
Bryostatin Effects on Cognitive Function and PKCɛ in Alzheimer’s Disease Phase IIa and Expanded Access Trials
Abstract
Bryostatin 1, a potent activator of protein kinase C epsilon (PKCɛ), has been shown to reverse synaptic loss and facilitate synaptic maturation in animal models of Alzheimer’s disease (AD), Fragile X, stroke, and other neurological disorders. In a single-dose (25 μg/m2) randomized double-blind Phase IIa clinical trial, bryostatin levels reached a maximum at 1-2 h after the start of infusion. In close parallel with peak blood levels of bryostatin, an increase of PBMC PKCɛ was measured (p = 0.0185) within 1 h from the onset of infusion. Of 9 patients with a clinical diagnosis of AD, of which 6 received drug and 3 received vehicle within a double-blind protocol, bryostatin increased the Mini-Mental State Examination (MMSE) score by +1.83±0.70 unit at 3 h versus –1.00±1.53 unit for placebo. Bryostatin was well tolerated in these AD patients and no drug-related adverse events were reported. The 25 μg/m2 administered dose was based on prior clinical experience with three Expanded Access advanced AD patients treated with bryostatin, in which return of major functions such as swallowing, vocalization, and word recognition were noted. In one Expanded Access patient trial, elevated PKCɛ levels closely tracked cognitive benefits in the first 24 weeks as measured by MMSE and ADCS-ADL psychometrics. Pre-clinical mouse studies showed effective activation of PKCɛ and increased levels of BDNF and PSD-95. Together, these Phase IIa, Expanded Access, and pre-clinical results provide initial encouragement for bryostatin 1 as a potential treatment for AD.
INTRODUCTION
In addition to amyloid plaques and neurofibrillary tangles, an important pathologic hallmark of Alzheimer’s disease (AD) is synaptic loss, which results in cognitive dysfunction and memory loss. In a recent study, protein kinase C isozyme epsilon (PKCɛ) was found to be deficient in fresh frozen hippocampal brain samples from AD versus control patients [1]. PKCɛ is a signaling enzyme known to be involved in learning and memory [2] and participates in synaptic growth and synaptogenesis [3, 4]. PKCɛ activators such as bryostatin 1 and DCPLA methyl ester are capable of preventing and/or reversing synaptic loss in various disease models including aged rats [5], AD transgenic mice [6], and rats subjected to neuronal and synaptic loss from ischemia/hypoxia [7, 8]. They elevate BDNF and facilitate synaptic maturation [9] even in normal animals during learning and memory [3]. If these compounds have similar effects in humans, they could be of value for treating the synaptic loss in AD and other neurodegenerative disorders such as Fragile X mental retardation, stroke, and traumatic brain injury, thereby ameliorating loss of memory, restoring other cognitive functions, and preserving the quality of life. However, little is known about the safety, pharmacokinetics, or efficacy of bryostatin 1 in AD patients.
Bryostatin 1 activates PKCɛ by binding to the C1A and C1B domains of conventional and novel isoforms of PKC [10–12], which bind the natural ligand 1,2-diacylglycerol (DAG) [13]. Bryostatin 1 has highest affinity for PKCα and ɛ [14–16]. Like DAG, bryostatin 1 produces a time-dependent biphasic effect on PKCɛ beginning with an initial activation accompanied by membrane translocation [17, 18]. Once activated, PKCɛ is proteolytically degraded in a process called downregulation [19], which lasts up to 24 h, followed by de novo synthesis that restores normal levels [20].
PKCɛ activation is an obligatory step prior to downregulation [21, 22]. Thus, downregulation can serve as an indicator of earlier PKCɛ activation, as the scheme here shows:

Bryostatin 1 has been extensively tested clinically as a treatment for cancer [23–35], for which it was considered as a PKC inhibitor due to its ability to downregulate PKC. Downregulation is particularly significant at higher doses of bryostatin, e.g., >30 μg/m2/week. Downregulation may potentially complicate the therapeutic use of bryostatin 1 because it could produce effects that are different or even opposite from activation. Therefore, it is important to optimize clinical trial protocols to maximize the lower dose biochemical effect of PKCɛ activation. Here, we report on initial human clinical trials of bryostatin 1 in AD including an initial Phase IIa safety and tolerability study and Expanded Access trials. In addition to activation, we demonstrate here in AD patients that bryostatin also increases the levels of PKCɛ (see below) that are associated with cognitive improvement. Results are also included from preclinical testing of bryostatin 1 in mice from which blood-brain distribution parameters, pharmacokinetics, and dose-dependent mechanism(s) of action guided the clinical trial protocols described here.
MATERIALS AND METHODS
Drug manufacturing and administration
Bryostatin 1 for animal experiments and biochemical testing was obtained from Tocris. Bryostatin 1 for clinical trials was generously provided by the National Cancer Institute. Sterile injectable bryostatin 1 and diluent were manufactured by Lyophilization Technology, Inc., Ivyland, PA. Bryostatin 1 was produced as a sterile lyophilized cake in 10 ml lyophilized sterile vials containing 50 μg bryostatin 1 and 2.5 mg Povidone C17, USP. Placebo was prepared identically except that bryostatin 1 was omitted. Sterile PET Diluent was made in 10 ml sterile vials and contained 1 ml solution of polyethylene glycol 400 (60%), dehydrated ethanol, USP (30%), and Polysorbate 80, USP (10%), v/v. Povidone C17 was a generous gift of Ashland Chemical Co., Wayne, NJ. Pure bryostatin 1 was stored at –20°C. The bryostatin 1, placebo, and PET diluent drug product were stored in controlled access chambers at +2 to +8°C. The identity, purity, and stability of the drug substance and drug product were confirmed by mass spectrometry [36], HPLC, UV spectroscopy, and IR spectroscopy at 6-month intervals. The identity, ethanol content, and viscosity of the PET diluent were also confirmed at 6-month intervals. Moisture content was measured at 6-month intervals by pulsed coulometric KF titration using Hydranal Coulomat AK (Sigma-Aldrich) in a Mettler Toledo C20 titrator. Sterility and endotoxin content were confirmed every 6 months by Alcami, Wilmington, NC.
Bryostatin 1 or placebo was administered by dissolving the contents of one vial in 1 ml PET diluent, followed by dilution with 9 ml of 0.9% sodium chloride injection, USP. This solution was then injected into a 250-ml Baxter non-DEHP-non-PVC Intravia polyolefin-lined saline IV bag. Hospira polyethylene lined tubing was used. The bryostatin 1 was administered to the EA patient by drip infusion over a period of 1 h. PVC tubing and bags were avoided because previous research showed that bryostatin 1 could bind to PVC.
Stability tests showed that the bryostatin 1 concentration thus prepared was stable at room temperature in PVC-free infusion bags for at least 21 days. Bryostatin was stable in glass vials containing 9 ml saline for at least 10 days at room temperature. Aqueous solutions of bryostatin were found to bind to PVC containers but not to polypropylene or glass. Bryostatin dissolved as 10% solutions in ethanol or DMSO was stable for at least 30 days in glass containers.
Phase IIa trial: Inclusion and exclusion criteria
Patients over 50 years of age with Mini-Mental State Examination (MMSE) score of 12–26 and a diagnosis of AD supported by CT or MRI scan, living outside an institution, but with a caregiver were considered eligible. Exclusion criteria included dementia due to any condition other than AD,including vascular dementia (modified Hachinski Ischemic Scale ≥5), cerebral tumor, Huntington’s disease, Parkinson’s disease, major depression, psychotic episodes, agitation, epilepsy, uncompensated congestive heart failure, pregnancy, lack of caregiver, or alcohol or drug dependence; evidence of clinically significant unstable cardiovascular, renal, hepatic, gastrointestinal, neurological, or metabolic disease within the past 6 months; change in use of any drug within 14 days prior to randomization; any medical or psychiatric condition that may have required medication or surgical treatment during the study; life expectancy less than 6 months; any clinically significant screening laboratory values outside the normal; use of an investigational drug within 30 days prior to the screening visit or during the entire study; or blood pressure >180/100.
Efficacy and safety endpoints
The primary objective was an evaluation of the safety and tolerability of bryostatin. Secondary objectives were a preliminary assessment of pharmacokinetics and effects on cognitive function. Behavioral outcome measures were MMSE, Alzheimer’s Disease Assessment Scale-Cognitive (ADAS-cog), Clinician’s Interview-Based Impression of Change-plus (CIBIC-plus), Clinical Dementia Rating (CDR), Severe Impairment Battery (SIB), Hopkins Verbal Learning Test Revised (HVLT-R), and Alzheimer’s disease Cooperative Study Activities of Daily Living (ADCS-ADL) at 24, 48, and 72 h post dose. Subjects were given baseline EKG, CBC, hematology, HIV/Hepatitis B screening and urinalysis for blood alcohol, drug and pregnancy screening. Vital signs were monitored at baseline and at intervals up to 24 h post infusion. A follow up examination was conducted four weeks after treatment. Blood was drawn for PKC within 30 min prior to infusion and at 15, 30, and 60 min after start of infusion, and 20 min, 1, 2, 6, 24, 48, and 72 h post infusion. Peripheral blood mononuclear cells (PBMCs) were isolated from blood on site and shipped on dry ice to our laboratory for analysis within 48 h. Blood was also drawn at the same time points and shipped to a commercial GLP lab for bryostatin 1 pharmacokineticmeasurement.
Human clinical trials
The Single Patient Expanded Access study (BRY-SPEA-JM) and the Phase IIa clinical trial (NTRP101-201) were conducted under a U.S. IND (IND 71,276) and received approval from the relevant Institutional Review Boards. Expanded access patient #2 was treated at Marshall University, Charleston, WV. Expanded access patient #3 was treated at Via Christi Hospitals, Wichita, KS. The Phase IIa trial was conducted by the CRO Parexel at Glendale Adventist Hospital, Glendale, CA under the supervision of our corporate partner, Neurotrope BioScience, Inc. Human studies were performed in compliance with the protocol and in accordance with Good Clinical Practice (GCP) (International Conference on Harmonization [ICH], Guidance E6, 1996, principles of human subject protection), and applicable country-specific regulatory requirements.
Subjects
The Phase II safety study (Identifier NCT02221947) included nine subjects (4 male and 5 female) ranging in age from 62 to 82 with a clinical diagnosis of probable AD. The mean age was 71.8±7.4. MMSE was measured 3 h, 4 days, and 15 days after infusion; however, based on earlier animal studies [37], only short-term improvements in cognition from a single dosing were expected.
Bryostatin 1 administration in mice
Bryostatin 1 (Tocris, 10 μg/vial) was dissolved in 10 μl dimethyl sulfoxide (DMSO) and diluted to 100 μl in sterile normal saline. We administered bryostatin 1 to groups of 3 to 6 male C57BL/6 N mice through the lateral tail vein and samples were collected after a delay ranging from 1 h to 28 d. The injection schedules and dosages are shown in Table 1. Twelve control groups of 3 or 4 mice each, injected with vehicle on the same days as the treated groups, were also used. All animal studies were conducted in accordance with AAALACguidelines.
Table 1
Preclinical mouse dosing schedule
| Group Name | Dose | Group ID | Week | ||||||
| μg/m2 | 1 h Delay | 24 h Delay | 1 | 2 | 3 | 4 | 5 | 6 | |
| Weekly 10 μg/m2 | 10 | 7 | 6 | ✓ | ✓ | ✓✘ | |||
| 10 | 8 | ✓ | ✓ | ✓ | ✓ | ✓ | ✓✘ | ||
| Weekly 15 μg/m2 | 15 | 17 | 18 | ✓ | ✓ | ✓✘ | |||
| Weekly 25 μg/m2 | 25 | 21 | 22 | ✓✘ | |||||
| 25 | 23 | 24 | ✓ | ✓✘ | |||||
| 25 | 25 | 4 | ✓ | ✓ | ✓✘ | ||||
| Semiweekly | 15 | 39 | ✓✓ | ✓✓✘ | |||||
| 20 | 40 | ✓✓ | ✓✓✘ | ||||||
Injection schedule of bryostatin in preclinical mouse experiment. Bryostatin 1 was injected into the tail vein of 3 to 6 male C57BL/6N mice once or twice per week at the indicated dosage. At the specified delay after the last injection, blood PBMCs and brain were collected and PKCɛ, BDNF, and PSD-95 were measured as described in Methods. Equal numbers of control animals were injected with vehicle on the same schedule. ✓= Injection of bryostatin at the indicated dose or a vehicle control. ✘= Collection date at specified delay (1 or 24 h) after last injection. N = 3 to 6 animals/group.
Mouse assays
PSD-95, pPSD-95, and synaptophysin were measured by western blotting. We also measured brain BDNF, pro BDNF, and neuron-specific enolase (NSE) in unfractionated brain extracts using commercial ELISA kits (Abnova, Abnova, and MyBioSource, respectively).
PKCɛ measurement
PBMCs were isolated from blood in animal experiments by centrifugation in Ficoll-Paque(GE Healthcare) in 12 ml Accuspin tubes (Sigma-Aldrich). PBMCs were isolated in the clinical experiments from blood drawn into 8 ml Vacutainer Cell Preparation Tubes (CPT Tubes) containing sodium heparin and Ficoll (BD, red/green) and crude PBMCs were isolated according to the manufacturer’s instructions. Due to the lability of PKC, only a single step of purification was performed. PBMCs were stored at –70 to –80°C for up to 72 h and homogenized by sonication in 330 μl PBS and 10 μl were taken for protein measurement. Brain tissue was homogenized by sonication in 3 volumes of ice-cold 1× phosphate-buffered saline (pH 7.4) using a 1/16” microprobe and Misonix S-4000 ultrasonic sonicator set at amplitude = 10% (32 μm) for 30 s (approx. 113 joules).
A portion of the homogenate was fractionated by ultracentrifugation (10 min, 100000 × g, Beckman Max-XP) for PKCɛ measurement. The cytosol fraction (320 μl in PBS) was put on ice and the particulate fraction was re-suspended to its original volume (320 μl) by adding cold PBS + 1% Tween-20 and sonicating on ice for 5 s. Because PKC is very labile, samples were not processed further but applied immediately to isozyme-specific ELISA plates (USCNK Life Science, Inc.) which had been coated with flat black paint on the outside to minimize cross-talk. Each measurement was done with 4 or 8 replicates. Samples were diluted with appropriate buffer to make the final Tween-20 concentrations the same.
Plates were processed according to the directions of the manufacturer except that the plates were washed five times and they were centrifuged in an Eppendorf 5804 refrigerated centrifuge with an A-2-DWP swinging bucket rotor for 10 min at 2250 × g after each wash. Plates were developed with Thermo Supersignal Femto reagent and chemiluminescence was recorded in a BioTek Synergy HT microplate reader. The microplate reader was calibrated weekly using a luminescence test plate (BioTek). Subcellular localization of PKCɛ in brain was calculated as the ratio of PKCɛ in membrane / (membrane + cytosol) fractions. All measurements were compared with control mice injected over the same period of time with vehicle only. The PKCɛ method was validated according to FDA Guidance document on Bioanalytical Method Validation (2001).
Bryostatin measurement
Bryostatin 1 in the EA subject was measured by LCMS using a Thermo/Dionex NCP-3200RS gradient nanopump attached to an Acclaim Pepmap 100 180 μm×5 cm C18 3 μm capillary column (100 Å particle size) at a flow rate of 1.5 μl/min. Samples were passed into a Nanospray Flex Ion ESI source and analyzed with a Thermo TSQ triple-quadrupole mass spectrometer in SRM mode as previously described [36]. Bryostatin in the Phase IIa samples was measured by a commercial cGLP laboratory using the method of Zhao et al. [38].
Statistical analysis
P-values were calculated using Student’s t test. PKCɛ ratio values were calculated using standard error propagation techniques. Pharmacokinetic half-life parameters were calculated by nonlinear least-squares analysis using custom software (Xdata). Other statistics, including power analysis, were calculated in R. ANOVAs were calculated using R and followed up with Tukey HSD multiple comparisons of means (95% family-wise confidence level). One-way robust repeated measures ANOVAs were calculated by the method of Wilcox [39].
RESULTS
Human Phase IIa clinical trial
We conducted a parallel randomized double-blind Phase IIa trial with 6 subjects receiving a single i.v. dose of bryostatin 1 at 25 μg/m2 and 3 subjects receiving a placebo. The primary objective was an evaluation of the safety and tolerability of bryostatin 1.The secondary objective was a preliminary assessment of pharmacokinetics, pharmacodynamics, and effects on cognitive function in patients with AD.
No deaths or SAEs occurred and no subject had an AE leading to withdrawal from the study. No myalgia was reported. Three subjects experienced minor adverse events (headache, dizziness, or rash). The headache occurred in a bryostatin patient and was not considered related to the drug. All hematology, blood chemistry, coagulation, renal function, liver function, and cardiac assessments were unremarkable after treatment. There were no clinically significant changes in any vital signs.
Bryostatin reached peak plateau level within 1 h for all 6 patients infused with the drug (Fig. 1). Bryostatin 1 treatment increased MMSE score at 3 h after the end of infusion (p = 0.041, paired t-test; Table 2, Fig. 2) but not at later times (not shown). MMSE scores of the placebos at 3 h were not statistically significant from baseline values. Although the change in the treated group at 3 h was statistically significant, considerably larger numbers of subjects would be needed to draw definitive conclusions about efficacy. Based on earlier animal studies [37], only short-term improvements in cognition from a single dosing were expected. Other tests (ADAS-cog, CIBIC-plus, CDR, SIB, HVLT-R, and ADCS-ADL) were either hampered by incomplete data or showed no statistically significant change in cognitive level.
Fig.1
Bryostatin elevation in Phase IIa subjects. Plasma bryostatin was measured by LCMS. All 6 bryostatin-infused (1-h infusion of 25 μg/m2, single dose) subjects showed peak elevation of bryostatin at 1-2 h after the start of infusion. Y-axis = ng bryostatin / ml. Each data point represents mean±SEM of six patients. Only samples from bryostatin-treated patients were measured.
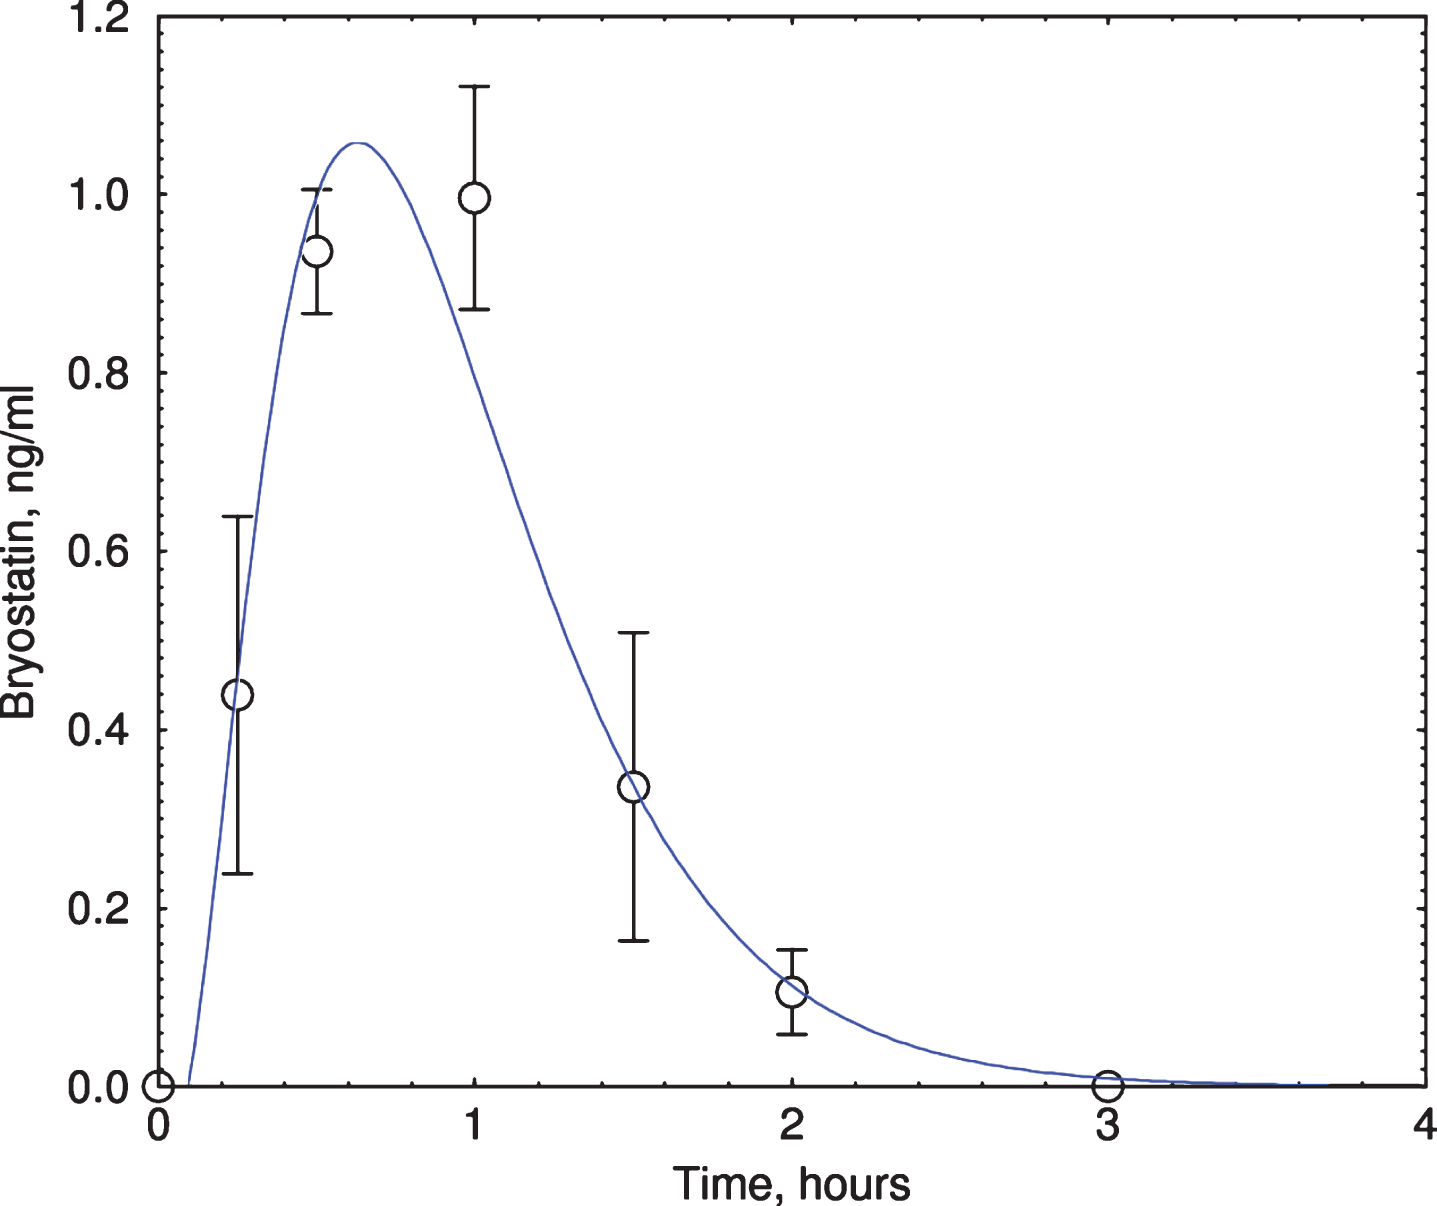
Table 2
MMSE scores
| Baseline | 3 h Post | ΔMMSE at 3 h | |
| Placebo (n = 3) | 22.00±1.53 | 21.00±2.00 | –1.00±1.53 |
| Bryostatin (n = 6) | 21.33±1.50 | 23.16±1.89 | +1.83±0.70 |
Bryostatin Efficacy on Cognitive Function in blinded Phase IIa trial. A single i.v. infusion was followed 3 h, 4 d, and 15 d after infusion by a cognitive evaluation with the Mini-Mental State Examination-2 (MMSE-2). MMSE scores in bryostatin-treated subjects were increased at 3 h (p = 0.041, paired t-test). MMSE scores of the treated groups at other times or of the placebos at 3 h were not significantly different from the corresponding baseline values.
Fig.2
Clinical trial outcome of bryostatin 1 treatment in Phase IIa AD trial. A) Mean PKCɛ changes above preinfusion level at 1 h measured in PBMCs collected from 6 bryostatin 1 and 3 placebo-treated patients. Note expanded y-axis. PKCɛ values are percent of blank-subtracted control in chemiluminescence units (mean±SEM). B) Changes in MMSE scores. MMSE is scored in discrete integers on a scale from 0 (severe dementia) to 30 (normal). MMSE scores in bryostatin-treated subjects were increased at 3 h (p = 0.041, paired t-test) but not at 4d or 15d (not shown).
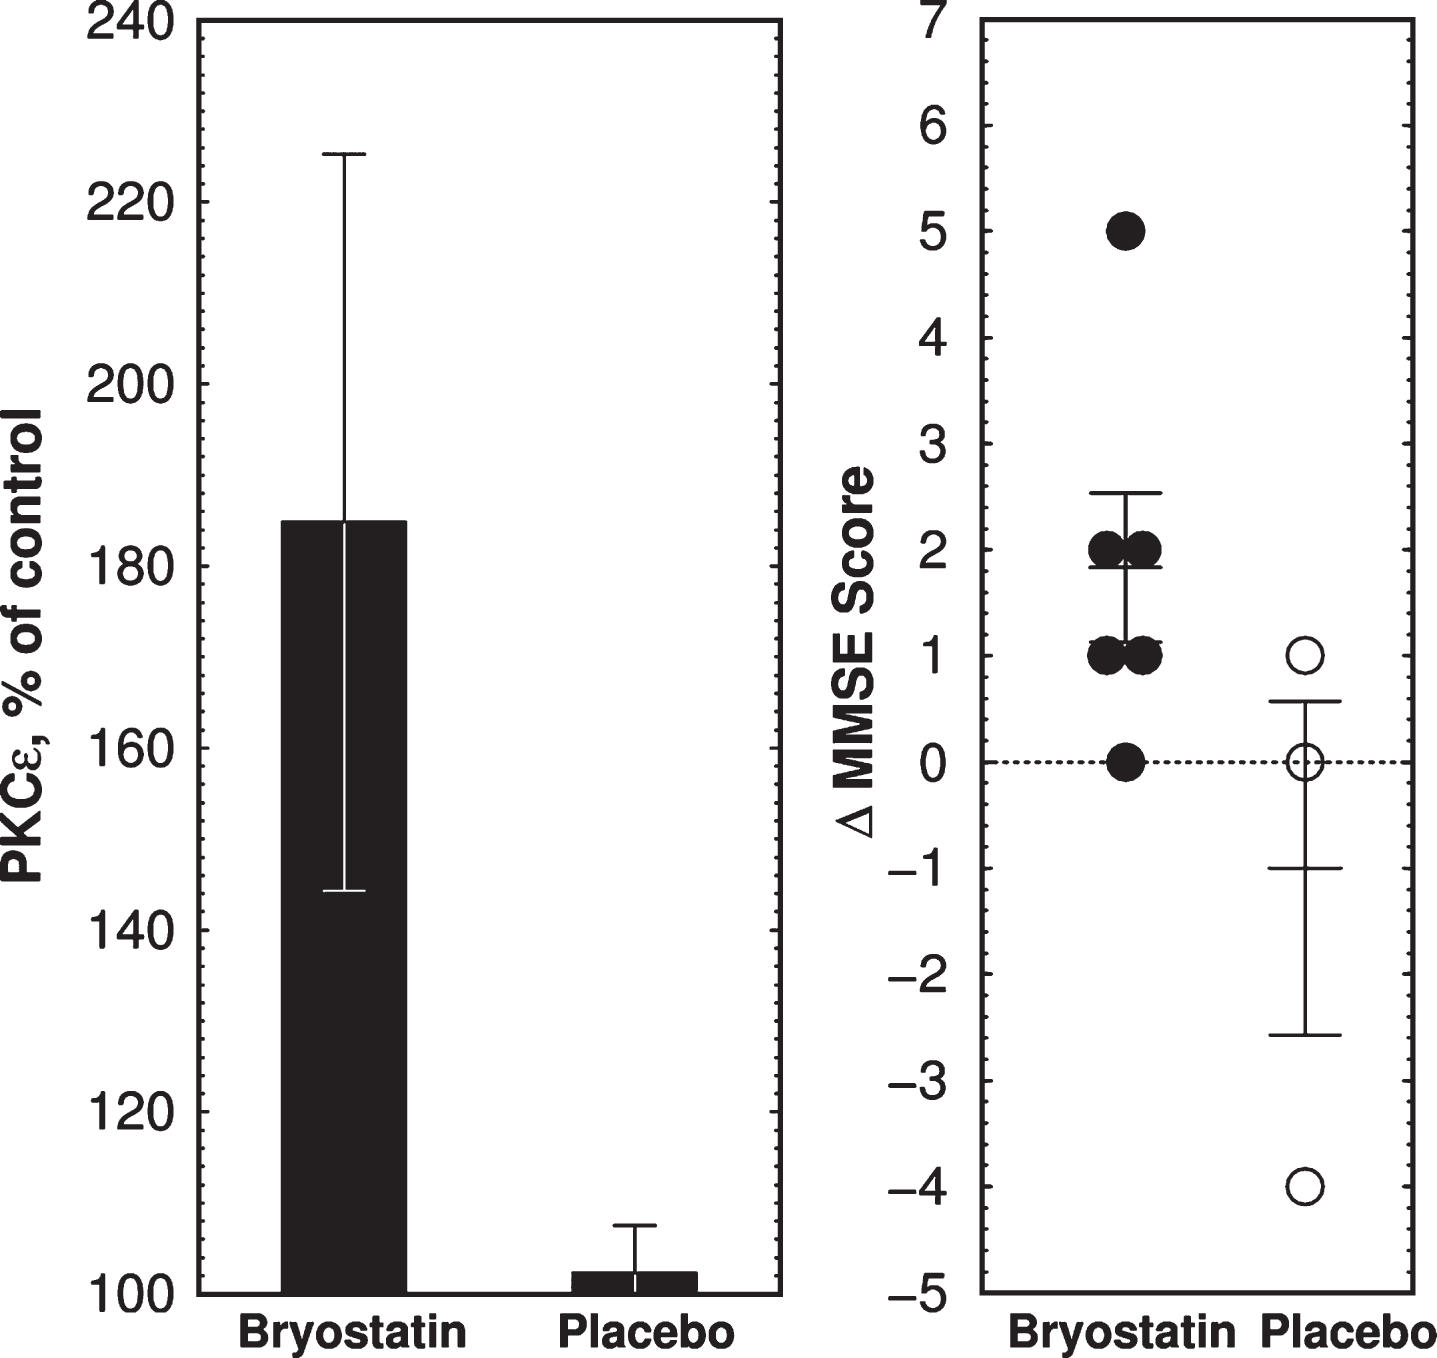
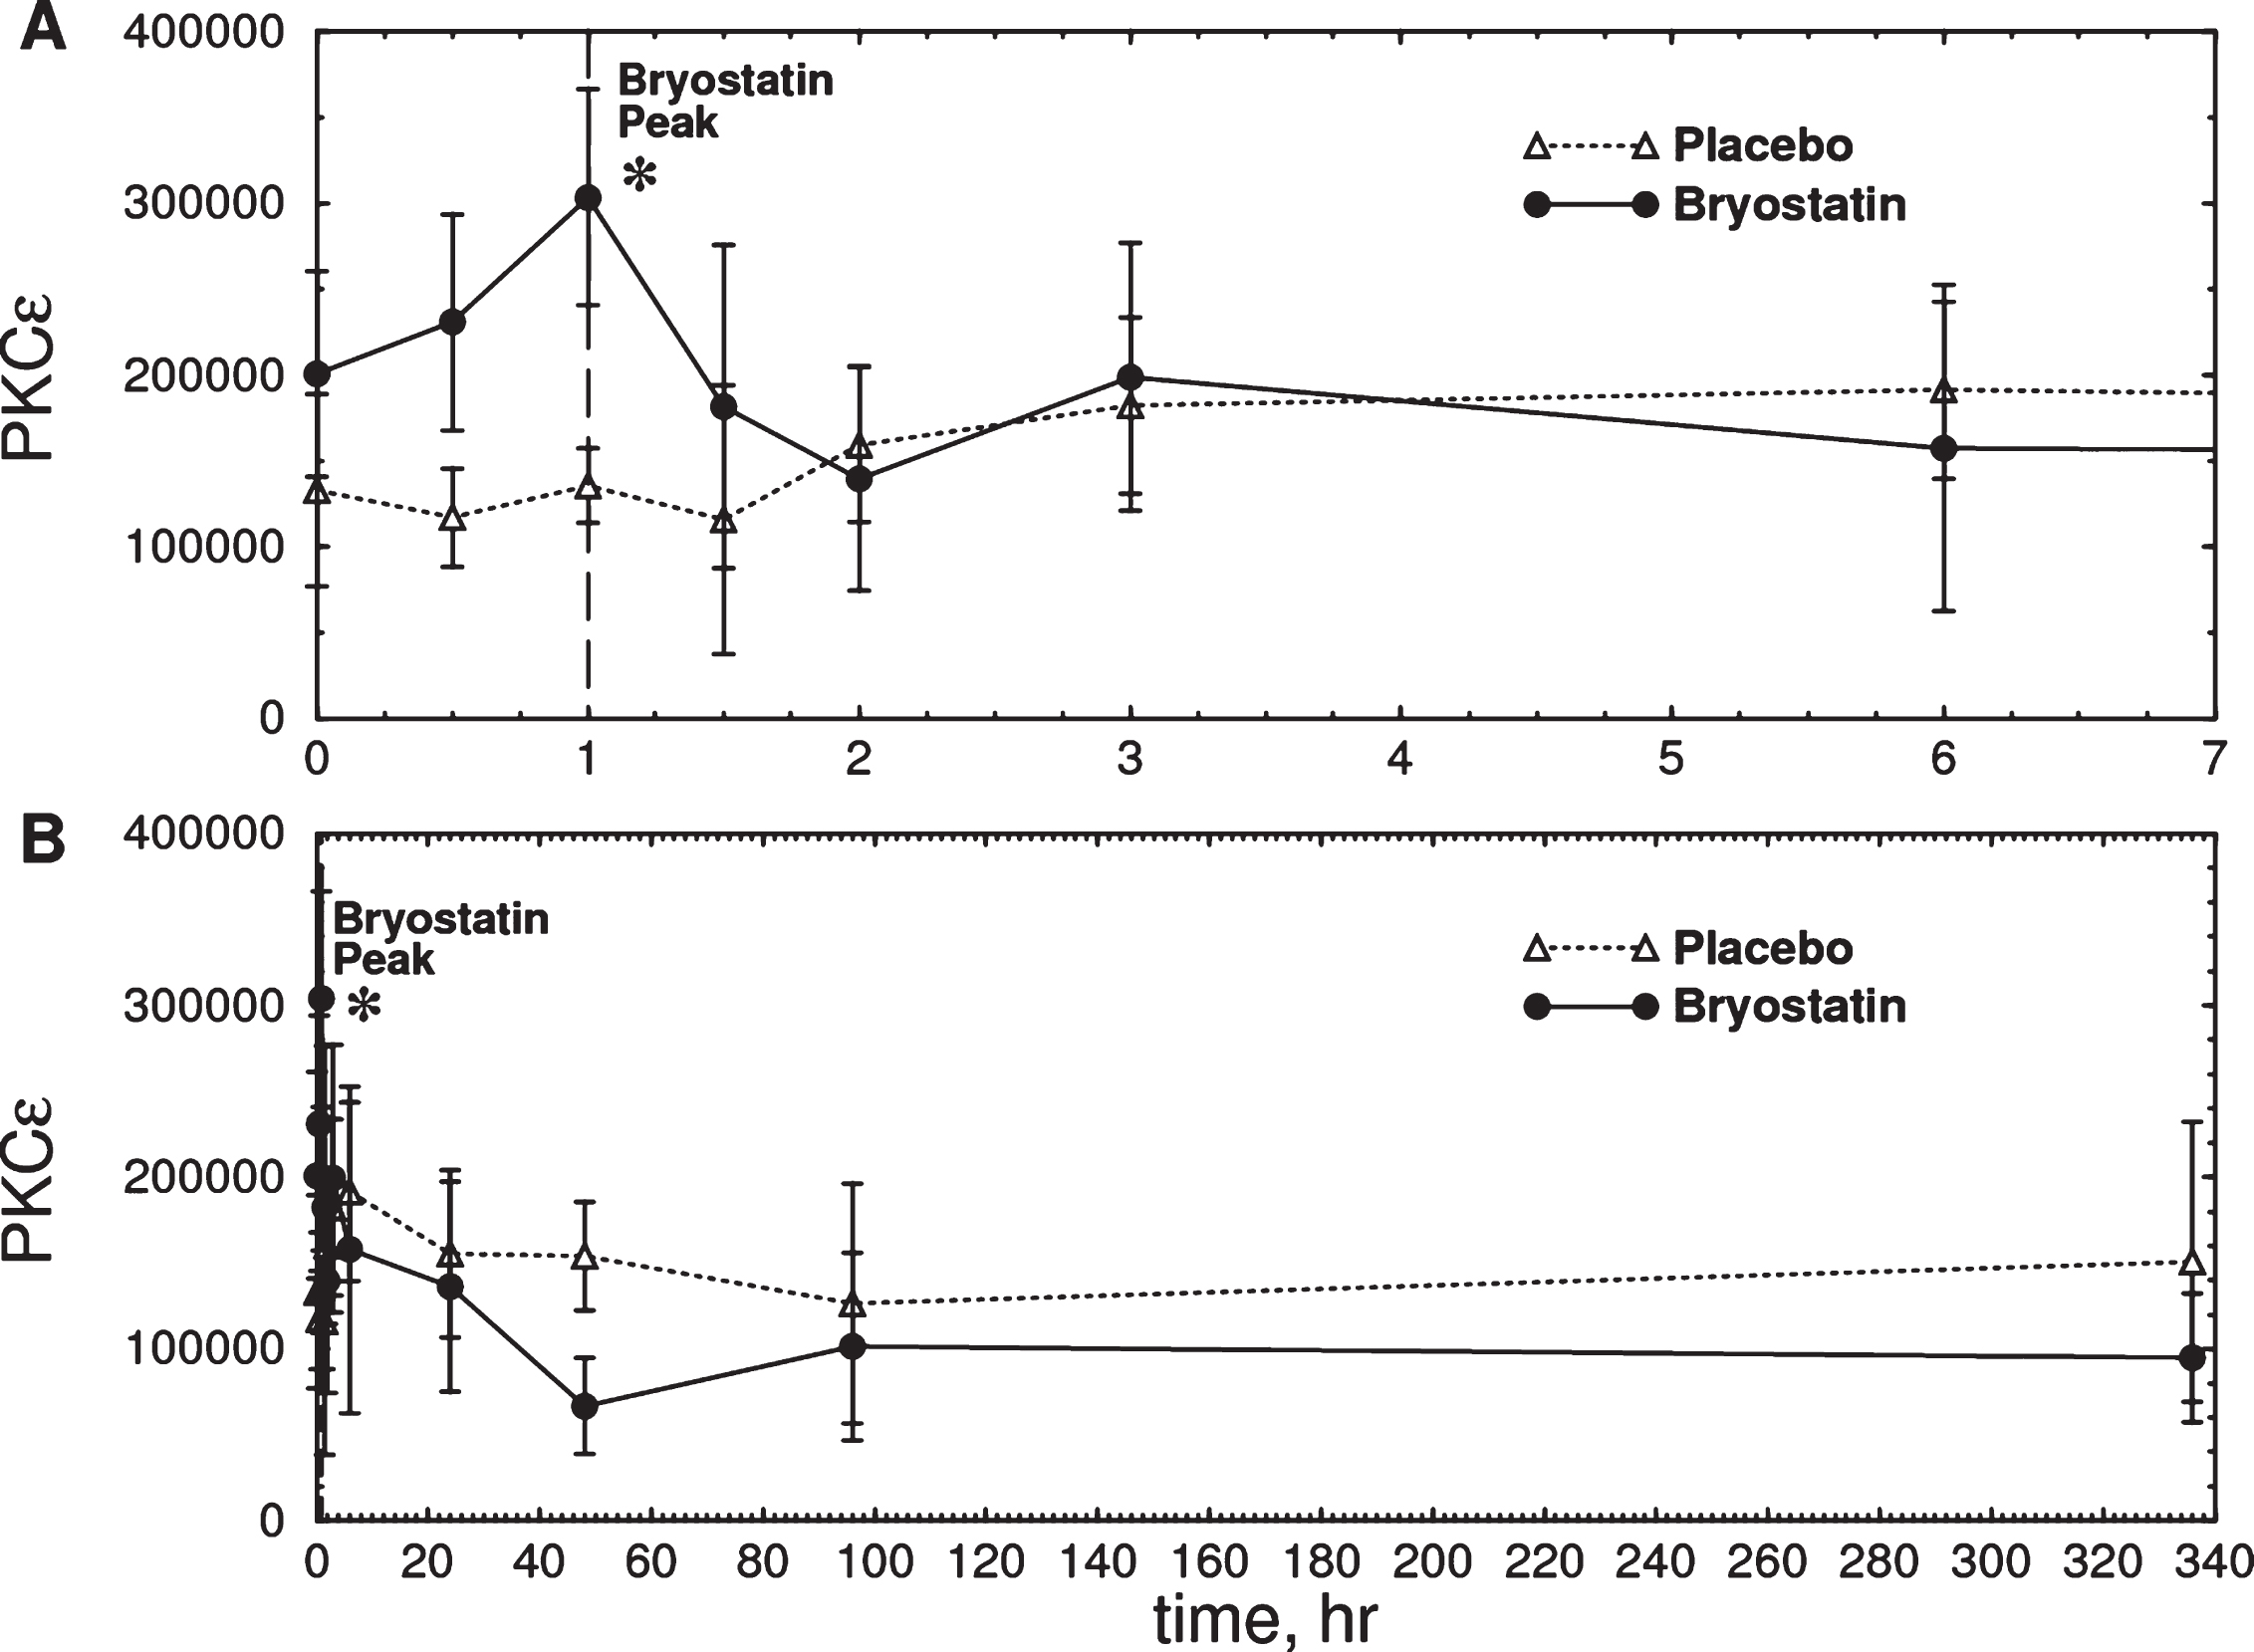
Based on the 1 h bryostatin results, we analyzed PBMC PKCɛ levels at 1 h. Bryostatin 1 treatment increased PBMC PKCɛ levels at 1 h (p = 0.0185, repeated measures ANOVA, Fig. 3a) followed by a long-term downregulation between 12 and 72 h (p = 0.0296, two-tailed paired t-test, Fig. 3b). PKCɛ values in PBMC samples were fairly reproducible from a given patient over time, but PBMCs from different patients had widely different PKC values. Thus the differences in t = 0 values are not significant and the relatively large error bars shown in Fig. 3 are the result of large patient-to-patient variation. The highest PKCɛ level occurred 1 h post infusion, in close correspondence to the peak levels of bryostatin measured in the patient’s blood samples. Based on the preclinical data described below, the dose chosen, 25 μg/m2 i.v., was predicted to be sufficient to activate PKCɛ and induce increased synthesis of synaptogenic factors such as BDNF and PSD-95 (See Preclinical Experiments below).
Fig.3
Time course of total PKCɛ measured in PBMC samples from six Phase IIa subjects treated with bryostatin 1. A) Expanded scale (0–7 h). B) Full scale (0–340 h). There was an increase in total PKCɛ in the bryostatin group but not in the placebo at 1 h after the start of infusion (Bryostatin F(7.013, 21.039) = 3.026, p = 0.023; placebo F(10,20) = 0.75, p = 0.67, repeated measures ANOVA; p = 0.0185 at 1 h, two-tailed matched pair t-test) Bryostatin also decreased PKCɛ between 12 h and 72 h (p = 0.0296, two-tailed matched pair t-test, average of 12, 48, and 72 h points). Data points are mean PKCɛ in arbitrary units±SEM (Placebo, n = 3; Bryostatin 1, n = 6). The treated and placebo groups are not significantly different at t = 0.
Human Expanded Access (EA) subjects
In contrast to the Phase IIa trial, in which subjects received a single infusion, EA subjects received up to 26 infusions over a period of up to 46 weeks (Table 3). Based on earlier pre-clinical studies of cognitive enhancement and neuroprotection in three different AD transgenic mouse strains, and also based on earlier clinical studies for oncologic indications, we hypothesized that an optimal bryostatin treatment protocol would be a dose of 25 μg/m2 for 3 successive weeks followed by several lower doses of gradually increased spacing. These doses are 4.8–12×lower than many doses given previously in some cancer trials [23, 24] but comparable to others [40–42]. Bryostatin infusion produced clinically relevant improvements in assessed behavior in all three patients (Table 3). Psychometric assessment was not possible in subjects #1 and #2 because both were non-verbal.
Table 3
Compassionate use patient details
| Subj. | Age | Sex | No. of | Clinical Profile | Course / Duration | Adverse events | Outcome |
| doses | |||||||
| 1 | 95 | M | 4 | Disoriented, intermittent coma, non-verbal | Became alert, attentive; remembered date, place, time; mind active, engaged, watched TV, requested return to work | None reported | Treatment discontinued due to infections unrelated to study drug. |
| 2 | 38 | F | 11 | Familial early-onset AD due to PSEN1 mutation. Non-verbal, drooling, unable to swallow (fed with gastronomy), attention grossly impaired, spasticity, inability to move | Return of some language and vocalization, swallowing, increased attentiveness to environment and persons, increased range of motion. Treatment stopped due to illness after 5 months; vocalizations also stopped, decreasing alertness, unresponsive, C-S respiration noted. | Aspiration pneumonia, not treatment related; improvements maintained throughout hospitalization while treatment paused. | After 5 months, a series of infections including sepsis, urinary tract and pneumonia prevented continuation of the study. Treatment discontinued due to infections unrelated to study drug. |
| 3 | 76 | M | 26 | MMSE 2-3; ADCS-ADL-Sev 18; hallucinations | MMSE improved to 10–12; ADCS-ADL-Sev 33; hallucinations reduced, return of complex motor skills incl. swimming, billiards. After 7 months, CIBIC-Plus score returned to ‘minimally improved.’ | Grade 1 and 2 myalgia, relieved with ibuprofen | Dosage frequency reduced over 7 months but MMSE score remained above baseline. Treatment discontinued due to change of residential facility. |
Subject #1
EA subject #1 was given multiple infusions over a period of 5 months. He became more alert and engaged, watched TV, began speaking, and requested to return to work. The improvements lasted for several weeks, after which the treatment was discontinued due to non-drug-related infections.
Subject #2
EA subject #2 was given 11 infusions over 6 months as described previously [43] (identified as IV-18). The patient showed increased vocalization of words, responses to verbal commands, increased swallowing (after many months of requiring tube-feeding), primitive conversational interaction, and some increased range of limb motion. Treatment was interrupted twice for hospitalizations due to severe pneumonia which was not considered treatment-related. The improvements lasted for roughly 8 weeks from trial initiation and gradually diminished as dosing became intermittent and eventually was discontinued due to sepsis, urinary tract infections, and severe pneumonia.
Subject #3
Subject #3 was a 76-year-old Hispanic male diagnosed with AD and rated as severely demented (baseline MMSE = 3 on the day of and before the 1st dose, and MMSE = 2 during initial evaluation) and with no family history of AD. Concomitant medications included Simvastatin, Felcainide, Lexapro, Namenda, and Clonazepam. The subject was given 25 infusions of bryostatin 1 in a dose-ranging study over a period of 46 weeks. PBMCs were isolated from Subject #3 on site 60 min after the start of drug infusion and total PKCɛ was measured in cell extracts within 48 h. Additional blood plasma samples for measurement of drug levels were collected before and after infusion.
Within 3 h of the first infusion, Subject #3’s MMSE rose from a baseline of 3 to 12. The MMSE score remained within the 10–12 range for 1-2 weeks, and remained between 5 and 12 thereafter (Fig. 4, green). These improvements of the MMSE roughly paralleled the changes of the ADCS-ADL. Improvements in cognitive function early in the course of treatment were also noted by the health care workers and caregivers. The patient, who had previously been largely immobile and absorbed in constant hallucinations that had occurred for many months prior to the bryostatin trial, became free of hallucinations, became mobile, able to feed himself, care for bodily functions, speak and recognize words, interactconversationally with others, and engage successfully in complex physical activities such as swimming and billiards. CIBIC-Plus score returned to ‘minimally improved’ after 7 months. By 9 months, the MMSE score declined to 5. As dosing became much less frequent his deficits and symptoms, including hallucinations, returned. Treatment was terminated when caregivers requested a change to a different residential facility.
Fig.4
Time course of Expanded Access Subject PKCɛ and psychometric scores. Subject was infused with the indicated doses on 26 occasions over 46 weeks with bryostatin 1 as indicated by the arrows. The dose rate was gradually lowered from 25 to 10 μg/m2/week. Blood was drawn immediately before and after infusion and PBMCs were isolated on site and frozen. PBMCs were obtained from blood samples before each bryostatin dose and PKCɛ was measured by ELISA within 48 h. (Green) MMSE scores, measured 3 h after infusion, increased after the first dose and remained above baseline for 44 weeks. (Blue) Postinfusion PBMC PKCɛ. Bryostatin 1 infusion increased PKCɛ on the day of infusion followed by rapid downregulation. (Red) ADCS-ADL-SIV scores. PKC values are mean±SD of 4 to 8 replicate measurements. A) 0–25 weeks. B) 25–50 weeks.
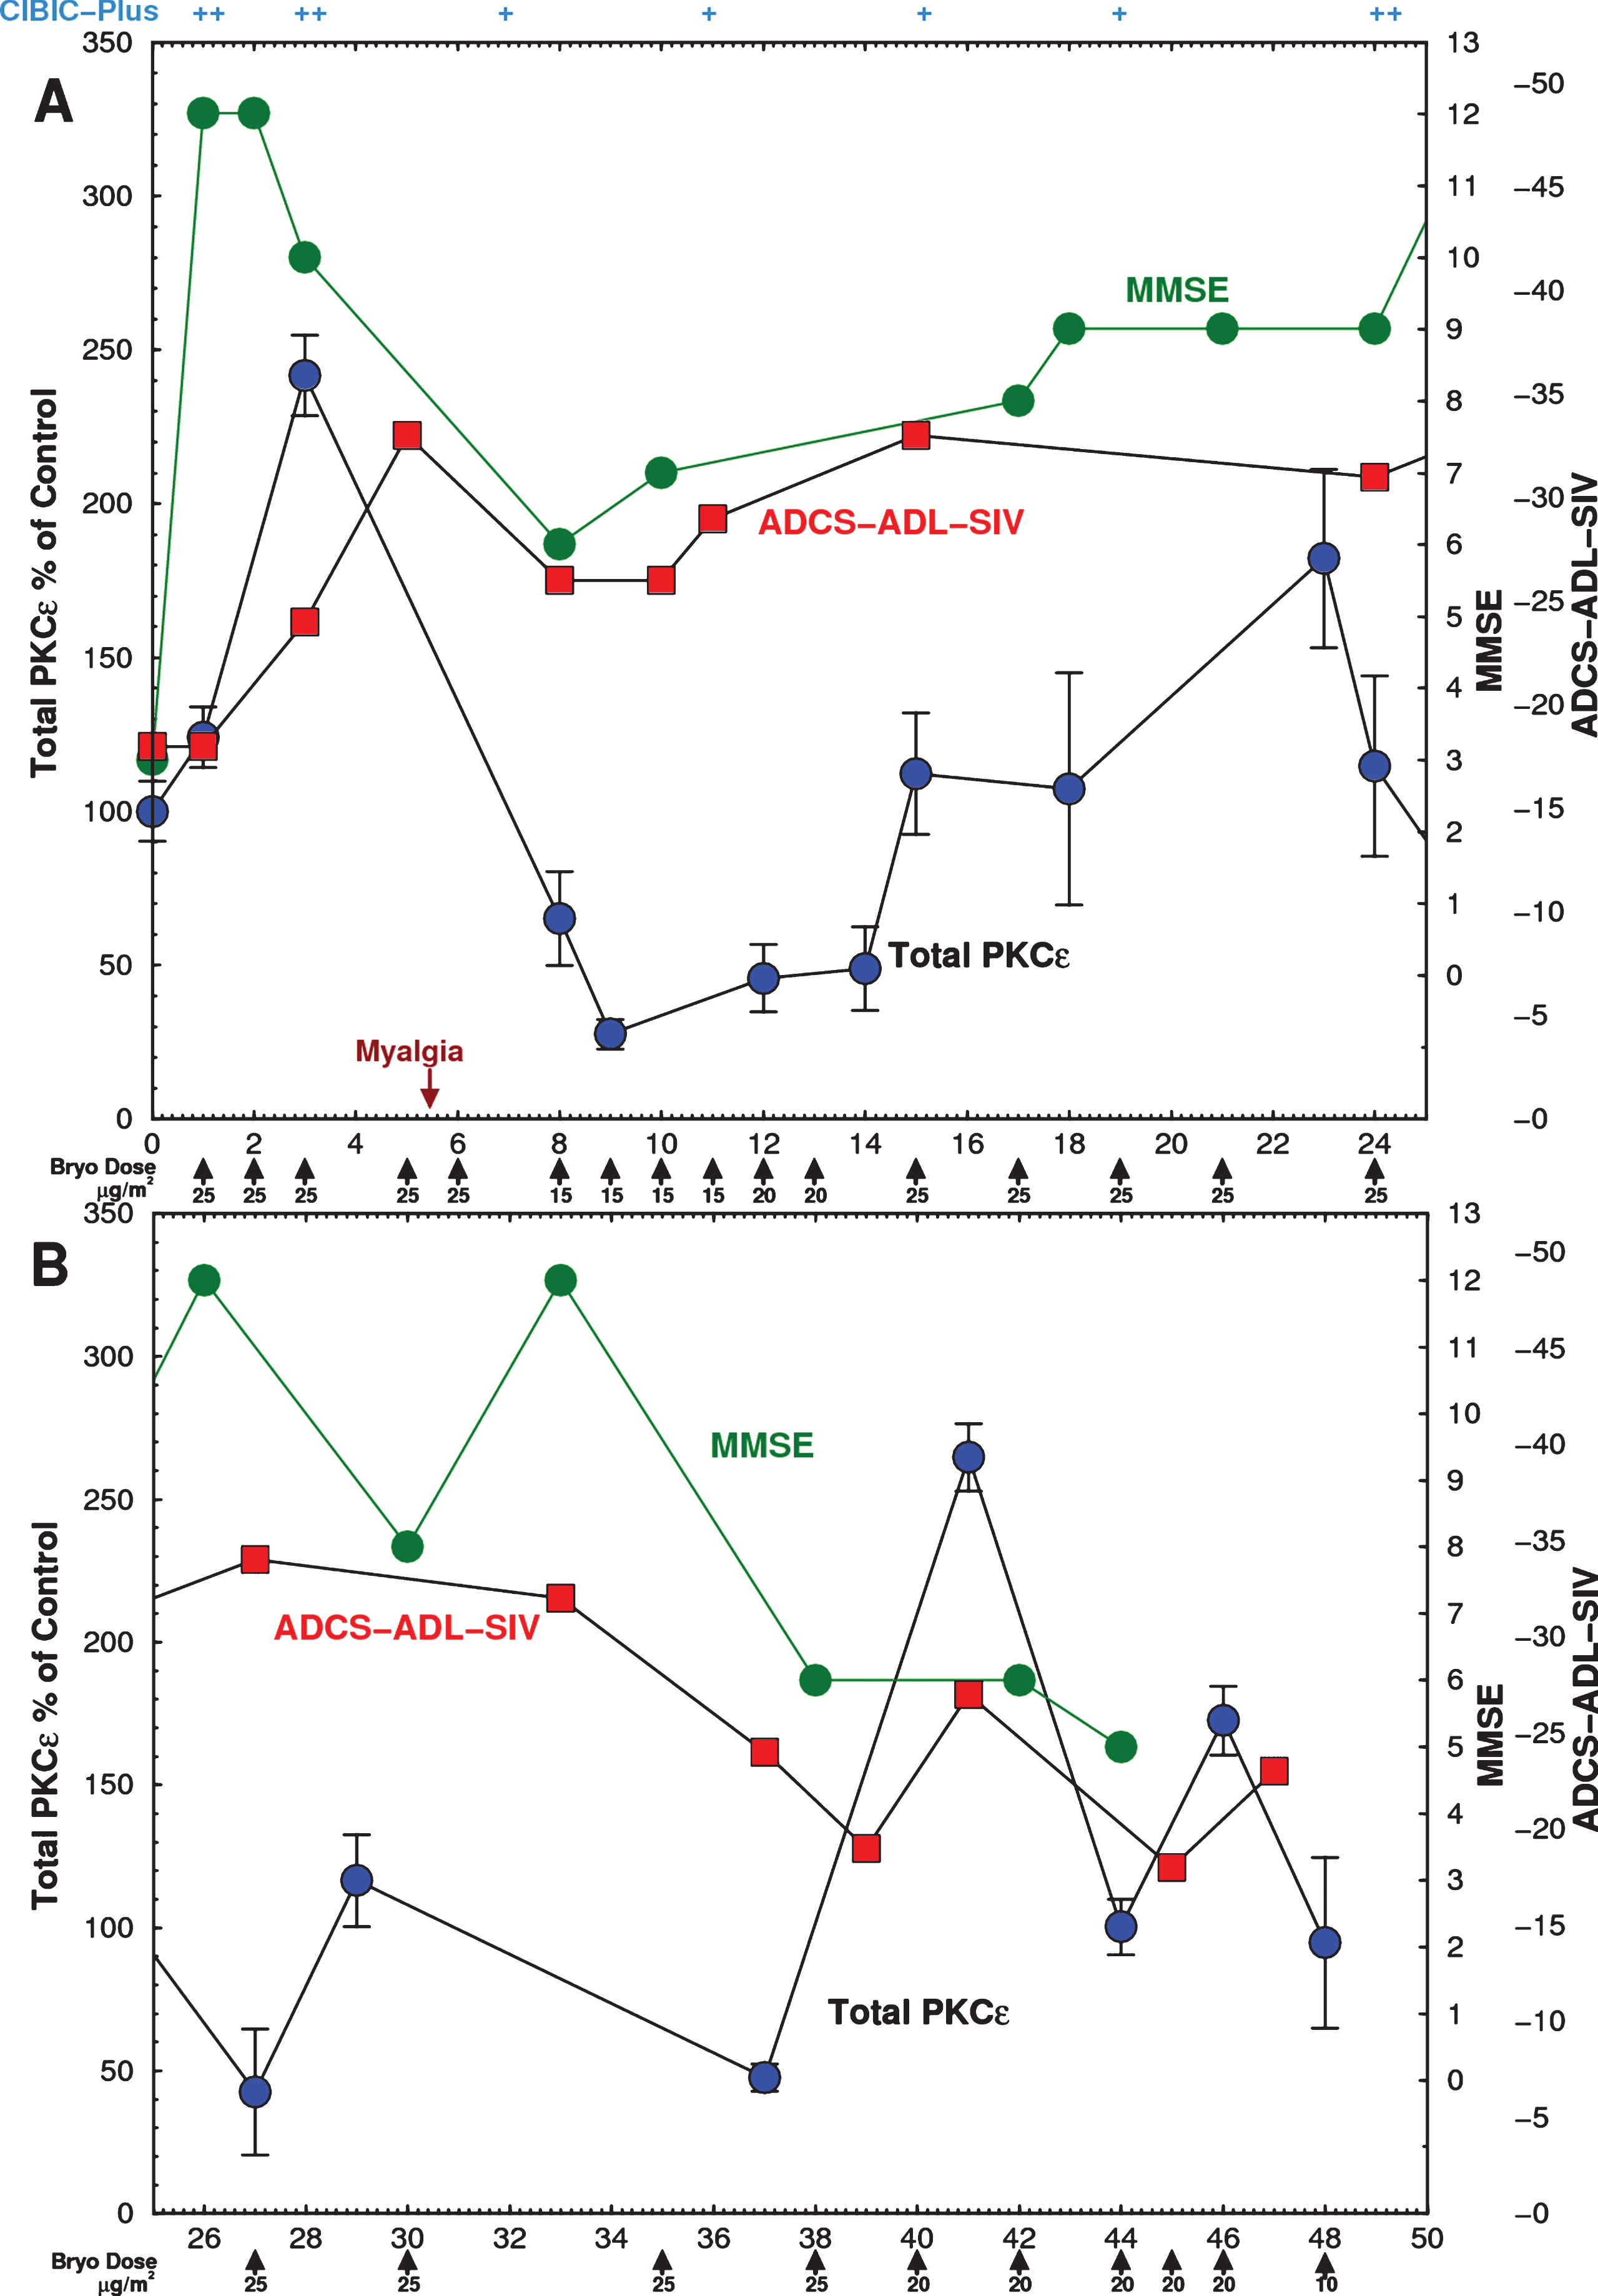
After the first 3 doses administered to Subject #3, the pre-infusion levels of PKCɛ increased by 140%, and then became profoundly downregulated to about 25% of the baseline value, gradually returning to and finally exceeding baseline levels (Fig. 4, blue). These levels, consistent with downregulation, recovered gradually as the intervals between bryostatin doses were progressively increased. The blue curve in Fig. 4 shows only the values of the preinfusion total PKCɛ before each dose. There was an apparent correspondence in the first 24 weeks between the changes observed in the MMSE and the ADCL-ADL and the changes of PBMC PKCɛ (Fig. 4a); however, the correlation was not statistically significant. In the second part of this trial, exploration of lower and less frequent doses was conducted. These doses resulted in lower efficacy (Fig. 4b). As an exploratory trial, these interval changes were made in an effort to optimize PKCɛ induction and activation and to minimize downregulation. No changes in serum chemistry, CBC, or vital signs except for moderate weight loss (82.7 to 75.9 kg) were noted throughout the treatment. The only AE was Grade 1 mild myalgia at 6 weeks, which roughly coincided with the period of greatest PKCɛ downregulation. It resolved completely after two 500 mg tablets of Tylenol. Myalgia has been frequently observed in cancer trials after bryostatin 1 treatment and is the dose-limiting toxicity at higher doses [41, 44, 45].
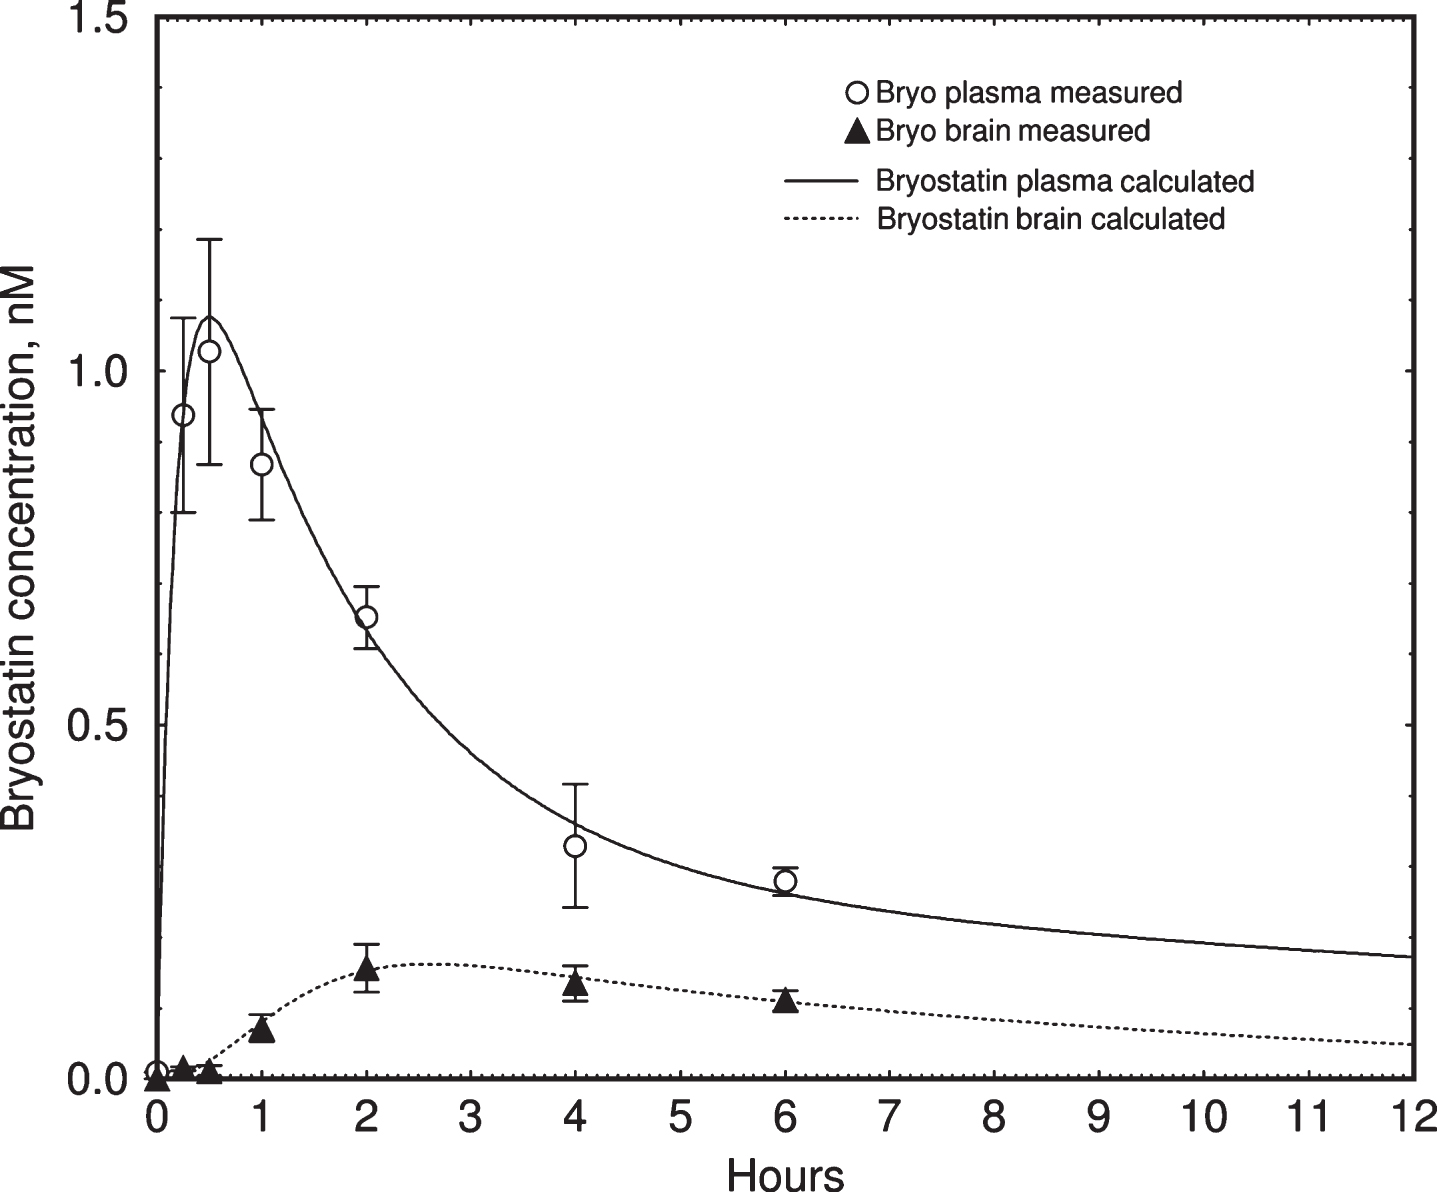
Bryostatin 1 blood plasma levels in Subject #3, measured by LCMS [35], reached a maximum of 0.4-0.5 nM within 1 h after infusion (Fig. 5). Over the course of the treatment we observed a gradual increase in the baseline level of bryostatin measured between infusions. To determine whether this apparent increase in half-life could be accounted for by accumulation of bryostatin 1, we created a two-compartment pharmacokinetic model based on our earlier mouse results [36]. The pharmacokinetic parameters were calculated using our previous data on the time course of bryostatin 1 in mouse blood plasma, measured by LCMS (Fig. 6). The fitted parameters were comparable to those measured in mice by Zhang et al. [46]. The lower curve represents the bryostatin in brain (solid triangles = measured values; solid line = fitted curve).
Fig.5
Time course of bryostatin elevation with successive infusions in EA subject. A) Blood plasma bryostatin was measured by LCMS in Expanded Access patient #3 after 1 h i.v. of 15 to 25 μg/m2 infusions during successive weeks. Doses are indicated in small rectangles along the top. Values are mean±SD of three replicate measurements. Blood plasma sample collection was discontinued after 30 wk. Open = preinfusion concentrations, closed = post-infusion concentrations. Dashed line = polyexponential least squares fit assuming constant elimination rate. Solid line = least squares fit with increasing elimination half-life. Parameters: kinj = rate constant injection site to blood = 0.09 min–1; kcompartment1 = rate constant fast elimination = 0.010 min–1; kcompartment2 = rate constant of slow elimination = 0.00012 min–1; vr = volume ratio of compartment 1 to 2 = 3.44. B) Plot of calculated elimination half-life of bryostatin in compartment 2 estimated in (A) versus weeks of infusion.
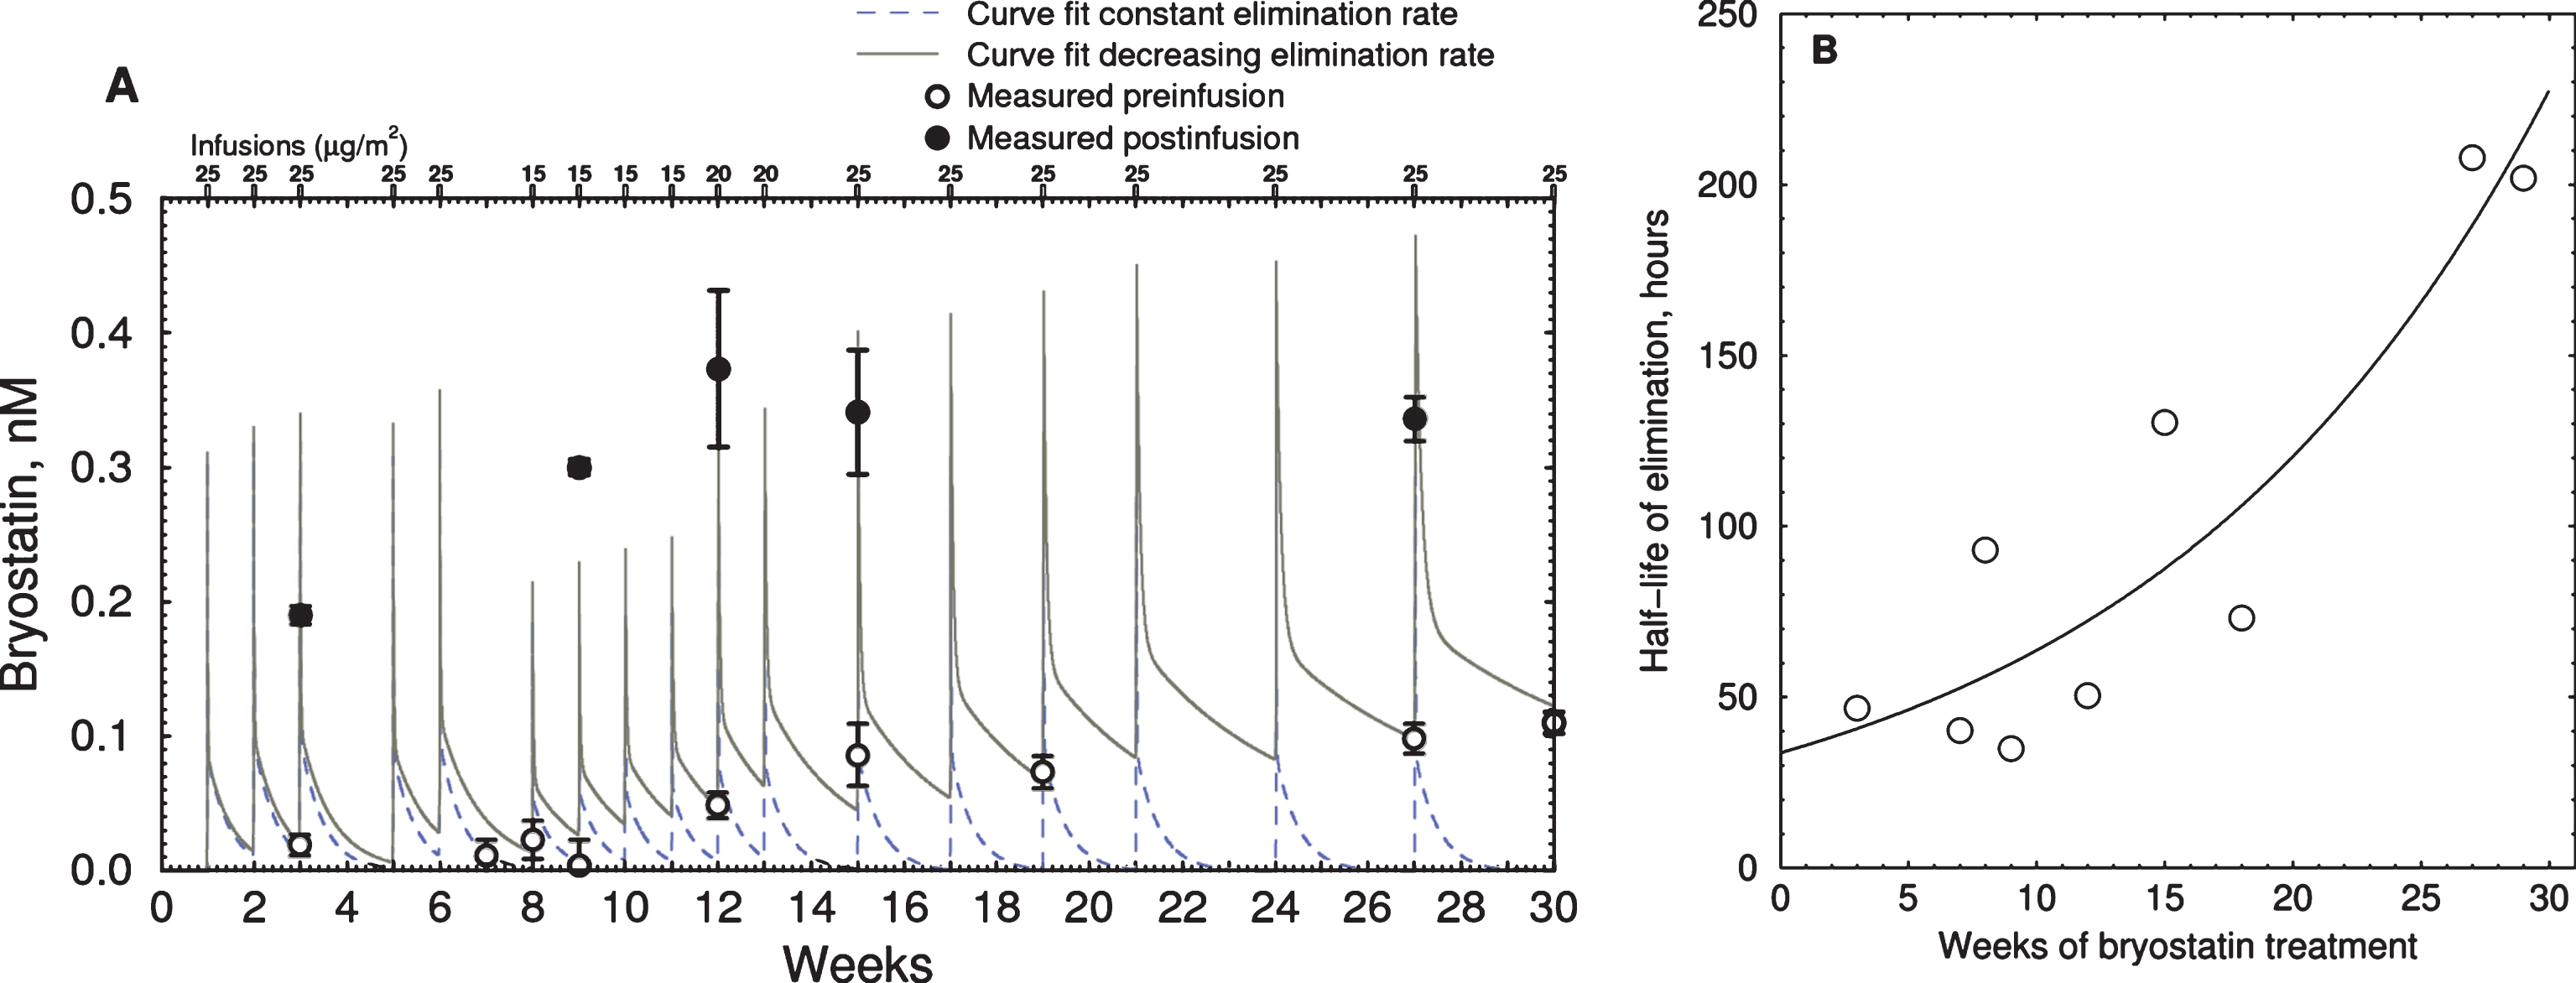
Fig.6
Pharmacokinetic simulation of bryostatin 1 blood plasma concentration in mouse. Upper curve = blood plasma. Lower curve = brain. Values are mean±SEM, n = 3–6 mice per group. The lower curve was fitted to measured values using a simple saturable brain uptake model using parameters of Vmuptake = 0.017 nM min–1, Kmuptake = 1.5 nM, and rate constant of elimination = 0.027 min–1.
The simulation showed that the accumulation of bryostatin was due a decrease in the rate constant of elimination from the slower compartment. The apparent half-life of elimination, calculated by comparing pre- and post-dose blood plasma levels for each administration, increased from 32 to 200 h during the course of treatment (Fig. 5B). Post-infusion values (filled circles) were not at the peak of the simulated values in all cases, indicating that these blood samples were drawn near but not precisely at the point of peak plasma concentration.
Preclinical experiments
To test optimization of the doses used both in the Phase IIa and the Expanded Access trials, we conducted exploratory tests of different protocols by administering bryostatin 1 to male C57BL/6N mice with i.v. bolus injections (each over 20 s) through the tail vein. We used the mouse results to develop our model, which was needed to interpret the long-term human results. We also used the mouse PKC results (below) to inform the dosing schedule. Groups of mice were injected biweekly, weekly, semiweekly (1 on/1 off), or intermittently (3 on/3 off) using up to six doses of 10, 15, 20, or 25 μg/m2 (see Table 1 for injection schedules). Blood PBMCs and brain were collected at 1 h or 24 h after the last dose. We measured total PKCɛ by isozyme-specific ELISA in brain extracts and PBMCs isolated from blood. Subcellular localization of PKCɛ in brain was calculated as the ratio of PKCɛ in membrane / (membrane + cytosol) fractions. We also measured brain BDNF, proBDNF, PSD-95, pPSD-95, and synaptophysin in unfractionated brain extracts. All measurements were compared with control mice injected on the same days with vehicle only.
Mouse brain BDNF
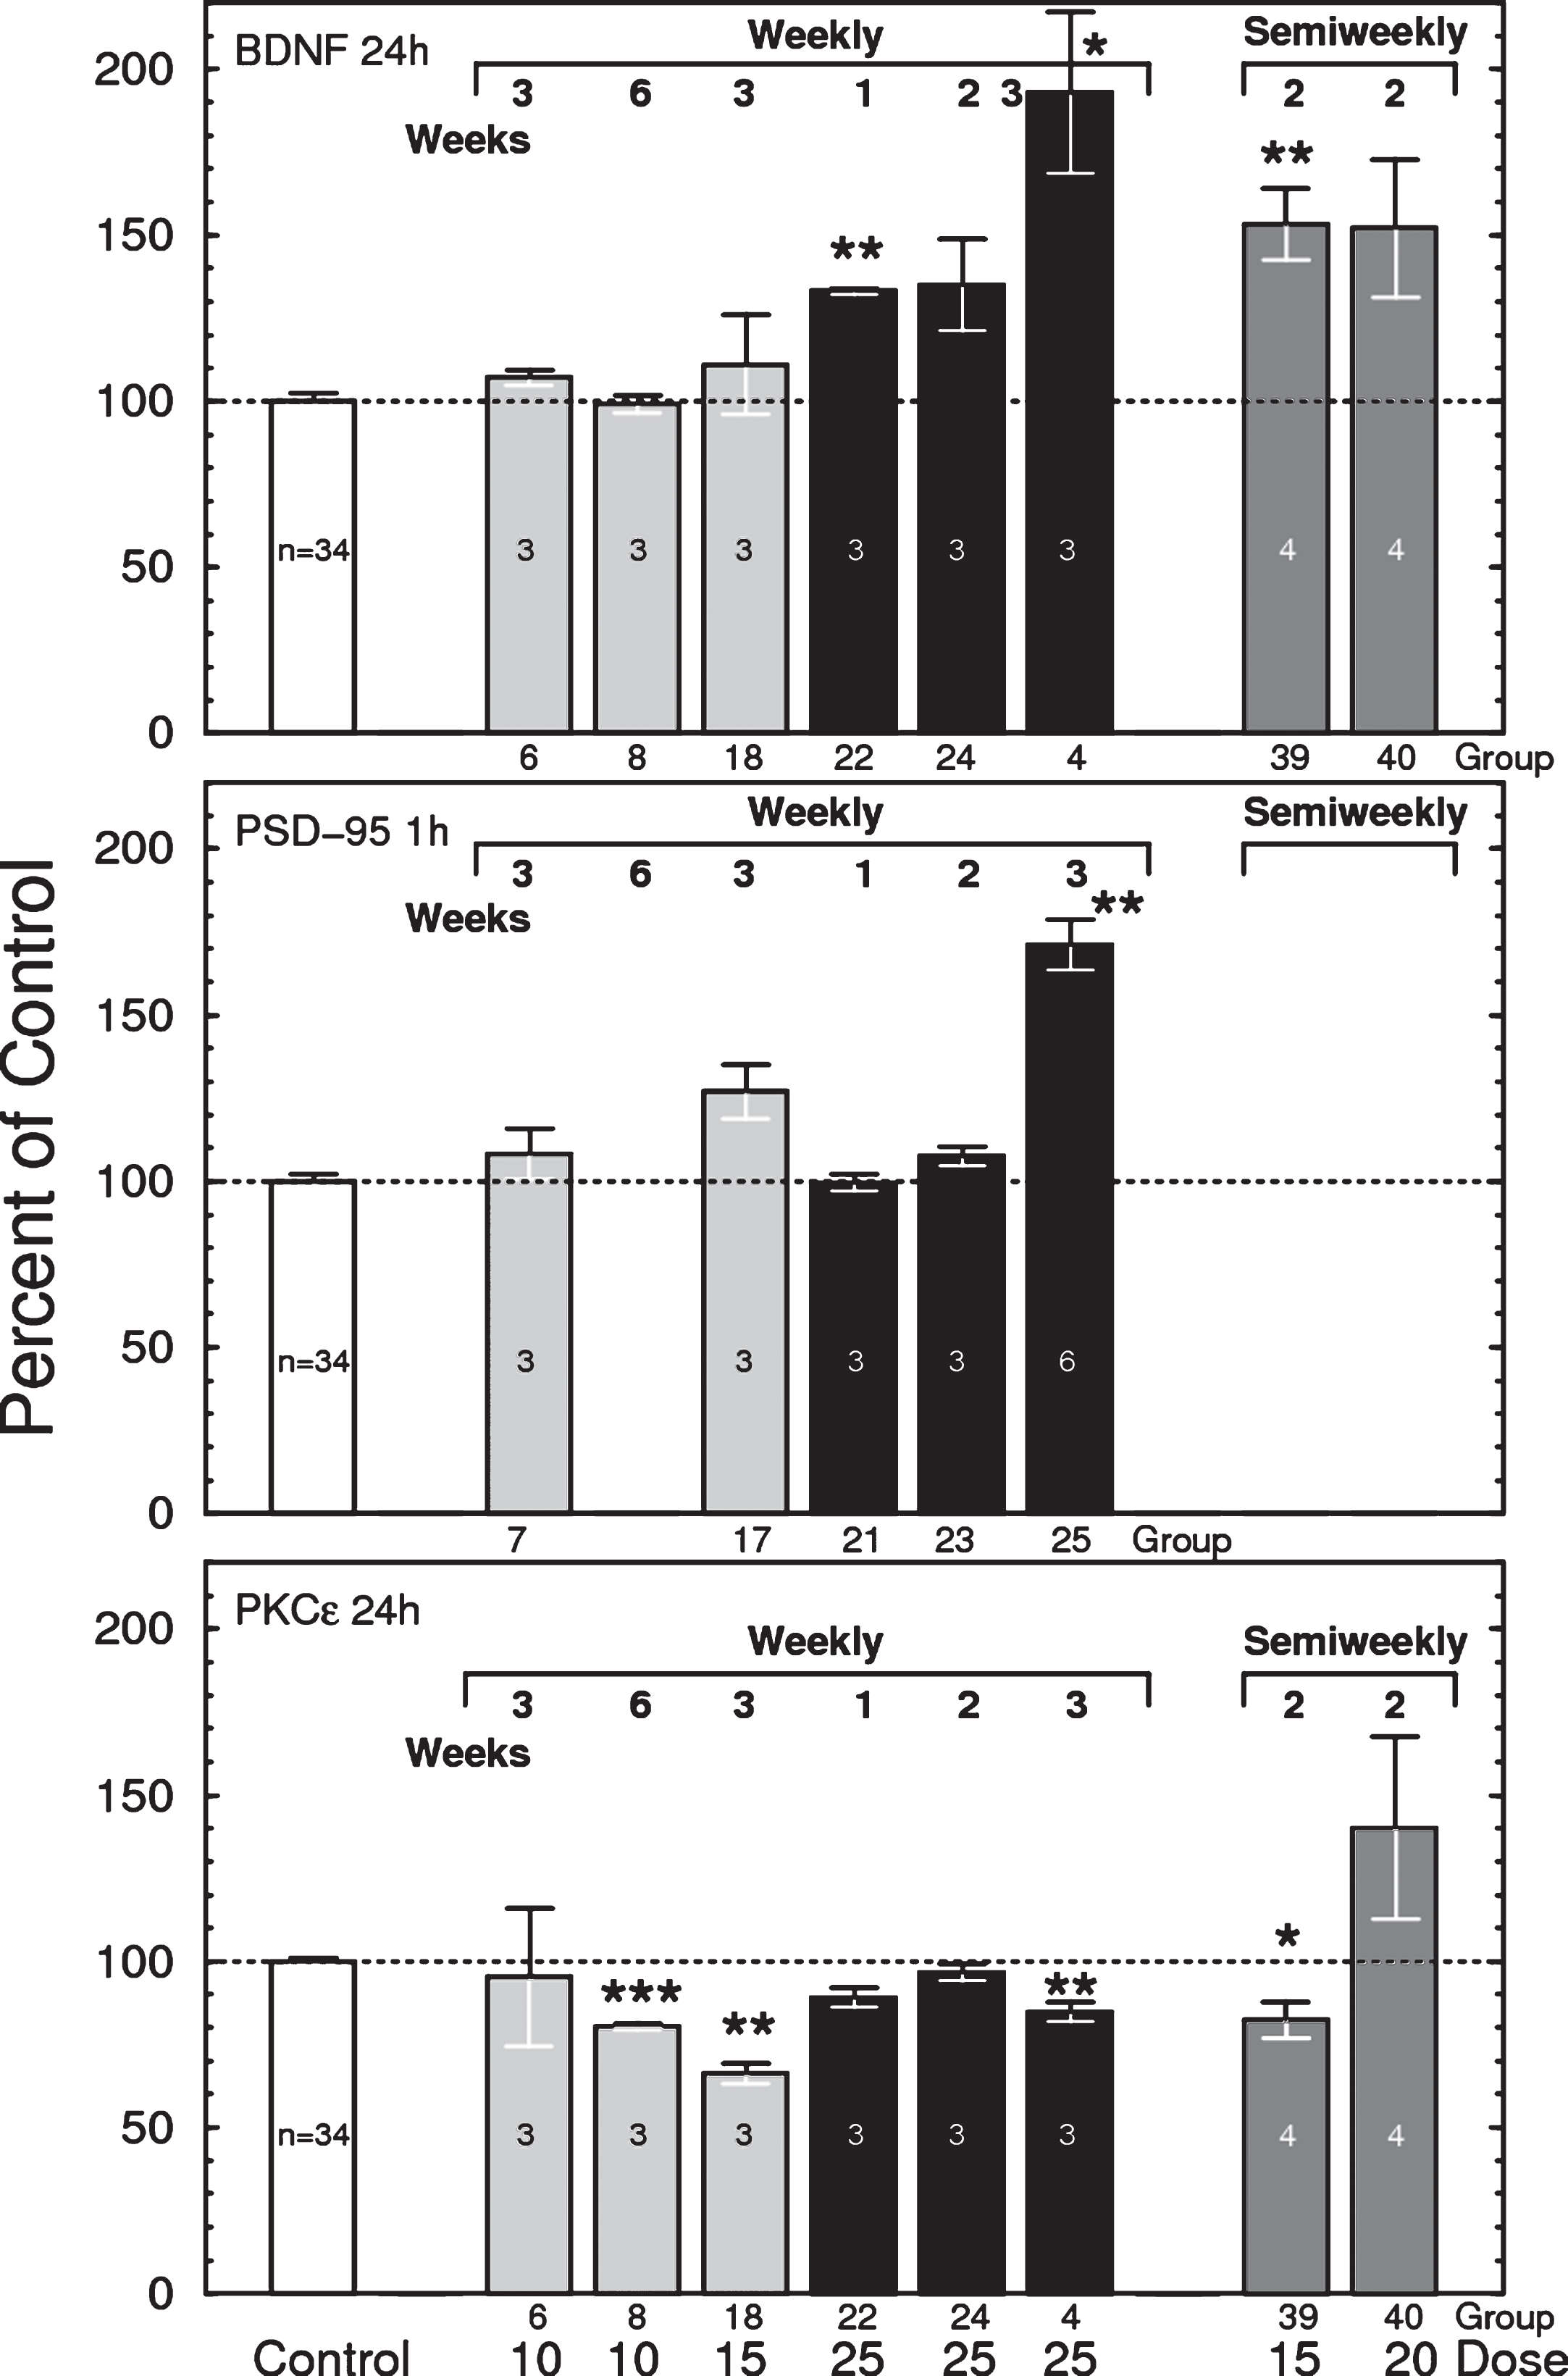
As reported earlier [5, 47, 48], bryostatin 1 increased the brain levels of total BDNF (mature + pro-BDNF forms) by up to 100% (Fig. 7, top). The elevation in BDNF increased linearly with the number of successive injections given at one week intervals, with the largest effects observed 24 h after 3 weeks of 25 μg/m2 bryostatin 1 weekly. Increasing the dose frequency to twice per week elevated BDNF at lower doses (15 and 20 μg/m2), indicating that repeated dosing has a cumulative effect. Other dosing schedules, including 1 on/1 off (alternating weeks), and 2 doses of 25 μg/m2 followed by alternating weeks of 20 μg/m2 (2×25 + 20 1 on/1 off), produced little or no elevation of BDNF (not shown). Little change in BDNF was observed in samples collected 1 h after injection (not shown). No significant changes were observed for BDNF in blood plasma or for proBDNF in brain (not shown).
Fig.7
Top: Total brain BDNF measured 24 h after i.v. injections of bryostatin 1 in mice. Only weekly treated groups are shown. Each bar represents 3 to 6 mice except control = 31 mice (F(40,74) = 12.48, p < 0.0001, ANOVA, includes all thirteen 24-h treated groups). Bars are mean±SEM. *p < 0.05, **p < 0.01. See Table 1 for dosing schedule. Middle: Effects of bryostatin 1 on mouse brain PSD-95 measured 1 h after i.v injection of bryostatin. Each bar represents 3 to 6 mice except control = 31 mice (F(20,53) = 4.028, p < 0.0001). Bars are mean±SEM. **p < 0.01. Bottom: Total brain PKCɛ measured by PKCɛ-specific ELISA 24 h after i.v. injection of bryostatin 1 in mice. Only weekly treated groups are shown. Each bar represents 3 to 6 mice except control = 31 mice (F(40,74) = 12.48, p < 0.0001, ANOVA). Bars are mean±SEM). **p < 0.01, ***p < 0.001.
The nonlinearity of the dosage response relationship suggested the possibility that the elevation of BDNF could be a toxic effect. However, no changes in blood plasma neuron-specific enolase, a marker for neuronal death [49, 50], were observed in any sample. Thus, we conclude that bryostatin needs to be above a threshold level to produce an increase in BDNF, and that BDNF is not a response to toxic cell injury by bryostatin 1.
Mouse brain PSD-95
PSD-95 also increased after successive doses of 25 μg/m2 bryostatin 1 treatment (Fig. 7, middle). No other statistically significant correlation between PKCɛ and BDNF, PSD-95, or synaptophysin was observed at either 1 h or 24 h. No changes were observed for pPSD-95 (not shown).
Mouse brain PKCɛ
While single infusions in humans produced a transient elevation of PKCɛ, the principal observable effect of bryostatin 1 injected at 25 μg/m2 in mouse, measured both 1 h and 24 h after the last dose, was downregulation of total brain PKCɛ (F(40,74) = 12.48, p < 0.0001, ANOVA) (Fig. 7,bottom). This is consistent with the known effects of C1-domain PKC activators, whereby enzyme activation and translocation are followed by rapid downregulation due to proteasomal activity. Enzymatic PKC activity was generally consistent with the ELISA results (not shown). PKCɛ downregulation was more severe in PBMC cells, but also more variable (not shown).
We also measured membrane translocation, which is accepted as an index of PKC activation. Translocation is defined as PKC in membrane / Total PKC; thus a value of 1.00 signifies complete membrane translocation. Bryostatin 1 produced maximal membrane translocation at 15 μg/m2 for 3 weeks and 25 μg/m2 for 2 weeks when measured 24 h after administration (not shown). Mice with higher translocation generally also had higher downregulation, consistent with the known life cycle for PKC. In mouse brain the baseline level of translocation was 0.775±0.032 (mean±SE, N = 33); therefore, a 29% increase in the ratio would represent essentially 100% membrane localization.
DISCUSSION
This was the first clinical study of bryostatin 1 in AD patients. Bryostatin 1 produced large changes in PKCɛ during the early course of treatment both in mice and in the EA patient, indicating effective target engagement. Peak levels of PKCɛ occurred within 1 h of infusion onset. Long-term treatment induced downregulation of PKCɛ that was dependent on dosing levels and duration. Administration of the highest doses used here (25 μg/m2) for 5 of 6 successive weeks produced measurable downregulation. Downregulation is a well-documented phenomenon that results from the transient nature of PKCɛ C1 domain activation in neurons [11, 12], after which PKC becomes dephosphorylated, ubiquitinated, and degraded primarily by the proteasome. Our previous results showed that a brief pulse of PKCɛ activation produces prolonged protein synthesis that lasts for at least one week [51]. Thus, PKCɛ activators can produce long-term changes that continue well after the drug has been eliminated. Bryostatin produces a marked improvement in performance of 5XFAD mice in the water maze memory task, and also improves performance in unimpaired wild-type animals [3]. Further research on the mechanisms of PKCɛ biosynthesis and degradation will be necessary in order to derive the numerical relationship between PBMC PKCɛ, brain PKCɛ, brain BDNF, and synaptogenesis that is needed for PKCɛ to be useful as abiomarker.
The Phase IIa trial results are consistent with our animal testing [3, 52] which indicated an early cognitive enhancement within hours of the first dosing. In EA Subject #3, the PKCɛ appeared to correlate with the psychometric scores in the early part of treatment, even though the correlation did not reach statistical significance. The threshold effect on BDNF noted in our preclinical results suggests that the frequency of dosing might be a critical factor in determining effectiveness of bryostatin.
Repeated infusions of bryostatin over several months in EA Subject #3 led to an accumulation of blood plasma levels reaching 0.1 nM up to 2 weeks after infusion. Simulations showed that this accumulation could not be described by a fixed elimination rate, and that a 6-fold decrease in elimination rate was necessary to account for the increased preinfusion levels. This could be attributed to disease progression or to gradual drug accumulation in a slowly equilibrating compartment. By contrast, in the Phase IIa trial, in which a single infusion was given, the time course was characterized by rapid elimination. Although samples in the Phase IIa study were collected out to 14 days, the sensitivity of the assay used in the Phase IIa trial (lower limit of quantitation = 0.2 ng/ml) was insufficient to perform detailed pharmacokinetic modeling. The increased half-life of bryostatin 1 when administered over long periods suggests that future trials should consider possible bryostatin accumulation over long intervals ofdosing.
The neuroprotective effects of bryostatin 1 may be due to its ability to induce synaptogenesis by elevating levels of synaptic growth factors in brain such as BDNF [47, 53] and other synaptic growth factors. BDNF is a potent neurotrophic factor, but is unable to cross the blood-brain barrier [54]. Our previous animal experiments demonstrated that bryostatin 1 is capable of crossing the blood-brain barrier and restoring water maze learning in aged rats and transgenic mice used as models for many types of neurodegenerative diseases [7, 48, 55, 56]. However, other mechanisms of neuroprotection, such as a direct effect of bryostatin-binding proteins on dendritic spine architecture [57], anti-apoptosis, or interference with amyloid-β toxicity through apolipoprotein E, [58], endothelin convertase [59], or neprilysin [60] may also be important.
These preliminary studies provide valuable guidance for the design of larger clinical trials. Bryostatin was well tolerated in AD patients. Although this study was insufficiently powered to draw any definitive conclusions about efficacy, bryostatin appeared to produce a short-duration improvement of the MMSE psychometric scores. The long half-life of bryostatin 1 and high between-patient variability in the PKC biomarker suggest that protocols may need to accommodate bryostatin elevation over long intervals of dose administration.
The findings here of safety, favorable pharmacokinetics, target engagement, initial cognitive improvement with even a single dose in the Phase IIa trial, and improvements of cognitive functions in the Compassionate Use trials, collectively suggest that bryostatin may be a promising candidate drug for the treatment of AD.
ACKNOWLEDGMENTS
We acknowledge the invaluable assistance ofDr. Ellen Cooper of Clinregsolutions.com, Drs. Jim New, David Crockford, Richard Scheyer, and Warren Wasiewski of Neurotrope BioScience, Lisa Aragon and Janie Krull of Via Christi Hospitals, Dr. Gerry Hobbs for statistical advice, Dr. Shirley Neitch of Cabell Huntington Hospital, and Mr. Ryan Johnson of BRNI for technical assistance. We appreciate the generous grant of bryostatin 1 drug substance from the NCI.
Authors’ disclosures available online (http://j-alz.com/manuscript-disclosures/17-0161r1).
REFERENCES
[1] | Khan TK , Sen A , Hongpaisan J , Lim CS , Nelson TJ , Alkon DL ((2015) ) PKCepsilon deficits in Alzheimer’s disease brains and skin fibroblasts. J Alzheimers Dis 43: , 491–509. |
[2] | Nelson TJ, Collin C, Alkon DL ((1990) ) Isolation of a G protein that is modified by learning and reduces potassium currents in Hermissenda. Science 247: , 1479–1483. |
[3] | Hongpaisan J , Alkon DL ((2007) ) A structural basis for enhancement of long-term associative memory in single dendritic spines regulated by PKC. Proc Natl Acad Sci U S A 104: , 19571–19576. |
[4] | Shearman MS , Shinomura T , Oda T , Nishizuka Y ((1991) ) Synaptosomal protein kinase C subspecies: A. Dynamic changes in the hippocampus and cerebellar cortex concomitant with synaptogenesis. J Neurochem 56: , 1255–1262. |
[5] | Hongpaisan J , Xu C , Sen A , Nelson TJ , Alkon DL ((2013) ) PKC activation during training restores mushroom spine synapses and memory in the aged rat. Neurobiol Dis 55: , 44–62. |
[6] | Hongpaisan J , Sun MK , Alkon DL ((2011) ) PKC epsilon activation prevents synaptic loss, Abeta elevation, and cognitive deficits in Alzheimer’s disease transgenic mice. J Neurosci 31: , 630–643. |
[7] | Sun MK , Hongpaisan J , Nelson TJ , Alkon DL ((2008) ) Poststroke neuronal rescue and synaptogenesis mediated in vivo by protein kinase C in adult brains. Proc Natl Acad SciU S A 105: , 13620–13625. |
[8] | Tan Z , Turner RC , Leon RL , Li X , Hongpaisan J , Zheng W , Logsdon AF , Naser ZJ , Alkon DL , Rosen CL , Huber JD ((2013) ) Bryostatin improves survival and reduces ischemic brain injury in aged rats after acute ischemic stroke. Stroke 44: , 3490–3497. |
[9] | Sun MK , Hongpaisan J , Alkon DL ((2016) ) Rescue of synaptic phenotypes and spatial memory in young Fragile X mice. J Pharmacol Exp Ther 357: , 300–310. |
[10] | Stahelin RV , Digman MA , Medkova M , Ananthanarayanan B , Melowic HR , Rafter JD , Cho W ((2005) ) Diacylglycerol-induced membrane targeting and activation of protein kinase Cepsilon: Mechanistic differences between protein kinases Cdelta and Cepsilon. J Biol Chem 280: , 19784–19793. |
[11] | Wender PA , Lippa B , Park CM , Irie K , Nakahara A , Ohigashi H ((1999) ) Selective binding of bryostatin analogues to the cysteine rich domains of protein kinase C isozymes. Bioorg Med Chem Lett 9: , 1687–1690. |
[12] | Lorenzo PS , Bogi K , Hughes KM , Beheshti M , Bhattacharyya D , Garfield SH , Pettit GR , Blumberg PM ((1999) ) Differential roles of the tandem C1 domains of protein kinase C delta in the biphasic down-regulation induced by bryostatin 1. Cancer Res 59: , 6137–6144. |
[13] | Nishizuka Y ((1992) ) Intracellular signaling by hydrolysis of phospholipids and activation of protein kinase C. Science 258: , 607–614. |
[14] | Kim H , Han SH , Quan HY , Jung YJ , An J , Kang P , Park JB , Yoon BJ , Seol GH , Min SS ((2012) ) Bryostatin-1 promotes long-term potentiation via activation of PKCalpha and PKCepsilon in the hippocampus. Neuroscience 226: , 348–355. |
[15] | Huwiler A , Fabbro D , Pfeilschifter J ((1994) ) Comparison of different tumour promoters and bryostatin 1 on protein kinase C activation and down-regulation in rat renal mesangial cells. Biochem Pharmacol 48: , 689–700. |
[16] | Szallasi Z , Smith CB , Pettit GR , Blumberg PM ((1994) ) Differential regulation of protein kinase C isozymes by bryostatin 1 and phorbol 12-myristate 13-acetate in NIH 3T3 fibroblasts. J Biol Chem 269: , 2118–2124. |
[17] | Reynolds NJ , Baldassare JJ , Henderson PA , Shuler JL , Ballas LM , Burns DJ , Moomaw CR , Fisher GJ ((1994) ) Translocation and downregulation of protein kinase C isoenzymes-alpha and -epsilon by phorbol ester and bryostatin-1 in human keratinocytes and fibroblasts. J Invest Dermatol 103: , 364–369. |
[18] | Lee HW , Smith L , Pettit GR , Bingham Smith J ((1996) ) Dephosphorylation of activated protein kinase C contributes to downregulation by bryostatin. Am J Physiol 271: , C304–C311. |
[19] | Leontieva OV , Black JD ((2004) ) Identification of two distinct pathways of protein kinase Calpha down-regulation in intestinal epithelial cells. J Biol Chem 279: , 5788–5801. |
[20] | Nelson TJ , Alkon DL ((2009) ) Neuroprotective versus tumorigenic protein kinase C activators. Trends Biochem Sci 34: , 136–145. |
[21] | Lu Z , Liu D , Hornia A , Devonish W , Pagano M , Foster DA ((1998) ) Activation of protein kinase C triggers its ubiquitination and degradation. Mol Cell Biol 18: , 839–845. |
[22] | Lee HW , Smith L , Pettit GR , Smith JB ((1997) ) Bryostatin 1 and phorbol ester down-modulate protein kinase C-alpha and -epsilon via the ubiquitin/proteasome pathway in human fibroblasts. Mol Pharmacol 51: , 439–447. |
[23] | Varterasian ML , Mohammad RM , Shurafa MS , Hulburd K , Pemberton PA , Rodriguez DH , Spadoni V , Eilender DS , Murgo A , Wall N , Dan M , Al-Katib AM ((2000) ) Phase II trial of bryostatin 1 in patients with relapsed low-grade non-Hodgkin’s lymphoma and chronic lymphocytic leukemia. Clin Cancer Res 6: , 825–828. |
[24] | Varterasian ML , Pemberton PA , Hulburd K , Rodriguez DH , Murgo A , Al-Katib AM ((2001) ) Phase II study of bryostatin 1 in patients with relapsed multiple myeloma. Invest New Drugs 19: , 245–247. |
[25] | Plimack ER , Tan T , Wong YN , von Mehren MM , Malizzia L , Roethke SK , Litwin S , Li T , Hudes GR , Haas NB ((2014) ) A phase I study of temsirolimus and bryostatin-1 in patients with metastatic renal cell carcinoma and soft tissue sarcoma. Oncologist 19: , 354–355. |
[26] | Morgan RJ Jr , Leong L , Chow W , Gandara D , Frankel P , Garcia A , Lenz HJ , Doroshow JH ((2012) ) Phase II trial of bryostatin-1 in combination with cisplatin in patients with recurrent or persistent epithelial ovarian cancer: A California cancer consortium study. Invest New Drugs 30: , 723–728. |
[27] | Lam AP , Sparano JA , Vinciguerra V , Ocean AJ , Christos P , Hochster H , Camacho F , Goel S , Mani S , Kaubisch A ((2010) ) Phase II study of paclitaxel plus the protein kinase C inhibitor bryostatin-1 in advanced pancreatic carcinoma. Am J Clin Oncol 33: , 121–124. |
[28] | Peterson AC , Harlin H , Karrison T , Vogelzang NJ , Knost JA , Kugler JW , Lester E , Vokes E , Gajewski TF , Stadler WM ((2006) ) A randomized phase II trial of interleukin-2 in combination with four different doses of bryostatin-1 in patients with renal cell carcinoma. Invest New Drugs 24: , 141–149. |
[29] | Ajani JA , Jiang Y , Faust J , Chang BB , Ho L , Yao JC , Rousey S , Dakhil S , Cherny RC , Craig C , Bleyer A ((2006) ) A multi-center phase II study of sequential paclitaxel and bryostatin-1 (NSC 339555) in patients with untreated, advanced gastric or gastroesophageal junction adenocarcinoma. Invest New Drugs 24: , 353–357. |
[30] | Madhusudan S , Protheroe A , Propper D , Han C , Corrie P , Earl H , Hancock B , Vasey P , Turner A , Balkwill F , Hoare S , Harris AL ((2003) ) A multicentre phase II trial of bryostatin-1 in patients with advanced renal cancer. Br J Cancer 89: , 1418–1422. |
[31] | Winegarden JD , Mauer AM , Gajewski TF , Hoffman PC , Krauss S , Rudin CM , Vokes EE ((2003) ) A phase II study of bryostatin-1 and paclitaxel in patients with advanced non-small cell lung cancer. Lung Cancer 39: , 191–196. |
[32] | Pfister DG , McCaffrey J , Zahalsky AJ , Schwartz GK , Lis E , Gerald W , Huvos A , Shah J , Kraus D , Shaha A , Singh B , Wolden S , Zelefsky M , Palgi I ((2002) ) A phase II trial of bryostatin-1 in patients with metastatic or recurrent squamous cell carcinoma of the head and neck. Invest New Drugs 20: , 123–127. |
[33] | Blackhall FH , Ranson M , Radford JA , Hancock BW , Soukop M , McGown AT , Robbins A , Halbert G , Jayson GC ((2001) ) A phase II trial of bryostatin 1 in patients with non-Hodgkin’s lymphoma. Br J Cancer 84: , 465–469. |
[34] | Propper DJ , Macaulay V , O’Byrne KJ , Braybrooke JP , Wilner SM , Ganesan TS , Talbot DC , Harris AL ((1998) ) A phase II study of bryostatin 1 in metastatic malignant melanoma. Br J Cancer 78: , 1337–1341. |
[35] | Grant S , Roberts J , Poplin E , Tombes MB , Kyle B , Welch D , Carr M , Bear HD ((1998) ) Phase Ib trial of bryostatin 1 in patients with refractory malignancies. Clin Cancer Res 4: , 611–618. |
[36] | Nelson TJ , Sen A , Alkon DL , Sun MK ((2014) ) Adduct formation in liquid chromatography-triple quadrupole mass spectrometric measurement of bryostatin 1. J Chromatogr B Analyt Technol Biomed Life Sci 944: , 55–62. |
[37] | Kuzirian AM , Epstein HT , Gagliardi CJ , Nelson TJ , Sakakibara M , Taylor C , Scioletti AB , Alkon DL ((2006) ) Bryostatin enhancement of memory in Hermissenda. Biol Bull 210: , 201–214. |
[38] | Zhao M , Rudek MA , He P , Smith BD , Baker SD ((2005) ) Validation and implementation of a method for determination of bryostatin 1 in human plasma by using liquid chromatography/tandem mass spectrometry. Anal Biochem 337: , 143–148. |
[39] | Wilcox RR ((2005) ) Introduction to Robust Estimation and Hypothesis Testing, 2nd ed., Elsevier, Burlington, MA. |
[40] | Ku GY , Ilson DH , Schwartz LH , Capanu M , O’Reilly E , Shah MA , Kelsen DP , Schwartz GK ((2008) ) Phase II trial of sequential paclitaxel and 1 h infusion of bryostatin-1 in patients with advanced esophageal cancer. Cancer Chemother Pharmacol 62: , 875–880. |
[41] | El-Rayes BF , Gadgeel S , Shields AF , Manza S , Lorusso P , Philip PA ((2006) ) Phase I study of bryostatin 1 and gemcitabine. Clin Cancer Res 12: , 7059–7062. |
[42] | Bedikian AY , Plager C , Stewart JR , O’Brian CA , Herdman SK , Ross M , Papadopoulos N , Eton O , Ellerhorst J , Smith T ((2001) ) Phase II evaluation of bryostatin-1 in metastatic melanoma. Melanoma Res 11: , 183–188. |
[43] | Denvir J , Neitch S , Fan J , Niles RM , Boskovic G , Schreurs BG , Primerano DA , Alkon DL ((2015) ) Identification of the PS1 Thr147Ile variant in a family with very early onset dementia and expressive aphasia. J Alzheimers Dis 46: , 483–490. |
[44] | Dowlati A , Lazarus HM , Hartman P , Jacobberger JW , Whitacre C , Gerson SL , Ksenich P , Cooper BW , Frisa PS , Gottlieb M , Murgo AJ , Remick SC ((2003) ) Phase I and correlative study of combination bryostatin 1 and vincristine in relapsed B-cell malignancies. Clin Cancer Res 9: , 5929–5935. |
[45] | Weitman S , Langevin AM , Berkow RL , Thomas PJ , Hurwitz CA , Kraft AS , Dubowy RL , Smith DL , Bernstein M ((1999) ) A Phase I trial of bryostatin-1 in children with refractory solid tumors: A Pediatric Oncology Group study. Clin Cancer Res 5: , 2344–2348. |
[46] | Zhang X , Zhang R , Zhao H , Cai H , Gush KA , Kerr RG , Pettit GR , Kraft AS ((1996) ) Preclinical pharmacology of the natural product anticancer agent bryostatin 1, an activator of protein kinase C. Cancer Res 56: , 802–808. |
[47] | Sen A , Nelson TJ , Alkon DL ((2015) ) ApoE4 and Abeta oligomers reduce BDNF expression via HDAC nuclear translocation. J Neurosci 35: , 7538–7551. |
[48] | Sun MK , Hongpaisan J , Lim CS , Alkon DL ((2014) ) Bryostatin-1 restores hippocampal synapses and spatial learning and memory in adult fragile x mice. J Pharmacol Exp Ther 349: , 393–401. |
[49] | Sulter G , Elting JW , De Keyser J ((1998) ) Increased serum neuron specific enolase concentrations in patients with hyperglycemic cortical ischemic stroke. Neurosci Lett 253: , 71–73. |
[50] | Cunningham RT , Young IS , Winder J , O’Kane MJ , McKinstry S , Johnston CF , Dolan OM , Hawkins SA , Buchanan KD ((1991) ) Serum neurone specific enolase (NSE) levels as an indicator of neuronal damage in patients with cerebral infarction. Eur J Clin Invest 21: , 497–500. |
[51] | Alkon DL , Epstein H , Kuzirian A , Bennett MC , Nelson TJ ((2005) ) Protein synthesis required for long-term memory is induced by PKC activation on days before associative learning. Proc Natl Acad Sci U S A 102: , 16432–16437. |
[52] | Sun MK , Nelson TJ , Alkon DL ((2015) ) Towards universal therapeutics for memory disorders. Trends Pharmacol Sci 36: , 384–394. |
[53] | Lim CS , Alkon DL ((2012) ) Protein kinase C stimulates HuD-mediated mRNA stability and protein expression of neurotrophic factors and enhances dendritic maturation of hippocampal neurons in culture. Hippocampus 22: , 2303–2319. |
[54] | Allen SJ , Watson JJ , Shoemark DK , Barua NU , Patel NK ((2013) ) GDNF, NGF and BDNF as therapeutic options for neurodegeneration. Pharmacol Ther 138: , 155–175. |
[55] | Sun MK , Alkon DL ((2009) ) Protein kinase C activators as synaptogenic and memory therapeutics. Arch Pharm (Weinheim) 342: , 689–698. |
[56] | Sun MK , Alkon DL ((2013) ) Cerebral ischemia-induced difference in sensitivity to depression and potential therapeutics in rats. Behav Pharmacol 24: , 222–228. |
[57] | Nelson TJ , Alkon DL ((2015) ) Molecular regulation of synaptogenesis during associative learning and memory. Brain Res 1621: , 239–251. |
[58] | Sen A , Alkon DL , Nelson TJ ((2012) ) Apolipoprotein E3 (ApoE3) but not ApoE4 protects against synaptic loss through increased expression of protein kinase C epsilon. J Biol Chem 287: , 15947–15958. |
[59] | Nelson TJ , Cui C , Luo Y , Alkon DL ((2009) ) Reduction of beta-amyloid levels by novel protein kinase C(epsilon) activators. J Biol Chem 284: , 34514–34521. |
[60] | Lim CS , Alkon DL ((2014) ) PKCepsilon promotes HuD-mediated neprilysin mRNA stability and enhances neprilysin-induced Abeta degradation in brain neurons. PLoS One 9: , e97756. |

