Quantifying the Potential for Low-Level Transport of Black Carbon Emissions from Cropland Burning in Russia to the Snow-Covered Arctic
 Joanne V. Hall
 Tatiana V. Loboda
- Department of Geographical Sciences, University of Maryland, College Park, MD, United States
Short lived aerosols and pollutants transported from northern mid-latitudes have amplified the short term warming in the Arctic region. Among those black carbon is recognized as the second most important human emission in regards to climate forcing, behind carbon dioxide, with a total climate forcing of +1.1 Wm−2. Studies have suggested that cropland burning may be a large contributor to the black carbon emissions which are directly deposited on the snow in the Arctic. However, commonly applied atmospheric transport models rely on estimates of black carbon emissions from cropland burning which are known to be highly inaccurate in both the amount and the timing of release. Instead, this study quantifies the potential for the deposition of hypothetical black carbon emissions from known cropland burning in Russia, identified by the Moderate Resolution Imaging Spectroradiometer (MODIS) active fire detections, through low-level transport to the snow in the Arctic using wind vectors from the European Centre for Medium-Range Weather Forecasts' ERA-Interim Reanalysis product. Our results confirm that Russian cropland burning is a potentially significant source of black carbon deposition on the Arctic snow in the spring despite the low injection heights associated with cropland burning. Approximately 10% of the observed spring (March–May) cropland active fires (7% annual) likely contribute to black carbon deposition on the Arctic snow from as far south as at least 40°N. Furthermore, our results show that potential spring black carbon emissions from cropland burning in Russia can be deposited beyond 80°N, however, the majority (~90%-depending on injection height) of all potential spring deposition occurs below 75°N.
Introduction
Over the past 30 years, the Arctic surface air temperature has risen at rates more than double of those anywhere else on Earth (NOAA, 2017). This has resulted in the drastic loss of sea ice, increased release of stored carbon and methane from melting permafrost, and substantial impacts on migratory patterns of birds and animals among many other environmental changes (EPA, 2016; NOAA, 2017; NSIDC, 20171). However, arguably one of the most important consequences of the amplified warming of the Arctic is its impact on the Earth's radiation budget through the decrease in snow and ice albedo which further drives increases in regional and global temperatures via a positive feedback loop within the climate system (Wexler, 1953; Chapin et al., 2005). While the reported increases in annual and especially cold-season temperatures (NOAA, 2017) are large enough to directly result in the loss of surface snow and sea ice, atmospheric pollutants—and especially black carbon (BC) deposition on the snow and ice surface—have contributed to the changes in snow/ice albedo and the subsequent accelerated rate of melting (Ramanathan and Carmichael, 2008; Dou and Xiao, 2016).
While remote and largely inaccessible, the Arctic is a known pollutant receptor region as the majority of pollution is transported via oceanic and atmospheric circulation from outside source regions, yet there are also important local sources including pollution from gas and oil exploration, shipping, and emissions from boreal forest fires (Law and Stohl, 2007; Arnold et al., 2016). The release of long-lived greenhouses gases, such as carbon dioxide, are responsible for the longer-term warming of the Earth, however, emitted short-lived aerosols and pollutants are key drivers impacting the Arctic climate. Specifically, short-lived pollutants, for example methane and BC, primarily emitted from open-source biomass burning have a large influence on regional warming (EPA, 2016). BC—the absorptive byproduct of the incomplete combustion of carbonaceous fuels—has received a great deal of attention due to its absorptive efficiency (Quinn et al., 2011) and its fairly complex influence on the climate with both direct (increased absorption of shortwave radiation in the atmosphere) and indirect (changes in the surface albedo; changes in emissivity; and impacts on the distribution and properties of clouds) effects. The short atmospheric lifetime of BC, on average approximately 1 week (Koch and Hansen, 2005; Cape et al., 2012), fluctuates with variations related to the type of deposition (wet or dry) and atmospheric processes, for instance, mixing with other aerosol compounds. Atmospheric removal of BC occurs within several days to weeks and the mixing of BC with other substances occurs within 1–5 days (Jacobson, 2001; Bond et al., 2013). Although air pollution in the Arctic is comprised of several other components, including, ozone, sulfate aerosols, and methane, BC is of particular importance primarily due to the effectiveness of its absorptive properties. A new international initiative PACES (air Pollution in the Arctic: Climate Environment and Societies) under the partnership of the International Global Atmospheric Chemistry Project and the International Arctic Science Committee emphasizes the importance of studying processes controlling Arctic air pollution with a focus on accurately identifying the potential BC source locations and the relative contributions to the potential deposition on the Arctic snow (Arnold et al., 2016).
Biomass burning (forests, grasslands, and croplands), gas flaring, and transportation emissions within East- and South Asia and Russia have been identified as the dominant sources of BC within the Arctic (e.g., Klonecki et al., 2003; Stohl et al., 2006; AMAP, 2015; Evangeliou et al., 2016; Winiger et al., 2017). Specifically, several studies have indicated that biomass burning sources as far south as 40°N are assumed to significantly impact the Arctic region (e.g., Warneke et al., 2010; Quinn et al., 2011; Sharma et al., 2013; Cheng, 2014; Liu et al., 2015). However, the relative importance of these various sources is dependent on their seasonal patterns as the timing of the burning plays a key role in determining the efficacy of BC in the Arctic (Doherty et al., 2015). The largest impact on the snow/ice albedo in the Arctic from BC deposition occurs during spring when the solar energy is increasing while still retaining the maximum snow cover extent (Quinn et al., 2011). Despite the vast circumpolar extent of the boreal forest, the majority of forest fires occur during the summer months (Groisman et al., 2007); whereas cropland burning in Russia predominantly occurs within spring and fall months–related to the harvest cycles (Figure 1).
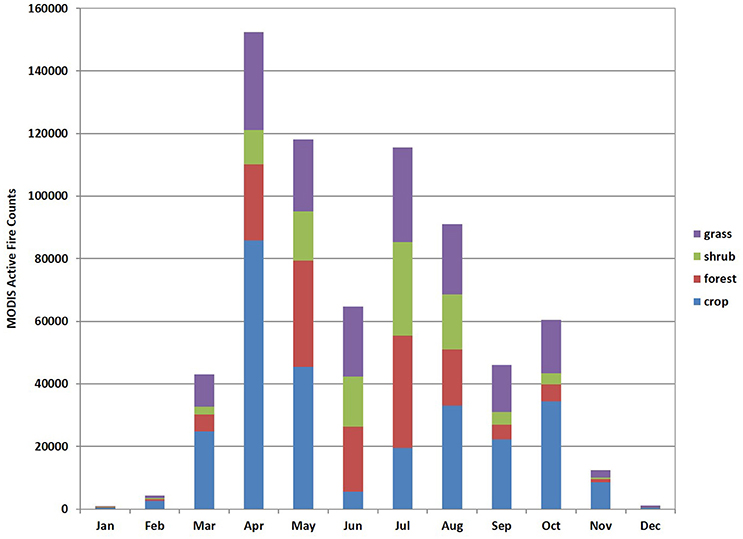
Figure 1. Average monthly MODIS active fire counts (2003–2015) within Russian grasslands, shrublands, forest and croplands as defined by the International Geosphere-Biosphere Programme (IGBP) land cover type data layer (MCD12Q1; Friedl et al., 2010).
Russia is the world's fifth-largest wheat exporter with a cropland area of approximately 215 × 104 km2, primarily located between 40 and 55°N (FAOSTAT, 2015)2. Although federal laws banning open-source burning are established in Russia it is still a common practice often used to clear, predominantly wheat, residue after harvest and before the next planting (Hall J. V. et al., 2016). Grains, specifically spring and winter wheat, are the major crop types in Russia and account for the majority of crop residue burning (USDA FAS, 2016). Typically, winter wheat is sown in fall, while spring wheat is sown in April and the burning of crop residue stubble usually occurs before planting to remove excess waste and pests from the field (McCarty et al., 2012).
Unlike forest fires, crop residue fires are typically low intensity, short-lived events with low injection heights ranging between 500 and 1,500 m (Ichoku and Kaufman, 2005; Martin et al., 2010; Soja et al., 2012). Although forest fires produce substantially more emissions than cropland fires due to higher biomass loading, Russian cropland burning occurs during the crucial time period for impacts on the Arctic snow/ice albedo. Despite the ongoing scientific progress, major challenges lie in the inability to accurately simulate the temporal and spatial variations in Arctic air pollution and to accurately quantify the contribution of air pollution from these source regions (Shindell et al., 2008; Hirdman et al., 2010; Monks et al., 2015). For example, a recent study focused on Siberian Arctic BC sources (Winiger et al., 2017) found gas flaring and biomass burning to be far less significant than transportation and domestic emissions—findings which are in contrast to other BC source contribution studies (e.g., AMAP, 2015). The majority of previous studies have utilized atmospheric chemical-transport models to quantify the contribution of BC emissions from northern mid-latitude source locations to the Arctic (e.g., Qi et al., 2017). Some have focused on modeled trajectories from atmospheric trajectory model outputs, such as NOAA's Hybrid Single Particle Lagrangian Integrated Trajectory (HYSPLIT) model, to identify potential source regions (e.g., Stohl et al., 2007; Larkin et al., 2012). Both atmospheric chemical-transport models (e.g., GEOS-Chem) and trajectory models (e.g., HYSPLIT) incorporate cropland burning emissions estimates, which are quite uncertain in the amount and timing of emissions. At present, crop residue emission estimates are notoriously difficult to quantify accurately. Typically, emission estimates are calculated following the equation originally developed by Seiler and Crutzen (1980):
Here, A represents the extent of burned area, B is the fuel load estimate, CE is the combustion efficiency, and ei is the emission factor for the specific species of interest. Cropland burned area (A) is a key requirement in the calculation; however, as shown in Hall J. V. et al. (2016), global publicly available and regionally-adjusted coarse resolution burned area products are unable to map burned area even within comparatively large and contiguous Russian croplands. Cropland burns differ dramatically from other types of natural and managed fire events and require a high frequency of observation which currently can only be met by coarse resolution satellite systems. Furthermore, the relatively small scale of individual burns (0.005–4 km2) and the low pre-fire biomass accumulations lead to comparatively minor changes in surface reflectance within coarse resolution pixels following a fire event, which are easily masked by bidirectional reflectance-induced changes in the recorded signal (Hall J. V. et al., 2016). In addition, all satellite-derived burned area maps carry an uncertainty of several days around the date of mapping resulting from missed observations due to cloud cover and high concentrations of atmospheric aerosols (Roy et al., 2008; Giglio et al., 2009; Hall J. V. et al., 2016). This inability to map cropland burned area accurately has large implications in both the magnitude and timing of calculated emissions.
Fuel loads (B) are typically derived from yield statistics using a yield-to-residue coefficient factor. The accuracy of these data are dependent on both the data source and the spatial resolution. For Russia, the yield data are typically produced at the oblast (administrative regions) level; however, variations between state official statistics and local expert data (compiled by USDA Foreign Agricultural Service, Mark Lindeman pers.comm.) has been identified in the yield tables. Finally, the values for the combustion efficiency (CE) and the emission factor for species i (ei) are usually based on laboratory and experimental analyses with a number of emission based studies (e.g., Wiedinmyer et al., 2011; McCarty et al., 2012) using the value quoted in a study by Andreae and Merlet (2001) which is defined by the authors as “best guess.”
Atmospheric chemical-transport models (e.g., GEOS-Chem) utilize biomass burning emission estimates from sources such as the Global Fire Emissions Database (GFED; Giglio et al., 2013). The updated GFEDv4 has been released to include small fires (detailed in Randerson et al., 2012) and crop residue coefficient factors from Akagi et al. (2011); however, the underlying cropland burned area and emission coefficients are still plagued with the previously addressed uncertainties. Atmospheric trajectory models (e.g., HYSPLIT) are the other main type of model used in studies identifying potential BC emission transport to the Arctic through simulating atmospheric trajectories, primarily back trajectories, and dispersions (Stein et al., 2015). However, these models also rely on emission estimates to monitor air pollutant concentration information over the course of the trajectory and require accurate estimates of the timings of those emissions to allow for proper transport and dispersion patterns within rapidly changing atmospheric conditions.
This inability to accurately quantify crop residue emissions or determine their spatial and temporal variability is a key weakness in these atmospheric transport models. The added complexity produces a sense of precision and accuracy which cannot be easily verified at any level. Furthermore, although numerous estimates of BC emissions from cropland burning in Russia have appeared in the scientific literature (e.g., McCarty et al., 2012; Hao et al., 2016), the inaccuracies within the current emission estimates inputs (e.g., burned area) lead to an imprecise representation of the timing and amount of cropland burning emissions. Given the combination of uncertainty surrounding the cropland burned area estimates, the yield values, and the coefficient factors, this study does not attempt to include any quantification of the magnitude of successfully transported cropland emission estimates to the Arctic. Instead, the purpose of this study is to quantify the fraction of cropland burning in Russia that potentially contributes to the deposition of BC on the Arctic snow with a particular focus on the spatial and temporal variability of the transport patterns. Here we present a simple transport model based on wind fields and the precipitation estimates of the European Centre for Medium-Range Weather Forecasts' ERA-Interim Reanalysis product (Berrisford et al., 2011). The model ingests the locations of known flaming cropland burning events and transports the “potential” BC emissions of unspecified amount following established wind patterns at varying injection heights. Using the developed transport trajectories, we are able to quantify the potential for contribution of BC generated by cropland burning in Russia observed between 2003 and 2015 to deposition on snow and ice above 60°N taking into account the spatio-temporal dynamics of both fire occurrence and snow cover.
Study Area
This study focuses on the contribution of cropland burning in Russia to the snow in the Eastern Hemisphere of the circumpolar region between 0–180°E and 60–90°N. The Russian croplands are defined by the MODIS land cover classification dataset (MCD12Q1; Friedl et al., 2010) cropland and cropland/natural vegetation mosaic classes (IGBP legend classes 12 and 14, respectively). While cropped areas are found across Russia, including regions above 60°N, the majority of croplands (~70%) are distributed along the southern boundary of the country roughly between ~40 and 55° N (Figure 2). In this study, Arctic snow and ice are defined as any permanent or seasonal snow and ice cover over land above 60°N.
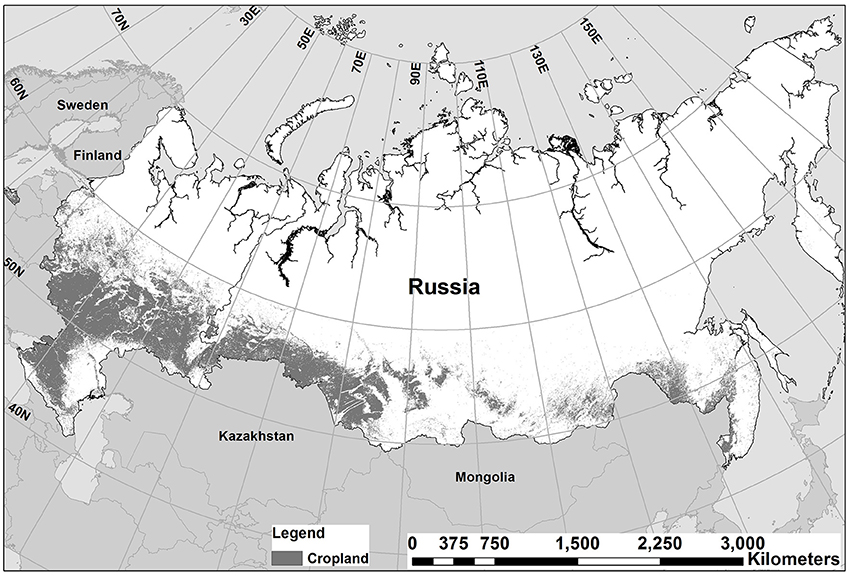
Figure 2. Russian cropland area as defined by the IGBP cropland/ natural vegetation mosaic.
Data and Methods
Our main research objective is to evaluate whether large-scale wind patterns in the low levels of the troposphere coupled with observed precipitation patterns can support the transport and eventual deposition of a hypothetical parcel of BC emissions, which originates from cropland fires, to the snow above 60°N. This approach combines satellite-derived observations of cropped areas (0.5 km grid cell), fire occurrence (~1 km grid cell), and snow cover (0.05° grid cell) and climatological ERA-Interim reanalysis (0.75° grid cell) data between 2003 and 2015. The transport model is driven by ERA-Interim meteorology and operates at a 0.75° resolution between 0–180°E and 30–90°N. Other components are incorporated into the model at their native resolution (fire and cropped areas) or as a fractional representation within the 0.75° grid (snow cover). Sections Cropland Burning Source Locations, Arctic Snow Cover Extent, and Transport Algorithm Development below detail the development of the modeling framework and its components.
Cropland Burning Source Locations
The active fire (MCD14ML; Giglio et al., 2003) collection 6 product was used to identify ongoing burning within the Russian croplands between 2003 and 2015. As discussed in the introduction, current burned area products provide very poor estimates of the magnitude and timing of cropland burning (Hall J. V. et al., 2016). While active fire detections offer no improvement over the burned area products in the amount of area burned, they accurately estimate the timing of burning as the flaming front is detected during the satellite overpass. In this study, the MODIS active fire dataset represents a fraction of burning within the Russian croplands observable by satellites. The MODIS orbital overlap provides the opportunity for much more frequent observations of fire activity on the land surface than the nominal twice daily (from each of the two MODIS instruments) temporal scales. The date and time of fire detections were utilized to create hourly depictions of cropland burning between 30–90°N and 0–180°E within the 0.75° grid. Each 1 km MODIS active fire detection that intersected the 500 m cropland layer was considered a “cropland fire event.” The specific time of each detection was rounded to the nearest full hour. Finally, the number of active fire detections within the 0.75° grid was recorded in hourly layers depicting both binary fire/no fire and number of events attributes. These source regions represent the starting burn locations and times for the transport algorithm.
Arctic Snow Cover Extent
The goal of this assessment is to quantify the potential deposition over snow and ice covered ground in the Arctic (here defined as above 60°N). Therefore, daily Arctic snow layers were developed for the period between January 1, 2003 and December 31, 2015 using the standard daily, MOD/MYD10C1 collection 6 MODIS snow cover product at climate modeling grid (0.05°) resolution (Hall D. et al., 2016). Primarily the Terra-based product (MOD10C1) was used in the construction of the snow layers while the Aqua-based product (MYD10C1), impacted by the non-functional detectors in band 6 (Riggs and Hall, 2015), was used to supplement any missing dates.
The Arctic region remains snow-covered during a large portion of the year with a relatively short snow-free season, except for regions surrounding the pole where permanent ice and snow cover are present. The spectral signature of snow and ice is distinct and allows for strong differentiation from other land surface covers (Dozier, 1989; Satterwhite et al., 2003). However, the daily MODIS snow cover estimates are strongly impacted by gaps in observations: amongst the most substantial is the absence of solar irradiance during the polar nights and the substantial cloud cover in the Arctic regions during the sunlit period (Schiffer and Rossow, 1983). In this analysis, snow cover is considered absent until five consecutive clear (i.e., not impacted by cloud cover) land surface observations within a given grid cell remain snow-free. A 5 day window was chosen based on the observed persistent cloud cover patterns with the need to avoid late spring and early fall snow events which do not represent established seasonal snow cover. Similarly, snow cover is considered present until five consecutive clear land surface observations within a given grid cell show the presence of snow. These two periods are subsequently referred to as “snow cover melt” and “snow cover establishment” with the details of the methodology developed to extract these values described below.
Creation of the snow cover extent required the snow cover percentage (DayCMGSnowCover), cloud cover percentage (DayCMGCloudObscured) and the quality assessment (SnowSpatialQA) layers from the MOD/MYD10C1 datasets. The daily snow cover percentage layer was filtered using the quality assessment layer to retain only values of “best” and “good” quality (QA ≤ 2). All grid cells impacted by polar night conditions were considered snow covered. All grid cells not impacted by the lack of solar irradiance were subsequently classified as:
• Snow (1): filtered snow layer value ≥50% (majority snow cover).
• Cloud (2): filtered snow layer value <50% and cloud percentage ≥50%.
• Water (3): values in any of the 3 original layers that were flagged as ocean, cloud obscured water, inland water, or lake ice.
• Fill (4): QA > 2 or any of the layers that were flagged as fill, no retrieval, or not mapped.
• No Snow/Clear (5): filtered snow layer value < 50% and cloud percentage < 50%.
Snow melt date is recorded within each 0.05° grid cell as the first date of a five consecutive clear (not cloud impacted) period of observations where land surface is reported as snow-free. A grid cell is considered permanently covered by snow if it does not reach the snow melt criteria by October 1 (Day of Year 274 or 275 for leap year) after the sea ice extent in the Arctic reaches its lowest annual extent in mid-September and begins to grow (NSIDC, 2017)3. The snow establishment date must follow the snow melt date and is recorded as the first date of a five consecutive clear period of observations where land surface is reported as snow covered. If the algorithm fails to determine the snow establishment date by Day of Year 360, it is automatically assigned a snow establishment date of 365 (or 366 for leap year). The output contains values for each grid cell that represent either a Day of Year or a reserved value indicating water or permanent snow cover. The values of 0.05° grids are scaled up to 0.75° to match the resolution of the meteorological variables from ERA-Interim Reanalysis product where the median Day of Year value for the date of snow melt and establishment of the 15 × 15 0.05° snow layer grid cells is recorded into the corresponding 0.75° grid cell.
Transport Algorithm Development
Our simplified transport algorithm takes into consideration a variety of potential injection heights, wind speed, wind direction, and precipitation provided within the European Centre for Medium-Range Weather Forecasts' daily, 0.75° resolution ERA-Interim Reanalysis product (Berrisford et al., 2011). Specifically, we ingest U- and V-Wind layers at the following five pressure levels: 1,000 mb (~110 m altitude), 975 mb (~323 m altitude), 950 mb (~540 m altitude), 925 mb (~762 m altitude), and 900 mb (~914 m altitude) to account for the reported variability of cropland burning emission injection heights (Ichoku and Kaufman, 2005; Martin et al., 2010; Soja et al., 2012). Total Precipitation (mm) was evaluated at the surface level only. Daily averages of wind direction (d, units: rad) and speed (s, units: ms−1) were computed using the U- and V-Wind vectors.
The transport algorithm was designed to quantify potential low-level, long distance transport within 96 h. This 96 h cut off reflects the atmospheric lifetime of BC used in a previous study (Larkin et al., 2012) focused on transport of BC from Russia to the Arctic. The algorithm records the transport time (hours) from each cropland burning source grid cell to the first instance of reaching snow-covered ground in the Arctic. Furthermore, the algorithm records the trajectory of the parcel, estimated by connecting the center points of the 0.75° grid cells, beyond the first instance of arriving on snow-covered ground above 60°N. The trajectory is tracked until either 96 h has elapsed or if the parcel encounters precipitation. For all analyses, we assume a total washout of BC from the atmospheric column if precipitation of any amount is encountered. If the precipitation is encountered over snow-covered ground above 60°N, the transport will be terminated; however, the mapped output will indicate a successful event (assumed wet deposition on snow) and the time to that snow-covered grid cell will be recorded in the source cell.
The time of travel is calculated using the daily average, computed from 6 h ERA-Interim data, wind speed (ms−1) and the great circle distance (m) between the center longitude and latitude values of the starting grid cell and the next grid cell. The longitude and latitude values of the next grid cell were determined through the wind direction using the following directional criteria: north (>337.5 to ≤22.5°); north-east (>22.5 to ≤67.5°); east (>67.5 to ≤112.5°); south-east (>112.5 to ≤157.5); south (>157.5 to ≤202.5°); south-west (>202.5 to ≤247.5°); west (>247.5 to ≤292.5°); north-west (>292.5 to ≤337.5°). The time (distance/speed) is then added to the starting UTC time taken from the hourly cropland burning source locations, which continues until the cumulative time has crossed the following day's threshold when meteorological parameters and snow date are extracted from the following date. This process continues until the parcel reaches snow-covered ground beyond 60°N (within the allowed 96 h period). The time at this point would be recorded in the starting source grid cell in the mapped output. If no precipitation was encountered or if the time had not exceeded 96 h, then the trajectory will be continuously tracked until the 96 h threshold is reached. If precipitation was encountered or if the parcel did not reach snow above 60°N within 96 h, then it is assigned a fill value and considered a “failed” transporting event.
This analysis was carried out at the hourly time step between 2003 and 2015 for each of the five pressure levels (1,000, 975, 950, 925, and 900 mb). The final outputs of the transport model include: (1) a binary successful/failed transport event for each cropland burning source grid cell, (2) time (up to 96 h) from each cropland burning source grid cell to the first instance of reaching snow-covered ground in the Arctic; (3) 96 h transport trajectories from the cropland burning source grid cells.
Results
Our results show that a substantial fraction of individual cropland burning events can be deposited on the Arctic snow. As expected, this fraction is the greatest (7.2%-annual average over 13 years) at higher injection heights (900 mb) and diminishes gradually from 7.0% (925 mb), to 6.4% (950 mb), to 5.3% (975 mb) to 2.9% at the lowest injection height (1,000 mb). Our analysis on the seasonal fractions of successful cropland burning events illustrates the importance of spring (March, April, and May) burning contributions to deposition on the Arctic snow. Table 1 summarizes the total cropland active fires and the successful active fire counts per atmospheric pressure level averaged between 2003 and 2015. Annual tables are available in the Supplementary Material (Table S1).
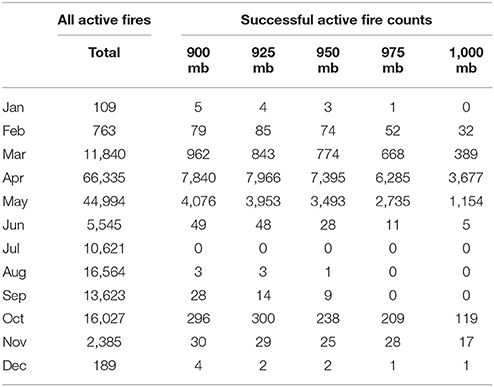
Table 1. Monthly average (2003–2015) successfully transported and total active fire counts within the Russian croplands.
Based on these values, on average between 2003 and 2015, approximately 4–10% of the March, April, and May observed fire occurrences (depending on injection height) are within regions with successful transport to the Arctic. These results represent a unique quantification of the fraction of observed burning within Russian croplands which are potentially able to contribute to the deposition of BC on the Arctic snow. The observed decrease in successful transport events is likely the result of increased interaction with the surface layer at 1,000 mb as compared to 900 mb, causing lower horizontal wind speeds, and therefore increased likelihood of trajectories failing to reach the snow in the Arctic within 96 h. Figure 3 illustrates the change in density of the successful trajectories at varying assumed injection heights.
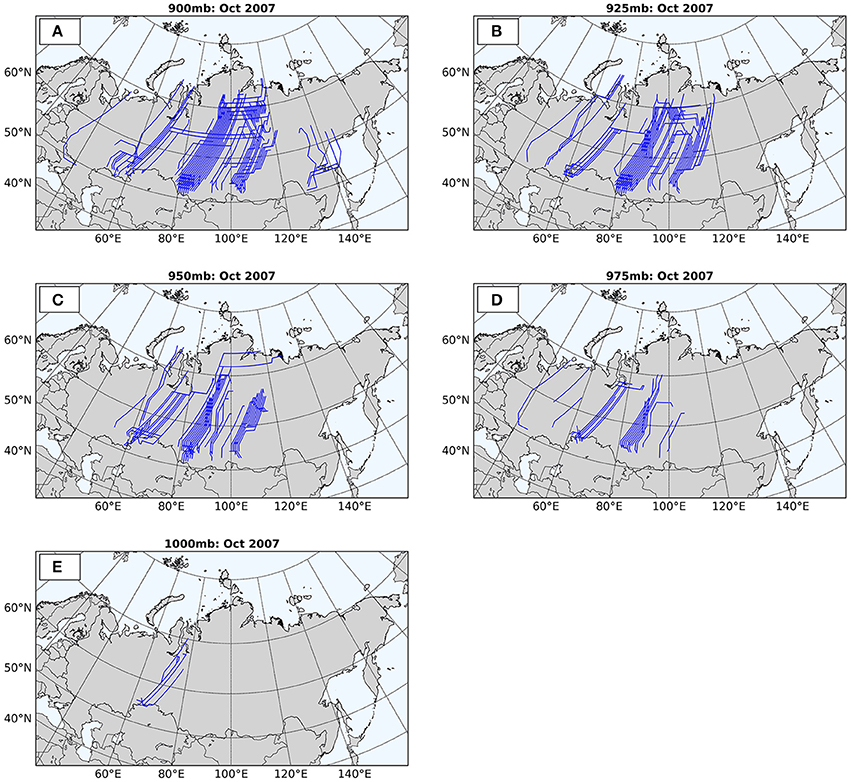
Figure 3. Transport trajectory line maps for successful events for October 2007 at five different pressure levels: 900 mb (A); 925 mb (B); 950 mb (C); 975 mb (D); 1,000 mb (E). For illustration purposes only October 2007 is shown, but the pattern is representative of the generally observed decrease in the number of successful events with shallower injection heights across all months and years.
Seasonal Patterns of Successful Transport Potential
Our analysis reveals a large inter-annual and seasonal variability in the success rate of transport of hypothetical BC emission parcels to the Arctic. The largest overall number of successful trajectories (4,645 at 925 mb) were recorded in 2008 and the least (107 at 1,000 mb) in 2013 with the largest (2,246 at 900 mb) monthly contribution of successful trajectories recorded in April 2010 (Table S2). This variability is driven by the confluence of respective variabilities in atmospheric conditions, fire activity, and snow cover extent (Figure S1). In this part of the analysis we assess generalized monthly patterns of transport potential through trajectory densities at various injection heights over the 13 year time frame (Figure 4 and Figures S2–S5). The general temporal pattern of successful transport events is stable across all injection heights, therefore, in this section we discuss findings for trajectory patterns only at 925 mb. Monthly snow extent maps are also produced to help interpret these successful transport patterns (Figure S1).
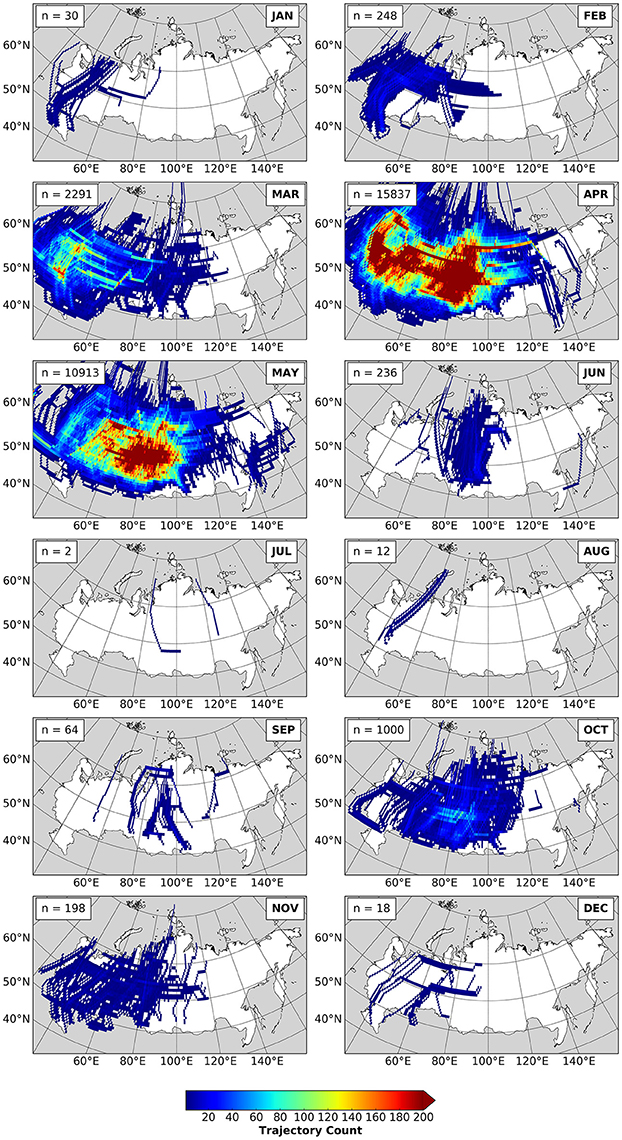
Figure 4. The cumulative number of successful trajectories between 2003 and 2015 monthly at 925 mb. See Figures S2–S5 for accompanying maps for cumulative trajectories at other injection heights examined within this study.
Generally, in December, January and February the few (on average 1, 2, and 19, respectively) successful events predominantly originate in the south-western regions of Russia in the Northern Caucasus (~45°N, 40°E). The few fires that occurred in the winter months are unlikely to represent crop residue burning in preparation for planting; however, they may be associated with other types of burning, including bonfires or pile burning of agricultural waste. March, April and May saw the largest number of successful transport events (on average 198, 1,197, and 839, respectively), often several orders of magnitude higher than other months. The very large number of successful trajectories in the spring result from not only the overall large amount of residue management fires (on average ~12,000, ~66,000, and ~45,000 for March, April, and May, respectively) but also largely from the coincidental maximal extent of snow cover above 60°N. In contrast, while the total monthly cropland burning activity in August (monthly average ~17,000 per year between 2003 and 2015) begins to increase in response to the wheat harvest cycles, snow extent in the Arctic is at its minimum (Figure S1), hence, substantially limiting the potential for cropland burning-resultant BC deposition on snow.
While in general, spring cropland burning appears to have the greatest potential to result in BC deposition on the Arctic snow, there is a considerable difference in the amount and spatial patterns of trajectory densities among March, April and May. In March, the hotspot in the density of overlapping trajectories is typically located along the western edge of Russia. This hotspot migrates east with time and reaches 80°E by May. By June, the number of successful transport trajectories is substantially reduced (on average 18 year−1) with the highest density located around 90°E. July and August on average have very few successful transport events, depending on the pressure level and year (on average <1 successful event per year). The number of successful events gradually increases in September (on average 5 year−1) and has a minor peak in October (on average 77 year−1), which is mostly associated with a rapid establishment of snow cover in the Arctic. The total number of successful trajectories quickly drops in November (on average 15 year−1) driven by the overall decrease in crop residue burning.
Further analysis of the full extent of the transport trajectories within the 96 h window show that BC emissions from cropland burning in Russia can be transported beyond 80°N. This potential for reaching far into the Arctic indicates that cropland burning has an impact not only on snow-covered land but also on sea ice. To determine how far north these successful trajectories can reach, the northern most latitude for each trajectory was recorded and summed over several latitude bands (60–65°N, 65–70°N, 70–75°N, 75–80°N, and 80–90°N) for every month between 2003 and 2015. The starting latitude was also recorded to help identify how far south within Russia a potential cropland burning emission source could be located to potentially deposit BC within each of these latitude bands (Figure 5). In this section we discuss only the results for March, April, and May–months with the larger number of successful transport events as compared with other months.
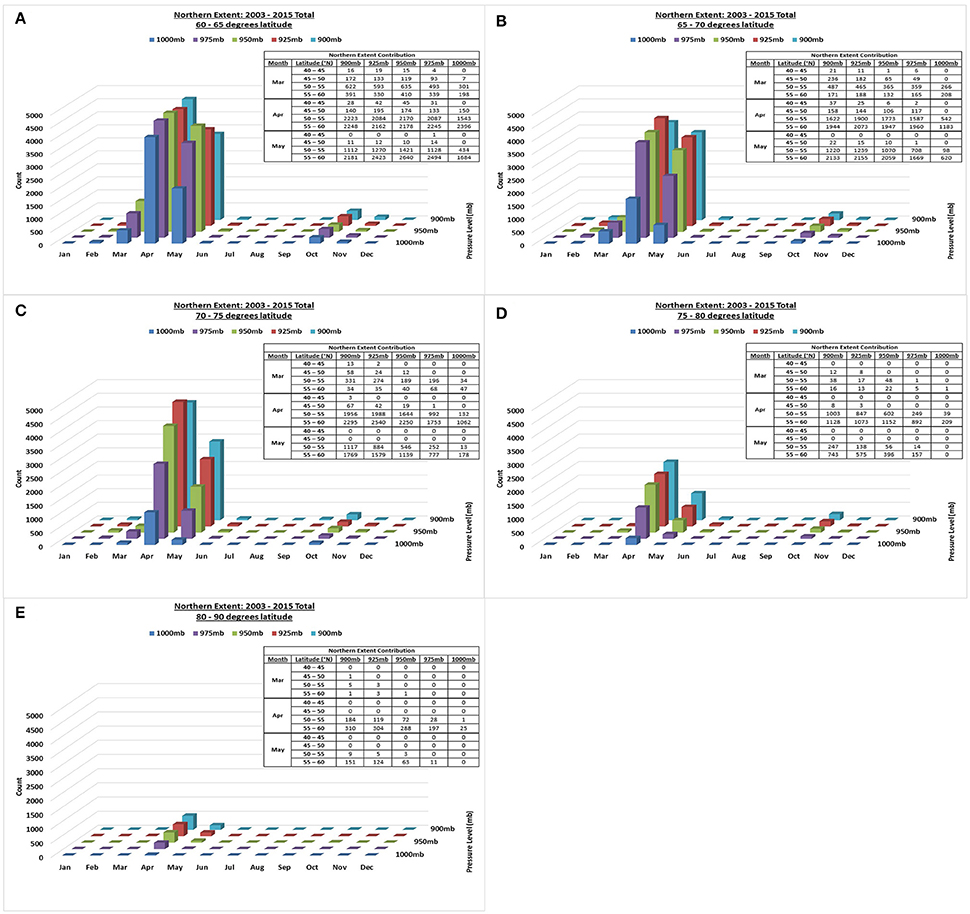
Figure 5. Total number of successful events (monthly) between 2003 and 2015 that reach snow cover between 60–65°N (A), 65–70°N (B), 70–75°N (C), 75–80°N (D), 80–90°N (E) as their northern-most extent per injection height. The inset table represents the contribution from the lower latitude bands (40–45°N, 45–50°N, 50–55°N, 55–60°N) for March, April and May.
The results show that BC emissions from as far south as 45°N (in March at the highest injection height) and 50°N (April and May at almost all injection heights) can potentially be transported as far north as 80–90°N. Deposition of BC this far north has important implications for the permanent sea ice cover in the Arctic. Furthermore, the trajectories indicate that cropland burning BC from as far south as 40–45°N can be transported and deposited on the Arctic snow (in some cases up to 70–75°N) during March, April and May and for nearly all injection heights.
Spatial Patterns of BC Transport to the Arctic Snow
Quantifying the transport time is an important element in identifying the relative importance of the burning source regions to their potential contribution to the BC deposition on snow in the Arctic. The exact impact of deposited BC on Arctic snow relies on the microphysical properties of the BC particle and the various chemical and turbulent processes within the atmosphere; however, as a general rule, the longer a molecule remains in the atmosphere the more mixing and alterations it will undergo before it is ultimately removed via wet or dry deposition.
We analyzed the average transport time (hours), the success (%) of each starting location, and the number of active fires within each grid cell of origin for a successful transport event to quantify the fraction of the potential contributions of BC deposition and to characterize the cropland burning source regions. While we discuss the findings of this analysis for all months (Figures S6–S14), we graphically show only results from March, April, and May (2003–2015) at 900 mb and 1,000 mb as the majority of the successful fires occur during these months (Figures 6–8). The 900 and 1,000 mb results are shown to illustrate the two extremes of the injection height range used in this study.
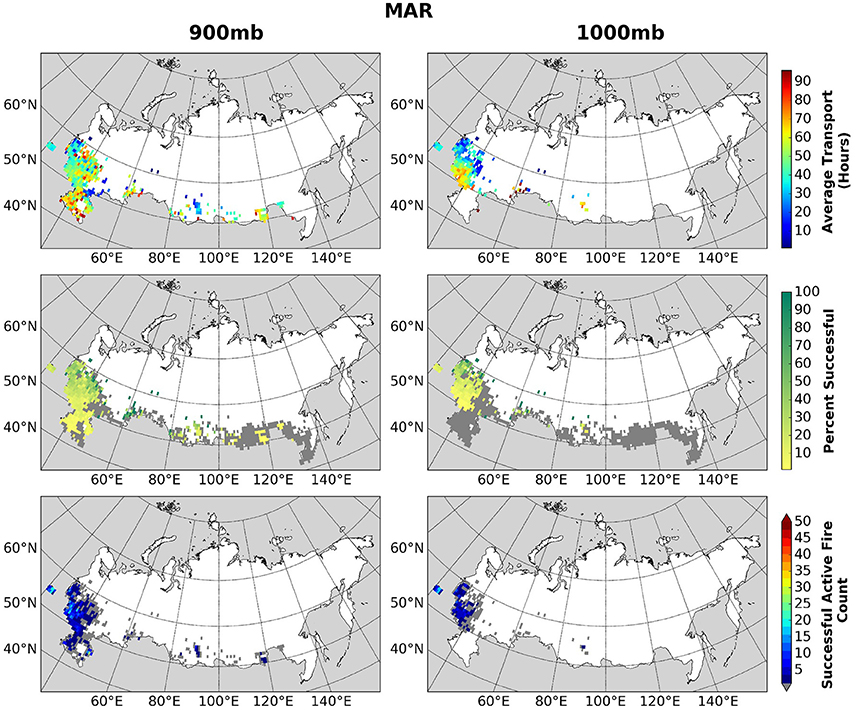
Figure 6. 900 and 1,000 mb March 2003–2015 average transport (hours), percent successful and active fires potentially contributing to BC deposition on snow in the Arctic. The dark gray color in the percent successful maps (middle) represents the starting fire locations which were unsuccessful at reaching the snow in the Arctic within 96 h.
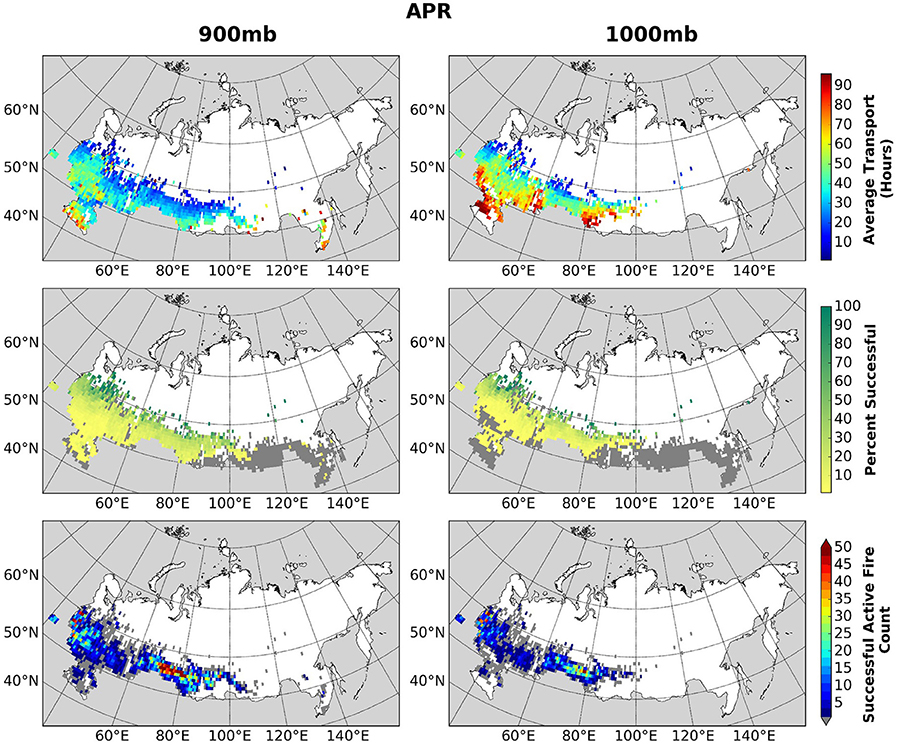
Figure 7. 900 and 1,000 mb April 2003–2015 average transport (hours), percent successful and active fires potentially contributing to BC deposition on snow in the Arctic. The dark gray color in the percent successful maps (middle) represents the starting fire locations which were unsuccessful at reaching the snow in the Arctic within 96 h.
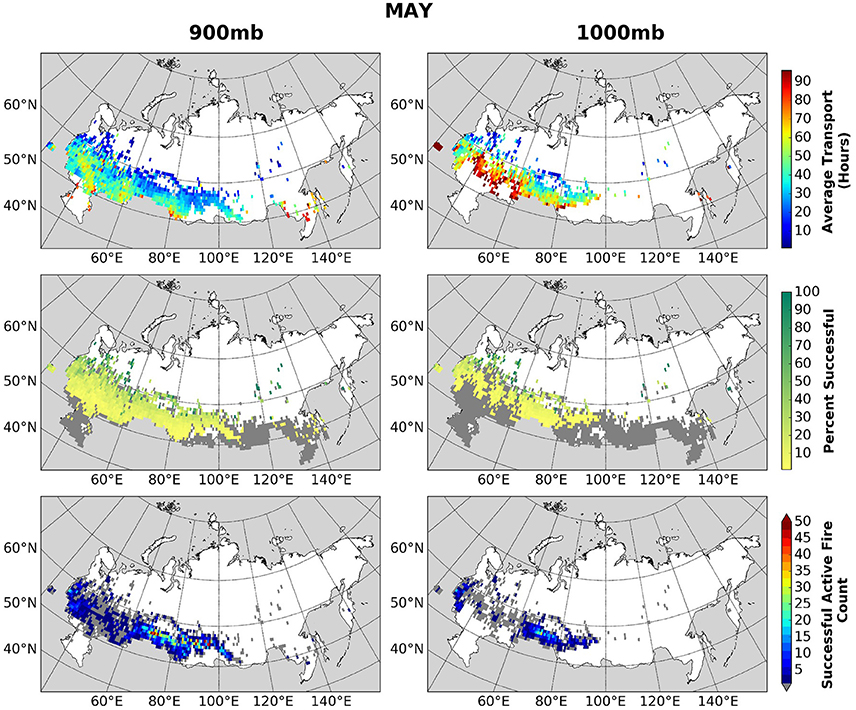
Figure 8. 900 and 1,000 mb May 2003–2015 average transport (hours), percent successful and active fires potentially contributing to BC deposition on snow in the Arctic. The dark gray color in the percent successful maps (middle) represents the starting fire locations which were unsuccessful at reaching the snow in the Arctic within 96 h.
On average, fire occurrence in January and February is very low with only 1 active fire per grid cell per year on average between 2003 and 2015 predominantly located in the south-western region of European Russia (45°N, 50°E). The few locations with successful transport were able to reach the snow-covered Arctic on average within approximately 50 h (January) and 40 h (February), depending on the injection height. By March, the total number of cropland fires increased to approximately 5–15 active fires per successful grid cell, while also increasing in spatial extent (Figure 6). As expected the success rate of potential crop residue emission transport decreases while transport time increases with lower injection heights; however, an interesting anomalous pattern occurs in March in the north-west region (centered on 55°N, 45°E) of the transport map. Instead of the transport time increasing with lower injection heights, the transport time actually decreases from approximately 40–50 h to approximately 10–30 h on average to the Arctic. Analysis of the transport pathways found this anomalous pattern resulted from longer trajectories at higher injection heights seemingly associated with a more circular pattern as compared to more straight northerly trajectories at lower injection heights.
In April, the successfully transported fire load reached a peak (100–130 active fires per grid cell–Figure 7) between 70 and 80°E. Although this area has low success rates, the transport time to the Arctic remains relatively low in comparison to the surrounding regions even at low injection heights. A slightly smaller peak in fire occurrence is located in the north-west corner (approximately 55°N, 35°E) with a coincidental increase in success rate. Transport times for both clusters vary between <10 and 50 h, therefore the emissions from these higher fire loads will likely encounter less mixing and fall out than emissions with longer atmospheric residence times. Furthermore, at higher injection heights, successful transport of potential emissions can originate at least as far south as approximately 40°N, which is the limit of the Russian croplands.
In May, the success rate along the southern edge of the Russian croplands, particularly at lower injection heights, drops significantly except for the region located between 70 and 80°E (Figure 8). As with April, this same area has slightly lower transport times to the Arctic as compared to the surrounding regions. Analysis of the transport pathways does not explain the decrease in transport time in that region. A possible explanation lies in the higher number of successful burning locations (see bottom map in Figures 7, 8) in that area as compared to other areas in the Russian croplands. These maps show the average transport times which are more likely to be influenced by outliers within the regions with fewer successful fires as compared to the region located between 70° and 80°E.
The highest density of cropland fires occurs in the spring in the southern portion of the cropland in the Far East (approximately between 40–55°N and 110–130°E); however, there are very few fires with successfully transported emissions within this region. Specifically, the success rate of fires east of 95°E are severely reduced with lower injection heights in comparison to the cropland fires within European Russia at similar latitudes. Analysis of the trajectories originating in the Far East croplands reveal short pathways often flowing toward the east over the Sea of Okhotsk (away from the snow extent), whereas the European Russian trajectories are much longer and tend to flow north. These differences are likely due to the varying atmospheric circulation patterns observed across Russia.
Discussion
Sources of Uncertainty
Quantifying the fraction of BC emitted from cropland burning in Russia that is deposited on snow in the Arctic is a difficult task due to the inherent challenges associated with the underlying input datasets. As previously mentioned, existing satellite-based estimates of area burned in croplands are very poor (Hall J. V. et al., 2016) which results in highly inaccurate cropland burning emissions inventories. This study assumes emissions of a hypothetical parcel of BC of unknown amount from cropland burning using the MODIS active fire detections. The orbital overlap that is achieved at the latitude of Russian croplands allows for more frequent observations of fire activity than the nominal twice daily from each of the two MODIS-carrying satellites. While it has not been established quantitatively (because there are currently no accurate estimates of cropland area burned), we assume active fire observations to be generally representative of the spatio-temporal patterns of biomass burning within Russian croplands.
The spatial scale of the meteorological data used in this transport model determines the spatial granularity of resultant trajectories which were restricted to tracking the centers of the individual grid cells rather than the actual locations of the active fires. While very coarse compared to the 1 km MODIS active fire pixels, ERA-Interim meteorological data (at 0.75°) records parameters at a finer scale than the more commonly used, in previous studies, 2.5° resolution NCEP/NCAR (National Centers for Environmental Prediction–National Center for Atmospheric Research Global Reanalysis; Kalnay et al., 1996) dataset. For example, the coarser NCEP/NCAR meteorological data is frequently used to drive HYSPLIT trajectory models (e.g., Treffeisen et al., 2007; Huang et al., 2010; Larkin et al., 2012). Additionally, 6 h ERA-Interim wind and precipitation data fields were aggregated to daily values. While ideally, hourly wind and precipitation data would more accurately represent the actual meteorological conditions throughout the transport pathway, it is difficult to quantify how much actual precision is lost in using daily vs. 6 hourly data within a 0.75° grid cell. The general weather patterns across Russia's mid-latitudes are primarily influenced by cyclonic and anticyclonic activity which most frequently last more than 1 day (Lebedeva et al., 2015). It is likely that the aggregation of meteorological parameters to a daily temporal scale has impacted trajectories for fire events that occurred during the stages when the weather patterns were shifting between cyclones and anticyclones. However, it is expected that most of the burning occurs during anticyclonic weather patterns when the meteorological conditions produce drier fuels (a particularly limiting parameter for fire spread during post snow-melt conditions in the spring) that can support fire spread more readily. Furthermore, this simplified transport model assumes the only vertical transport occurs at the point of BC injection from cropland burning and all subsequent transport occurs via horizontal wind vectors. Due to the vertical atmospheric stratification and dominant horizontal advection motions, this assumption is not a severe constraint on the model; however, future work focusing on the variability within the planetary boundary layer could be undertaken to improve the understanding of how BC is transported from cropland burning in Russia to the Arctic snow.
An additional source of uncertainty is related to the satellite-based estimates of snow cover extent used in this study. The high northern latitudes are plagued with persistent cloud cover during the sunlit period and an absence of solar irradiance during the polar nights. Therefore, several assumptions had to be defined in order to create snow melt and snow establishment layers. The inability to observe surface conditions due to cloud presence introduces a considerable amount of uncertainty in identifying the exact date of snow melt and snow establishment. Quantifying the difference between the 0.75° aggregated snow establishment and snow melt dates (calculated as the median of the 0.05° grid cells–see section Arctic Snow Cover Extent) and the dates of the individual 0.05° grid cells found that on average (2003–2015) the difference was <1 day for both the snow melt and snow establishment periods with a standard deviation of 6 and 7 days, respectively, with the majority of the variability stemming from grid cells below 65°N.
Finally, transport trajectories and the resultant outputs generated by this methodology are consistent (although not directly comparable) with those produced within previously published studies. Several previous studies have indicated that biomass burning sources from northern mid-latitudes significantly impact the Arctic region (e.g., Warneke et al., 2010; Quinn et al., 2011; Larkin et al., 2012; Sharma et al., 2013; Cheng, 2014; Liu et al., 2015). Comparison of this study's results with previous studies (focused on air pollution transport from northern mid-latitudes to the Arctic) has demonstrated that the simple form of the transport model, developed within this study, has represented the key meteorological drivers appropriately and that the interpretation of the results is meaningful.
Significance of BC Deposition from Cropland Burning on the Arctic Snow
A key attribute of this study is focused on BC deposition on the snow in the Arctic. This nuance has important implications for the timing of burning. Although forest fires produce substantially more emissions than cropland fires due to higher biomass loading (e.g., Hao et al., 2016), the timing of the burning largely determines the relative importance of these source emissions to BC deposition on Arctic snow. Forest fires typically occur in the summer, when high temperatures, low humidity, and little precipitation drive the increase in forest flammability. On the other hand, crop residue burning in Russia usually follows the crop planting and harvest cycles. Analysis of the active fire dataset between 2003 and 2015 found two peaks in cropland fires – one in April/May and another smaller peak in August/September (Hall J. V. et al., 2016) consistent with winter and spring planting and harvesting dates in Russia (USDA FAS, 2016). Despite the peak in summer cropland fires, the contribution to BC deposition on the Arctic snow is negligible. Based on this analysis, it seems the coincidental timing of burning and snow cover extent is a linking factor in determining the importance of crop residue-related BC emissions and their impact on Arctic albedo.
This study confirmed the importance of springtime cropland burning in relation to the deposition on the Arctic snow. Based on the analysis of the transport time and the success percentage, it is clear that despite the low injection heights, potential BC emissions from cropland burning can be transported and deposited onto Arctic snow in the spring from at least 40°N. This study also identified that the cropland regions within European Russia contained the highest percentage of successful transport to the Arctic snow. Although this study makes no attempt to quantify emissions, these regions contain the highest wheat yields within Russia (yield data compiled by USDA Foreign Agricultural Service, Mark Lindeman pers.comm.), therefore they are likely to also contain the highest volumes of crop residues and larger BC emissions. A recent interest in expanding arable land through reclaiming Post-Soviet abandoned cropland (e.g., Schierhorn et al., 2014; Meyfroidt et al., 2016) and in particular, a large concentration of cropland in European Russia is located along the fertile Chernozem soil belt which stretches from the southern tip of Russia (43°N, 44°E) toward Moscow (55°N, 37°E)-a region with higher wheat yields, raises concerns for associated increase in BC deposition on Arctic snow. Although an expansion of cropped area does not necessarily lead to an increase in fire activity, it does give rise to an increased opportunity for burning crop residue in the regions of higher transport potential. Moreover, if this increase in cropland area expands further north toward 50°N and leads to additional fire activity then based on the results of the northern extent analysis, there could also be an increase in BC deposition from cropland burning emissions on the permanent sea ice.
Conclusion
Crop residue burning has been reported to constitute a considerable source of BC deposited in the Arctic. However, previous studies relied on highly inaccurate estimates in terms of the amount and timing of cropland burning emissions resulting from uncertainties in estimates of burned area, biomass loads, and emission factors. This study introduces a simple approach to assess the potential for BC deposition in the Arctic based on reanalysis data of observed meteorological conditions and confirmed cropland burning. In addition, we specifically assess the impact of BC deposition on snow when the impact on surface albedo from deposition is the highest with considerable consequences for snow melt and establishment. Although our approach does not allow for quantifying the amount of BC deposited on the snow surface, it provides the baseline estimate of the spatio-temporal patterns of BC transport resulting from confirmed cropland burning and the potential for BC deposition on the snow.
It is clear based on the results of this study that cropland burning has the potential to significantly impact the Arctic via BC deposition. We estimate that approximately 10% of the observed cropland burning in March, April and May (7% annual) has the potential to contribute to the BC deposition on the Arctic snow. Despite the low injection heights, this study has shown that potential BC emissions from at least 40°N can be deposited on the Arctic snow. Furthermore, during the spring, which is the most vulnerable period for sea ice melt, potential cropland burning emissions can reach areas beyond 80°N. Analysis of the successful transport pathways identified areas containing concentrated trajectories particularly over European and Central Russia. These clusters of trajectories may be influenced by persistent wind patterns over these areas. The magnitude of this impact, however, cannot be quantified well due to current inaccuracies surrounding cropland emission inventory calculations.
Complex chemical-transport model outputs should be applied with caution, particularly when considering impacts from cropland burning. Additional improvements are needed to accurately represent the spatial and temporal cropland emission fluxes. Future work should be focused on improving the deficiencies associated with current cropland burning emission inventories. Improvements to all components of emission inventories, including area burned, the precise timing of burning (at least to the date), biomass loading, and emission factors, are absolutely essential to deriving meaningful estimates of the amount of BC deposited on the snow. Future studies should also investigate the causes behind these concentrated pollution pathways to the Arctic, revealed in this study, with a focus on large-scale atmospheric patterns that can act to enhance atmospheric transport of pollutants from lower mid-latitudes.
Author Contributions
JH was the primary developer of the low-level transport algorithm which was a key component of her doctoral research. JH was responsible for data collection, analysis, and interpretation and was the primary author of the manuscript. TL was the primary author's doctoral advisor and participated in advisory input in both the research project and the manuscript preparation. TL also gave critical revision of the manuscript.
Funding
This research did not receive any specific grant from funding agencies in the public, commercial, or not-for-profit sectors.
Conflict of Interest Statement
The authors declare that the research was conducted in the absence of any commercial or financial relationships that could be construed as a potential conflict of interest.
Acknowledgments
The authors would like to thank Dr. Louis Giglio (University of Maryland), Dr. Christopher Justice (University of Maryland), and Dr. Gregory McCarty (USDA ARS) for their useful technical discussions.
Supplementary Material
The Supplementary Material for this article can be found online at: https://www.frontiersin.org/articles/10.3389/feart.2017.00109/full#supplementary-material
Footnotes
1. ^https://nsidc.org/cryosphere/arctic-meteorology/index.html (Accessed Mar 11, 2017).
2. ^http://faostat3.fao.org/browse/T/TP/E (Accessed Aug 22, 2015).
3. ^http://nsidc.org/arcticseaicenews/sea-ice-tools/ (Accessed July 9, 2017).
References
Akagi, S., Yokelson, R. J., Wiedinmyer, C., Alvarado, M., Reid, J., Karl, T., et al. (2011). Emission factors for open and domestic biomass burning for use in atmospheric models. Atmos. Chem. Phys. 11, 4039–4072. doi: 10.5194/acp-11-4039-2011
AMAP (2015). AMAP Assessment 2015: Black Carbon and Ozone as Arctic Climate Forcers. Oslo: Arctic Monitoring and Assessment Programme (AMAP).
Andreae, M. O., and Merlet, P. (2001). Emission of trace gases and aerosols from biomass burning. Global Biogeochem. Cycles 15, 955–966. doi: 10.1029/2000GB001382
Arnold, S., Law, K., Thomas, J., Starckweather, S., von Salzen, K., Stohl, A., et al. (2016). Arctic air Pollution. Elementa: Science of the Anthropocene.
Berrisford, P., Dee, D., Poli, P., Brugge, R., Fielding, K., Fuentes, M., et al. (2011). The ERA-Interim Archive Version 2.0. ERA Report Series 1, Shinfield Park; Reading: ECMWF. 13177.
Bond, T. C., Doherty, S. J., Fahey, D. W., Forster, P. M., Berntsen, T., DeAngelo, B. J., et al. (2013). Bounding the role of black carbon in the climate system: a scientific assessment. J. Geophys. Res. Atmos. 118, 5380–5552. doi: 10.1002/jgrd.50171
Cape, J. N., Coyle, M., and Dumitrean, P. (2012). The atmospheric lifetime of black carbon. Atmos. Environ. 59, 256–263. doi: 10.1016/j.atmosenv.2012.05.030
Chapin, F. S., Sturm, M., Serreze, M. C., McFadden, J. P., Key, J. R., Lloyd, A. H., et al. (2005). Role of land-surface changes in Arctic summer warming. Science 310, 657–660. doi: 10.1126/science.1117368
Cheng, M.-D. (2014). Geolocating Russian sources for Arctic black carbon. Atmos. Environ. 92, 398–410. doi: 10.1016/j.atmosenv.2014.04.031
Doherty, S. J., Steele, M., Rigor, I., and Warren, S. G. (2015). Interannual variations of light-absorbing particles in snow on Arctic sea ice. J. Geophys. Res. Atmos. 120, 11,391–11,400. doi: 10.1002/2015JD024018
Dou, T. F., and Xiao, C. D. (2016). An overview of black carbon deposition and its radiative forcing over the Arctic. Adv. Clim. Change Res. 7, 115–122. doi: 10.1016/j.accre.2016.10.003
Dozier, J. (1989). Spectral signature of alpine snow cover from the Landsat Thematic Mapper. Remote Sens. Environ. 28, 9–22. doi: 10.1016/0034-4257(89)90101-6
EPA (2016). Methane and Black Carbon Impacts on the Arctic: Communicating the Science. US Environmental Protection Agency. Available online at: https://19january2017snapshot.epa.gov/sites/production/files/2016-09/documents/arctic-methane-blackcarbon_communicating-the-science.pdf
Evangeliou, N., Balkanski, Y., Hao, W., Petkov, A., Silverstein, R. P., Corley, R., et al. (2016). Wildfires in northern Eurasia affect the budget of black carbon in the Arctic–a 12-year retrospective synopsis (2002–2013). Atmos. Chem. Phys. 16, 7587–7604. doi: 10.5194/acp-16-7587-2016
Friedl, M. A., Sulla-Menashe, D., Tan, B., Schneider, A., Ramankutty, N., Sibley, A., et al. (2010). MODIS Collection 5 global land cover: algorithm refinements and characterization of new datasets. Remote Sens. Environ. 114, 168–182. doi: 10.1016/j.rse.2009.08.016
Giglio, L., Descloitres, J., Justice, C. O., and Kaufman, Y. J. (2003). An enhanced contextual fire detection algorithm for MODIS. Remote Sens. Environ. 87, 273–282. doi: 10.1016/S0034-4257(03)00184-6
Giglio, L., Loboda, T., Roy, D. P., Quayle, B., and Justice, C. O. (2009). An active-fire based burned area mapping algorithm for the MODIS sensor. Remote Sens. Environ. 113, 408–420. doi: 10.1016/j.rse.2008.10.006
Giglio, L., Randerson, J. T., and van der Werf, G. R. (2013). Analysis of daily, monthly, and annual burned area using the fourth-generation global fire emissions database (GFED4). J. Geophys. Res. Biogeosci. 118, 317–328. doi: 10.1002/jgrg.20042
Groisman, P. Y., Sherstyukov, B. G., Razuvaev, V. N., Knight, R. W., Enloe, J. G., Stroumentova, N. S., et al. (2007). Potential forest fire danger over Northern Eurasia: changes during the 20th century. Glob. Planet. Change 56, 371–386. doi: 10.1016/j.gloplacha.2006.07.029
Hall, J. V., Loboda, T. V., Giglio, L., and McCarty, G. W. (2016). A MODIS-based burned area assessment for Russian croplands: mapping requirements and challenges. Remote Sens. Environ. 184, 506–521. doi: 10.1016/j.rse.2016.07.022
Hall, D., Salomonson, V., and Riggs, G. (2016). MODIS/Terra Snow Cover Daily L3 Global 0.05 Deg CMG, Version 6. Boulder, CO: National Snow and Ice Data Center.
Hao, W. M., Petkov, A., Nordgren, B. L., Corley, R. E., Silverstein, R. P., Urbanski, S. P., et al. (2016). Daily black carbon emissions from fires in northern Eurasia for 2002-2015. Geosci. Model Dev. 9:4461. doi: 10.5194/gmd-9-4461-2016
Hirdman, D., Sodemann, H., Eckhardt, S., Burkhart, J. F., Jefferson, A., Mefford, T., et al. (2010). Source identification of short-lived air pollutants in the Arctic using statistical analysis of measurement data and particle dispersion model output. Atmos. Chem. Phys. 10, 669–693. doi: 10.5194/acp-10-669-2010
Huang, L., Gong, S., Sharma, S., Lavoué, D., and Jia, C. (2010). A trajectory analysis of atmospheric transport of black carbon aerosols to Canadian high Arctic in winter and spring (1990–2005). Atmos. Chem. Phys. 10, 5065–5073. doi: 10.5194/acp-10-5065-2010
Ichoku, C., and Kaufman, Y. J. (2005). A method to derive smoke emission rates from MODIS fire radiative energy measurements. IEEE Trans. Geosci. Remote Sens. 43, 2636–2649. doi: 10.1109/TGRS.2005.857328
Jacobson, M. Z. (2001). Strong radiative heating due to the mixing state of black carbon in atmospheric aerosols. Nature 409, 695–697. doi: 10.1038/35055518
Kalnay, E., Kanamitsu, M., Kistler, R., Collins, W., Deaven, D., Gandin, L., et al. (1996). The NCEP/NCAR 40-year reanalysis project. Bull. Am. Meteorol. Soc. 77, 437–471. doi: 10.1175/1520-0477(1996)077<0437:TNYRP>2.0.CO;2
Klonecki, A., Hess, P., Emmons, L., Smith, L., Orlando, J., and Blake, D. (2003). Seasonal changes in the transport of pollutants into the Arctic troposphere-model study. J. Geophys. Res. Atmos. 108:8367. doi: 10.1029/2002JD002199
Koch, D., and Hansen, J. (2005). Distant origins of Arctic black carbon: a Goddard Institute for Space Studies ModelE experiment. J. Geophys. Res. Atmos. 110:D04204. doi: 10.1029/2004JD005296
Larkin, N. K., DeWinter, J. L., Strand, T. M., Brown, S. G., Brown, S. M., Raffuse, S. M., et al. (2012). Identification of Necessary Conditions for Arctic Transport of Smoke from United States Fires. JFSP Research Project Reports. Paper 93.
Law, K. S., and Stohl, A. (2007). Arctic air pollution: origins and impacts. Science 315, 1537–1540. doi: 10.1126/science.1137695
Lebedeva, M. G., Krymskaya, O. V., Lupo, A. R., Chendev, Y. G., Petin, A. N., and Solovyov, A. B. (2015). Trends in summer season climate for Eastern Europe and Southern Russia in the Early 21st Century. Adv. Meteorol. 2016:5035086. doi: 10.1155/2016/5035086
Liu, D., Quennehen, B., Darbyshire, E., Allan, J. D., Williams, P. I., Taylor, J. W., et al. (2015). The importance of Asia as a source of black carbon to the European Arctic during springtime 2013. Atmos. Chem. Phys. 15, 11537–11555. doi: 10.5194/acp-15-11537-2015
Martin, M. V., Logan, J. A., Kahn, R. A., Leung, F.-Y., Nelson, D. L., and Diner, D. J. (2010). Smoke injection heights from fires in North America: analysis of 5 years of satellite observations. Atmos. Chem. Phys. 10, 1491–1510. doi: 10.5194/acp-10-1491-2010
McCarty, J. L., Ellicott, E. A., Romanenkov, V., Rukhovitch, D., and Koroleva, P. (2012). Multi-year black carbon emissions from cropland burning in the Russian Federation. Atmos. Environ. 63, 223–238. doi: 10.1016/j.atmosenv.2012.08.053
Meyfroidt, P., Schierhorn, F., Prishchepov, A. V., Müller, D., and Kuemmerle, T. (2016). Drivers, constraints and trade-offs associated with recultivating abandoned cropland in Russia, Ukraine and Kazakhstan. Glob. Environ. Change 37, 1–15. doi: 10.1016/j.gloenvcha.2016.01.003
Monks, S., Arnold, S., Emmons, L., Law, K. S., Turquety, S., Duncan, B., et al. (2015). Multi-model study of chemical and physical controls on transport of anthropogenic and biomass burning pollution to the Arctic. Atmos. Chem. Phys. 15, 3575–3603. doi: 10.5194/acp-15-3575-2015
NOAA (2017). Arctic Report Card. Available online at: http://arctic.noaa.gov/Report-Card (Accessed Mar 12, 2017).
Qi, L., Li, Q., Li, Y., and He, C. (2017). Factors controlling black carbon distribution in the Arctic. Atmos. Chem. Phys. 17, 1037–1059. doi: 10.5194/acp-17-1037-2017
Quinn, P. K., Stohl, A., Arneth, A., Berntsen, T., Burkhart, J. F., Christensen, J., et al. (2011). The Impact of Black Carbon on Arctic Climate. AMAP Technical Report No. 4. Arctic Monitoring and Assessment Programme (AMAP), (Oslo).
Ramanathan, V., and Carmichael, G. (2008). Global and regional climate changes due to black carbon. Nat. Geosci. 1, 221 – 227. doi: 10.1038/ngeo156
Randerson, J. T., Chen, Y., van derWerf, G. R., Rogers, B. M., and Morton, D. C. (2012). Global burned area and biomass burning emissions from small fires. J. Geophys. Res. 117, G04012, doi: 10.1029/2012JG002128
Riggs, G. A., and Hall, D. K. (2015). MODIS Snow Products Collection 6 User Guide. Available online at: https://nsidc.org/sites/nsidc.org/files/files/MODIS-snow-user-guide-C6.pdf
Roy, D. P., Boschetti, L., Justice, C. O., and Ju, J. (2008). The collection 5 MODIS burned area product-Global evaluation by comparison with the MODIS active fire product. Remote Sens. Environ. 112, 3690–3707. doi: 10.1016/j.rse.2008.05.013
Satterwhite, M. B., Mitchell, H., Hemmer, T., and Leckie, J. D. (2003). “Field spectral signatures of snow, ice, and water,” in Proceedings of SPIE, the International Society for Optical Engineering (Orlando, FL).
Schierhorn, F., Müller, D., Prishchepov, A. V., Faramarzi, M., and Balmann, A. (2014). The potential of Russia to increase its wheat production through cropland expansion and intensification. Glob. Food Secur. 3, 133–141. doi: 10.1016/j.gfs.2014.10.007
Schiffer, R., and Rossow, W. B. (1983). The International Satellite Cloud Climatology Project (ISCCP)-the first project of the World Climate Research Programme. Am. Meteorol. Soc. Bull. 64, 779–784.
Seiler, W., and Crutzen, P. J. (1980). Estimates of gross and net fluxes of carbon between the biosphere and the atmosphere from biomass burning. Clim. Change 2, 207–247. doi: 10.1007/BF00137988
Sharma, S., Ishizawa, M., Chan, D., Lavoué, D., Andrews, E., Eleftheriadis, K., et al. (2013). 16-year simulation of Arctic black carbon: transport, source contribution, and sensitivity analysis on deposition. J. Geophys. Res. Atmos. 118, 943–964. doi: 10.1029/2012JD017774
Shindell, D. T., Chin, M., Dentener, F., Doherty, R. M., Faluvegi, G., Fiore, A. M., et al. (2008). A multi-model assessment of pollution transport to the Arctic. Atmos. Chem. Phys. 8, 5353–5372. doi: 10.5194/acp-8-5353-2008
Soja, A. J., Fairlie, T. D., Westberg, M. D. J., and Pouliot, G. (2012). Biomass burning plume injection height using CALIOP, MODIS and the NASA Langley Trajectory Model. Available online at: https://www3.epa.gov/ttn/chief/conference/ei20/session7/asoja.pdf
Stein, A., Draxler, R., Rolph, G., Stunder, B., Cohen, M., and Ngan, F. (2015). NOAA's HYSPLIT atmospheric transport and dispersion modeling system. Bull. Am. Meteorol. Soc. 96, 2059–2077. doi: 10.1175/BAMS-D-14-00110.1
Stohl, A., Andrews, E., Burkhart, J. F., Forster, C., Herber, A., Hoch, S. W., et al. (2006). Pan-Arctic enhancements of light absorbing aerosol concentrations due to North American boreal forest fires during summer 2004. J. Geophys. Res. Atmos. 111:D22214. doi: 10.1029/2006JD007216
Stohl, A., Berg, T., Burkhart, J. F., Fjaeraa, A. M., Forster, C., Herber, A., et al. (2007). Arctic smoke - record high air pollution levels in the European Arctic due to agricultural fires in Eastern Europe in spring 2006. Atmos. Chem. Phys. 7, 511–534. doi: 10.5194/acp-7-511-2007
Treffeisen, R., Tunved, P., Ström, J., Herber, A., Bareiss, J., Helbig, A., et al. (2007). Arctic smoke–aerosol characteristics during a record smoke event in the European Arctic and its radiative impact. Atmos. Chem. Phys. 7, 3035–3053. doi: 10.5194/acp-7-3035-2007
USDA FAS (2016). Foreign Agricultural Service. Russian Federation Grain and Feed Annual. Gain Report number RS1617. Available online at: https://gain.fas.usda.gov/Recent%20GAIN%20Publications/Grain%20and%20Feed%20AnnualMoscowRussian%20Federation4-18-2016.pdf (Accessed Mar 11, 2017).
Warneke, C., Froyd, K. D., Brioude, J., Bahreini, R., Brock, C. A., Cozic, J., et al. (2010). An important contribution to springtime Arctic aerosol from biomass burning in Russia. Geophys. Res. Lett. 37:L01801. doi: 10.1029/2009GL041816
Wexler, H. (1953). “Radiation balance of the Earth as a factor in climatic change,” in Climatic Change, ed H. Shapley (Cambridge, MA: Harvard University Press), 73–105.
Wiedinmyer, C., Akagi, S., Yokelson, R. J., Emmons, L., Al-Saadi, J., Orlando, J., et al. (2011). The Fire INventory from NCAR (FINN): a high resolution global model to estimate the emissions from open burning. Geosci. Model Dev. 4:625. doi: 10.5194/gmd-4-625-2011
Keywords: low-level atmospheric transport, black carbon, cropland burning, Russia, Moderate Resolution Imaging Spectroradiometer (MODIS)
Citation: Hall JV and Loboda TV (2017) Quantifying the Potential for Low-Level Transport of Black Carbon Emissions from Cropland Burning in Russia to the Snow-Covered Arctic. Front. Earth Sci. 5:109. doi: 10.3389/feart.2017.00109
Received: 20 September 2017; Accepted: 08 December 2017;
Published: 22 December 2017.
Edited by:
Pavla Dagsson-Waldhauserova, University of Iceland, IcelandReviewed by:
Ernesto Dos Santos Caetano Neto, Universidad Nacional Autónoma de México, MexicoBijoy Vengasseril Thampi, Science Systems and Applications, Inc., United States
Aki Virkkula, Finnish Meteorological Institute, Finland
Copyright © 2017 Hall and Loboda. This is an open-access article distributed under the terms of the Creative Commons Attribution License (CC BY). The use, distribution or reproduction in other forums is permitted, provided the original author(s) or licensor are credited and that the original publication in this journal is cited, in accordance with accepted academic practice. No use, distribution or reproduction is permitted which does not comply with these terms.
*Correspondence: Joanne V. Hall, jhall1@umd.edu