 Daisuke Motooka1†
 Kosuke Fujimoto2,3†
 Reiko Tanaka4Takashi Yaguchi4Kazuyoshi Gotoh1,5Yuichi Maeda2,3Yoki Furuta2
 Takashi Kurakawa2Naohisa Goto1Teruo Yasunaga1Masashi Narazaki3Atsushi Kumanogoh3Toshihiro Horii1
 Tetsuya Iida1
 Kiyoshi Takeda2
 Shota Nakamura1*
- 1Department of Infection Metagenomics, Genome Information Research Center, Research Institute for Microbial Diseases, Osaka University, Suita, Japan
- 2Laboratory of Immune Regulation, Department of Microbiology and Immunology, Graduate School of Medicine, WPI Immunology Frontier Research Center, Osaka University, Suita, Japan
- 3Department of Respiratory Medicine, Allergy and Rheumatic Diseases, Graduate School of Medicine, Osaka University, Suita, Japan
- 4Division of Bio-resources, Medical Mycology Research Center, Chiba University, Chiba, Japan
- 5Department of Bacteriology, Graduate School of Medicine, Dentistry and Pharmaceutical Sciences, Okayama University, Okayama, Japan
The study of mycobiota remains relatively unexplored due to the lack of sufficient available reference strains and databases compared to those of bacterial microbiome studies. Deep sequencing of Internal Transcribed Spacer (ITS) regions is the de facto standard for fungal diversity analysis. However, results are often biased because of the wide variety of sequence lengths in the ITS regions and the complexity of high-throughput sequencing (HTS) technologies. In this study, a curated ITS database, ntF-ITS1, was constructed. This database can be utilized for the taxonomic assignment of fungal community members. We evaluated the efficacy of strategies for mycobiome analysis by using this database and characterizing a mock fungal community consisting of 26 species representing 15 genera using ITS1 sequencing with three HTS platforms: Illumina MiSeq (MiSeq), Ion Torrent Personal Genome Machine (IonPGM), and Pacific Biosciences (PacBio). Our evaluation demonstrated that PacBio’s circular consensus sequencing with greater than 8 full-passes most accurately reconstructed the composition of the mock community. Using this strategy for deep-sequencing analysis of the gut mycobiota in healthy Japanese individuals revealed two major mycobiota types: a single-species type composed of Candida albicans or Saccharomyces cerevisiae and a multi-species type. In this study, we proposed the best possible processing strategies for the three sequencing platforms, of which, the PacBio platform allowed for the most accurate estimation of the fungal community. The database and methodology described here provide critical tools for the emerging field of mycobiome studies.
Introduction
Comprehensive analysis of bacterial communities (microbiota) has been made possible with the advent of high-throughput sequencing (HTS) technologies. Particularly, this has led to understanding the composition of the gut microbiome as influenced by factors, such as genetic background, diet, and immune function. Rapid progress has been made in discovery of associations between gut microbiota, the host’s immune system, and various diseases (Arumugam et al., 2011; Wu et al., 2011; Gevers et al., 2012; Ursell et al., 2012).
In addition to bacteria, various types of fungi are also present in the intestines (Schulze and Sonnenborn, 2009; Chen et al., 2011; Dollive et al., 2012). Although the absolute number of commensal fungi accounts for as little as approximately 0.1% of total microorganisms in the intestines (Underhill and Iliev, 2014), they may have an important role in human health (Chang et al., 2011; Gaitanis et al., 2012; Cui et al., 2013; Huffnagle and Noverr, 2013; Wang et al., 2014). For instance, Candida albicans is a species of fungi persistently present in model mice that causes the exacerbation of allergies and autoimmune diseases (Sonoyama et al., 2011). In addition, fungi in the intestines induce colitis through the activity of host Dectin-1, a C-type lectin receptor (Sonoyama et al., 2011; Iliev et al., 2012). Fungal communities (mycobiota) in the intestines clearly play an important role in the health of the host.
Various genera of fungi have been detected in mycobiota analyses of the healthy human gut, and the genera Saccharomyces. Candida, and Cladosporium have been detected in particularly high percentages (Schulze and Sonnenborn, 2009; Chen et al., 2011; Dollive et al., 2012; Hoffmann et al., 2013). Moreover, analyses of the mycobiota in the oral cavity (Kleinegger et al., 1996; Ghannoum et al., 2010) and skin (Paulino et al., 2006, 2008; Zhang et al., 2011; Park et al., 2012; Findley et al., 2013) have demonstrated that mycobiota populations vary according to sites on the body (Cui et al., 2013; Underhill and Iliev, 2014). Furthermore, there have recently been a number of discussions on the relationships between both fungi and host and among bacteria, fungi, and host (Romani and Luigina, 2011; Mason et al., 2012a,b; Huffnagle and Noverr, 2013; Underhill and Iliev, 2014; Wang et al., 2014; Romani et al., 2015). However, unlike studies analyzing the bacterial component of the host microbiome, fewer studies are available on mycobiomes. In addition, databases of fungal sequences and methodologies for mycobiota analysis are not yet fully developed. Therefore, the potential impact of the mycobiome on pathogenesis and the development of the host immune system remains unknown (Romani and Luigina, 2011; Cui et al., 2013; Huffnagle and Noverr, 2013; Underhill and Iliev, 2014; Wang et al., 2014).
Characterizations of mycobiomes mainly rely on analysis of one portion of the internal transcribed spacer (ITS) region, ITS1, which is located between the 18S and 5.8S subunits of the fungal rRNA genes (Huffnagle and Noverr, 2013; Underhill and Iliev, 2014). This region is universally present in fungi and the mutation rate has been used to analyze evolutionary relationships. For these reasons, it is widely used for identification of species and genetic analyses. However, while the 16S rRNA gene used for bacterial microbiota analysis has a virtually identical length regardless of the species, the length of the ITS region in fungi varies between species. MiSeq and IonPGM sequencing platforms commonly used in mycobiota analysis are able to produce read lengths of several hundred base pairs (bp), however, shorter DNA sequences are favored on these platforms, and thus, overrepresented in the sequencing results. For example, the ITS1 sequence of the well-known fungi Saccharomyces cerevisiae has a length of approximately 460 bp, however, IonPGM do not completely read the ITS1 region with sufficient margins. As a result, it is impossible to have an accurate census of the composition of some fungi in the mycobiota using this strategy. A previous study aimed at solving this issue made attempts to evaluate the accuracy of the analysis by using the ITS1 sequence together with additional gene regions (Tonge et al., 2014). In addition to the problem of short reads, there is also a challenge in establishing a consensus method for mycobiome assessment. There are studies approached with the analytical strategy using automated analysis platforms such as QIIME (Caporaso et al., 2010) and PIPITS (Gweon et al., 2015), and using some curated databases of fungal ITS sequences (Findley et al., 2013; Kõljalg et al., 2013; Schoch et al., 2014; Tang et al., 2015). However, due to the complexity in evaluating the combination of both experimental and analytical strategies, not many attempts have been made to establish a consensus method for mycobiome assessment.
In this study, combinations of experimental and analytical strategies using three sequencing technologies, Illumina MiSeq (MiSeq), Life Technologies Ion Torrent PGM (IonPGM), and Pacific Biosciences RS II system (PacBio), were evaluated using a newly constructed database, ntF-ITS1, and a mock community containing mixtures of 26 fungal species representing 15 genera. Because reports of the analysis of human mycobiomes have been relatively rare and the gut mycobiota is particularly poorly understood (Cui et al., 2013; Huffnagle and Noverr, 2013; Tonge et al., 2014; Wang et al., 2014), we analyzed the mycobiota of feces from healthy Japanese subjects. In this paper, we propose the best strategies to assess the fungal communities and mycobiota of healthy Japanese individuals that is a potential consensus method for mycobiome assessment that may overcome the problem of short reads.
Materials and Methods
Database Construction
Sequences classified as fungi (Taxonomy ID:4751) were extracted from the NCBI-nt database. Additional sequences with ambiguous taxonomic information (those whose taxonomic name included the terms “uncultured,” “environmental,” “unclassified,” or “mixed”) were excluded. From these sequences, the ITS1 region was identified between the ITS1-F (5′-CTTGGTCATTTAGAGGAAGTAA-3′) and ITS2 (5′-GCATCGATGAAGAACGCAGC-3′) sequences using cutadapt-1.7.1 with default parameters (Martin and Marcel, 2011). Because no ITS1 sequences were identified for Rhodosporidium babjevae. Acremonium alternatum. Penicillium digitatum. Mucor ramosissimus, or Rhizopus oryzae in the curated NCBI-nt database, we manually added these sequences to our database. The resulting sequences were converted into a format that was suitable for the Ribosomal Database Project (RDP) Classifier (Wang et al., 2007), and this was used as the database nt-Fungi-ITS1 (ntF-ITS1) for mycobiota analysis. Sequence extraction and format conversion were conducted with a Ruby script. The ntF-ITS1 database can be downloaded from our website1.
Culture and DNA Extraction from 26 Known Fungal Species
The 26 examined strains listed in Table 1 were cultivated on potato-dextrose agar (PDA) slants at 25°C for 3 – 7 days. DNA was extracted from each of cultivated mycelium using a modified benzyl bromide extraction method reported previously in Zhu et al. (1993). Briefly, 500 μL of extraction buffer (100 mM Tris-HCl, 40 mM EDTA, pH 9.0), 100 μL of 10% SDS, and 300 μL of benzyl chloride were added to approximately 200 mg of mycelium. This suspension was then mixed by vortexing and incubated at 65°C for 25 min. The mixture was kept on ice for 5 min and centrifuged at 6,000 × g for 10 min at 4°C. DNA was collected from the supernatant by isopropanol precipitation.
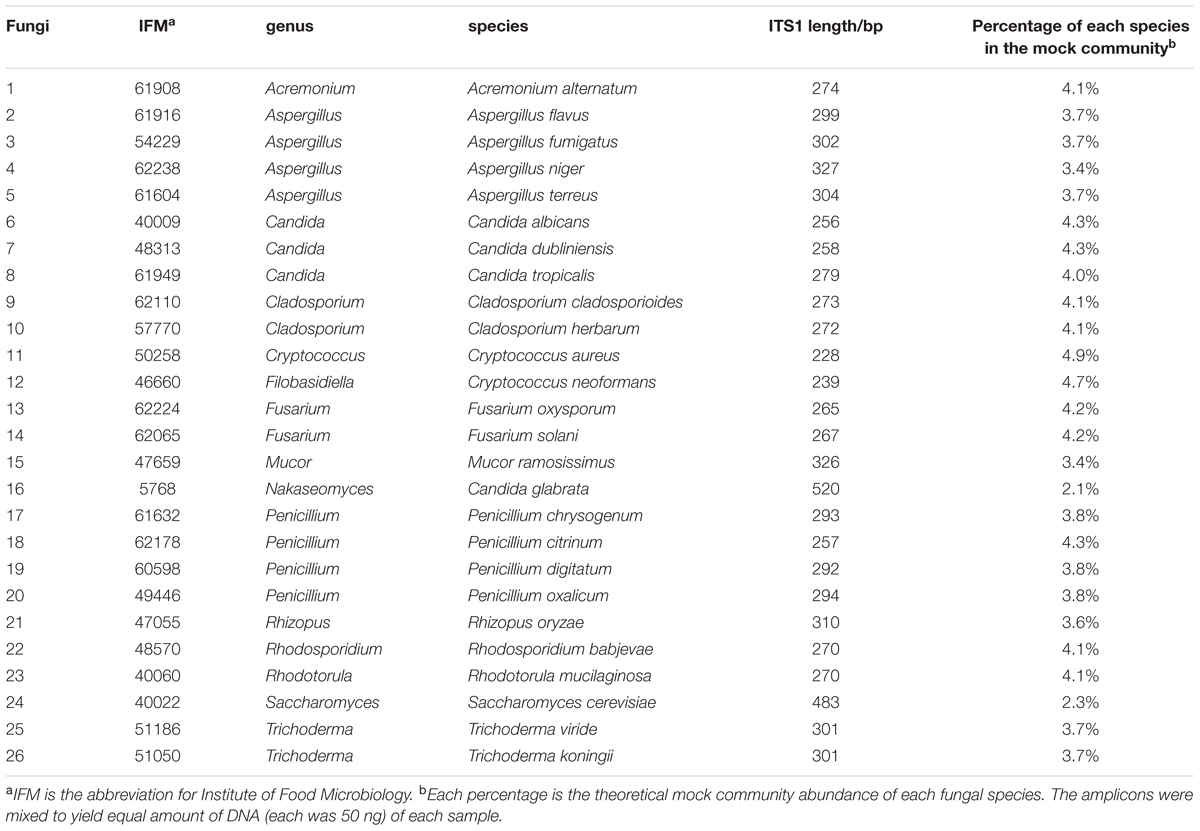
TABLE 1. Genera, species, ITS1 length, and the percentage of fungi used in the mock community.
Amplification of ITS1 Regions and Sanger Sequencing of the Fungal Mock Community
PCR was performed using a primer set (ITS1-F: 5′-CTTGGTCATTTAGAGGAAGTAA-3′) and (ITS2: 5′-GCATCGATGAAGAACGCAGC-3′) targeted the ITS1 region of the ITS. To amplify the targeted region, 5 ng of extracted DNA from 26 known individual fungal species served as the template in 50 μL reactions using KAPA HiFi HotStart Ready Mix (KAPA Biosystems, Woburn, MA, USA). DNA was amplified with an initial denaturation step at 95°C for 3 min, followed by 15 cycles of denaturation at 98°C for 20 s, annealing at 56°C for 15 s, and elongation at 72°C for 30 s. Products were purified using DNA clean and Concentrator-5 (Zymo Research, Orange, CA, USA). Sequencing reactions were performed using 3130xI Genetic Analyzer (Applied Biosystems, Foster City, CA, USA).
Library Preparation, Sequencing, and Read Trimming for the Fungal Mock Community
The concentrations of the ITS1 amplicons from all 26 fungal species were measured using a Qubit Fluorometer (Invitrogen, Carlsbad, CA, USA). Amplicons were mixed to yield equal amounts of DNA (50 ng each), and the mixture was used as a fungal mock community for the preparation of libraries for each sequencing system. Since different fungal species has different ITS1 length, percent composition of each fungi in the mock community based on their ITS1 length is calculated as shown in the Table 1. The raw sequencing data have been deposited in the DDBJ Sequence Read Archive (DRA) under the accession code DRA004340.
IonPGM
A library was prepared from 5 ng of mixed amplicon using the Ion Fragment Library kit (Life Technologies, Gaithersburg, MD, USA) according to the manufacturer’s instructions. Sequencing was performed using a 318 chip and Ion PGM Sequencing Hi-Q Kit (Life Technologies). Raw sequences were trimmed using BBtrim software2 with mean quality value of 10–30. Sequences without full length ITS1 (i.e., the sequences amplified with primers by PCR) were removed using the FASTX-Toolkit3 for subsequent analysis.
MiSeq
A library was prepared from 10 ng of mixed amplicon using KAPA Library Preparation kits (KAPA Biosystems) according to the manufacturer’s instructions. Paired-end sequencing of 251 bp was performed using a MiSeq v2 500 cycle kit (Illumina, San Diego, CA, USA). Paired-end sequences were merged using PEAR software4. The merged reads were then quality filtered with the same condition as those of the IonPGM data.
PacBio
A library was prepared from 300 ng of mixed amplicon using the DNA Template Prep kit 2.0 (Pacific Biosciences, Menlo Park, CA, USA) according to the manufacturer’s instructions. Sequencing was performed with the PacBio RS II system using the DNA Sequencing Kit C2 (Pacific Biosciences) with P4 polymerase. CCS constructed from more than three full-pass subreads were produced using PacBio SMRT Analysis.
Fungal ITS1 Deep Sequencing of Healthy Japanese Feces
Feces were collected in tubes containing RNAlater (Ambion, Austin, TX, USA). Samples were weighed, and RNAlater added to make 10-fold dilutions of homogenates. Homogenates (200 mg) of feces were washed twice with 1 mL PBS and fecal DNA was extracted with the PowerSoil DNA isolation kit (MO BIO Laboratories, Solana Beach, CA, USA) according to the manufacturer’s protocol. Samples were stored at -20°C. DNA was amplified with PCR using the following protocol: Initial denaturation at 95°C for 2 min, followed by 40 cycles of denaturation at 95°C for 20 s, annealing at 56°C for 30 s, elongation at 72°C for 30 min, followed by a final elongation step at 72°C for 10 min. Barcoded PacBio libraries were prepared using the DNA Template Prep kit 2.0 (Pacific Biosciences, Menlo Park, CA, USA) according to the manufacturer’s instructions. Three libraries per SMRT Cell were pooled and subjected to Single Molecule Real-Time (SMRT) sequencing using the PacBio RS II system (Pacific Biosciences). All fecal samples were collected and analyzed at Osaka University. The Osaka University ethics committee approved this study and written informed consent was obtained from all study subjects (12237-3).
Bioinformatic Analysis and Taxonomic Assignment
Sequences were clustered into operational taxonomic units (OTUs), defined at 90 – 100% similarity cutoff for the mock community and 95% for fecal samples using UCLUST version 1.2.22q (Edgar, 2010) using the script (pick_otus.py) in QIIME 1.9.1 (pick_otus.py). Representative sequences for each OTU were classified taxonomically using RDP Classifier version 2.2 using the script (assign_taxonomy.py) in QIIME 1.9.1 with our ntF-ITS1 database and the minimum confidence value is 0.55, and using blastn 2.3.30+ using the script (assign_taxonomy.py) in QIIME 1.9.1 with the default parameters. For the analysis of mock community, we also used the databases; UNITE (Kõljalg et al., 2013), Findley (Findley et al., 2013), and THF (Tang et al., 2015). The characterization of these ITS reference database were summarized in Supplementary Table S1. For principal component analysis (PCA), we visualized data sets using the statistical programming language R 3.1.3 (R Core Team, 2016). Hierarchical clusters of mycobiota were calculated from the relative abundances and the ranked abundances of genera. PCA was performed using the “stats” package from CRAN. A heat map visualization of OTUs was generated with the heatmap.2 function of the “gplots” package from CRAN.
Results
Construction of a Fungal ITS1 Database
For the database construction to identify fungal species, at first, 2,444,619 records of fungi-derived sequences were retrieved from the NCBI-nt database. Of those records, 1,849,386 sequences remained after excluding the records that included ambiguous taxonomic information (e.g., “environmental samples”). Finally, from these, 13,943 sequences remained by excluding the data records with no ITS1 region information, and the database has been constructed. The constructed database, termed ntF-ITS1, represented 1,218 genera and 6,525 species. The average length of ntF-ITS1 sequences was 257 bp, and was widely distributed from approximately 100–800 bp (Figure 1). The length of ITS1 for each sequence in THF and UNITE showed the similar distribution to ntF-ITS1 as shown in Supplementary Figure S1. The number of fungal genera and species included in each database were summarized in Supplementary Table S1.
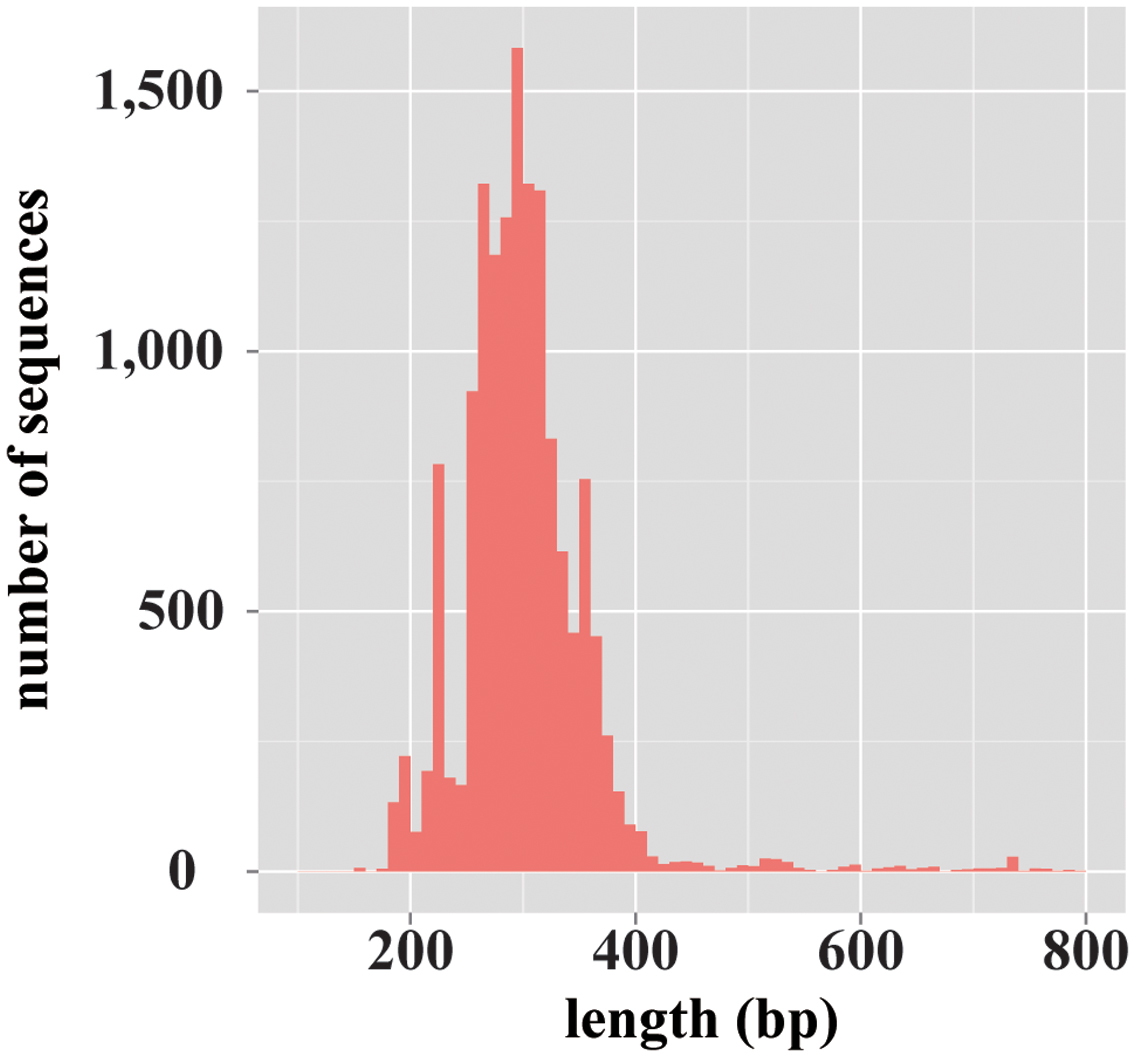
FIGURE 1. The length distribution of the fungal ITS1 region sequences registered on ntF-ITS1 database. A histogram showing the variety in length distribution of fungal ITS1 region sequences. The horizontal axis represents the length of ITS1 sequences. The vertical axis represents the number of sequences of each length.
Taxonomic Assignment of a Mock Community
A mock community composed of 26 fungal species representing 15 genera (Table 1) was used to evaluate the various methods of taxonomic assessment. To characterize this community, we sequenced the ITS1 regions of 26 species. The average length of ITS1 in the mock community was 298 bp; the shortest sequence measured was 228 bp, and the longest 520 bp. Thus, the distribution of ITS1 sequence lengths in the mock community were of similar diversity to ntF-ITS1. We next examined the percent identity that allowed for accurate OTU clustering of the mock community. Using a similarity threshold of 98% or higher for clustering, the 26 fungal species were classified as 25 individual OTUs. Trichoderma viride and Trichoderma koningii were clustered in the same OTU due to the fact that their sequences had 100% similarity. Using a threshold of 97% similarity, Penicillium digitatum and Penicillium chrysogenum were classified in the same OTU. Using a threshold of 96% similarity, Cladosporium herbarum and Cladosporium cladosporioides were classified in the same OTU. At a 95% similarity threshold, C. albicans and C. dubliniensis were classified in the same OTU. If the similarity threshold were reduced to 94% and below, fungal species from differing genera (Penicillium chrysogenum and Aspergillus fumigatus) were clustered in the same OTU. These clustering results at each similarity level are summarized in Supplementary Table S2. We also classified each OTU using blastn and UCLUST. As shown in Supplementary Table S3, blastn and UCLUST mis-assigned some OTU’s to other genera. Our evaluation suggested that to conduct a clustering of fungal genera on the basis of the ITS1 region in an accurate manner, the sequence similarity required for clustering must be 95% or higher. We employed the 95% sequence similarity threshold for taxonomic assignment with our ntF-ITS1 using RDP Classifier, resulting in the accurate assignments of all 15 fungal genera in our mock community (Supplementary Table S4). We further compared our ntF-ITS1 to existing fungal ITS database, UNITE, Findley, and THF. As shown in the Supplementary Table S5, while some sequences were mis-assigned to wrong genera using UNITE and Findley, all sequences were assigned to correct genera using ntF-ITS1 and THF. While THF has sequences for only 1,816 species, ntF-ITS1 for 6,525 species. Therefore we used ntF-ITS1 for analysis of fungal ITS1 deep sequence.
Mock Community Analysis by IonPGM Sequencing
The Ion PGM Hi-Q sequencing of the mock community yielded 219,756 reads. We evaluated the composition of the community with trimming conditions at varying quality levels (Figure 2A). The estimated compositions of the mock community varied widely at different quality scores. It is noteworthy that, when high quality trimming with a mean quality value (MQV) of 30 was employed, the genus Filobasidiella (dark green) accounted for almost 90% of the total community. The compositions for the genera Acremonium (blue), Candida (green), Fusarium (dark gray), and Cryptococcus (light blue) were more highly represented in the middle quality ranges, around MQV20, and decreased toward MQV30. The compositions of the genera Saccharomyces and Nakaseomyces were barely detected in this analysis, as its ITS1 regions consist of sequences that are longer than others (Figure 2B). Plotting MQV at each sequence position clearly revealed that the quality scores rapidly dropped to MQV20 at 50 bp, and decreased to MQV15 at 275 bp, the average length of all ITS1 regions (Figure 2C). When we performed hierarchical clustering analysis of the compositions at different quality scores (Figure 2D), the population compositions at MQV11 clustered with the original mock population. However, the original composition could not be reconstructed accurately when the MQV was set over 21. Mycobiota analysis using IonPGM depended largely on the length of the ITS1 regions. This shows that the quality of the reads must be carefully considered when using IonPGM. In our case, the quality trimming score of MQV 11 yielded the most accurate results.
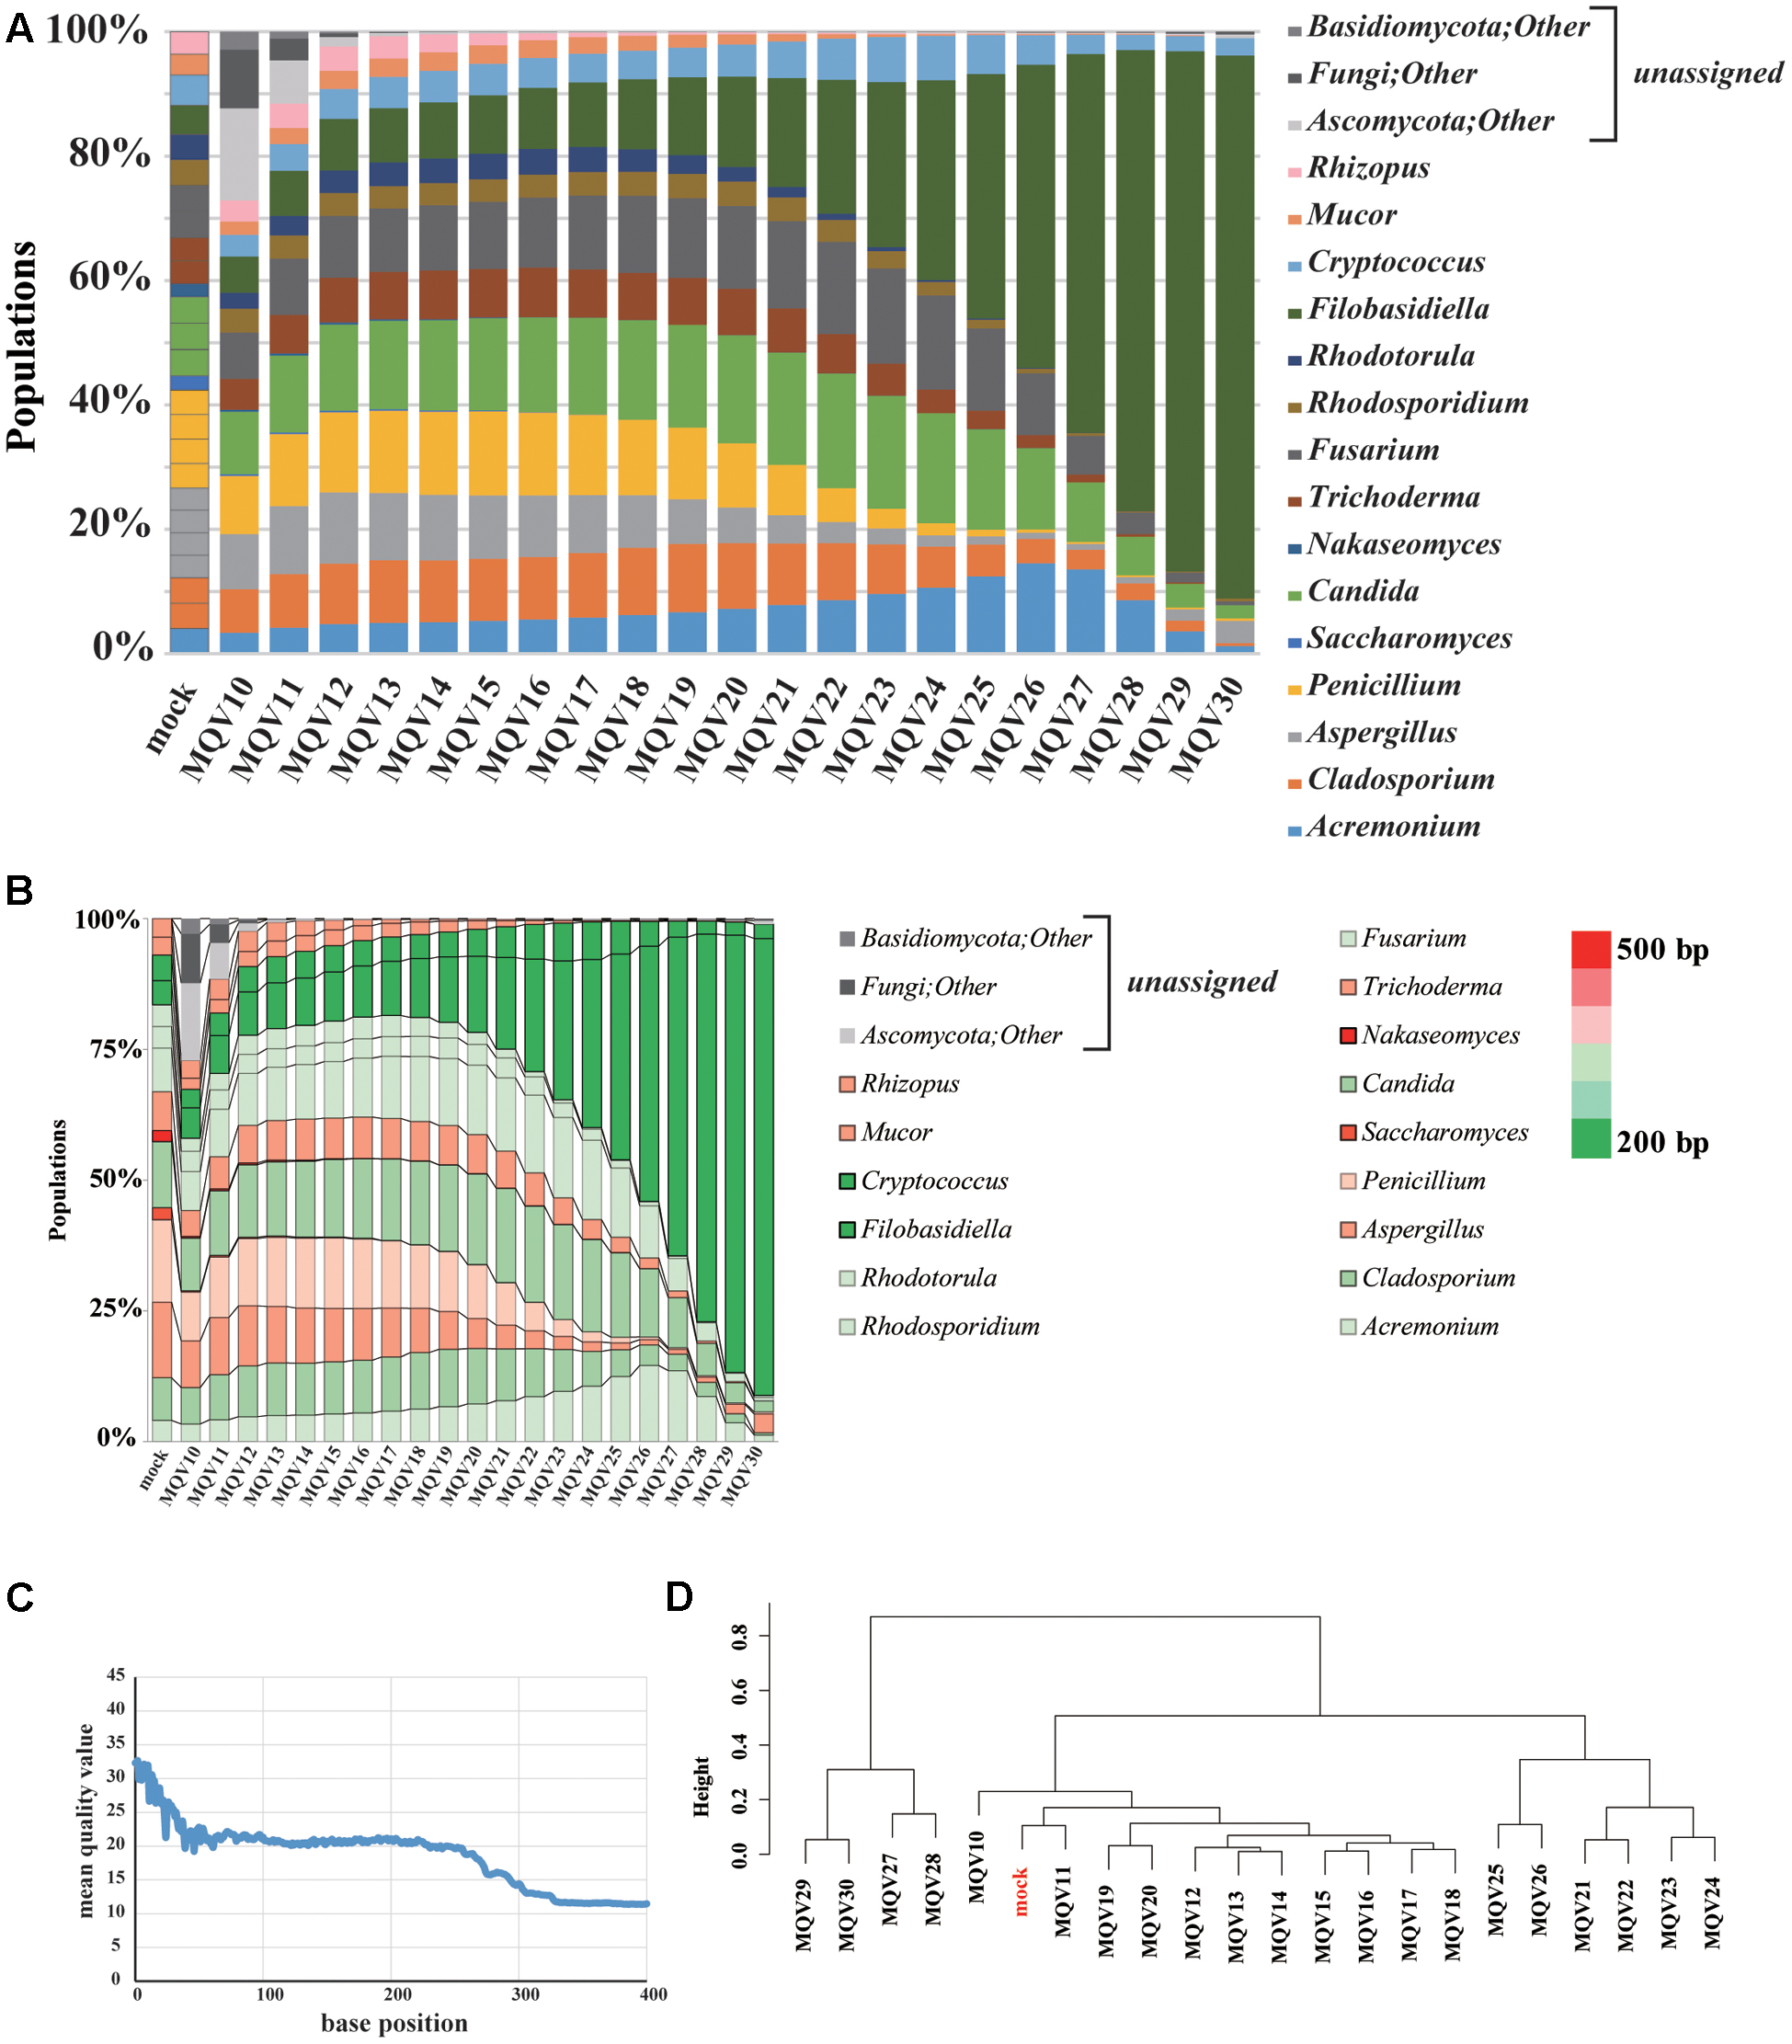
FIGURE 2. Results of mycobiota analysis in the mock community using IonPGM sequencing. (A) Relative abundance of major fungal genera in the mock community shown in a bar graph. Read-trimming was carried out using an ideal relative abundance of the mock community and MQV 10 – 30. Percentage read abundances of 15 genera are shown in Supplementary Figure S4. (B) Relative abundances of the major fungal genera are shown in different colors according to the length of the ITS1 region. (C) MQV at each base position of the read. (D) Genus-level hierarchical clustering analysis of the relative abundance of the major fungal genera. Results of analyses conducted using MQV ranging from 10 to 30 were analyzed along with ideal values.
Mock Community Analysis by MiSeq Sequencing
MiSeq paired-end sequencing of 251 bp yielded 181,436 reads. These paired reads were merged, trimmed, and subjected to taxonomic assignment with various trimming conditions. Unlike the case of IonPGM, the estimated compositions at each MQV score were not influenced by the trimming quality (Figure 3A). However, the genus Nakaseomyces was not identified at any quality score. The composition of the genus Saccharomyces was estimated to be as low as approximately half of the original population. As stated above, the ITS1 regions of these specific genera have long sequences, around 500 bp. In particular, the ITS1 region of Candida glabrata, which was used as a representative of the genus Nakaseomyces, had an ITS1 length of 520 bp. This long ITS1 region could not be sequenced by the 251 bp paired-end sequencing method. Similar to the IonPGM data, the MQV plot of MiSeq also tended to decrease according to the length of the reads (Figure 3B). The overall MQVs of the read2 region are lower than those of the read1 region. However, because the overall MQVs were higher than 30, quality trimming had no impact. The hierarchical clustering analysis revealed that there are no large differences between MQVs. The cluster most closely resembling the mock population was MQV26-30 (Figure 3C). The analysis with MiSeq sequencing reconstructed nearly the entire population of the mock community, except the genus Nakaseomyces which was not identified.
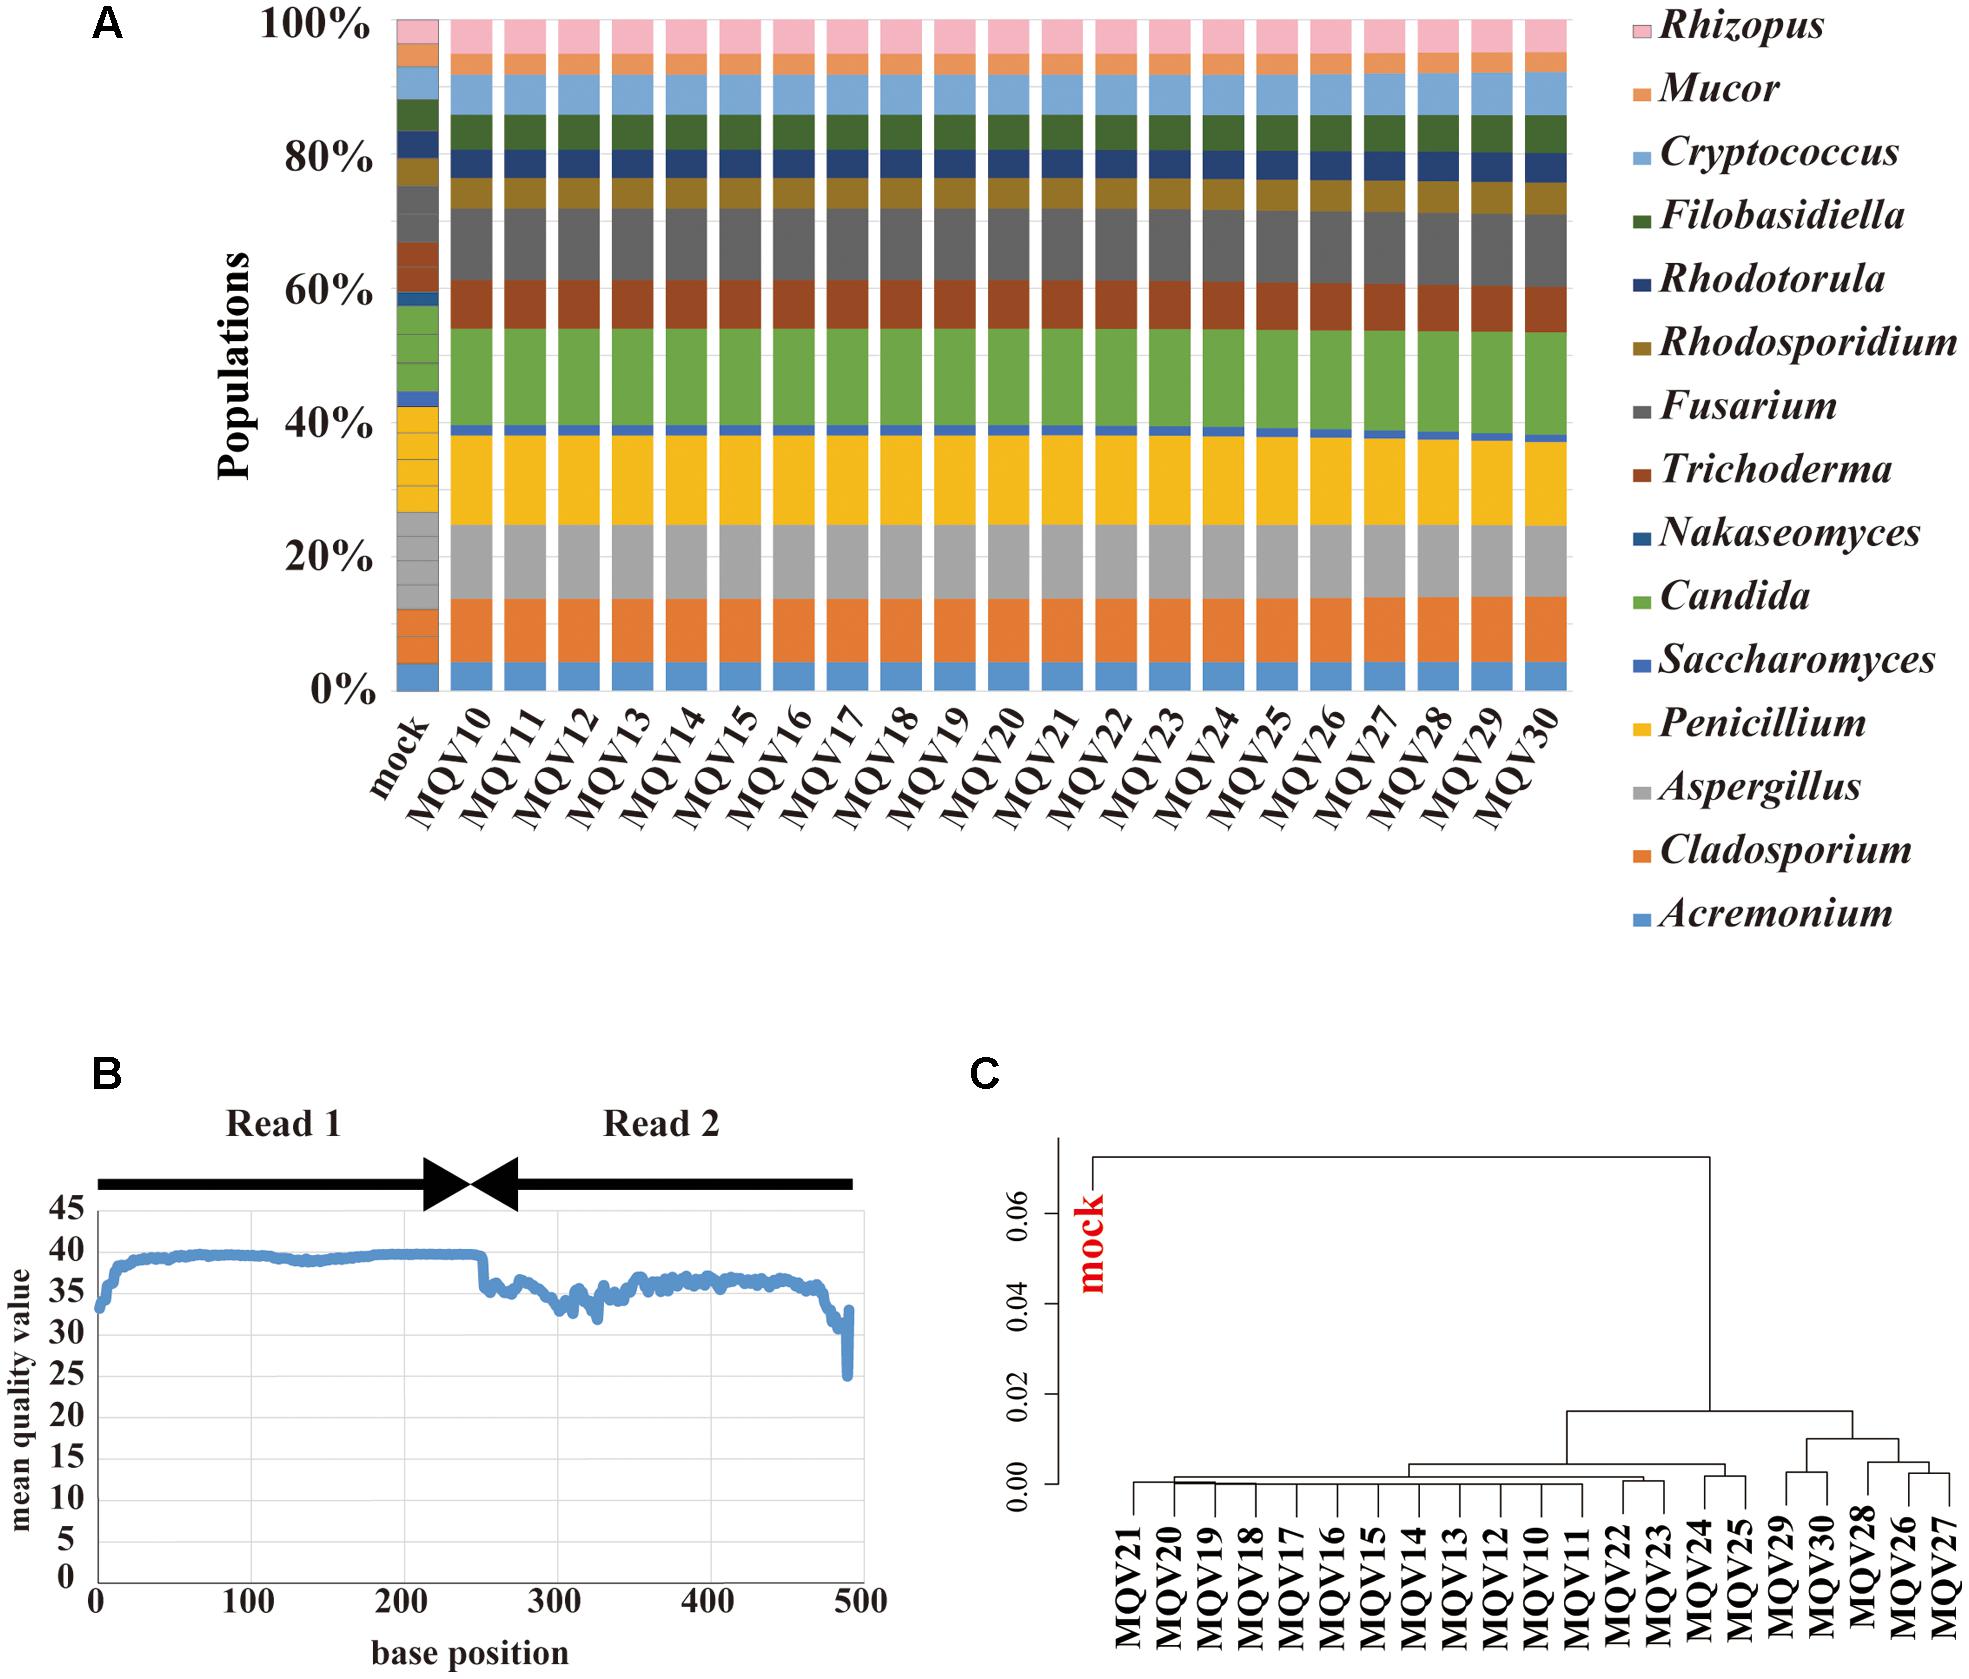
FIGURE 3. Results of mycobiota analysis in the mock community using MiSeq sequencing. (A) Relative abundance of major fungal genera in the mock community shown in a bar graph. Read-trimming was carried out using an ideal relative abundance of the mock community and MQV 10 – 30. Percentage read abundance of 15 genera are shown in Supplementary Figure S4. (B) MQV at each base position of the sequences merged with paired-end reads. (C) Genus-level hierarchical clustering analysis of the relative abundance of the major fungal genera. Results of analyses conducted using MQV ranging from 10 to 30 were analyzed along with ideal values.
Mock Community Analysis by PacBio Sequencing
PacBio sequencing using one cell yielded 2,189,947 subreads. The MQV of these subreads was 9.5, which was extremely low. To increase sequence accuracy, circular consensus sequencing (CCS) was employed. As the consensus sequence was generated, the number of full passes used in the analysis ranged from 2 to 12. At two full-passes, 72,406 reads were obtained. At 12 full-passes, 40,934 reads were obtained. We evaluated the composition change according to the numbers of full-passes (Figure 4A). The PacBio sequencing reconstructed the composition of the original mock community, including the genera Nakaseomyces and Saccharomyces. Among the data associated with a small number of full-passes, sequences that could not be identified, such as those labeled as “fungi” or “other,” were confirmed to account for less than 10% of sequences, and were not present in data sets with a higher number of full-passes. The MQV plot of PacBio showed that MQVs of reads longer than 300 bp increased according to the number of full-passes (Figure 4B). At the 520 bp position, consensus sequences with four and eight full-passes achieved MQV30 and MQV40, respectively. The hierarchical clustering analysis revealed that there are no large differences related to the number of full-passes (Figure 4C). Therefore, the consensus sequence with eight full-passes, which could identify 98% or more of all 15 fungal genera, was considered to have been the optimal analytical parameters for PacBio sequencing, and those parameters were used for subsequent analysis of the gut mycobiota of healthy Japanese individuals.
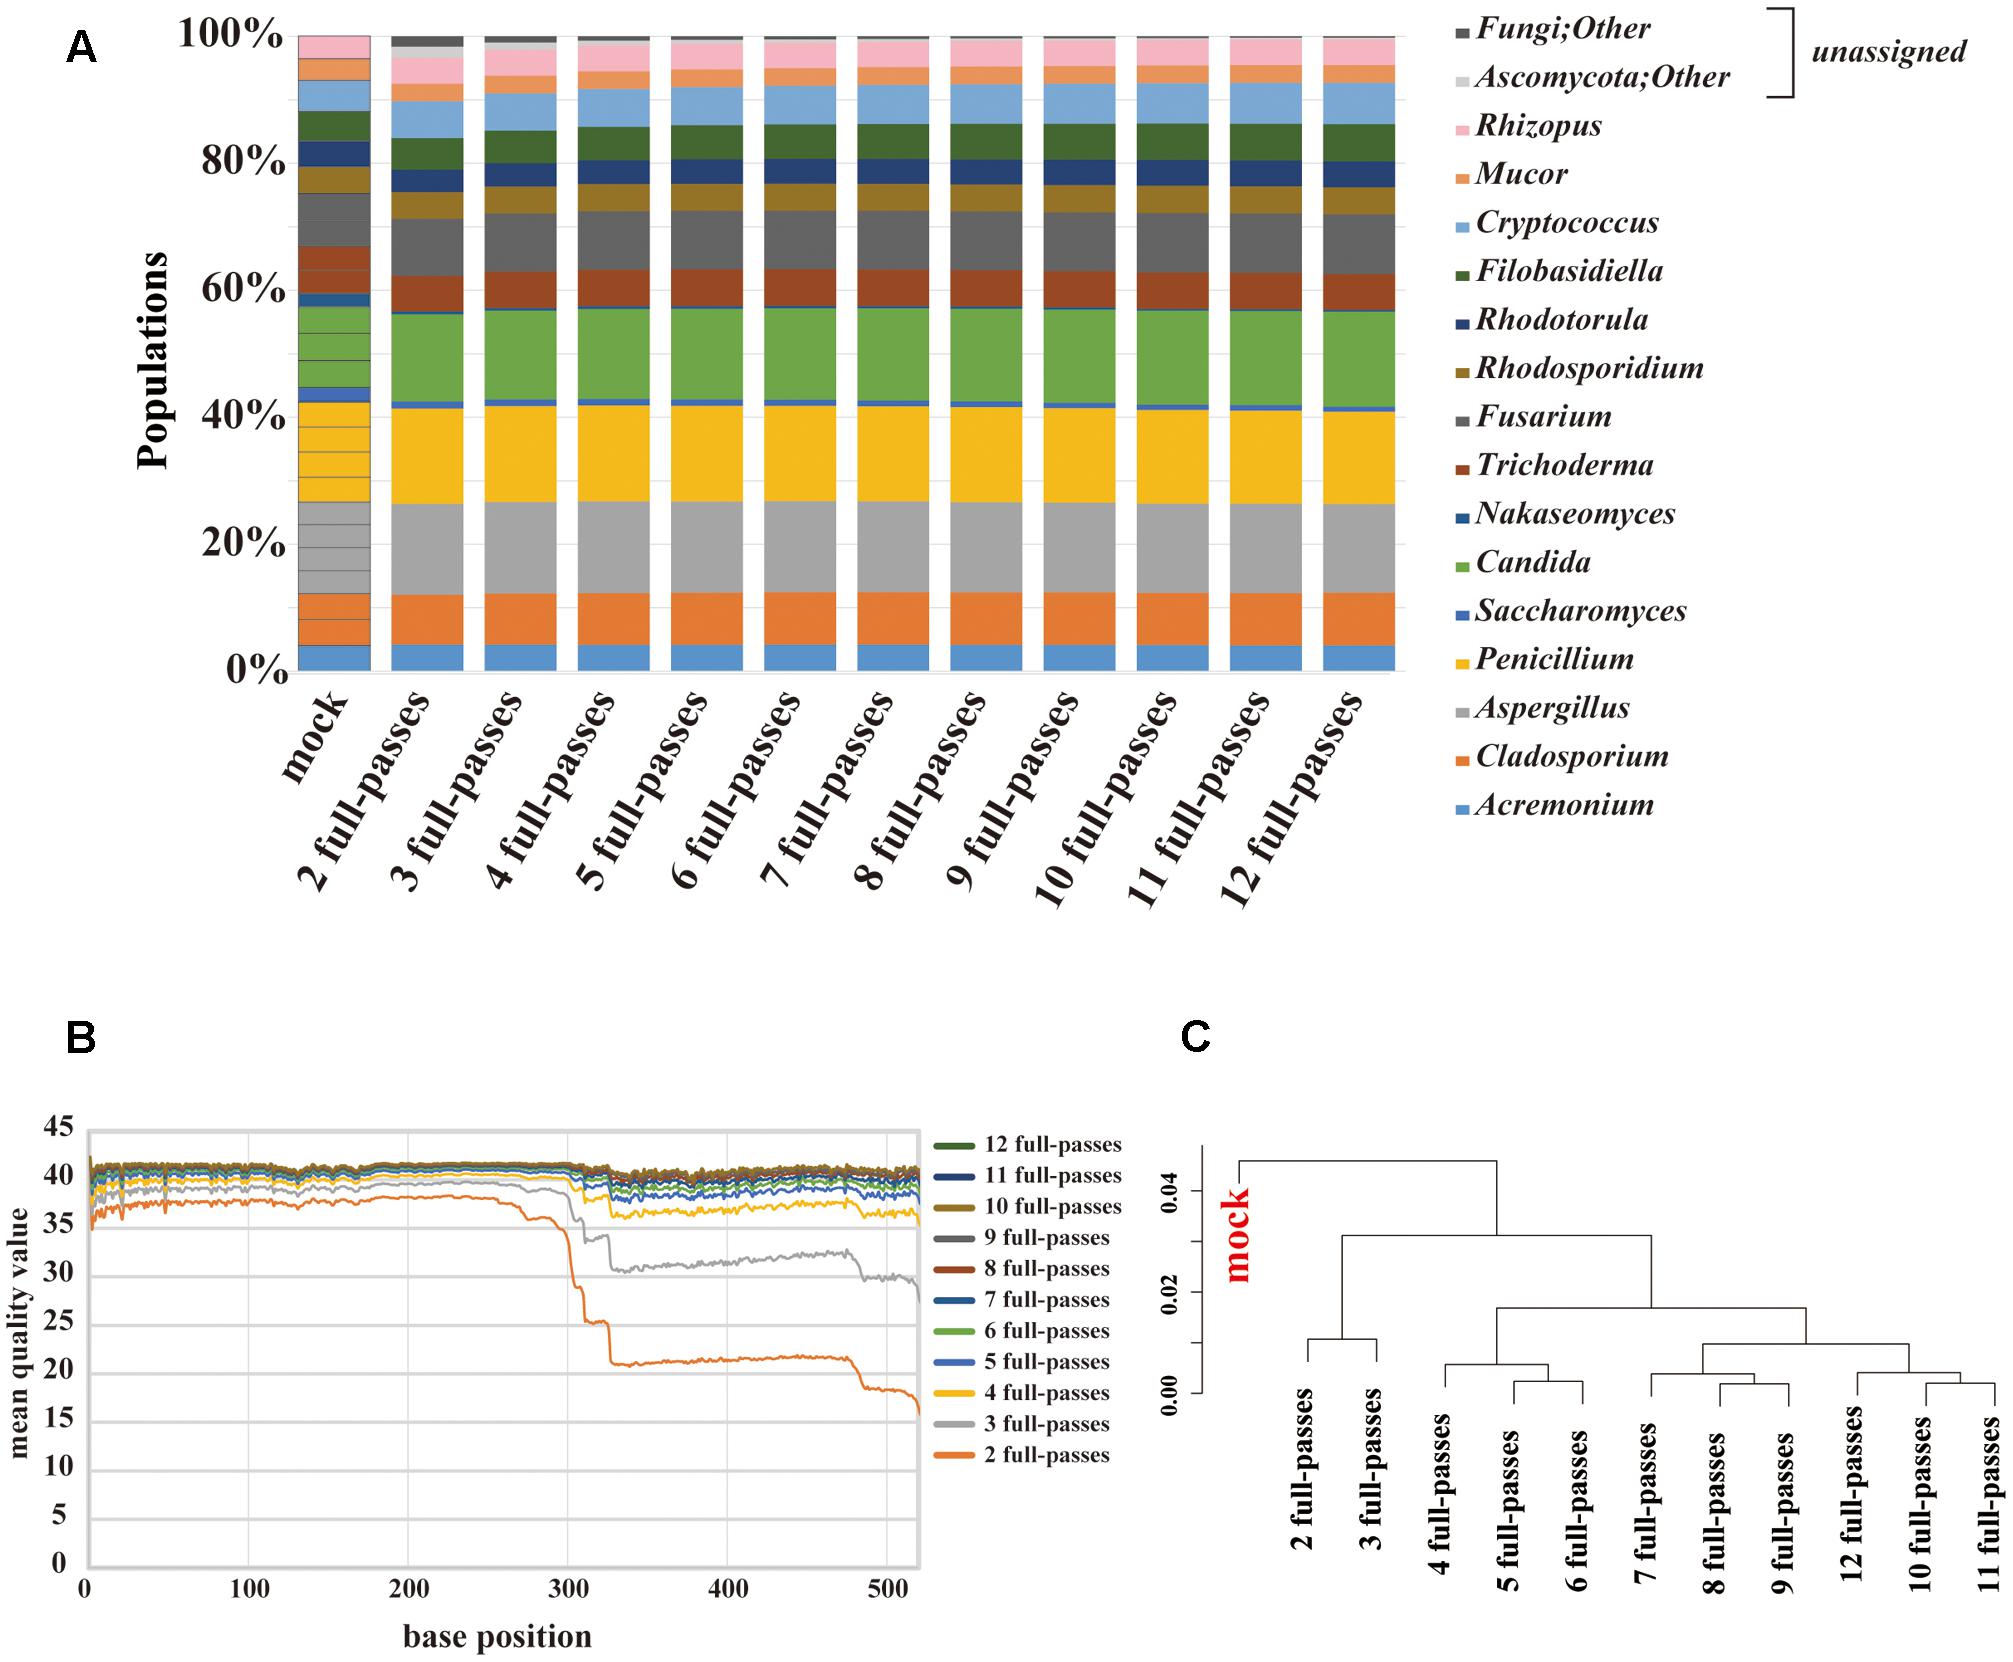
FIGURE 4. Results of mycobiota analysis in the mock community using PacBio sequencing. (A) Relative abundance of major fungal genera in the mock community shown in a bar graph. Consensus sequences were created with the ideal values for the mock community and between 2 and 12 full passes. Percentage read abundance of 15 genera are shown in Supplementary Figure S4. (B) MQV at each base position of the consensus sequences created with varying numbers of full passes (C) Genus-level hierarchical clustering analysis of the relative abundance of the major fungal genera. Results of analyses conducted with between 2 and 12 full passes were analyzed along with ideal values.
Gut Mycobiota in Healthy Japanese Individuals
Mycobiota analysis was performed on fecal samples from 14 healthy subjects. PacBio consensus sequences with eight full-passes yielded an average of 2,984 reads per sample. We performed the PCA on mycobiota at the genus level for 14 individuals (Figure 5A), and characterized two major mycobiota types, Genera Candida-dominant and Saccharomyces dominant type. A third group composed of other fungi was also identified. Relationships between mycobiota and gender or age differences were analyzed, but no apparent differences were found (Supplementary Figure S2). The heat map of fungal OTUs revealed a low diversity among the major fungi present in each individual (Figure 5B). The mycobiota of seven individuals was composed of either only a single species or was >90% of C. albicans or S. cerevisiae (Figure 5C). For the remaining seven individuals, the mycobiota were composed of multiple species, including C. glabrata. C. dubliniensis. Ganoderma lingzhi. Aspergillus oryzae, and unidentified fungal sequences. All fungi found in feces are listed in Supplementary Table S6. We determined that the mycobiota of healthy Japanese individuals is comprised of a simple assemblage consisting of only one or a few species.
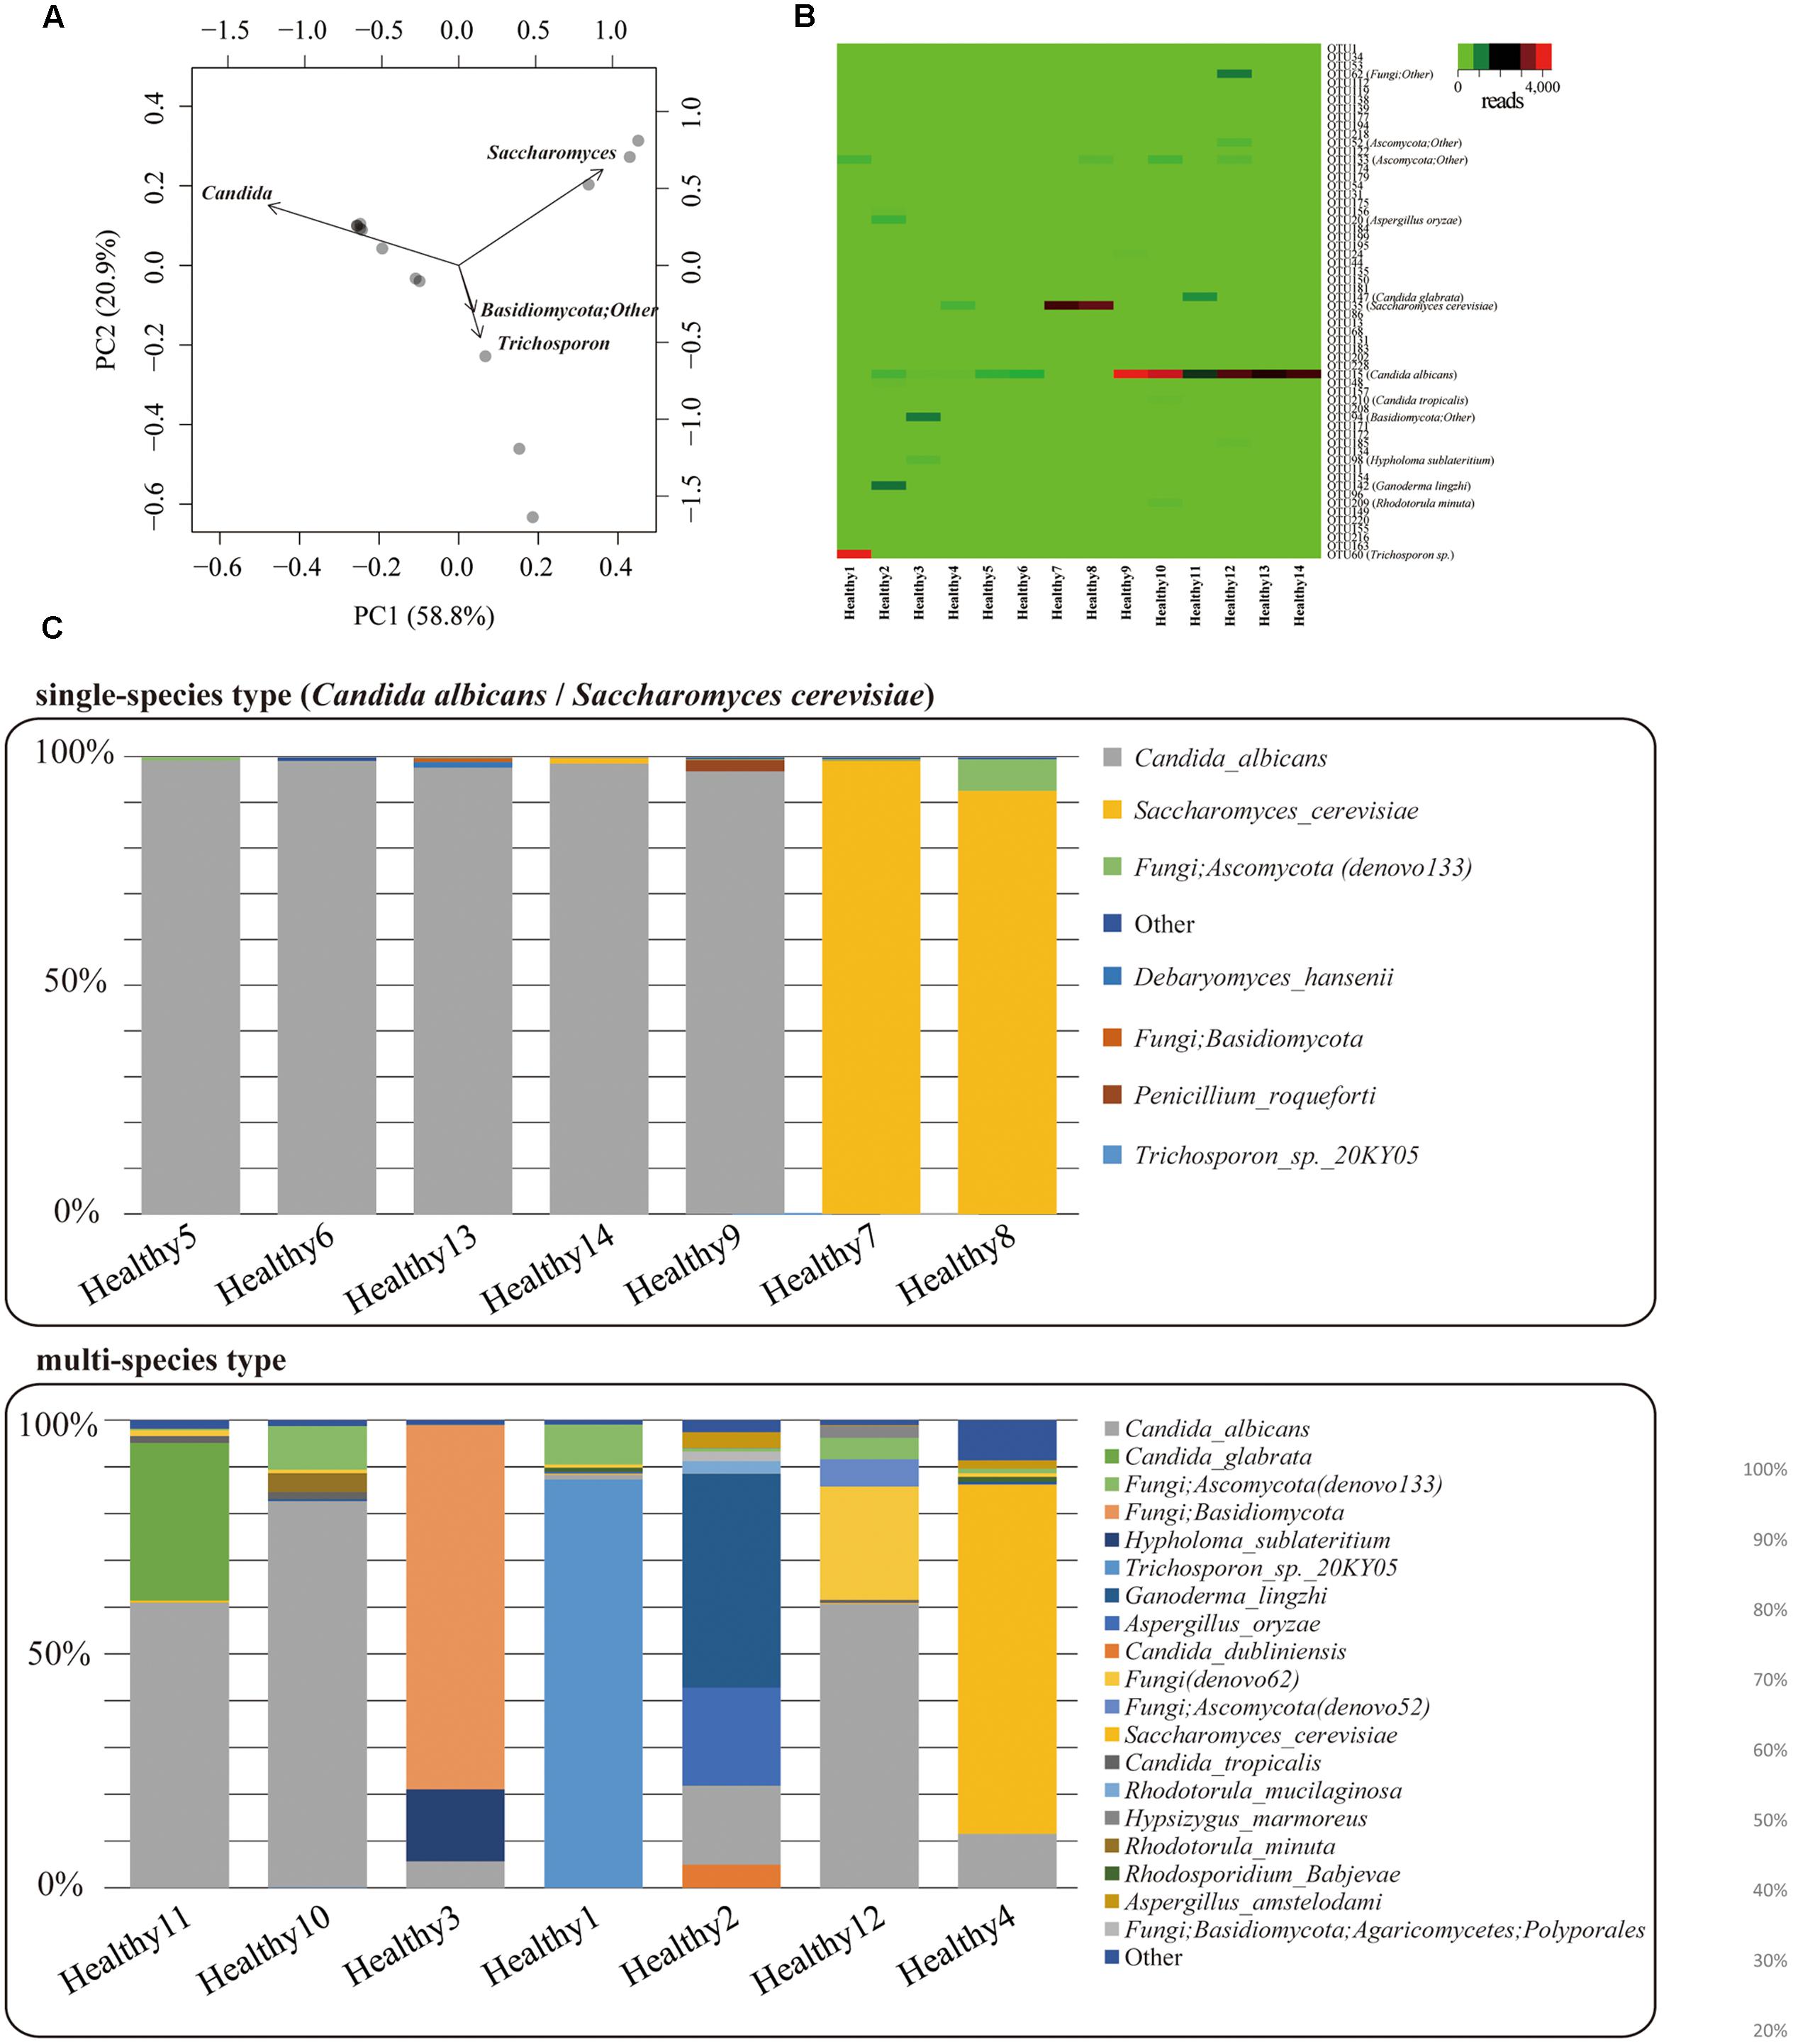
FIGURE 5. Gut mycobiota in healthy Japanese individuals. (A) Genus-level principal component analysis of mycobiota in the feces of 14 healthy Japanese subjects. Each individual subject is shown with a black dot. (B) Heat-map [operational taxonomic unit (OTU) level] of mycobiota found in the feces of the 14 healthy Japanese subjects. Number of reads for each OTU is shown in a color scale ranging from green to red (low to high). Name of each OTU is listed in Supplementary Table S4. (C) Bar charts of the mycobiota found in the feces of each of the Japanese subjects. The upper graph represents the “single species type” the bottom one represents the “multi-species type.”
Discussion
Comparison of IonPGM, MiSeq, and PacBio ITS1 Sequencing for Characterization of a Fungal Community
We evaluated the performance of three sequencing technologies, IonPGM, MiSeq, and PacBio, for an ITS1 deep sequencing analysis of a 26-species fungal community. Figure 6A summarizes the results obtained from surveys of each sequencing technology. For IonPGM sequencing, relative abundances of genera Nakaseomyces and Saccharomyces were evaluated to be less than 10% of the original mock while the genus Filobasidiella was estimated to be twice as much. For MiSeq sequencing, the genus Nakaseomyces was not identified, and the genus Saccharomyces was estimated at less than half of the original mock population. In addition, the abundances of genera Aspergillus. Cryptococcus, and Rhizopus deviated by approximately 30% from the original mock. For PacBio sequencing, the relative abundances of genera Nakaseomyces and Saccharomyces were underestimated, with results suggesting less than half of the concentration of the original mock population, while the relative abundances of the other genera were estimated accurately. While second-generation sequencing, such as IonPGM and MiSeq, tends to read shorter DNA sequences, PacBio has less of a length-dependent sequencing bias, however, the length dependence cannot be eliminated completely (Fichot and Norman, 2013).
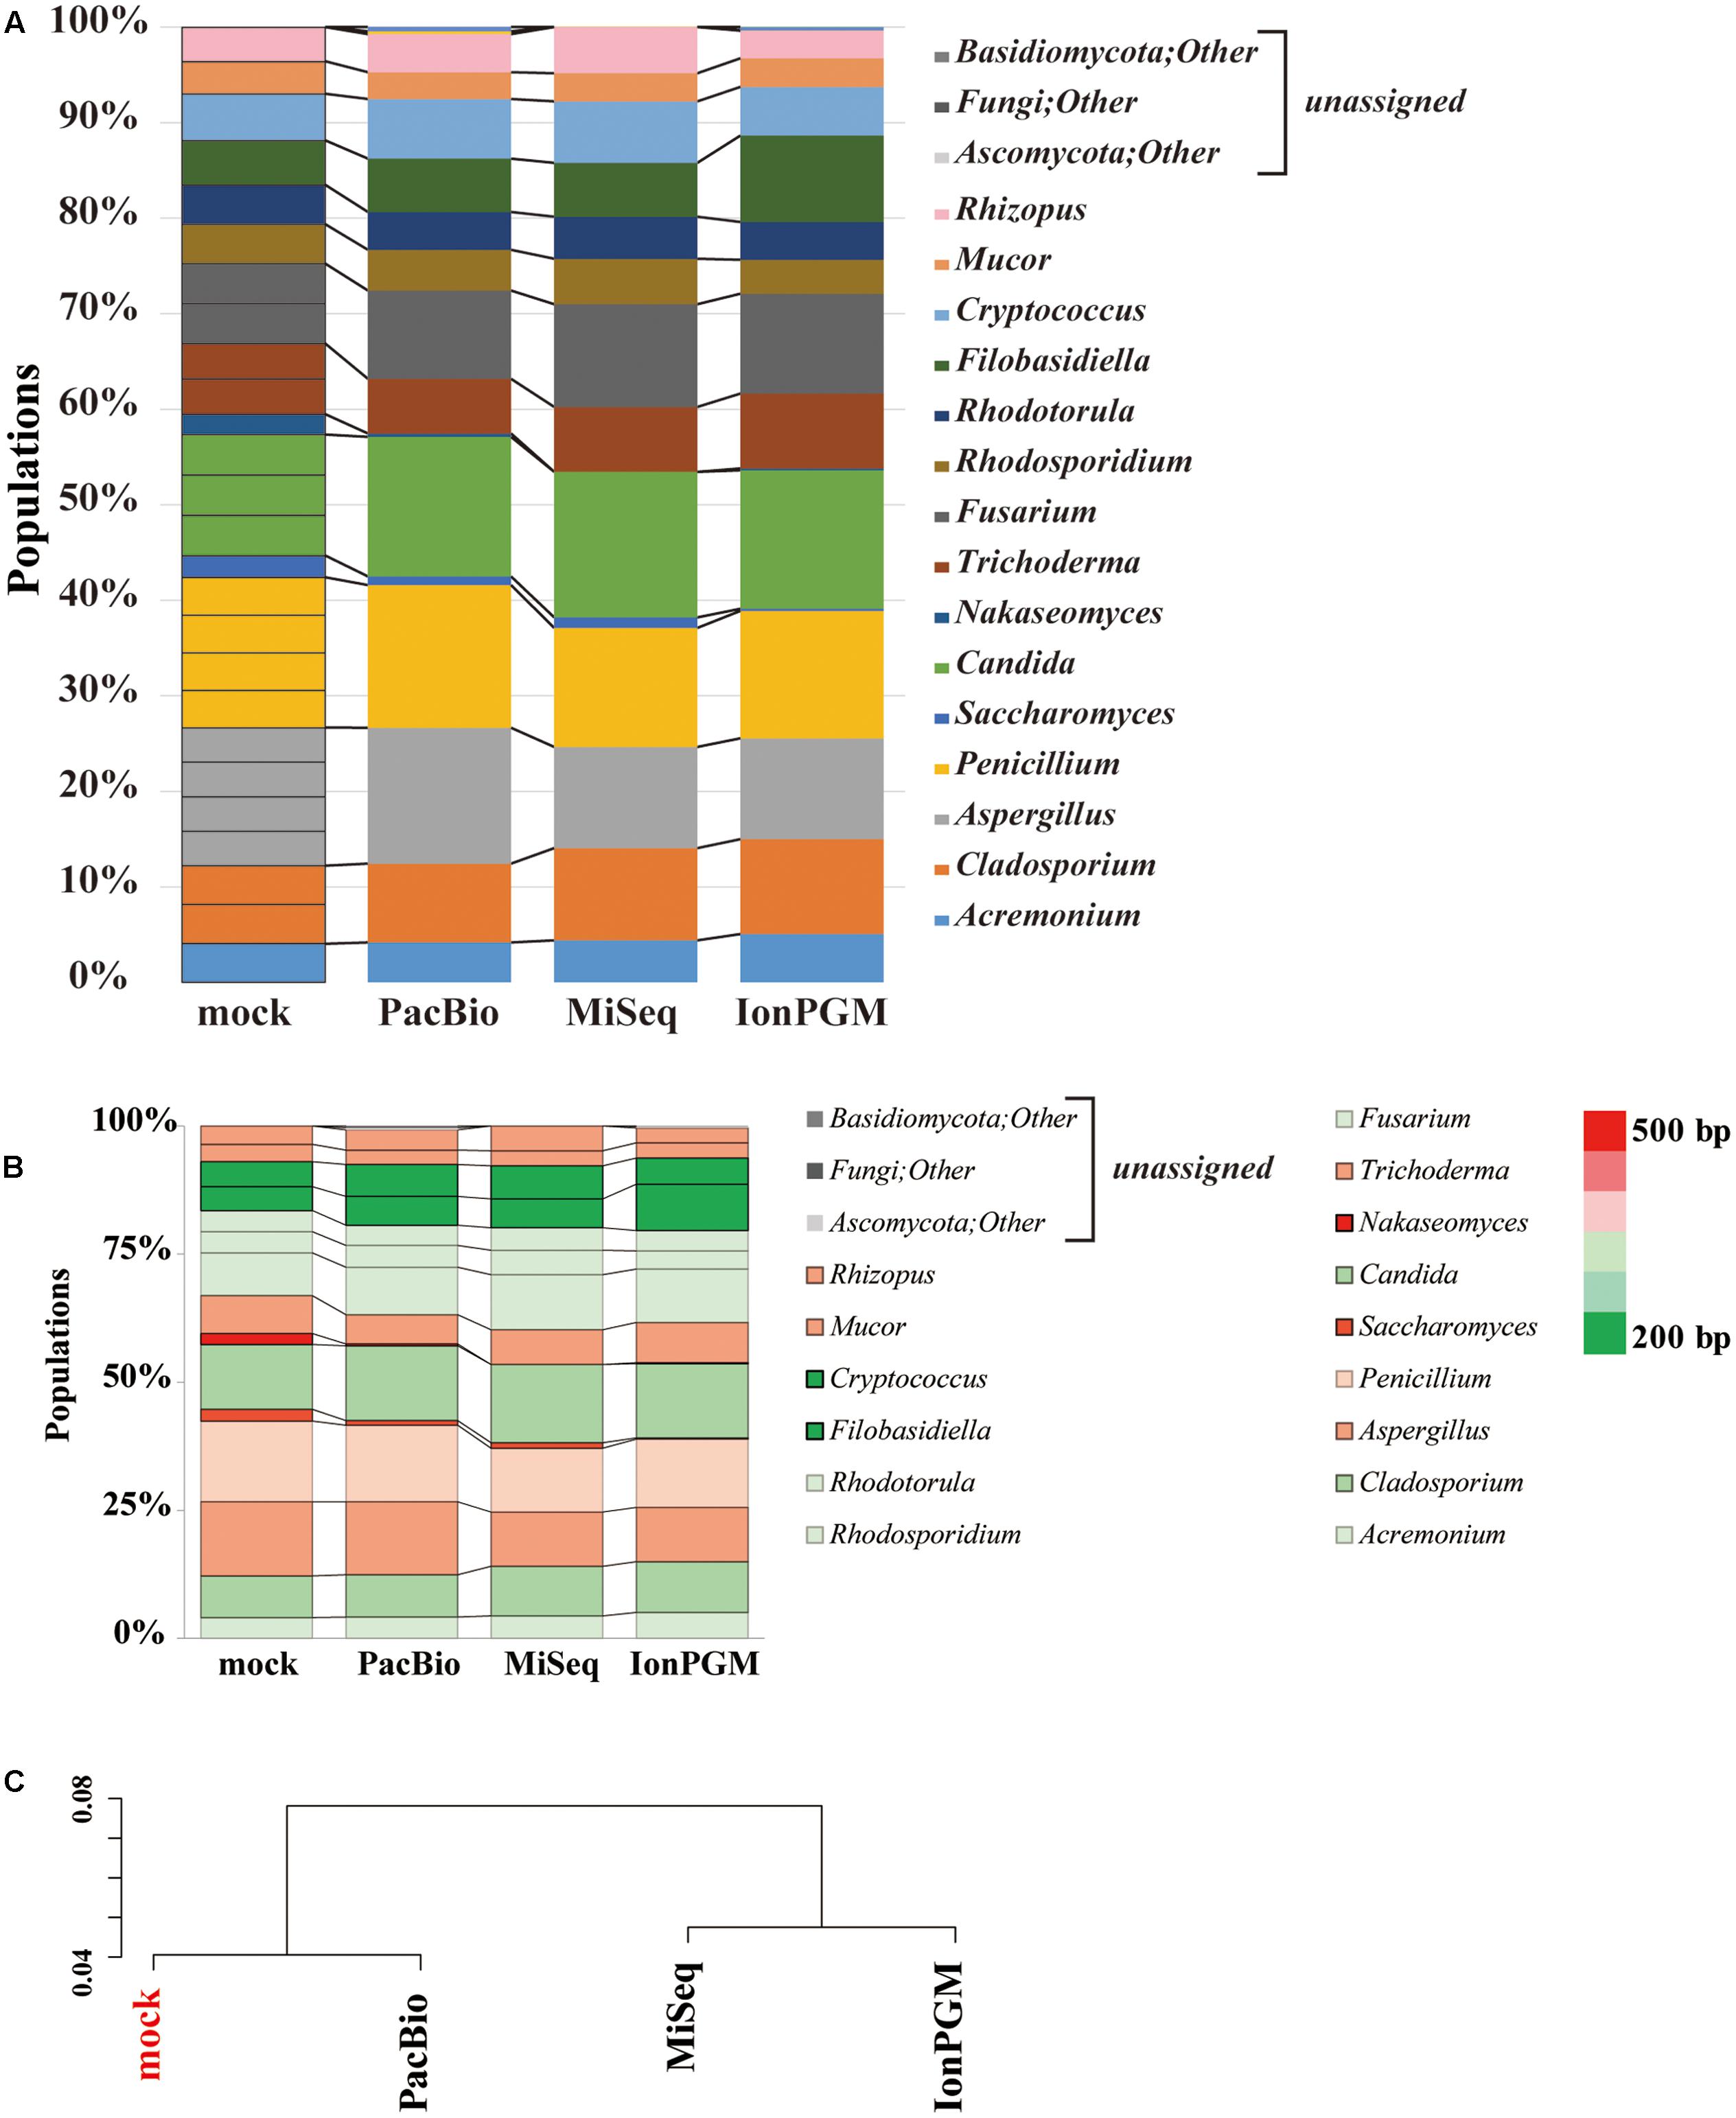
FIGURE 6. Comparison of IonPGM, MiSeq, and PacBio sequencing performance for ITS1 fungal community. (A) Relative abundance of major fungal genera in the mock community. The theoretical proportion for the mock community together with the optimal analysis of the results obtained by PacBio, MiSeq, and IonPGM sequencing are shown in a bar graph. Percentage read abundance of 15 genera are shown in Supplementary Figure S4. (B) Relative abundance of the major fungal genera found in the mock community are shown in different colors according to length of the ITS1 sequence. (C) Results of the hierarchical clustering of the composition of the major fungal genera derived from the results obtained by each sequencing method.
We generated a heat map of the relative abundances for each sequencing technology according to the length of the ITS1 region of each fungal genus (Figure 6B). For all sequencing technologies, the longer ITS1 sequences, shown in red, were underestimated from the original mock sample, and the shorter ITS1, which are shown in green, were overestimated. The ITS1 regions of C. glabrata and S. cerevisiae are approximately 500 bp. Therefore, it is impossible to sequence them in their entirety using the current IonPGM sequencing kit, which allows for reading DNA sequences up to a maximum length of 400 bp. C. glabrata is a fungal species commonly present in humans (Underhill and Iliev, 2014) and S. cerevisiae is a very well-known species included in common food products. Therefore, these two species of fungi are highly likely to be present in the human mycobiome.
Despite the importance of the two major species, C. glabrata was not found with MiSeq or IonPGM sequencing. Pyrosequencing technology such as IonPGM sequencing and 454 sequencing (Roche) are currently the most widely used methods for the analysis of mycobiota. However, pyrosequencing results contain many homopolymer errors, and all services pertaining to 454 sequencing will be unavailable after 2016. In addition, IonPGM sequencing is fundamentally dependent on the sequence length. Even though the Hi-Q sequencing chemistry, which reduces insert-deletion error compared with previous version, was applied in this study, sequence quality decay was observed (Supplementary Figure S3). Compared with IonPGM, MiSeq was found to be more suitable for mycobiota analysis. These results were consistent with recently reported findings that compared MiSeq with IonPGM analysis (Tang et al., 2015).
Our study using PacBio revealed that all fungi from our mock community could be accurately assigned. The hierarchical clustering analysis of results from each sequencing analysis revealed that PacBio provided the most accurate estimation of the mock community population (Figure 6C). This was particularly true for some species of fungi with ITS1 regions as long as 800 bp. In the further studies aiming to assign all OTUs at the species level, expanding the fungal sequence database and conducting an analysis of the entire length of the ITS region by selecting different regions will be required. With our approach, the PacBio method was the only one that allowed for analysis of long sequence lengths with sufficient margins, covering the entire length of the ITS region. However, it must be noted that some fungi cannot be differentiated by the ITS region alone, which is a limitation of this analysis (Mello et al., 2011; Schoch et al., 2012; Tonge et al., 2014).
Mycobiota Analysis of Healthy Japanese Individuals
Our study is the first report analyzing the mycobiota of the feces of Japanese individuals using deep ITS1 sequencing. We found that the mycobiota of most subjects were composed of only a few species, mainly consisting of genera Candida and Saccharomyces. These results were consistent with previous reports exploring the composition of fungi in human feces (Dollive et al., 2012; Hoffmann et al., 2013). In the genus Candida, we found the following species: C. albicans. C. glabrata, and C. dubliniensis, which have been reported as the most commonly found fungal species in humans (Underhill and Iliev, 2014; Romani et al., 2015). Our study revealed that while the two major genera in the mycobiota were Candida and Saccharomyces, some people were carriers of other populations of mycobiota. These mycobiomes were composed of identifiable fungi such as Tricosporon spp., G. lingzhi. Hypsizygus sublateritium, and A. oryzae, as well as a large number of sequences that could not be assigned to a known taxa.
Although the mycobiota of each individual participant did not show much diversity, the identification of those unknown minor fungi in the mycobiota would be the next targets for research on human commensal microorganisms. Further development of fungal genome databases will be essential for the analysis of various mycobiota and diseases associated with specific commensal microorganisms.
Author Contributions
DM and SN designed the study, performed experiments and data analysis, interpreted the analyzed results, and coauthored the manuscript. KF and RT performed experiments and coauthored the manuscript. KG, YM, YF, TK, NG, TeY, MN, AK, and TH contributed valuable advice on the analyzed results. TaY, TI, and KT designed the study, coordinated research and helped to author the manuscript. All authors have read and approved the final manuscript.
Funding
This work was supported in part by the program of the Japan Initiative for Global Research Network on Infectious Diseases (J-GRID) by the Ministry of Education, Culture, Sports, Science and Technology of Japan. DM is supported in part by JSPS KAKENHI Grant Number 24890103. SN is supported in part by JSPS KAKENHI Grant Number 25670271.
Conflict of Interest Statement
The authors declare that the research was conducted in the absence of any commercial or financial relationships that could be construed as a potential conflict of interest.
Acknowledgments
We thank S. Yoshiki and T. Yoshimura for help with the experiments. We would like to thank S. Ito, N. Jung, and J. Rozewicki. This work was supported in part by the National BioResource Project – Pathogenic Microbes in Japan (http://www.nbrp.jp/).
Supplementary Material
The Supplementary Material for this article can be found online at: http://journal.frontiersin.org/article/10.3389/fmicb.2017.00238/full#supplementary-material
Footnotes
- ^https://bitbucket.org/daisukem/fungi/wiki/Home
- ^http://sourceforge.net/projects/bbmap/
- ^http://hannonlab.cshl.edu/fastx_toolkit/
- ^http://sco.h-its.org/exelixis/web/software/pear/
References
Arumugam, M., Raes, J., Pelletier, E., Le Paslier, D., Yamada, T., Mende, D. R., et al. (2011). Enterotypes of the human gut microbiome. Nature 473, 174–180. doi: 10.1038/nature09944
Caporaso, J. G., Kuczynski, J., Stombaugh, J., Bittinger, K., Bushman, F. D., Costello, E. K., et al. (2010). QIIME allows analysis of high-throughput community sequencing data. Nat. Methods 7, 335–336.
Chang, F.-Y., Lee, J.-H., Yang, Y.-H., Yu, H.-H., Wang, L.-C., Lin, Y.-T., et al. (2011). Analysis of the serum levels of fungi-specific immunoglobulin E in patients with allergic diseases. Int. Arch. Allergy Immunol. 154, 49–56. doi: 10.1159/000319208
Chen, Y., Chen, Z., Guo, R., Chen, N., Lu, H., Huang, S., et al. (2011). Correlation between gastrointestinal fungi and varying degrees of chronic hepatitis B virus infection. Diagn. Microbiol. Infect. Dis. 70, 492–498. doi: 10.1016/j.diagmicrobio.2010.04.005
Cui, L., Morris, A., and Ghedin, E. (2013). The human mycobiome in health and disease. Genome Med. 5:63. doi: 10.1186/gm467
Dollive, S., Peterfreund, G. L., Sherrill-Mix, S., Bittinger, K., Sinha, R., Hoffmann, C., et al. (2012). A tool kit for quantifying eukaryotic rRNA gene sequences from human microbiome samples. Genome Biol. 13:R60. doi: 10.1186/gb-2012-13-7-r60
Edgar, R. C. (2010). Search and clustering orders of magnitude faster than BLAST. Bioinformatics 26, 2460–2461. doi: 10.1093/bioinformatics/btq461
Fichot, E. B., and Norman, R. S. (2013). Microbial phylogenetic profiling with the Pacific Biosciences sequencing platform. Microbiome 1:10. doi: 10.1186/2049-2618-1-10
Findley, K., Oh, J., Yang, J., Conlan, S., Deming, C., Meyer, J. A., et al. (2013). Topographic diversity of fungal and bacterial communities in human skin. Nature 498, 367–370. doi: 10.1038/nature12171
Gaitanis, G., Magiatis, P., Hantschke, M., Bassukas, I. D., and Velegraki, A. (2012). The Malassezia genus in skin and systemic diseases. Clin. Microbiol. Rev. 25, 106–141. doi: 10.1128/CMR.00021-11
Gevers, D., Knight, R., Petrosino, J. F., Huang, K., McGuire, A. L., Birren, B. W., et al. (2012). The Human Microbiome Project: a community resource for the healthy human microbiome. PLoS Biol. 10:e1001377.
Ghannoum, M. A., Jurevic, R. J., Mukherjee, P. K., Cui, F., Sikaroodi, M., Naqvi, A., et al. (2010). Characterization of the oral fungal microbiome (mycobiome) in healthy individuals. PLoS Pathog. 6:e1000713. doi: 10.1371/journal.ppat.1000713
Gweon, H. S., Oliver, A., Taylor, J., Booth, T., Gibbs, M., Read, D. S., et al. (2015). PIPITS: an automated pipeline for analyses of fungal internal transcribed spacer sequences from the Illumina sequencing platform. Methods Ecol. Evol. 6, 973–980.
Hoffmann, C., Dollive, S., Grunberg, S., Chen, J., Li, H., Wu, G. D., et al. (2013). Archaea and fungi of the human gut microbiome: correlations with diet and bacterial residents. PLoS ONE 8:e66019. doi: 10.1371/journal.pone.0066019
Huffnagle, G. B., and Noverr, M. C. (2013). The emerging world of the fungal microbiome. Trends Microbiol. 21, 334–341. doi: 10.1016/j.tim.2013.04.002
Iliev, I. D., Funari, V. A., Taylor, K. D., Nguyen, Q., Reyes, C. N., Strom, S. P., et al. (2012). Interactions between commensal fungi and the C-type lectin receptor Dectin-1 influence colitis. Science 336, 1314–1317. doi: 10.1126/science.1221789
Kleinegger, C. L., Lockhart, S. R., Vargas, K., and Soll, D. R. (1996). Frequency, intensity, species, and strains of oral Candida vary as a function of host age. J. Clin. Microbiol. 34, 2246–2254.
Kõljalg, U., Nilsson, R. H., Abarenkov, K., Tedersoo, L., Taylor, A. F. S., Bahram, M., et al. (2013). Towards a unified paradigm for sequence-based identification of fungi. Mol. Ecol. 22, 5271–5277. doi: 10.1111/mec.12481
Martin, M., and Marcel, M. (2011). Cutadapt removes adapter sequences from high-throughput sequencing reads. EMBnet.journal 17, 10–12.
Mason, K. L., Erb Downward, J. R., Falkowski, N. R., Young, V. B., Kao, J. Y., and Huffnagle, G. B. (2012a). Interplay between the gastric bacterial microbiota and Candida albicans during postantibiotic recolonization and gastritis. Infect. Immun. 80, 150–158. doi: 10.1128/IAI.05162-11
Mason, K. L., Erb Downward, J. R., Mason, K. D., Falkowski, N. R., Eaton, K. A., Kao, J. Y., et al. (2012b). Candida albicans and bacterial microbiota interactions in the cecum during recolonization following broad-spectrum antibiotic therapy. Infect. Immun. 80, 3371–3380. doi: 10.1128/IAI.00449-12
Mello, A., Napoli, C., Murat, C., Morin, E., Marceddu, G., and Bonfante, P. (2011). ITS-1 versus ITS-2 pyrosequencing: a comparison of fungal populations in truffle grounds. Mycologia 103, 1184–1193. doi: 10.3852/11-027
Park, H. K., Ha, M.-H., Park, S.-G., Kim, M. N., Kim, B. J., and Kim, W. (2012). Characterization of the fungal microbiota (mycobiome) in healthy and dandruff-afflicted human scalps. PLoS ONE 7:e32847. doi: 10.1371/journal.pone.0032847
Paulino, L. C., Tseng, C.-H., and Blaser, M. J. (2008). Analysis of Malassezia microbiota in healthy superficial human skin and in psoriatic lesions by multiplex real-time PCR. FEMS Yeast Res. 8, 460–471. doi: 10.1111/j.1567-1364.2008.00359.x
Paulino, L. C., Tseng, C.-H., Strober, B. E., and Blaser, M. J. (2006). Molecular analysis of fungal microbiota in samples from healthy human skin and psoriatic lesions. J. Clin. Microbiol. 44, 2933–2941.
R Core Team (2016). The R Project for Statistical Computing [Online]. Available at: https://www.r-project.org/
Romani, L., and Luigina, R. (2011). Immunity to fungal infections. Nat. Rev. Immunol. 11, 275–288. doi: 10.1038/nri2939
Romani, L., Zelante, T., Palmieri, M., Napolioni, V., Picciolini, M., Velardi, A., et al. (2015). The cross-talk between opportunistic fungi and the mammalian host via microbiota’s metabolism. Semin. Immunopathol. 37, 163–171. doi: 10.1007/s00281-014-0464-2
Schoch, C. L., Robbertse, B., Robert, V., Vu, D., Cardinali, G., Irinyi, L., et al. (2014). Finding needles in haystacks: linking scientific names, reference specimens and molecular data for Fungi. Database 2014:bau061. doi: 10.1093/database/bau061
Schoch, C. L., Seifert, K. A., Huhndorf, S., Robert, V., Spouge, J. L., Levesque, C. A., et al. (2012). Nuclear ribosomal internal transcribed spacer (ITS) region as a universal DNA barcode marker for Fungi. Proc. Natl. Acad. Sci. U.S.A. 109, 6241–6246. doi: 10.1073/pnas.1117018109
Schulze, J., and Sonnenborn, U. (2009). Yeasts in the gut: from commensals to infectious agents. Dtsch. Arztebl. Int. 106, 837–842. doi: 10.3238/arztebl.2009.0837
Sonoyama, K., Miki, A., Sugita, R., Goto, H., Nakata, M., and Yamaguchi, N. (2011). Gut colonization by Candida albicans aggravates inflammation in the gut and extra-gut tissues in mice. Med. Mycol. 49, 237–247. doi: 10.3109/13693786.2010.511284
Tang, J., Iliev, I. D., Brown, J., Underhill, D. M., and Funari, V. A. (2015). Mycobiome: approaches to analysis of intestinal fungi. J. Immunol. Methods 421, 112–121. doi: 10.1016/j.jim.2015.04.004
Tonge, D. P., Pashley, C. H., and Gant, T. W. (2014). Amplicon-based metagenomic analysis of mixed fungal samples using proton release amplicon sequencing. PLoS ONE 9:e93849. doi: 10.1371/journal.pone.0093849
Underhill, D. M., and Iliev, I. D. (2014). The mycobiota: interactions between commensal fungi and the host immune system. Nat. Rev. Immunol. 14, 405–416. doi: 10.1038/nri3684
Ursell, L. K., Clemente, J. C., Rideout, J. R., Gevers, D., Caporaso, J. G., and Knight, R. (2012). The interpersonal and intrapersonal diversity of human-associated microbiota in key body sites. J. Allergy Clin. Immunol. 129, 1204–1208. doi: 10.1016/j.jaci.2012.03.010
Wang, Q., Garrity, G. M., Tiedje, J. M., and Cole, J. R. (2007). Naïve Bayesian classifier for rapid assignment of rRNA sequences into the new bacterial taxonomy. Appl. Environ. Microbiol. 73, 5261–5267.
Wang, Z. K., Yang, Y. S., Stefka, A. T., Sun, G., and Peng, L. H. (2014). Review article: fungal microbiota and digestive diseases. Aliment. Pharmacol. Ther. 39, 751–766. doi: 10.1111/apt.12665
Wu, G. D., Chen, J., Hoffmann, C., Bittinger, K., Chen, Y.-Y., Keilbaugh, S. A., et al. (2011). Linking long-term dietary patterns with gut microbial enterotypes. Science 334, 105–108. doi: 10.1126/science.1208344
Zhang, E., Sugita, T., Tsuboi, R., Yamazaki, T., and Makimura, K. (2011). The opportunistic yeast pathogen Trichosporon asahii colonizes the skin of healthy individuals: analysis of 380 healthy individuals by age and gender using a nested polymerase chain reaction assay. Microbiol. Immunol. 55, 483–488. doi: 10.1111/j.1348-0421.2011.00341.x
Keywords: mycobiota, fungi, internal transcribed spacer (ITS), high-throughtput sequencing (HTS), the gut mycobiota in Japanese
Citation: Motooka D, Fujimoto K, Tanaka R, Yaguchi T, Gotoh K, Maeda Y, Furuta Y, Kurakawa T, Goto N, Yasunaga T, Narazaki M, Kumanogoh A, Horii T, Iida T, Takeda K and Nakamura S (2017) Fungal ITS1 Deep-Sequencing Strategies to Reconstruct the Composition of a 26-Species Community and Evaluation of the Gut Mycobiota of Healthy Japanese Individuals. Front. Microbiol. 8:238. doi: 10.3389/fmicb.2017.00238
Received: 21 January 2016; Accepted: 03 February 2017;
Published: 15 February 2017.
Edited by:
Martin Grube, University of Graz, AustriaReviewed by:
Nicola Segata, University of Trento, ItalyGerhard G. Thallinger, Graz University of Technology, Austria
Copyright © 2017 Motooka, Fujimoto, Tanaka, Yaguchi, Gotoh, Maeda, Furuta, Kurakawa, Goto, Yasunaga, Narazaki, Kumanogoh, Horii, Iida, Takeda and Nakamura. This is an open-access article distributed under the terms of the Creative Commons Attribution License (CC BY). The use, distribution or reproduction in other forums is permitted, provided the original author(s) or licensor are credited and that the original publication in this journal is cited, in accordance with accepted academic practice. No use, distribution or reproduction is permitted which does not comply with these terms.
*Correspondence: Shota Nakamura, nshota@gen-info.osaka-u.ac.jp
†These authors have contributed equally to this work.