The Connectivity Fingerprint of the Human Frontal Cortex, Subthalamic Nucleus, and Striatum
 Bethany R. Isaacs
 Birte U. Forstmann
 Yasin Temel
 Max C. Keuken
- 1Integrative Model-Based Cognitive Neuroscience Research Unit, University of Amsterdam, Amsterdam, Netherlands
- 2Department of Neurosurgery, Maastricht University Medical Center, Maastricht, Netherlands
- 3Department of Neuroscience, School for Mental Health and Neuroscience, Maastricht University, Maastricht, Netherlands
Within the cortico basal ganglia (BG)–thalamic network, the direct and indirect pathways comprise of projections from the cortex to the striatum (STR), whereas the hyperdirect pathway(s) consist of cortical projections toward the subthalamic nucleus (STN). Each pathway possesses a functionally distinct role for action selection. The current study quantified and compared the structural connectivity between 17 distinct cortical areas with the STN and STR using 7 Tesla diffusion weighted magnetic resonance imaging (dMRI) and resting-state functional MRI (rs-fMRI) in healthy young subjects. The selection of these cortical areas was based on a literature search focusing on animal tracer studies. The results indicate that, relative to other cortical areas, both the STN and STR showed markedly weaker structural connections to areas assumed to be essential for action inhibition such as the inferior frontal cortex pars opercularis. Additionally, the cortical connectivity fingerprint of the STN and STR indicated relatively strong connections to areas related to voluntary motor initiation such as the cingulate motor area and supplementary motor area. Overall the results indicated that the cortical–STN connections were sparser compared to the STR. There were two notable exceptions, namely for the orbitofrontal cortex and ventral medial prefrontal cortex, where a higher tract strength was found for the STN. These two areas are thought to be involved in reward processing and action bias.
Introduction
The basal ganglia (BG) collectively refer to a group of interconnected subcortical nuclei. The main BG components are the caudate and putamen, which together form the striatum (STR), the internal and external segments of the globus pallidus (GPi and GPe, respectively), the substantia nigra, and the subthalamic nucleus (STN) (Parent and Hazrati, 1995a). Together with the cortex and the thalamus, these BG nuclei form an integrative network consisting of a number of loops involved in a wide range of cognitive, limbic, and motor functions (Albin et al., 1989; Alexander and Crutcher, 1990; Alexander et al., 1990; Temel et al., 2005; Haber and Calzavara, 2009). Each circuit is characterized by three functionally distinct pathways: direct, indirect, and hyperdirect. Anatomically, the direct and indirect pathways entail projections from cortex to the STR, while the hyperdirect pathway bypasses the STR and projects from cortex, directly to the STN (Nambu et al., 2002b; Jahanshahi et al., 2015).
Therefore, both the STN and STR are considered as crucial input structures to the BG and are essential for both optimal and flexible adaptive motor control and action selection, which may arise from a number of scenarios, from goal-directed behaviors to habitual responses (Alexander and Crutcher, 1990; Nambu et al., 2002b; Bogacz and Gurney, 2007; Ding and Gold, 2013). Animal literature indicates that the majority of the cortical input to BG arises from prefrontal and primary motor cortices (Parent and Hazrati, 1995a,b). However, it is generally accepted that frontal connections monosynaptically connecting to the STN are more sparse in comparison to those connecting directly to the STR (Frankle et al., 2006).
To the best of our knowledge, a quantitative comparison of the connectivity profiles between the frontal cortex and the STN and STR in humans has yet to be conducted. There have been numerous studies quantifying the diffusion weighted and resting-state functional MRI (rs-fMRI) connectivity patterns of the cortex, STN, and STR separately (e.g., Di Martino et al., 2008; Draganski et al., 2008; Brunenberg et al., 2012; Lambert et al., 2012; Morris et al., 2016; Cacciola et al., 2017; Anteraper et al., 2018). Though many studies use lower MRI field strengths, where the STN is notoriously difficult to visualize due to its small size and high iron content (Cho et al., 2010; de Hollander et al., 2015, 2017; Forstmann et al., 2017). To compliment the previous connectivity studies, we set out to characterize the connectivity fingerprint of the fontal cortex with the STN and STR in healthy young subjects using ultra-high field 7 Tesla (T) dMRI and rs-fMRI data.
Materials and Methods
Participants
Sixteen healthy participants (9 female, age range = 19–28, mean age = 23.13, SD = 2.47) were scanned. All participants reported normal or corrected to normal vision and were right-handed, as confirmed by the Edinburgh Inventory (Oldfield, 1971). None of the participants had a history of neurological disorder or currently suffered from psychiatric disorders as indicated by self-report and structured clinical interview. The study was approved by the local ethical committee at the Max Planck Institute for Human Brain and Cognitive Sciences in Leipzig, Germany. Written informed consent was acquired and participants received a monetary reward for participation.
MRI Sequences
Structural Scans
The structural data were obtained from a 7T whole body Siemens MAGNETOM using a 24 channel Nova head coil (NOVA Medical Inc., Wilmington, MA, United States) during two sessions. The first session consisted of a whole-brain MP2RAGE (Marques et al., 2010), a MP2RAGE covering a smaller slab, and a multi-echo 3D FLASH slab (Haase et al., 1986). Whole-brain MP2RAGE scans were collected with the following parameters: 240 sagittal slices, acquisition time (TA) of 10:57 min, repetition time (TR) = 5000 ms, echo time (TE) = 2.45 ms, inversion times (TI1) = 900 ms/(TI2) = 2750 ms, flip angle (FA) = 5°/3°, bandwidth (BW) = 250 Hz/Px, and a voxel size of 0.7 mm isotropic. Zoomed MP2RAGE slab images were acquired to facilitate the registration of FLASH images to whole-brain MP2RAGE images which consisted of 128 sagittal slices, with a TA of 9:07 min, TR = 5000 ms, TE = 3.71 ms, TI1 = 900 ms/TI2 = 2750 ms, FA = 5°/3°, BW = 240 Hz/Px, and 0.6 mm isotropic voxel size. Zoomed FLASH slab images consisted of 128 axial slices covering the midbrain with an TA of 17:18 min, TR = 41 ms, TE = 11.22 ms/20.39 ms/29.57 ms, FA = 14°, BW = 160 Hz/Px, and 0.5 mm isotropic voxel size. For the exact acquisition parameters and the raw data see Forstmann et al. (2014).
Diffusion Weighted Imaging
In a second structural scan session, DWI was acquired with a spin echo planar imaging sequence (Heidemann et al., 2010). A total of 100 axial slices were acquired with a TA of 54:16 min, TR = 11.3 s, TE = 67 ms, and voxel size = 1.0 mm isotropic and GRAPPA acceleration factor 3. Diffusion weighting was isotropically distributed along 60 directions with a b value of 1000 s/mm2, AV = 4, and 7 diffusion weighted images to every B0 image.
Resting-State Functional MRI
Finally, in a third MRI session, rs-fMRI was acquired using a 2D EPI sequence. A total of 76 slices were acquired interleaved in transversal direction, with a TA of 5:16 min, TR = 3330 ms, TE = 18 ms, voxel size = 1.5 mm isotropic, phase encoding A > P, GRAPPA acceleration factor 3, BW = 1086 Hz/Px, and echo spacing = 1.03 ms. To correct for distortions, a GRE field map with 57 slices was acquired in transversal direction with a TA of 4:53 min, TR = 1500, TE1 = 6.00 ms, TE2 = 7.02 ms, voxel size = 2.0 mm isotropic, FA = 68°, phase encoding A > P, and BW = 259 Hz/Px.
Region of Interest (ROI) Definition
Subcortical Masks
The STN and STR masks have been previously described in Keuken et al. (2014). The STN was parcellated using the multi-echo FLASH, whereas the STR was parcellated using the MP2RAGE slab. In short, both the STN and STR as a whole were manually parcellated by two independent researchers using FSLview (version 4.1.4.; Jenkinson et al., 2012). The STR was not subdivided into its anatomical subdivisions due to the challenges associated with identifying the border between the caudate nucleus, the putamen, and the fundus striati (Neto et al., 2008; Keuken et al., 2014). Only voxels identified by both raters as belonging to the structure were included for further analyses. Given the size of the STN in relation to the resolution of the dMRI and rs-fMRI we decided to only focus on the connectivity profile of the two subcortical structures as a whole and not investigate any topographical organization within the given structures. For more information regarding the parcellation protocol see Keuken et al. (2014, 2017).
Cortical Masks
Instead of testing the connectivity of the STN and STR with the entire cortex, we selected a number of cortical areas that have been identified in non-human primate (NHP) tracer studies as connecting to both the STN and STR. These connections were selected by conducting an empirical literature search using the PubMed database1. The employed keywords included: “subthalamic nucleus,” “striatum,” “macaque,” “monkey,” “histological,” “tracer(s),” and “connection(s)” and was published in English. All abstracts and resulting full text articles were read by two researchers (BI and MK).
Since a large number of studies used different nomenclature to refer to the same or similar brain regions (e.g., Brodmann, Walkers, Vogts, and “own labeling system”) we summarized these studies into a single cortical area using the anatomical description of the original study. The human homolog of each cortical area was then identified in standard MNI-space using a number of comparative anatomical atlases that are based on both human and NHPs (Sallet et al., 2013; Neubert et al., 2014, 2015) as implemented in FSL. See Table 1 for the cortical areas identified in the literature search and Figure 1 for a visualization of the cortical ROI’s in MNI-space.
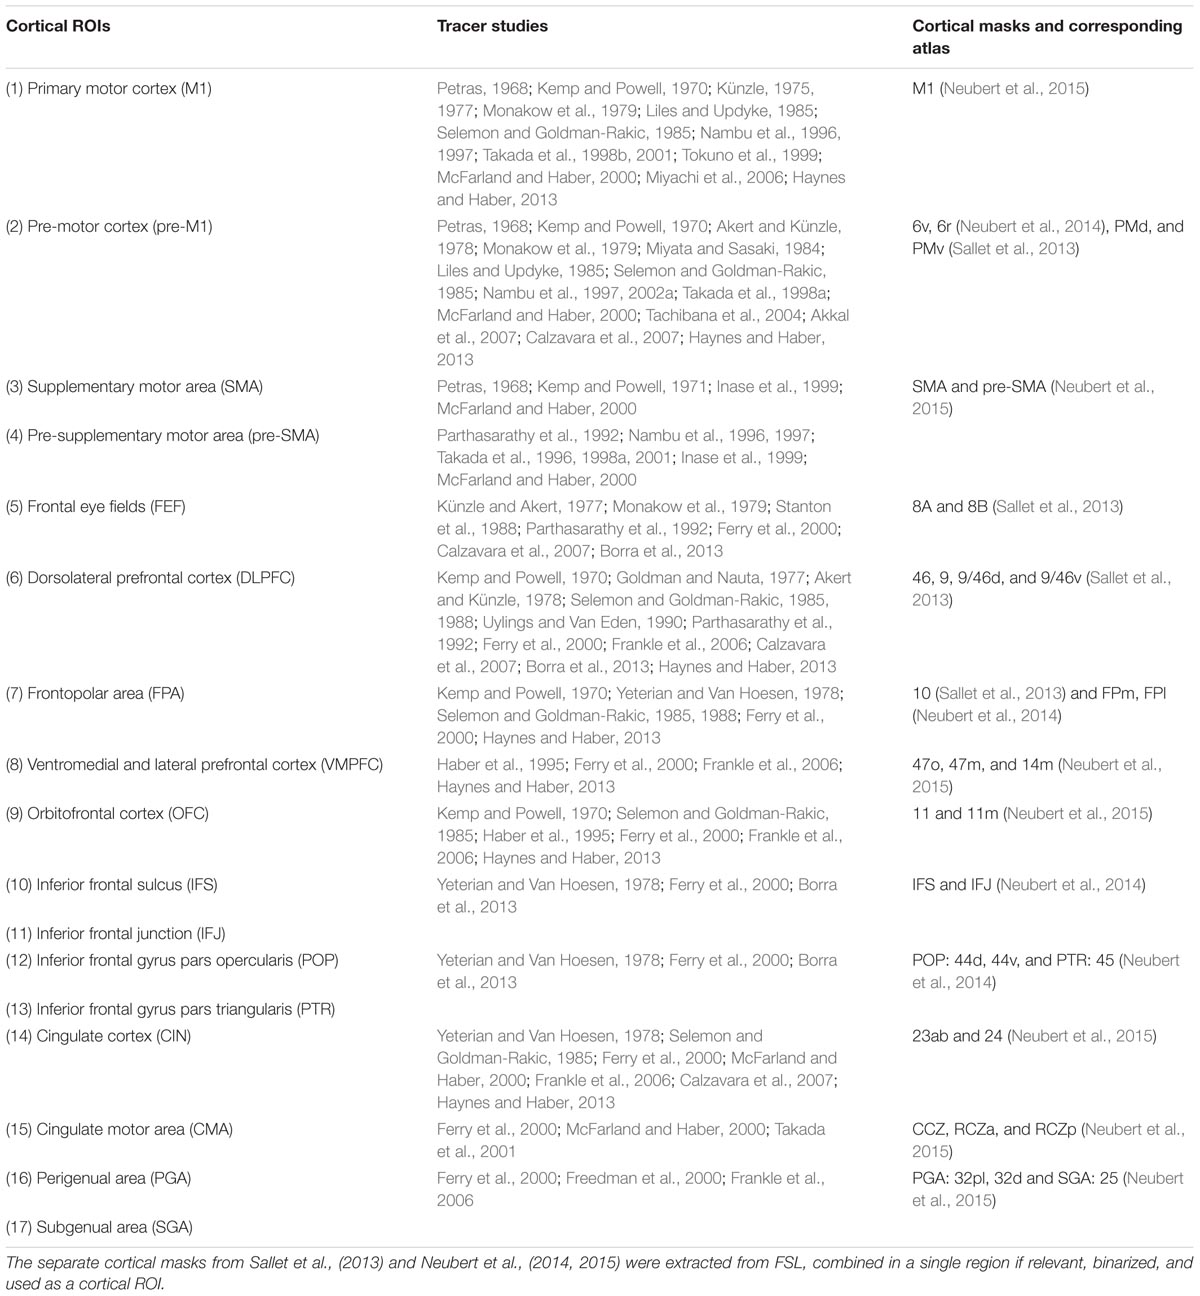
TABLE 1. Cortical areas that connect both to the STR and STN based on tracer studies in non-human primates.
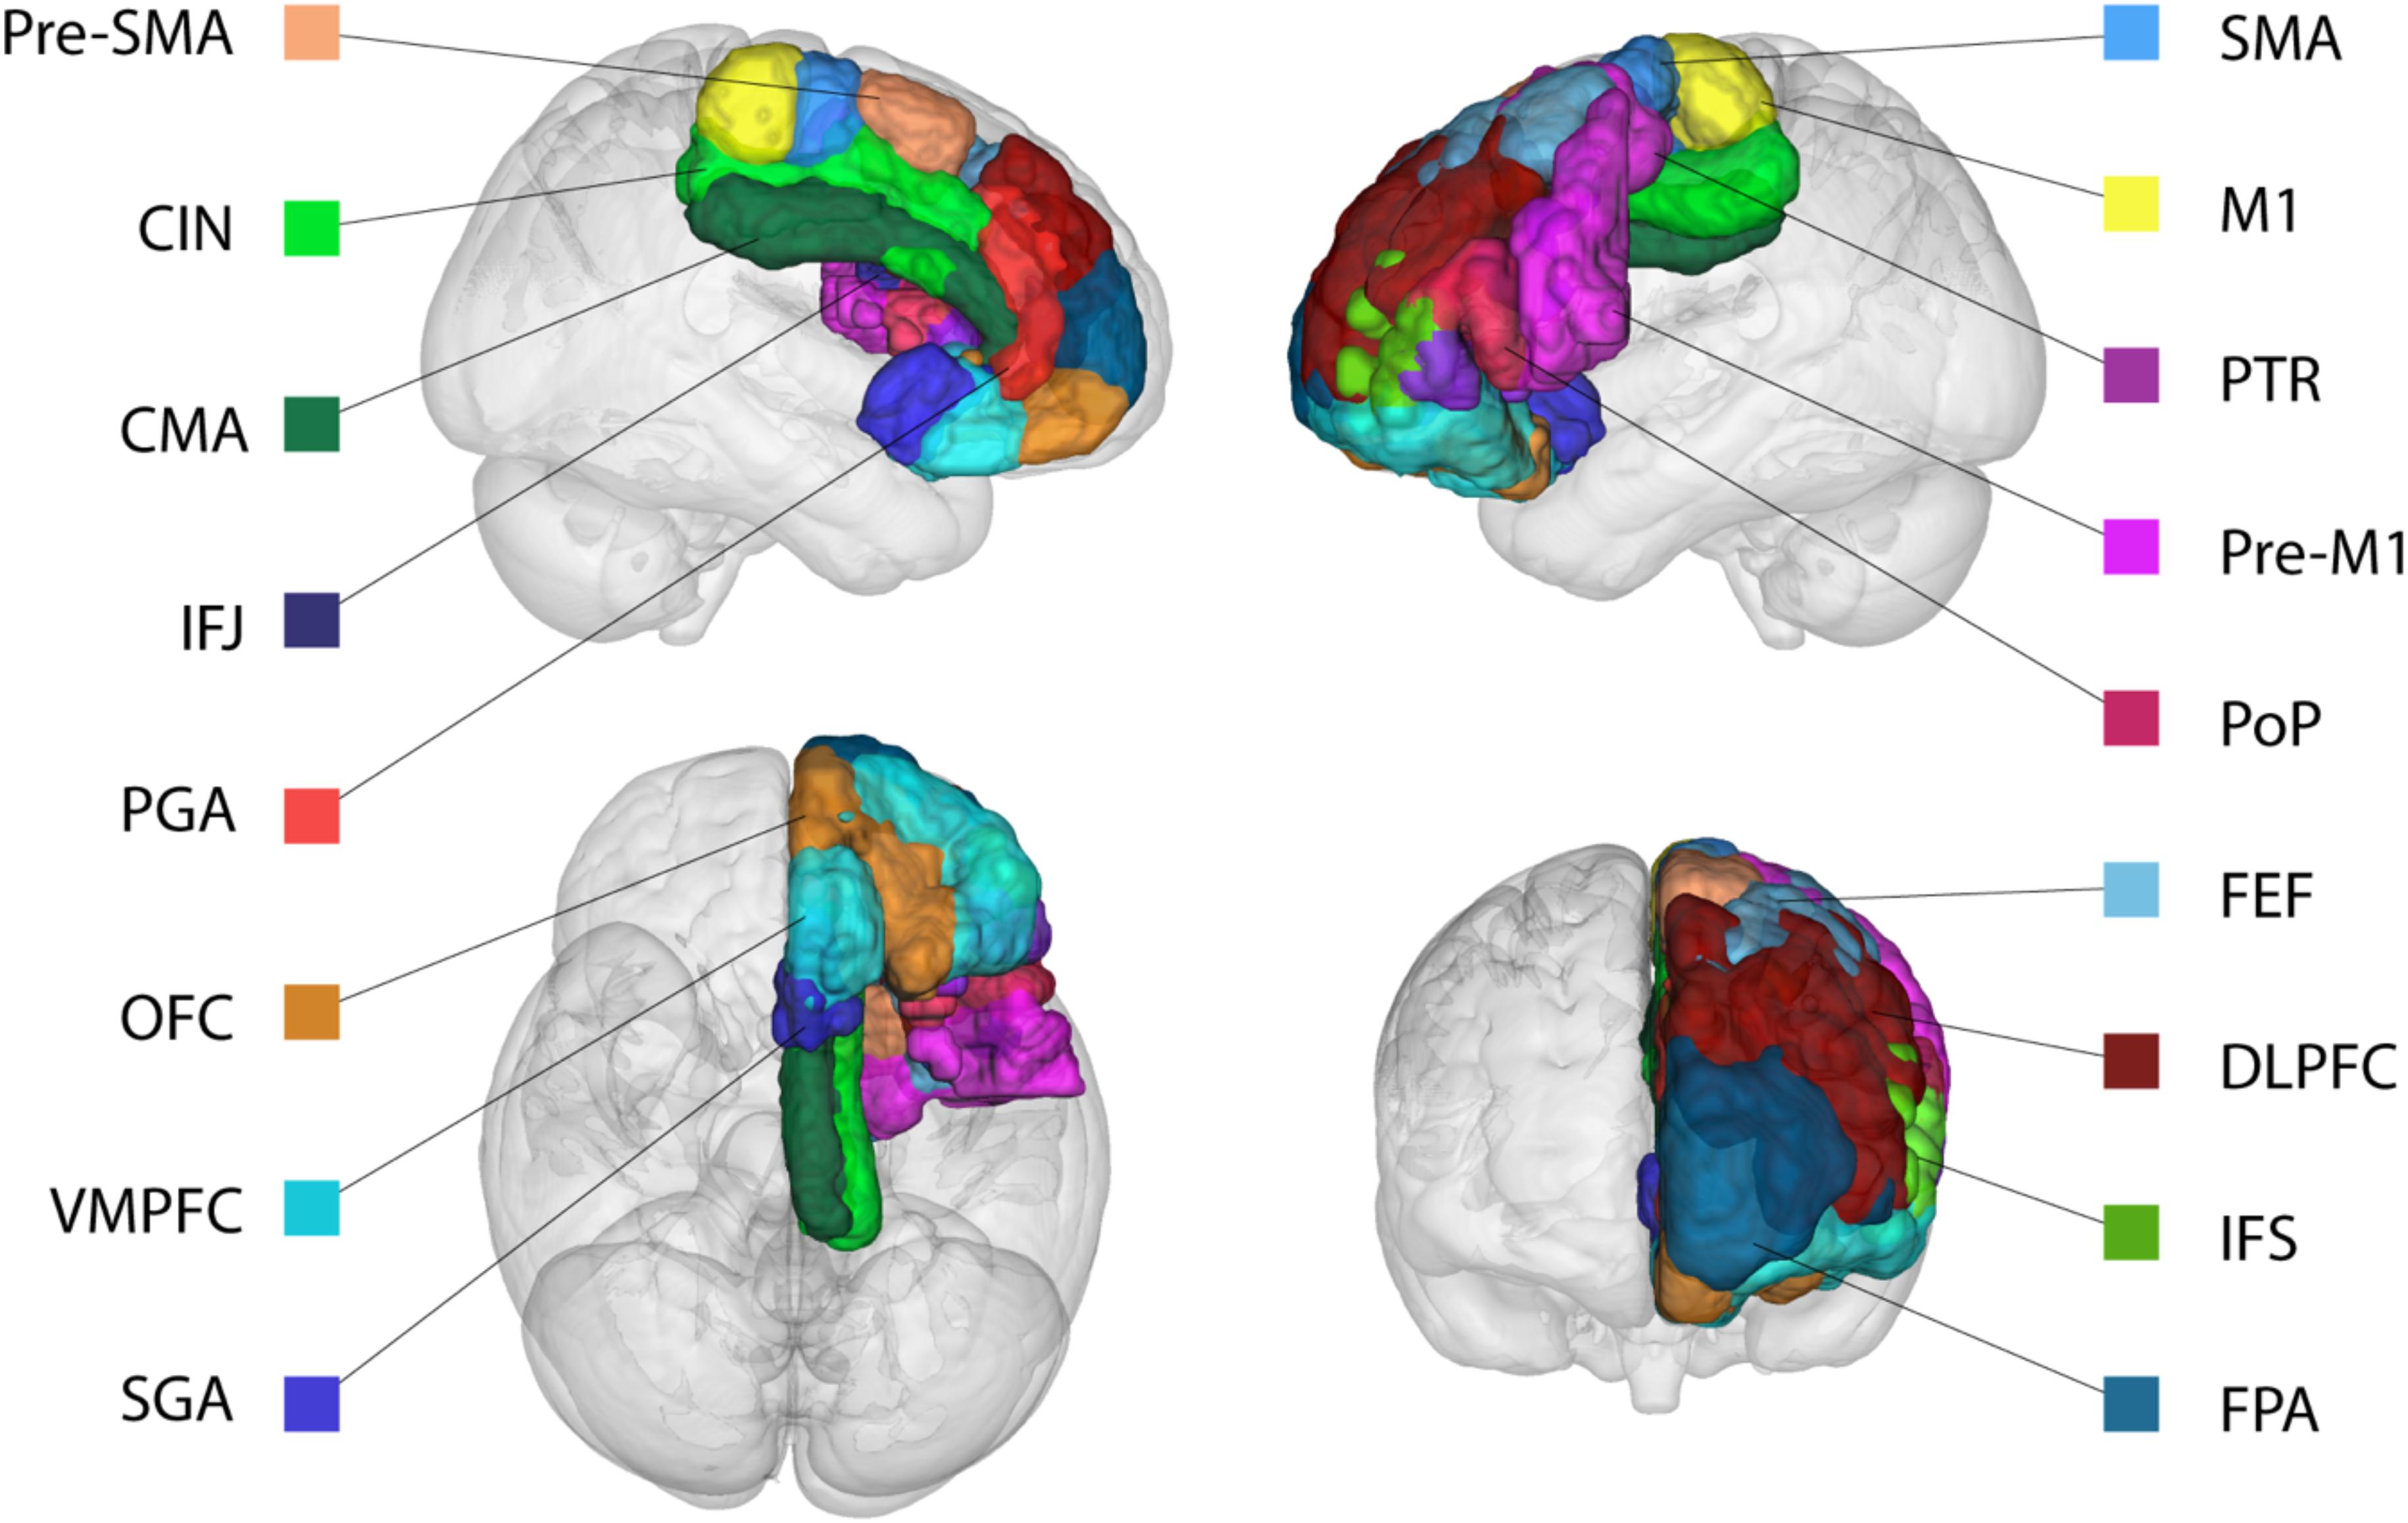
FIGURE 1. Representation of the cortical region of interests (ROIs). Based on the literature search, all areas have a non-human primate homolog and structurally connect to both the STN and STR in non-human primates. For visualization purposes only the ROIs in the left hemispheres are displayed. See Table 1 for abbreviations.
MRI Registration
Subcortical Masks
The average FLASH volume of the three TE’s was linearly registered to the MP2RAGE whole-brain second inversion volume using a mutual information function, trilinear interpolation, and 6 degrees of freedom (DoF) in FLIRT (FSL 5.0.9). The MP2RAGE slab image was linearly registered to the MP2RAGE whole-brain UNI volume using a correlation cost function, trilinear interpolation, and 6 DoF in FLIRT. The MP2RAGE whole-brain was registered to the average rs-fMRI volume using mutual information cost function, trilinear interpolation, and 6 DoF. The MP2RAGE whole-brain was registered to the B0 volume using correlation cost function, trilinear interpolation, and 7 DoF (6 DoF did not result in a reasonable registration). All images were skull stripped before registration using BET (Smith, 2002). All registrations were visually inspected. The resulting transformation matrices from the slab to whole-brain and whole-brain to either the B0 or average rs-fMRI were concatenated and used to transform the STN and STR masks to the either DWI or rs-fMRI space using nearest neighbor interpolation.
Cortical Masks
The skull stripped 1 mm MNI template was linearly registered to the MP2RAGE whole-brain UNI volume using a correlation cost function, trilinear interpolation, and 12 DoF in FLIRT. The resulting transformation matrix were concatenated with the transformation matrix of the whole-brain to either the B0 or average rs-fMRI and used to transform the cortical masks to the either DWI or rs-fMRI space using nearest neighbor interpolation.
DWI Processing
Diffusion weighted image pre-processing and all subsequent analyses were conducted using FSL (version 5.0.10). The four runs were concatenated and the data were corrected for eddy currents and motion. A single volume without diffusion weighting (B0) was extracted from the DWI volume and used to create a brain-mask using BET (Smith, 2002). BedpostX (Behrens et al., 2003) was then run on the pre-processed data to estimate the voxel-wise diffusion parameter distributions. Then probabilistic tractography was used to estimate the tract strength between the cortical and subcortical regions. This was done in both directions using a midline exclusion mask, 5000 samples, a curvature threshold of 0.2, and a distance correction was used to correct for differences in cortical–subcortical distance (Azadbakht et al., 2015). See Table 2 for the average path cortical–subcortical length for the STN and STR separately. The tractography analysis resulted in an image which, for each voxel in the seed mask, contains the number of samples reaching the target mask.
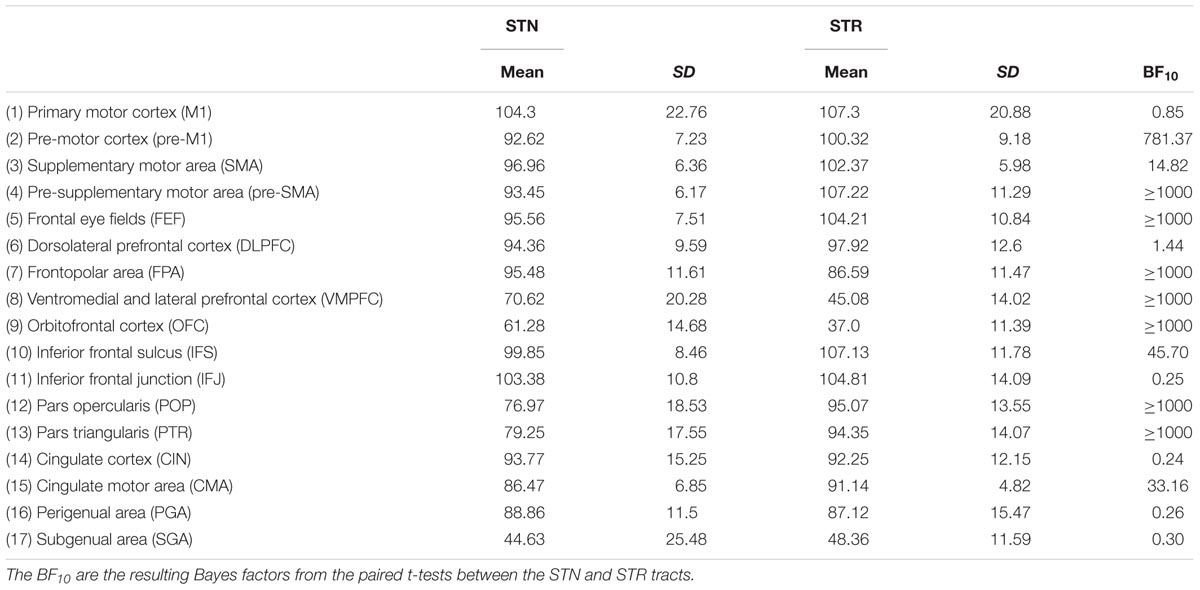
TABLE 2. Summary statistics of the tract lengths between the cortical areas and the STN and STR averaged over hemispheres.
Calculation of Tract Seed Ratio
To remove any spurious connections, the resulting seed images were thresholded so that only voxels which had at least 50 samples were kept. The resulting thresholded masks were divided by the number of samples (n = 5000). This creates a ratio between the number of samples that reached the target versus the total number of samples used per voxel. Finally, an average ratio was calculated for a given seed mask which indicates, on average, how many samples ended in the target region. Tract seed ratio was defined here as the average of the two seed ratios that resulted from the seed-to-target tractography and target-to-seed tractography.
Calculation of Tract Strength
Tract seed ratio can be informative to show differences in connectivity between regions it does not take differences in volume into account. Therefore, in addition to tract seed ratio we also calculate tract strength. To remove any spurious connections, the resulting seed image was thresholded so that only voxels which had at least 50 samples were kept. The number of non-zero voxels was then divided by the total number of voxels in the seed mask, resulting in a ratio indicating the proportion of seed mask voxels that was probabilistically connected to the target mask. This ratio is relative to the volume of the seed mask and compensates for the volumetric differences between the STN and STR. Tract strength was defined as the average of the two ratios that resulted from the seed-to-target tractography and target-to-seed tractography (Forstmann et al., 2010; Boekel et al., 2017). Tract strength differs from tract seed ratio in two ways: the absolute number of samples is not taken into account but the volumes of the seed masks are. Note that the term tract strength here is used to index a probability density function (PDF), quantifying the ratio of how many streamlines directly and continuously commence from a seed region and terminate at a target area. This PDF is a commonly used measure for inferring the strength of structural white matter tracts (Behrens et al., 2007; Khalsa et al., 2014; van den Bos et al., 2014). While the PDF is a commonly used measure for inferring the strength of white matter tracts, it is not without its limitations. For instance, the “amount” of probability or confidence we have in a tract can be influenced by the distance between two areas. As errors and noise accumulate over time, shorter connections would result in higher tract strengths (Jbabdi and Johansen-Berg, 2011). Therefore we used a distance correction. While the tract strength ratio is normalized for volume and a distance correction was applied, the direct statistical comparisons between the STN and STR should be interpreted with caution.
rs-fMRI Processing
The rs-fMRI data were corrected for B0 field inhomogeneities using fsl_prepare_fieldmap and FUGUE as implemented in FSL (version 5.0.9). Subsequently, the rs-fMRI data were motion-corrected using MCFLIRT. The average time series of each cortical and subcortical ROI were correlated using a Pearson correlation, and the correlation coefficient was used for further analyses.
Statistics
The outlier criteria were three times the interquartile range. All statistics were done using the Bayesian tests implemented in the BayesFactor toolbox (Morey et al., 2014) in R (R Core Team, 2016). The benefit of using Bayesian statistics is that it allows the quantification of evidence for the null hypothesis (H0: the STN and STR do not differ in tract strength or rs-fMRI correlation) versus the alternative hypothesis (H1: the STN and STR do differ in tract strength or rs-fMR correlation). We will use the labels as proposed by Jeffreys (1961) and adjusted by Wetzels and Wagenmakers (2012) and are shown in Table 3. Bayes factors which are larger or equal to 1000 will be noted as ≥1000. The tract strengths and correlation coefficients were compared using a JZS Bayesian mixed effect model with subcortical region and cortical region as independent variables, and participant and hemisphere as random factors with default prior scales as implemented in the BayesFactor toolbox.
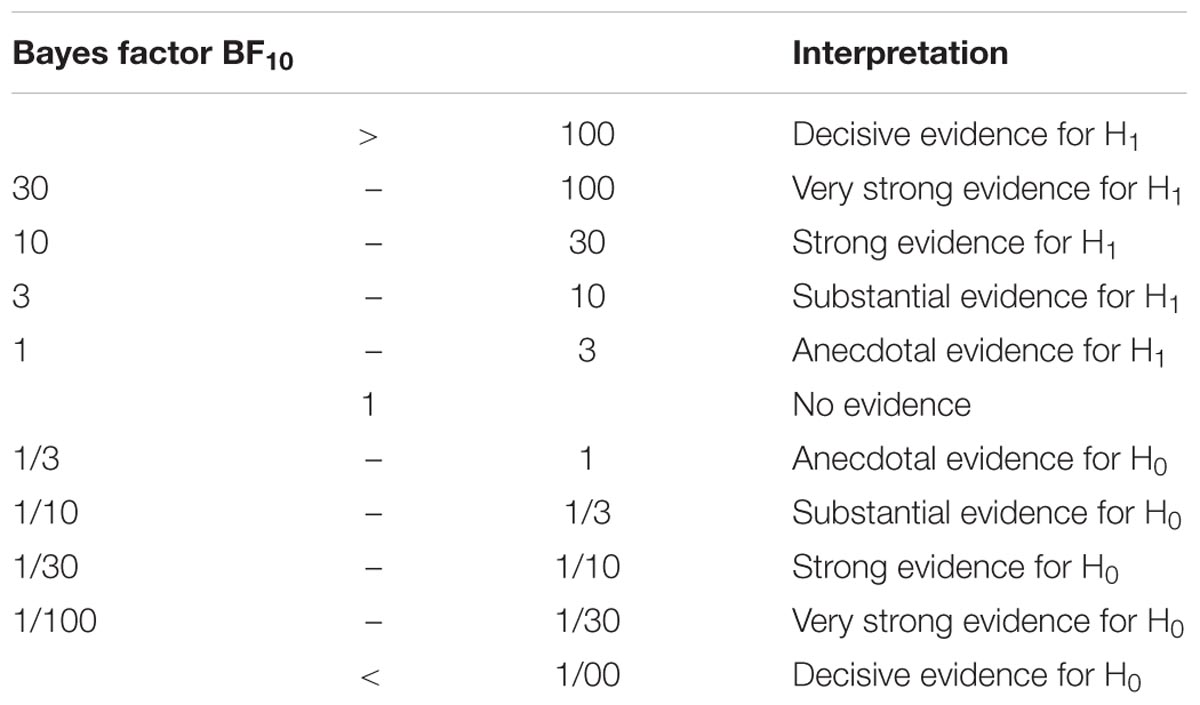
TABLE 3. Suggested categories for interpreting the Bayes factors.
Open Science
All corresponding analysis scripts can be found on https://osf.io/s46hr/
Results
Average Seed Ratio Differences Between the STN and STR
The outlier analysis indicated that for a single tract [STN – orbitofrontal cortex (OFC)] there were four outliers. These data points were removed from any further analysis. The JZS Bayesian mixed effect model revealed that the model with main effects for subcortical structure and cortical structures, as well as an interaction between these two variables, is preferred over the model without the interaction, by a Bayes factor of >1000. Therefore, the data provide decisive evidence that the average number of samples reaching the target is generally higher for the tracts between the STN and cortex than for the STR. Pairwise post hoc comparisons between the STN and STR are given in Table 4.
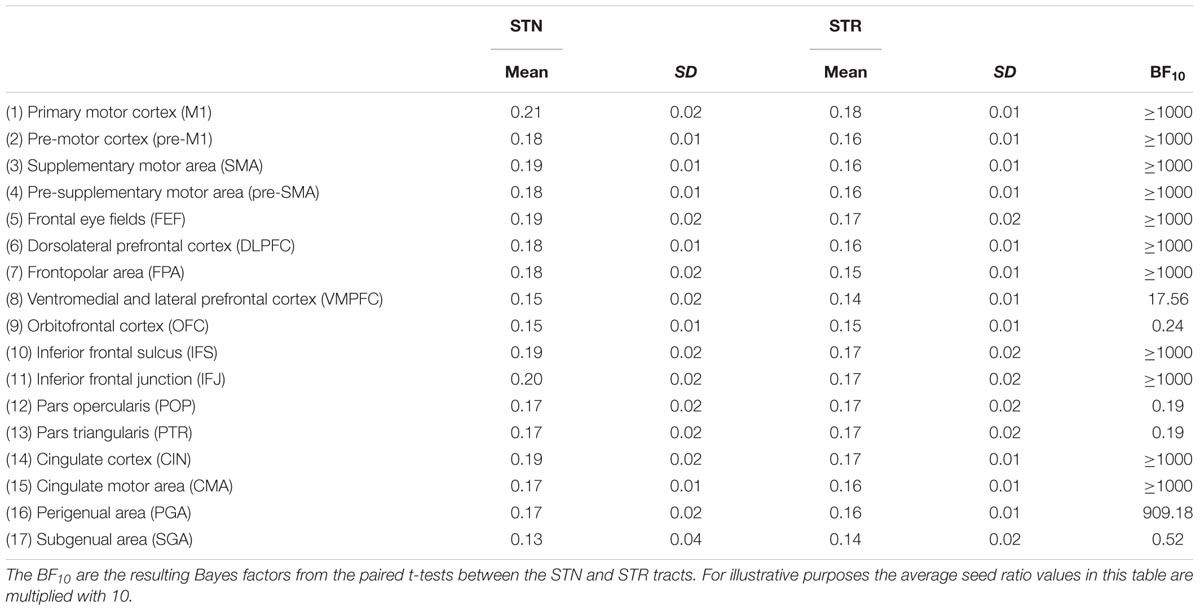
TABLE 4. Summary statistics of the average seed ratios for the STN and STR to cortex averaged over hemispheres.
Tract Strength Differences Between STN and STR
The outlier analysis indicated that for a single tract [STR – perigenual area (PGA)] there was a single outlier. This data point was removed from any further analysis. The JZS Bayesian mixed effect model revealed that the model with main effects for subcortical structure and cortical structures, as well as an interaction between these two variables, is preferred to the model without the interaction with a Bayes factor of >1000. Therefore, the data provide decisive evidence that the tract strength between the STN and cortex is generally lower than for the STR and the cortex. Note that this was the case even though the absolute number of samples reaching the target was higher for the STN.
The post hoc comparisons indicated a few exceptions, namely that there was decisive evidence for the STN for higher tract strengths toward the ventromedial and lateral prefrontal cortex (VMPFC) and OFC. There was substantial evidence for the STN and the STR showing similar tract strengths to the pre-supplementary motor area (pre-SMA). There was only anecdotal evidence that tract strengths for the PGA and subgenual area (SGA) were similar between the STN and STR (see Table 5 for the paired t-tests between the STN and STR per tract and Figure 2).
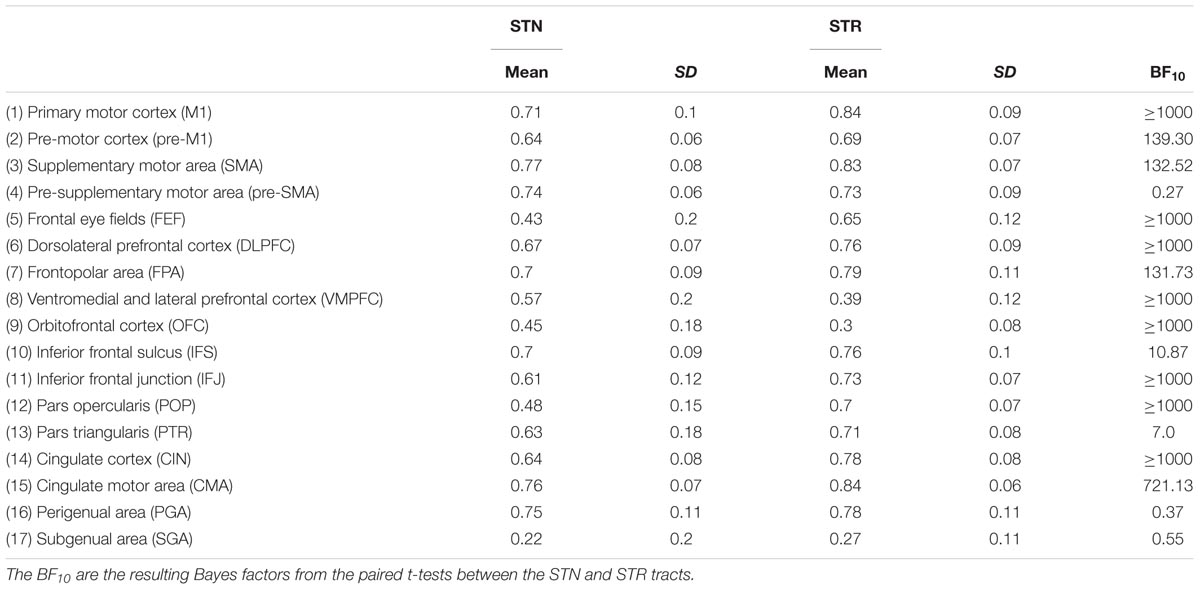
TABLE 5. Summary statistics of the tract strengths for the STN and STR to cortex averaged over hemispheres.
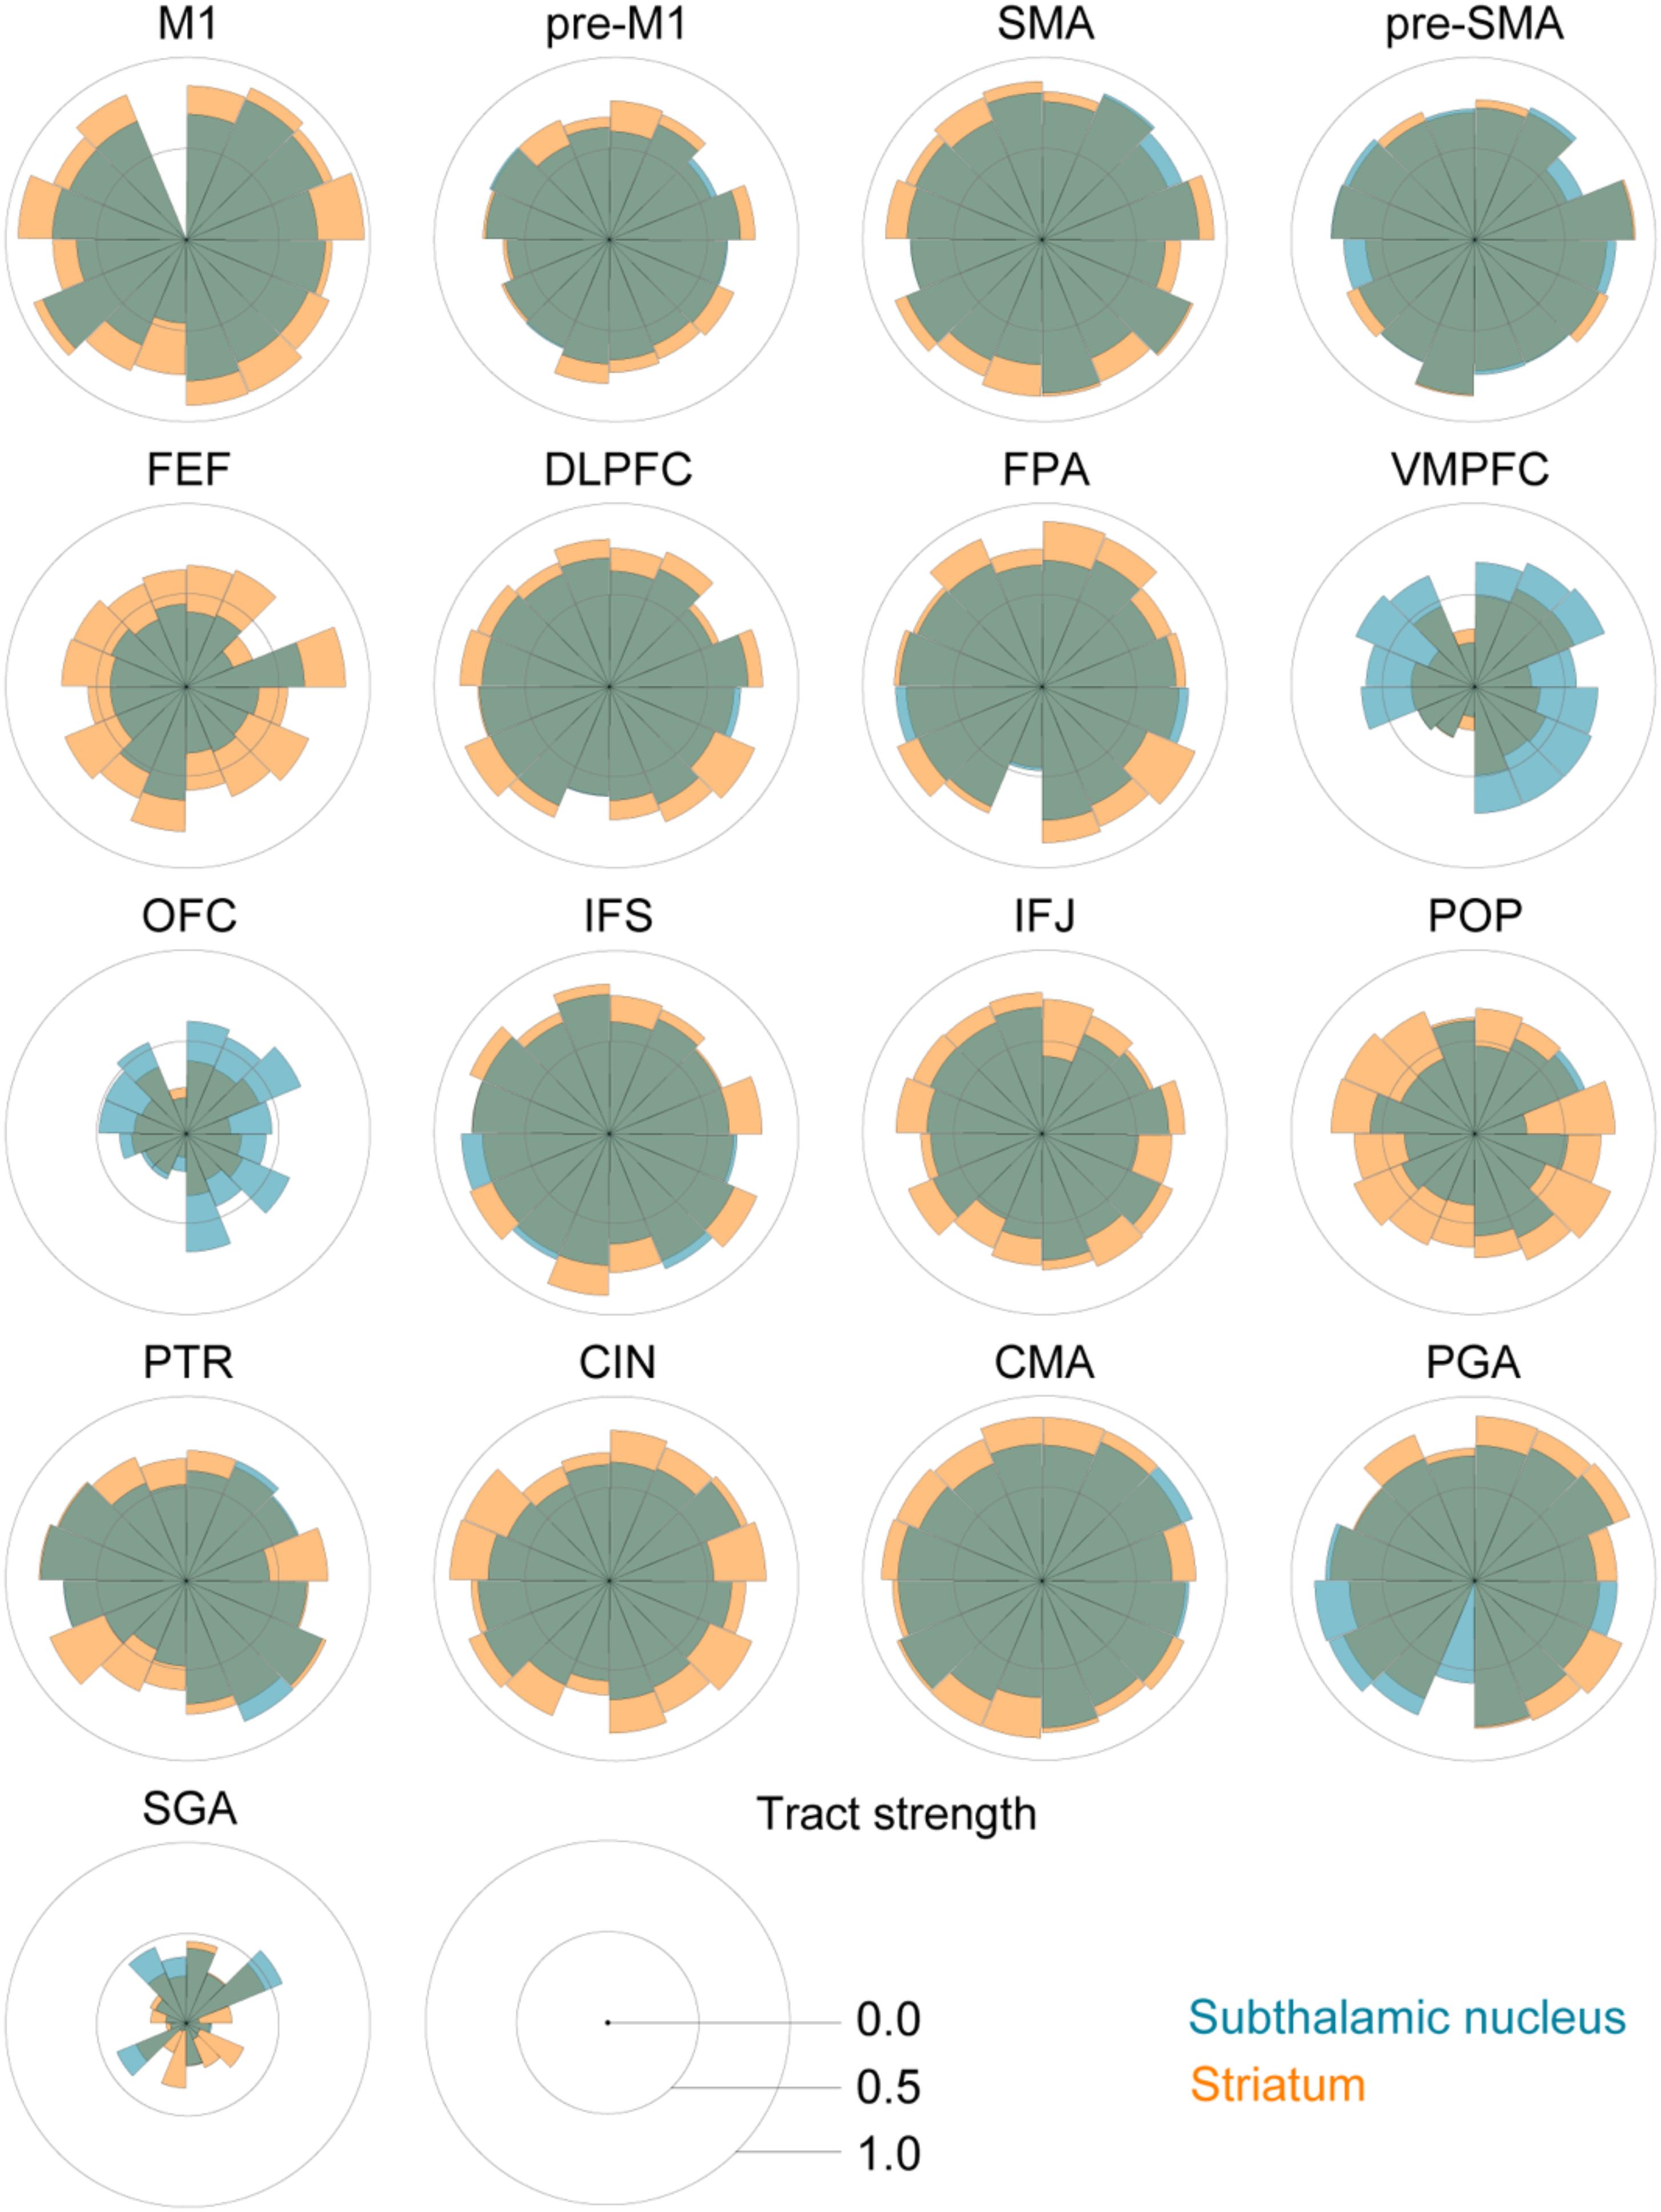
FIGURE 2. Star plots of the tract strengths between the STN, STR, and the different cortical regions per participant. The STN is color coded using blue, the STR using orange, and both tracts are plotted with 50% opacity. Each segment corresponds to an individual participant.
The main effect of cortical areas and the interaction indicated that various cortical areas have different tract strengths to the subcortex and that this tract strength varied per cortical area and subcortical structure.
As illustrated in Figure 1, the cortical masks used in this study are rather large. It might therefore be the case that the cortical areas projecting to the STN did not overlap with the cortical areas projecting to the STR. We illustrated this by backprojecting the thresholded cortical masks from individual B0 to MNI standard space where a probabilistic map was created across participants (see Figure 3). It seemed that the cortical region projecting to the STR that had the highest overlap across participants is the same region that also projects to the STN.
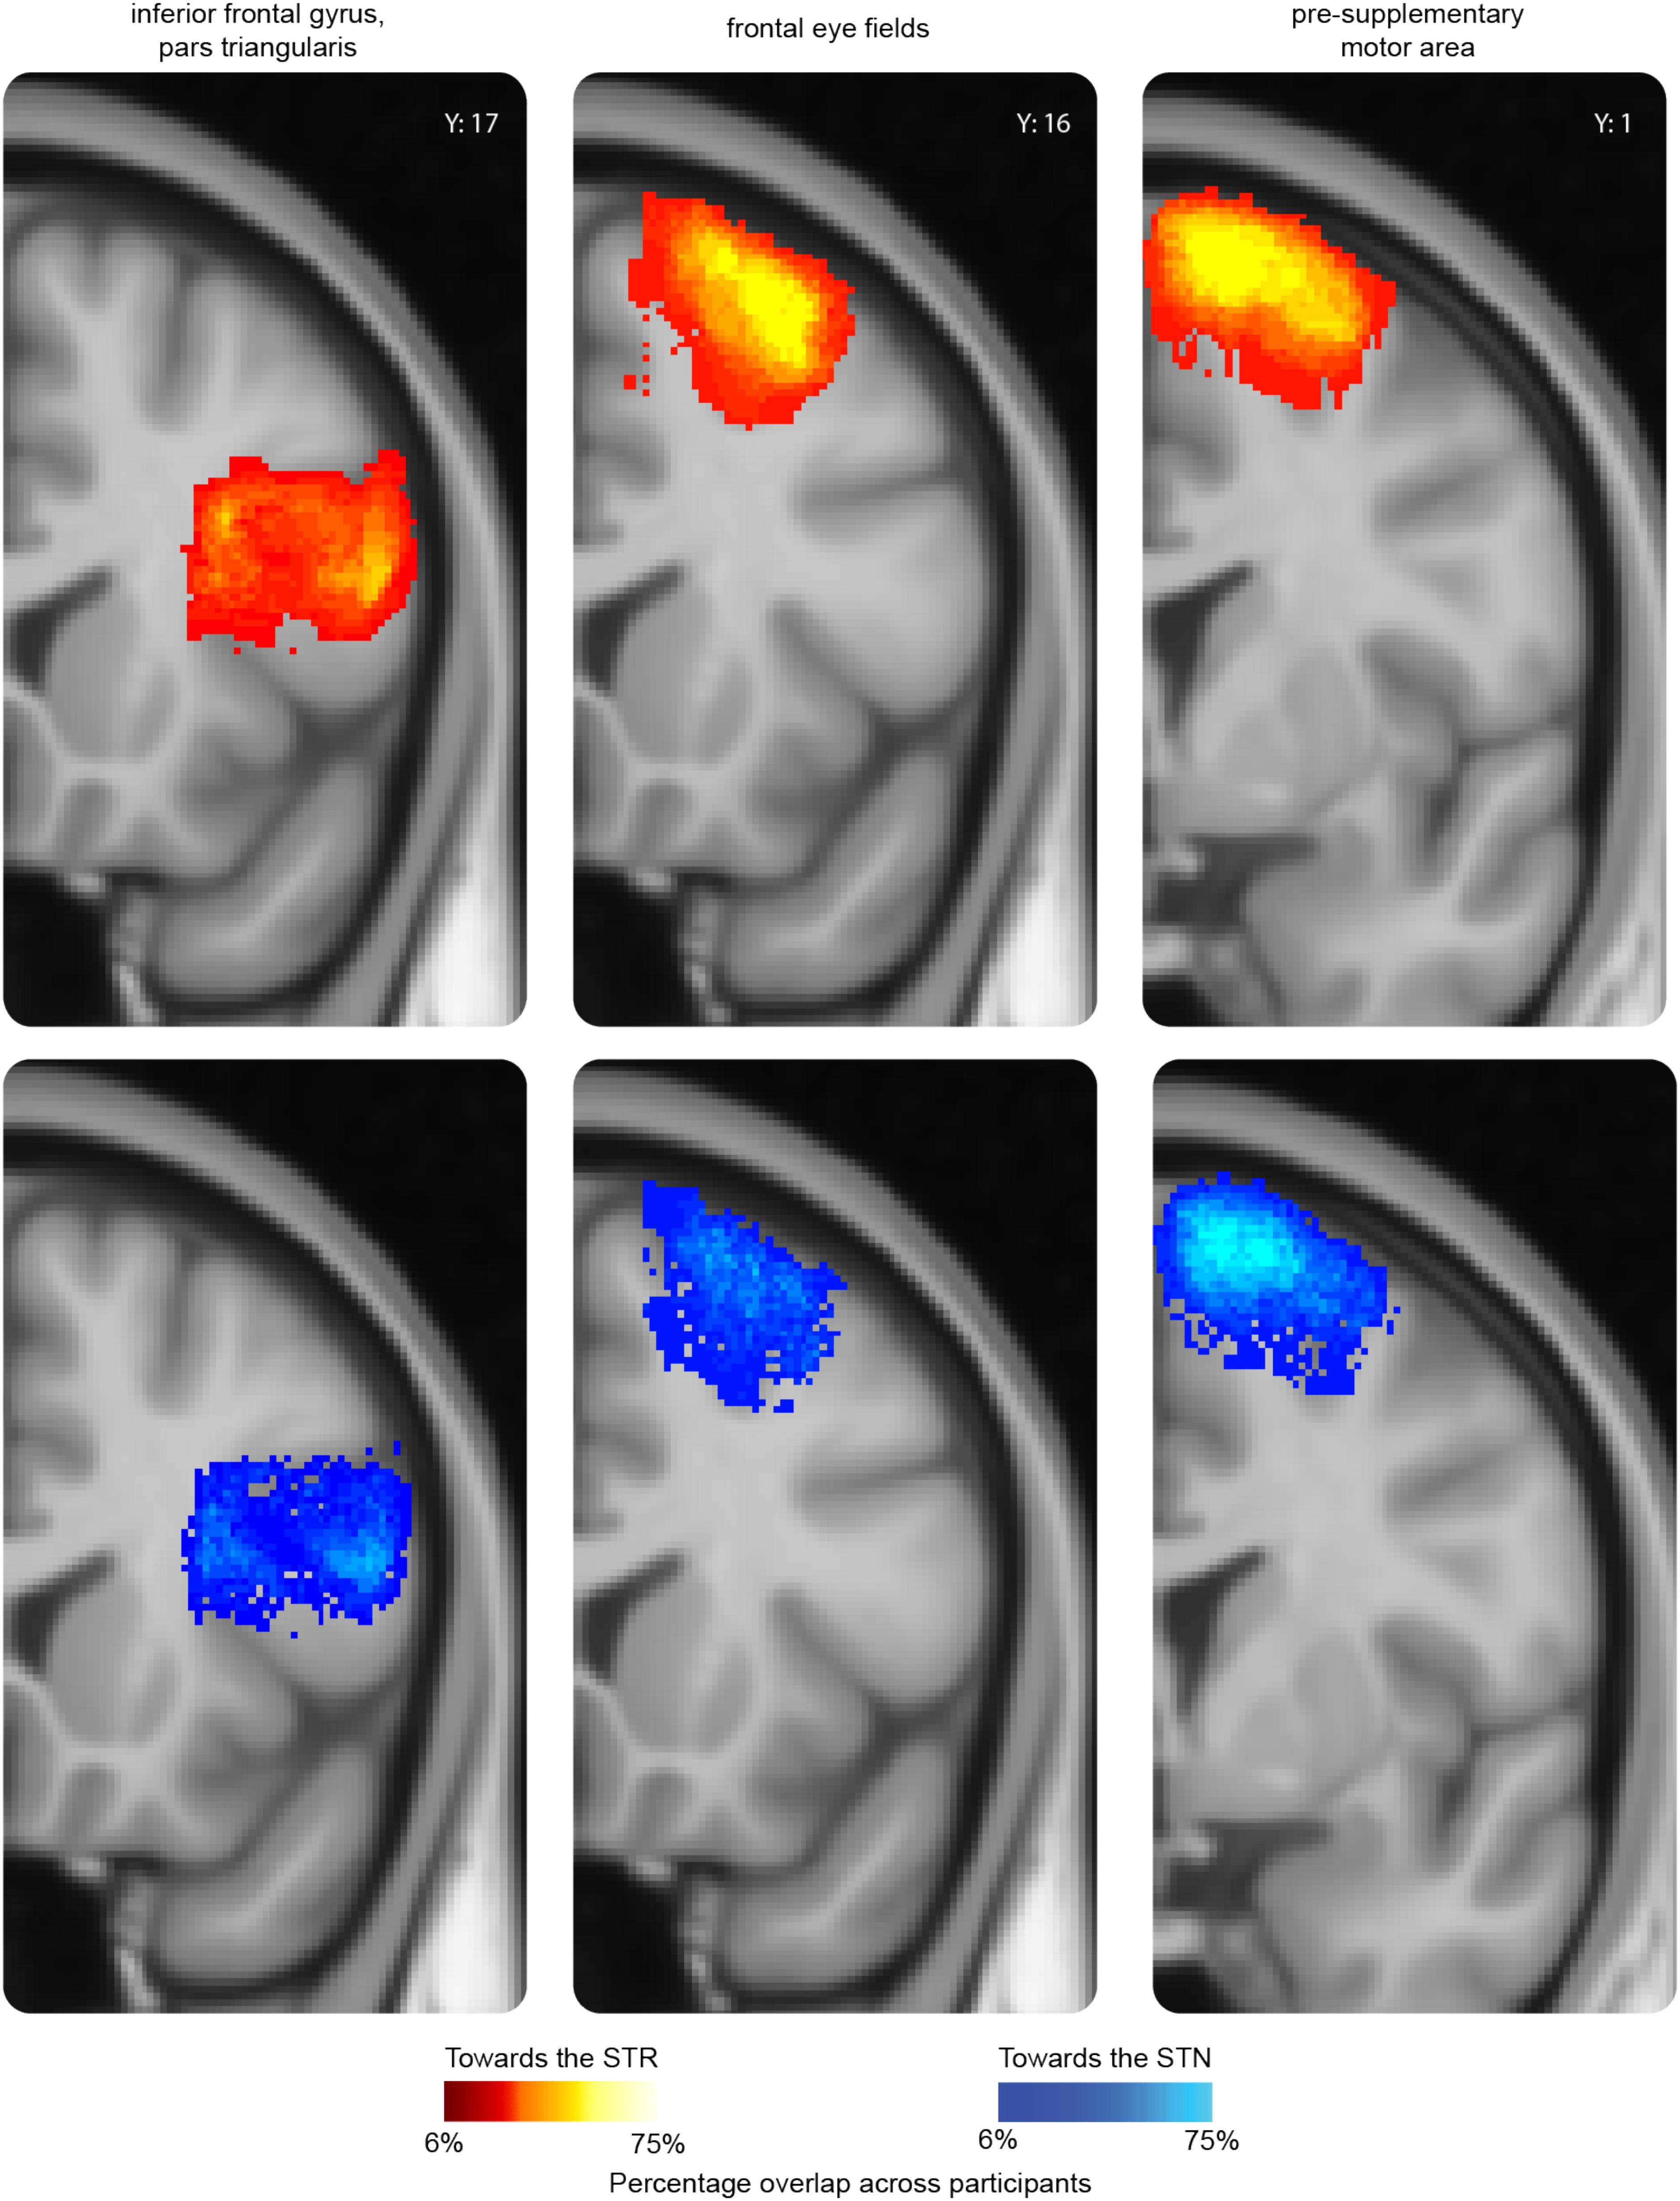
FIGURE 3. A probability map of three representative cortical regions projecting to the subcortex. For the pars triangularis (PTR), frontal eye fields (FEF), and pre-supplementary motor area (pre-SMA), a probability map was created using the individual thresholded seed masks. The thresholded seed masks only include those voxels which contained at least 50 samples in the tractography analysis. To be able to compare the results across participants, the thresholded seed masks were transformed back into MNI-standard space using the inverted transformation matrices. The color intensity indicates the overlap across participants. In red-yellow the probability map of the thresholded seed masks toward the STR; in blue the probability map of the thresholded seed masks toward the STN. The y value corresponds to the MNI coordinate system.
Tract Strength Differences for the STN and STR Separately
To test for differences between tracts connecting subcortical areas, i.e., STN and STR, with the cortex, Bayesian paired t-tests were used (see Table 6 for all the resulting Bayes factors). The paired t-tests indicated that the STN and the STR shared a number of similarities in their connectivity fingerprint to cortex.
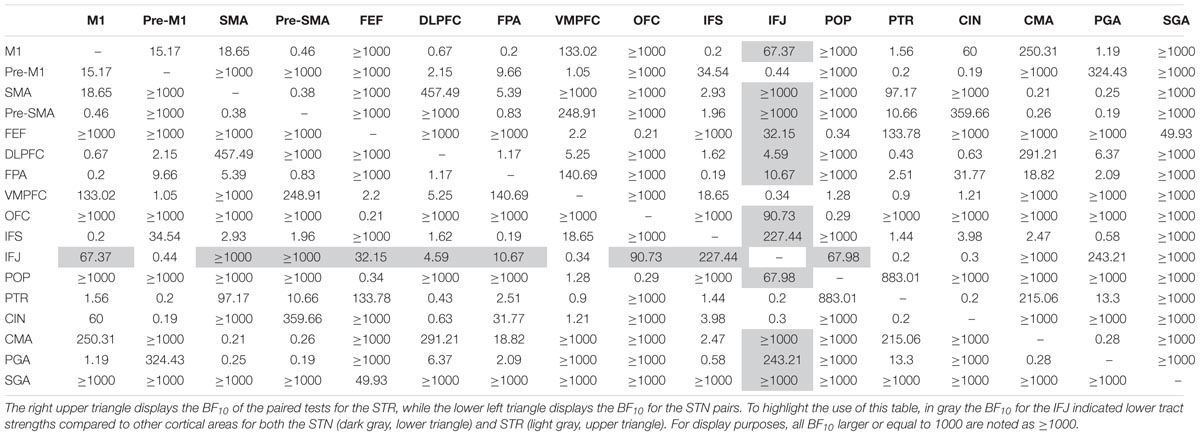
TABLE 6. Paired t-tests within the STN and STR tracts.
Compared to other cortical areas, the SGA, frontal eye fields (FEF), OFC, and the pars opercularis of the inferior frontal gyrus (POP) had lower tract strengths toward the STN (SGA: 16 out of 16 paired t-tests indicated substantial or more evidence in favor of lower tract strengths; FEF: 12 out of 16 paired t-tests indicated substantial or more evidence in favor of lower tract strengths; OFC: 13 out of 16 paired t-tests indicated substantial or more evidence in favor of lower tract strengths; and POP: 12 out of 16 paired t-tests indicated substantial or more evidence in favor of lower tract strengths). Similarly, compared to other cortical areas, the SGA, FEF, OFC, and POP had lower tract strengths toward the STR (SGA: 16 out of 16 paired t-tests indicated substantial or more evidence in favor of lower tract strengths; FEF: 12 out of 16 paired t-tests indicated substantial or more evidence in favor of lower tract strengths; OFC: 13 out of 16 paired t-tests indicated substantial or more evidence in favor of lower tract strengths; and POP: 11 out of 16 paired t-tests indicated substantial or more evidence in favor of lower tract strengths).
There were also a number of cortical areas that had relatively higher tract strengths toward both the STN and STR. Compared to the other cortical areas, the SMA, cingulate motor area (CMA), PGA, and pre-SMA had higher tract strengths toward the STN (SMA: 12 out of 16 paired t-tests indicated substantial or more evidence in favor of higher tract strengths; CMA: 12 out of 16 paired t-tests indicated substantial or more evidence in favor of higher tract strengths; PGA: 10 out of 16 paired t-tests indicated substantial or more evidence in favor of higher tract strengths; pre-SMA: 10 out of 16 paired t-tests indicated substantial or more evidence in favor of higher tract strengths). Similarly, compared to the other cortical areas, the CMA and SMA had higher tract strengths toward the STR (CMA: 12 out of 16 paired t-tests indicated substantial or more evidence in favor of higher tract strengths; SMA: 12 out of 16 paired t-tests indicated substantial or more evidence in favor of higher tract strengths).
rs-fMRI Correlation Differences Between STN and STR
There were no outliers for the rs-fMRI correlations. The JZS Bayesian mixed effect model revealed that the model with main effects for subcortical structures and cortical structures, as well as an interaction between these two variables, is preferred to the model without the interaction with a Bayes factor of 130.74. The data therefore provide decisive evidence that the resting-state BOLD correlation between the STN and cortex is generally lower than for the STR and cortex.
The post hoc comparisons indicate that overall the STR has a stronger rs-fMRI correlation to cortical areas compared to the STN (see Table 7 for the paired t-tests between the STN and STR per tract, as well as Figure 4). It is unlikely that this difference in rs-fMRI is due to the T2∗ differences because the rs-fMRI sequence used short TE’s optimized for the human subcortex at 7T (Keuken et al., 2015, 2017; de Hollander et al., 2017; Mestres-Missé et al., 2017). It might, however, be the case that there is more physiological noise in and around the STN, resulting in lower rs-fMRI correlations with cortex (Altman and Krzywinski, 2015). Therefore, the direct comparison between the STN and STR as reported in Tables 3, 4 should be interpreted with caution.
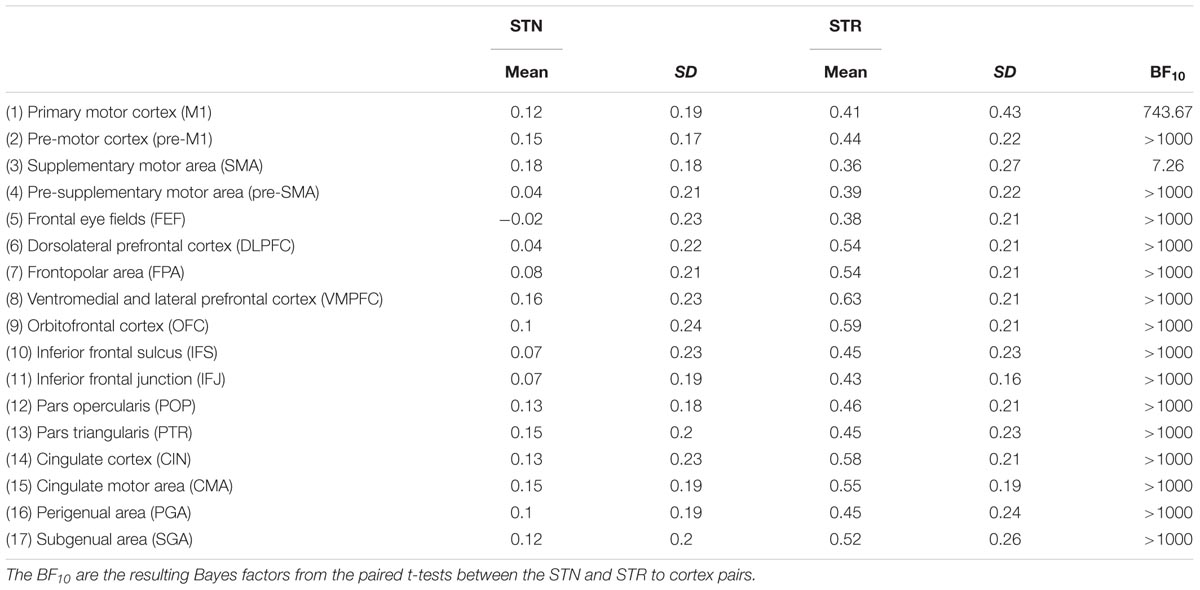
TABLE 7. Summary statistics of rs-fMRI correlation coefficient for the STN and STR to cortex averaged over hemispheres.
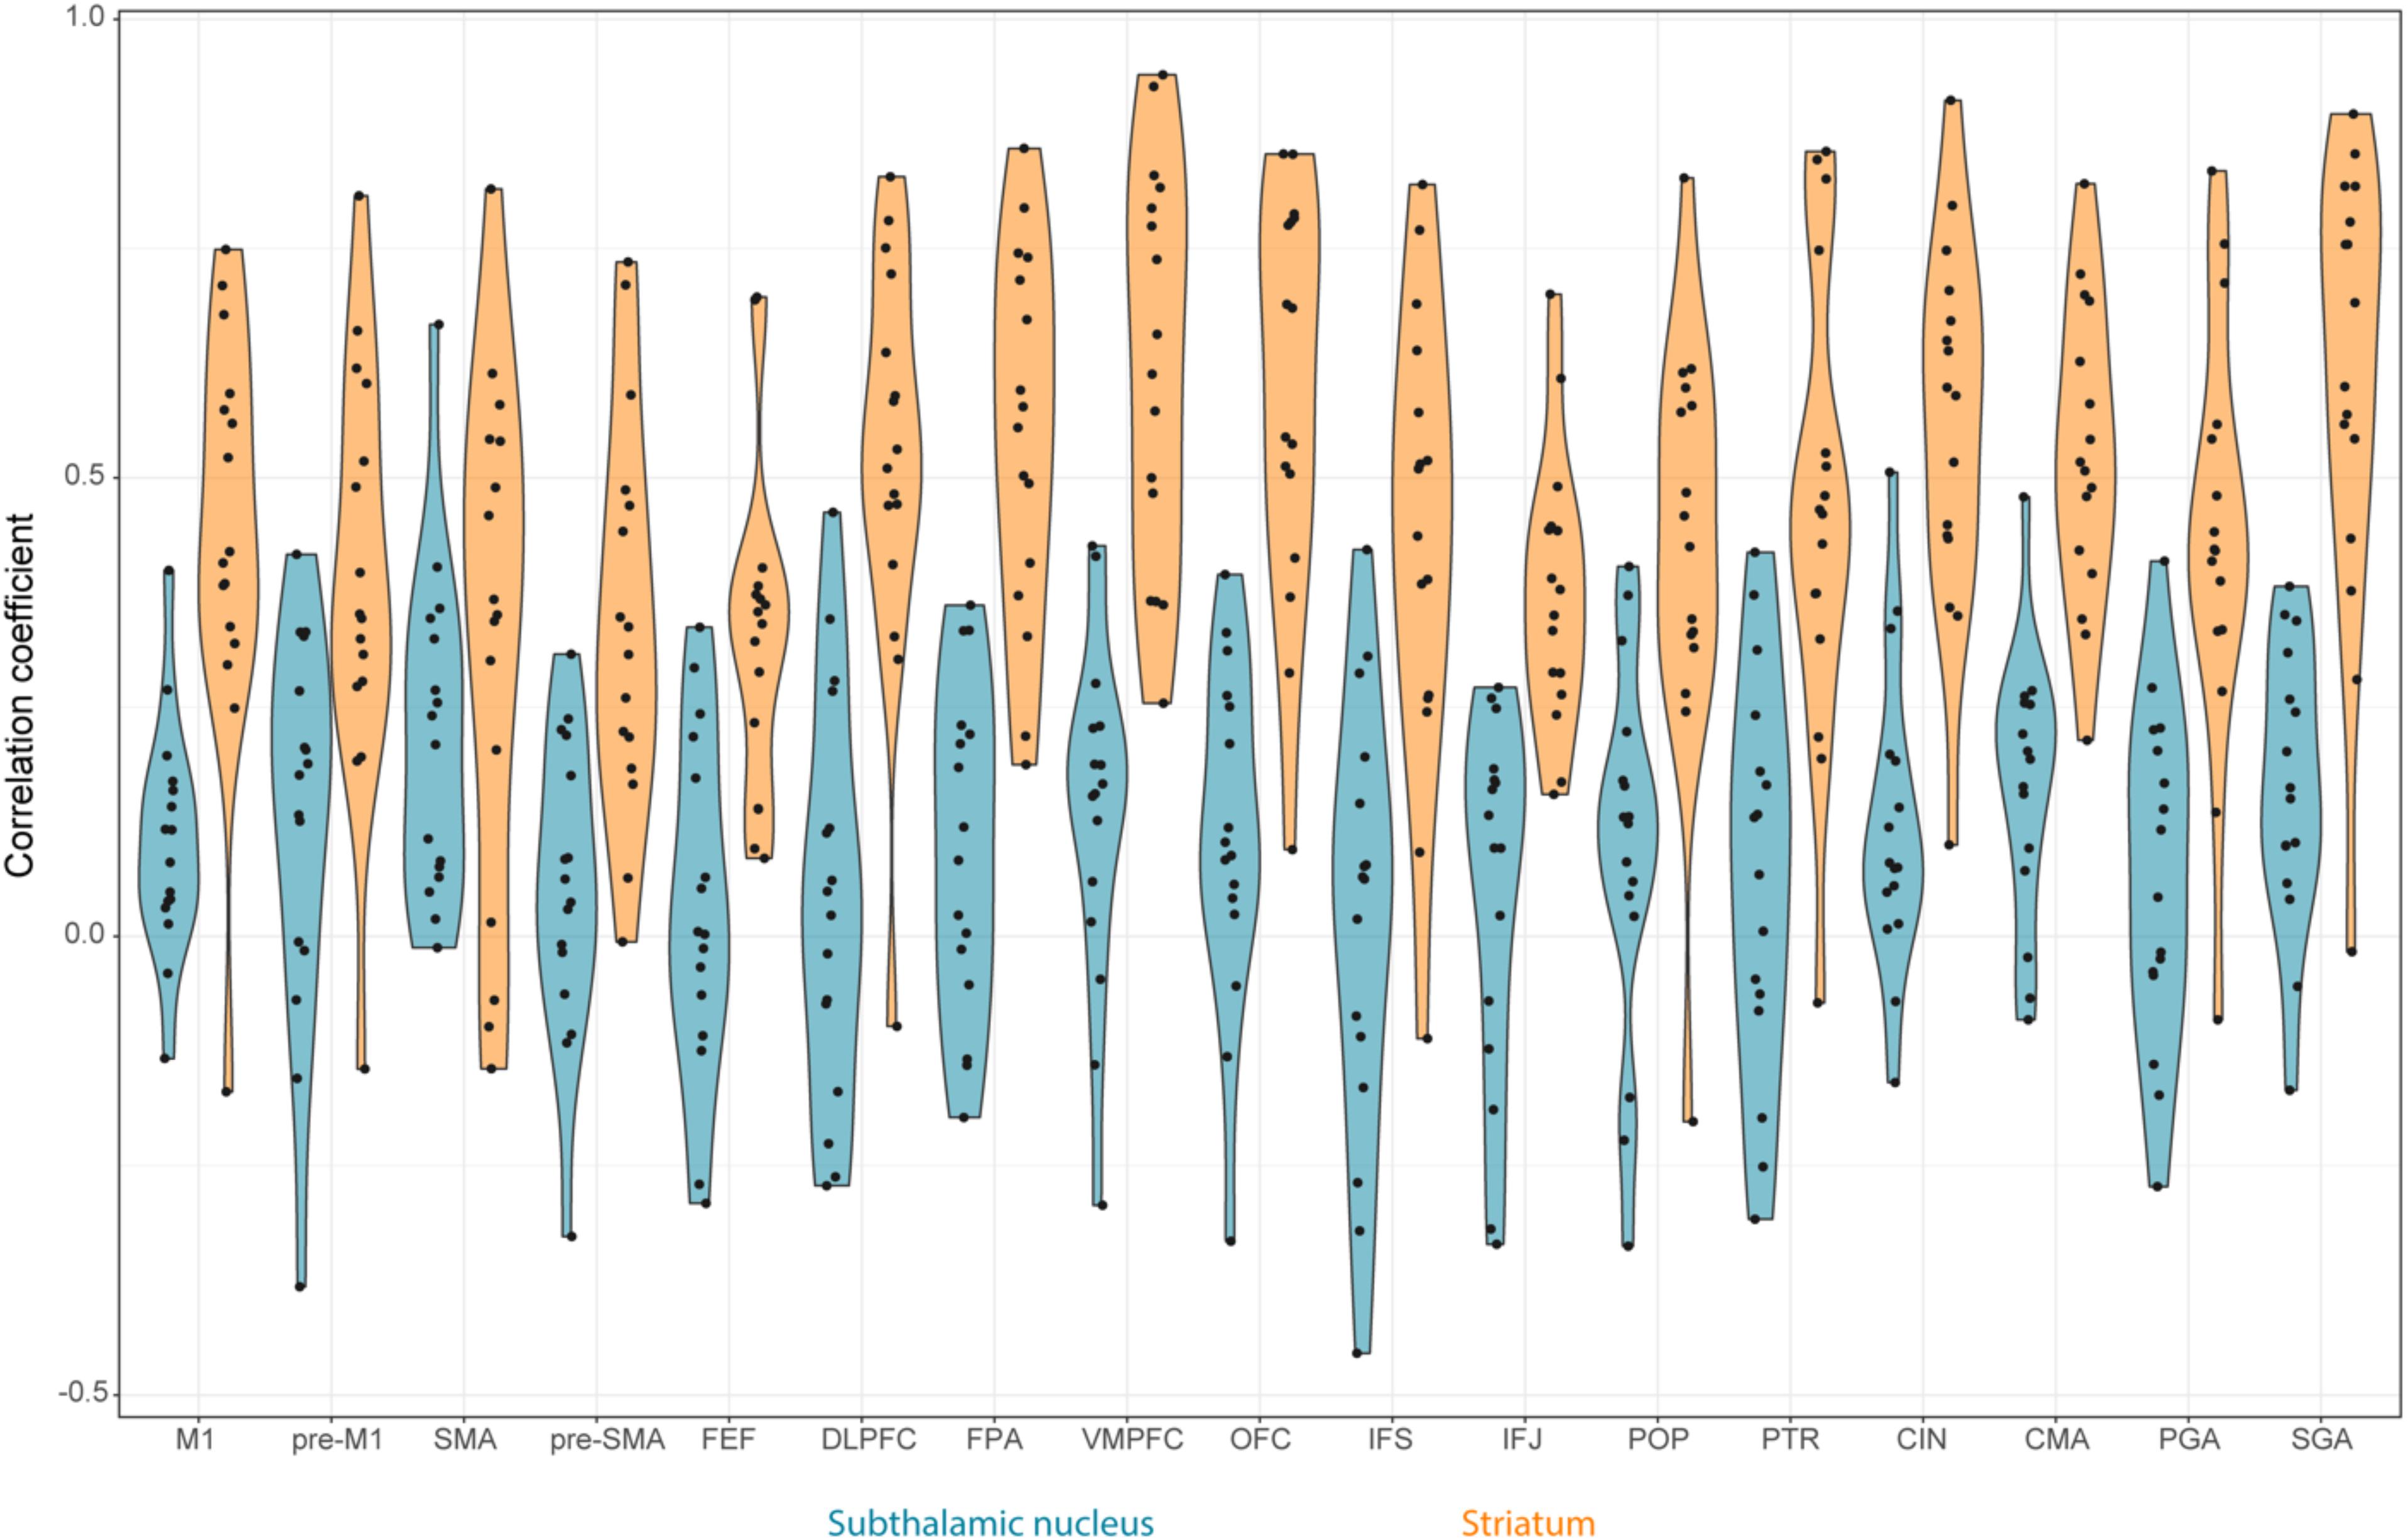
FIGURE 4. Violin plots of the rs-fMRI correlation between STN, STR, and the different cortical regions per participant. The STN is color coded using blue and the STR using orange. The black circles correspond to the individual participants.
Correlation Differences Within the STN and STR
To test which of the resting-state correlations between the subcortical areas and cortex differed from each other, Bayesian paired t-tests for the STN and STR were run separately. The results indicated that the STN had a different resting-state fingerprint than the STR.
Contrary to the tract strengths, most of the rs-fMRI correlations between the STN and cortical ROIs did not differ from each other (see Table 8 for all the resulting Bayes factors). This was the case for the primary motor area (M1) (11 out of 16 paired t-tests indicated substantial or more evidence in favor of no difference); SGA (10 out of 16 paired t-tests); pre-M1 (9 out of 16 paired t-tests); POP (9 out of 16 paired t-tests); the inferior frontal gyrus pars triangularis (PTR; 8 out of 16 paired t-tests); CMA (8 out of 16 paired t-tests); and OFC (8 out of 16 paired t-tests). There was a notable exception for the FEF where compared to the other cortical areas the resting-state correlation with the STN was lower (13 out of 16 paired t-tests indicated substantial or more evidence in favor of a lower correlation).
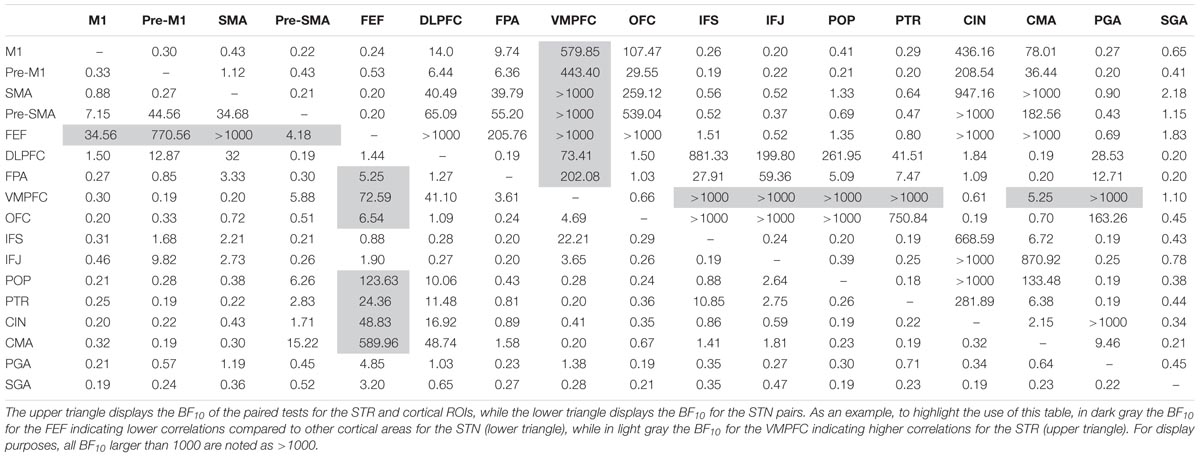
TABLE 8. Paired t-tests for the resting-state correlation between the STN, STR, and the cortical ROIs.
Contrary to the STN, the rs-fMRI correlations between the STR and the cortical ROIs seemed more heterogeneous. Compared to the other cortical areas, there were a number of regions which had a higher rs-fMRI correlation with the STR such as the ventral medial prefrontal cortex (VMPFC; 13 out of 16 paired t-tests indicated substantial or more evidence in favor of a higher correlation); OFC (10 out of 16 paired t-tests indicated substantial or more evidence in favor of a higher correlation); and the cingulate cortex (CIN; 10 out of 16 paired t-tests indicated substantial or more evidence in favor of a higher correlation).
Discussion
This study set out to investigate the connectivity fingerprint of the STN and STR with the cortex using diffusion and rs-fMRI. The tract strengths indicate that for most cortical areas tested, the STR exhibits relatively higher tract strengths than the STN. It is unlikely that the lower tract strength for the STN was due to higher noise in the tractography as the absolute seed ratios were actually higher for the STN. For the rs-fMRI data, the correlations between the cortical ROI’s and the STR were also consistently found to be higher than those for the STN. This finding is in line with the previous literature that notes that while the STN and STR are indeed directly connected to similar cortical areas, STN connections are more sparsely present (Alexander et al., 1986; Albin et al., 1989; Frankle et al., 2006).
There were, however, two notable exceptions for tract strengths. Namely for the OFC and VMPFC, where a higher tract strength was found for the STN relative to the STR. The OFC and VMPFC are two cortical regions thought to be essential for reward processing, choice bias, and mood (Hollerman et al., 2000; Haber and Knutson, 2009; Mulder et al., 2013; Lim et al., 2015). Reward-oriented behaviors require many mental processes, including motor, sensory, learning, memory, cognitive, executive, decision-making, motivational, and emotional functions (Crocker et al., 2013). Given the multifaceted and complex nature of limbic processes, having strong connections to the STN might be explained as a direct modulator of motor-related output for goal directed behaviors (Mallet et al., 2008; Espinosa-Parrilla et al., 2013). Contrary to the structural connectivity, the rs-fMRI connectivity for the OFC and VMPFC was higher toward the STR than toward the STN. This is somewhat puzzling as previous comparisons between DTI and rs-fMRI indicate that increased structural connectivity would predict higher functional connectivity. Whether this finding indicates that the functional connectivity between the OFC, VMPFC, and STR is driven via a hidden third region remains unclear (Damoiseaux and Greicius, 2009).
Overall the relative structural connectivity fingerprint of the cortex toward the STN is very similar to the STR. Compared to the other tested cortical areas, both subcortical areas have relatively low tract strengths toward the SGA, FEF, OFC, and POP. Both the SGA and OFC are thought to be involved in limbic processing. The FEF are largely governed by attentional mechanisms (Schafer and Moore, 2007), and are essential for visuospatial attention, visual awareness, and perceptual modulation such as the preparation and execution of eye movements (Bizzi, 1968) as well as smooth pursuit (MacAvoy et al., 1991) and fixation (Izawa et al., 2009). Eye movement in response to an external cue will often form the basis for action selection and appropriate motor response, and is crucial to early inhibition processes (Jantz et al., 2017). In addition it has been shown that high frequency stimulation of the STN in Parkinson’s disease patients is shown to modulate saccadic latencies (Temel et al., 2008). It was therefore surprising to also find a low functional connectivity between the STN and the FEF.
Relatedly, we found a lack of white matter connectivity between the STN, STR, and the inferior frontal gyrus pars opercularis. This was somewhat surprising given the functional significance of the inferior frontal gyrus associated with response inhibition (Aron, 2007; Swick et al., 2008; Bari and Robbins, 2013; Aron et al., 2014a,b). The low structural connectivity to the pars opercularis was complimented by relatively low functional connectivity (10 out of the 16 t-tests indicated substantial or more evidence in favor of lower functional connectivity for both the STN and STR).
There were also a number of cortical areas such as the CMA and SMA that compared to the other cortical areas had a stronger structural connectivity toward the subcortex. Both the CMA and SMA are thought to be crucial in voluntary based motor processes and highlight the role of the BG in action generation (Halsband et al., 1994; Shima and Tanji, 1998). The only functional connectivity that was inline with these structural connections was between the CMA and the STR.
The cortical regions were selected based on their connection with both the STN and STR as identified in NHP tracer studies. Additionally, the cortical ROIs were created using atlases that parcellated the human cortex in terms of their structural and functional homolog with NHPs using DTI (Sallet et al., 2013; Neubert et al., 2014, 2015). While there is a general agreement that major fiber tracts in DTI in NHPs correspond to the known anatomy identified with neural tracers within species, it remains difficult to identify the anatomy at the very fine fiber level with tractography (Dauguet et al., 2007; Thomas et al., 2014; Azadbakht et al., 2015; Donahue et al., 2016). Therefore, while a direct comparison between the findings of an NHP tracer study and a human neuroimaging study is challenging, previous work using DWI has shown that NHP results can be compared to humans due to similar organizational principles (Jbabdi et al., 2013). With regards to the present study, our findings are in agreement with animal-based BG models, proposing that both the STN and STR function as BG input structures and both show connections with a priori defined motor related, cognitive, and limbic cortical areas known to be present in NHPs. Moreover, the STN shows a higher structural connectivity with the SMA when compared with the primary motor area (M1), which is in accordance with models of action selection and inhibition within the hyperdirect pathway (Monakow et al., 1978; Haber et al., 1990; Nambu et al., 1996, 1997; Inase et al., 1999; Haynes and Haber, 2013; Feingold et al., 2015). Such a connectivity profile seems to be in line with previous work (Brunenberg et al., 2012; Lambert et al., 2012). Both the SMA and M1 connections to the STN seem to be clinically relevant as both cortico–subcortical connections are predictive for the DBS efficacy in Parkinson’s disease patients (Horn et al., 2017).
Limitations
There are several limitations that need to be addressed. Even with a high spatial resolution of 1 mm isotropic DWI data, it remains a challenge to precisely identify where the white matter tract exactly enters the cortex resulting in the so-called “gyral biases” (Jones et al., 2013; Jbabdi et al., 2015; Reveley et al., 2015; Schilling et al., 2017). While not feasible in this project, postmortem MRI and histological validation of these tracts could assist in validating the in vivo findings presented here (Forstmann et al., 2017; Mortazavi et al., 2017). Related is the tensor model used to fit the DWI data. Here, we used a relatively simple ball-and-stick model (Behrens et al., 2007) as the acquisition parameters of the data did not lend itself for more complex models such as spherical deconvolution (Tournier et al., 2004, 2008; Dell’Acqua et al., 2012). Furthermore, the term “tract strength” should not be over interpreted as it does not quantify the actual white matter fiber number. The term tract strength here is used to index a PDF, quantifying the ratio of how many streamlines directly and continuously commence from a seed region and terminate at a target area. While this density function is a commonly used measure for inferring the strength of white matter tracts, it is not without its limitations. A related limitation is the volumetric difference of the STN and STR. While the tract strength ratio was normalized for volume and a distance correction was applied, the volume difference might still influence the result that the STR has a higher tract strength than the STN. However, this would not explain the results in which the STN tract strengths to the OFC and VMPFC were found to be stronger compared to STR. Nonetheless, the direct statistical comparisons between the STN and STR should be interpreted with caution.
A final limitation is the anatomical specificity of the cortical ROIs used in this study and the relevance for computational models. Computational models have allowed us to generate quantifiable predictions about the role of the different structures in the cortico-BG-thalamic loops (Rubchinsky et al., 2003; Brown et al., 2004; Frank, 2006; Bogacz and Gurney, 2007; Forstmann and Wagenmakers, 2015; Forstmann et al., 2017). Within a number of these models the cortex is ill-specified as a single node that can correspond to a number of distinct areas such the lateral intraparietal area (LIP), the FEF, pre-motor cortex, or simply “cortex”. Based on the current results, these models can be further refined by incorporating more precise anatomical information regarding the cortical input. A straightforward way of improving the anatomical specificity is the use of DWI and rs-fMRI to identify per participant the voxels within these relatively large cortical areas connected to the BG. These individualized cortical ROIs can be used to test correlations during task-based fMRI (e.g., Marrelec and Fransson, 2011; Zhang et al., 2012; Keuken et al., 2015). For the STN and STR, we were able to manually parcellate the structure per individual using high-resolution 7T MRI. Parcellating the entire cortex in vivo into the myelo- or cyto-architectonic areas per participant is, however, still very challenging (but see De Martino et al., 2014; Dinse et al., 2015; Waehnert et al., 2015). Recently, there have been a number of cortical atlases that go well beyond the cortical parcellation scheme of Brodmann (Nieuwenhuys, 2012; Nieuwenhuys et al., 2014; Glasser et al., 2016; Eickhoff et al., 2017). Such atlases entail a fine-grained parcellation of the cortex, reducing the need to use non-specific terms such as the DLPFC, which reflects a functional rather than a single anatomical defined region (Petrides and Pandya, 1999). It is, however, unclear how these recent cortical parcellations translate to the anatomical nomenclature used in the animal tracer studies.
Conclusion
Using multimodal UHF MRI we show that compared to other tested cortical areas, the STN and STR have a relatively lower connectivity to areas thought to be involved in response inhibition and stronger connectivity to areas associated with voluntary based motor actions. Overall our results are consistent with previous literature in that the STN and STR are connected to similar cortical areas.
Author Contributions
BI designed the study, analyzed the data, and wrote the paper. BF designed the study and wrote the paper. YT designed the study and wrote the paper. MK designed the study, analyzed the data, and wrote the paper.
Funding
This work was supported by a Vidi grant from the Dutch Organization for Scientific Research (BF), an ERC starter grant (BF), and an ABC Talent Grant from the University of Amsterdam (MK).
Conflict of Interest Statement
The authors declare that the research was conducted in the absence of any commercial or financial relationships that could be construed as a potential conflict of interest.
Acknowledgments
We thank SURFsara (www.surfsara.nl) for the support in using the Lisa Computer Cluster and Domenica Wilfling and Gilles de Hollander for acquiring the resting-state fMRI data.
Footnotes
References
Akert, K., and Künzle, H. (1978). Projections of the precentral motor cortex and other cortical areas of the frontal lobe to the subthalamic nucleus in the monkey. Exp. Brain Res. 33, 395–403.
Akkal, D., Dum, R. P., and Strick, P. L. (2007). Supplementary motor area and presupplementary motor area: targets of basal ganglia and cerebellar output. J. Neurosci. 27, 10659–10673. doi: 10.1523/JNEUROSCI.3134-07.2007
Albin, R. L., Young, A., and Penny, J. B. (1989). the functional-anatomy of basal ganglia disorders. Trends Neurosci. 12, 366–375. doi: 10.1016/0166-2236(89)90074-X
Alexander, G., and Crutcher, M. (1990). Functional architecture of basal ganglia circuits: neural substrates of parallel processing. Trends Neurosci. 13, 266–271. doi: 10.1016/0166-2236(90)90107-L
Alexander, G., DeLong, M., and Strick, P. (1986). Parallel organization of functionally segregated circuits linking basal ganglia and cortex. Annu. Rev. Neurosci. 9, 357–381. doi: 10.1146/annurev.ne.09.030186.002041
Alexander, G. E., Crutcher, M. D., and DeLong, M. R. (1990). Basal ganglia-thalamocortical circuits: parallel substrates for motor, oculomotor, “prefrontal” and “limbic” functions. Prog. Brain Res. 85, 119–146. doi: 10.1016/S0079-6123(08)62678-3
Altman, N., and Krzywinski, M. (2015). Association, correlation and causation. Nat. Methods 12, 899–900. doi: 10.1038/nmeth.3587
Anteraper, S. A., Guell, X., Whitfield-Gabrieli, S., Triantafyllou, C., Mattfeld, A., Gabrieli, J. D., et al. (2018). Resting state functional connectivity of the subthalamic nucleus to limbic, associative and motor networks. Brain Connect. 8, 22–32. doi: 10.1089/brain.2017.0535
Aron, A. R. (2007). The neural basis of inhibition in cognitive control. Neuroscientist 13, 214–228. doi: 10.1177/1073858407299288
Aron, A. R., Robbins, T. W., and Poldrack, R. A. (2014a). Inhibition and the right inferior frontal cortex: one decade on. Trends Cogn. Sci. 18, 177–185. doi: 10.1016/j.tics.2013.12.003
Aron, A. R., Robbins, T. W., and Poldrack, R. A. (2014b). Right inferior frontal cortex: addressing the rebuttals. Front. Hum. Neurosci. 8:905. doi: 10.3389/fnhum.2014.00905
Azadbakht, H., Parkes, L. M., Haroon, H. A., Augath, M., Logothetis, N. K., de Crespigny, A., et al. (2015). Validation of high-resolution tractography against in vivotracing in the macaque visual cortex. Cereb. Cortex 25, 4299–4309. doi: 10.1093/cercor/bhu326
Bari, A., and Robbins, T. W. (2013). Inhibition and impulsivity: behavioral and neural basis of response control. Prog. Neurobiol. 108, 44–79. doi: 10.1016/j.pneurobio.2013.06.005
Behrens, T., Johansen-Berg, H., Woolrich, M. W., Smith, S. M., Wheeler-Kingshott, C., Boulby, P. A., et al. (2003). Non-invasive mapping of connections between human thalamus and cortex using diffusion imaging. Nat. Neurosci. 6, 750–757. doi: 10.1038/nn1075
Behrens, T. E. J., Berg, H. J., Jbabdi, S., Rushworth, M. F. S., and Woolrich, M. W. (2007). Probabilistic diffusion tractography with multiple fibre orientations: what can we gain? Neuroimage 34, 144–155. doi: 10.1016/j.neuroimage.2006.09.018
Bizzi, E. (1968). Discharge of frontal eye field neurons during saccadic and following eye movements in unanesthetized monkeys. Exp. Brain Res. 6, 69–80. doi: 10.1007/BF00235447
Boekel, W., Forstmann, B. U., and Keuken, M. C. (2017). A test-retest reliability analysis of diffusion measures of white matter tracts relevant for cognitive control. Psychophysiology 54, 24–33. doi: 10.1111/psyp.12769
Bogacz, R., and Gurney, K. (2007). The basal ganglia and cortex implement optimal decision making between alternative actions. Neural Comput. 19, 442–477. doi: 10.1162/neco.2007.19.2.442
Borra, E., Gerbella, M., Rozzi, S., and Luppino, G. (2013). Projections from caudal ventrolateral prefrontal areas to brainstem preoculomotor structures and to basal ganglia and cerebellar oculomotor loops in the macaque. Cereb. Cortex 25, 748–764. doi: 10.1093/cercor/bht265
Brown, J. W., Bullock, D., and Grossberg, S. (2004). How laminar frontal cortex and basal ganglia circuits interact to control planned and reactive saccades. Neural Netw. 17, 471–510. doi: 10.1016/j.neunet.2003.08.006
Brunenberg, E. J. L., Moeskops, P., Backes, W. H., Pollo, C., Cammoun, L., Vilanova, A., et al. (2012). Structural and resting state functional connectivity of the subthalamic nucleus: identification of motor STN parts and the hyperdirect pathway. PLoS One 7:e39061. doi: 10.1371/journal.pone.0039061
Cacciola, A., Calamuneri, A., Milardi, D., Mormina, E., Chillemi, G., Marino, S., et al. (2017). A connectomic analysis of the human basal ganglia network. Front. Neuroanat. 11:85. doi: 10.3389/fnana.2017.00085
Calzavara, R., Mailly, P., and Haber, S. N. (2007). Relationship between the corticostriatal terminals from areas 9 and 46, and those from area 8A, dorsal and rostral premotor cortex and area 24c: an anatomical substrate for cognition to action. Eur. J. Neurosci. 26, 2005–2024. doi: 10.1111/j.1460-9568.2007.05825.x
Cho, Z. H., Min, H. K., Oh, S. H., Han, J. Y., Park, C. W., Chi, J. G., et al. (2010). Direct visualization of deep brain stimulation targets in Parkinson disease with the use of 7-tesla magnetic resonance imaging. J. Neurosurg. 113, 1–9. doi: 10.3171/2010.3.JNS091385
Crocker, L. D., Heller, W., Warren, S. L., O’Hare, A. J., Infantolino, Z. P., and Miller, G. A. (2013). Relationships among cognition, emotion, and motivation: implications for intervention and neuroplasticity in psychopathology. Front. Hum. Neurosci. 7:261. doi: 10.3389/fnhum.2013.00261
Damoiseaux, J. S., and Greicius, M. D. (2009). Greater than the sum of its parts: a review of studies combining structural connectivity and resting-state functional connectivity. Brain Struct. Funct. 213, 525–533. doi: 10.1007/s00429-009-0208-6
Dauguet, J., Delzescaux, T., Condé, F., Mangin, J. F., Ayache, N., Hantraye, P., et al. (2007). Three-dimensional reconstruction of stained histological slices and 3D non-linear registration with in-vivo MRI for whole baboon brain. J. Neurosci. Methods 164, 191–204. doi: 10.1016/j.jneumeth.2007.04.017
de Hollander, G., Keuken, M. C., and Forstmann, B. U. (2015). The subcortical cocktail problem; mixed signals from the subthalamic nucleus and substantia nigra. PLoS One 10:e0120572. doi: 10.1371/journal.pone.0120572
de Hollander, G., Keuken, M. C., van der Zwaag, W., Forstmann, B. U., and Trampel, R. (2017). Comparing functional MRI protocols for small, iron-rich basal ganglia nuclei such as the subthalamic nucleus at 7 T and 3 T. Hum. Brain Mapp. 38, 3226–3248. doi: 10.1002/hbm.23586
De Martino, F., Moerel, M., Xu, J., van de Moortele, P. F., Ugurbil, K., Goebel, R., et al. (2014). High-resolution mapping of myeloarchitecture in vivo: localization of auditory areas in the human brain. Cereb. Cortex 25, 3394–3405. doi: 10.1093/cercor/bhu150
Dell’Acqua, F., Simmons, A., Williams, S. C. R., and Catani, M. (2012). Can spherical deconvolution provide more information than fiber orientations? Hindrance modulated orientational anisotropy, a true-tract specific index to characterize white matter diffusion. Hum. Brain Mapp. 34, 2464–2483. doi: 10.1002/hbm.22080
Di Martino, A., Scheres, A., Margulies, D. S., Kelly, A. M. C., Uddin, L. Q., Shehzad, Z., et al. (2008). Functional connectivity of human striatum: a resting state FMRI study. Cereb. Cortex 18, 2735–2747. doi: 10.1093/cercor/bhn041
Ding, L., and Gold, J. I. (2013). The basal ganglia’s contributions to perceptual decision making. Neuron 79, 640–649. doi: 10.1016/j.neuron.2013.07.042
Dinse, J., Härtwich, N., Waehnert, M. D., Tardif, C. L., Schäfer, A., Geyer, S., et al. (2015). A cytoarchitecture-driven myelin model reveals area-specific signatures in human primary and secondary areas using ultra-high resolution in-vivo brain MRI. Neuroimage 114, 71–87. doi: 10.1016/j.neuroimage.2015.04.023
Donahue, C. J., Sotiropoulos, S. N., Jbabdi, S., Hernandez-Fernandez, M., Behrens, T. E., Dyrby, T. B., et al. (2016). Using diffusion tractography to predict cortical connection strength and distance: a quantitative comparison with tracers in the monkey. J. Neurosci. 36, 6758–6770. doi: 10.1523/JNEUROSCI.0493-16.2016
Draganski, B., Kherif, F., Kloppel, S., Cook, P., Alexander, D., Parker, G., et al. (2008). Evidence for segregated and integrative connectivity patterns in the human basal ganglia. J. Neurosci. 28, 7143. doi: 10.1523/JNEUROSCI.1486-08.2008
Eickhoff, S. B., Constable, R. T., and Yeo, B. T. T. (2017). Topographic organization of the cerebral cortex and brain cartography. Neuroimage 170, 332–347. doi: 10.1016/j.neuroimage.2017.02.018
Espinosa-Parrilla, J.-F., Baunez, C., and Apicella, P. (2013). Linking reward processing to behavioral output: motor and motivational integration in the primate subthalamic nucleus. Front. Comput. Neurosci. 7:175. doi: 10.3389/fncom.2013.00175
Feingold, J., Gibson, D. J., DePasquale, B., and Graybiel, A. M. (2015). Bursts of beta oscillation differentiate postperformance activity in the striatum and motor cortex of monkeys performing movement tasks. Proc. Natl. Acad. Sci. U.S.A. 112, 13687–13692. doi: 10.1073/pnas.1517629112
Ferry, A. T., Öngür, D., An, X., and Price, J. L. (2000). Prefrontal cortical projections to the striatum in macaque monkeys: evidence for an organization related to prefrontal networks. J. Comp. Neurol. 425, 447–470. doi: 10.1002/1096-9861(20000925)425:3<447::AID-CNE9>3.0.CO;2-V
Forstmann, B., de Hollander, G., van Maanen, L., Alkemade, A., and Keuken, M. C. (2017). Towards a mechanistic understanding of the human subcortex. Nat. Rev. Neurosci. 18, 57–65. doi: 10.1038/nrn.2016.163
Forstmann, B. U., Anwander, A., Schäfer, A., Neumann, J., Brown, S., Wagenmakers, E.-J., et al. (2010). Cortico-striatal connections predict control over speed and accuracy in perceptual decision making. Proc. Natl. Acad. Sci. U.S.A. 107, 15916–15920. doi: 10.1073/pnas.1004932107
Forstmann, B. U., Keuken, M. C., Schäfer, A., Bazin, P.-L., Alkemade, A., and Turner, R. (2014). Multi-modal ultra-high resolution structural 7-Tesla MRI data repository. Sci. Data 1, 140050–140058. doi: 10.1038/sdata.2014.50
Forstmann, B. U., and Wagenmakers, E.-J. (2015). An Introduction to Model-Based Cognitive Neuroscience. Berlin: Springer. doi: 10.1007/978-1-4939-2236-9
Frank, M. J. (2006). Hold your horses: a dynamic computational role for the subthalamic nucleus in decision making. Neural Netw. 19, 1120–1136. doi: 10.1016/j.neunet.2006.03.006
Frankle, W., Laruelle, M., and Haber, S. N. (2006). Prefrontal cortical projections to the midbrain in primates: evidence for a sparse connection. Neuropsychopharmacology 31, 1627–1636. doi: 10.1038/sj.npp.1300990
Freedman, L. J., Insel, T. R., and Smith, Y. (2000). Subcortical projections of area 25 (subgenual cortex) of the macaque monkey. J. Comp. Neurol. 421, 172–188. doi: 10.1002/(SICI)1096-9861(20000529)421:2<172::AID-CNE4>3.0.CO;2-8
Glasser, M. F., Coalson, T. S., Robinson, E. C., Hacker, C. D., Harwell, J., Yacoub, E., et al. (2016). A multi-modal parcellation of human cerebral cortex. Nature 536, 171–178. doi: 10.1038/nature18933
Goldman, P. S., and Nauta, W. J. (1977). An intricately patterned prefronto-caudate projection in the rhesus monkey. J. Comp. Neurol. 171, 369–385. doi: 10.1002/cne.901710305
Haase, A., Frahm, J., Matthaei, D., Hanicke, W., and Merboldt, K. D. (1986). FLASH imaging. Rapid NMR imaging using low flip-angle pulses. J. Magn. Reson. 67, 258–266. doi: 10.1016/0022-2364(86)90433-6
Haber, S. N., and Calzavara, R. (2009). The cortico-basal ganglia integrative network: the role of the thalamus. Brain Res. Bull. 78, 69–74. doi: 10.1016/j.brainresbull.2008.09.013
Haber, S. N., and Knutson, B. (2009). The reward circuit: linking primate anatomy and human imaging. Neuropsychopharmacology 35, 4–26. doi: 10.1038/npp.2009.129
Haber, S. N., Kunishio, K., Mizobuchi, M., and Lynd Balta, E. (1995). The orbital and medial prefrontal circuit through the primate basal ganglia. J. Neurosci. 15, 4851–4867. doi: 10.1523/JNEUROSCI.15-07-04851.1995
Haber, S. N., Lynd, E., Klein, C., and Groenewegen, H. J. (1990). Topographic organization of the ventral striatal efferent projections in the rhesus monkey: an anterograde tracing study. J. Comp. Neurol. 293, 282–298. doi: 10.1002/cne.902930210
Halsband, U., Matsuzaka, Y., and Tanji, J. (1994). Neuronal activity in the primate supplementary, pre-supplementary and premotor cortex during externally and internally instructed sequential movements. Neurosci. Res. 20, 149–155. doi: 10.1016/0168-0102(94)90032-9
Haynes, W. I. A., and Haber, S. N. (2013). The organization of prefrontal-subthalamic inputs in primates provides an anatomical substrate for both functional specificity and integration: implications for basal ganglia models and deep brain stimulation. J. Neurosci. 33, 4804–4814. doi: 10.1523/JNEUROSCI.4674-12.2013
Heidemann, R. M., Porter, D. A., Anwander, A., Feiweier, T., Heberlein, K., Knösche, T. R., et al. (2010). Diffusion imaging in humans at 7T using readout-segmented EPI and GRAPPA. Magn. Reson. Med. 64, 9–14. doi: 10.1002/mrm.22480
Hollerman, J. R., Tremblay, L., and Schultz, W. (2000). Involvement of basal ganglia and orbitofrontal cortex in goal-directed behavior. Prog. Brain Res. 126, 193–215. doi: 10.1016/S0079-6123(00)26015-9
Horn, A., Reich, M., Vorwerk, J., Li, N., Wenzel, G., Fang, Q., et al. (2017). Connectivity predicts deep brain stimulation outcome in Parkinson disease. Ann. Neurol. 82, 67–78. doi: 10.1002/ana.24974
Inase, M., Tokuno, H., Nambu, A., Akazawa, T., and Takada, M. (1999). Corticostriatal and corticosubthalamic input zones from the presupplementary motor area in the macaque monkey: comparison with the input zones from the supplementary motor area. Brain Res. 833, 191–201. doi: 10.1016/S0006-8993(99)01531-0
Izawa, Y., Suzuki, H., and Shinoda, Y. (2009). Response properties of fixation neurons and their location in the frontal eye field in the monkey. J. Neurophysiol. 102, 2410–2422. doi: 10.1152/jn.00234.2009
Jahanshahi, M., Obeso, I., Rothwell, J. C., and Obeso, J. A. (2015). A fronto–striato–subthalamic–pallidal network for goal-directed and habitual inhibition. Nat. Rev. Neurosci. 16, 719–732. doi: 10.1038/nrn4038
Jantz, J. J., Watanabe, M., Levy, R., and Munoz, D. P. (2017). Evidence for a task-dependent switch in subthalamo-nigral basal ganglia signaling. Nat. Commun. 2017, 1–14. doi: 10.1038/s41467-017-01023-3
Jbabdi, S., and Johansen-Berg, H. (2011). Tractography: where do we go from here? Brain Connect. 1, 169–183. doi: 10.1089/brain.2011.0033
Jbabdi, S., Lehman, J. F., Haber, S. N., and Behrens, T. E. (2013). Human and monkey ventral prefrontal fibers use the same organizational principles to reach their targets: tracing versus tractography. J. Neurosci. 33, 3190–3201. doi: 10.1523/JNEUROSCI.2457-12.2013
Jbabdi, S., Sotiropoulos, S. N., Haber, S. N., Van Essen, D. C., and Behrens, T. E. (2015). Measuring macroscopic brain connections in vivo. Nat. Neurosci. 18, 1546–1555. doi: 10.1038/nn.4134
Jenkinson, M., Beckmann, C. F., Behrens, T. E. J., Woolrich, M. W., and Smith, S. M. (2012). FSL. Neuroimage 62, 782–790. doi: 10.1016/j.neuroimage.2011.09.015
Jones, D. K., Knösche, T. R., and Turner, R. (2013). White matter integrity, fiber count, and other fallacies: the do’s and don’ts of diffusion MRI. Neuroimage 73, 239–254. doi: 10.1016/j.neuroimage.2012.06.081
Kemp, J. M., and Powell, T. (1970). The cortico-striate projection in the monkey. Brain 93, 525–546. doi: 10.1093/brain/93.3.525
Kemp, J. M., and Powell, T. P. S. (1971). The connexions of the striatum and globus pallidus: synthesis and speculation. Philos. Trans. R. Soc. Lond. B Biol. Sci. 262, 441–457. doi: 10.1098/rstb.1971.0106
Keuken, M. C., Bazin, P. L., Backhouse, K., Beekhuizen, S., Himmer, L., Kandola, A., et al. (2017). Effects of aging on T1, T2∗, and QSM MRI values in the subcortex. Brain Struct. Funct. 222, 2487–2505. doi: 10.1007/s00429-016-1352-4
Keuken, M. C., Bazin, P. L., Crown, L., Hootsmans, J., Laufer, A., Müller-Axt, C., et al. (2014). Quantifying inter-individual anatomical variability in the subcortex using 7T structural MRI. Neuroimage 94, 40–46. doi: 10.1016/j.neuroimage.2014.03.032
Keuken, M. C., van Maanen, L., Bogacz, R., Schäfer, A., Neumann, J., Turner, R., et al. (2015). The subthalamic nucleus during decision-making with multiple alternatives. Hum. Brain. Mapp. 36, 4041–4052. doi: 10.1002/hbm.22896
Khalsa, S., Mayhew, S. D., Chechlacz, M., Bagary, M., and Bagshaw, A. P. (2014). The structural and functional connectivity of the posterior cingulate cortex: comparison between deterministic and probabilistic tractography for the investigation of structure–function relationships. Neuroimage 102, 118–127. doi: 10.1016/j.neuroimage.2013.12.022
Künzle, H. (1975). Bilateral projections from precentral motor cortex to the putamen and other parts of the basal ganglia. An autoradiographic study in Macaca fascicularis. Brain Res. 88, 195–209. doi: 10.1016/0006-8993(75)90384-4
Künzle, H. (1977). An autoradiographic analysis of the efferent connections from premotor and adjacent prefrontal regions (areas 6 and 9) in Macaca fascicularis. Brain Behav. Evol. 15, 185–234. doi: 10.1159/000123779
Künzle, H., and Akert, K. (1977). Efferent connections of cortical, area 8 (frontal eye field) in Macaca fascicularis. A reinvestigation using the autoradiographic technique. J. Comp. Neurol. 173, 147–163. doi: 10.1002/cne.901730108
Lambert, C., Zrinzo, L., Nagy, Z., Lutti, A., Hariz, M., Foltynie, T., et al. (2012). Confirmation of functional zones within the human subthalamic nucleus: patterns of connectivity and sub-parcellation using diffusion weighted imaging. Neuroimage 60, 83–94. doi: 10.1016/j.neuroimage.2011.11.082
Liles, S. L., and Updyke, B. V. (1985). Projection of the digit and wrist area of precentral gyrus to the putamen: relation between topography and physiological properties of neurons in the putamen. Brain Res. 339, 245–255. doi: 10.1016/0006-8993(85)90089-7
Lim, L. W., Janssen, M. L. F., Kocabicak, E., and Temel, Y. (2015). The antidepressant effects of ventromedial prefrontal cortex stimulation is associated with neural activation in the medial part of the subthalamic nucleus. Behav. Brain Res. 279, 17–21. doi: 10.1016/j.bbr.2014.11.008
MacAvoy, M. G., Gottlieb, J. P., and Bruce, C. J. (1991). Smooth-pursuit eye movement representation in the primate frontal eye field. Cereb. Cortex 1, 95–102. doi: 10.1093/cercor/1.1.95
Mallet, L., Polosan, M., Jaafari, N., Baup, N., Welter, M.-L., Fontaine, D., et al. (2008). Subthalamic nucleus stimulation in severe obsessive-compulsive disorder. N. Engl. J. Med. 359, 2121–2134. doi: 10.1056/NEJMoa0708514
Marques, J. P., Kober, T., Krueger, G., van der Zwaag, W., van de Moortele, P.-F., and Gruetter, R. (2010). MP2RAGE, a self bias-field corrected sequence for improved segmentation and T1-mapping at high field. Neuroimage 49, 1271–1281. doi: 10.1016/j.neuroimage.2009.10.002
Marrelec, G., and Fransson, P. (2011). Assessing the influence of different ROI selection strategies on functional connectivity analyses of FMRI data acquired during steady-state conditions. PLoS One 6:e14788. doi: 10.1371/journal.pone.0014788
McFarland, N. R., and Haber, S. N. (2000). Convergent inputs from thalamic motor nuclei and frontal cortical areas to the dorsal striatum in the primate. J. Neurosci. 20, 3798–3813. doi: 10.1523/JNEUROSCI.20-10-03798.2000
Mestres-Missé, A., Trampel, R., Turner, R., and Kotz, S. A. (2017). Uncertainty and expectancy deviations require cortico-subcortical cooperation. Neuroimage 144, 23–34. doi: 10.1016/j.neuroimage.2016.05.069
Miyachi, S., Lu, X., Imanishi, M., Sawada, K., Nambu, A., and Takada, M. (2006). Somatotopically arranged inputs from putamen and subthalamic nucleus to primary motor cortex. Neurosci. Res. 56, 300–308. doi: 10.1016/j.neures.2006.07.012
Miyata, M., and Sasaki, K. (1984). Horseradish peroxidase studies on thalamic and striatal connections of the mesial part of area 6 in the monkey. Neurosci. Lett. 49, 127–133. doi: 10.1016/0304-3940(84)90148-4
Monakow, K. H., Akert, K., and Künzle, H. (1979). Projections of precentral and premotor cortex to the red nucleus and other midbrain areas in Macaca fascicularis. Exp. Brain Res. 34, 91–105. doi: 10.1007/BF00238343
Monakow, K. H. V., Akert, K., and Künzle, H. (1978). Projections of the precentral motor cortex and other cortical areas of the frontal lobe to the subthalamic nucleus in the monkey. Exp. Brain Res. 33, 395–403. doi: 10.1007/BF00235561
Morey, R. D., Rouder, J. N., and Jamil, T. (2014). BayesFactor Computation of Bayes Factors for Common Designs. R Package Version 0.9 9.
Morris, L. S., Kundu, P., Dowell, N., Mechelmans, D. J., Favre, P., Irvine, M. A., et al. (2016). Fronto-striatal organization: defining functional and microstructural substrates of behavioural flexibility. Cortex 74, 118–133. doi: 10.1016/j.cortex.2015.11.004
Mortazavi, F., Oblak, A. L., Morrison, W. Z., Schmahmann, J. D., Stanley, H. E., Wedeen, V. J., et al. (2017). Geometric navigation of axons in a cerebral pathway: comparing dMRI with tract tracing and immunohistochemistry. Cereb. Cortex 28, 1219–1232. doi: 10.1093/cercor/bhx034
Mulder, M. J., Boekel, W., Ratcliff, R., and Forstmann, B. U. (2013). Cortico-subthalamic connection predicts individual differences in value-driven choice bias. Brain Struct. Funct. 219, 1239–1249. doi: 10.1007/s00429-013-0561-3
Nambu, A., Kaneda, K., Tokuno, H., and Takada, M. (2002a). Organization of corticostriatal motor inputs in monkey putamen. J. Neurophysiol. 88, 1830–1842. doi: 10.1152/jn.00672.2001
Nambu, A., Takada, M., Inase, M., and Tokuno, H. (1996). Dual somatotopical representations in the primate subthalamic nucleus: evidence for ordered but reversed body-map transformations from the primary motor cortex and the supplementary motor area. J. Neurosci. 16, 2671–2683. doi: 10.1523/JNEUROSCI.16-08-02671.1996
Nambu, A., Tokuno, H., and Takada, M. (2002b). Functional significance of the cortico–subthalamo–pallidal “hyperdirect” pathway. Neurosci. Res. 43, 111–117. doi: 10.1016/S0168-0102(02)00027-5
Nambu, A., Tokuno, H., Inase, M., and Takada, M. (1997). Corticosubthalamic input zones from forelimb representations of the dorsal and ventral divisions of the premotor cortex in the macaque monkey: comparison with the input zones from the primary motor cortex and the supplementary motor area. Neurosci. Lett. 239, 13–16. doi: 10.1016/S0304-3940(97)00877-X
Neto, L. L., Oliveira, E., Correia, F., and Ferreira, A. G. (2008). The human nucleus accumbens: where is it? A stereotactic, anatomical and magnetic resonance imaging study. Neuromodulation 11, 13–22. doi: 10.1111/j.1525-1403.2007.00138.x
Neubert, F.-X., Mars, R. B., Sallet, J., and Rushworth, M. F. S. (2015). Connectivity reveals relationship of brain areas for reward-guided learning and decision making in human and monkey frontal cortex. Proc. Natl. Acad. Sci. U.S.A. 112, E2695–E2704. doi: 10.1073/pnas.1410767112
Neubert, F.-X., Mars, R. B., Thomas, A. G., Sallet, J., and Rushworth, M. F. S. (2014). Comparison of human ventral frontal cortex areas for cognitive control and languagewith areas in monkey frontal cortex. Neuron 81, 700–713. doi: 10.1016/j.neuron.2013.11.012
Nieuwenhuys, R. (2012). The myeloarchitectonic studies on the human cerebral cortex of the Vogt–Vogt school, and their significance for the interpretation of functional neuroimaging data. Brain Struct. Funct. 218, 303–352. doi: 10.1007/s00429-012-0460-z
Nieuwenhuys, R., Broere, C. A. J., and Cerliani, L. (2014). A new myeloarchitectonic map of the human neocortex based on data from the Vogt–Vogt school. Brain Struct. Funct. 220, 2551–2573. doi: 10.1007/s00429-014-0806-9
Oldfield, R. C. (1971). The assessment and analysis of handedness: the Edinburgh inventory. Neuropsychologia 9, 97–113. doi: 10.1016/0028-3932(71)90067-4
Parent, A., and Hazrati, L. (1995a). Functional anatomy of the basal ganglia. I. The cortico-basal ganglia-thalamo-cortical loop. Brain Res. Brain Res. Rev. 20, 91–127.
Parent, A., and Hazrati, L. (1995b). Functional anatomy of the basal ganglia. II. The place of subthalamic nucleus and external pallidium in basal ganglia circuitry. Brain Res. Rev. 20, 128–154.
Parthasarathy, H. B., Schall, J. D., and Graybiel, A. M. (1992). Distributed but convergent ordering of corticostriatal projections – analysis of the frontal eye field and the supplementary eye field in the macaque monkey. J. Neurosci. 12, 4468–4488. doi: 10.1523/JNEUROSCI.12-11-04468.1992
Petras, J. (1968). Some efferent connections of the motor and somatosensory cortex of simian primates and felid, canid and procyonid carnivores. Ann. N. Y. Acad. Sci. 167, 469–505. doi: 10.1111/j.1749-6632.1969.tb20461.x
Petrides, M., and Pandya, D. N. (1999). Dorsolateral prefrontal cortex: comparative cytoarchitectonic analysis in the human and the macaque brain and corticocortical connection patterns. Eur. J. Neurosci. 11, 1011–1036. doi: 10.1046/j.1460-9568.1999.00518.x
R Core Team (2016). R: A Language and Environment for Statistical Computing. Available at: https://www.R-project.org/
Reveley, C., Seth, A. K., Pierpaoli, C., Silva, A. C., Yu, D., Saunders, R. C., et al. (2015). Superficial white matter fiber systems impede detection of long-range cortical connections in diffusion MR tractography. Proc. Natl. Acad. Sci. U.S.A. 112, E2820–E2828. doi: 10.1073/pnas.1418198112
Rubchinsky, L. L., Kopell, N., and Sigvardt, K. A. (2003). Modeling facilitation and inhibition of competing motor programs in basal ganglia subthalamic nucleus-pallidal circuits. Proc. Natl. Acad. Sci. U.S.A. 100, 14427–14432. doi: 10.1073/pnas.2036283100
Sallet, J., Mars, R. B., Noonan, M. P., Neubert, F.-X., Jbabdi, S., O’Reilly, J. X., et al. (2013). The organization of dorsal frontal cortex in humans and macaques. J. Neurosci. 33, 12255–12274. doi: 10.1523/JNEUROSCI.5108-12.2013
Schafer, R. J., and Moore, T. (2007). Attention governs action in the primate frontal eye field. Neuron 56, 541–551. doi: 10.1016/j.neuron.2007.09.029
Schilling, K., Gao, Y., Janve, V., Stepniewska, I., Landman, B. A., and Anderson, A. W. (2017). Confirmation of a gyral bias in diffusion MRI fiber tractography. Hum. Brain Mapp. 39, 1449–1466. doi: 10.1002/hbm.23936
Selemon, L. D., and Goldman-Rakic, P. S. (1985). Longitudinal topography and interdigitation of corticostriatal projections in the rhesus monkey. J. Neurosci. 5, 776–794. doi: 10.1523/JNEUROSCI.05-03-00776.1985
Selemon, L. D., and Goldman-Rakic, P. S. (1988). Common cortical and subcortical targets of the dorsolateral prefrontal and posterior parietal cortices in the rhesus monkey: evidence for a distributed neural network subserving spatially guided behavior. J. Neurosci. 8, 4049–4068. doi: 10.1523/JNEUROSCI.08-11-04049.1988
Shima, K., and Tanji, J. (1998). Role for cingulate motor area cells in voluntary movement selection based on reward. Science 282, 1335–1338. doi: 10.1126/science.282.5392.1335
Smith, S. M. (2002). Fast robust automated brain extraction. Hum. Brain Mapp. 17, 143–155. doi: 10.1002/hbm.10062
Stanton, G. B., Goldberg, M. E., and Bruce, C. J. (1988). Frontal eye field efferents in the macaque monkey: I. Subcortical pathways and topography of striatal and thalamic terminal fields. J. Comp. Neurol. 271, 473–492. doi: 10.1002/cne.902710402
Swick, D., Ashley, V., and Turken, A. U. (2008). Left inferior frontal gyrus is critical for response inhibition. BMC Neurosci. 9:102. doi: 10.1186/1471-2202-9-102
Tachibana, Y., Nambu, A., Hatanaka, N., Miyachi, S., and Takada, M. (2004). Input–output organization of the rostral part of the dorsal premotor cortex, with special reference to its corticostriatal projection. Neurosci. Res. 48, 45–57. doi: 10.1016/j.neures.2003.09.006
Takada, M., Tokuno, H., Hamada, I., Inase, M., Ito, Y., Imanishi, M., et al. (2001). Organization of inputs from cingulate motor areas to basal ganglia in macaque monkey. Eur. J. Neurosci. 14, 1633–1650. doi: 10.1046/j.0953-816x.2001.01789.x
Takada, M., Tokuno, H., and Inase, M. (1996). Direct projections from the presupplementary motor area (pre-SMA) to the basal ganglia in the Japanese monkey. Neuroscience 25:S179.
Takada, M., Tokuno, H., Nambu, A., and Inase, M. (1998a). Corticostriatal input zones from the supplementary motor area overlap those from the contra- rather than ipsilateral primary motor cortex. Brain Res. 791, 335–340.
Takada, M., Tokuno, H., Nambu, A., and Inase, M. (1998b). Corticostriatal projections from the somatic motor areas of the frontal cortex in the macaque monkey: segregation versus overlap of input zones from the primary motor cortex, the supplementary motor area, and the premotor cortex. Exp. Brain Res. 120, 114–128.
Temel, Y., Blokland, A., Steinbusch, H., and Visser-Vandewalle, V. (2005). The functional role of the subthalamic nucleus in cognitive and limbic circuits. Prog. Neurobiol. 76, 393–413. doi: 10.1016/j.pneurobio.2005.09.005
Temel, Y., Visser-Vandewalle, V., and Carpenter, R. H. S. (2008). Saccadic latency during electrical stimulation of the human subthalamic nucleus. Curr. Biol. 18, R412–R414. doi: 10.1016/j.cub.2008.03.008
Thomas, C., Ye, F. Q., Irfanoglu, M. O., Modi, P., Saleem, K. S., Leopold, D. A., et al. (2014). Anatomical accuracy of brain connections derived from diffusion MRI tractography is inherently limited. Proc. Natl. Acad. Sci. U.S.A. 111, 16574–16579. doi: 10.1073/pnas.1405672111
Tokuno, H., Inase, M., Nambu, A., Akazawa, T., Miyachi, S., and Takada, M. (1999). Corticostriatal projections from distal and proximal forelimb representations of the monkey primary motor cortex. Neurosci. Lett. 269, 33–36. doi: 10.1016/S0304-3940(99)00401-2
Tournier, J. D., Calamante, F., Gadian, D. G., and Connelly, A. (2004). Direct estimation of the fiber orientation density function from diffusion-weighted MRI data using spherical deconvolution. Neuroimage 23, 1176–1185. doi: 10.1016/j.neuroimage.2004.07.037
Tournier, J. D., Yeh, C.-H., Calamante, F., Cho, K.-H., Connelly, A., and Lin, C.-P. (2008). Resolving crossing fibres using constrained spherical deconvolution: validation using diffusion-weighted imaging phantom data. Neuroimage 42, 617–625. doi: 10.1016/j.neuroimage.2008.05.002
Uylings, H., and Van Eden, C. G. (1990). Qualitative and quantitative comparison of the prefrontal cortex in rat and in primates, including humans. Prog. Brain Res. 85, 31–62. doi: 10.1016/S0079-6123(08)62675-8
van den Bos, W., Rodriguez, C. A., Schweitzer, J. B., and McClure, S. M. (2014). Connectivity strength of dissociable striatal tracts predict individual differences in temporal discounting. J. Neurosci. 34, 10298–10310. doi: 10.1523/JNEUROSCI.4105-13.2014
Waehnert, M. D., Dinse, J., Schäfer, A., Geyer, S., Bazin, P.-L., Turner, R., et al. (2015). A subject-specific framework for in vivo myeloarchitectonic analysis using high resolution quantitative MRI. Neuroimage 125, 94–107. doi: 10.1016/j.neuroimage.2015.10.001
Wetzels, R., and Wagenmakers, E.-J. (2012). A default Bayesian hypothesis test for correlations and partial correlations. Psychon. Bull. Rev. 19, 1057–1064. doi: 10.3758/s13423-012-0295-x
Yeterian, E. H., and Van Hoesen, G. W. (1978). Cortico-striate projections in the rhesus monkey: the organization of certain cortico-caudate connections. Brain Res. 139, 43–63. doi: 10.1016/0006-8993(78)90059-8
Keywords: 7T MRI, basal ganglia, connectivity, DWI, RS-fMRI
Citation: Isaacs BR, Forstmann BU, Temel Y and Keuken MC (2018) The Connectivity Fingerprint of the Human Frontal Cortex, Subthalamic Nucleus, and Striatum. Front. Neuroanat. 12:60. doi: 10.3389/fnana.2018.00060
Received: 02 March 2018; Accepted: 02 July 2018;
Published: 19 July 2018.
Edited by:
Kathleen S. Rockland, Boston University, United StatesReviewed by:
Ettore Alberto Accolla, University of Fribourg, SwitzerlandMasahiko Takada, Kyoto University, Japan
Copyright © 2018 Isaacs, Forstmann, Temel and Keuken. This is an open-access article distributed under the terms of the Creative Commons Attribution License (CC BY). The use, distribution or reproduction in other forums is permitted, provided the original author(s) and the copyright owner(s) are credited and that the original publication in this journal is cited, in accordance with accepted academic practice. No use, distribution or reproduction is permitted which does not comply with these terms.
*Correspondence: Max C. Keuken, mckeuken@gmail.com