 Martin Klietz1†
 Paul Bronzlik2†Patrick Nösel2
 Florian Wegner1
 Dirk W. Dressler1Mete Dadak2Andrew A. Maudsley3Sulaiman Sheriff3Heinrich Lanfermann2Xiao-Qi Ding2*
- 1Department of Neurology, Hannover Medical School, Hanover, Germany
- 2Department of Neuroradiology, Hannover Medical School, Hanover, Germany
- 3Department of Radiology, University of Miami School of Medicine, Miami, FL, United States
Objective: To estimate alterations in neurometabolic profile of patients with early stage Parkinson's disease (PD) by using a short echo-time whole brain magnetic resonance spectroscopic imaging (wbMRSI) as possible biomarker for early diagnosis and monitoring of PD.
Methods: 20 PD patients in early stage (H&Y ≤ 2) without evidence of severe other diseases and 20 age and sex matched healthy controls underwent wbMRSI. In each subject brain regional concentrations of metabolites N-acetyl-aspartate (NAA), choline (Cho), total creatine (tCr), glutamine (Gln), glutamate (Glu), and myo-inositol (mIns) were obtained in atlas-defined lobar structures including subcortical basal ganglia structures (the left and right frontal lobes, temporal lobes, parietal lobes, occipital lobes, and the cerebellum) and compared between patients and matched healthy controls. Clinical characteristics of the PD patients were correlated with spectroscopic findings.
Results: In comparison to controls the PD patients revealed altered lobar metabolite levels in all brain lobes contralateral to dominantly affected body side, i.e., decreases of temporal NAA, Cho, and tCr, parietal NAA and tCr, and frontal as well as occipital NAA. The frontal NAA correlated negatively with the MDS-UPDRS II (R = 22120.585, p = 0.008), MDS-UPDRS IV (R = −0.458, p = 0.048) and total MDS-UPDRS scores (R = −0.679, p = 0.001).
Conclusion: In early PD stages metabolic alterations are evident in all contralateral brain lobes demonstrating that the neurodegenerative process affects not only local areas by dopaminergic denervation, but also the functional network within different brain regions. The wbMRSI-detectable brain metabolic alterations reveal the potential to serve as biomarkers for early PD.
Introduction
Parkinson's disease (PD) is characterized by symptoms of rigidity, bradykinesia, tremor, and postural instability. Diagnosis is based on clinical findings, with an accuracy of only 53% for disease duration <5 years, increasing to 88% for durations longer than 5 years (1). Magnetic resonance imaging (MRI) reveals in PD patients only unspecific brain changes and is used mainly to exclude differential diagnoses (2–6). Magnetic resonance spectroscopy (MRS) can be used to measure brain metabolites like N-acetyl-aspartate (NAA), choline (Cho), myo-inositol (mIns), total creatine (tCr), glutamine (Gln), and glutamate (Glu), which provide information about neuronal integrity (NAA), membrane turnover (Cho), gliosis (mIns), energy metabolism (Cr), and glutamatergic neuronal activity (Glu, Gln) in patients. Numerous MRS studies on PD have been reported previously (7–11). Due to methodical limitations of commonly used MRS techniques that suffered from limited spatial coverage, most studies reported PD-related metabolic changes in one or a few small brain structures. These results thus may not necessarily reflect the metabolic status within whole brain. Considering that human brain functions as organized networks with interactions between different multiple brain regions (10, 12), information about PD-related metabolic alterations within the whole brain with high spatial resolution may help to better characterize PD and understand the underlying pathologic mechanisms. A recently established whole-brain MR spectroscopic imaging (wbMRSI) technique provides the possibility to measure brain metabolites simultaneously over different larger brain scales in subjects in vivo (13), as well as in multiple specific small brain areas (14, 15). Therefore, we are going to study altered brain metabolism in PD patients systematically by use of the wbMRSI. As a first part of the project we aimed to obtain an overview about altered neurometabolic profile in early PD by exploring metabolic changes in eight brain lobes and cerebellum that composed the whole brain, with the results being reported in the following.
Patients and Methods
Patients and Clinical Examinations
Human subject studies were carried out with approval from the local Ethics Committee of Hannover Medical School (No. 6167-2016) and all subjects gave written informed consent. PD patients were recruited from those treated at the neurological wards and movement disorders outpatient clinic of Hannover Medical School. Inclusion criteria were the neurological diagnosis of PD according to the Movement Disorder Society (MDS) diagnosis criteria with a Hoehn and Yahr stage (H&Y) of 1 or 2 in the best medical on state and age of 75 or below. Definition of early stage PD by the H&Y stage is in accordance with (7–13), additionally, none of our patients complained of a significant amount of motor complications qualifying for advanced PD [see (16) for review]. Patients with atypical Parkinsonism and other known brain pathologies e.g., stroke, small vessel disease or tumor, were excluded. Additionally, patients with severe head tremor, dystonia or dyskinesia had to be excluded from this study.
A movement disorders specialist enrolled the PD patients. Twenty PD patients (48–72 years old, mean age 60.2 ± 7.2 years, 8 males) were included. Information about course of PD in the individual patient was collected, including disease duration, dominantly affected body side, main symptoms, medication, and comorbidities. PD symptoms were assessed by the Movement Disorders Society Unified Parkinson's Disease Rating Scale (MDS-UPDRS) (17). Patients were rated in best medication “on” state. PD specific medication was noted and levodopa equivalence dosage calculated (LED). Cognitive deficits were quantified by the established test for dementia and mild cognitive impairment DemTect (18). As controls 20 healthy participants matched in age and sex on a one-to-one basis were also studied. All patients and healthy controls were right-handed according to self-report.
MR Examinations
All subjects underwent MR examinations at 3T (Verio, Siemens, Erlangen, Germany). The routine MRI protocol included a T2 weighted turbo spin echo (TSE) sequence, a T2 weighted gradient echo (GRE) sequence, a fluid attenuation inversion recovery (FLAIR) sequence, a T1 weighted 3D magnetization-prepared rapid gradient-echo (MPRAGE) sequence, and a volumetric spin-echo planar spectroscopic imaging (EPSI) acquisition (TR/TE = 1550/17.6 ms, field-of view of 280 × 280 × 180 mm3, matrix size of 50 × 50 with 18 slices with a nominal voxel volume of 0.31 ml (= 5.6 × 5.6 × 10 mm3), echo train length of 1,000 points, and bandwidth of 2,500 Hz) for wbMRSI, as described previously (13, 19). The scan time with EPSI was about 17 min. The EPSI-acquisition included also a second dataset obtained without water suppression, which was used for several processing functions, including measurement and correction of the resonance frequency offset at each voxel location, correction of lineshape distortions and to provide internal signal reference for the normalization of metabolite concentrations (20), while the MPRAGE images were used as anatomical reference. The EPSI, MPRAGE, FLAIR, TSE, and GRE scans were obtained with the same angulation.
Data Processing
MPRAGE, FLAIR, TSE, and GRE images were inspected to recognize possible morphological abnormalities, which were done by two neuroradiologists. The EPSI data were processed using the MIDAS software package to obtain volumetric metabolite maps. Processing included zero-filling to 64 × 64 × 32 points and spatial smoothing, resulting in an interpolated basic voxel volume of 0.107 ml (4.375 × 4.375 × 5.625 mm3) and an effective voxel volume of 1.5 ml (13, 19). The processing also included calculation of the fractional tissue volume contributing to each MRSI voxel, which used a tissue segmentation (18, 19) of the T1-weighted MPRAGE data to map gray matter (GM), white matter (WM), and cerebrospinal fluid (CSF). All resultant maps were then spatially transformed and interpolated to a standard spatial reference (20) at 2 mm isotropic resolution, which was associated with an atlas that mapped the individual brain lobes and the cerebellum. Mean regional metabolite concentrations were then determined in atlas-defined brain lobes and cerebellum, which composed the whole brain (Figure 1): The frontal lobe left (LFL) and right (RFL) including anterior parts of the striatum and pallidum, the temporal lobe left (LTL) and right (RTL) including posterior parts of the striatum and pallidum, the parietal lobe left (LPL) and right (RPL) including thalamus and subthalamic nucleus, the occipital lobe left (LOL) and right (ROL), and the cerebellum (Cbl). To obtain brain regional metabolite concentrations, especially to estimate the metabolites with small MRS signal amplitudes (Glu and Gln) separately, a modified data analysis approach suggested by Goryawala et al. was applied, i.e., the spectra were averaged by summing voxels within a region of interest (ROI) to obtain high-SNR spectra from atlas-registered anatomic regions, which was done following inverse spatial transformation of the atlas into subject space (14). Prior to averaging, the voxels were excluded if they had a spectral linewidth larger than 12 Hz or a CSF fraction larger than 30%. The application of these selection criteria resulted in excluding more basic voxels in frontal lobes (57% of the voxels within the structure), temporal lobes (55%), and cerebellum (54%) than in parietal (47%) and occipital lobes (33%), due to more filed distortion by neighbored structures containing bone and air or locations containing more CSF spaces. Finally, there were altogether 6,442 of 13,534 basic voxel spectra accounted for the spectral averaging in nine brain regions. The averaged spectra were subsequently analyzed with the FITT program included in MIDAS, in which a Lorentz-Gauss lineshape was used for spectral fitting. Mean regional concentrations of NAA, Cho, Cr, Glu, Gln, and mIns were determined as a ratio to a signal equivalent to that from 100% tissue water and presented as institutional units (i.u.) (21). Cramer-Rao lower bound (CRLB) of the spectral analysis was used as quality criteria for estimated metabolite values, i.e., only metabolites estimated with a CRLB <30% for Gln [a larger CRLB was selected for Gln to minimize possible bias related to its lower concentration (14)] and <20% for all other metabolites as often recommended for MRS analysis (http://s-provencher.com/lcmodel.shtml) were considered for further analyses. The fractional tissue volumes of CSF (FVCSF) and total brain tissue (FVBT) in each brain region were derived by using multi-voxel analysis based on nine atlas-defined anatomical regions. Correction for CSF volume contribution was applied as Met' = Met/(1-FVCSF).
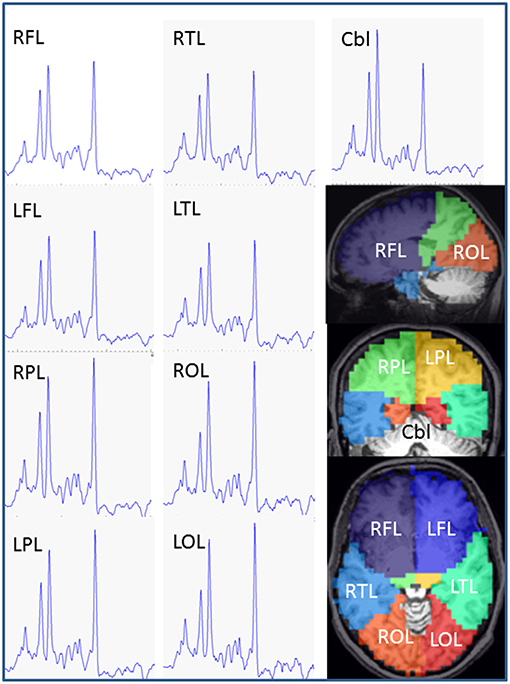
Figure 1. Exemplary MR spectra of each brain lobe and cerebellum obtained from a PD patient (female, 62 years). Estimated anatomic assignment of brain areas to brain lobes of our study. Frontal lobe: BA 4, 6, 8, 9, 10, 11, 12, 24, 25, 32, 33, 44, 45, 46, 47, head of caudate nucleus, accumbens, anterior part of putamen and pallidum, anterior cingulum. Parietal lobe: BA 1, 2, 3, 5, 7, 23, 31, 39, 40, thalamus, subthalamic nucleus, posterior cingulum. Temporal lobe: BA 13, 14, 15, 16, 20, 21, 22, 26, 27, 28, 29, 30, 34, 35, 36, 37, 38, 41, 42, 43, hippocampus, posterior parts of putamen and pallidum, caudatus tail, amygdala. Occipital lobe: BA 17, 18, 19. RFL, right frontal lobe; LFL, left frontal lobe; RPL, right parietal lobe; LPL, left parietal lobe; RTL, right temporal lobe; LTL left temporal lobe; ROL right occipital lobe; LOL left occipital lobe; Cbl, cerebellum; BA, Broadman Area.
Statistical Analysis
The results from the patient studies were compared with those of 20 age- and sex-matched healthy controls. The normality of the data was checked with Shapiro-Wilk test, where more than 80% of the data were normally distributed (p > 0.05). Paired t-test was used for comparison of measured metabolite concentrations, spectral linewidths, and the fractional volumes of CSF in each of nine brain regions between patients and healthy controls. Wilcoxon signed rank test was additionally used for the few non-normally distributed data, which revealed the results with the same significance levels as those derived by using paired t-test, i.e., this part of the data showed no significant changes in patients by both parametric and nonparametric estimation. For simplicity, only the results of paired t- tests are given. In addition, the lobar metabolite concentrations of the patients were pooled in two hemispheres according to dominantly affected body side (right side in 12 patients and left side in 7 patients, one patient was excluded from this analysis due to no obvious dominantly affected body side), i.e., the contralateral brain lobes as well as ipsilateral brain lobes in respect to the affected/more affected body side, and compared to those of the healthy controls by using paired t-test. In addition, a nonparametric Spearman's correlation test was used to estimate possible correlations between clinical MDS-UPDRS and pooled lobar metabolites concentrations in patients. Corrections for multiple comparisons or multiple correlation tests were performed by using the false-discovery rate (FDR) method, with the desired false-discovery rate to 0.05. Those results with p-values not significant after a FDR correction were considered as showing a tendency (if p < 0.05) or a weak tendency (p < 0.75) of corresponding alterations in patients. Statistical analyses were performed with SPSS version 23 (SPSS IBM, New York, U.S.A.).
Results
PD Patient Characteristics
The 20 early stage PD subjects were clinically diagnosed. None of the patients was suspected to suffer from atypical Parkinsonism or was cognitively impaired. All patients reported an obvious positive response on dopaminergic treatment and were examined in the best medical on state. As summarized in Table 1, the Hoehn and Yahr stage of the PD subjects was 2 or less with mean disease duration of 6 years. Twelve PD subjects (60%) showed right side dominant symptoms, seven (35%) left side, and one patient (5%) presented mainly non-motor symptoms with no dominantly affected body side. Of our 20 PD subjects 4 presented with an akinetic-rigid type (20%), 8 showed a tremor dominant type (40%) or an equivalence type (40%), respectively. All the early PD subjects revealed good cognitive functions measured by the DemTect with a mean score of 15.5 ± 2.9. The patients displayed a mean value of 7.7 points in MDS-UPDRS part I as non-motor aspects of daily living (SD 4.5, min 2, max 20), and 7.0 in MDS-UPDRS part II as motor aspects of daily living (SD 4.3, min 2, max 17). Motor deficits in the best medical on of our PD subjects in the MDS-UPDRS part III scored in mean 15.4 points (SD 7.5, min 5, and max 31). Using the MDS-UPDRS part IV as scale for motor complications we measured a mean score of 0.35 points (SD 1, min 0, max 4).
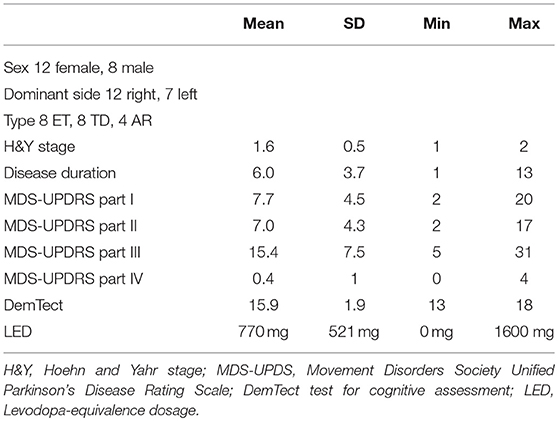
Table 1. Patient characteristic.
Whole-Brain MR Spectroscopic Imaging
Example averaged MR spectra of each brain lobe and cerebellum obtained from a PD patient (female, 62 years) are shown in Figure 1. The lobar and cerebellar concentrations of NAA, Cho, tCr, Glu, Gln, and mIns measured in the PD patients and healthy controls are drawn as Box-Whisker-plots in Figure 2, which shows that several lobes exhibit clear differences between the metabolite values of the patients and the controls.
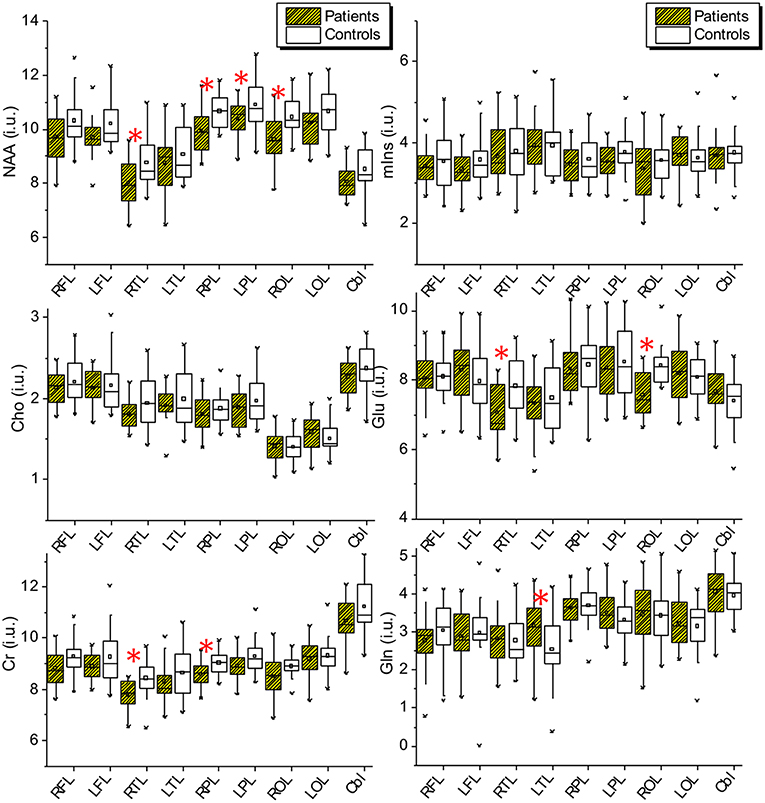
Figure 2. Lobar and cerebellar concentrations of NAA, Cho, tCr, Glu, Gln, and mIns measured in the PD patients and the healthy controls. NAA, N-acetyl-aspartat; mIns, myo-inusitol; Cho, choline; Glu, glutamate; Cr, creatinin; Gln, glumatine; RFL, right frontal lobe; LFL, left frontal lobe; RPL, right parietal lobe; LPL, left parietal lobe; RTL, right temporal lobe; LTL, left temporal lobe; ROL, right occipital lobe; LOL, left occipital lobe; Cbl, cerebellum.
Results of paired t-tests for comparisons of metabolite concentrations, spectral linewidths, and the fractional volumes of CSF and total brain tissue between patients and controls are shown in Tables 2, 3. Paired t-tests revealed that in patients NAA was decreased significantly in the right temporal lobe (−8.6%, p = 0.010), in the right parietal lobe (−6.7% and p = 0.007), and the right occipital lobe (−8%, p = 0.005), with a tendency to decrease in the left parietal lobe (p = 0.034) and with a weak tendency to decrease in both frontal lobes (p = 0.073 and 0.061 respectively); Cho did not show significant changes but revealed a weak tendency to decrease in right temporal lobe (p = 0.066); tCr was decreased significantly in the right temporal lobe (−7.6%, p = 0.004) and with a tendency to decrease in the right parietal lobe (−4.8%, p = 0.033); glutamate was decreased significantly in the right temporal lobe (−9.9%, p = 0.006) and the right occipital lobe (−10.2%, p = 0.001); glutamine showed a tendency to increase in the left temporal lobe (20.0%, p = 0.045); mIns did not show significant differences between patients and controls (Table 2). Moreover, in comparison to healthy controls the patients showed significantly broader spectral linewidths in both frontal lobes and the right occipital lobe, and with a trend to increase in the left occipital lobe. Slightly decreased FVCSF in frontal lobes and in left parietal lobe, and a slight increase of FVTB in left frontal lobe were also found in PD patients (Table 3). On the other hand, the cerebellum did not reveal significant differences between patients and controls concerning metabolite concentrations, spectral linewidth and FVCSF.
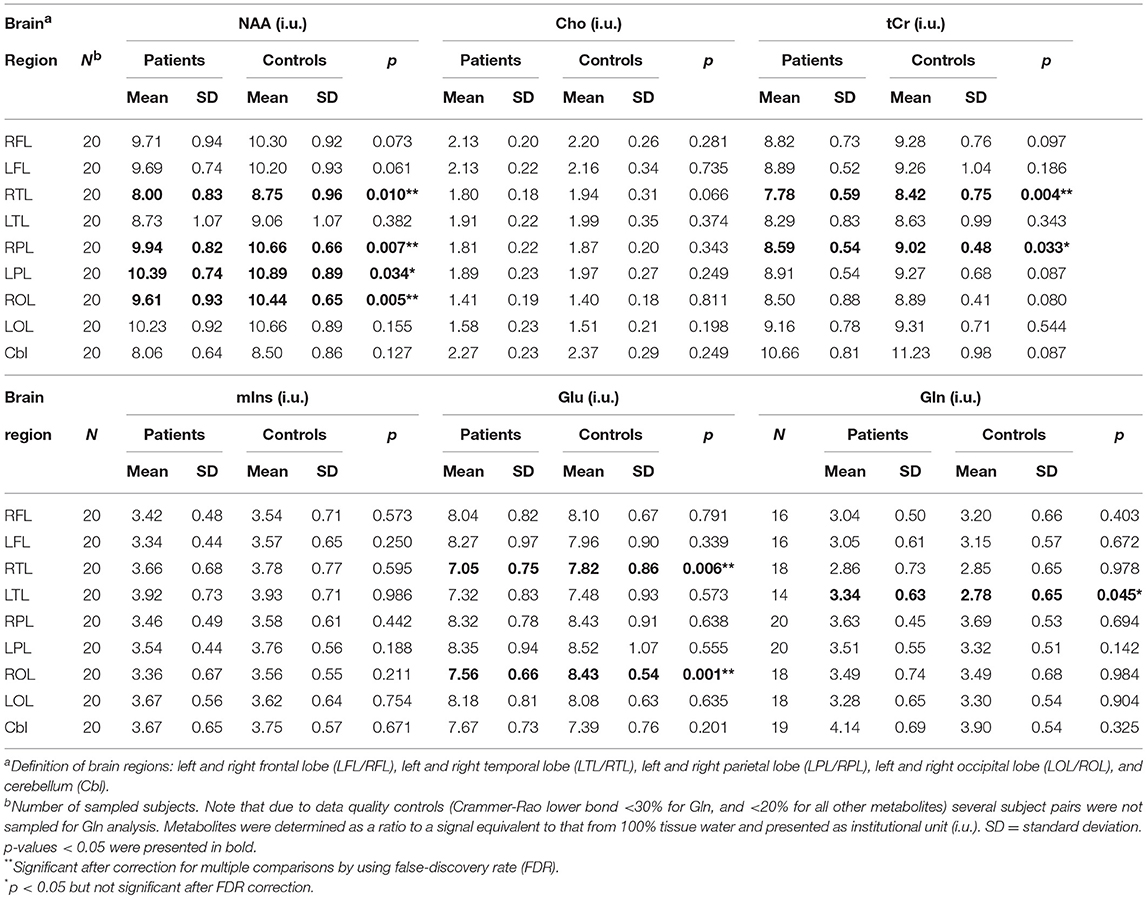
Table 2. Comparison of lobar and cerebellar metabolite concentrations between patients and controls with paired t-tests.
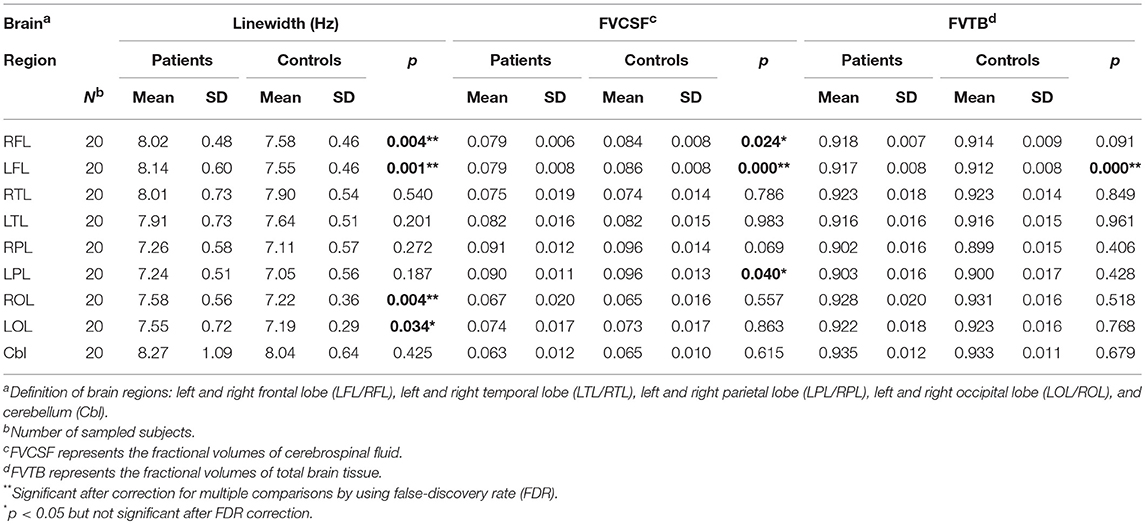
Table 3. Comparison of the spectral linewidths and the fractional volumes of cerebrospinal fluid and total brain tissue between patients and controls with paired t-tests.
The results of paired t-tests between pooled lobar metabolite concentrations of the patients and the controls are shown in Table 4, and those of the correlation tests of MDS-UPDRS to pooled lobar NAA concentrations in patients in Table 5. In comparison to healthy controls the patients revealed different grades of alterations in pooled lobar metabolite concentrations in respect to contralateral or ipsilateral hemispheres corresponding to the prominently affected body side.
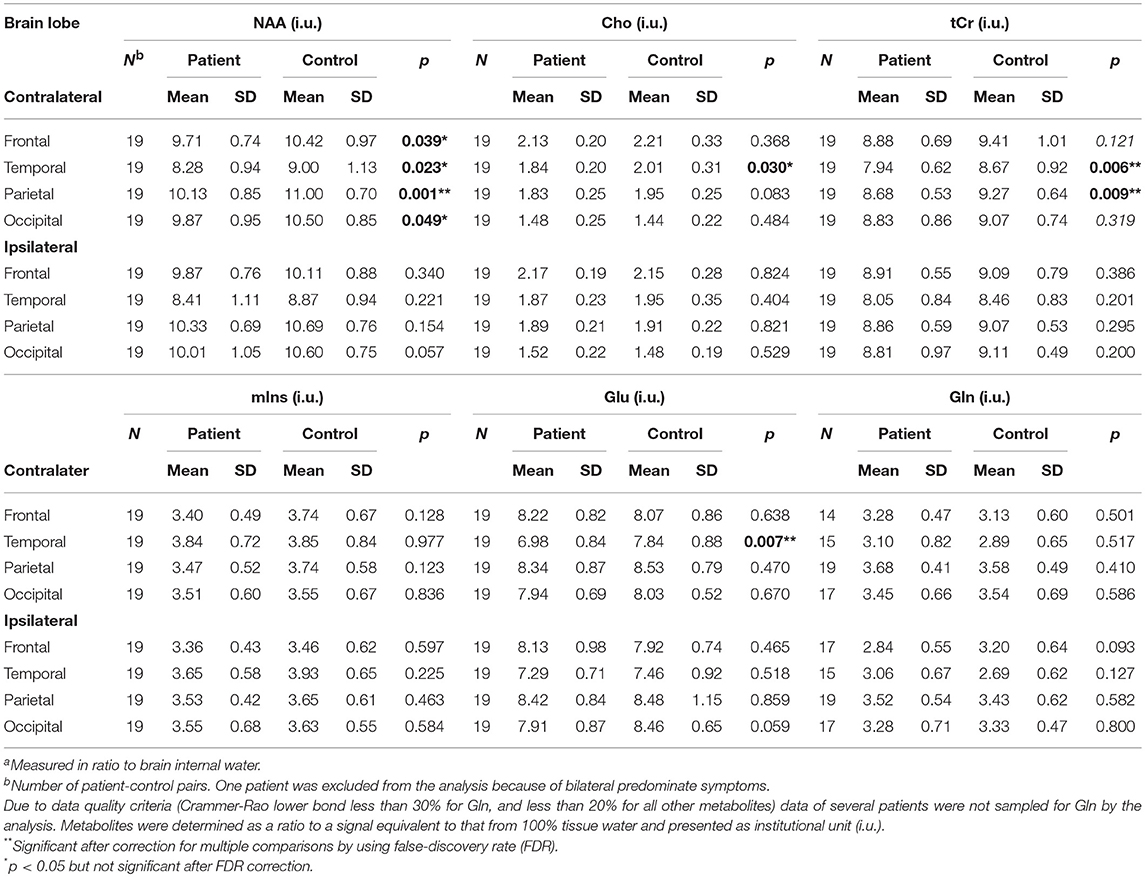
Table 4. Paired t-test of lobar metabolite levelsa between patients and controls measured in brain hemisphere contralateral or ipsilateral to affected/more affected body side as indicated.
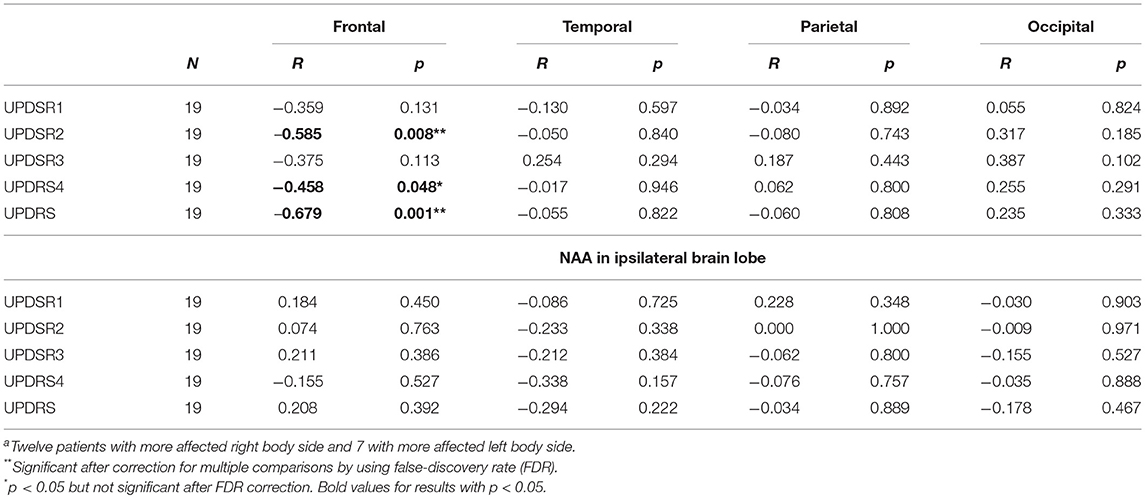
Table 5. Correlations of MDS-UPDRS to brain NAA concentrations in respect to the most affected body side of the patients estimated by Spearman's correlation testa.
In the contralateral hemisphere, NAA decreased significantly or with a trend in all 4 brain lobes (−6.82% and p = 0.039 in FL, −8.00% and p = 0.023 in TL, −7.96% and p = 0.001 in PL, and −6.07% and p = 0.049 in OL); Cho showed a trend to decrease in one lobe (−8.47% and p = 0.030 in TL); tCr significantly decreased in two lobes (−8.52% and p = 0.006 in TL, and −6.40% and p = 0.009 in PL); glutamate decreased only in TL (−11.06% and p = 0.007); mIns and Gln did not show significant alterations (Table 4). Spearman's correlation test revealed significant correlations between MDS-UPDRS scores and lobar NAA concentrations in contralateral frontal lobe in patients, i.e., significant negative correlations of the NAA in contralateral frontal lobe to UPDRS2 as motor activities of daily living (R = −0.585, p = 0.008), and to total UPDRS (R = −0.679, p = 0.001) (Table 5), and a trend of negative correction to UPDRS4 as treatment complications (R = −0.458, p = 0.048).
In the ipsilateral hemisphere, only NAA and Glu revealed a weak tendency to decrease in occipital lobe (p = 0.057 for NAA and 0.059 for Glu) (Table 4), and no significant correlations of NAA to MDS -UPDRS was found (Table 5).
Discussion
In this study we assessed changes of brain lobar and cerebellar metabolites in early stage PD. Our major findings are the significant alterations of NAA contents in PD subjects in the whole brain in comparison to age-matched healthy controls: NAA was decreased or showed a tendency to decreased values in a majority of brain lobes (6 of 8 lobes). Of course, variations in tissue water content, which was used to calibrate the metabolite contents, could impact the measured concentration of metabolites in spectroscopy, however, this would affect not only NAA but all metabolites and since they were not all altered significantly we found no evidence for changes in tissue water content. After pooling brain lobar metabolites in hemispheres contralateral and ipsilateral to the dominantly affected body side significantly decreased NAA contents was seen in all four contralateral brain lobes, where frontal lobar NAA revealed negative correlations to clinical scores of UPDRS2, UPDRS4, and total UPDRS. Moreover, we found tCr decreased in two contralateral brain lobes, and Cho and glutamate decreased each in one contralateral brain lobe. In parallel, a significant broadening of spectral linewidth was found in both frontal and occipital lobes.
The findings of decreased NAA, Cho, tCr, and Glu, and no changes of mIns were qualitatively consistent with those previously reported, despite several methodological differences on targeted brain regions or tissue type. For example, studies in de novo PD subjects showed a reduction in NAA in the motor cortex (22) and putamen (23). Decreased NAA/tCr and Glu/tCr in PD subjects with psychosis were reported (24). Brain NAA, Cho, and tCr were also measured over brain lobes with long echo time wbMRSI by Levin et al., who found decreased NAA/tCr and Cho/tCR in gray matter of temporal lobe, decreased NAA in right occipital lobe, and decreased NAA/tCr (25), anyhow, a detailed comparison to present study is difficult due to different patient selections and not separating tissue type between gray and white matter in the present. Since NAA is localized within neurons and involved in synaptic processes a decrease of brain NAA could be due to either a reduction in brain tissue volume or due to reduced neuronal function and metabolism (13). As no decrease of brain tissue volume in PD subjects was found the observed decreases of NAA most likely reflect reduced neuronal function and metabolism, which is consistent with the observations of decreased tCr and Glu, suggesting alterations in brain energy metabolism (tCr) and glutamatergic neuronal activity (Glu). The observed increase of glutamine in LTL could be a reactive response to reduced glutamate. Our findings of increased spectral linewidth in bilateral frontal and occipital lobes are most likely due to magnetic susceptibility-induced local magnetic field distortions and suggest pathological accumulation of brain iron in these brain regions, which has also been observed by other MRI measurements (26–28).
Present observation that brain lobar metabolite alterations were altered differently across the hemispheres contralateral and ipsilateral to the dominantly affected body side provides more insight into PD related brain metabolite changes. In the contralateral hemisphere, the main metabolic alterations were observed, which included significantly decreased NAA in all 4 brain lobes. In the ipsilateral hemisphere, smaller metabolic changes were seen, e.g., with PD subjects having lower mean NAA values in all lobes but not reaching significance. These observations indicate that the brain metabolite alterations are dominant in the hemisphere contralateral to more affected body side, reflecting PD-associated asymmetrical reduction of neuronal function and metabolism in early stage PD, which is consistent with previously reported lateralization findings of decreased NAA/tCr (29) and reduced dopamine uptake (30) in contralateral basal ganglia in early PD. Within the dominant hemisphere the distributions of the metabolic alterations varied among the brain lobes. The greatest changes occurred in the temporal lobe, with involvement of 3 metabolites (−8.00% for NAA, −8,47% for Cho, and −8.52% for tCr), the next occurred in the parietal lobe with involvement of 2 metabolites (−7.96% for NAA and −6.40% for tCr), while frontal and occipital lobes revealed decreases of one metabolite (−6.82% for FL and −6.07% for OL for NAA), showing the inhomogeneity of brain structures involved in PD process that may relate to their contained substructures. Interestingly, corresponding to the fact that the basal ganglia, which has been reported to be involved in PD pathological processes in previous MRS studies (22, 23, 31–36), are located in the temporal and frontal lobar atlas regions used in this study, we found that most metabolic changes occurred in temporal lobe, while the frontal NAA changes correlated significantly to MDS-UPDRS score describing clinical symptoms. Previous studies have reported a significant correlation of NAA/tCr to clinical symptoms (11, 31, 33, 34). However, this study found that tCr was also altered in PD, which is consistent with reduced concentrations of phosphates in the striatum and midbrain that has been interpreted as early mitochondrial dysfunction in PD patients (37). Therefore, the use of metabolite ratios to tCr may underestimate PD related metabolic changes.
This study performed the clinical evaluation and wbMRSI of the patients in their best medical condition; therefore, the low MDS-UPDRS part III score may underestimate the degree of disability as the treatment reduces this score by at least 20–30%. This may also have contributed to the lack of a significant correlation of the MDS-UPDRS III with spectroscopic findings. However, the MDS-UPDRS part II score for impairment of daily living reflects more selectively the impact of the disease (17, 24). The observed correlations of NAA in the frontal lobe, which includes important areas of the telencephalic dopaminergically innervated structures, with the MDS-UPDRS II, therefore, indicate the potential of wbMRSI for assessment of disability in Parkinson's disease (38, 39).
Treatment of PD is difficult and a lot of therapeutic agents are available (40). The impact of treatment in MRS studies has been rarely investigated. While some studies reported patients' on or off status during examination and imaging (11, 22, 25, 41–47), for a large number of studies the medication status is unclear (9, 31, 32, 37, 48–56). A recent study found significant metabolic changes in PD subjects between medical on and off state (41). These authors found a significant reduction in NAA, tCr, and mIns in the clinical off which is reversed for NAA und tCr under acute L-DOPA challenge (200 mg intake) (41). Another early PD spectroscopic study found no metabolic changes in the putamen before and after apomorphine therapy in 5 PD patients (57). Lucetti et al. reported an increased Cho/Cr ratio after 6 months of treatment with the dopamine agonist pergolide in early de-novo PD patients (43). Taking this limited amount of data together, PD therapy seems to impact spectroscopic measurements, however, dopamine agonists might not similarly influence spectroscopic changes of metabolite profile. Hence, the impact of different PD therapeutics is not yet clear and might vary in different brain regions. Dopaminergic innervated brain regions seem to show more likely PD medication dependent changes in metabolite profile. The short echo time wbMRSI offers a potential method to study these neurometabolic effects in more detail for a variety of brain regions in the future. Importantly, the impact of off state, acute levodopa challenge, and chronic treatment should be addressed in future studies.
It remains unclear which brain region and metabolites could be used as a valid spectroscopic marker for PD or atypical Parkinsonism. For this purpose wbMRSI could be very useful, because it provides a way to measure brain metabolites not only in large brain scales but also in multiple specific brain areas simultaneously, thus many hypotheses could be tested in one set of data (13, 19). Clinically established imaging diagnostics are often unspecific and in PD the MRI is often normal (2–6). In atypical Parkinsonism structural changes can be seen in MRI scans, e.g., changes like midbrain atrophy, putaminal rim, hot cross bun sign and others, are indicative of different atypical Parkinson syndromes, however, in the absence of these signs the diagnosis is difficult (4, 6, 58). DAT-SCAN as marker for degeneration of dopaminergic transporters on nigrostriatal projection neurons of the ventral midbrain is very sensitive for early detection of PD (59). The discrimination of Parkinson syndromes by the DAT-SCAN is not possible, because all syndromes have the common pathological hallmark of degeneration of midbrain dopaminergic neurons. By FDG-PET imaging PD and atypical Parkinsonism could be discriminated by specific metabolic patterns (60). Unfortunately, FDG-PET is off-label for the usage in the differential diagnosis of Parkinsonism. Furthermore, the methods of DAT-SCAN and FDG-PET require radiotracers. As an alternative WbMRSI offers a potential method for discrimination of PD and Parkinsonism without exposure to radioactive substances.
Present study focused on obtaining an overview of early PD-related metabolic alterations within the whole brain. Therefore, the cortical lobes and the cerebellum were selected as regions of interest in order to cover the whole brain. However, an accompanied limitation is that any regional metabolic inhomogeneity within the lobar or cerebellar structures was not accounted, especially the different contributions of the white matter, the cortical gray matter and basal ganglia were not separately evaluated. As an ongoing project PD related metabolic changes in multiple specific brain areas will be investigated in our further study. These results may then provide information related to specific brain functional networks and contribute to our understanding of the pathophysiological processes underlying PD.
Limitations of this study include the lack of correction of the results for age and for partial volume. However, the age effect was minimized by matching the patients and controls on a one-by-one basis appropriately in respect to age (and to gender). The partial volume effect was minimized by including only basic voxels containing <30% CSF for obtaining the integrated spectrum of each lobar brain region, and by correction for CSF volume contribution to measured metabolite values. Further validation of this study is also needed in a larger sample of patients together with a more comprehensive clinical phenotyping of PD subtypes (61–63). The identification of PD related metabolic changes in the white matter, cortical gray matter and basal ganglia may help to understand the metabolic processes during disease progression and spreading of neurodegenerative pathology in the brain (33, 64).
Conclusion
This study has shown that NAA changed nearly ubiquitous in all brain lobes with different grades and with a clear lateralization contralateral to the major symptoms in early PD subjects. This finding suggests that NAA may be a promising spectroscopic marker for early diagnosis of PD (8), which is also favored by the observations of significant negative correlations between frontal NAA levels and the clinical UPDRS scores. Future studies with larger cohorts of patients with different stages of PD are needed to verify these results.
In conclusion, this study has demonstrated that even in early-stage PD brain metabolic alterations are evident and involved in all brain lobar areas of the cerebral hemisphere contralateral to the dominant side of disability. This result indicates that PD affects not only brain local regions by dopaminergic denervation, but also the brain network within the hemisphere. The novel wbMRSI-detectable brain metabolic alterations in PD may serve as promising biomarkers for early PD diagnosis, differential diagnosis of Parkinsonism (32) and with emerging disease-modifying drugs also for treatment monitoring (65, 66).
Ethics Statement
Human subject studies were carried out with approval from the local Ethics Committee of Hannover Medical School (No. 6167-2016) and all subjects gave written informed consent.
Author Contributions
XD designed the study. MK, DD, and FW were responsible for recruitment. MK and PB performed the clinical characterization of the patients. PB and PN performed the MRIs. XD performed the statistical analysis. MK, FW, DD, MD, AM, SS, HL, and XD interpreted the data. MK, FW, and XD wrote the manuscript. PB, DD, MD, AM, SS, and HL coedited the manuscript. All authors had access to the data generated in the study including the statistical analysis and agree to submit the paper for publication.
Funding
This research was supported by the DFG Grand to XD and the NIH Grand for AM. The sponsors had no influence on the carrying out of the study or the writing of the manuscript.
Conflict of Interest Statement
The authors declare that the research was conducted in the absence of any commercial or financial relationships that could be construed as a potential conflict of interest.
Acknowledgments
We would like to thank our research volunteers.
References
1. Adler CH, Beach TG, Hentz JG, Shill HA, Caviness JN, Driver-Dunckley E, et al. Low clinical diagnostic accuracy of early vs advanced Parkinson disease: clinicopathologic study. Neurology. (2014) 83:406–12. doi: 10.1212/WNL.0000000000000641
2. Barsottini OGP, Ferraz HB, Maia ACMJ, Silva CJ, Rocha AJ. Differentiation of Parkinson's disease and progressive supranuclear palsy with magnetic resonance imaging: the first Brazilian experience. Parkinsonism Relat Disord. (2007) 13:389–93. doi: 10.1016/j.parkreldis.2006.12.011
3. Kraft E, Schwarz J, Trenkwalder C, Vogl T, Pfluger T, Oertel WH. The combination of hypointense and hyperintense signal changes on T2-weighted magnetic resonance imaging sequences: a specific marker of multiple system atrophy? Arch Neurol. (1999) 56:225–8.
4. Schrag A, Kingsley D, Phatouros C, Mathias CJ, Lees AJ, Daniel SE, et al. Clinical usefulness of magnetic resonance imaging in multiple system atrophy. J Neurol Neurosurg Psychiatr. (1998) 65:65–71. doi: 10.1136/jnnp.65.1.65
5. Seppi K, Schocke MFH, Esterhammer R, Kremser C, Brenneis C, Mueller J, et al. Diffusion-weighted imaging discriminates progressive supranuclear palsy from PD, but not from the Parkinson variant of multiple system atrophy. Neurology. (2003) 60:922–7. doi: 10.1212/01.wnl.0000049911.91657.9d
6. Yekhlef F, Ballan G, Macia F, Delmer O, Sourgen C, Tison F. Routine MRI for the differential diagnosis of Parkinson's disease, MSA, PSP, and CBD. J Neural Transm. (2003) 110:151–69. doi: 10.1007/s00702-002-0785-5
7. Saeed U, Compagnone J, Aviv RI, Strafella AP, Black SE, Lang AE, et al. Imaging biomarkers in Parkinson's disease and Parkinsonian syndromes: current and emerging concepts. Transl Neurodegener. (2017) 6:8. doi: 10.1186/s40035-017-0076-6
8. Ciurleo R, Di Lorenzo G, Bramanti P, Marino S. Magnetic resonance spectroscopy: an in vivo molecular imaging biomarker for Parkinson's disease? BioMed Res Int. (2014) 2014:519816. doi: 10.1155/2014/519816
9. Zanigni S, Testa C, Calandra-Buonaura G, Sambati L, Guarino M, Gabellini A, et al. The contribution of cerebellar proton magnetic resonance spectroscopy in the differential diagnosis among Parkinsonian syndromes. Parkinsonism Relat Disord. (2015) 21:929–37. doi: 10.1016/j.parkreldis.2015.05.025
10. Damoiseaux JS, Beckmann CF, Arigita EJS, Barkhof F, Scheltens P, Stam CJ, et al. Reduced resting-state brain activity in the “default network” in normal aging. Cereb Cortex. (2007) 18:1856–64. doi: 10.1093/cercor/bhm207
11. Barbagallo G, Arabia G, Morelli M, Nisticò R, Novellino F, Salsone M, et al. Thalamic neurometabolic alterations in tremulous Parkinson's disease: a preliminary proton MR spectroscopy study. Parkinsonism Relat Disord. (2017) 43:78–84. doi: 10.1016/j.parkreldis.2017.07.028
12. Siman-Tov T, Bosak N, Sprecher E, Paz R, Eran A, Aharon-Peretz J, et al. Early age-related functional connectivity decline in high-order cognitive networks. Front Aging Neurosci. (2017) 8:330. doi: 10.3389/fnagi.2016.00330
13. Ding XQ, Maudsley AA, Sabati M, Sheriff S, Schmitz B, Schütze M, et al. Physiological neuronal decline in healthy aging human brain — an in vivo study with MRI and short echo-time whole-brain 1H MR spectroscopic imaging. Neuroimage. (2016) 137:45–51. doi: 10.1016/j.neuroimage.2016.05.014
14. Goryawala MZ, Sheriff S, Maudsley AA. Regional distributions of brain glutamate and glutamine in normal subjects. NMR Biomed. (2016) 29:1108–16. doi: 10.1002/nbm.3575
15. Maghsudi H, Schmitz B, Maudsley AA, Sheriff S, Bronzlik P, Schütze M, et al. Regional metabolite concentrations in aging human brain: comparison of short-TE whole brain MR spectroscopic imaging and single voxel spectroscopy at 3T. Clin Neuroradiol. (2019). doi: 10.1007/s00062-018-00757-x. [Epub ahead of print].
16. Titova N, Martinez-Martin P, Katunina E, Chaudhuri KR. Advanced Parkinson's or “complex phase” Parkinson's disease? Re-evaluation is needed. J Neural Transm. (2017) 124:1529–37. doi: 10.1007/s00702-017-1799-3
17. Goetz CG, Tilley BC, Shaftman SR, Stebbins GT, Fahn S, Martinez-Martin P, et al. Movement Disorder Society-sponsored revision of the Unified Parkinson's Disease Rating Scale (MDS-UPDRS): scale presentation and clinimetric testing results. Mov Disord. (2008) 23:2129–70. doi: 10.1002/mds.22340
18. Kalbe E, Kessler J, Calabrese P, Smith R, Passmore AP, Brand M, et al. DemTect: a new, sensitive cognitive screening test to support the diagnosis of mild cognitive impairment and early dementia. Int J Geriat Psychiatry. (2004) 19:136–43. doi: 10.1002/gps.1042
19. Ding XQ, Maudsley AA, Sabati M, Sheriff S, Dellani PR, Lanfermann H. Reproducibility and reliability of short-TE whole-brain MR spectroscopic imaging of human brain at 3T. Magn Reson Med. (2015) 73:921–8. doi: 10.1002/mrm.25208
20. Barker PB, Soher BJ, Blackband SJ, Chatham JC, Mathews VP, Bryan RN. Quantitation of proton NMR spectra of the human brain using tissue water as an internal concentration reference. NMR Biomed. (1993) 6:89–94.
21. Maudsley AA, Domenig C, Govind V, Darkazanli A, Studholme C, Arheart K, et al. Mapping of brain metabolite distributions by volumetric proton MR spectroscopic imaging (MRSI). Magn Reson Med. (2009) 61:548–59. doi: 10.1002/mrm.21875
22. Lucetti C, Del Dotto P, Gambaccini G, Bernardini S, Bianchi MC, Tosetti M, et al. Proton magnetic resonance spectroscopy (1H-MRS) of motor cortex and basal ganglia in de novo Parkinson's disease patients. Neurol Sci. (2001) 22:69–70. doi: 10.1007/s100720170051
23. Ellis CM, Lemmens G, Williams SC, Simmons A, Dawson J, Leigh PN, et al. Changes in putamen N-acetylaspartate and choline ratios in untreated and levodopa-treated Parkinson's disease: a proton magnetic resonance spectroscopy study. Neurology. (1997) 49:438–44.
24. Rodríguez-Violante M, Cervantes-Arriaga A, González-Latapí P, León-Ortiz P, la Fuente-Sandoval de C, Corona T. Proton magnetic resonance spectroscopy changes in Parkinson's disease with and without psychosis. Rev Invest Clin. (2015) 67:227–34.
25. Levin BE, Katzen HL, Maudsley A, Post J, Myerson C, Govind V, et al. Whole-brain proton MR spectroscopic imaging in Parkinson's disease. J Neuroimaging. (2012) 24:39–44. doi: 10.1111/j.1552-6569.2012.00733.x
26. Boelmans K, Holst B, Hackius M, Finsterbusch J, Gerloff C, Fiehler J, et al. Brain iron deposition fingerprints in Parkinson's disease and progressive supranuclear palsy. Mov Disord. (2012) 27:421–7. doi: 10.1002/mds.24926
27. Mitsumori F, Watanabe H, Takaya N. Estimation of brain iron concentration in vivo using a linear relationship between regional iron and apparent transverse relaxation rate of the tissue water at 4.7T. Magn Reson Med. (2009) 62:1326–30. doi: 10.1002/mrm.22097
28. Wang JY, Zhuang QQ, Zhu LB, Zhu H, Li T, Li R, et al. Meta-analysis of brain iron levels of Parkinson's disease patients determined by postmortem and MRI measurements. Sci Rep. (2016) 6:36669. doi: 10.1038/srep36669
29. Choe BY, Park JW, Lee KS, Son BC, Kim MC, Kim BS, et al. Neuronal laterality in Parkinson's disease with unilateral symptom by in vivo 1H magnetic resonance spectroscopy. Invest Radiol. (1998) 33:450–5.
30. Lin SC, Lin KJ, Hsiao IT, Hsieh CJ, Lin WY, Lu CS, et al. In vivo detection of monoaminergic degeneration in early Parkinson disease by (18)F-9-fluoropropyl-(+)-dihydrotetrabenzazine PET. J Nucl Med. (2014) 55:73–9. doi: 10.2967/jnumed.113.121897
31. Wu G, Shen YJ, Huang MH, Xing Z, Liu Y, Chen J. Proton MR spectroscopy for monitoring pathologic changes in the Substantia nigra and Globus pallidus in Parkinson disease. Am J Roentgenol. (2016) 206:385–9. doi: 10.2214/AJR.14.14052
32. Groger A, Bender B, Wurster I, Chadzynski GL, Klose U, Berg D. Differentiation between idiopathic and atypical Parkinsonian syndromes using three-dimensional magnetic resonance spectroscopic imaging. J Neurol Neurosurg Psychiatr. (2013) 84:644–9. doi: 10.1136/jnnp-2012-302699
33. Cao H, Shi J, Cao B, Kang B, Zhang M, Qu Q. Evaluation of the braak staging of brain pathology with (1)H-MRS in patients with Parkinson's disease. Neurosci Lett. (2017) 660:57–62. doi: 10.1016/j.neulet.2017.08.050
34. Guan J, Rong Y, Wen Y, Wu H, Qin H, Zhang Q, et al. Detection and application of neurochemical profile by multiple regional (1)H-MRS in Parkinson's disease. Brain Behav. (2017) 7:e00792. doi: 10.1002/brb3.792
35. Geng DY, Li YX, Zee CS. Magnetic resonance imaging-based volumetric analysis of basal ganglia nuclei and substantia nigra in patients with Parkinson's disease. Neurosurgery. (2006) 58:256–62. doi: 10.1227/01.NEU.0000194845.19462.7B
36. Tedeschi G, Litvan I, Bonavita S, Bertolino A, Lundbom N, Patronas NJ, et al. Proton magnetic resonance spectroscopic imaging in progressive supranuclear palsy, Parkinson's disease and corticobasal degeneration. Brain. (1997) 120:1541–52.
37. Hattingen E, Magerkurth J, Pilatus U, Mozer A, Seifried C, Steinmetz H, et al. Phosphorus and proton magnetic resonance spectroscopy demonstrates mitochondrial dysfunction in early and advanced Parkinson's disease. Brain. (2009) 132:3285–97. doi: 10.1093/brain/awp293
38. Rodriguez-Blazquez C, Rojo-Abuin JM, Alvarez-Sanchez M, Arakaki T, Bergareche-Yarza A, Chade A, et al. The MDS-UPDRS part II (motor experiences of daily living) resulted useful for assessment of disability in Parkinson's disease. Parkinsonism Relat Disord. (2013) 19:889–93. doi: 10.1016/j.parkreldis.2013.05.017
39. Klietz M, Tulke A, Müschen LH, Paracka L, Schrader C, Dressler DW, et al. Impaired quality of life and need for palliative care in a German cohort of advanced Parkinson's disease patients. Front Neurol. (2018) 9:120. doi: 10.3389/fneur.2018.00120
40. Klietz M, Greten S, Wegner F, Höglinger GU. Safety and tolerability of pharmacotherapies for Parkinson's disease in geriatric patients. Drugs Aging. (2019) 5:525–20. doi: 10.1007/s40266-019-00654-z
41. Mazuel L, Chassain C, Jean B, Pereira B, Cladière A, Speziale C, et al. Proton MR spectroscopy for diagnosis and evaluation of treatment efficacy in Parkinson disease. Radiology. (2016) 278:505–13. doi: 10.1148/radiol.2015142764
42. Griffith HR, Hollander den JA, Okonkwo OC, O'Brien T, Watts RL, Marson DC. Brain metabolism differs in Alzheimer's disease and Parkinson's disease dementia. Alzheimer's Dement. (2008) 4:421–7. doi: 10.1016/j.jalz.2008.04.008
43. Lucetti C, Del Dotto P, Gambaccini G, Ceravolo R, Logi C, Berti C, et al. Influences of dopaminergic treatment on motor cortex in Parkinson disease: a MRI/MRS study. Mov Disord. (2007) 22:2170–5. doi: 10.1002/mds.21576
44. Camicioli RM, Hanstock CC, Bouchard TP, Gee M, Fisher NJ, Martin WRW. Magnetic resonance spectroscopic evidence for presupplementary motor area neuronal dysfunction in Parkinson's disease. Mov Disord. (2007) 22:382–6. doi: 10.1002/mds.21288
45. Watanabe H, Fukatsu H, Katsuno M, Sugiura M, Hamada K, Okada Y, et al. Multiple regional 1H-MR spectroscopy in multiple system atrophy: NAA/Cr reduction in pontine base as a valuable diagnostic marker. J Neurol Neurosurg Psychiatr. (2004) 75:103–9.
46. O'Neill J, Schuff N, Marks WJ, Feiwell R, Aminoff MJ, Weiner MW. Quantitative1H magnetic resonance spectroscopy and MRI of Parkinson's disease. Mov Disord. (2002) 17:917–27. doi: 10.1002/mds.10214
47. Abe K, Terakawa H, Takanashi M, Watanabe Y, Tanaka H, Fujita N, et al. Proton magnetic resonance spectroscopy of patients with parkinsonism. Brain Res Bull. (2000) 52:589–95.
48. Stamelou M, Pilatus U, Reuss A, Magerkurth J, Eggert KM, Knake S, et al. In vivo evidence for cerebral depletion in high-energy phosphates in progressive supranuclear palsy. J Cereb Blood Flow Metab. (2009) 29:861–70. doi: 10.1038/jcbfm.2009.2
49. Chagas MHN, Tumas V, Pena-Pereira MA, Machado-de-Sousa JP, Santos dos AC, Sanches RF, et al. Neuroimaging of major depression in Parkinson's disease: cortical thickness, cortical and subcortical volume, and spectroscopy findings. J Psychiatr Res. (2017) 90:40–5. doi: 10.1016/j.jpsychires.2017.02.010
50. Zhou B, Yuan F, He Z, Tan C. Application of proton magnetic resonance spectroscopy on substantia nigra metabolites in Parkinson's disease. Brain Imaging Behav. (2013) 8:97–101. doi: 10.1007/s11682-013-9251-2
51. Groger A, Kolb R, Schafer R, Klose U. Dopamine reduction in the substantia nigra of Parkinson's disease patients confirmed by in vivo magnetic resonance spectroscopic imaging. PLoS ONE. (2014) 9:e84081. doi: 10.1371/journal.pone.0084081
52. Takado Y, Igarashi H, Terajima K, Shimohata T, Ozawa T, Okamoto K, et al. Brainstem metabolites in multiple system atrophy of cerebellar type: 3.0-T magnetic resonance spectroscopy study. Mov Disord. (2011) 26:1297–302. doi: 10.1002/mds.23550
53. Guevara CA, Blain CR, Stahl D, Lythgoe DJ, Leigh PN, Barker GJ. Quantitative magnetic resonance spectroscopic imaging in Parkinson's disease, progressive supranuclear palsy and multiple system atrophy. Eur J Neurol. (2010) 17:1193–202. doi: 10.1111/j.1468-1331.2010.03010.x
54. Camicioli RM, Korzan JR, Foster SL, Fisher NJ, Emery DJ, Bastos AC, et al. Posterior cingulate metabolic changes occur in Parkinson's disease patients without dementia. Neurosci Lett. (2004) 354:177–80. doi: 10.1016/j.neulet.2003.09.076
55. Clarke CE, Lowry M. Basal ganglia metabolite concentrations in idiopathic Parkinson's disease and multiple system atrophy measured by proton magnetic resonance spectroscopy. Eur J Neurol. (2000) 7:661–5. doi: 10.1046/j.1468-1331.2000.00111.x
56. Barbagallo G, Morelli M, Quattrone A, Chiriaco C, Vaccaro MG, Gullà D, et al. In vivo evidence for decreased scyllo-inositol levels in the supplementary motor area of patients with progressive supranuclear palsy: a proton MR spectroscopy study. Parkinsonism Relat Disord. (2018) 62:185–91. doi: 10.1016/j.parkreldis.2018.12.008
57. Clarke CE, Lowry M, Horsman A. Unchanged basal ganglia N-acetylaspartate and glutamate in idiopathic Parkinson's disease measured by proton magnetic resonance spectroscopy. Mov Disord. (1997) 12:297–301. doi: 10.1002/mds.870120306
58. Kwon KY, Choi CG, Kim JS, Lee MC, Chung SJ. Diagnostic value of brain MRI and 18F-FDG PET in the differentiation of Parkinsonian-type multiple system atrophy from Parkinson's disease. Eur J Neurol. (2008) 15:1043–9. doi: 10.1111/j.1468-1331.2008.02235.x
59. Booij J, Tissingh G, Boer GJ, Speelman JD, Stoof JC, Janssen AG, et al. [123I]FP-CIT SPECT shows a pronounced decline of striatal dopamine transporter labelling in early and advanced Parkinson's disease. J Neurol Neurosurg Psychiatr. (1997) 62:133–40.
60. Hellwig S, Amtage F, Kreft A, Buchert R, Winz OH, Vach W, et al. [18F]FDG-PET is superior to [123I]IBZM-SPECT for the differential diagnosis of parkinsonism. Neurology. (2012) 79:1314–22. doi: 10.1212/WNL.0b013e31826c1b0a
61. Mu J, Chaudhuri KR, Bielza C, de Pedro Cuesta J, Larrañaga P, Martinez-Martin P. Parkinson's disease subtypes identified from cluster analysis of motor and non-motor symptoms. Front Aging Neurosci. (2017) 9:301. doi: 10.3389/fnagi.2017.00301
62. Marras C. Subtypes of Parkinson's disease: state of the field and future directions. Curr Opin Neurol. (2015) 28:382–6. doi: 10.1097/WCO.0000000000000219
63. Lawton M, Baig F, Rolinski M, Ruffman C, Nithi K, May MT, et al. Parkinson's disease subtypes in the Oxford Parkinson disease centre (OPDC) discovery cohort. J Parkinsons Dis. (2015) 5:269–79. doi: 10.3233/JPD-140523
64. Braak H, Del Tredici K, Rüb U, de Vos RAI, Jansen Steur ENH, Braak E. Staging of brain pathology related to sporadic Parkinson's disease. Neurobiol Aging. (2003) 24:197–211. doi: 10.1016/S0197-4580(02)00065-9
65. Seraji-Bozorgzad N, Bao F, George E, Krstevska S, Gorden V, Chorostecki J, et al. Longitudinal study of the substantia nigra in Parkinson disease: a high-field (1) H-MR spectroscopy imaging study. Mov Disord. (2015) 30:1400–4. doi: 10.1002/mds.26323
66. Delli Pizzi S, Bellomo RG, Carmignano SM, Ancona E, Franciotti R, Supplizi M, et al. Rehabilitation program based on sensorimotor recovery improves the static and dynamic balance and modifies the basal ganglia neurochemistry: a pilot 1H-MRS study on Parkinson's disease patients. Medicine (Baltimore). (2017) 96:e8732. doi: 10.1097/MD.0000000000008732
Keywords: Parkinson's disease, whole brain, MRI, spectroscopy, biomarker, early diagnosis
Citation: Klietz M, Bronzlik P, Nösel P, Wegner F, Dressler DW, Dadak M, Maudsley AA, Sheriff S, Lanfermann H and Ding X-Q (2019) Altered Neurometabolic Profile in Early Parkinson's Disease: A Study With Short Echo-Time Whole Brain MR Spectroscopic Imaging. Front. Neurol. 10:777. doi: 10.3389/fneur.2019.00777
Received: 01 February 2019; Accepted: 03 July 2019;
Published: 17 July 2019.
Edited by:
Fabiana Novellino, Italian National Research Council (CNR), ItalyReviewed by:
Bruno J. Weder, University of Bern, SwitzerlandGaetano Barbagallo, Università degli Studi Magna Græcia di Catanzaro, Italy
Copyright © 2019 Klietz, Bronzlik, Nösel, Wegner, Dressler, Dadak, Maudsley, Sheriff, Lanfermann and Ding. This is an open-access article distributed under the terms of the Creative Commons Attribution License (CC BY). The use, distribution or reproduction in other forums is permitted, provided the original author(s) and the copyright owner(s) are credited and that the original publication in this journal is cited, in accordance with accepted academic practice. No use, distribution or reproduction is permitted which does not comply with these terms.
*Correspondence: Xiao-Qi Ding, ding.xiaoqi@mh-hannover.de
†These authors have contributed equally to this work