Spatial Prediction of Landslides Using Hybrid Integration of Artificial Intelligence Algorithms with Frequency Ratio and Index of Entropy in Nanzheng County, China


Abstract
:1. Introduction
2. Methodology
2.1. Frequency Ratio
2.2. Index of Entropy
2.3. SysFor
2.4. Logistic Regression
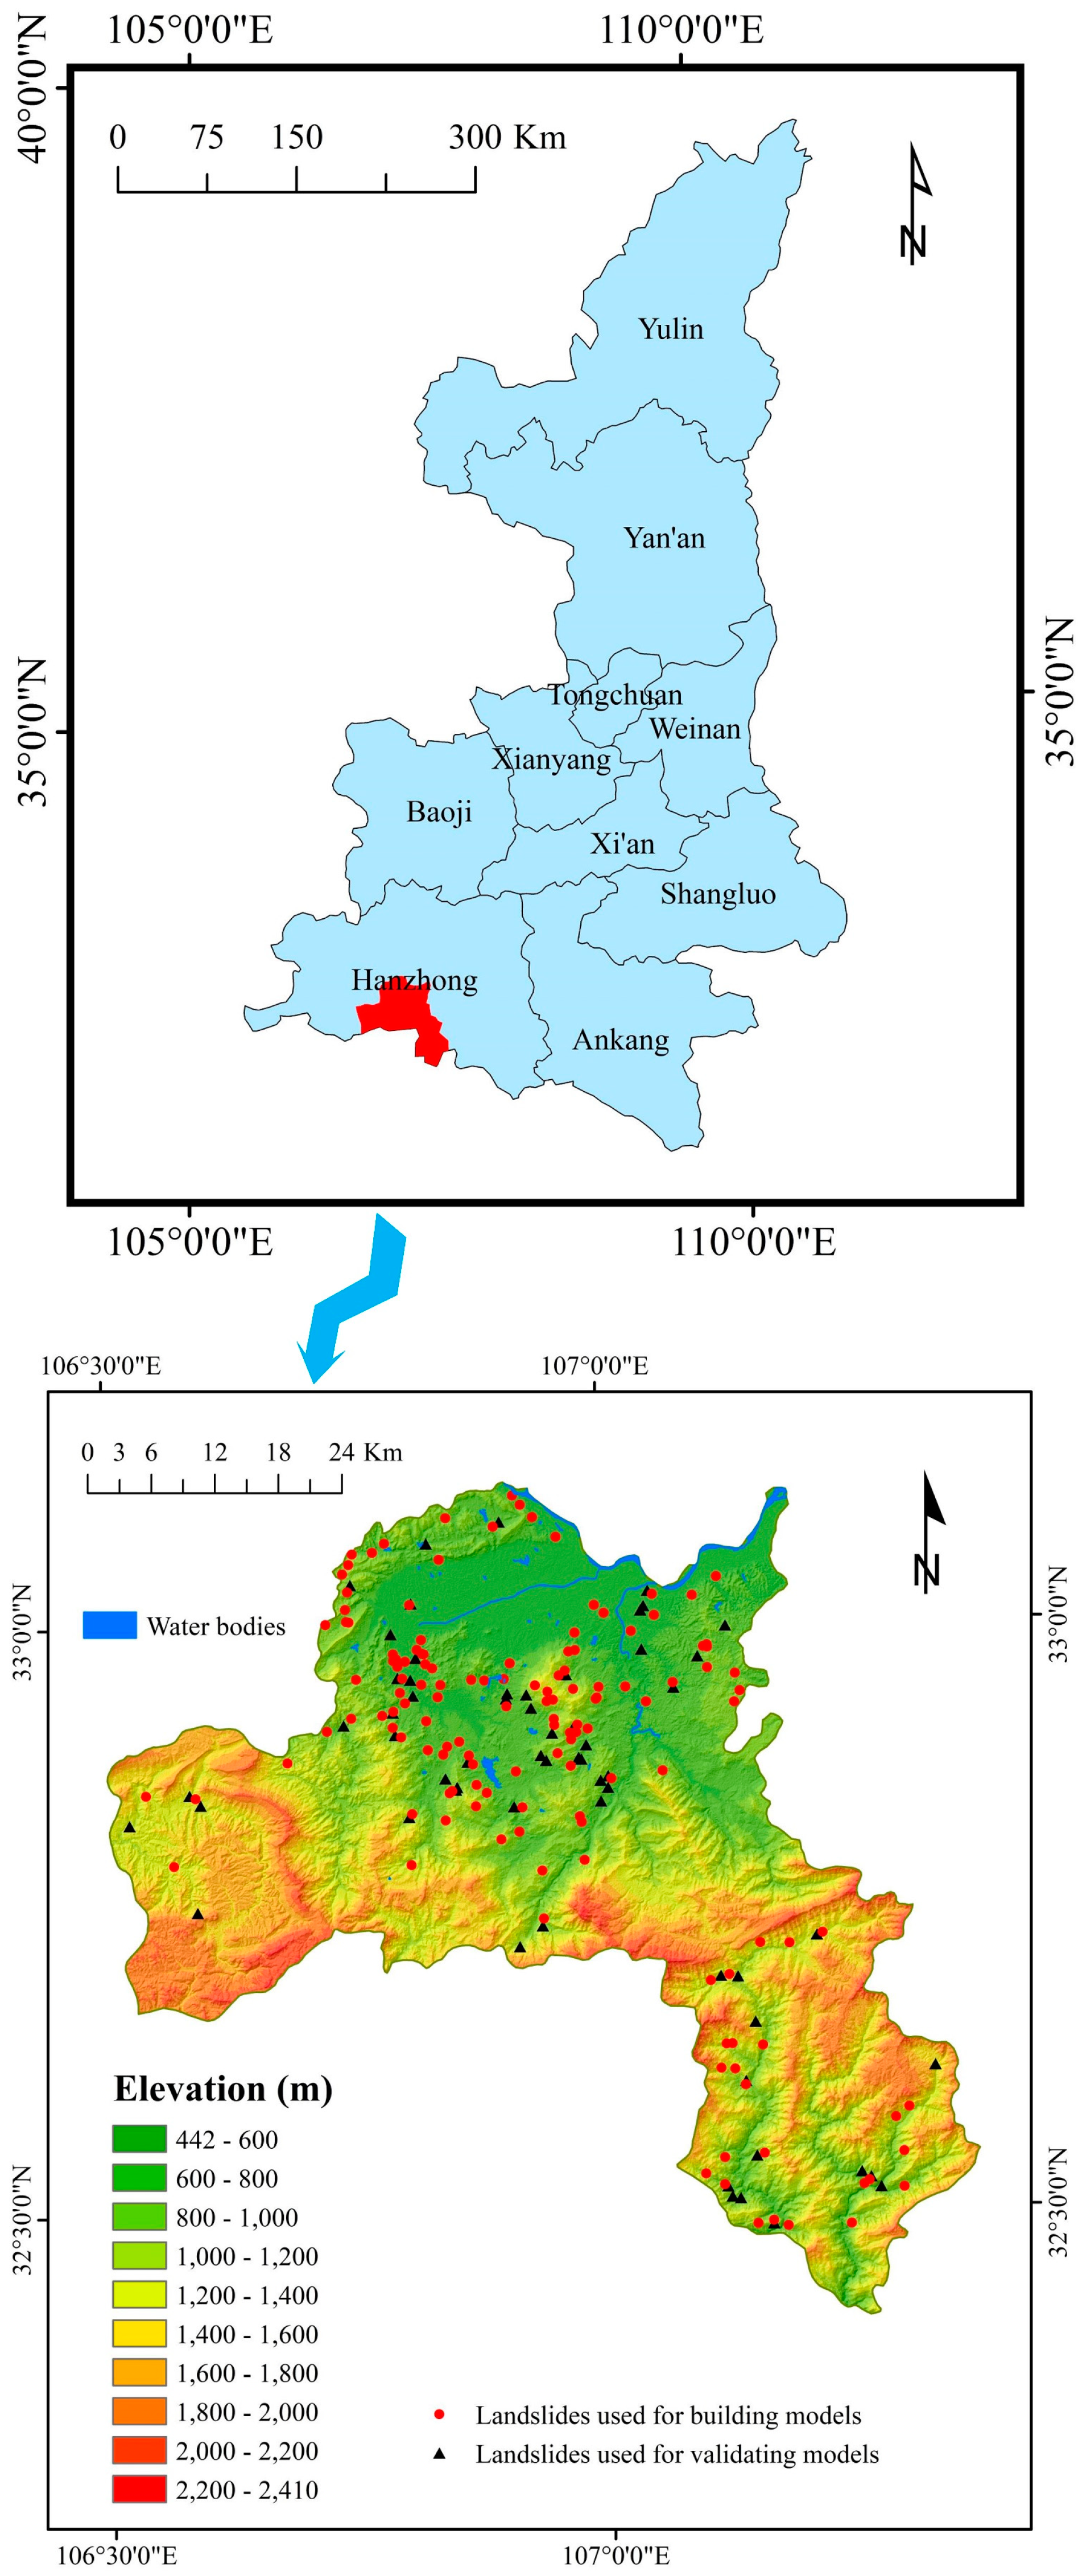
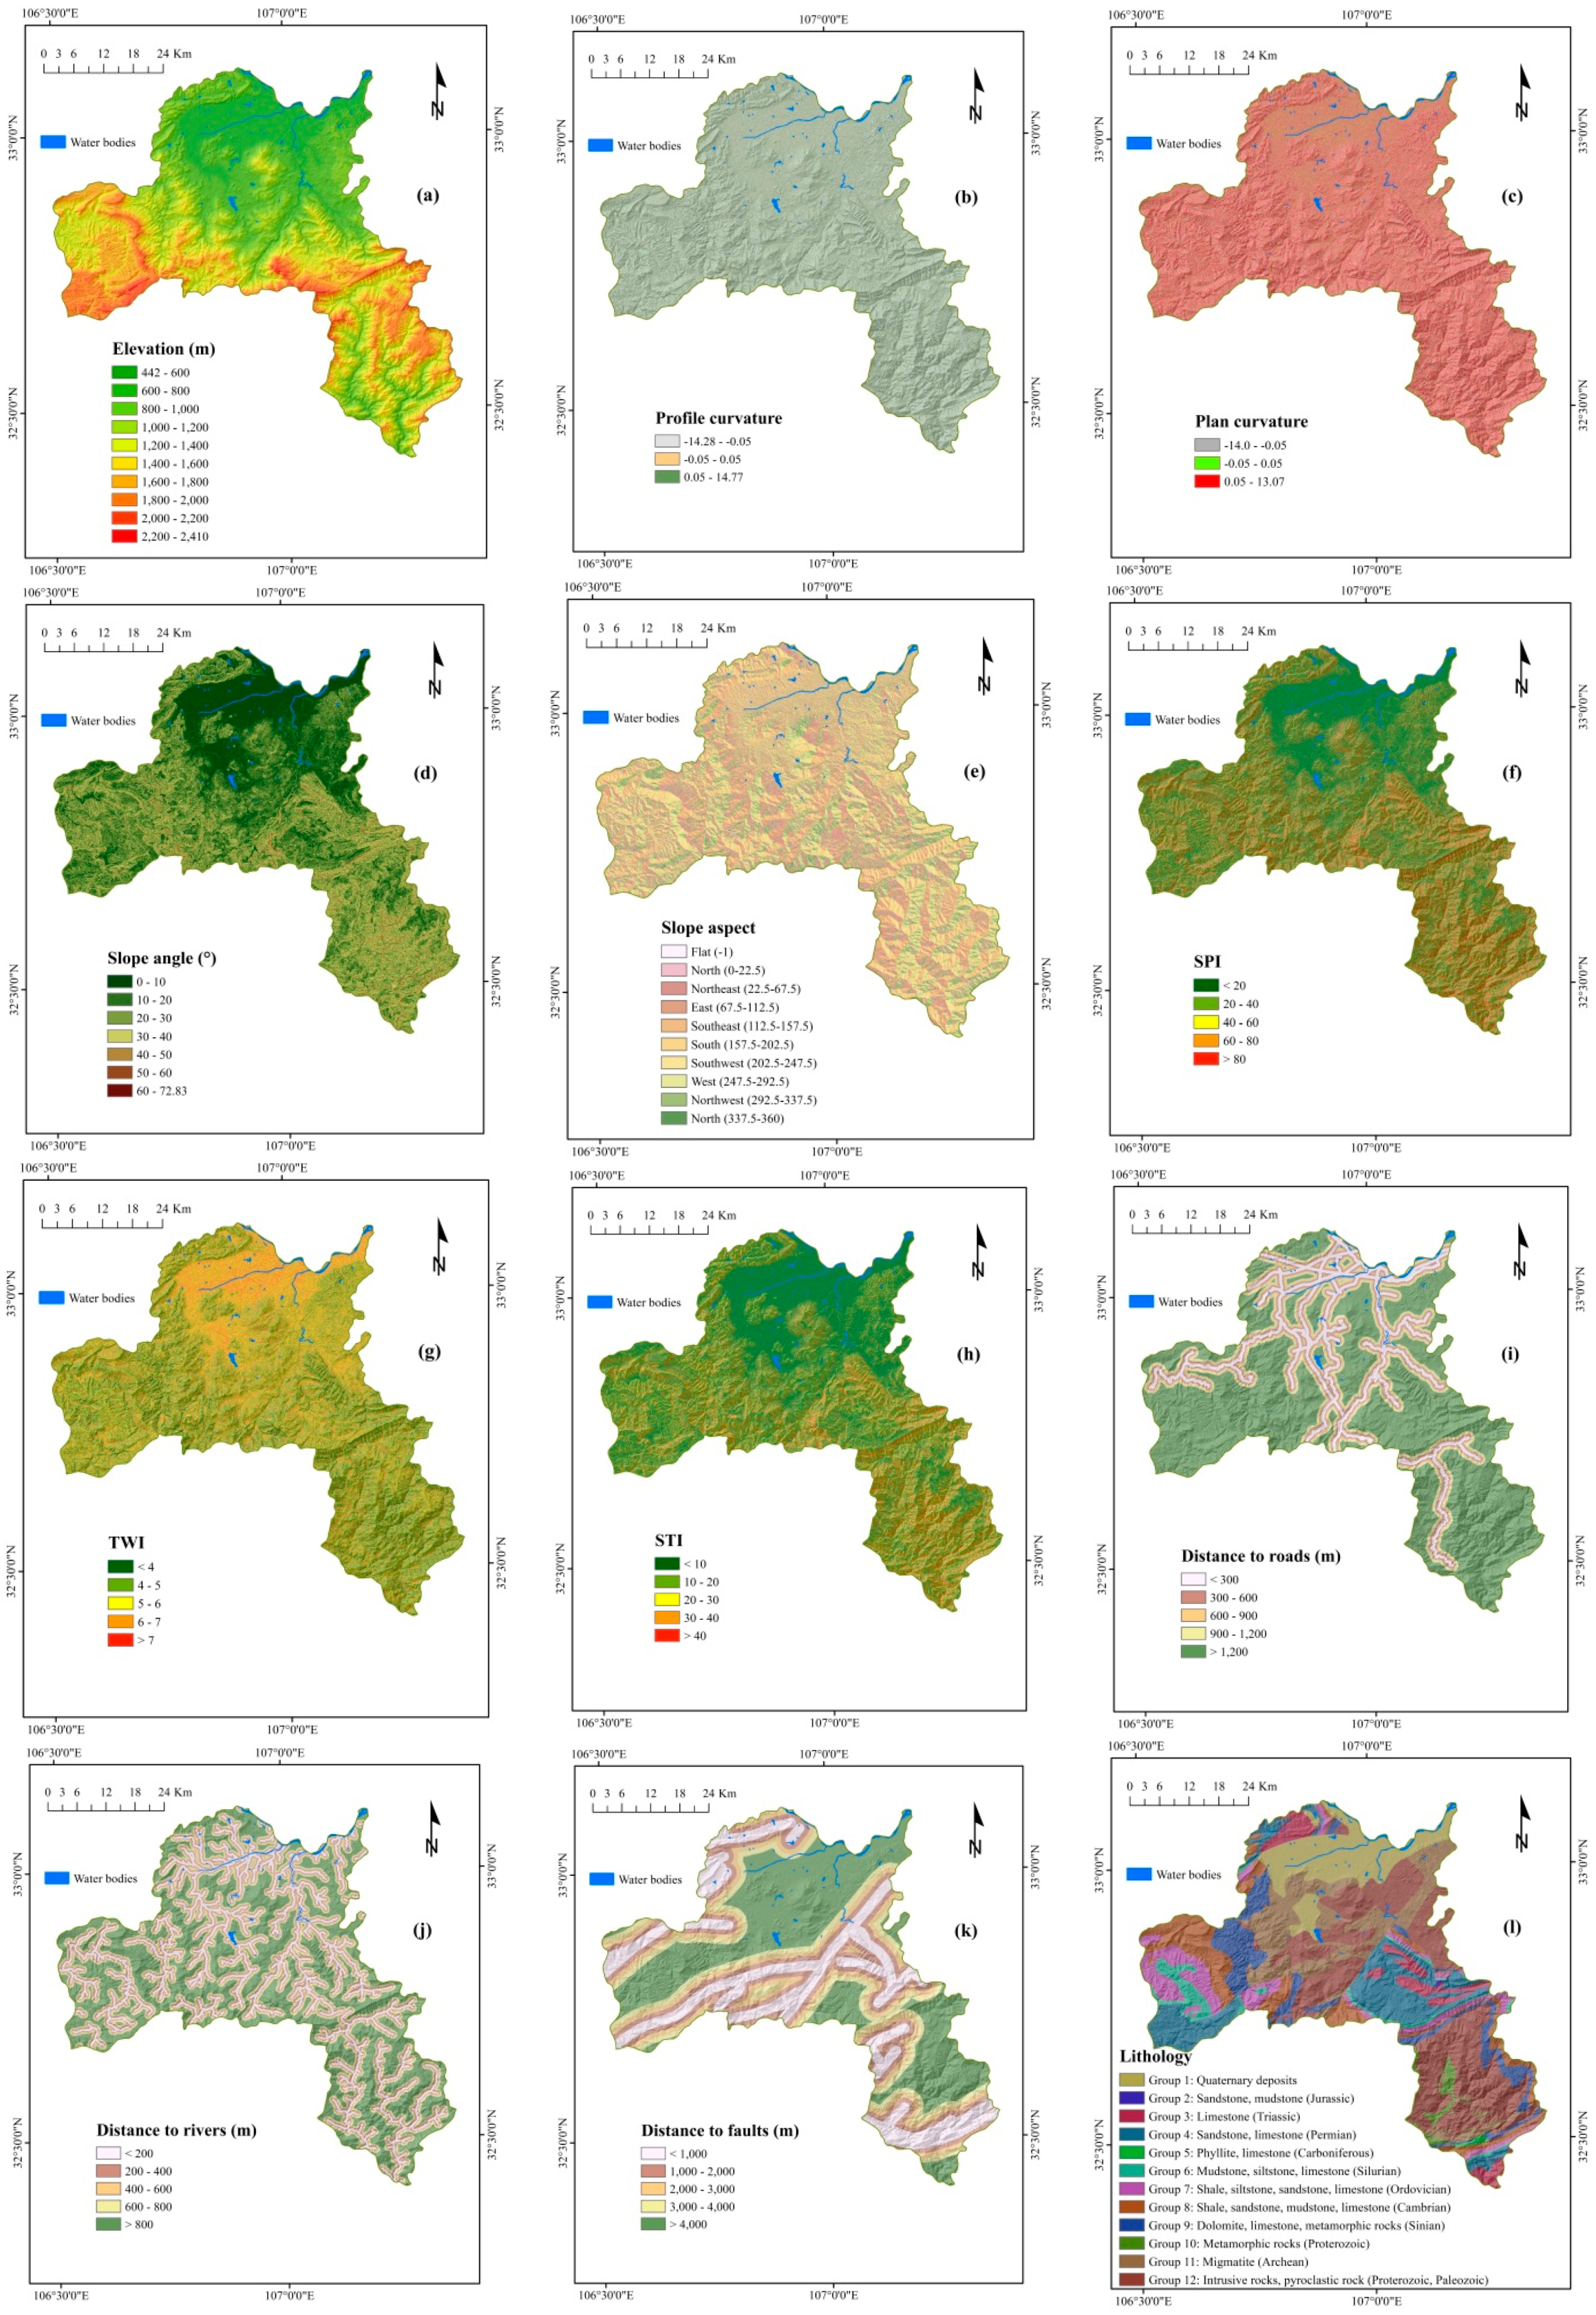
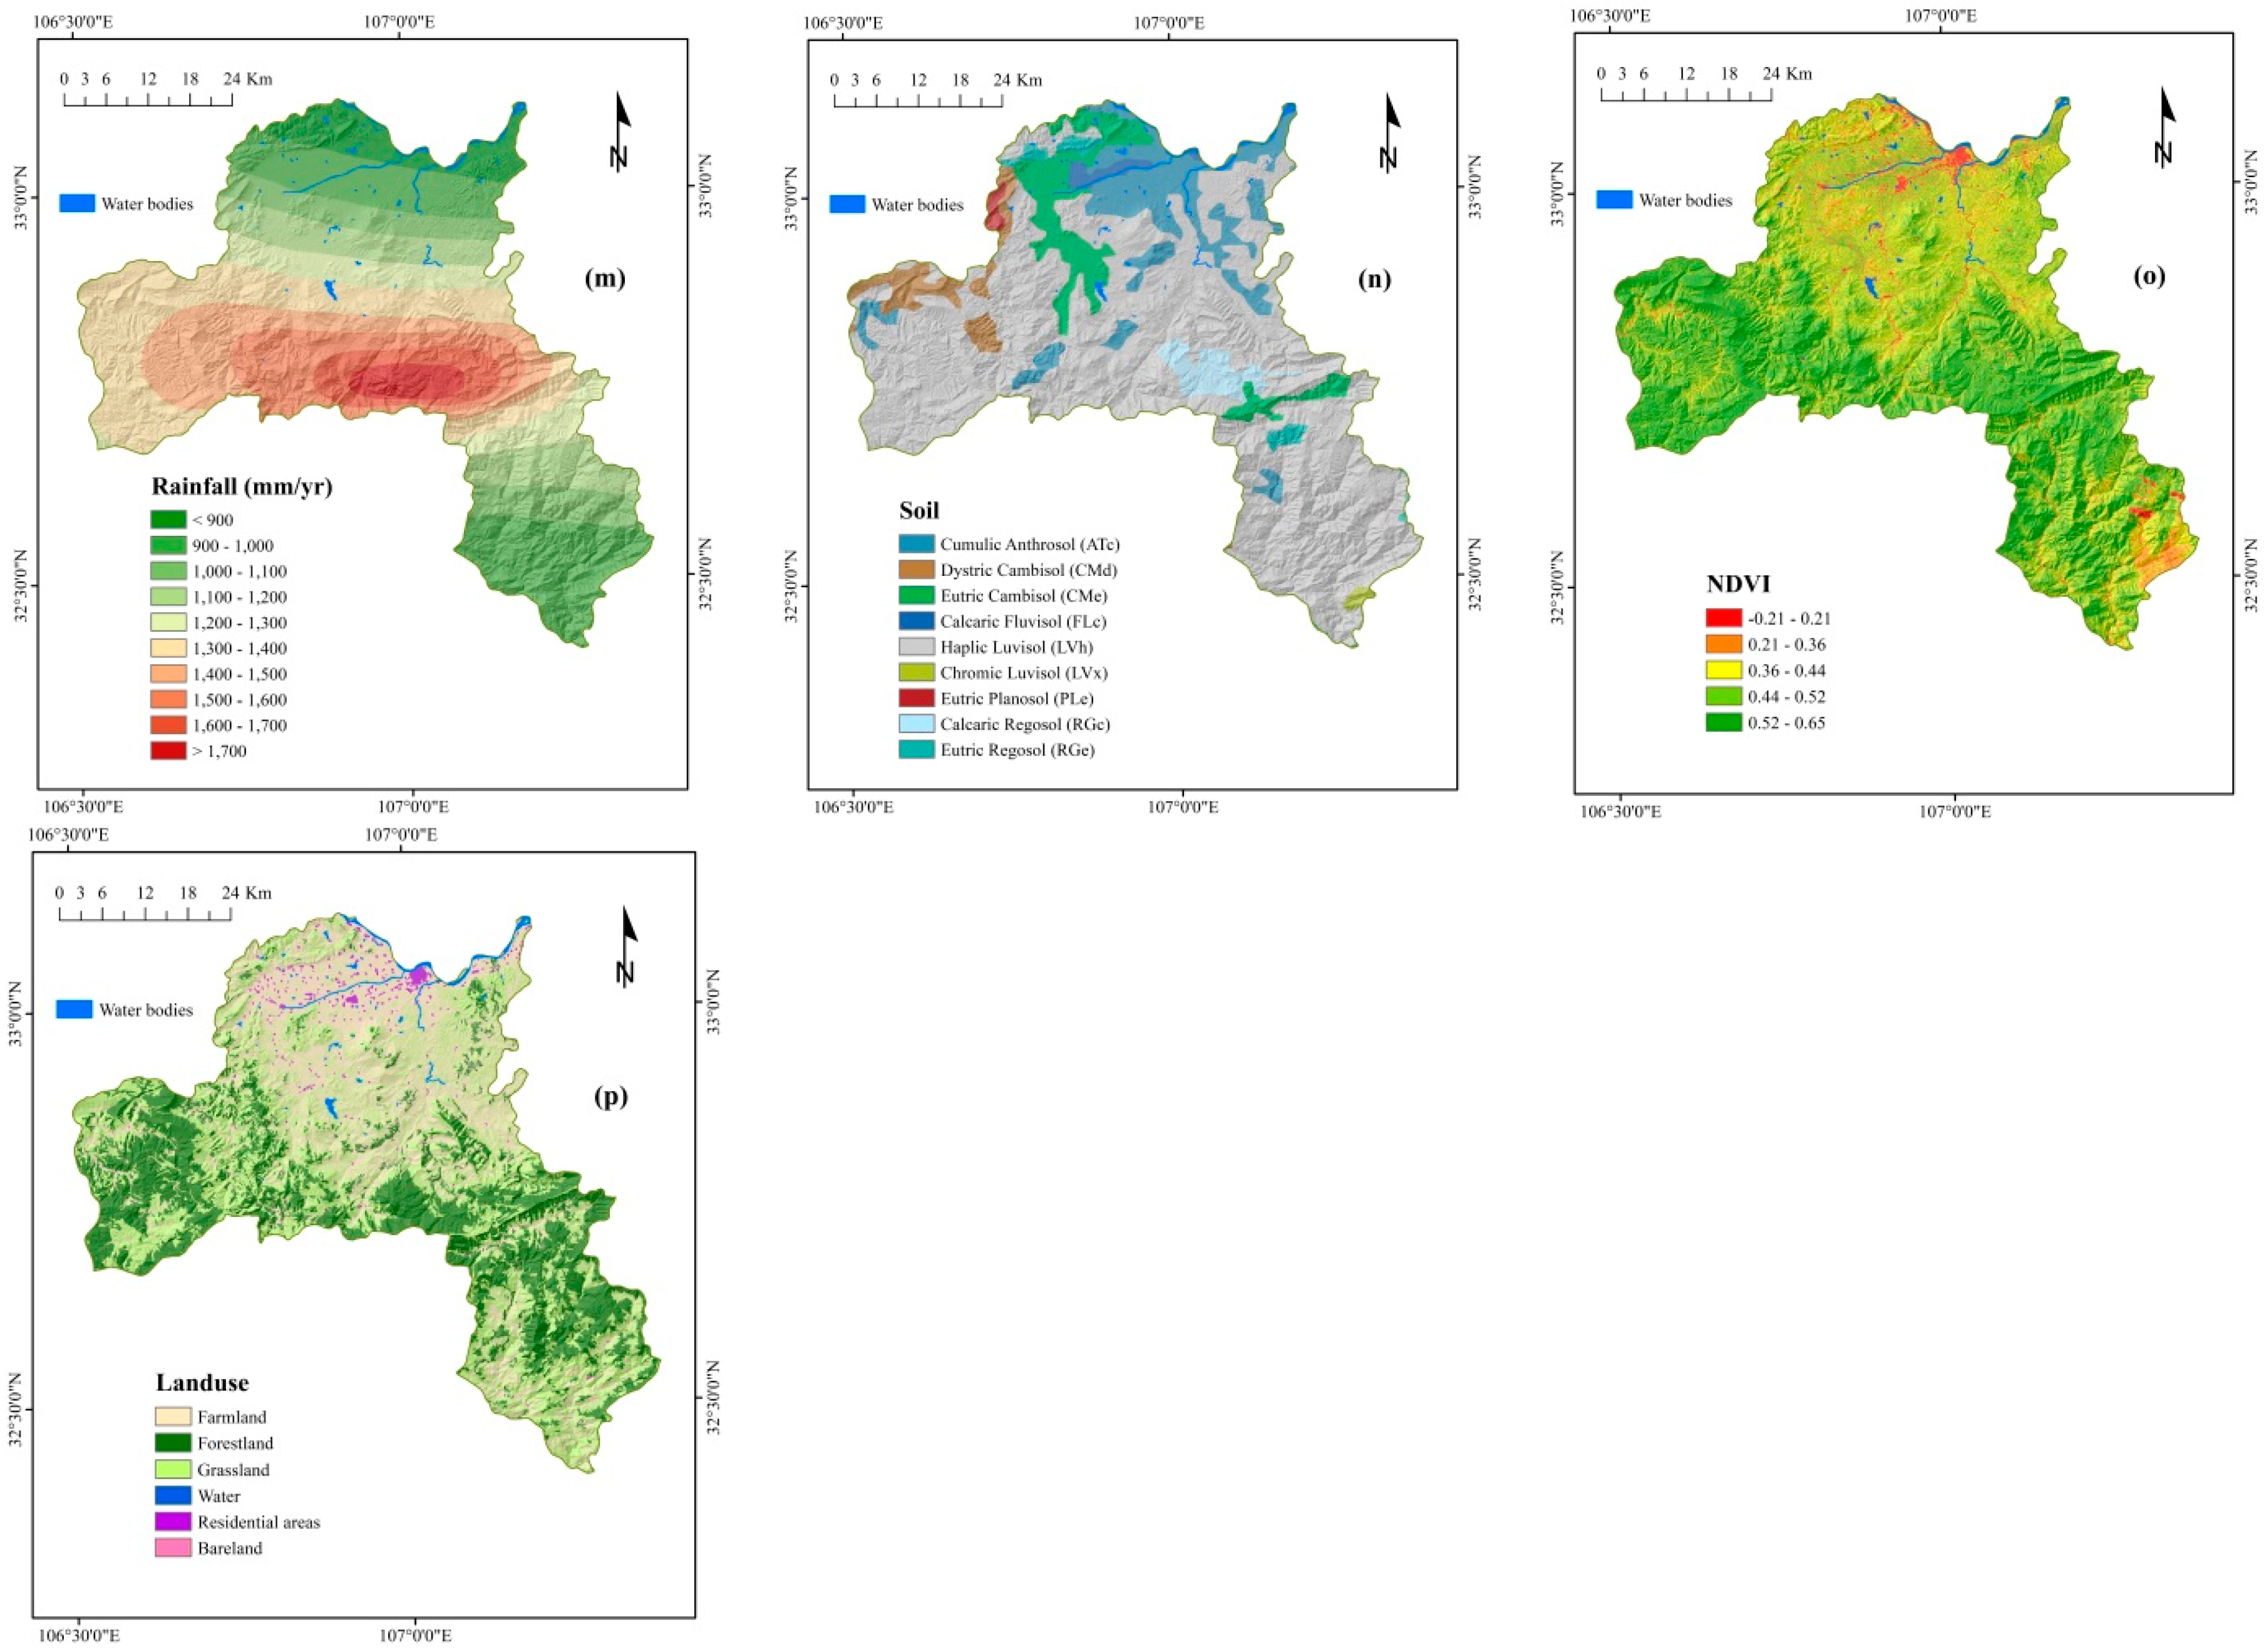
3. Study Area and Data Used
4. Results
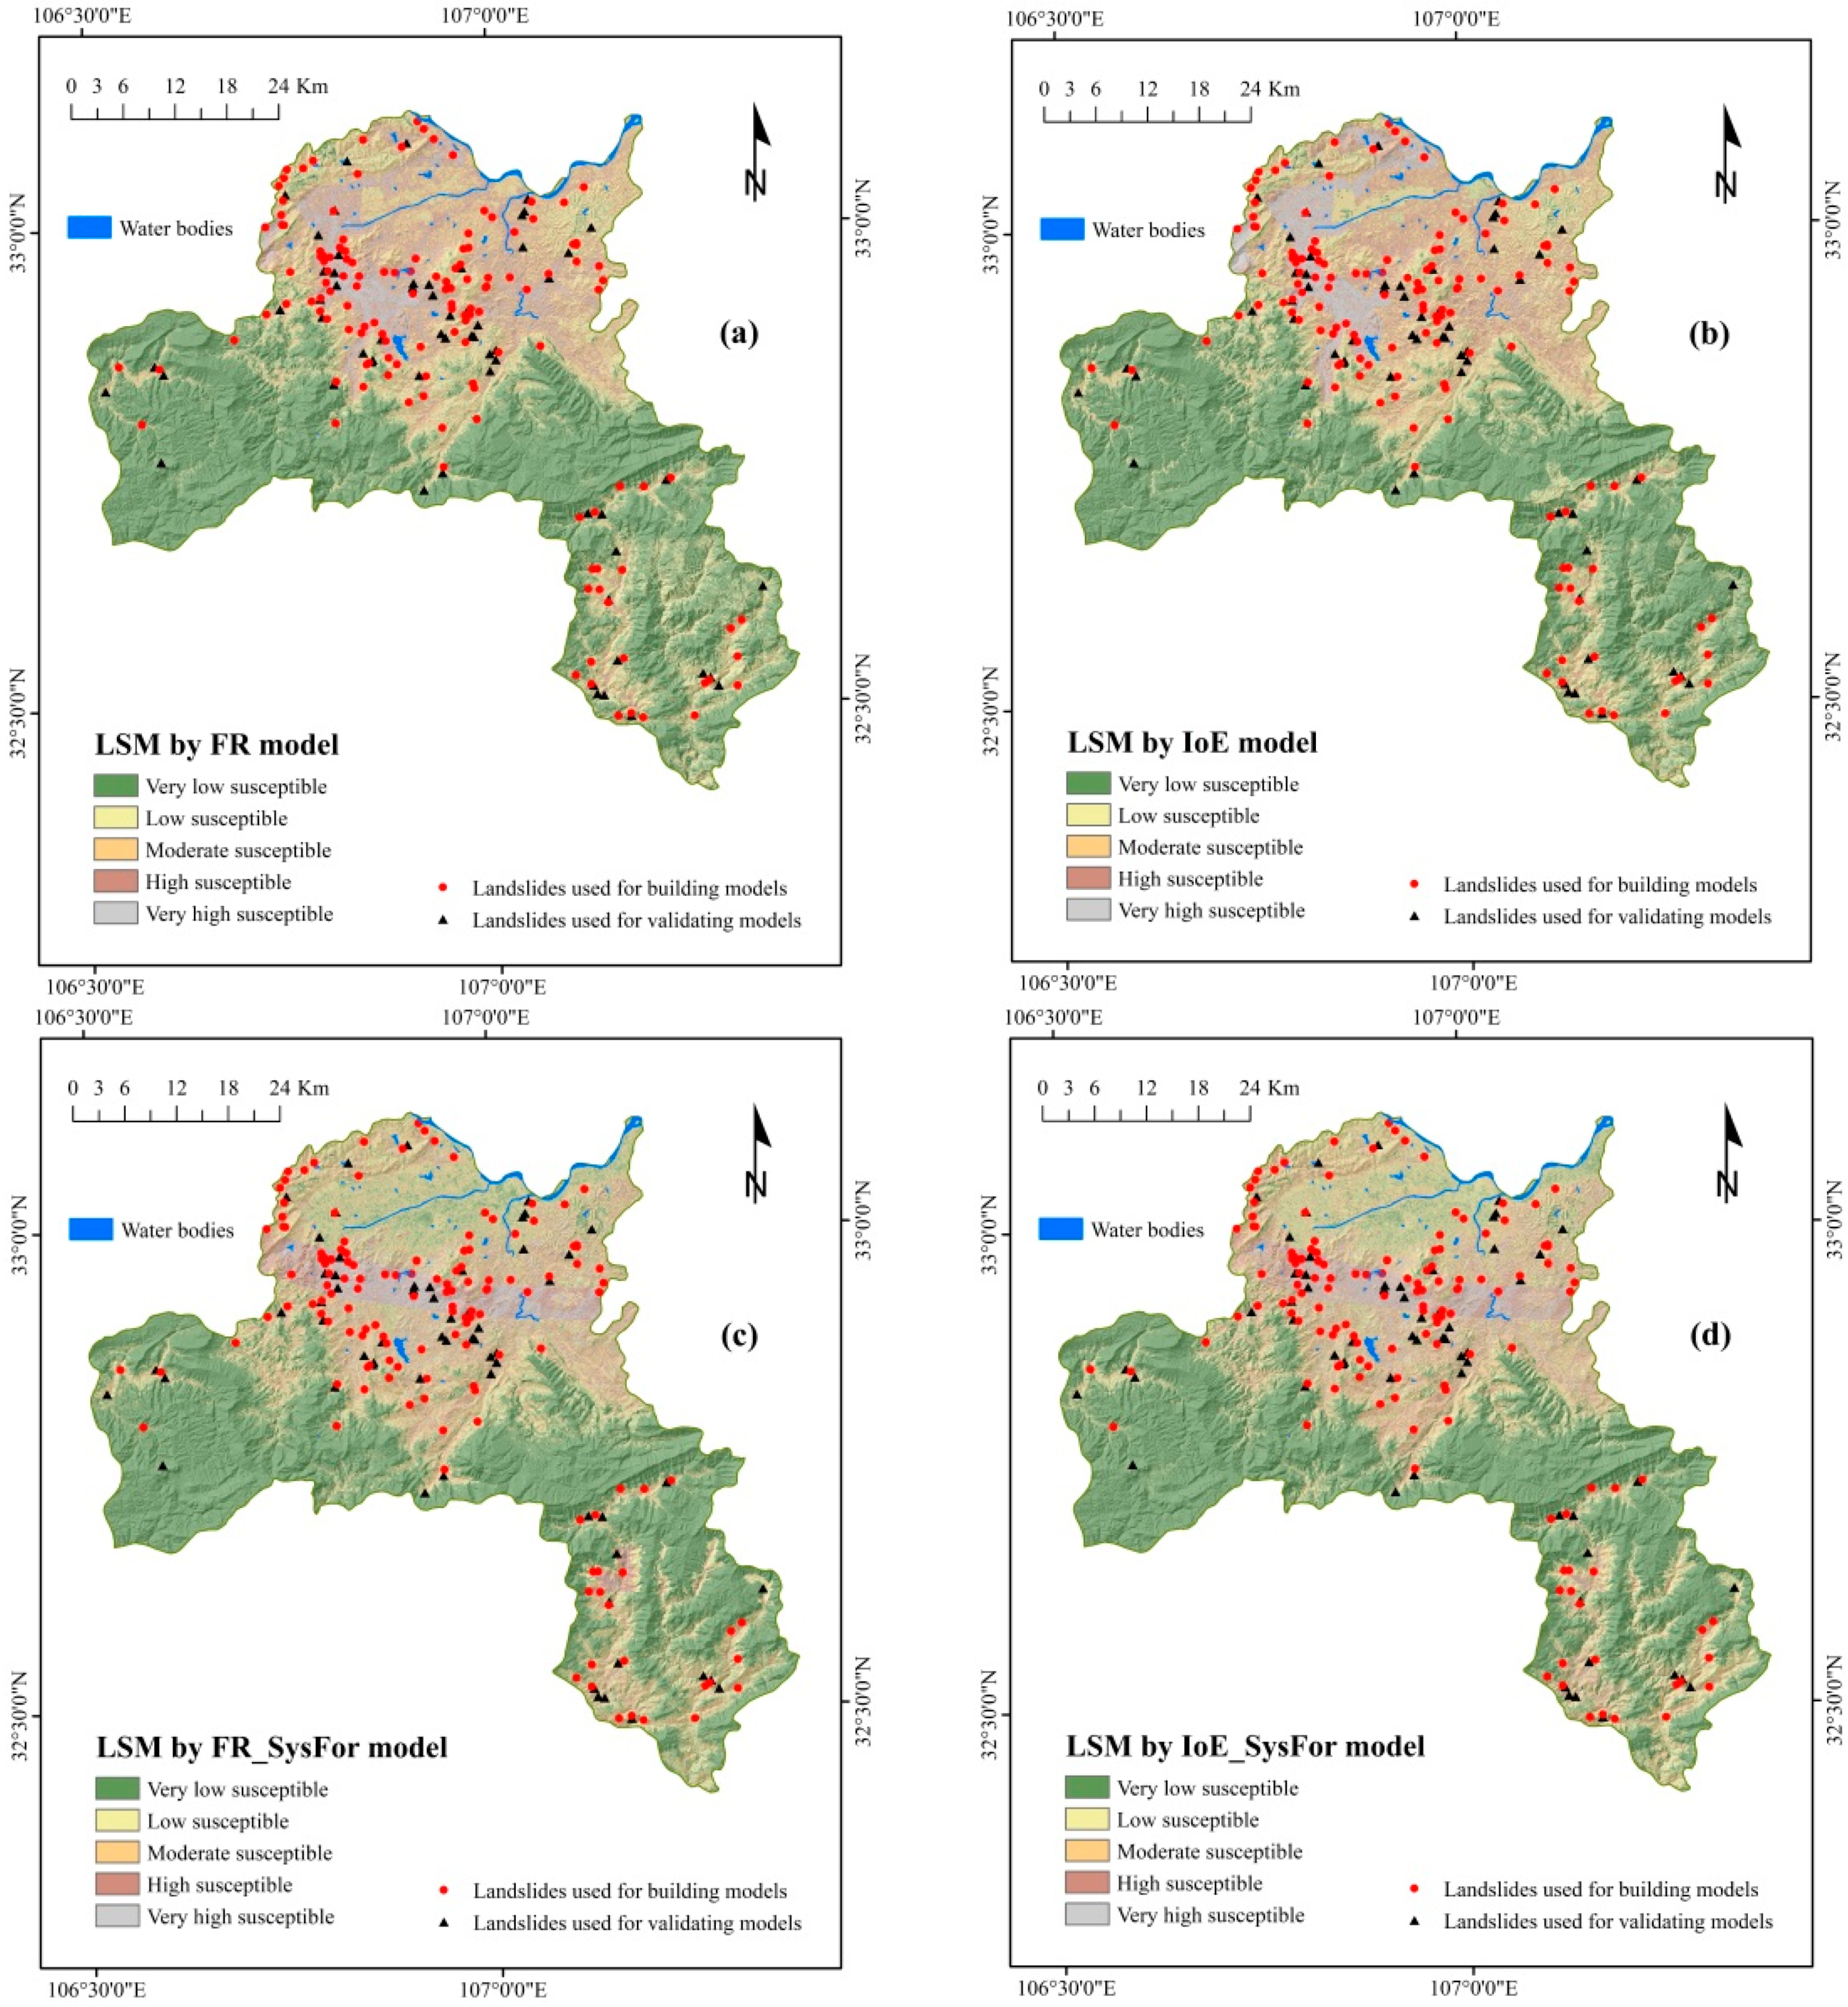
4.1. Application of FR Model
4.2. Application of IoE Model
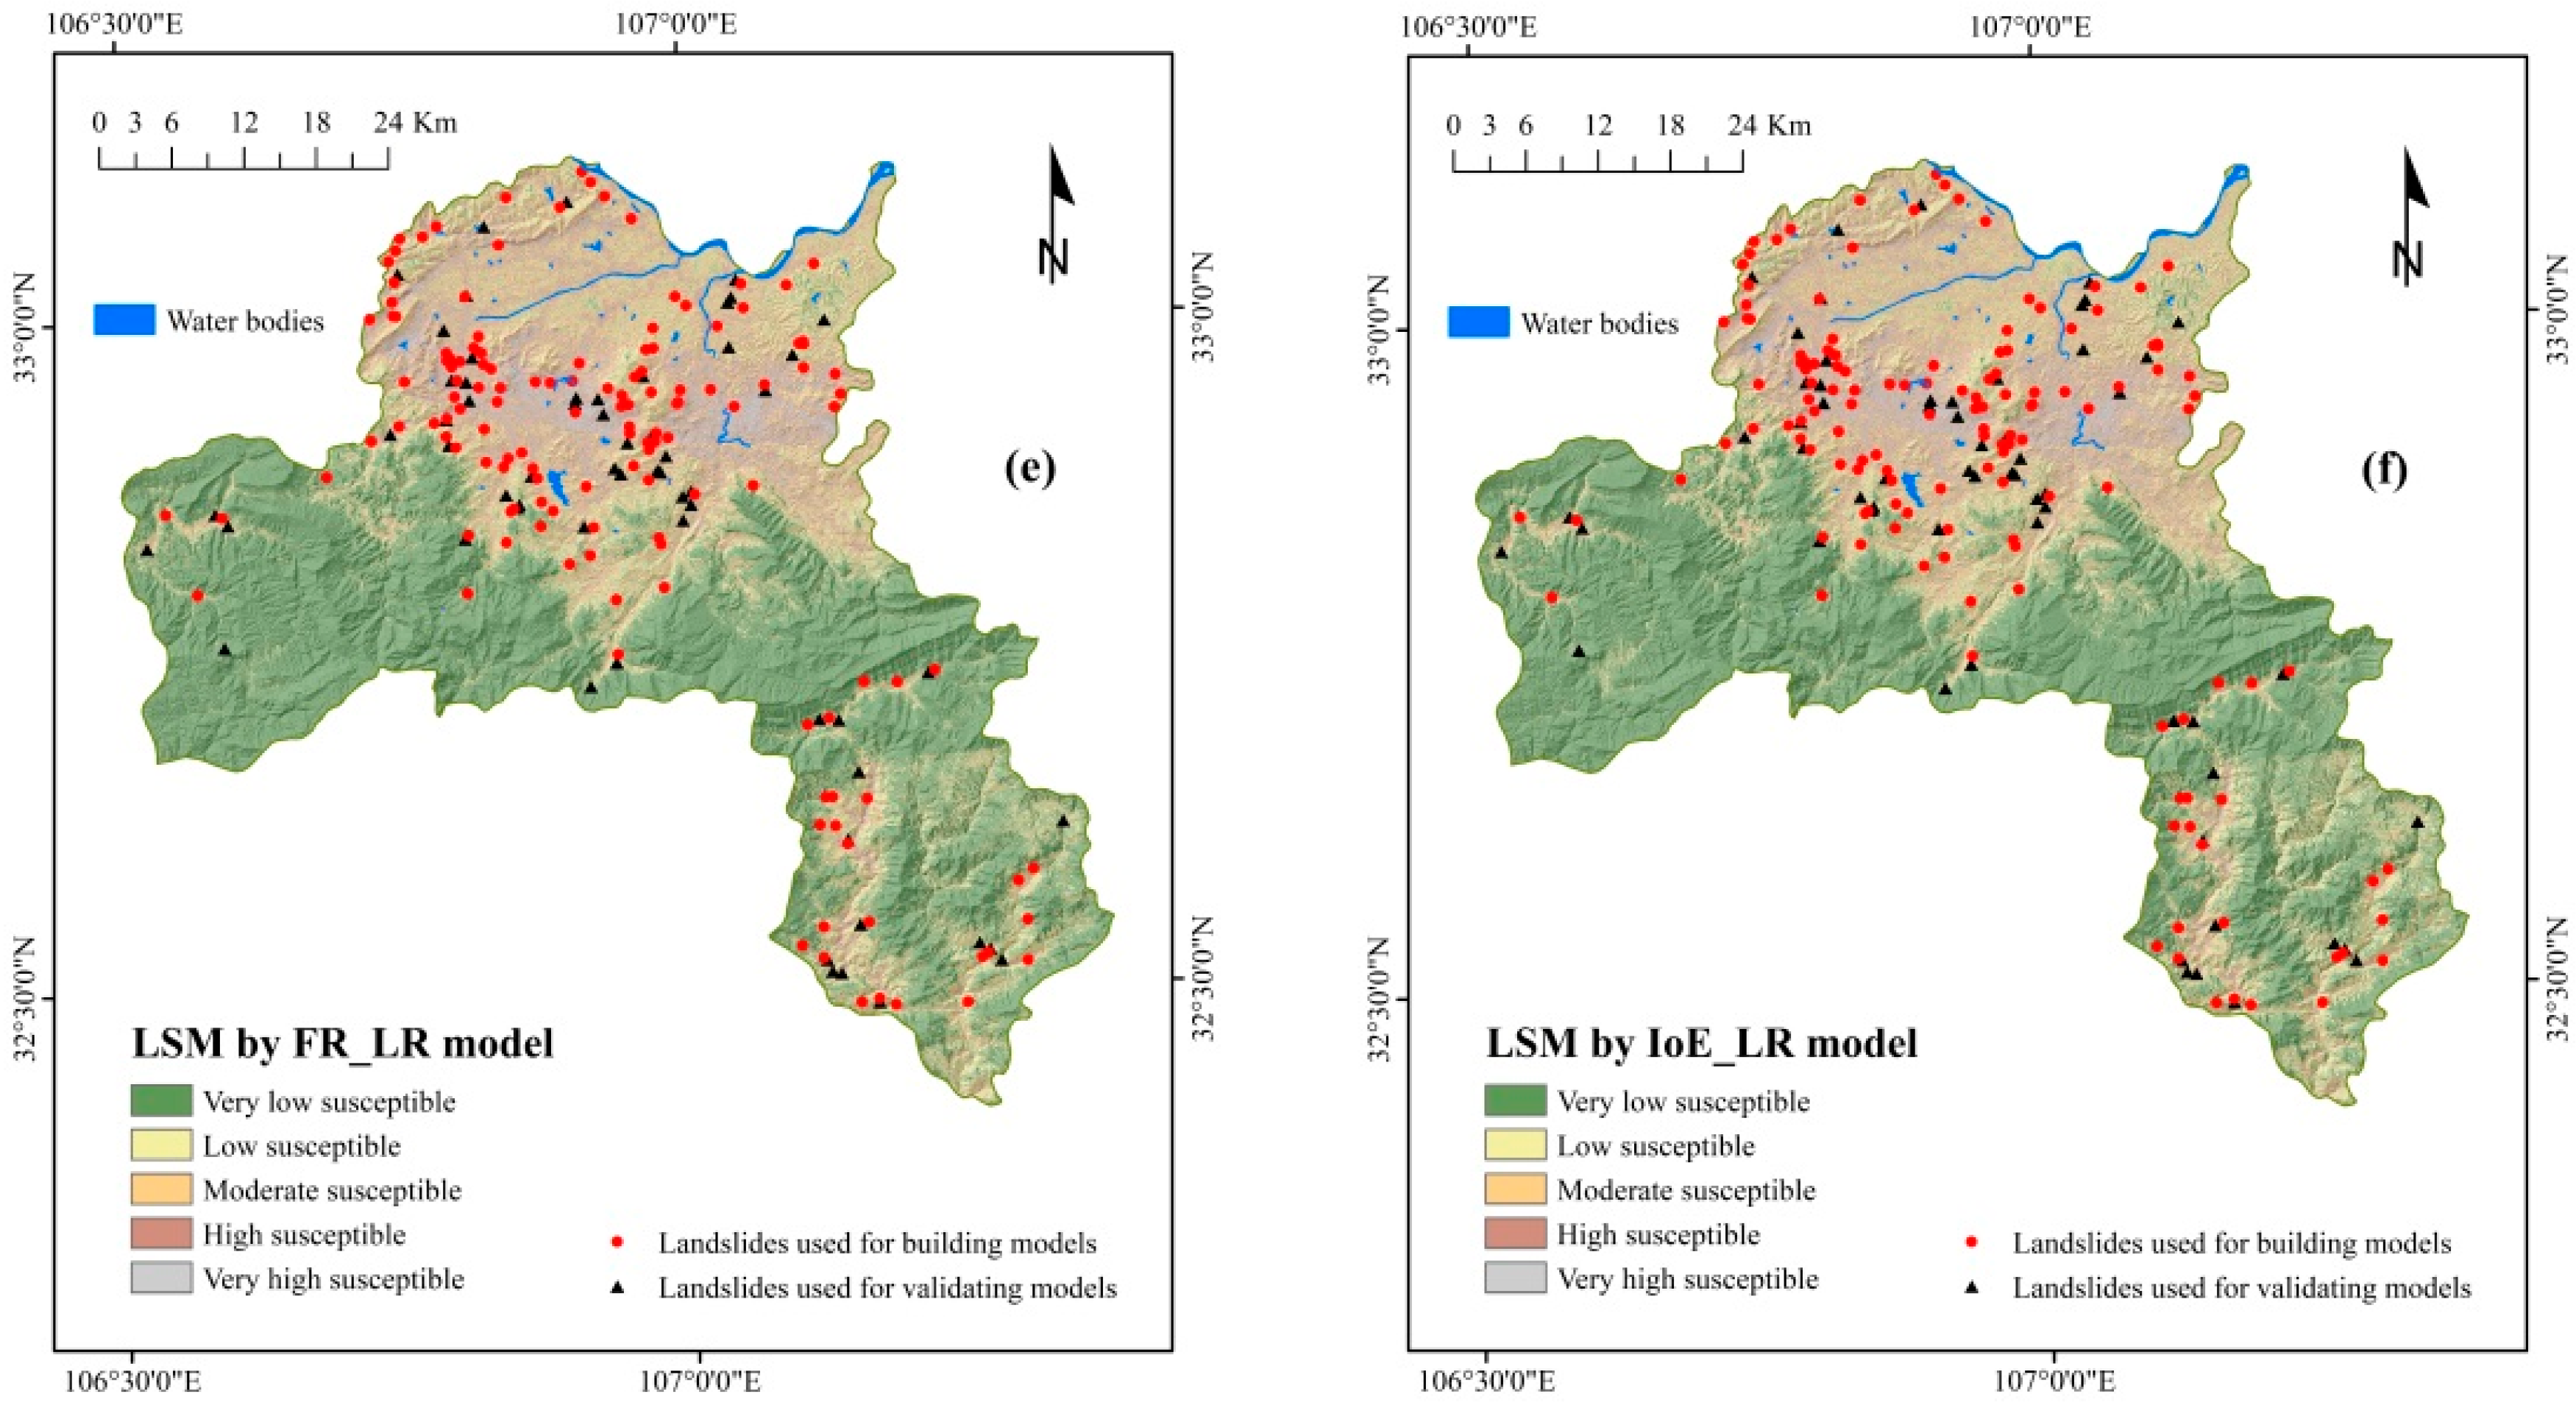
4.3. Application of Hybrid Models
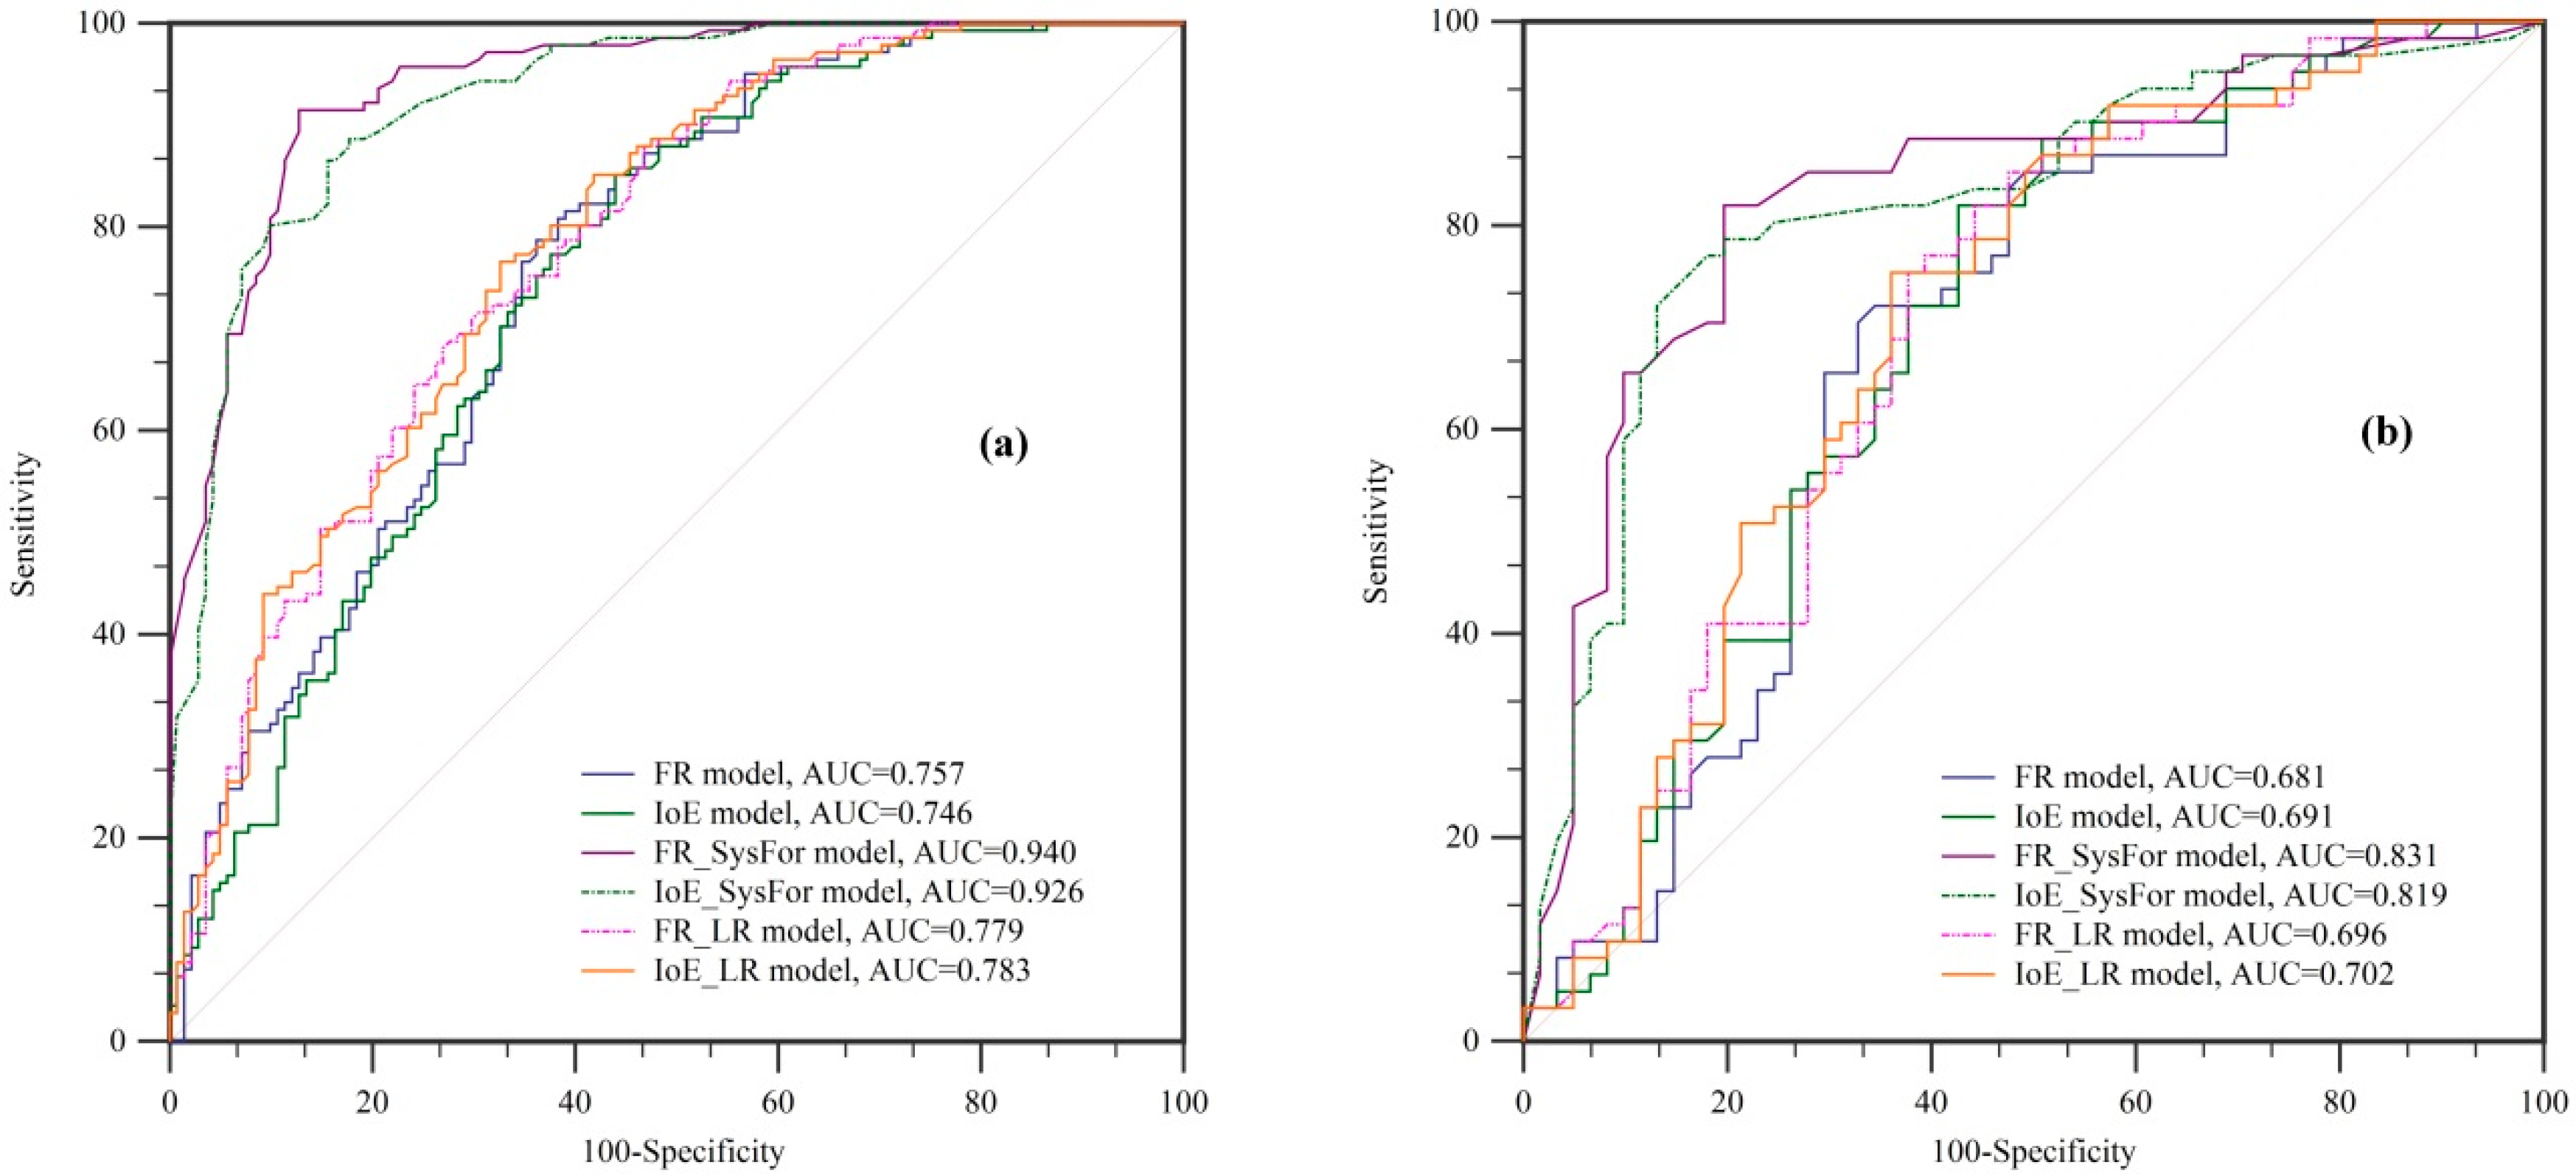
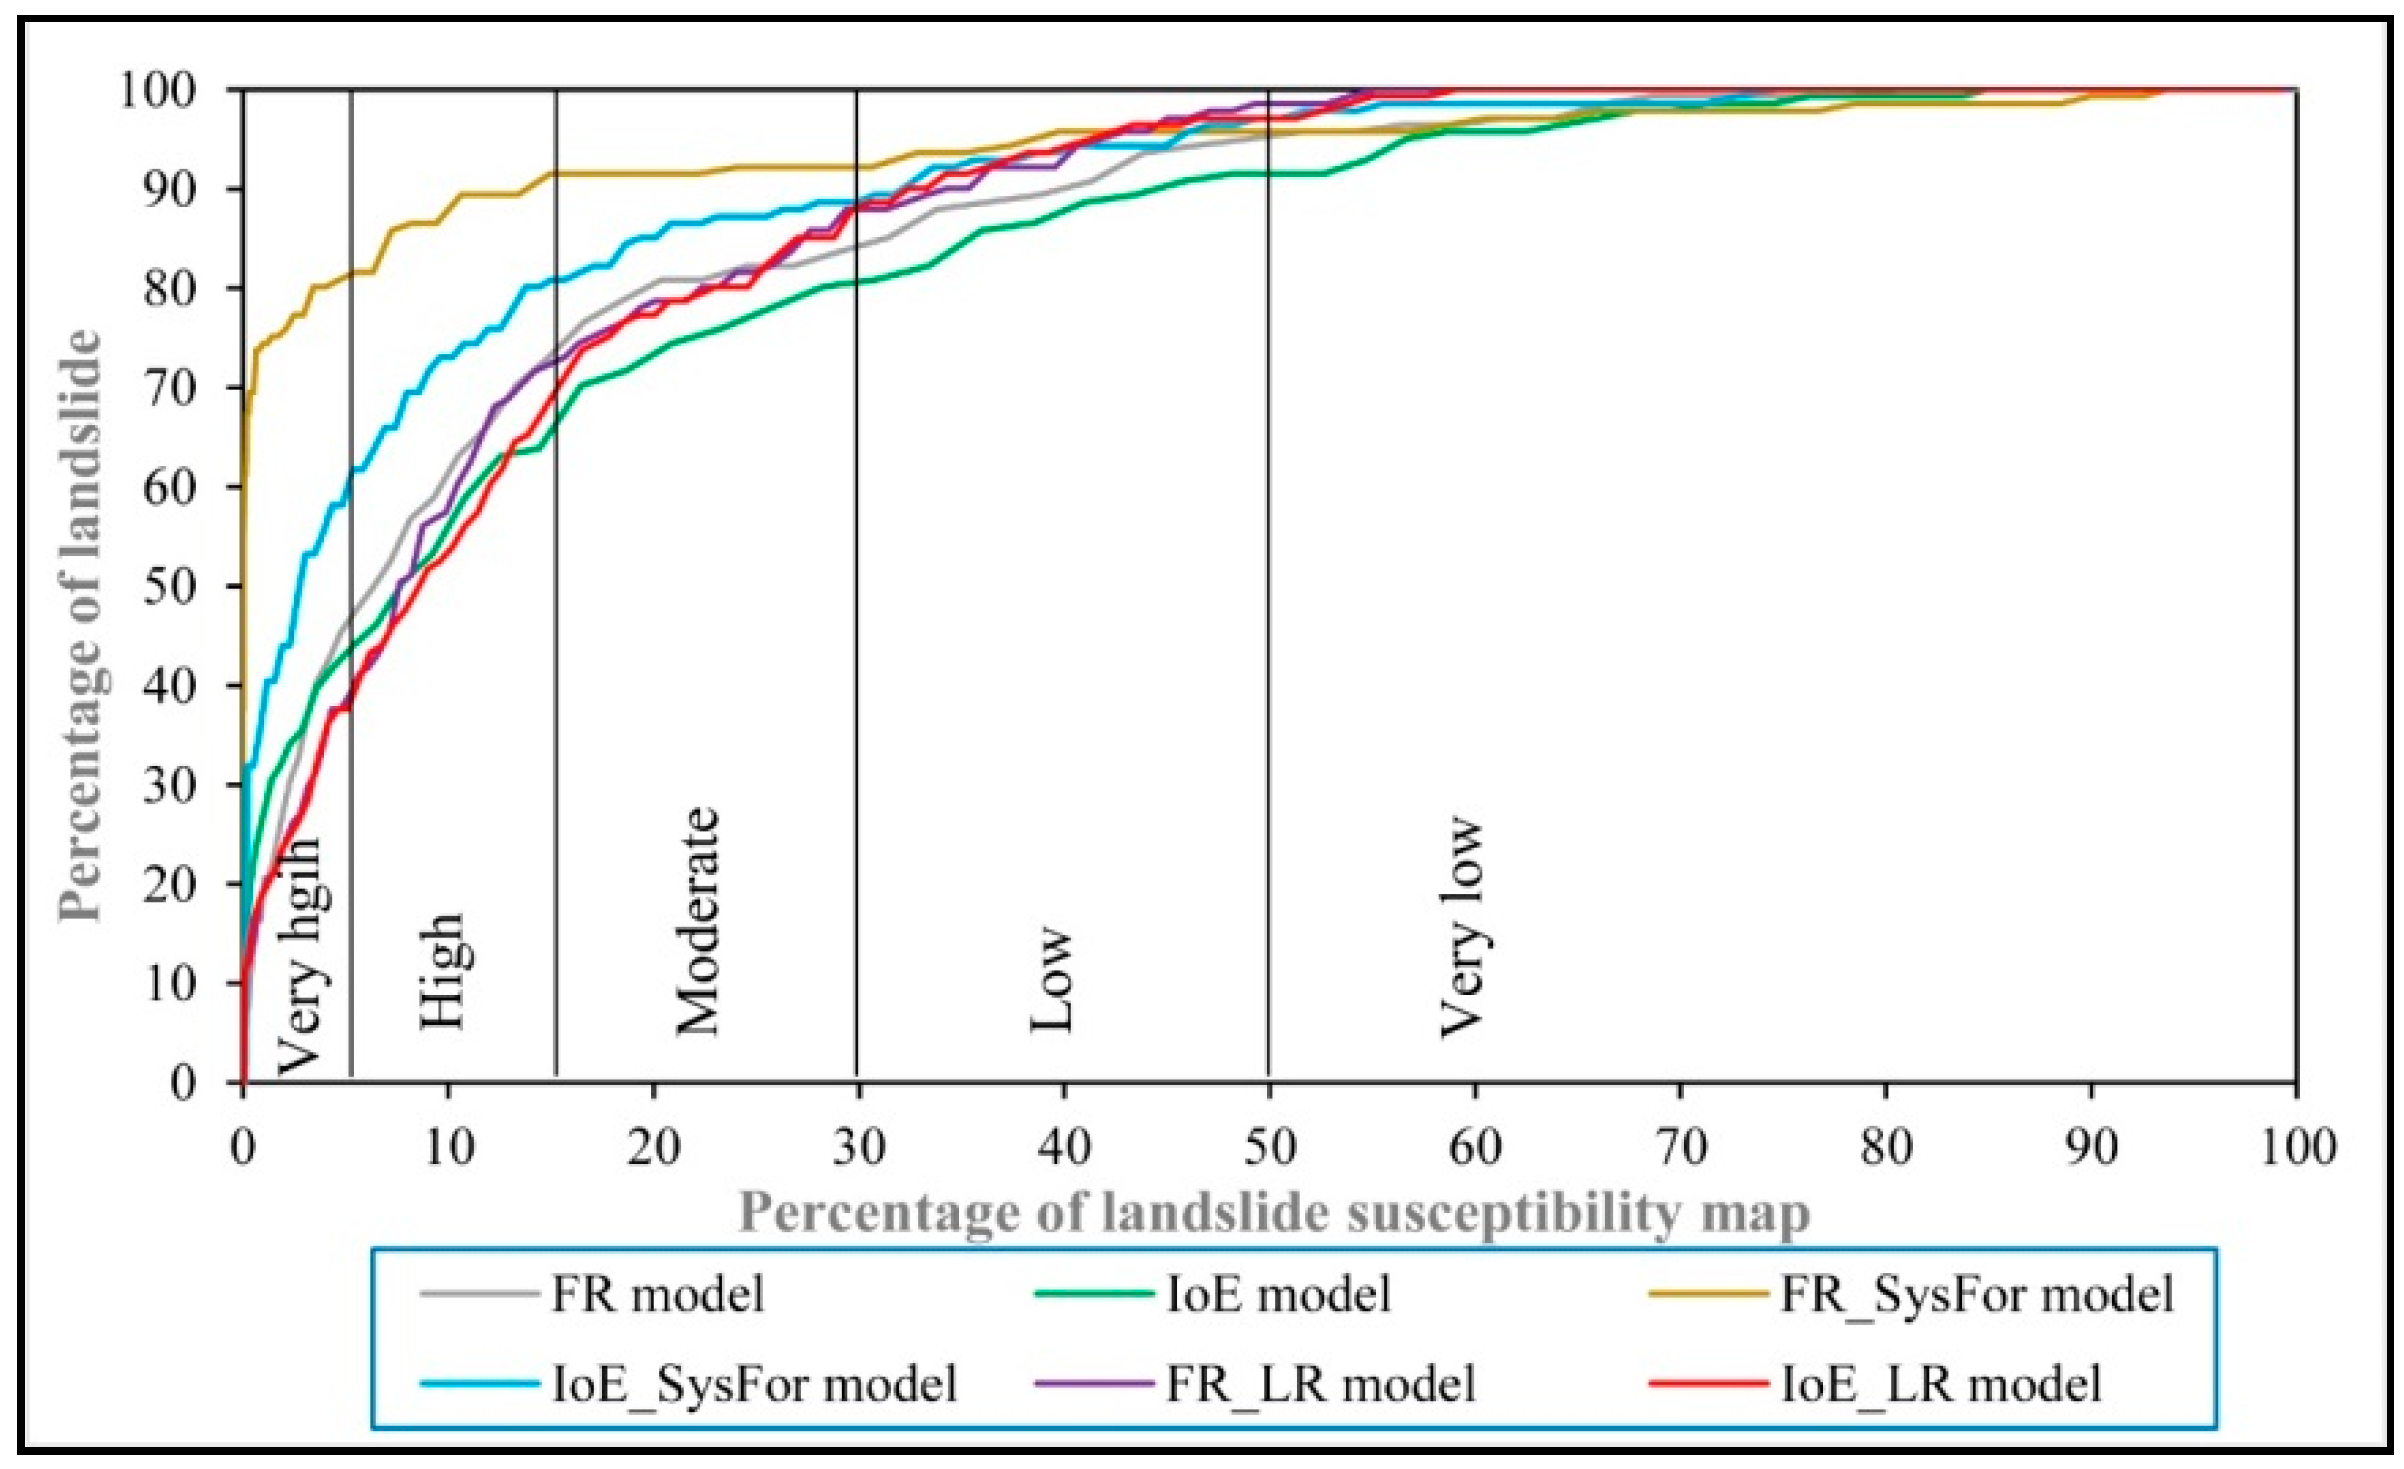
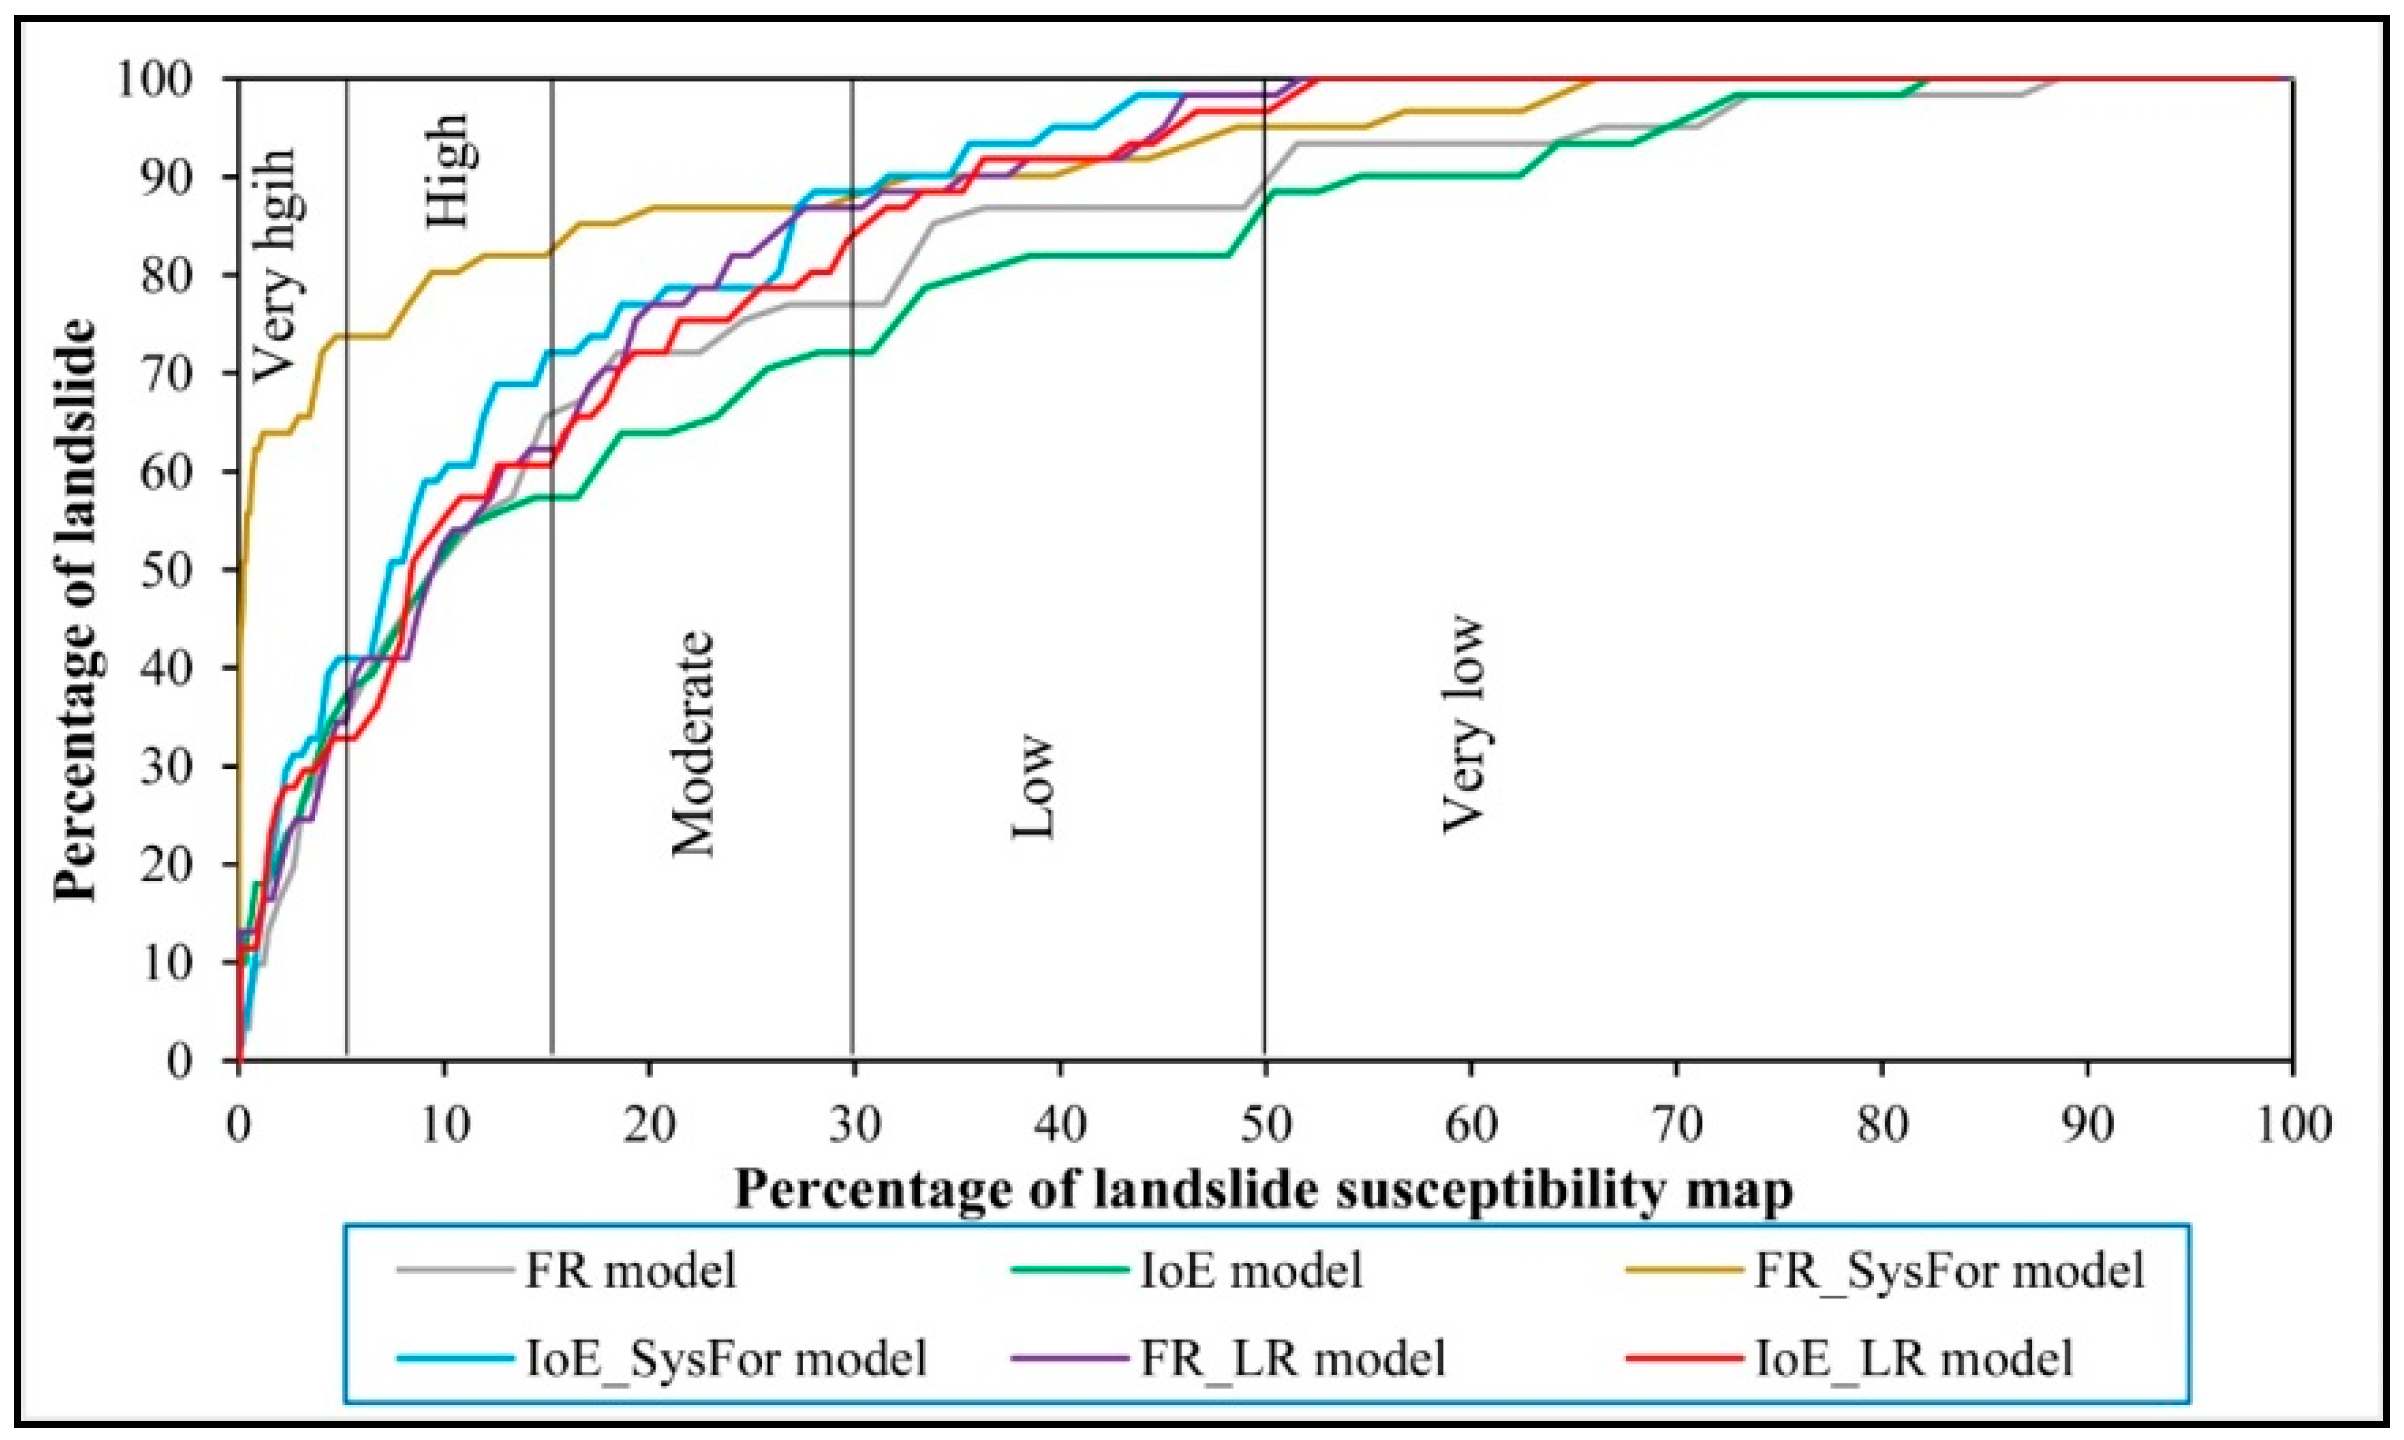
4.4. Validation of Landslide Susceptibility Maps
5. Discussion
6. Conclusions
Author Contributions
Funding
Conflicts of Interest
References
- Wang, Z.; Hu, Z.; Liu, H.; Gong, H.; Zhao, W.; Yu, M.; Zhang, M. In Application of the relief degree of land surface in landslide disasters susceptibility assessment in china. In Proceedings of the 2010 18th International Conference on Geoinformatics, Beijing, China, 18–20 June 2010; pp. 1–5. [Google Scholar]
- Wu, Y.; Liu, X.; Wang, J.A.; Liu, L.; Shi, P. Landslide and debris flow disasters in china. In Natural Disasters in China; Shi, P., Ed.; Springer: Berlin/Heidelberg, Germany, 2016; pp. 73–101. [Google Scholar]
- Available online: http://www.cigem.cgs.gov.cn/ (accessed on 17 April 2019).
- Adineh, F.; Motamedvaziri, B.; Ahmadi, H.; Moeini, A. Landslide susceptibility mapping using genetic algorithm for the rule set production (garp) model. J. Mt. Sci. 2018, 15, 2013–2026. [Google Scholar] [CrossRef]
- Ahmed, B. Landslide susceptibility modelling applying user-defined weighting and data-driven statistical techniques in cox’s bazar municipality, bangladesh. Nat. Hazards 2015, 79, 1707–1737. [Google Scholar] [CrossRef]
- Acharya, T.D.; Lee, D.H. Landslide susceptibility mapping using relative frequency and predictor rate along araniko highway. KSCE J. Civ. Eng. 2019, 23, 763–776. [Google Scholar] [CrossRef]
- Ilia, I.; Tsangaratos, P. Applying weight of evidence method and sensitivity analysis to produce a landslide susceptibility map. Landslides 2016, 13, 379–397. [Google Scholar] [CrossRef]
- Ko, F.W.Y.; Lo, F.L.C. From landslide susceptibility to landslide frequency: A territory-wide study in Hong Kong. Eng. Geol. 2018, 242, 12–22. [Google Scholar] [CrossRef]
- Guo, C.; Qin, Y.; Ma, D.; Xia, Y.; Chen, Y.; Si, Q.; Lu, L. Ionic composition, geological signature and environmental impacts of coalbed methane produced water in China. Energy Sources Part A Recovery Util. Environ. Eff. 2019, 1–15. [Google Scholar] [CrossRef]
- Meten, M.; Bhandary, N.P.; Yatabe, R. Gis-based frequency ratio and logistic regression modelling for landslide susceptibility mapping of debre sina area in central ethiopia. J. Mt. Sci. 2015, 12, 1355–1372. [Google Scholar] [CrossRef]
- Pham, B.T.; Tien Bui, D.; Prakash, I.; Dholakia, M.B. Hybrid integration of multilayer perceptron neural networks and machine learning ensembles for landslide susceptibility assessment at himalayan area (India) using gis. CATENA 2017, 149, 52–63. [Google Scholar] [CrossRef]
- Reichenbach, P.; Rossi, M.; Malamud, B.D.; Mihir, M.; Guzzetti, F. A review of statistically-based landslide susceptibility models. Earth Sci. Rev. 2018, 180, 60–91. [Google Scholar] [CrossRef]
- Hussin, H.Y.; Zumpano, V.; Reichenbach, P.; Sterlacchini, S.; Micu, M.; van Westen, C.; Bălteanu, D. Different landslide sampling strategies in a grid-based bi-variate statistical susceptibility model. Geomorphology 2016, 253, 508–523. [Google Scholar] [CrossRef]
- Pham, B.T.; Pradhan, B.; Tien Bui, D.; Prakash, I.; Dholakia, M.B. A comparative study of different machine learning methods for landslide susceptibility assessment: A case study of uttarakhand area (India). Environ. Model. Softw. 2016, 84, 240–250. [Google Scholar] [CrossRef]
- Zhu, A.X.; Miao, Y.; Wang, R.; Zhu, T.; Deng, Y.; Liu, J.; Yang, L.; Qin, C.-Z.; Hong, H. A comparative study of an expert knowledge-based model and two data-driven models for landslide susceptibility mapping. CATENA 2018, 166, 317–327. [Google Scholar] [CrossRef]
- He, Q.; Shahabi, H.; Shirzadi, A.; Li, S.; Chen, W.; Wang, N.; Chai, H.; Bian, H.; Ma, J.; Chen, Y.; et al. Landslide spatial modelling using novel bivariate statistical based naïve bayes, rbf classifier, and rbf network machine learning algorithms. Sci. Total Environ. 2019, 663, 1–15. [Google Scholar] [CrossRef] [PubMed]
- Bui, D.T.; Lofman, O.; Revhaug, I.; Dick, O. Landslide susceptibility analysis in the hoa binh province of vietnam using statistical index and logistic regression. Nat. Hazards 2011, 59, 1413. [Google Scholar] [CrossRef]
- Zhang, G.; Cai, Y.; Zheng, Z.; Zhen, J.; Liu, Y.; Huang, K. Integration of the statistical index method and the analytic hierarchy process technique for the assessment of landslide susceptibility in Huizhou, China. CATENA 2016, 142, 233–244. [Google Scholar] [CrossRef]
- Constantin, M.; Bednarik, M.; Jurchescu, M.C.; Vlaicu, M. Landslide susceptibility assessment using the bivariate statistical analysis and the index of entropy in the sibiciu basin (romania). Environ. Earth Sci. 2011, 63, 397–406. [Google Scholar] [CrossRef]
- Jaafari, A.; Najafi, A.; Pourghasemi, H.R.; Rezaeian, J.; Sattarian, A. Gis-based frequency ratio and index of entropy models for landslide susceptibility assessment in the caspian forest, northern iran. Int. J. Environ. Sci. Technol. 2014, 11, 909–926. [Google Scholar] [CrossRef] [Green Version]
- Aditian, A.; Kubota, T.; Shinohara, Y. Comparison of gis-based landslide susceptibility models using frequency ratio, logistic regression, and artificial neural network in a tertiary region of ambon, Indonesia. Geomorphology 2018, 318, 101–111. [Google Scholar] [CrossRef]
- Regmi, A.D.; Yoshida, K.; Pourghasemi, H.R.; DhitaL, M.R.; Pradhan, B. Landslide susceptibility mapping along bhalubang—Shiwapur area of mid-western nepal using frequency ratio and conditional probability models. J. Mt. Sci. 2014, 11, 1266–1285. [Google Scholar] [CrossRef]
- Umar, Z.; Pradhan, B.; Ahmad, A.; Jebur, M.N.; Tehrany, M.S. Earthquake induced landslide susceptibility mapping using an integrated ensemble frequency ratio and logistic regression models in west sumatera province, Indonesia. CATENA 2014, 118, 124–135. [Google Scholar] [CrossRef]
- Rana, N.; Bisht, P.; Bagri, D.S.; Wasson, R.J.; Sundriyal, Y. Identification of landslide-prone zones in the geomorphically and climatically sensitive mandakini valley, (central Himalaya), for disaster governance using the weights of evidence method. Geomorphology 2017, 284, 41–52. [Google Scholar]
- Razavizadeh, S.; Solaimani, K.; Massironi, M.; Kavian, A. Mapping landslide susceptibility with frequency ratio, statistical index, and weights of evidence models: A case study in northern iran. Environ. Earth Sci. 2017, 76, 499. [Google Scholar] [CrossRef]
- Fan, W.; Wei, X.-S.; Cao, Y.-B.; Zheng, B. Landslide susceptibility assessment using the certainty factor and analytic hierarchy process. J. Mt. Sci. 2017, 14, 906–925. [Google Scholar] [CrossRef]
- Pradhan, B.; Sameen, M.I. Landslide susceptibility modeling: Optimization and factor effect analysis. In Laser Scanning Applications in Landslide Assessment; Pradhan, B., Ed.; Springer International Publishing: Cham, Switzerland, 2017; pp. 115–132. [Google Scholar]
- Althuwaynee, O.F.; Pradhan, B.; Lee, S. Application of an evidential belief function model in landslide susceptibility mapping. Comput. Geosci. 2012, 44, 120–135. [Google Scholar] [CrossRef]
- Gayen, A.; Saha, S. Application of weights-of-evidence (woe) and evidential belief function (ebf) models for the delineation of soil erosion vulnerable zones: A study on pathro river basin, jharkhand, India. Model. Earth Syst. Environ. 2017, 3, 1123–1139. [Google Scholar] [CrossRef]
- Mondal, S.; Maiti, R. Integrating the analytical hierarchy process (ahp) and the frequency ratio (fr) model in landslide susceptibility mapping of shiv-khola watershed, darjeeling himalaya. Int. J. Disaster Risk Sci. 2013, 4, 200–212. [Google Scholar] [CrossRef] [Green Version]
- Myronidis, D.; Papageorgiou, C.; Theophanous, S. Landslide susceptibility mapping based on landslide history and analytic hierarchy process (ahp). Nat. Hazards 2016, 81, 245–263. [Google Scholar] [CrossRef]
- Yoshimatsu, H.; Abe, S. A review of landslide hazards in japan and assessment of their susceptibility using an analytical hierarchic process (ahp) method. Landslides 2006, 3, 149–158. [Google Scholar] [CrossRef]
- Chen, W.; Zhao, X.; Shahabi, H.; Shirzadi, A.; Khosravi, K.; Chai, H.; Zhang, S.; Zhang, L.; Ma, J.; Chen, Y.; et al. Spatial prediction of landslide susceptibility by combining evidential belief function, logistic regression and logistic model tree. Geocarto Int. 2019, 34, 1177–1201. [Google Scholar] [CrossRef]
- Feizizadeh, B.; Roodposhti, M.S.; Blaschke, T.; Aryal, J. Comparing gis-based support vector machine kernel functions for landslide susceptibility mapping. Arab. J. Geosci. 2017, 10, 122. [Google Scholar] [CrossRef]
- Pourghasemi, H.R.; Jirandeh, A.G.; Pradhan, B.; Xu, C.; Gokceoglu, C. Landslide susceptibility mapping using support vector machine and gis at the golestan province, iran. J. Earth Syst. Sci. 2013, 122, 349–369. [Google Scholar] [CrossRef] [Green Version]
- Wu, X.; Ren, F.; Niu, R. Landslide susceptibility assessment using object mapping units, decision tree, and support vector machine models in the three gorges of china. Environ. Earth Sci. 2014, 71, 4725–4738. [Google Scholar] [CrossRef]
- Catani, F.; Lagomarsino, D.; Segoni, S.; Tofani, V. Landslide susceptibility estimation by random forests technique: Sensitivity and scaling issues. Nat. Hazards Earth Syst. Sci. 2013, 13, 2815–2831. [Google Scholar] [CrossRef] [Green Version]
- Chen, W.; Pourghasemi, H.R.; Naghibi, S.A. Prioritization of landslide conditioning factors and its spatial modeling in shangnan county, china using gis-based data mining algorithms. Bull. Eng. Geol. Environ. 2018, 77, 611–629. [Google Scholar] [CrossRef]
- Chen, W.; Hong, H.; Panahi, M.; Shahabi, H.; Wang, Y.; Shirzadi, A.; Pirasteh, S.; Alesheikh, A.A.; Khosravi, K.; Panahi, S.; et al. Spatial prediction of landslide susceptibility using gis-based data mining techniques of anfis with whale optimization algorithm (woa) and grey wolf optimizer (gwo). Appl. Sci. 2019, 9, 3755. [Google Scholar] [CrossRef] [Green Version]
- Nasiri Aghdam, I.; Pradhan, B.; Panahi, M. Landslide susceptibility assessment using a novel hybrid model of statistical bivariate methods (fr and woe) and adaptive neuro-fuzzy inference system (anfis) at southern zagros mountains in iran. Environ. Earth Sci. 2017, 76, 237. [Google Scholar] [CrossRef]
- Quan, H.-C.; Lee, B.-G. Gis-based landslide susceptibility mapping using analytic hierarchy process and artificial neural network in jeju (korea). KSCE J. Civ. Eng. 2012, 16, 1258–1266. [Google Scholar] [CrossRef]
- Wang, Q.; Li, W.; Xing, M.; Wu, Y.; Pei, Y.; Yang, D.; Bai, H. Landslide susceptibility mapping at gongliu county, china using artificial neural network and weight of evidence models. Geosci. J. 2016, 20, 705–718. [Google Scholar] [CrossRef]
- Zare, M.; Pourghasemi, H.R.; Vafakhah, M.; Pradhan, B. Landslide susceptibility mapping at vaz watershed (iran) using an artificial neural network model: A comparison between multilayer perceptron (mlp) and radial basic function (rbf) algorithms. Arab. J. Geosci. 2013, 6, 2873–2888. [Google Scholar] [CrossRef]
- Pradhan, B. A comparative study on the predictive ability of the decision tree, support vector machine and neuro-fuzzy models in landslide susceptibility mapping using gis. Comput. Geosci. 2013, 51, 350–365. [Google Scholar] [CrossRef]
- Zhang, K.; Wu, X.; Niu, R.; Yang, K.; Zhao, L. The assessment of landslide susceptibility mapping using random forest and decision tree methods in the three gorges reservoir area, China. Environ. Earth Sci. 2017, 76, 405. [Google Scholar] [CrossRef]
- Pham, B.T.; Tien Bui, D.; Prakash, I. Application of classification and regression trees for spatial prediction of rainfall-induced shallow landslides in the uttarakhand area (India) using gis. In Climate Change, Extreme Events and Disaster Risk Reduction: Towards Sustainable Development Goals; Mal, S., Singh, R.B., Huggel, C., Eds.; Springer International Publishing: Cham, Switzerland, 2018; pp. 159–170. [Google Scholar]
- Sahana, M.; Sajjad, H. Evaluating effectiveness of frequency ratio, fuzzy logic and logistic regression models in assessing landslide susceptibility: A case from rudraprayag district, India. J. Mt. Sci. 2017, 14, 2150–2167. [Google Scholar] [CrossRef]
- Chen, W.; Shahabi, H.; Zhang, S.; Khosravi, K.; Shirzadi, A.; Chapi, K.; Pham, B.T.; Zhang, T.; Zhang, L.; Chai, H.; et al. Landslide susceptibility modeling based on gis and novel bagging-based kernel logistic regression. Appl. Sci. 2018, 8, 2540. [Google Scholar] [CrossRef] [Green Version]
- Jebur, M.N.; Pradhan, B.; Tehrany, M.S. Manifestation of lidar-derived parameters in the spatial prediction of landslides using novel ensemble evidential belief functions and support vector machine models in gis. IEEE J. Sel. Top. Appl. Earth Obs. Remote Sens. 2015, 8, 674–690. [Google Scholar] [CrossRef]
- Wang, L.-J.; Guo, M.; Sawada, K.; Lin, J.; Zhang, J. A comparative study of landslide susceptibility maps using logistic regression, frequency ratio, decision tree, weights of evidence and artificial neural network. Geosci. J. 2016, 20, 117–136. [Google Scholar] [CrossRef]
- Aghdam, I.N.; Varzandeh, M.H.M.; Pradhan, B. Landslide susceptibility mapping using an ensemble statistical index (wi) and adaptive neuro-fuzzy inference system (anfis) model at Alborz mountains (Iran). Environ. Earth Sci. 2016, 75, 553. [Google Scholar] [CrossRef]
- Youssef, A.M.; Pradhan, B.; Jebur, M.N.; El-Harbi, H.M. Landslide susceptibility mapping using ensemble bivariate and multivariate statistical models in Fayfa area, Saudi Arabia. Environ. Earth Sci. 2015, 73, 3745–3761. [Google Scholar] [CrossRef]
- Chen, W.; Shirzadi, A.; Shahabi, H.; Ahmad, B.B.; Zhang, S.; Hong, H.; Zhang, N. A novel hybrid artificial intelligence approach based on the rotation forest ensemble and naïve bayes tree classifiers for a landslide susceptibility assessment in Langao County, China. Geomat. Nat. Hazards Risk 2017, 8, 1955–1977. [Google Scholar] [CrossRef] [Green Version]
- Pham, B.T.; Prakash, I.; Tien Bui, D. Spatial prediction of landslides using a hybrid machine learning approach based on random subspace and classification and regression trees. Geomorphology 2018, 303, 256–270. [Google Scholar] [CrossRef]
- Persichillo, M.G.; Bordoni, M.; Meisina, C. The role of land use changes in the distribution of shallow landslides. Sci. Total Environ. 2017, 574, 924–937. [Google Scholar] [CrossRef]
- Nicu, I.C.; Asăndulesei, A. Gis-based evaluation of diagnostic areas in landslide susceptibility analysis of Bahluieț river basin (Moldavian Plateau, Ne Romania). Are neolithic sites in danger? Geomorphology 2018, 314, 27–41. [Google Scholar] [CrossRef]
- Sharma, S.; Mahajan, A.K. A comparative assessment of information value, frequency ratio and analytical hierarchy process models for landslide susceptibility mapping of a Himalayan watershed, India. Bull. Eng. Geol. Environ. 2019, 78, 2431–2448. [Google Scholar] [CrossRef]
- Shirani, K.; Pasandi, M.; Arabameri, A. Landslide susceptibility assessment by dempster–shafer and index of entropy models, Sarkhoun basin, southwestern Iran. Nat. Hazards 2018, 93, 1379–1418. [Google Scholar] [CrossRef]
- Youssef, A.M.; Al-Kathery, M.; Pradhan, B. Landslide susceptibility mapping at Al-Hasher area, Jizan (Saudi Arabia) using gis-based frequency ratio and index of entropy models. Geosci. J. 2015, 19, 113–134. [Google Scholar] [CrossRef]
- Wang, Q.; Li, W.; Wu, Y.; Pei, Y.; Xie, P. Application of statistical index and index of entropy methods to landslide susceptibility assessment in gongliu (Xinjiang, China). Environ. Earth Sci. 2016, 75, 599. [Google Scholar] [CrossRef]
- Veenadhari, S.; Misra, B.; Singh, C. Machine learning approach for forecasting crop yield based on climatic parameters. In Proceedings of the 2014 International Conference on Computer Communication and Informatics, Coimbatore, India, 3–5 January 2014; pp. 1–5. [Google Scholar]
- Islam, Z.; Giggins, H. Knowledge discovery through sysfor: A systematically developed forest of multiple decision trees. In Proceedings of the Ninth Australasian Data Mining Conference; Australian Computer Society, Inc.: Ballarat, Australia, 2011; Volume 121, pp. 195–204. [Google Scholar]
- Bibri, S.E. Data science for urban sustainability: Data mining and data-analytic thinking in the next wave of city analytics. In Smart Sustainable Cities of the Future: The Untapped Potential of Big Data Analytics and Context–Aware Computing for Advancing Sustainability; Bibri, S.E., Ed.; Springer International Publishing: Cham, Switherland, 2018; pp. 189–246. [Google Scholar]
- Polykretis, C.; Chalkias, C. Comparison and evaluation of landslide susceptibility maps obtained from weight of evidence, logistic regression, and artificial neural network models. Nat. Hazards 2018, 93, 249–274. [Google Scholar] [CrossRef]
- Pourghasemi, H.R.; Moradi, H.R.; Fatemi Aghda, S.M. Landslide susceptibility mapping by binary logistic regression, analytical hierarchy process, and statistical index models and assessment of their performances. Nat. Hazards 2013, 69, 749–779. [Google Scholar] [CrossRef]
- Shahabi, H.; Hashim, M.; Ahmad, B.B. Remote sensing and gis-based landslide susceptibility mapping using frequency ratio, logistic regression, and fuzzy logic methods at the central zab basin, iran. Environ. Earth Sci. 2015, 73, 8647–8668. [Google Scholar] [CrossRef]
- Meng, Q.; Miao, F.; Zhen, J.; Wang, X.; Wang, A.; Peng, Y.; Fan, Q. Gis-based landslide susceptibility mapping with logistic regression, analytical hierarchy process, and combined fuzzy and support vector machine methods: A case study from wolong giant panda natural reserve, china. Bull. Eng. Geol. Environ. 2016, 75, 923–944. [Google Scholar] [CrossRef]
- Fell, R.; Glastonbury, J.; Hunter, G. Rapid landslides: The importance of understanding mechanisms and rupture surface mechanics. Q. J. Eng. Geol. Hydrogeol. 2007, 40, 9–27. [Google Scholar] [CrossRef]
- Rosi, A.; Tofani, V.; Tanteri, L.; Stefanelli, C.T.; Agostini, A.; Catani, F.; Casagli, N. The new landslide inventory of tuscany (Italy) updated with ps-insar: Geomorphological features and landslide distribution. Landslides 2018, 15, 5–19. [Google Scholar] [CrossRef] [Green Version]
- Chen, W.; Sun, Z.; Han, J. Landslide susceptibility modeling using integrated ensemble weights of evidence with logistic regression and random forest models. Appl. Sci. 2019, 9, 171. [Google Scholar] [CrossRef] [Green Version]
- Hungr, O.; Leroueil, S.; Picarelli, L. The varnes classification of landslide types, an update. Landslides 2014, 11, 167–194. [Google Scholar] [CrossRef]
- Tien Bui, D.; Tuan, T.A.; Klempe, H.; Pradhan, B.; Revhaug, I. Spatial prediction models for shallow landslide hazards: A comparative assessment of the efficacy of support vector machines, artificial neural networks, kernel logistic regression, and logistic model tree. Landslides 2016, 13, 361–378. [Google Scholar] [CrossRef]
- Conforti, M.; Pascale, S.; Robustelli, G.; Sdao, F. Evaluation of prediction capability of the artificial neural networks for mapping landslide susceptibility in the Turbolo river catchment (northern Calabria, Italy). CATENA 2014, 113, 236–250. [Google Scholar] [CrossRef]
- Hong, H.; Pradhan, B.; Xu, C.; Tien Bui, D. Spatial prediction of landslide hazard at the Yihuang area (China) using two-class kernel logistic regression, alternating decision tree and support vector machines. CATENA 2015, 133, 266–281. [Google Scholar] [CrossRef]
- Pham, B.T.; Tien Bui, D.; Pourghasemi, H.R.; Indra, P.; Dholakia, M.B. Landslide susceptibility assesssment in the uttarakhand area (India) using gis: A comparison study of prediction capability of naïve bayes, multilayer perceptron neural networks, and functional trees methods. Theor. Appl. Climatol. 2017, 128, 255–273. [Google Scholar] [CrossRef]
- Chen, W.; Panahi, M.; Pourghasemi, H.R. Performance evaluation of gis-based new ensemble data mining techniques of adaptive neuro-fuzzy inference system (anfis) with genetic algorithm (ga), differential evolution (de), and particle swarm optimization (pso) for landslide spatial modelling. CATENA 2017, 157, 310–324. [Google Scholar] [CrossRef]
- Chapi, K.; Singh, V.P.; Shirzadi, A.; Shahabi, H.; Bui, D.T.; Pham, B.T.; Khosravi, K. A novel hybrid artificial intelligence approach for flood susceptibility assessment. Environ. Model. Softw. 2017, 95, 229–245. [Google Scholar] [CrossRef]
- Chen, W.; Zhang, S.; Li, R.; Shahabi, H. Performance evaluation of the gis-based data mining techniques of best-first decision tree, random forest, and naïve bayes tree for landslide susceptibility modeling. Sci. Total Environ. 2018, 644, 1006–1018. [Google Scholar] [CrossRef]
- Losasso, L.; Rinaldi, C.; Alberico, D.; Sdao, F. In Landslide risk analysis along strategic touristic roads in Basilicata (southern Italy) using the modified rhrs 2.0 method. In Proceedings of the Computational Science and Its Applications—ICCSA 2017; Gervasi, O., Murgante, B., Misra, S., Borruso, G., Torre, C.M., Rocha, A.M.A.C., Taniar, D., Apduhan, B.O., Stankova, E., Cuzzocrea, A., Eds.; Springer International Publishing: Cham, Switherland, 2017; pp. 761–776. [Google Scholar]
- Sridhar, B.; Rao, P.J.; Narasimha Rao, G.; Duvvuru, R.; Anusha, C.; Sanyasi Naidu, D.; Srinivas, E.; Sridevi, T.; Madhuri, M.; Padmini, Y. In Identification of landslide hazard zones along the Bheemili Beach road, Visakhapatnam district, A.P. In Proceedings of International Conference on Remote Sensing for Disaster Management; Rao, P.J., Rao, K.N., Kubo, S., Eds.; Springer International Publishing: Cham, Switherland, 2019; pp. 515–522. [Google Scholar]
- Srivastava, P.K.; Han, D.; Rico-Ramirez, M.A.; Islam, T.J.H.P. Sensitivity and uncertainty analysis of mesoscale model downscaled hydro-meteorological variables for discharge prediction. Hydrol. Process. 2014, 28, 4419–4432. [Google Scholar] [CrossRef]
- Bièvre, G.; Jongmans, D.; Goutaland, D.; Pathier, E.; Zumbo, V. Geophysical characterization of the lithological control on the kinematic pattern in a large clayey landslide (Avignonet, French Alps). Landslides 2016, 13, 423–436. [Google Scholar] [CrossRef]
- Watakabe, T.; Matsushi, Y. Lithological controls on hydrological processes that trigger shallow landslides: Observations from granite and hornfels hillslopes in Hiroshima, Japan. CATENA 2019, 180, 55–68. [Google Scholar] [CrossRef]
- Bezak, N.; Jemec Auflič, M.; Mikoš, M. Application of hydrological modelling for temporal prediction of rainfall-induced shallow landslides. Landslides 2019, 16, 1273–1283. [Google Scholar] [CrossRef] [Green Version]
- Piciullo, L.; Gariano, S.L.; Melillo, M.; Brunetti, M.T.; Peruccacci, S.; Guzzetti, F.; Calvello, M. Definition and performance of a threshold-based regional early warning model for rainfall-induced landslides. Landslides 2017, 14, 995–1008. [Google Scholar] [CrossRef]
- Chen, C.-W.; Chen, H.; Oguchi, T. Distributions of landslides, vegetation, and related sediment yields during typhoon events in northwestern Taiwan. Geomorphology 2016, 273, 1–13. [Google Scholar] [CrossRef]
- Fiorucci, F.; Ardizzone, F.; Mondini, A.C.; Viero, A.; Guzzetti, F. Visual interpretation of stereoscopic ndvi satellite images to map rainfall-induced landslides. Landslides 2019, 16, 165–174. [Google Scholar] [CrossRef]
- Sun, W.; Tian, Y.; Mu, X.; Zhai, J.; Gao, P.; Zhao, G. Loess landslide inventory map based on gf-1 satellite imagery. Remote Sens. 2017, 9, 314. [Google Scholar] [CrossRef] [Green Version]
- Bartelletti, C.; Giannecchini, R.; D’Amato Avanzi, G.; Galanti, Y.; Mazzali, A. The influence of geological–morphological and land use settings on shallow landslides in the pogliaschina T. Basin (northern Apennines, Italy). J. Maps 2017, 13, 142–152. [Google Scholar] [CrossRef] [Green Version]
- Li, R.; Wang, N. Landslide susceptibility mapping for the Muchuan county (China): A comparison between bivariate statistical models (woe, ebf, and ioe) and their ensembles with logistic regression. Symmetry 2019, 11, 762. [Google Scholar] [CrossRef] [Green Version]
- Chen, W.; Xie, X.; Peng, J.; Wang, J.; Duan, Z.; Hong, H. Gis-based landslide susceptibility modelling: A comparative assessment of kernel logistic regression, naïve-bayes tree, and alternating decision tree models. Geomat. Nat. Hazards Risk 2017, 8, 950–973. [Google Scholar] [CrossRef] [Green Version]
- Chen, W.; Shahabi, H.; Shirzadi, A.; Hong, H.; Akgun, A.; Tian, Y.; Liu, J.; Zhu, A.X.; Li, S. Novel hybrid artificial intelligence approach of bivariate statistical-methods-based kernel logistic regression classifier for landslide susceptibility modeling. Bull. Eng. Geol. Environ. 2019, 78, 4397–4419. [Google Scholar] [CrossRef]
- Chen, W.; Shahabi, H.; Shirzadi, A.; Li, T.; Guo, C.; Hong, H.; Li, W.; Pan, D.; Hui, J.; Ma, M.; et al. A novel ensemble approach of bivariate statistical-based logistic model tree classifier for landslide susceptibility assessment. Geocarto Int. 2018, 33, 1398–1420. [Google Scholar] [CrossRef]
- Ashournejad, Q.; Hosseini, A.; Pradhan, B.; Hosseini, S.J. Hazard zoning for spatial planning using gis-based landslide susceptibility assessment: A new hybrid integrated data-driven and knowledge-based model. Arab. J. Geosci. 2019, 12, 126. [Google Scholar] [CrossRef]
- Moosavi, V.; Niazi, Y. Development of hybrid wavelet packet-statistical models (wp-sm) for landslide susceptibility mapping. Landslides 2016, 13, 97–114. [Google Scholar] [CrossRef]
- Shirzadi, A.; Bui, D.T.; Pham, B.T.; Solaimani, K.; Chapi, K.; Kavian, A.; Shahabi, H.; Revhaug, I. Shallow landslide susceptibility assessment using a novel hybrid intelligence approach. Environ. Earth Sci. 2017, 76, 60. [Google Scholar] [CrossRef]
- Battistini, A.; Rosi, A.; Segoni, S.; Lagomarsino, D.; Catani, F.; Casagli, N. Validation of landslide hazard models using a semantic engine on online news. Appl. Geogr. 2017, 82, 59–65. [Google Scholar] [CrossRef]
- Hong, H.; Shahabi, H.; Shirzadi, A.; Chen, W.; Chapi, K.; Ahmad, B.B.; Roodposhti, M.S.; Yari Hesar, A.; Tian, Y.; Tien Bui, D. Landslide susceptibility assessment at the wuning area, china: A comparison between multi-criteria decision making, bivariate statistical and machine learning methods. Nat. Hazards 2019, 96, 173–212. [Google Scholar] [CrossRef]
- Murillo-García, F.G.; Steger, S.; Alcántara-Ayala, I. Landslide susceptibility: A statistically-based assessment on a depositional pyroclastic ramp. J. Mt. Sci. 2019, 16, 561–580. [Google Scholar] [CrossRef]
- Chen, W.; Hong, H.; Li, S.; Shahabi, H.; Wang, Y.; Wang, X.; Ahmad, B.B. Flood susceptibility modelling using novel hybrid approach of reduced-error pruning trees with bagging and random subspace ensembles. J. Hydrol. 2019, 575, 864–873. [Google Scholar] [CrossRef]
- Chen, W.; Panahi, M.; Khosravi, K.; Pourghasemi, H.R.; Rezaie, F.; Parvinnezhad, D. Spatial prediction of groundwater potentiality using anfis ensembled with teaching-learning-based and biogeography-based optimization. J. Hydrol. 2019, 572, 435–448. [Google Scholar] [CrossRef]
- Chen, W.; Li, Y.; Xue, W.; Shahabi, H.; Li, S.; Hong, H.; Wang, X.; Bian, H.; Zhang, S.; Pradhan, B.; et al. Modeling flood susceptibility using data-driven approaches of naïve bayes tree, alternating decision tree, and random forest methods. Sci. Total Environ. 2020, 701, 134979. [Google Scholar] [CrossRef] [PubMed]
- Chen, W.; Pradhan, B.; Li, S.; Shahabi, H.; Rizeei, H.M.; Hou, E.; Wang, S. Novel hybrid integration approach of bagging-based fisher’s linear discriminant function for groundwater potential analysis. Nat. Resour. Res. 2019, 28, 1239–1258. [Google Scholar] [CrossRef] [Green Version]
- Chen, W.; Tsangaratos, P.; Ilia, I.; Duan, Z.; Chen, X. Groundwater spring potential mapping using population-based evolutionary algorithms and data mining methods. Sci. Total Environ. 2019, 684, 31–49. [Google Scholar] [CrossRef] [PubMed]
- Chen, W.; Li, H.; Hou, E.; Wang, S.; Wang, G.; Panahi, M.; Li, T.; Peng, T.; Guo, C.; Niu, C.; et al. Gis-based groundwater potential analysis using novel ensemble weights-of-evidence with logistic regression and functional tree models. Sci. Total Environ. 2018, 634, 853–867. [Google Scholar] [CrossRef] [PubMed] [Green Version]
- Pham, B.T.; Prakash, I.; Singh, S.K.; Shirzadi, A.; Shahabi, H.; Tran, T.-T.-T.; Bui, D.T. Landslide susceptibility modeling using reduced error pruning trees and different ensemble techniques: Hybrid machine learning approaches. CATENA 2019, 175, 203–218. [Google Scholar] [CrossRef]
- Tien Bui, D.; Pham, B.T.; Nguyen, Q.P.; Hoang, N.-D. Spatial prediction of rainfall-induced shallow landslides using hybrid integration approach of least-squares support vector machines and differential evolution optimization: A case study in central vietnam. Int. J. Digit. Earth 2016, 9, 1077–1097. [Google Scholar] [CrossRef]
- Althuwaynee, O.F.; Pradhan, B.; Park, H.J.; Lee, J.H. A novel ensemble decision tree-based chi-squared automatic interaction detection (chaid) and multivariate logistic regression models in landslide susceptibility mapping. Landslides 2014, 11, 1063–1078. [Google Scholar] [CrossRef]
- Arabameri, A.; Pradhan, B.; Rezaei, K. Spatial prediction of gully erosion using alos palsar data and ensemble bivariate and data mining models. Geosci. J. 2019, 23, 669–686. [Google Scholar] [CrossRef]
- Chen, W.; Xie, X.; Peng, J.; Shahabi, H.; Hong, H.; Bui, D.T.; Duan, Z.; Li, S.; Zhu, A.X. Gis-based landslide susceptibility evaluation using a novel hybrid integration approach of bivariate statistical based random forest method. CATENA 2018, 164, 135–149. [Google Scholar] [CrossRef]
- Pourghasemi, H.R.; Mohammady, M.; Pradhan, B. Landslide susceptibility mapping using index of entropy and conditional probability models in gis: Safarood basin, Iran. CATENA 2012, 97, 71–84. [Google Scholar] [CrossRef]
- Abedini, M.; Ghasemyan, B.; Rezaei Mogaddam, M.H. Landslide susceptibility mapping in bijar city, kurdistan province, iran: A comparative study by logistic regression and ahp models. Environ. Earth Sci. 2017, 76, 308. [Google Scholar] [CrossRef]
- Ba, Q.; Chen, Y.; Deng, S.; Yang, J.; Li, H. A comparison of slope units and grid cells as mapping units for landslide susceptibility assessment. Earth Sci. Inform. 2018, 11, 373–388. [Google Scholar] [CrossRef]
- Zhao, X.; Chen, W. Gis-based evaluation of landslide susceptibility models using certainty factors and functional trees-based ensemble techniques. Appl. Sci. 2020, 10, 16. [Google Scholar]
- Raja, N.B.; Çiçek, I.; Türkoğlu, N.; Aydin, O.; Kawasaki, A. Correction to: Landslide susceptibility mapping of the sera river basin using logistic regression model. Nat. Hazards 2018, 91, 1423. [Google Scholar] [CrossRef] [Green Version]


| Parameters | Collinearity Statistics | |||
|---|---|---|---|---|
| Tolerance | VIF | Tolerance | VIF | |
| Elevation | 0.543 | 1.843 | 0.507 | 1.970 |
| Profile curvature | 0.897 | 1.115 | 0.897 | 1.115 |
| Plan curvature | 0.824 | 1.214 | 0.801 | 1.248 |
| Slope angle | 0.764 | 1.308 | 0.759 | 1.317 |
| Slope aspect | 0.912 | 1.096 | 0.904 | 1.106 |
| SPI | 0.524 | 1.907 | 0.464 | 2.157 |
| TWI | 0.830 | 1.205 | 0.834 | 1.200 |
| STI | 0.479 | 2.086 | 0.426 | 2.346 |
| Distance to roads | 0.817 | 1.224 | 0.823 | 1.214 |
| Distance to rivers | 0.952 | 1.050 | 0.924 | 1.083 |
| Distance to faults | 0.926 | 1.080 | 0.731 | 1.368 |
| Lithology | 0.729 | 1.372 | 0.734 | 1.362 |
| Rainfall | 0.741 | 1.349 | 0.802 | 1.247 |
| Soil | 0.805 | 1.242 | 0.687 | 1.456 |
| NDVI | 0.847 | 1.180 | 0.639 | 1.566 |
| Land use | 0.640 | 1.562 | 0.507 | 1.970 |
| Factors | Class | Percentage of Domain | Percentage of Landslides | FR | Wj |
|---|---|---|---|---|---|
| Elevation (m) | 442–600 | 13.242 | 19.858 | 1.500 | 0.223 |
| 600–800 | 16.399 | 34.043 | 2.076 | ||
| 800–1000 | 12.091 | 21.986 | 1.818 | ||
| 1000–1200 | 10.450 | 12.057 | 1.154 | ||
| 1200–1400 | 12.756 | 10.638 | 0.834 | ||
| 1400–1600 | 12.341 | 1.418 | 0.115 | ||
| 1600–1800 | 12.042 | 0.000 | 0.000 | ||
| 1800–2000 | 7.920 | 0.000 | 0.000 | ||
| 2000–2200 | 2.504 | 0.000 | 0.000 | ||
| 2200–2410 | 0.255 | 0.000 | 0.000 | ||
| Profile curvature | −14.28 to −0.05 | 45.753 | 46.809 | 1.023 | 0.083 |
| −0.05–0.05 | 5.696 | 11.348 | 1.992 | ||
| 0.05–14.77 | 48.551 | 41.844 | 0.862 | ||
| Plan curvature | −14.0 to −0.05 | 46.110 | 41.135 | 0.892 | 0.014 |
| −0.05–0.05 | 6.893 | 9.220 | 1.338 | ||
| 0.05–13.07 | 46.996 | 49.645 | 1.056 | ||
| Slope angle (°) | 0–10 | 23.641 | 25.532 | 1.080 | 0.146 |
| 10–20 | 29.270 | 44.681 | 1.526 | ||
| 20–30 | 26.292 | 20.567 | 0.782 | ||
| 30–40 | 14.987 | 7.801 | 0.521 | ||
| 40–50 | 4.975 | 1.418 | 0.285 | ||
| 50–60 | 0.780 | 0.000 | 0.000 | ||
| 60–72.83 | 0.055 | 0.000 | 0.000 | ||
| Slope aspect | Flat | 0.028 | 0.000 | 0.000 | 0.075 |
| North | 14.212 | 11.348 | 0.798 | ||
| North-east | 12.976 | 11.348 | 0.875 | ||
| East | 12.046 | 12.057 | 1.001 | ||
| South-east | 12.505 | 16.312 | 1.304 | ||
| South | 11.982 | 22.695 | 1.894 | ||
| South-west | 11.044 | 9.220 | 0.835 | ||
| West | 11.355 | 6.383 | 0.562 | ||
| North-west | 13.853 | 10.638 | 0.768 | ||
| SPI | <20 | 55.734 | 62.411 | 1.120 | 0.010 |
| 20–40 | 15.930 | 14.184 | 0.890 | ||
| 40–60 | 7.404 | 8.511 | 1.149 | ||
| 60–80 | 4.284 | 3.546 | 0.828 | ||
| >80 | 16.649 | 11.348 | 0.682 | ||
| TWI | <4 | 17.880 | 7.801 | 0.436 | 0.046 |
| 4–5 | 32.049 | 35.461 | 1.106 | ||
| 5–6 | 23.903 | 34.043 | 1.424 | ||
| 6–7 | 12.599 | 14.184 | 1.126 | ||
| >7 | 13.569 | 8.511 | 0.627 | ||
| STI | <10 | 55.157 | 63.830 | 1.157 | 0.024 |
| 10–20 | 22.491 | 22.695 | 1.009 | ||
| 20–30 | 9.447 | 4.255 | 0.450 | ||
| 30–40 | 4.524 | 3.546 | 0.784 | ||
| >40 | 8.381 | 5.674 | 0.677 | ||
| Distance to roads (m) | <300 | 11.010 | 23.404 | 2.126 | 0.065 |
| 300–600 | 8.951 | 11.348 | 1.268 | ||
| 600–900 | 7.852 | 5.674 | 0.723 | ||
| 900–1200 | 7.036 | 10.638 | 1.512 | ||
| >1200 | 65.151 | 48.936 | 0.751 | ||
| Distance to rivers (m) | <200 | 16.686 | 19.149 | 1.148 | 0.003 |
| 200–400 | 14.837 | 15.603 | 1.052 | ||
| 400–600 | 13.695 | 12.766 | 0.932 | ||
| 600–800 | 12.002 | 13.475 | 1.123 | ||
| >800 | 42.781 | 39.007 | 0.912 | ||
| Distance to faults (m) | <1000 | 21.510 | 22.695 | 1.055 | 0.022 |
| 1000–2000 | 16.106 | 12.766 | 0.793 | ||
| 2000–3000 | 13.198 | 14.894 | 1.129 | ||
| 3000–4000 | 11.168 | 5.674 | 0.508 | ||
| >4000 | 38.019 | 43.972 | 1.157 | ||
| Lithology | Group 1 | 11.627 | 19.149 | 1.647 | 0.117 |
| Group 2 | 0.054 | 0.000 | 0.000 | ||
| Group 3 | 4.383 | 1.418 | 0.324 | ||
| Group 4 | 12.756 | 4.255 | 0.334 | ||
| Group 5 | 0.239 | 0.000 | 0.000 | ||
| Group 6 | 3.453 | 0.000 | 0.000 | ||
| Group 7 | 7.231 | 3.546 | 0.490 | ||
| Group 8 | 10.228 | 7.092 | 0.693 | ||
| Group 9 | 8.846 | 6.383 | 0.722 | ||
| Group 10 | 1.254 | 0.709 | 0.566 | ||
| Group 11 | 13.945 | 22.695 | 1.627 | ||
| Group 12 | 25.982 | 34.752 | 1.338 | ||
| Rainfall (mm/yr) | <900 | 6.069 | 5.674 | 0.935 | 0.111 |
| 900–1000 | 18.642 | 20.567 | 1.103 | ||
| 1000–1100 | 9.029 | 16.312 | 1.807 | ||
| 1100–1200 | 10.544 | 24.823 | 2.354 | ||
| 1200–1300 | 8.680 | 11.348 | 1.307 | ||
| 1300–1400 | 20.159 | 12.766 | 0.633 | ||
| 1400–1500 | 11.247 | 4.965 | 0.441 | ||
| 1500–1600 | 8.670 | 2.128 | 0.245 | ||
| 1600–1700 | 4.343 | 0.709 | 0.163 | ||
| >1700 | 2.618 | 0.709 | 0.271 | ||
| Soil | ATc | 11.538 | 14.184 | 1.229 | 0.326 |
| CMd | 3.647 | 2.837 | 0.778 | ||
| CMe | 7.992 | 21.986 | 2.751 | ||
| FLc | 1.186 | 0.000 | 0.000 | ||
| LVh | 70.808 | 56.738 | 0.801 | ||
| LVx | 0.322 | 0.000 | 0.000 | ||
| PLe | 0.475 | 2.128 | 4.479 | ||
| RGc | 2.630 | 0.709 | 0.270 | ||
| RGe | 1.403 | 1.418 | 1.011 | ||
| NDVI | −0.21 to 0.21 | 2.161 | 2.837 | 1.313 | 0.128 |
| 0.21–0.36 | 6.660 | 7.092 | 1.065 | ||
| 0.36–0.44 | 20.845 | 44.681 | 2.144 | ||
| 0.44–0.52 | 34.881 | 39.716 | 1.139 | ||
| 0.52–0.65 | 35.454 | 5.674 | 0.160 | ||
| Land use | Farmland | 28.826 | 60.993 | 2.116 | 0.311 |
| Forestland | 30.974 | 2.837 | 0.092 | ||
| Forestland | 38.500 | 36.170 | 0.939 | ||
| Water | 0.603 | 0.000 | 0.000 | ||
| Residential areas | 1.075 | 0.000 | 0.000 | ||
| Bare land | 0.022 | 0.000 | 0.000 |
| Parameters | Coefficient of FR_LR Model | Coefficient of IoE_LR Model |
|---|---|---|
| Elevation | 0.596 | 1.978 |
| Profile curvature | 0.005 | −0.626 |
| Plan curvature | 1.390 | 72.424 |
| Slope angle | 0.182 | 1.042 |
| Slope aspect | 0.633 | 9.670 |
| SPI | 0.370 | 66.354 |
| TWI | 0.729 | 1.570 |
| STI | 0.381 | 7.543 |
| Distance to roads | 0.436 | 5.933 |
| Distance to rivers | −0.722 | —— |
| Distance to faults | −0.060 | −4.887 |
| Lithology | −0.138 | −1.090 |
| Rainfall | 0.607 | 5.141 |
| Soil | −0.030 | 0.008 |
| NDVI | 0.275 | 5.007 |
| Land use | 0.399 | 1.260 |
| Constant | −5.702 | −6.400 |
| Variable | AUC | SE | 95% CI |
|---|---|---|---|
| FR_model | 0.757 | 0.0285 | 0.702 to 0.806 |
| IoE_model | 0.746 | 0.0292 | 0.691 to 0.796 |
| FR_SysFor_model | 0 940 | 0.0132 | 0.906 to 0.965 |
| IoE_SysFor_model | 0.926 | 0.0151 | 0.889 to 0.954 |
| FR_LR_model | 0.779 | 0.0271 | 0.726 to 0.826 |
| IoE_LR_model | 0.783 | 0.0270 | 0.730 to 0.829 |
| Variable | AUC | SE | 95% CI |
|---|---|---|---|
| FR_model | 0.681 | 0.0498 | 0.590 to 0.762 |
| IoE_model | 0.691 | 0.0489 | 0.601 to 0.771 |
| FR_SysFor_model | 0.831 | 0.0388 | 0.753 to 0.893 |
| IoE_SysFor_model | 0.819 | 0.0399 | 0.739 to 0.883 |
| FR_LR_model | 0.696 | 0.0485 | 0.606 to 0.776 |
| IoE_LR_model | 0.702 | 0.0483 | 0.612 to 0.781 |
© 2019 by the authors. Licensee MDPI, Basel, Switzerland. This article is an open access article distributed under the terms and conditions of the Creative Commons Attribution (CC BY) license (http://creativecommons.org/licenses/by/4.0/).
Share and Cite
Chen, W.; Fan, L.; Li, C.; Pham, B.T. Spatial Prediction of Landslides Using Hybrid Integration of Artificial Intelligence Algorithms with Frequency Ratio and Index of Entropy in Nanzheng County, China. Appl. Sci. 2020, 10, 29. https://0-doi-org.brum.beds.ac.uk/10.3390/app10010029
Chen W, Fan L, Li C, Pham BT. Spatial Prediction of Landslides Using Hybrid Integration of Artificial Intelligence Algorithms with Frequency Ratio and Index of Entropy in Nanzheng County, China. Applied Sciences. 2020; 10(1):29. https://0-doi-org.brum.beds.ac.uk/10.3390/app10010029
Chicago/Turabian StyleChen, Wei, Limin Fan, Cheng Li, and Binh Thai Pham. 2020. "Spatial Prediction of Landslides Using Hybrid Integration of Artificial Intelligence Algorithms with Frequency Ratio and Index of Entropy in Nanzheng County, China" Applied Sciences 10, no. 1: 29. https://0-doi-org.brum.beds.ac.uk/10.3390/app10010029