Strain Measurement Distributed on a Ground Anchor Bearing Plate by Fiber Optic OFDR Sensor


1
Center for Safety Measurement, Korea Research Institute of Standards and Science (KRISS), Yuseong-gu, Daejeon 34114, Korea
2
Department of Physics, Chungnam National University, Yuseong-gu, Daejeon 34134, Korea
3
Department of Materials Physics, Dong-A University, Saha-gu, Busan 49315, Korea
*
Authors to whom correspondence should be addressed.
Appl. Sci. 2018, 8(11), 2051; https://0-doi-org.brum.beds.ac.uk/10.3390/app8112051
Submission received: 12 September 2018
/
Revised: 18 October 2018
/
Accepted: 19 October 2018
/
Published: 25 October 2018
(This article belongs to the Special Issue Optical Correlation-domain Distributed Fiber Sensors)
Abstract
:The safety of soil slopes reinforced by ground anchors can be evaluated by monitoring the tensile force of the anchors. The tensile force of ground anchors can be determined by measuring the strain of the bearing plate that transfers the tensile force of the anchor to the ground. Therefore, in order to investigate the relation between the strain of the bearing plate and the tensile force of a ground anchor, the strain distributed on the bearing plate was measured by a fiber optic OFDR (optical frequency domain reflectometry) sensor, which was fabricated by a tunable laser source, auxiliary interferometer, and main interferometer. This OFDR sensor was operated through a sweep range of 500 GHz with a spatial resolution of 0.2 mm, and a strain accuracy of approximately 4 με, considering the system noise when operating in 5-cm segments. The sensing fiber was circularly bonded onto the bearing plate using epoxy, and the distributed strain was measured on the bearing plate while increasing the load up to 10 tons. From the experimental results, the difference between the strain near the anchor head and the strain at the far site is significant in the region where compression strain is dominant. However, such a tendency did not appear in areas where bending strain dominates. Therefore, in order to monitor an anchor tensile force, it is necessary to carefully study the calibration factor between the anchor tensile force and the strain of the bearing plate.
1. Introduction
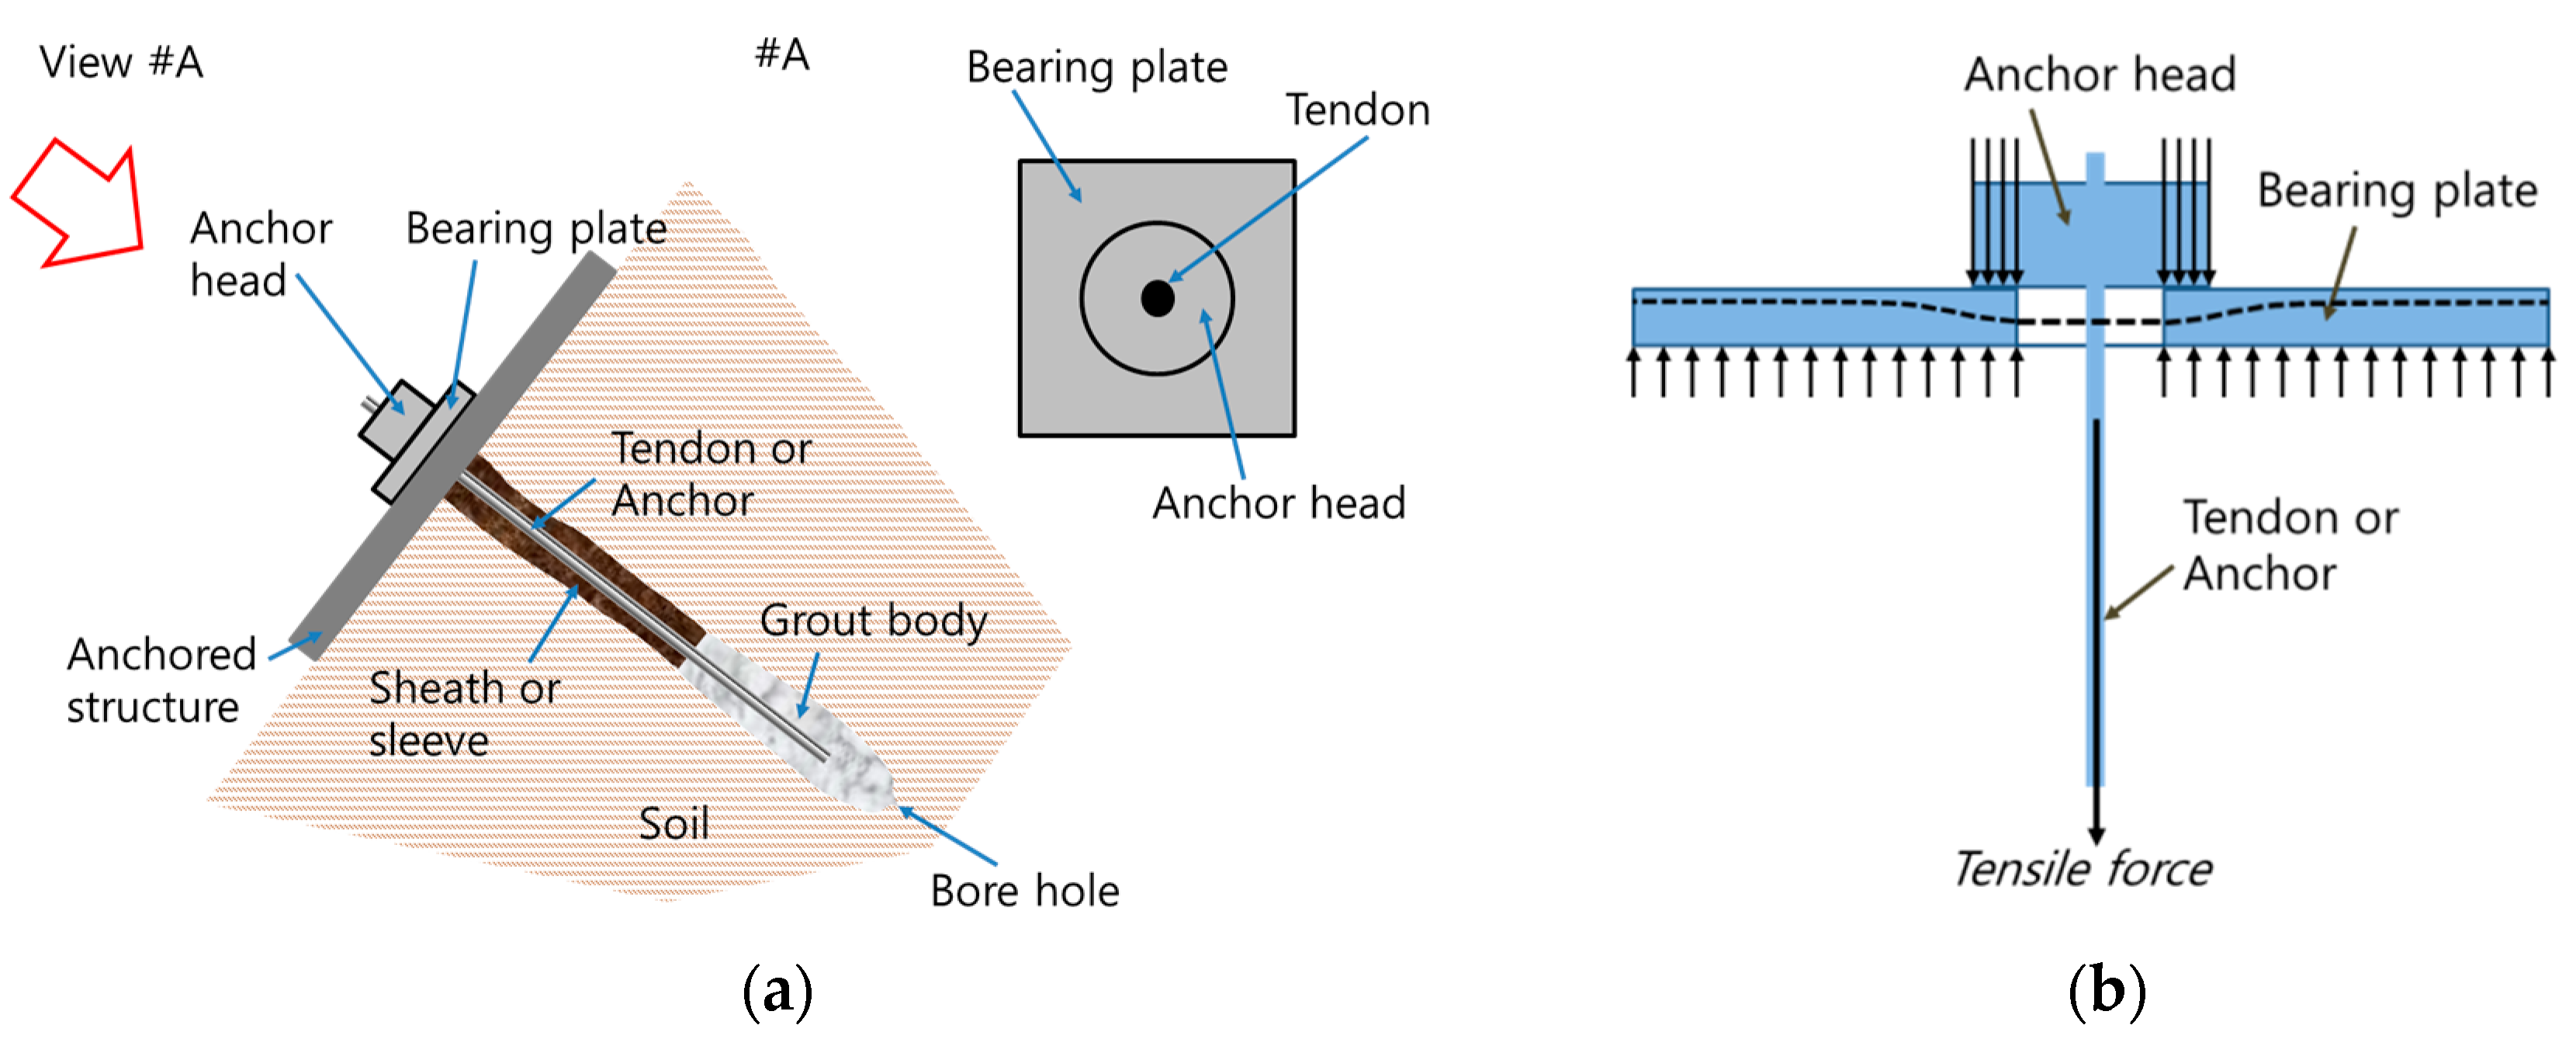
Recently, in the field of structural health monitoring, many studies have been conducted using optical fiber sensors [1]. Most notably, it is expected that the distributed strain sensing technique, which can be implemented only by optical fiber sensors, will be able to provide a new method for measuring the strain distribution for stress analysis of structures. Fiber optic sensors for distributed strain sensing have been developed with optical frequency domain reflectometry (OFDR) sensors using Rayleigh scattering, and Brillouin optical correlation domain analysis (BOCDA), Brillouin optical time domain analysis (BOTDA), and Brillouin optical time domain reflectometry (BOTDR) by Brillouin scattering [2,3]. In general, OFDR and BOCDA can achieve spatial resolution of less than 1 m [4,5,6]. In the field of construction engineering, the ground anchor system is used to stabilize slopes to prevent slope failure. The anchor system has the purpose of transmitting the tensile force of the anchor to the compressive force of the ground. Since the Cheurfas dam, in Algeria, utilized pre-stressing technology in 1935, various anchors have been developed and utilized for use on bridges, tunnels, and slopes [7,8]. Even so, most ground anchors have a basic mechanism for transferring the tensile force of the tendon to the ground. As shown in Figure 1a, the ground anchor consists of three parts: (1) the ground anchor body, (2) the anchor head, and (3) other parts related to the anchor head [9]. The ground anchor body is further divided into free anchor and fixed anchor sections. The free anchor, in which the strand or rod is covered by the sheath, transfers the tensile force from the anchor head to the fixed anchor section, where the tendon is grouted. The fixed anchor section transfers the tensile force to the ground by friction and compression. The ground anchor system is operated by various related accessories (e.g., wedges of anchor heads, nuts, and saddles) for easy operation.
Slopes are influenced by problems with the ground anchor components (e.g., secondary quality of the anti-corrosive material and poor quality of the anchor) and changes within the slope (e.g., freezing, thawing, and ground expansion). In the worst case, deformation of the slope causes damage to the anchor system as well as to the slope. Therefore, it is very important to detect a change in tensile force because damage to the anchor system necessarily involves a change in tensile force. If the change in tensile force is abnormal, the administrator must initiate a follow-up to identify the exact cause and ensure timely maintenance. In addition, an emergency warning can be issued if monitoring is expected to result in rapid slope failure. An electrical strain gauge can be applied to detect the tensile force change of the anchor system. An anchor tensile force measurement study has been performed using a fiber optic FBG (fiber Bragg grating) sensor [10]. This sensor used in this study has difficulties in fabrication because the optical fiber is embedded in the tensile strand in order to measure tensile force. When the tensile force of the anchor is changed, the bearing plate is deformed, as shown in Figure 1b, so that the strain of the bearing plate can be measured and converted into the tensile force of the anchor. Ideally, the tensile force of the anchor acts on the center portion of the bearing plate, so that the strain at the surface of the bearing plate will be distributed symmetrically with respect to the center. The strain on the surface of the bearing plate consists of the circumferential strain and the radial strain. The axial strain (εaxial) of the anchor is related to the circumferential strain (εcirc) and radial strain (εrad) as follows:
where ν is Poisson’s ratio. However, in reality, the bearing plate can undergo bending deformation, which should also be considered when calculating the anchor’s tensile force. Since it is easy to install the optical fiber on the surface of the bearing plate in a circular shape, it is preferable to examine the correlation with the anchor tensile force after measuring the circumferential strain distribution of the bearing plate. Therefore, in this study, to investigate the feasibility of measuring anchor tensile force from bearing plate strain, which is measured by a sensing optical fiber installed in a circumferential direction, we performed basic research to measure the strain distributed on a bearing plate surface. A fiber optic OFDR sensor was fabricated to acquire the strain distribution. The sensing fiber was glued onto the bearing plate with an epoxy adhesive, and four electrical strain gauges were also applied for comparison. The distributed strain was measured and the deformation behavior of the bearing plate was examined. The current paper describes sensor fabrication and testing, and discusses the implications for anchor load measurement.
2. Fabrication of Fiber Optic OFDR Sensor
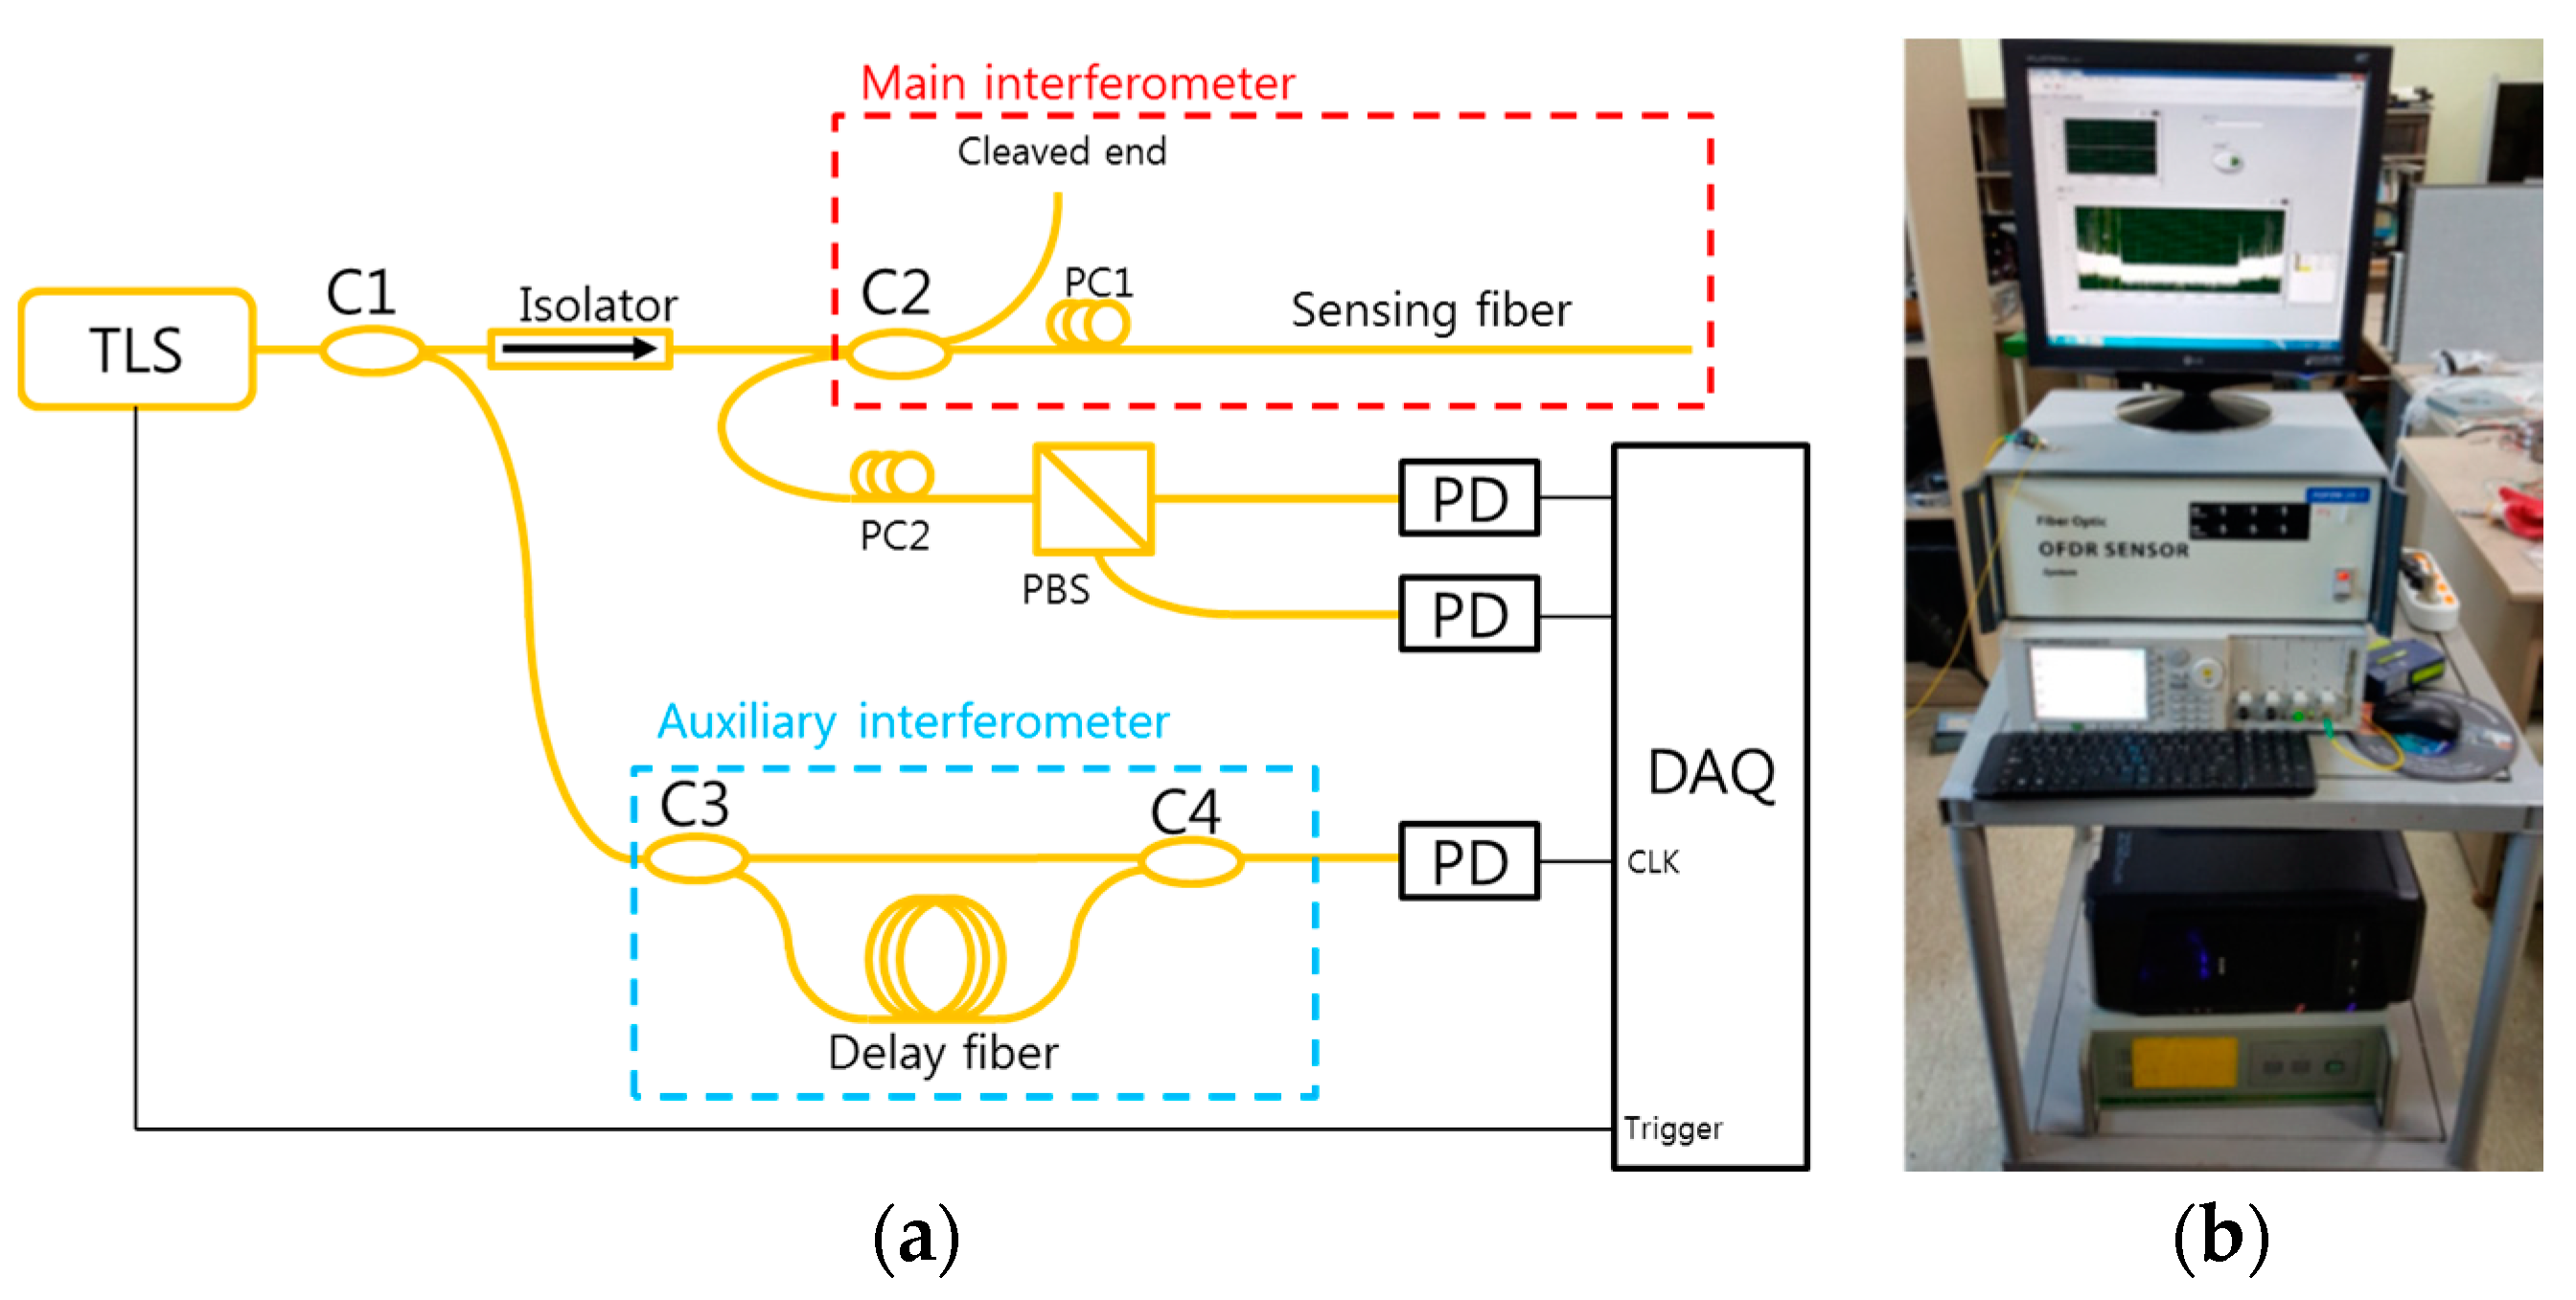
A schematic diagram of a fiber optic OFDR sensor is shown in Figure 2a. Light launched from a tunable laser source (TLS, Agilent 8164B) is divided by a 1:99 coupler (C1). The TLS light is swept from 1545 to 1551 nm, i.e., a 500-GHz sweep range (Δν). A small portion of light (1%) is sent to an auxiliary interferometer (AI), while the remaining light travels to a main interferometer. The AI is a simple Mach–Zehnder interferometer, which has 100 m delay between two arms. It creates an interfered signal which has same frequency spacing. With this interfered signal, a clock signal is generated to remove tuning nonlinearity. The main interferometer is constructed by a 50:50 coupler (C2). The Fresnel reflection generated by one fiber end of C2 can be termed a local oscillator (LO). When the light of the tunable laser source scans another arm, which is termed a sensing fiber, the Rayleigh backscattering (RBS) and connector reflections are generated. The signals of the LO and the sensing fiber are recombined at C2, and this produces a beat signal, which has a different frequency resulting from the difference in the length between the LO and sensing fiber. This beat signal is divided by a polarization beam splitter (PBS) using a polarization-diversity scheme [11]. Two polarization controllers (PC1 and PC2) are used to optimize the signal to noise-ratio (SNR) of the RBS signal of the OFDR. This fabricated OFDR sensor system is shown in Figure 2b.
3. Preparation of the Bearing Plate of Anchor System
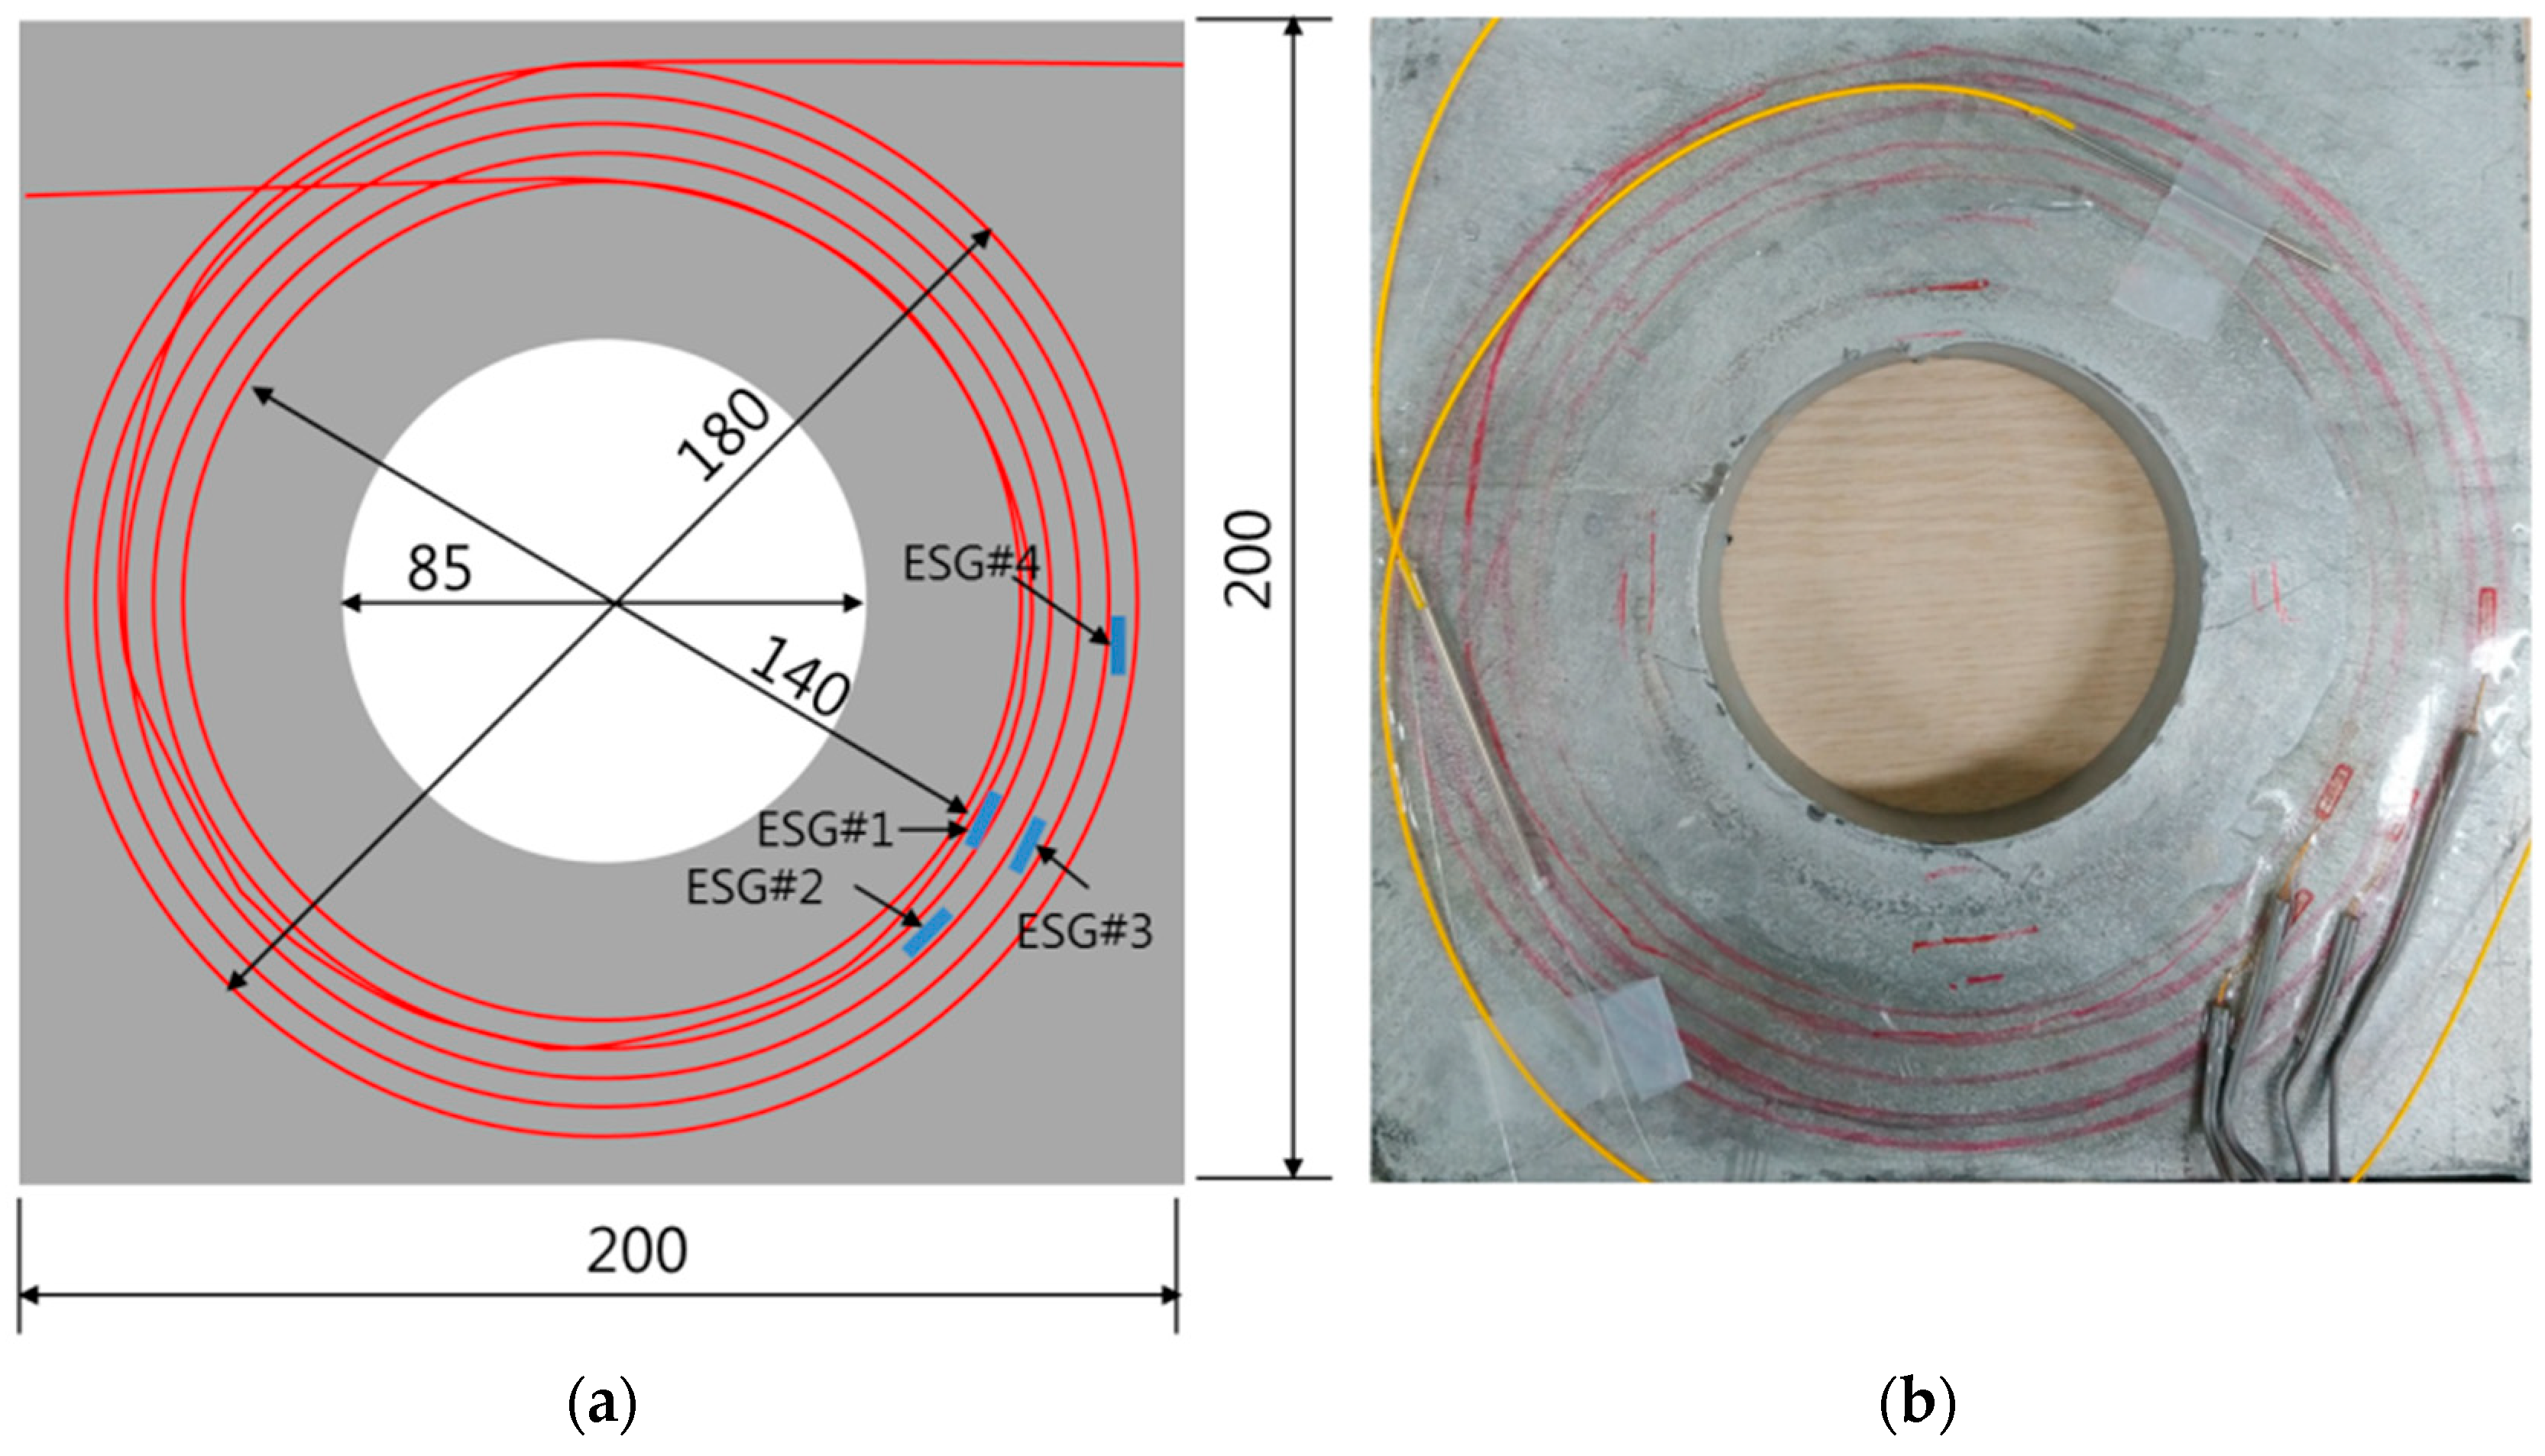
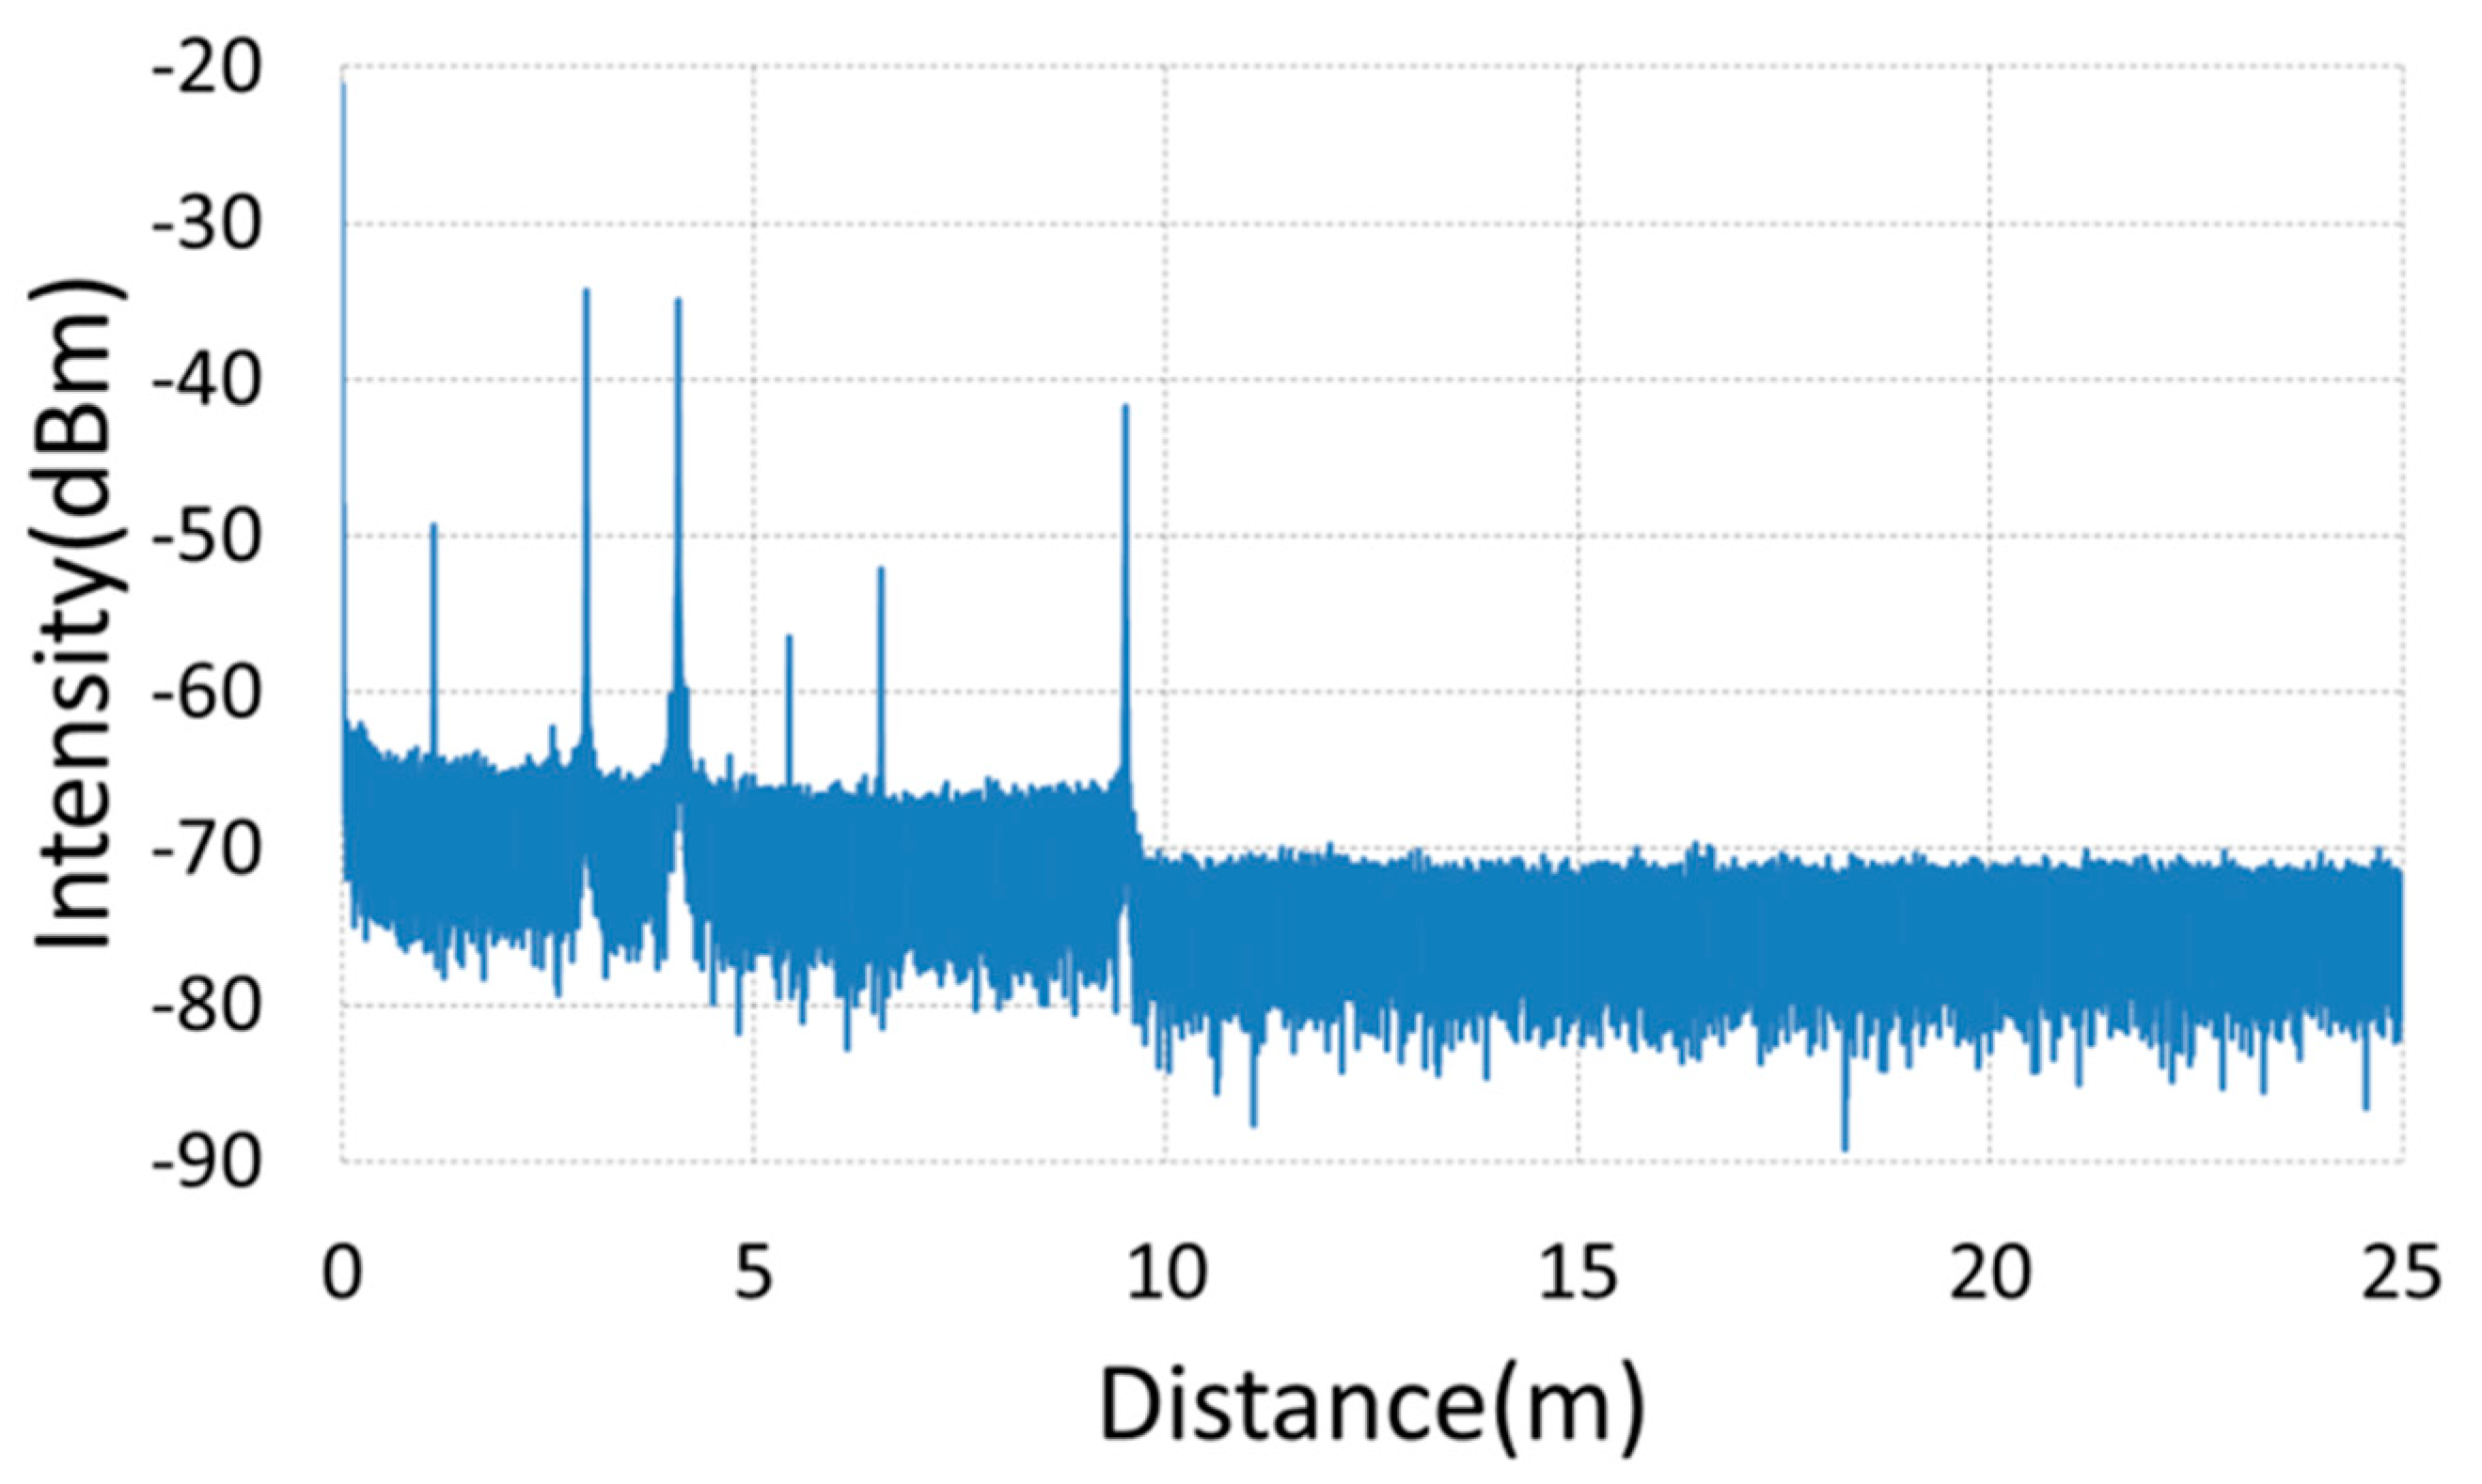
The bearing plate of the anchor system is shown in Figure 3 with a sensing fiber and four electrical strain gauges (ESG). The sensing fiber was installed on the bearing plate in a concentric circle with approximately five rotations in a radial direction at intervals of 0.5 cm. In addition, there is also an overlap of the optical fiber, which is installed with an additional rotation on the bearing plate. As a result, there were six rounds of data measured in the longitudinal direction of the sensing optical fiber; however, the data obtained from the overlapping fiber were removed prior to analyzing the results. The strain gauges were also installed, as shown in Figure 3a, at different distances from the anchor head, so that the effect on the spatial position on the bearing plate could be confirmed. Figure 3b is a photograph of the produced bearing plate. Figure 4 shows the distance domain signal of the bearing plate, which is obtained from the sensing optical fiber by the OFDR. This signal is obtained by fast Fourier transform (FFT) processing of the frequency domain signal obtained from the sensor. The light source was swept at a speed of 5 nm/s for a frequency range of 500 GHz to have a distance resolution of 0.2 mm (z = c/(2 ngΔν)). In Figure 4, the intensity of this signal is approximately 5 dB, and the length of the sensing fiber installed on the bearing plate is between 4 m and 9.5 m depending on the connector reflection.
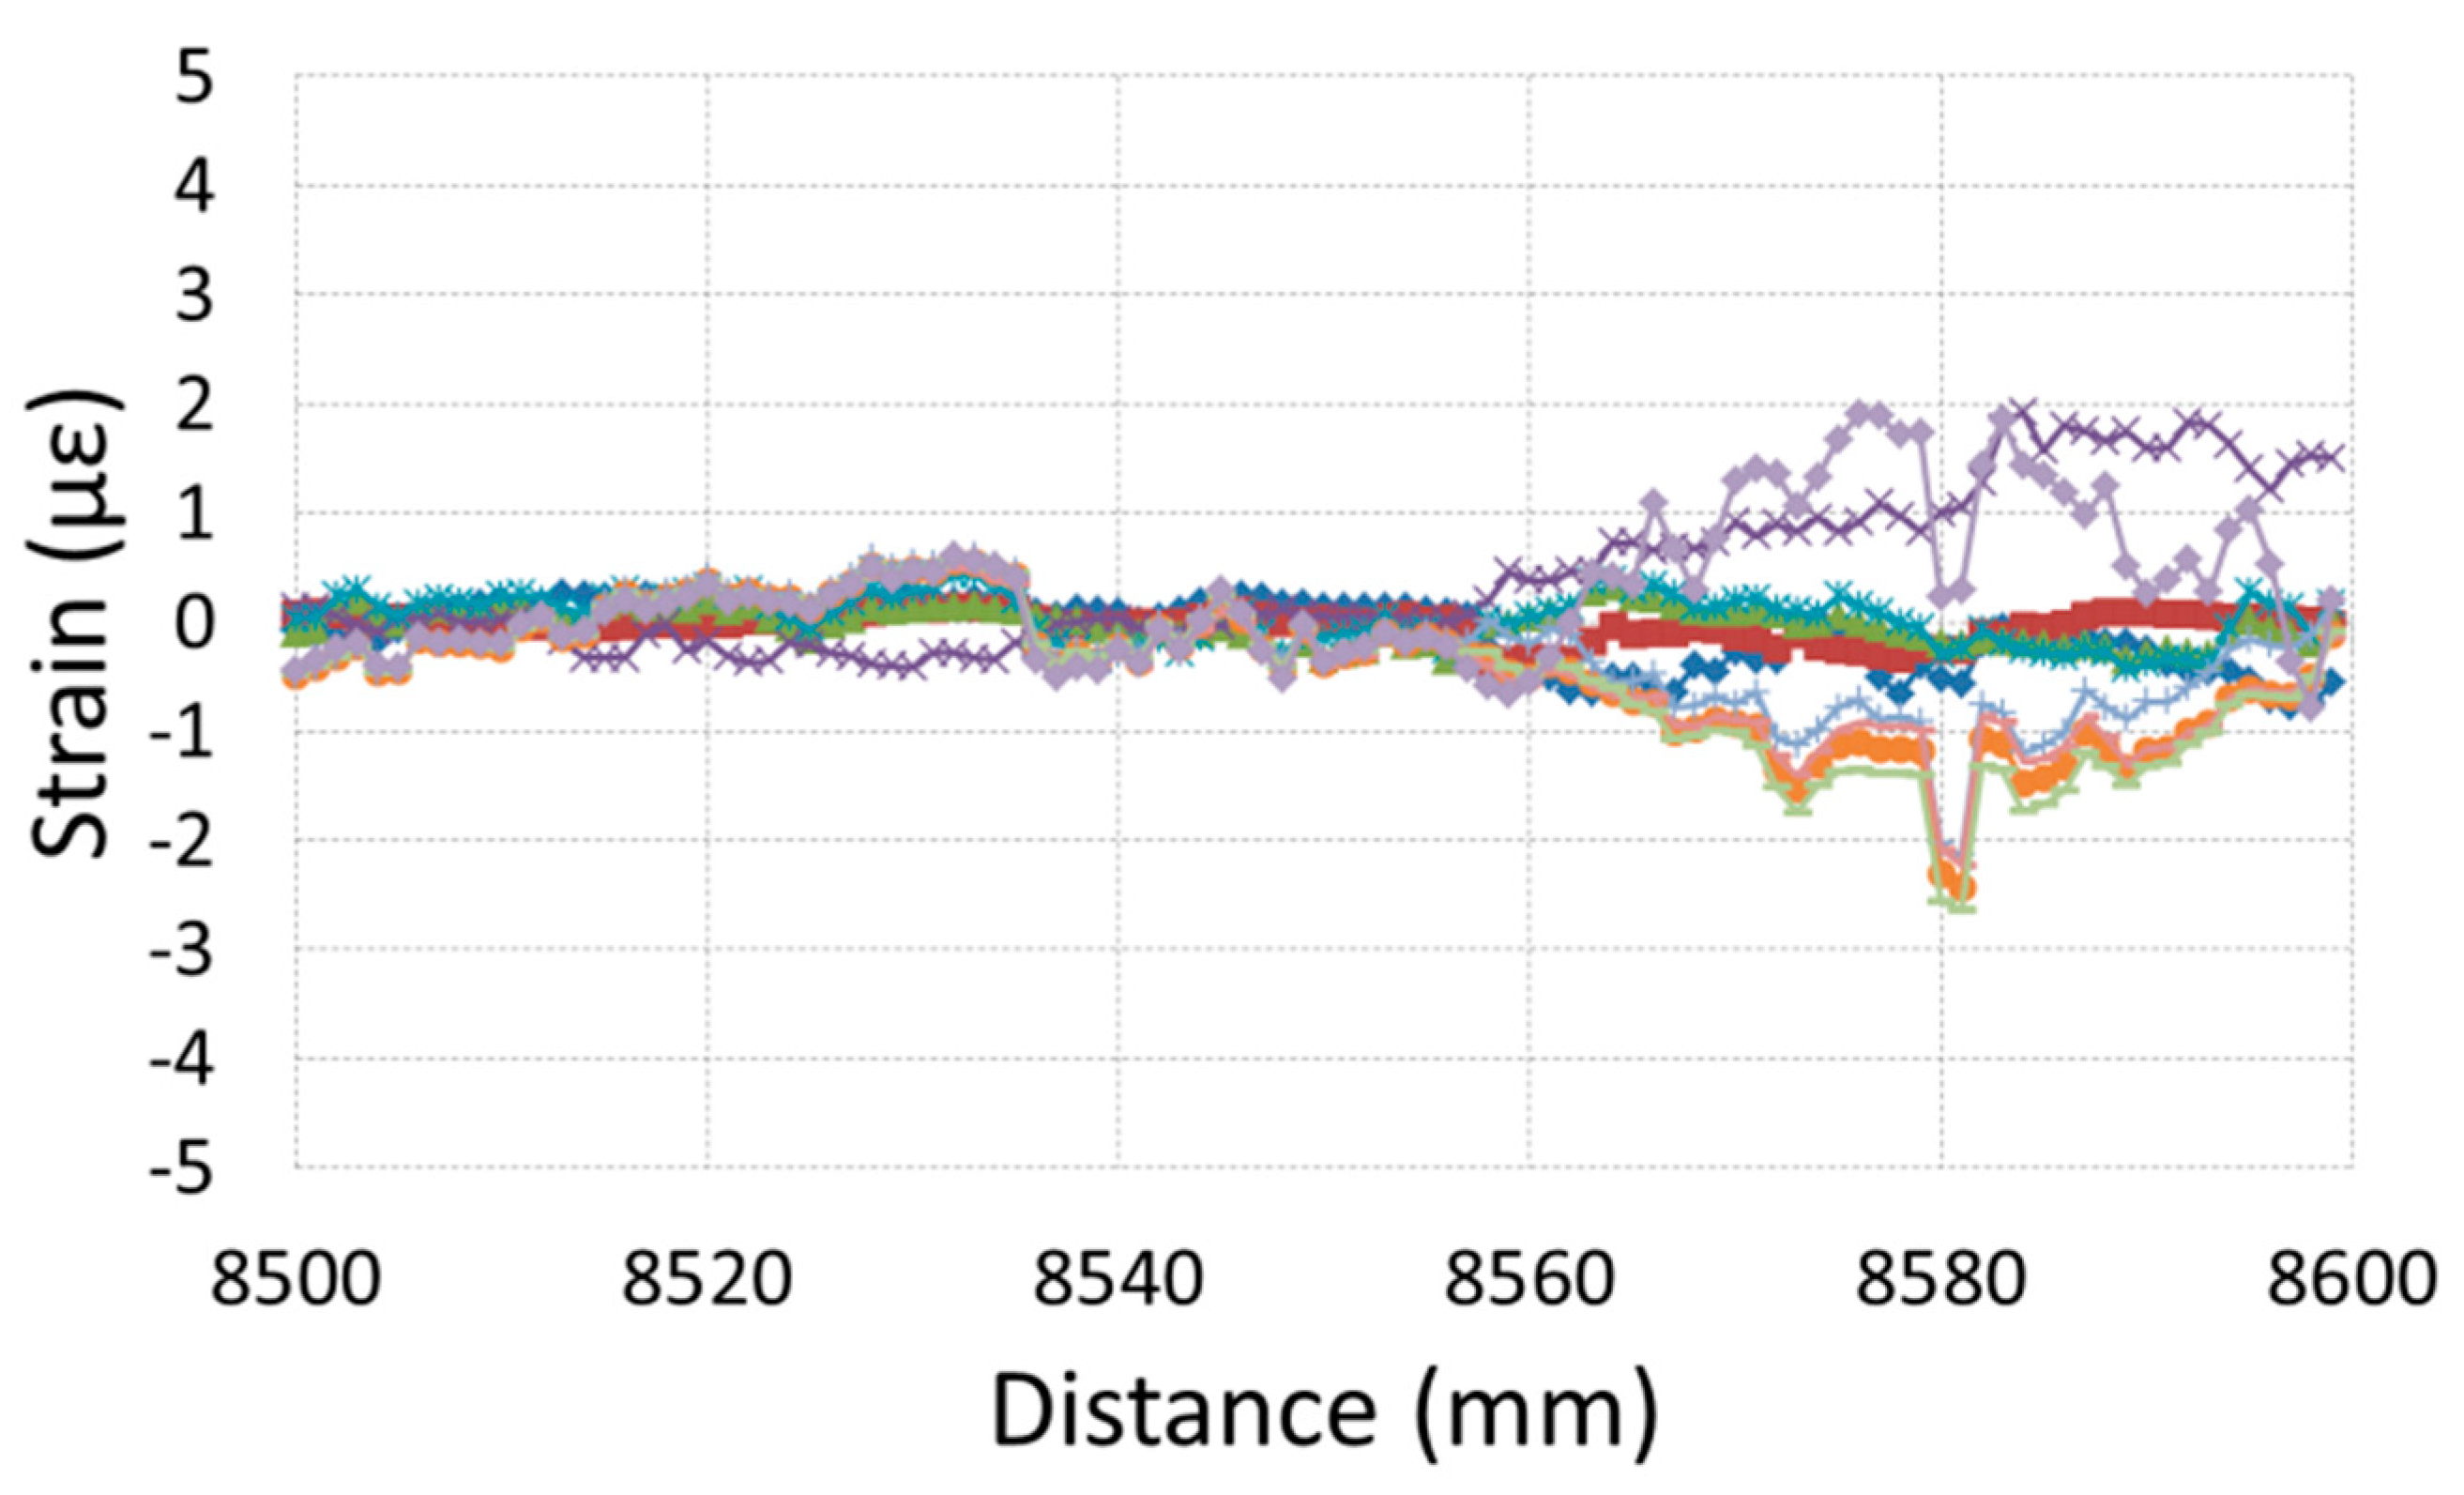
The strain can be obtained from the correlation frequency shift multiplied by the strain sensitivity, which is 0.7 με/GHz, and the property of the sensing optical fiber. The correlation frequency shift is determined by cross-correlation processing between the reference and sensing distance domain signals of each segment position. The segment size was selected to be 5 cm. In this experimental study, strain data were obtained by moving at 1 mm intervals using distance data corresponding to each segment. With this segment size, the theoretical frequency resolution is 2 GHz, which equates to a strain resolution of 14 με [12]. Figure 5 shows the signals measured nine times in the 8500–8600 mm distance range of the sensing fiber. Outside of the 8560–8600 mm range, variation is less than approximately ±1 με. In this figure, it was considered that strain variation in the range of 8560–8600 mm would be affected by small movements of the sensing fiber. Even with this effect in mind, the impact on strain measurement accuracy is less than ±2 με.
4. Anchor Tension Test with the Bearing Plate
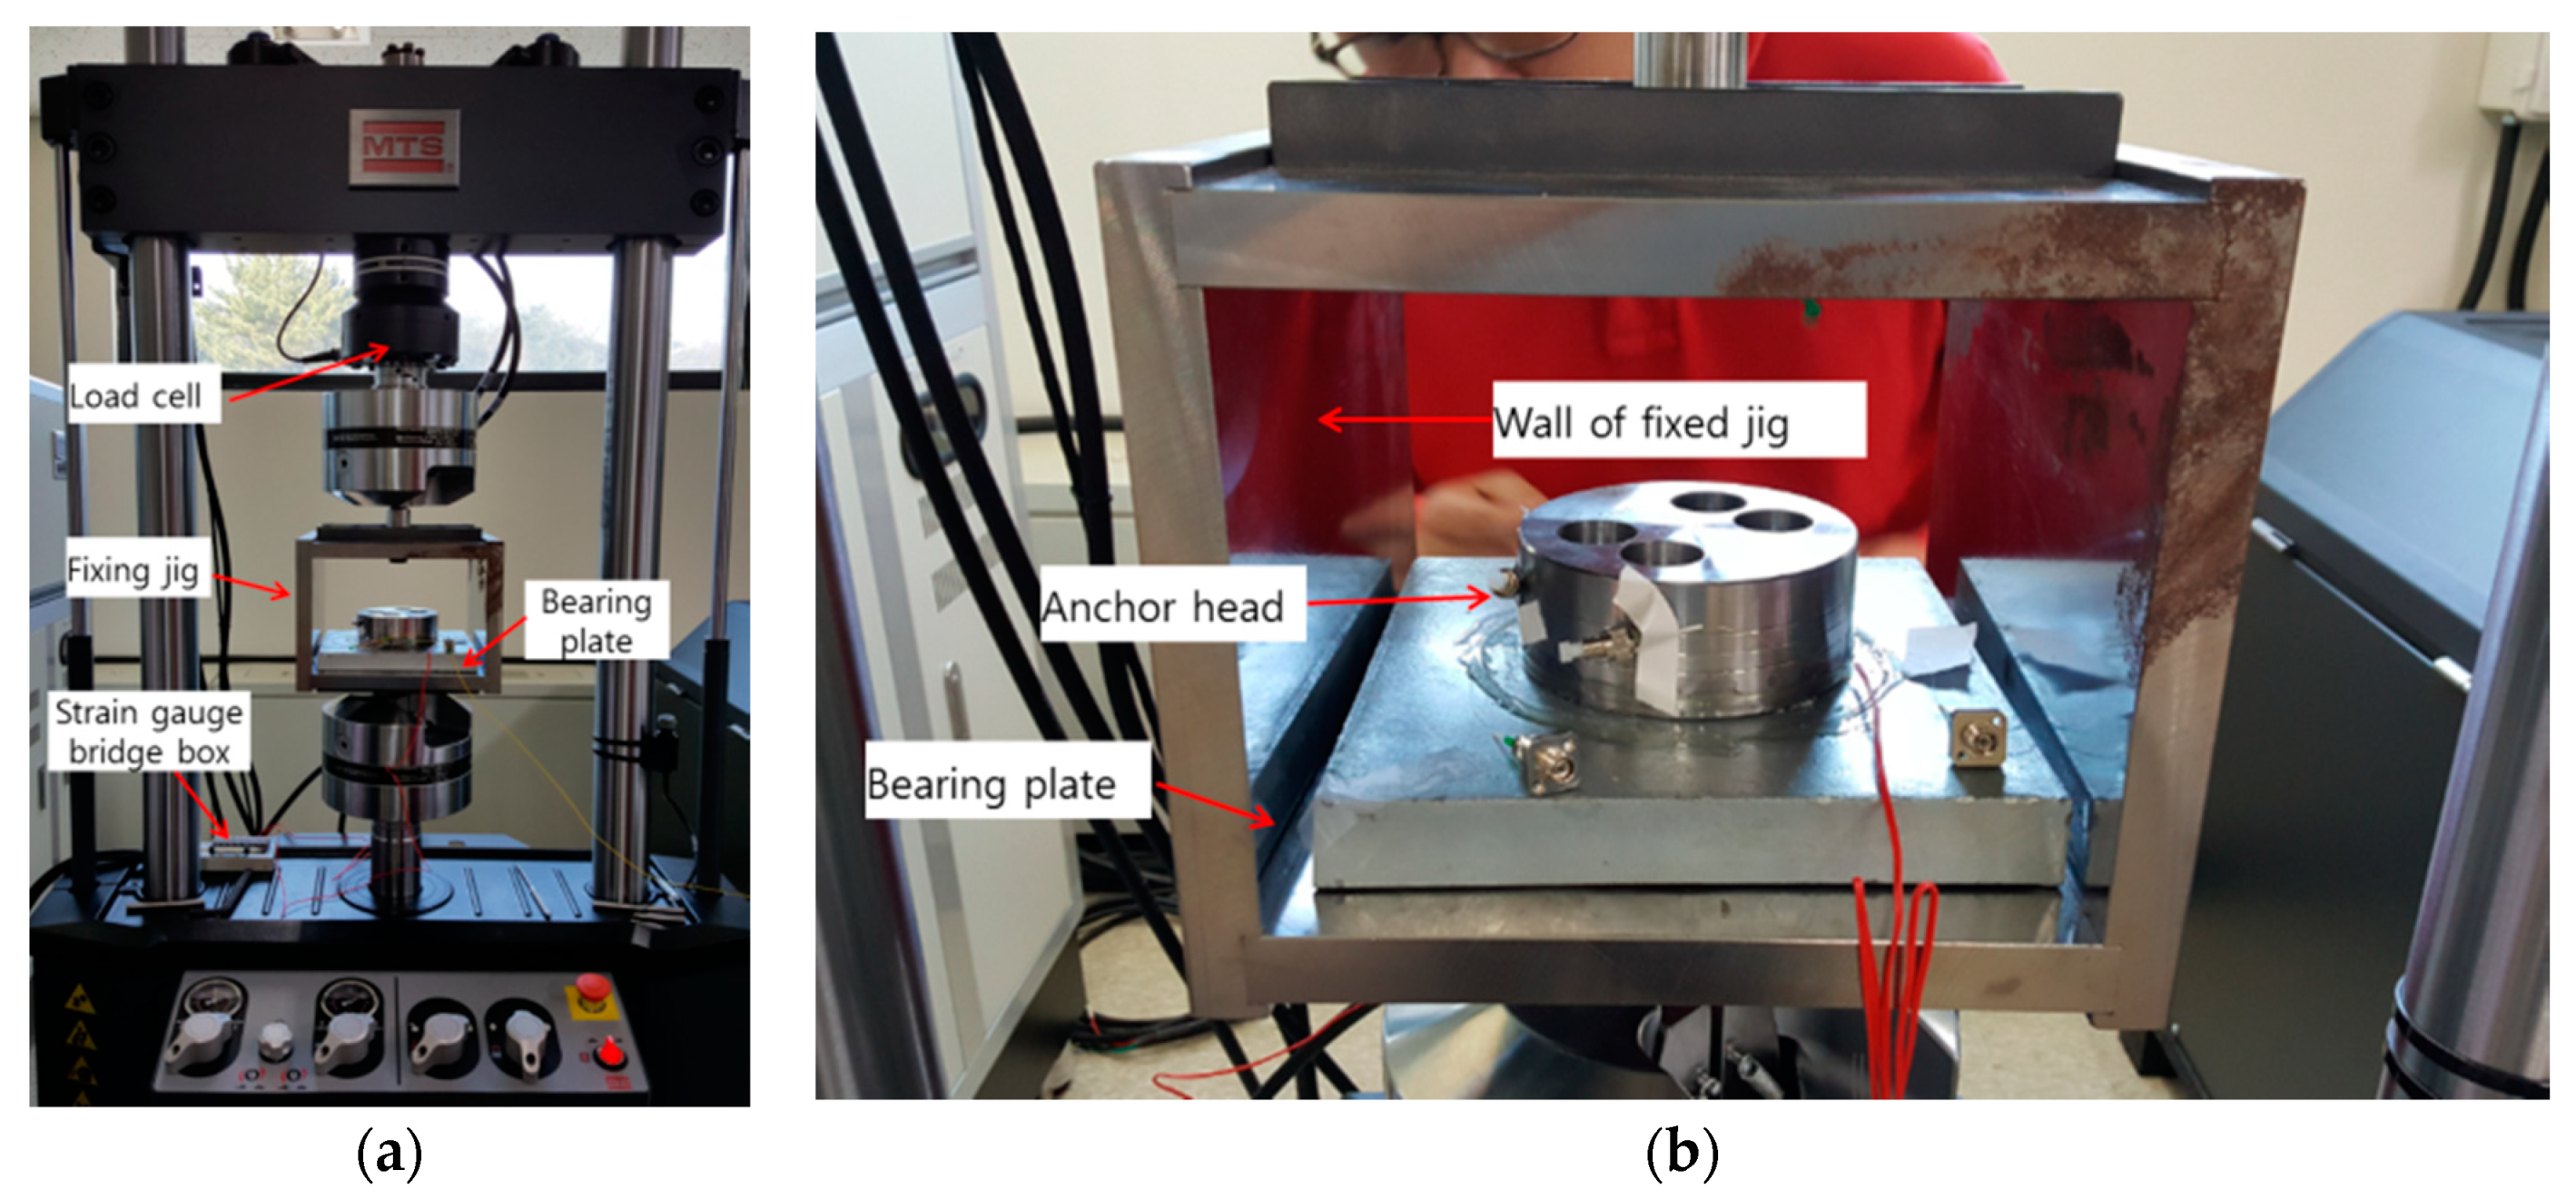
A universal testing machine (UTM) was used for loading the bearing plate with an anchor head as shown in Figure 6. Anchor tension testing was carried out with a load of up to 10 t while measuring the strain at 1 t intervals. Testing was performed by installing the load cell, fixed jig, anchor head, and bearing plate as shown in Figure 6a. In addition, strain gauges were connected to the bridge box and data collected from a computer via a signal conditioner. The anchor head on the bearing plate was connected to the bottom actuator of the universal testing machine by one bolt. In addition, the fixing jig connected to the base plate supporting the lower surface of the bearing plate was connected to the upper part of the universal testing machine shown in Figure 6b. The fixing jig was constructed with carbon steel of 23 mm thickness and dimensions of 270 mm × 270 mm × 250 mm. The base plate was reinforced by two bars in the same fashion as for the upper part of the fixing jig in order to prevent bending deformation. Therefore, when the universal testing machine is operated under the load control, the bearing plate is compressed between the anchor head and the base plate of the fixing jig.
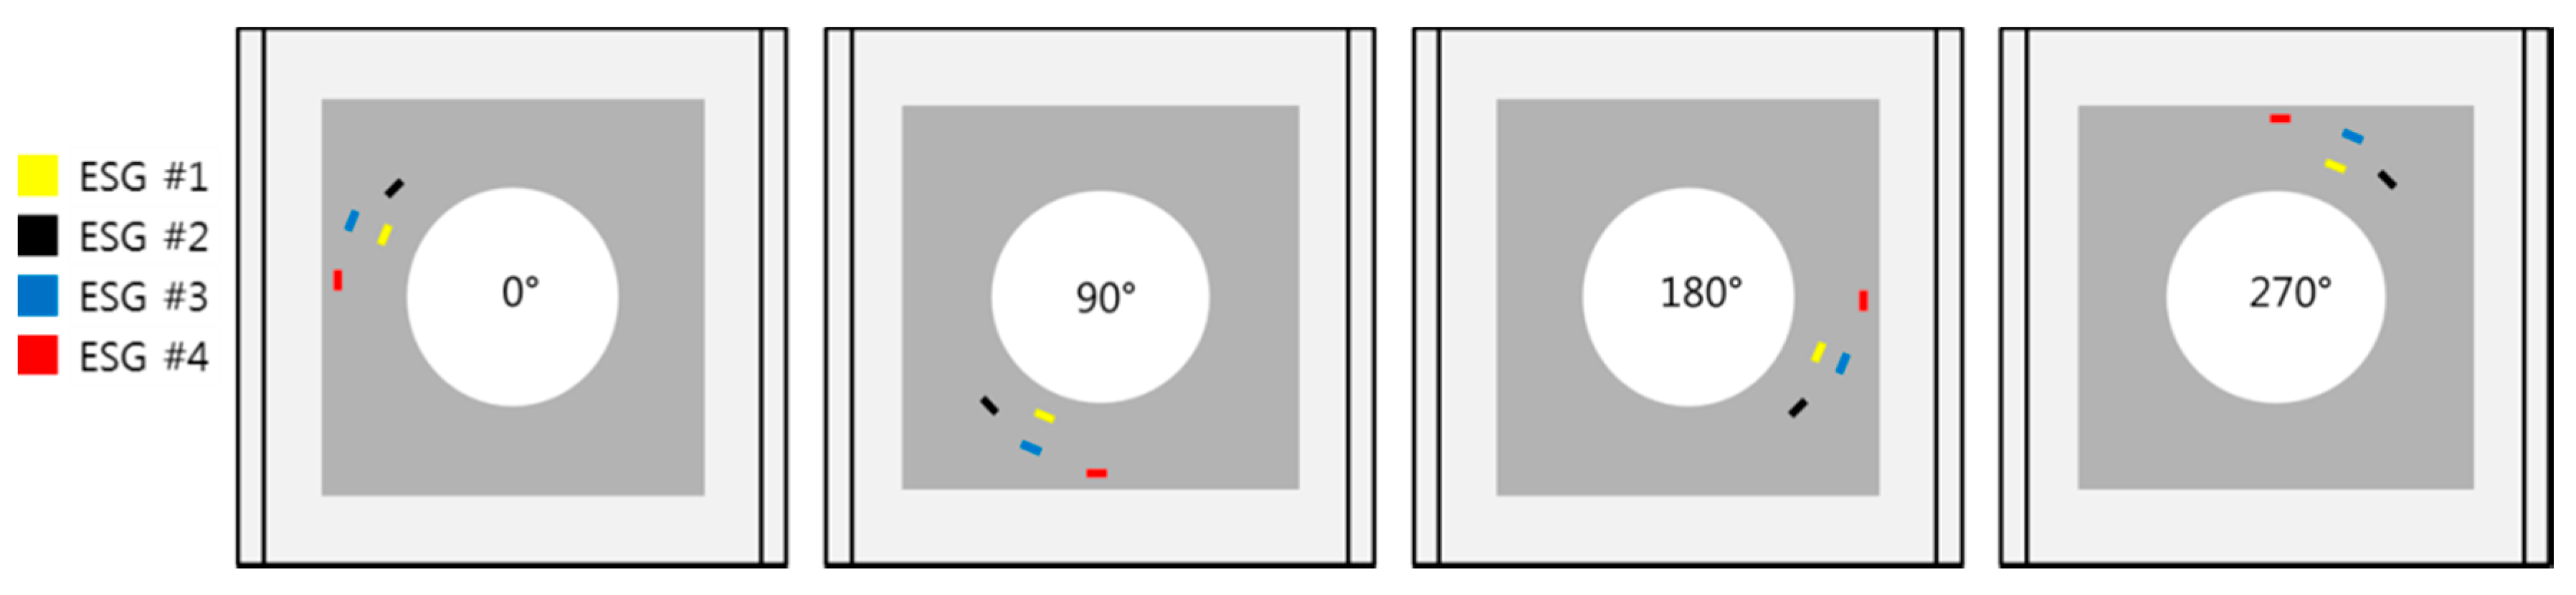
The tension test was also performed under four setting directions of the bearing plate to investigate the symmetricity of the plate, as shown in Figure 7. In this figure, the locations of the four ESGs were also changed due to the change of the setting direction.
5. Results and Discussion
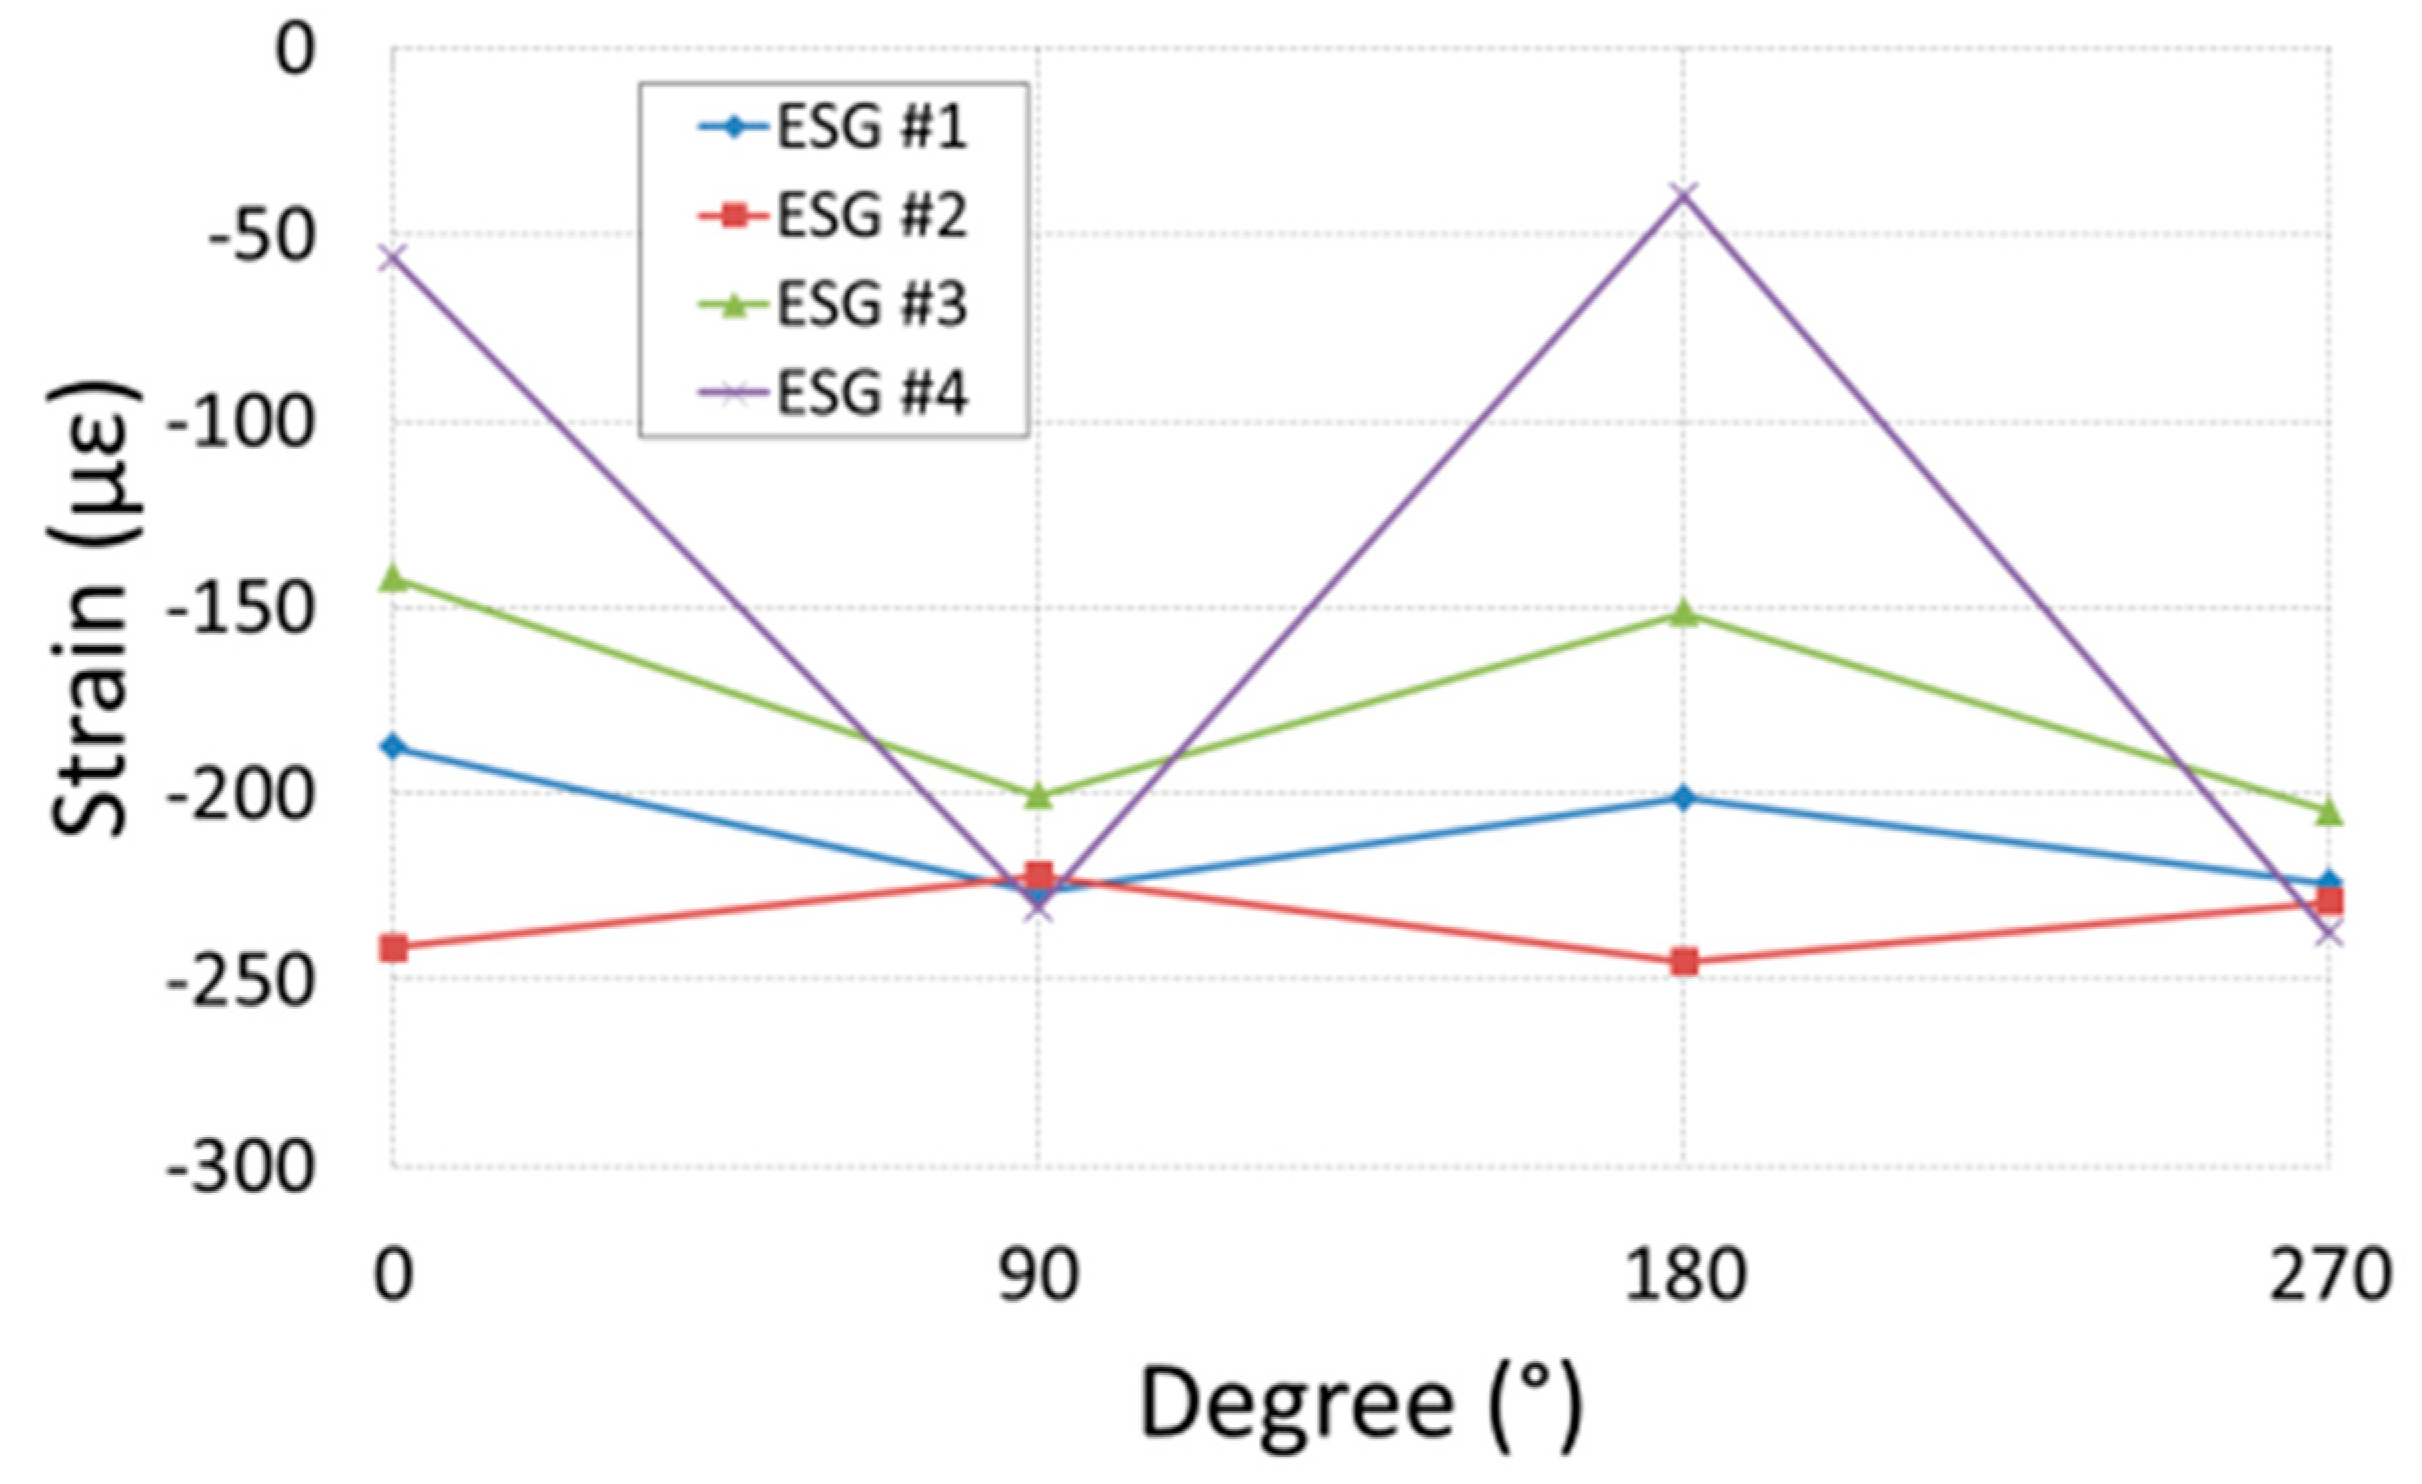
Figure 8 shows the measured values from four strain gauges after applying 10 t with a universal testing machine. The four setting directions (0, 90, 180, and 270 degrees) of the bearing plate in the fixing jig are shown on the horizontal axis. When the bearing plate is positioned at the position of zero degrees, the strain gauges are located closer to the wall of the fixing jig than in other positions. Therefore, as shown in Figure 8, it can be seen that the compressive strains of ESGs #1 and #2, close to the anchor head, are larger than that of ESGs #3 and #4. This tendency is maintained even if the installation direction of the bearing plate in the fixing jig is changed. However, the compressive strain of ESG #4 increases significantly when the mounting direction of the bearing plate is 90 and 270 degrees.
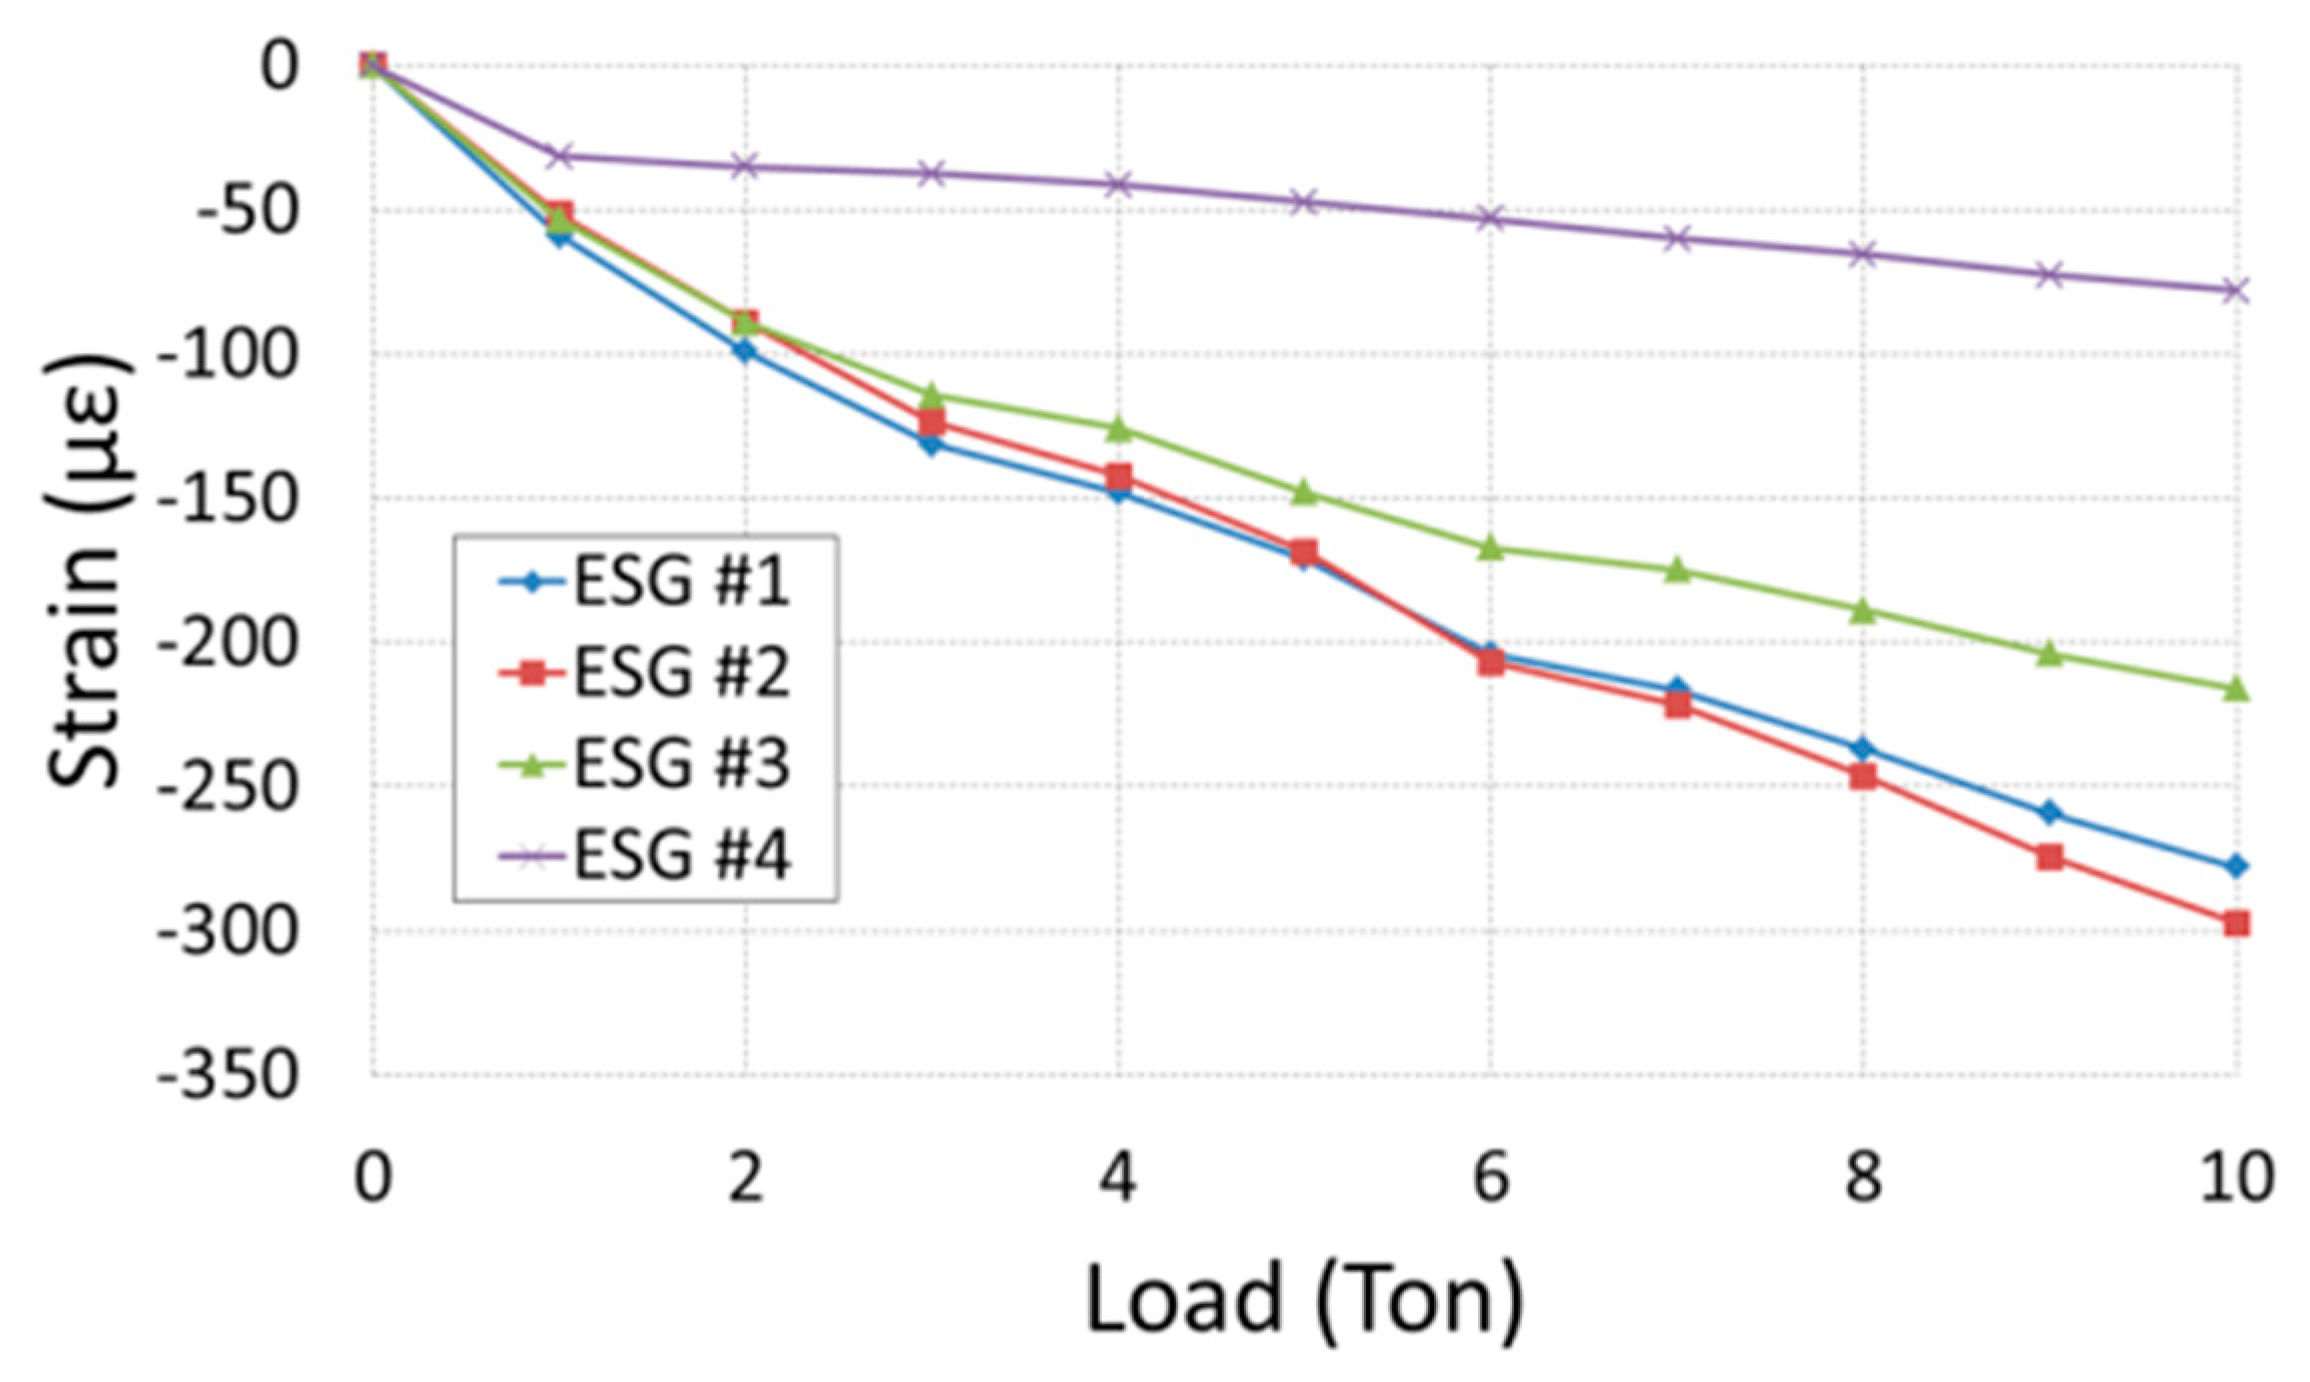
Figure 9 shows the strain gauge values when the bearing plate is placed in the fixing jig at 0 degrees and the load is varied from 1 to 10 tons. The strain of ESG #4 is smaller than that of other strain gauges as load increases. In addition, the strains of ESGs #1 and #2 show almost the same values. Ideally, if the bearing plate is deformed only by the compression load from the anchor head, the value of the strain gauge will have to be larger as it is located closer to the anchor head.
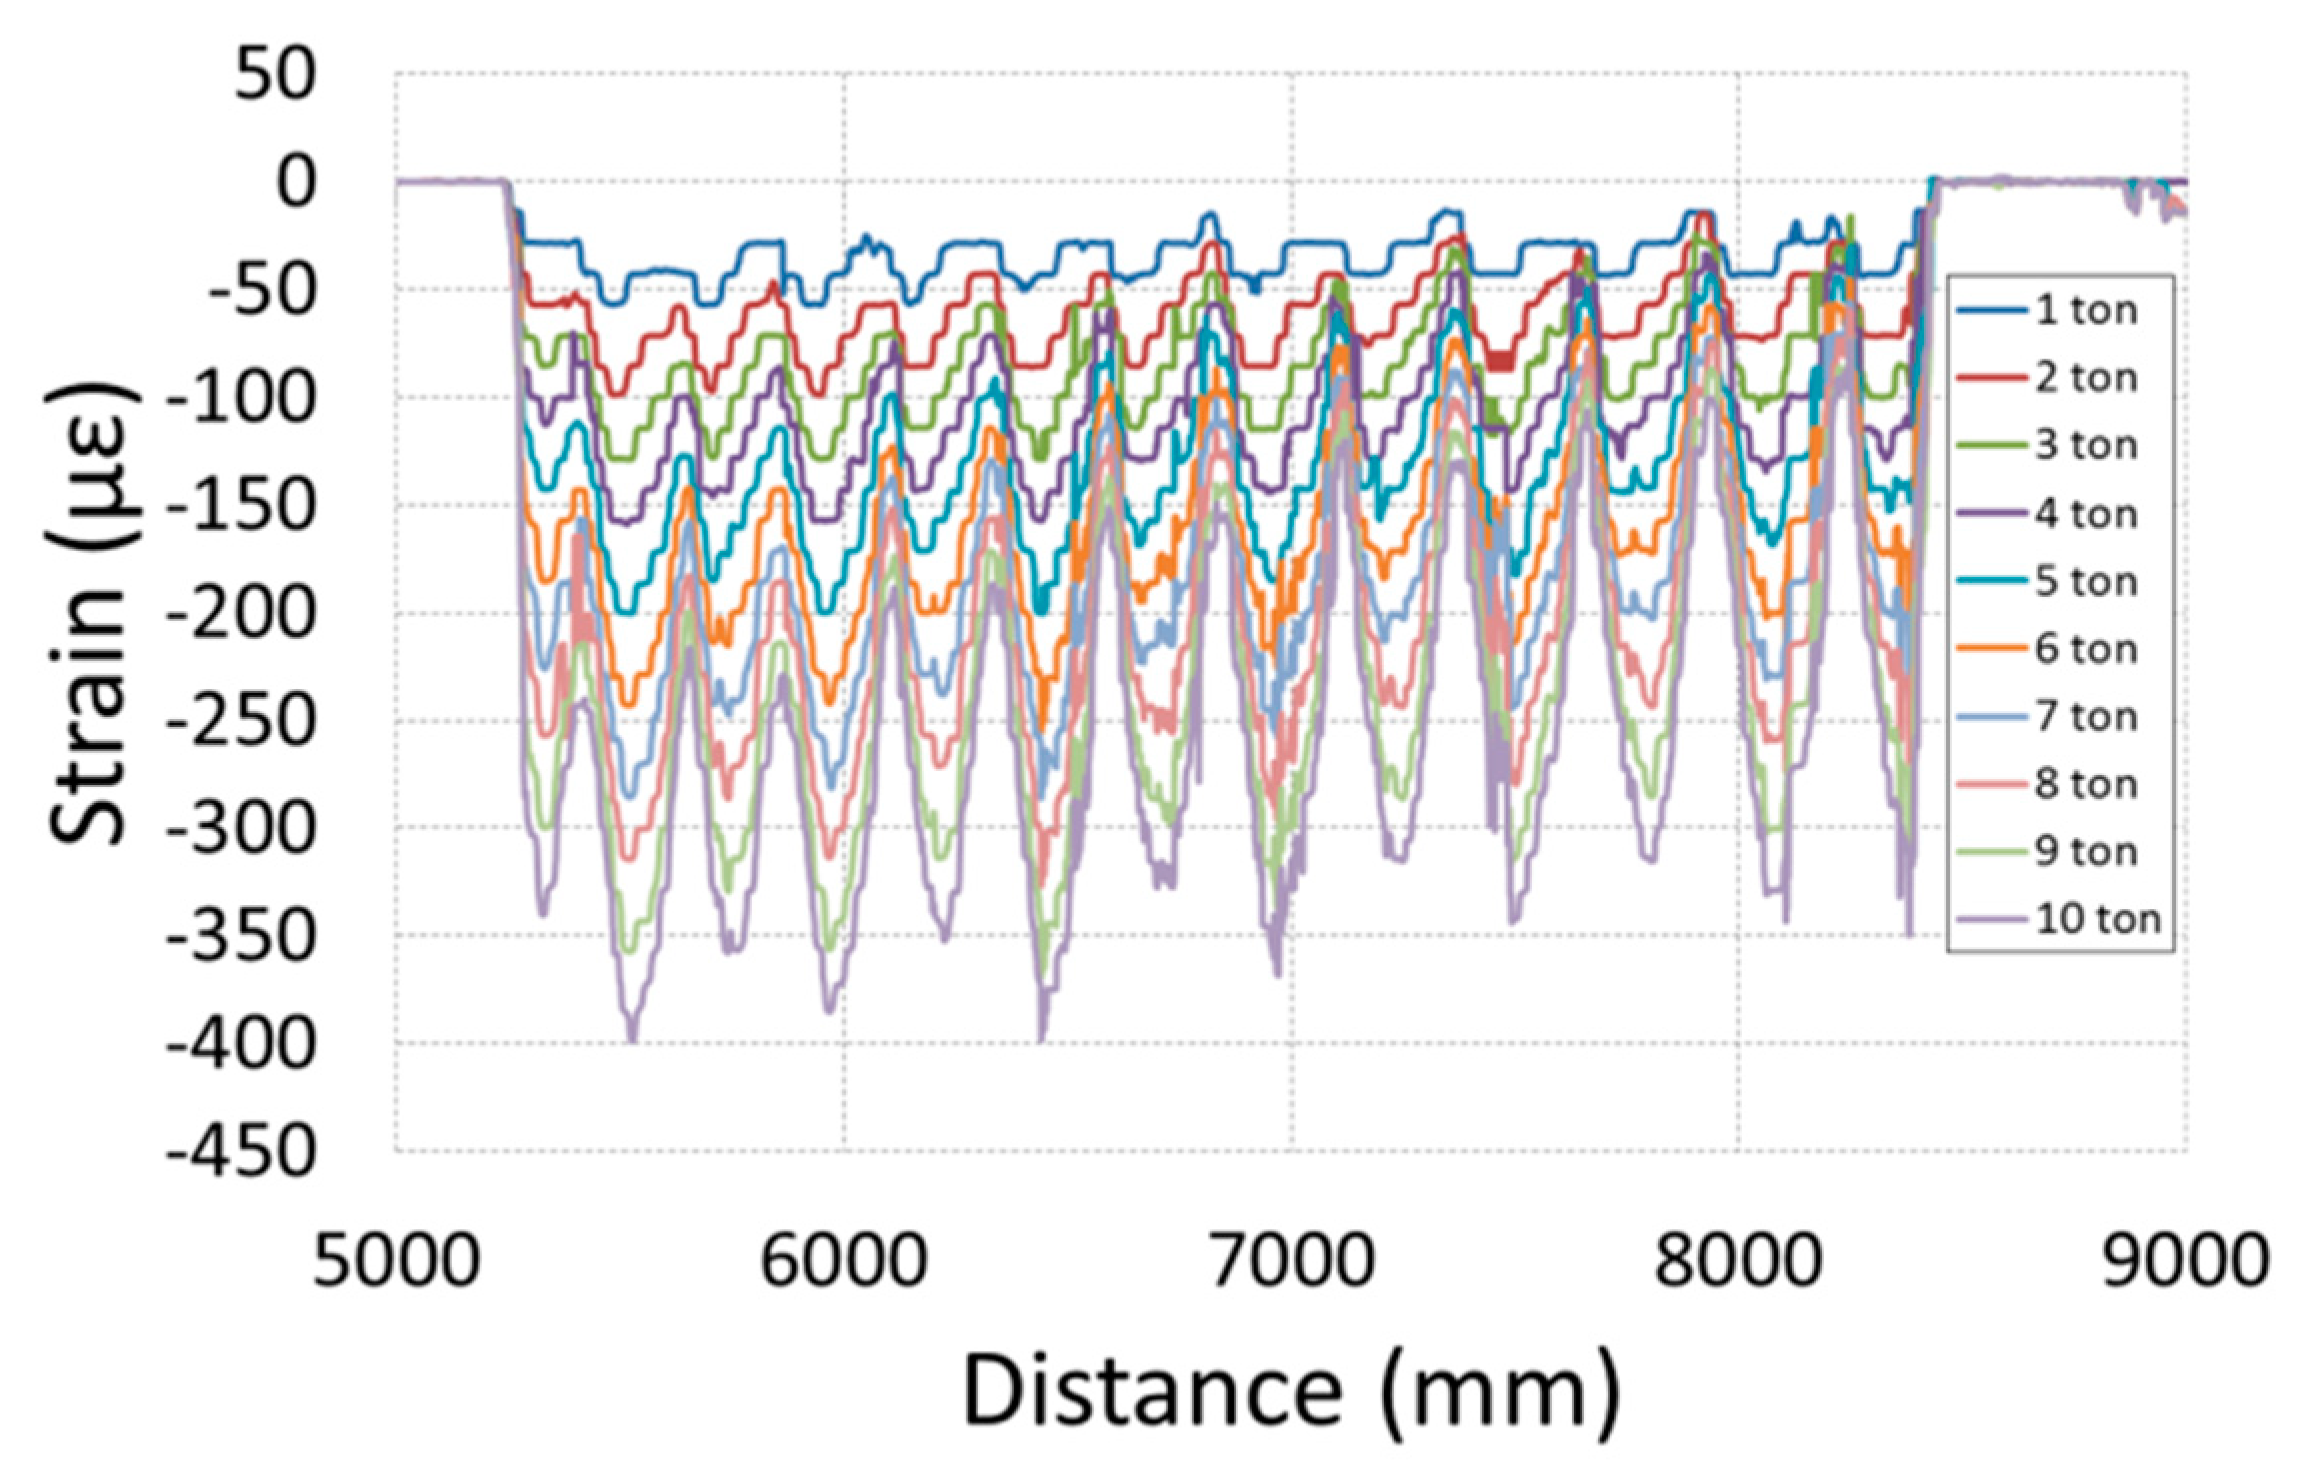
Figure 10 shows the distributed strain measured by OFDR while increasing the anchor load by 1 t increments in a range of 1 t to 10 t. The horizontal axis represents the position of the sensing fiber, with 5250 mm near the anchor head, and 8450 mm far from the anchor head. However, the strain distribution measured by the OFDR shows a tendency to periodically increase or decrease in the longitudinal direction of the sensing optical fiber, unlike the strain distribution behavior due to compression of the anchor head, which can be expected to be distributed in a monotonically decreasing pattern from the anchor head.
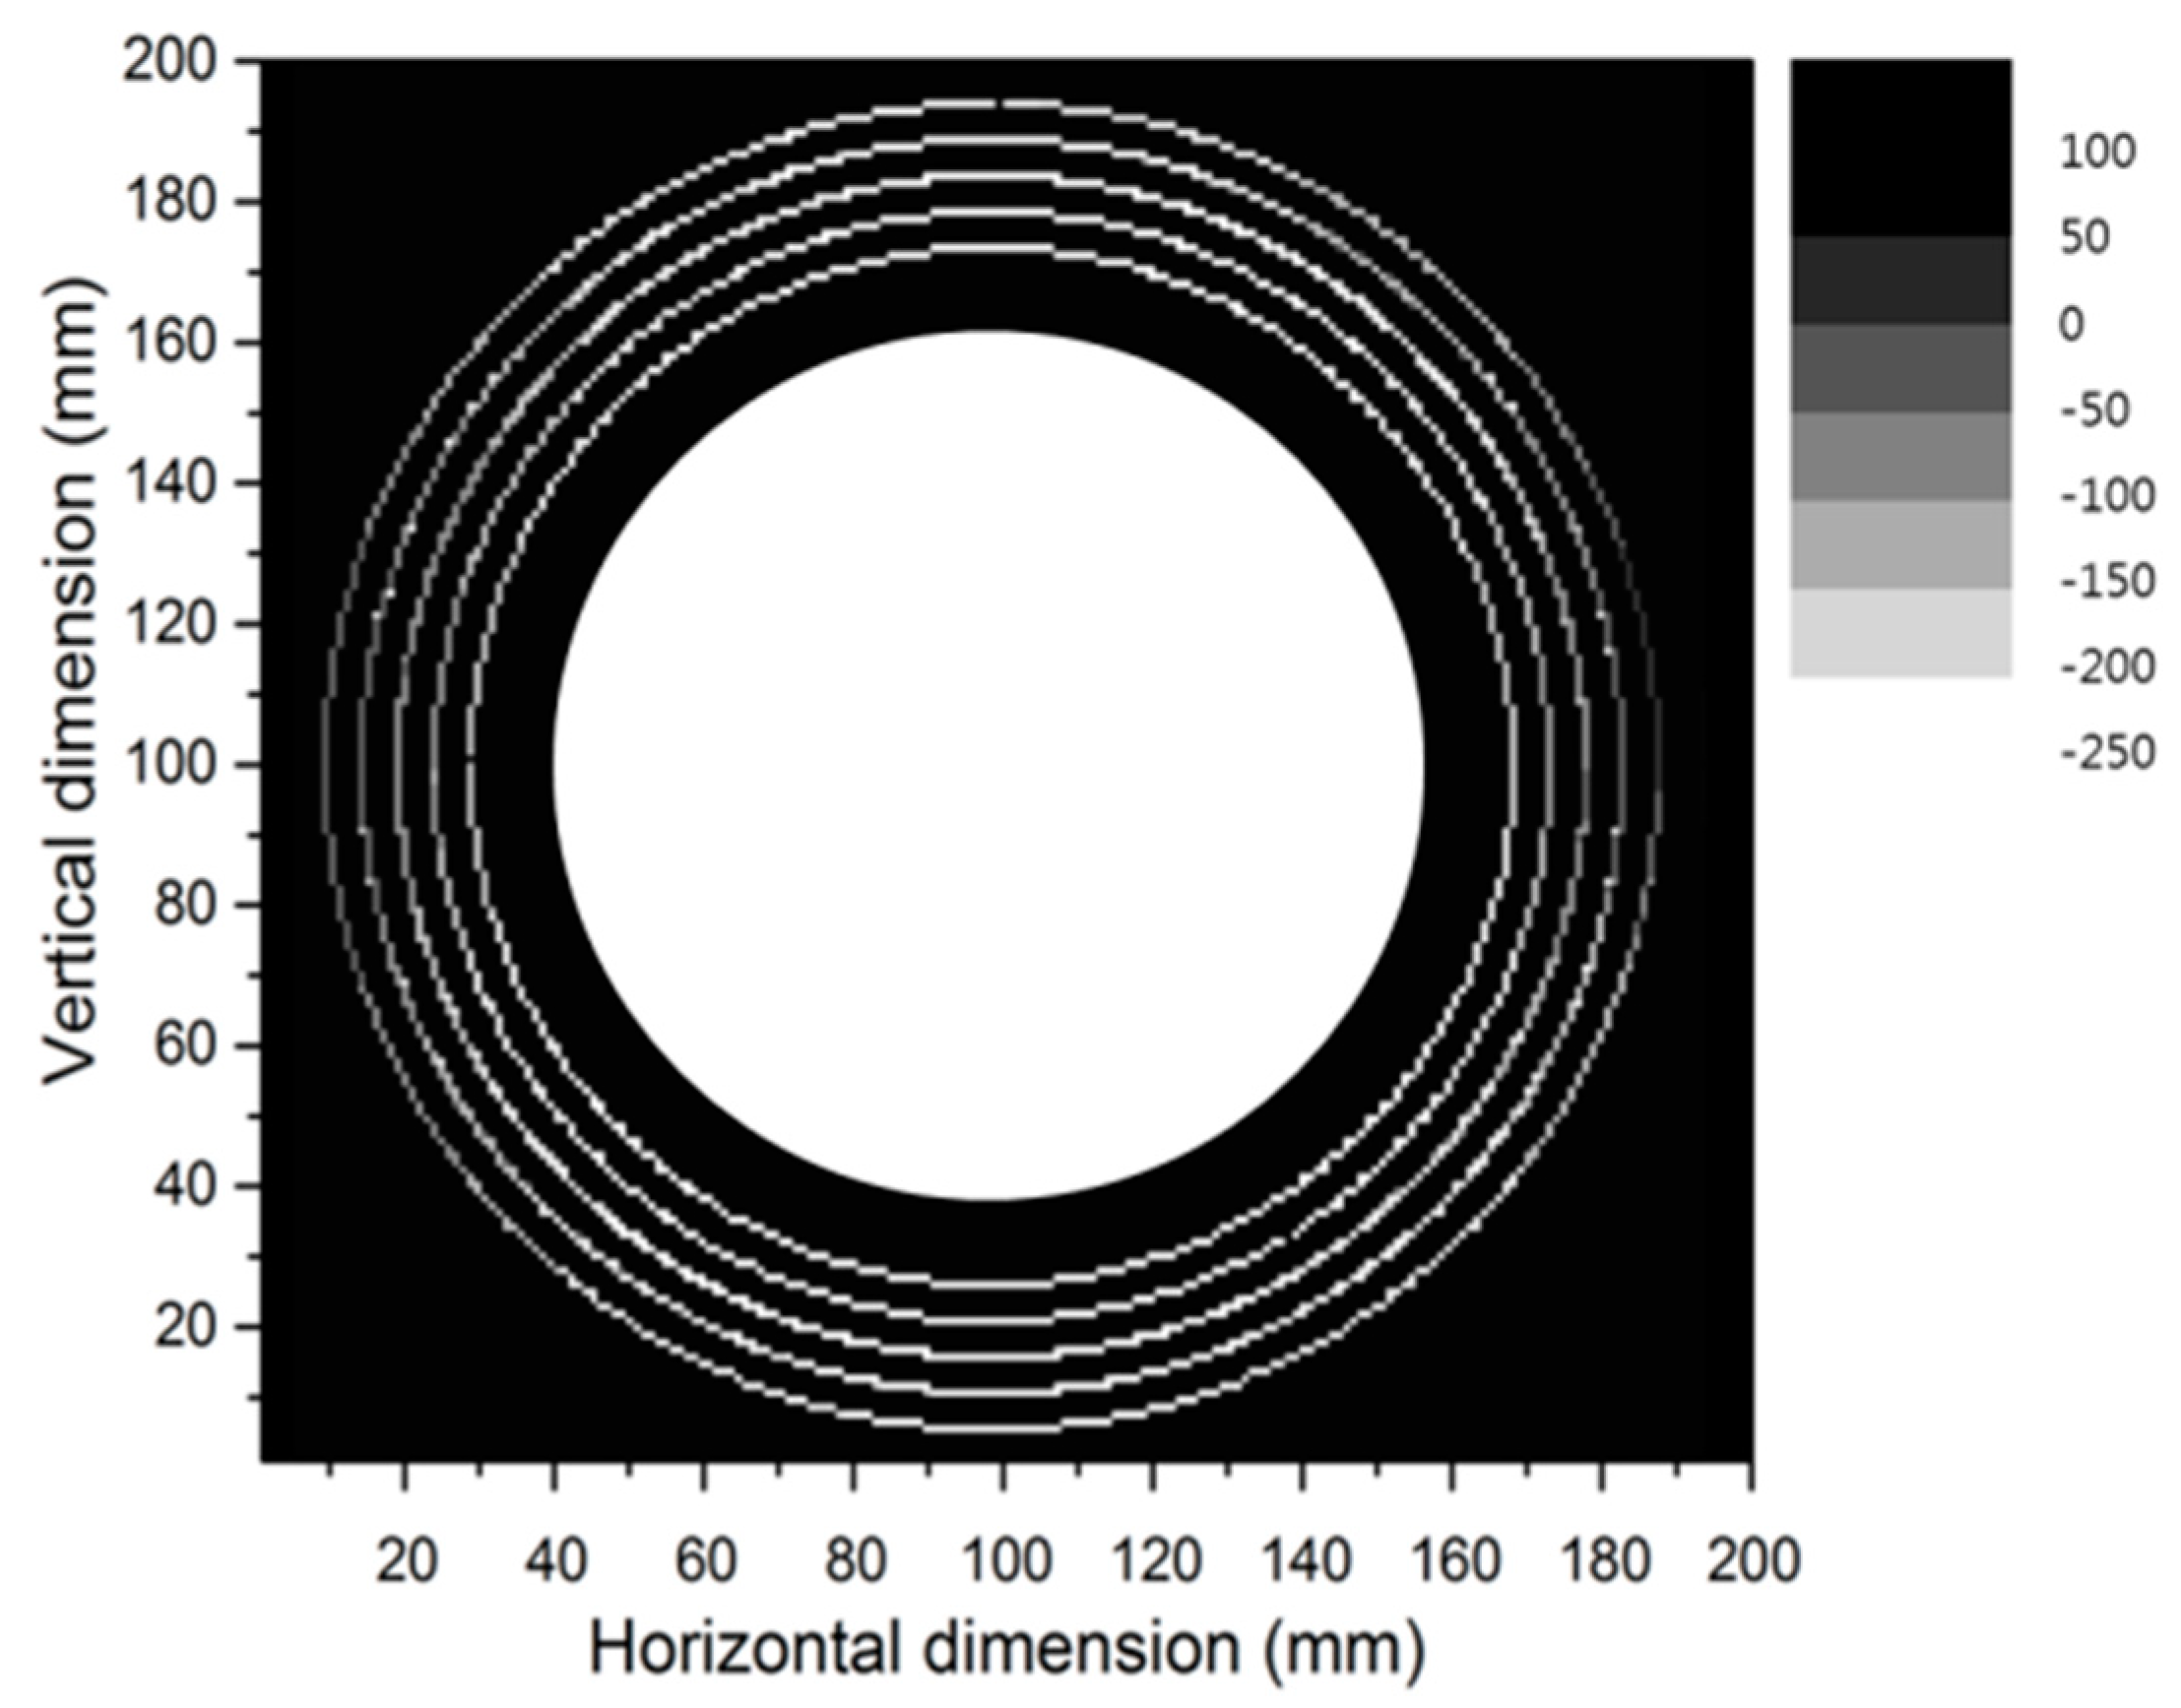
Figure 11 maps the distributed strain shown in Figure 10 to each position on the plane of the bearing plate. The larger the compressive strain, the brighter the representation in Figure 11; portions that are in measurement positions are shaded black. If the effect of compressive load due to the anchor head only affects the bearing plate, a point symmetric strain distribution should be shown with respect to the center of the bearing plate. However, contrary to this, the experimental results are symmetrical with respect to the horizontal position of 10 cm as shown in Figure 11. These results suggest that not only the compressive load of the anchor head but also the bending load due to the fixing jig influenced the deformation behavior of the bearing plate. Accordingly, the bearing plate is subjected to bending deformation, and the largest compression deformation occurs at a horizontal position of 10 cm. It can be seen that there is little difference in strain between near and far positions from the anchor head. On the other hand, it can be seen that there is a difference in the magnitude of the strain near and far from the anchor head at the vertical position of 10 cm, so that the compressive strain due to the anchor head dominates at that position.
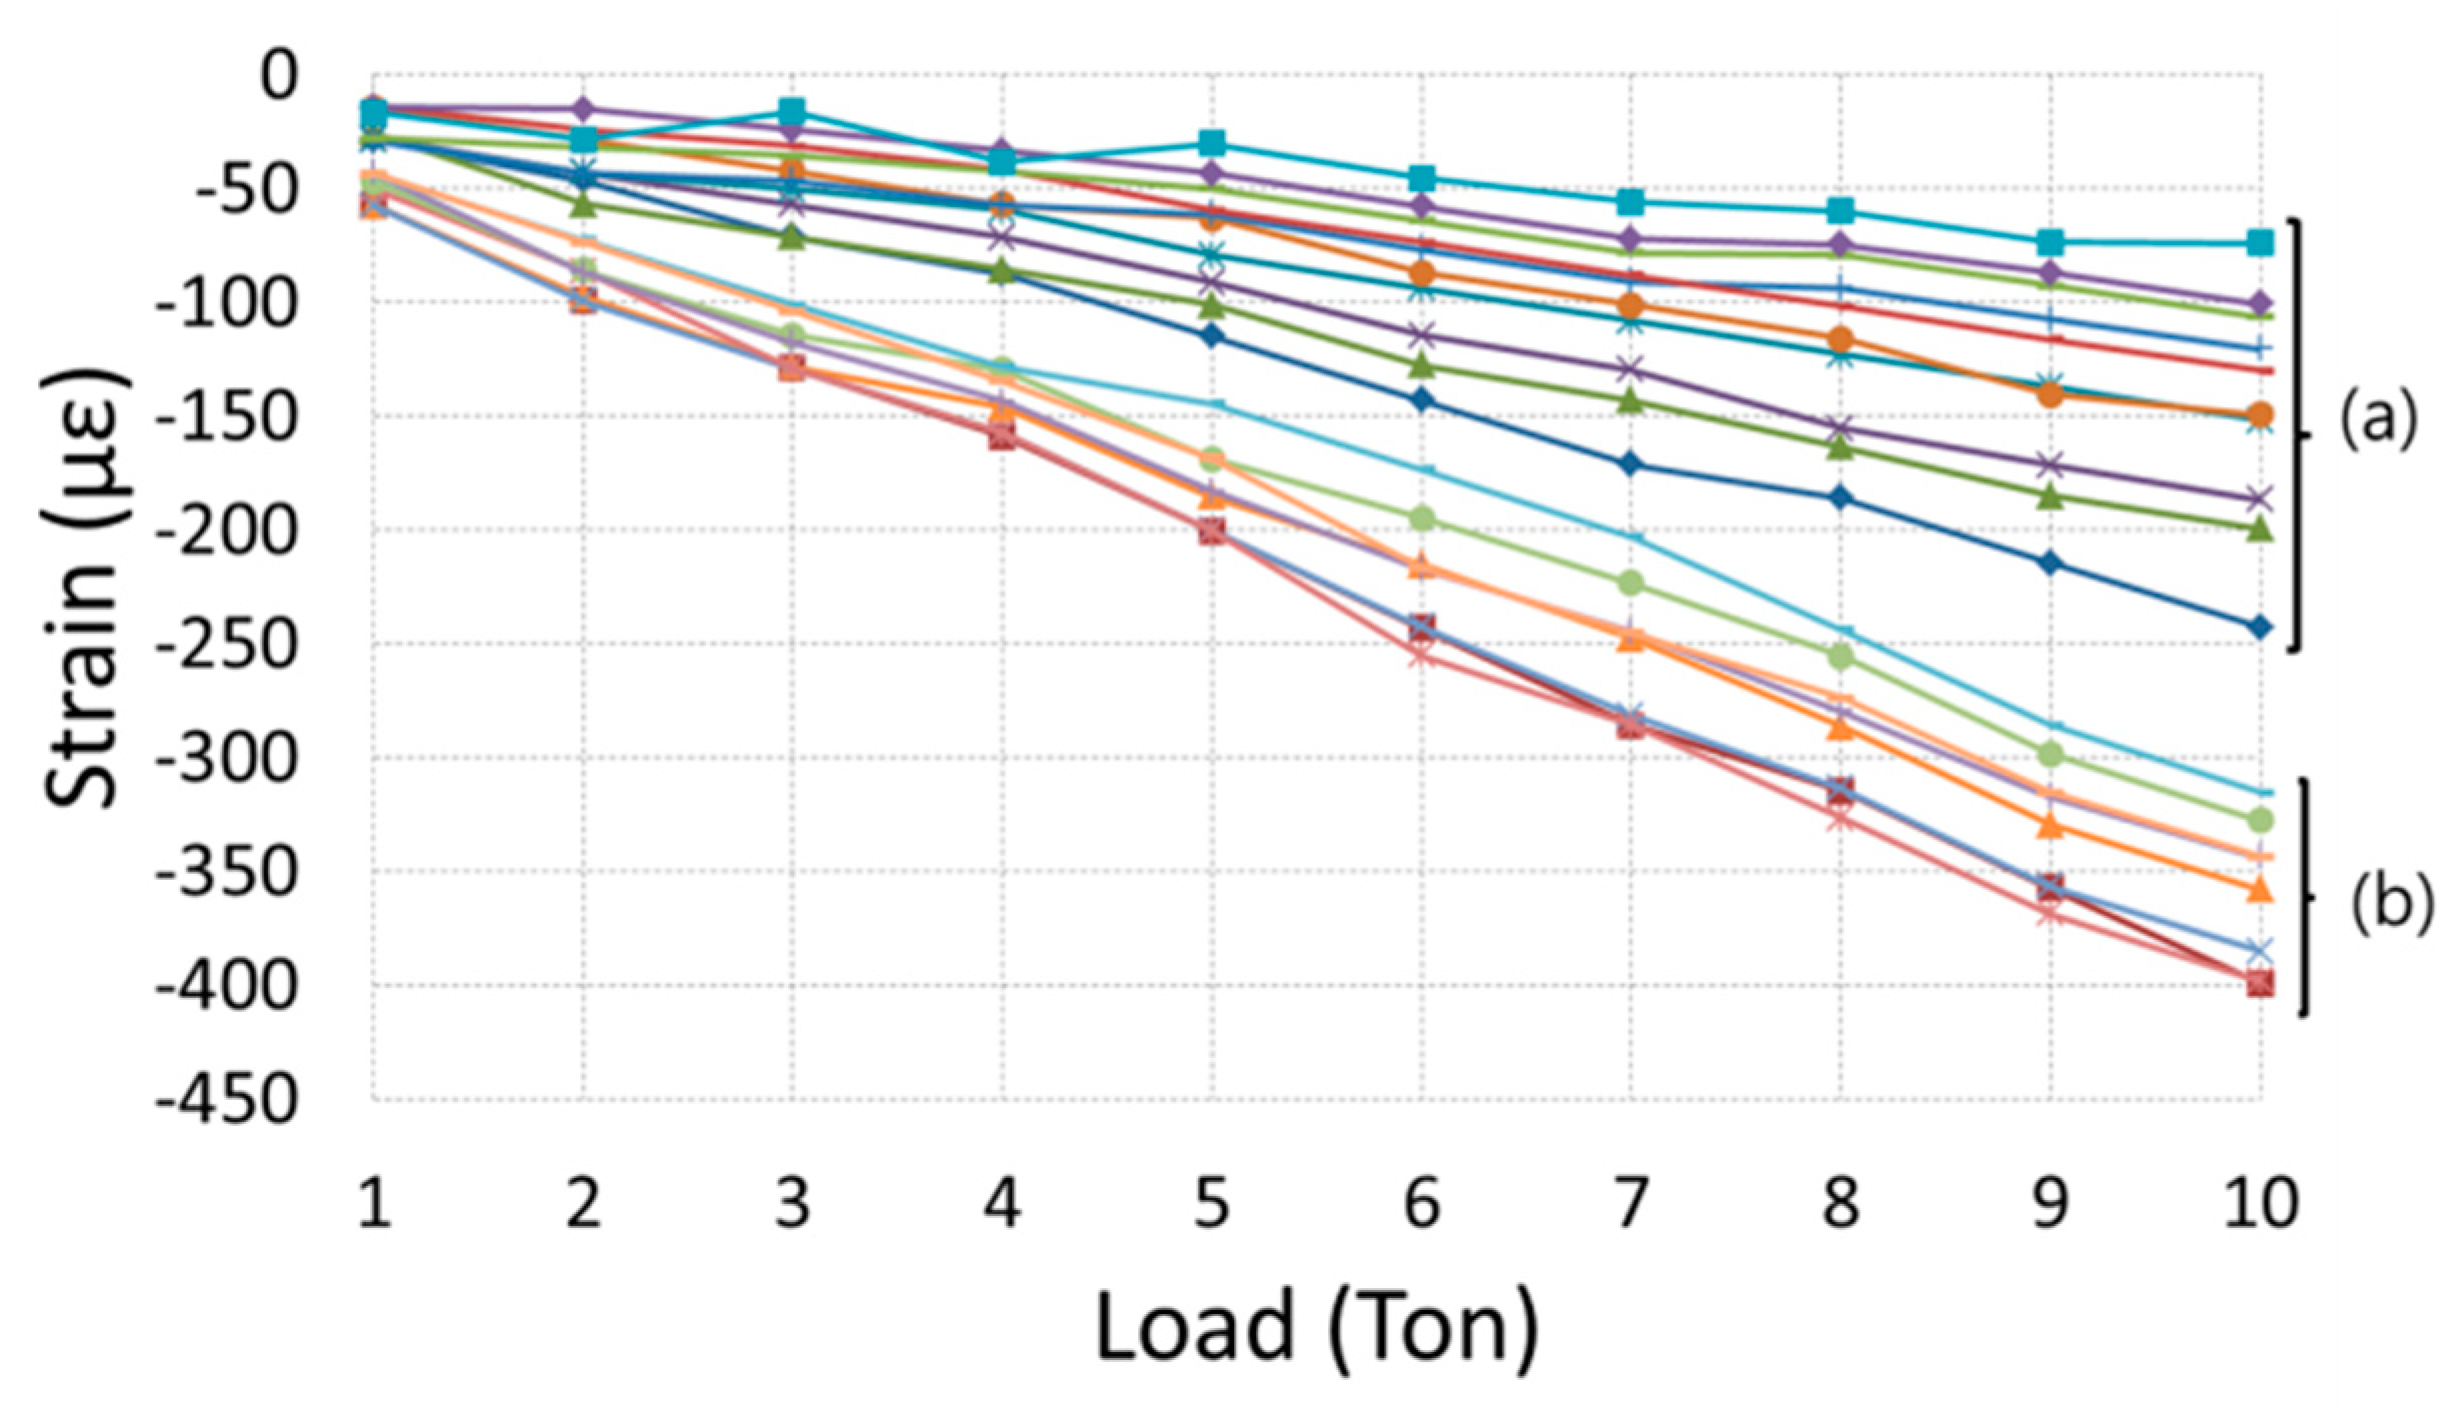
Figure 12 shows the variation of strain according to the load at two specific positions taken from Figure 11. That is, the strains labelled (b) in Figure 12 are those selected from each point of five lines of the sensing fiber at the 10 cm horizontal position, where the bending load has an effect. In addition, strains were selected one by one in each of the five sensing fiber lines at a 10 cm vertical position where the compression load of the anchor head is dominant; these are labelled (a) in Figure 12.
As the anchor load increases, group (a), which has a large influence on the bending load, has a large strain variation, but the difference between the respective strains is smaller than for group (b). In addition, the strains of group (b), which have a large effect of the anchor compressive load, are smaller than those of the group (a) due to the increase of the load, but the difference between the strains increases due to the increase of the load. As shown in Figure 10, Figure 11 and Figure 12, such bending deformation is a phenomenon caused by bending of the base plate of the fixing jig. If the bending rigidity of the fixing jig base plate is increased, compression deformation due to the anchor head will predominantly appear. The bearing plate of a typical anchor head also undergoes bending deformation, but it is considered to occur in a symmetrical form with respect to the center. It was also considered that the complicated strain distribution of such a bearing plate can be seen in reality. Therefore, it was found that the deformation behavior of the bearing plate should be considered when measuring the strain of the bearing plate in order to monitor the anchor load. That is, when the strain distribution of the bearing plate does not have a point symmetric distribution due to the anchor load, it cannot be simply converted to the load of the anchor by measuring one point of strain at an arbitrary location.
6. Conclusions
In order to monitor the safety of soil slopes reinforced by ground anchors, the tensile forces of anchors should be measured. The tensile force of a ground anchor can be determined by measuring the strain of a bearing plate that transfers the tensile force of the anchor to the ground, because the strain can be assumed to be proportional to the ground anchor force. Therefore, the strain distribution of the bearing plate was investigated by a fiber optic OFDR sensor, which was fabricated from a tunable laser source, an auxiliary interferometer and a main interferometer. This OFDR sensor was operated through a sweep range of 500 GHz with a spatial resolution of 0.2 mm, and a strain accuracy of approximately 4 με, considering the system noise when processing the signal in 5-cm segments. The sensing fiber was circularly bonded onto the bearing plate using epoxy, and the distributed strain was measured on the bearing plate while increasing the load up to 10 t. As a result, it was confirmed that the bearing plate was subjected to not only compressive deformation but also bending deformation. It was considered that the complicated strain distribution of such a bearing plate can be seen in reality. Therefore, the deformation behavior of the bearing plate should be carefully considered when measuring the strain of the bearing plate in order to monitor the anchor load. That is, when the strain distribution of the bearing plate does not have a point symmetric distribution due to the anchor load, it can be understood that it is necessary to carefully study the calibration to monitor the load of the anchor by measuring one point of strain of the bearing plate. However, in future, by measuring the circumferential distribution strain of the anchor bearing plate, the tensile force of the anchor may be able to be monitored by analyzing the bearing plate deformation behavior.
Author Contributions
I.-B.K. developed the concepts, designed the experimental methodology, analyzed the data, wrote, reviewed and approved the final paper. Y.-S.K. and D.-C.S. conducted the experiments, analyzed the data, wrote and edited the paper. B.-H.C. and M.Y.J. wrote and edited the paper.
Funding
This research was supported by “Development of safety measurement technology for cable systems of major infrastructures”, funded by the Korea Research Institute of Standards and Science (KRISS-2018-18011073).
Acknowledgments
The authors would like to thank Ki-Tae Park, and Oh-Il Kwon (Korea Institute of Construction Technology) for sharing the knowledge about anchors and soil slope monitoring.
Conflicts of Interest
The authors declare no conflict of interest.
References
- Ferdinand, P. The evolution of optical fiber sensors technologies during the 35 last years and their applications in structural health monitoring. In Proceedings of the 7th European Workshop on Structural Health Monitoring, Nantes, France, 8–11 July 2014; pp. 914–929. [Google Scholar]
- Bao, X.; Chen, L. Recent Progress in Distributed Fiber Optic Sensors. Sensors 2012, 12, 8601–8639. [Google Scholar] [CrossRef] [PubMed] [Green Version]
- Schenato, L. A Review of Distributed Fibre Optic Sensors for Geo-Hydrological Applications. Appl. Sci. 2017, 7, 896. [Google Scholar] [CrossRef] [Green Version]
- Gu¨emes, A.; Fernández-López, A.; Soller, A. Optical Fiber Distributed Sensing-Physical Principles and Applications. Struct. Health Monit. 2010, 9, 233–245. [Google Scholar] [CrossRef]
- Koyamada, Y.; Imahama, M.; Kubota, K.; Hogari, K. Fiber-Optic Distributed Strain and Temperature Sensing with Very High Measurand Resolution Over Long Range Using Coherent OTDR. J. Lightwave Technol. 2009, 27, 1142–1146. [Google Scholar] [CrossRef]
- Motil, A.; Bergman, A.; Tur, M. State of the art of Brillouin fiber-optic distributed sensing. Opt. Laser Technol. 2016, 78, 81–103. [Google Scholar] [CrossRef]
- Smoltczyk, U.B. Geotechnical Engineering Handbook; Ernst & Sohn: Berlin, Germany, 2003; Volume 2, pp. 169–230. [Google Scholar]
- Barley, A.D.; Windsor, C.R. Recent advances in ground anchor and ground reinforcement technology with reference to the development of the art. In Proceedings of the International Conference on Geotechnical and Geological Engineering (GeoEng2000), Melbourne, Australia, 19–24 November 2000; pp. 1084–1094. [Google Scholar]
- Public Works Research Institute and Japan Anchor Association. Ground Anchor Maintenance Management Manual; Kajima Institute Publishing Co, Ltd.: Tokyo, Japan, 2008. (In Japanese) [Google Scholar]
- Kim, Y.S.; Sung, H.J.; Hyun, K.W.; Kim, J.-M. Monitoring of tension force and load transfer of ground anchor by using optical FBG sensors embedded tendon. Smart Struct. Syst. 2011, 7. [Google Scholar] [CrossRef]
- Brian, J.S.; Dawn, K.G.; Matthew, S.W.; Mark, E.F. High resolution optical frequency domain reflectometry for characterization of components and assemblies. Opt. Express 2005, 13, 666–674. [Google Scholar]
- Ding, Z.; Yang, D.; Du, Y.; Zhou, Y.; Xu, Z.; Liu, K.; Jiang, J.; Liu, T. Note: Improving distributed strain sensing sensitivity in OFDR by reduced-cladding single mode fiber. Rev. Sci. Instrum. 2016, 87, 126106. [Google Scholar] [CrossRef] [PubMed]
Figure 1.
Conceptual diagram (a), and load state (b) of ground anchor system.

Figure 2.
Fiber optic optical frequency domain reflectometry (OFDR) sensor. (a) Schematic diagram (b) Fabricated OFDR. (TLS: tunable laser source, PD: Photo-detector, DAQ: data acquisition, CLK; Clock)
Figure 2.
Fiber optic optical frequency domain reflectometry (OFDR) sensor. (a) Schematic diagram (b) Fabricated OFDR. (TLS: tunable laser source, PD: Photo-detector, DAQ: data acquisition, CLK; Clock)

Figure 3.
The bearing plate with a sensing optical fiber and four electrical strain gauges. (a) Conceptual drawing (b) Photograph.
Figure 3.
The bearing plate with a sensing optical fiber and four electrical strain gauges. (a) Conceptual drawing (b) Photograph.

Figure 4.
Distance domain signal of OFDR sensor.

Figure 5.
Strain signal variation at some portion of the sensing optical fiber.

Figure 6.
Anchor loading by universal testing machine (UTM) (a) UTM (b) the beating plate with a sensing fiber.
Figure 6.
Anchor loading by universal testing machine (UTM) (a) UTM (b) the beating plate with a sensing fiber.

Figure 7.
Four positions of the bearing plate installed in the fixing jig.

Figure 8.
Strains from four strain gauges with a 10 t load due to the placing angles of the bearing plate in the fixing jig.
Figure 8.
Strains from four strain gauges with a 10 t load due to the placing angles of the bearing plate in the fixing jig.

Figure 9.
Strains from four strain gauges bonded on the bearing plate installed with 0 degrees with varying loads.
Figure 9.
Strains from four strain gauges bonded on the bearing plate installed with 0 degrees with varying loads.

Figure 10.
Strains from the sensing fiber of OFDR sensor bonded on the bearing plate due to loads.

Figure 11.
Strain distribution on the bearing plate from OFDR sensor under 10 t loading.

Figure 12.
Strains on the bearing plate from OFDR sensor due to loading.

© 2018 by the authors. Licensee MDPI, Basel, Switzerland. This article is an open access article distributed under the terms and conditions of the Creative Commons Attribution (CC BY) license (http://creativecommons.org/licenses/by/4.0/).
Share and Cite
MDPI and ACS Style
Kwon, Y.-S.; Seo, D.-C.; Choi, B.-H.; Jeon, M.Y.; Kwon, I.-B. Strain Measurement Distributed on a Ground Anchor Bearing Plate by Fiber Optic OFDR Sensor. Appl. Sci. 2018, 8, 2051. https://0-doi-org.brum.beds.ac.uk/10.3390/app8112051
AMA Style
Kwon Y-S, Seo D-C, Choi B-H, Jeon MY, Kwon I-B. Strain Measurement Distributed on a Ground Anchor Bearing Plate by Fiber Optic OFDR Sensor. Applied Sciences. 2018; 8(11):2051. https://0-doi-org.brum.beds.ac.uk/10.3390/app8112051
Chicago/Turabian StyleKwon, Yong-Seok, Dae-Cheol Seo, Bo-Hun Choi, Min Yong Jeon, and Il-Bum Kwon. 2018. "Strain Measurement Distributed on a Ground Anchor Bearing Plate by Fiber Optic OFDR Sensor" Applied Sciences 8, no. 11: 2051. https://0-doi-org.brum.beds.ac.uk/10.3390/app8112051
Note that from the first issue of 2016, this journal uses article numbers instead of page numbers. See further details here.