1. Introduction
In construction projects, site layout planning is a critical task for managers and planners to provide labor crews with ergonomic working space and comfortable industrial environment [
1]. Within a construction site, temporary facilities, such as equipment (e.g., cranes and scaffoldings), job offices, storage areas, warehouse, fabrication shops, and batch plants, are needed by work crews to support their task operations and various activities [
2,
3,
4,
5]. In order to improve the project profitability, labor productivity, safety, quality and controlling ability of project cost, the project managers need to conduct an effective temporary facility layout planning process properly during the construction planning phase [
6,
7,
8]. An appropriate layout plan of facilities can reduce the construction expenses by up to 50 percent [
9,
10].
Generally, the construction site layout planning problem is to identify the number and size of temporary facilities to be laid out, and the spatial constraints between different facilities. The relative positions and relationships among the facilities are analyzed to construct the project effectively and efficiently [
11,
12,
13,
14]. To improve the ability for temporary facility layout planning, a number of research studies were conducted. Different approaches and tools were applied to site layout planning, which mainly include: simulation methods, knowledge-based approaches, genetic algorithms, GIS and other optimization methods [
5,
14,
15]. For example, EI-Rayes and Khalafallah [
8] developed an expanded site layout planning model in order to maximize construction safety and minimize the travel cost of multiple resources in construction using multi-objective genetic algorithms. As temporary facility layout planning involves a large number of facilities, the planning process is very labor-intensive and complex. The artificial intelligence-based systems and knowledge-based techniques can also be adopted to deal with the large amounts of layout planning data and further improve the flexibility to the existing temporary facility layout models [
16]. In order to improve safety performance and labor productivity, optimum layout of temporary facilities can be generated through simulation-based methods within the restricted sites [
2,
17]. The optimization criteria involved in temporary facility planning were identified to assist with the planning task using heuristic algorithms [
6,
9,
18,
19,
20,
21,
22,
23]. To automate layout planning, Building Information Modeling (BIM) -based system can support the dynamic generation of site layout models, instead of manually inputting the information data [
24]. These attempts have shown the effectiveness and improvements in the temporary facility layout planning and optimization, especially in establishing the mathematical models and identifying the related criteria to solve the complex multi-objective optimization problem.
In construction layout planning, the temporary facility layout optimization is a multi-criteria optimization problem, including safety, labor productivity and cost goals. Managers and planners need to identify the factors that affect the performance of a temporary facility layout plan, recognize the space requirements of task executions and select the most economic and productive layout plan from a set of potential alternatives. Each potential alternative may lead to a unique performance on the project. It remains a decision problem to select the optimal or favorable layout plan in the preconstruction phase.
To choose the optimal temporary facility layout plan for construction projects, all relevant criteria should be simultaneously considered and further integrated into the decision model. Therefore, a suitable multi-criteria decision-making (MCDM) method is required to assess the performance of different layout plans. A variety of decision-making techniques have been applied in construction planning problems, e.g., the analytic hierarchy process (AHP) method, data envelopment analysis (DEA) method, technique for order preference by similarity to an ideal solution (TOPSIS) method, Analytic Network Process (ANP) method and grey target decision method [
25,
26,
27]. Raviv et al. implemented the AHP method as a tool to evaluate the quantitative outcome of severity levels in the safety risk analyses related to crane work [
28]. Erdogan et al. used the AHP method to identify the construction management problems and determined the best contractor for a construction project in Turkey [
29]. For sustainable construction planning, Zavadskas et al. analyzed and summarized the application of different multi-criteria techniques in civil engineering and construction building technology problems [
30]. Chanati et al. developed a multi-criteria assessment model using AHP and ANP methods to optimize the maintenance planning for water pipelines. Ning et al. proposed a fuzzy decision-making model based on fuzzy set theory and the TOPSIS method to evaluate and select the construction site layout plan.
Although the previous MCDM-based models are effective in construction planning problems and building technology optimization, the ability to integrate all relevant criteria into temporary facility layout planning is limited. In facility layout planning, the developed approaches did not consider all assessment factors into the model. Furthermore, the interdependency relationships between different factors involved in temporary facility layout problems were not taken into account. The result accuracy in temporary facility layout assessments can be improved when all criteria and their interdependency relationships are considered in the decision problem.
This paper proposes a novel and practical model for multi-criteria temporary facility layout planning in construction projects, where emphasis is placed on the performance evaluation of the layout alternatives, with multiple criteria being assessed: (1) construction safety associated with task executions and space management; (2) labor productivity associated with activity workspace, labor ergonomics and comfortability; and (3) construction cost caused by the facility setup, dismantling process and resource transportation. Considering the factors that significantly impact the criteria, the proposed model incorporates an ANP-based approach to assess the weight of each criterion related to temporary facility layout problem. Based on the weight assessment from the established ANP model, the One Factor at a Time (OAT) -based sensitivity analysis is formulated to identify the criteria that are especially sensitive to the weight changes, and further find out all possible optimal plans. The model does not consider the limitations of data collection, and therefore provides a scientific evaluation system to the potential planning alternatives. The related criteria on layout planning are discussed and the decision process that contributes to optimal layout plan selection is outlined. The method, with which the model has been formulated, allows the construction managers and planners to effectively assess the relative importance of multiple criteria and select the most suitable plan for the construction project.
2. Multi-Criteria Model of Temporary Facility Layout Planning in Construction
2.1. Problems of Temporary Facility Layout Planning for Construction
In temporary facility layout planning and organization, safety, productivity and cost are the main factors that significantly impact the spatial facility arrangement and layout planning on the construction site. Construction industry suffers from more accidents compared to other industries, which can be significantly prevented or reduced through proper and effective layout planning. Therefore, safety is one of the most important objectives in construction layout planning [
31], which should be taken into account during site layout planning and optimization. Secondly, on the jobsite, the performance of task executions and equipment operations are impacted by the facility layout. The position and spatial relationship of temporary facilities directly affect the productivity of labor crews who execute and complete activities with the assistance of temporary facilities, such as cranes and scaffoldings. In order to improve labor productivity and shorten construction duration, managers and planners should quantify the productivity impacts on the construction layout planning. Besides safety and productivity, there exists another major impact factor on temporary facility layout planning, which is defined as the cost factor. Large temporary facilities, such as jobsite offices, tower cranes and batch plants, are difficult to move during construction. Therefore, the spatial arrangement of facilities directly determines the path between facilities, which significantly impacts the resource transportation cost and personnel travel cost caused by the facility movement.
Considering the multiple objectives during temporary facility layout planning, it remains a critical task for planners and managers to identify the factors that influence the planning process and the construction delivery. To support planners with this challenging job, there is a need to formulate a systematic approach to select the optimal temporary facility layout plan for a construction project.
2.2. Identification of Layout Factors and Objectives
In order to formulate a generic temporary facility layout planning model, it is critical to identify and define all relevant planning objectives and criteria involved in the planning and decision process.
Based on the previous research and studies, the critical factors that influence the main objectives can be identified.
Table 1 presents the list of the related criteria and sub-criteria that significantly impact temporary facility layout planning, which can be summarized as follows:
safety criterion: including proper equipment operation (PEO), control of hazardous zones (CHZ), control of hazardous material (CHM), minimization of the total number of intersections (TNI) and safety of task execution (STE);
productivity criterion: including effective space utilization (ESU), labor productivity and ergonomics (LPE), short construction duration (SCD), the ability to dynamically change the temporary facilities (ACT), facility closeness relationships (FCRs) and workspace conflicts (WSC);
cost criterion: including facility setup cost (FSC), facility removal cost (FRC), resource travelling cost (RTC), resource handling cost (RHC) and worksite personnel visit cost (WPC).
3. Modeling the Temporary Facility Layout Problem
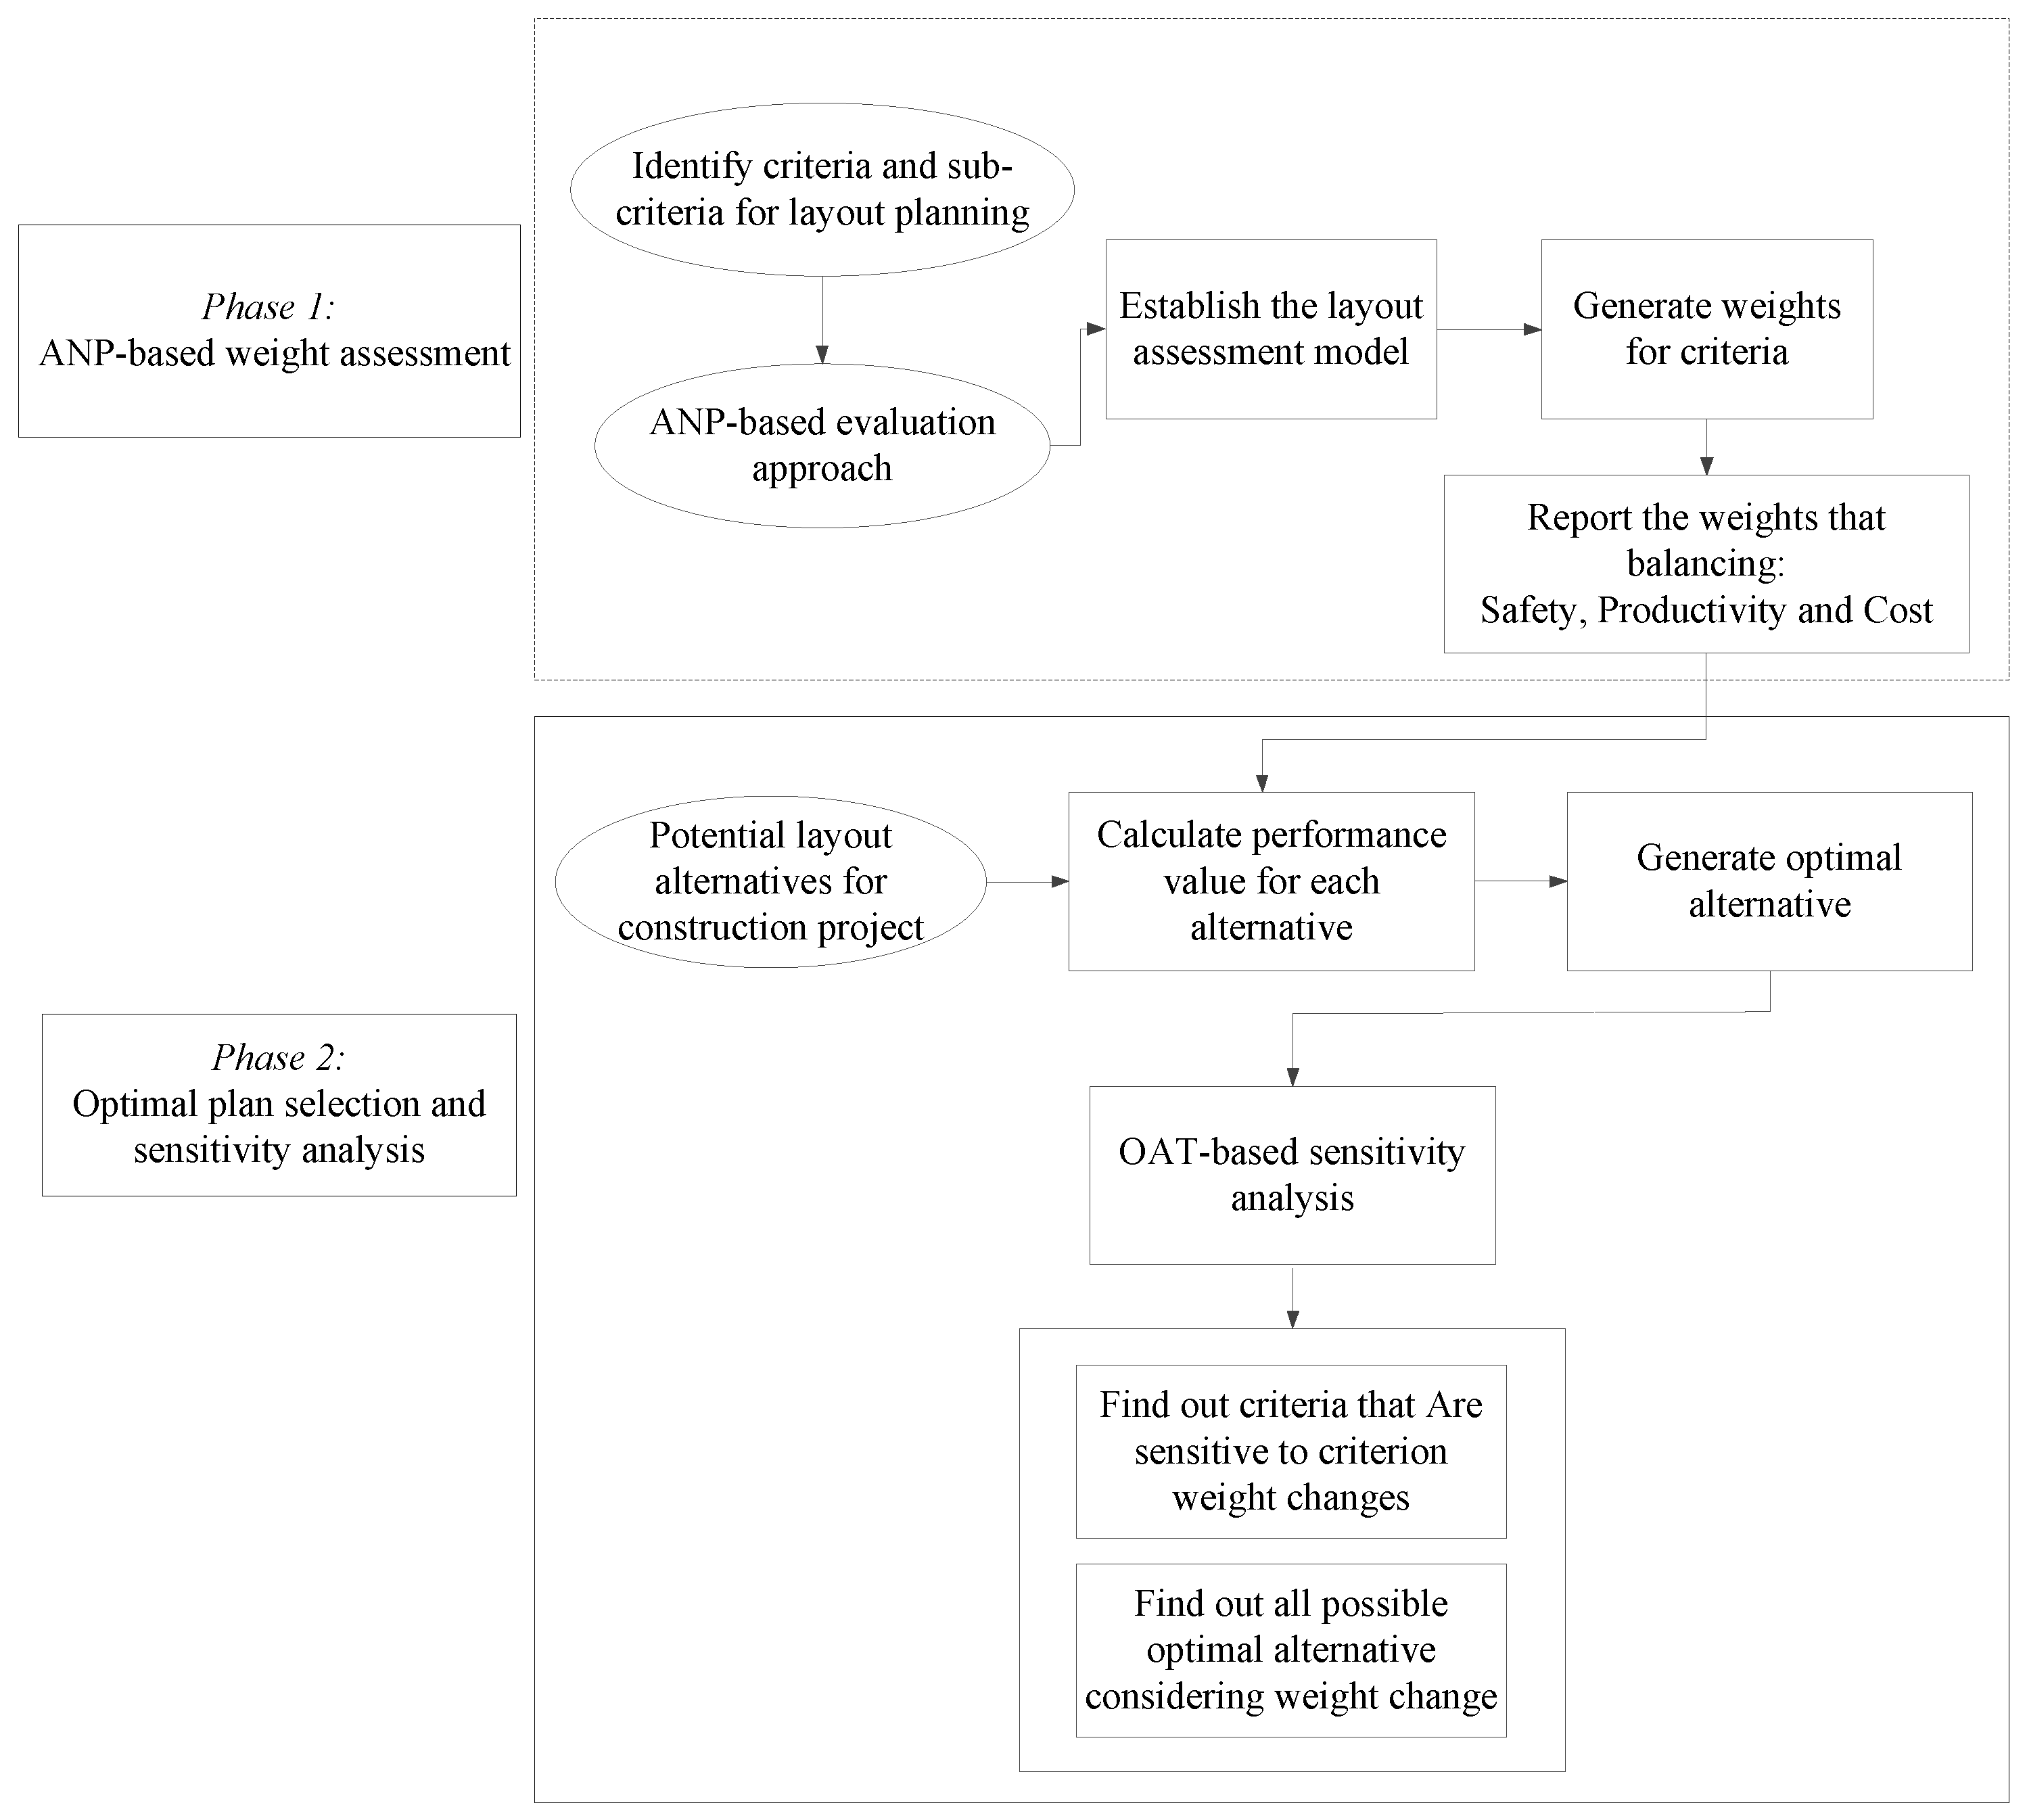
The proposed framework evaluates and assesses the temporary facility layout plans through a two-phase analysis process. As illustrated in
Figure 1, the model development is described in two phases: (1) the ANP-based weight assessment on multiple criteria, and (2) the optimal plan selection and sensitivity analysis to weight changes.
In the first phase of the proposed framework, an ANP evaluation model is established. During this phase, all criteria for temporary facility layout planning are identified, which follows an ANP-based evaluation approach. Then, all criteria are integrated into the layout assessment model. Through the ANP method, the weight of each criterion is generated. Considering the multiple criteria of safety, productivity and cost, the assessment weights are reported from the first phase of the proposed framework.
In the second phase, the potential temporary facility layout alternatives for a given construction project are predetermined for further assessment to select the optimal solution. For each criterion obtained from the first phase, an accurate performance value for each alternative is calculated, which indicates which alternative is the optimal layout alternative. Based on an OAT-based sensitivity analysis, the criteria which are sensitive to the weight changes can be identified. It assists the decision-makers to find out all possible optimal layout alternatives for a construction project.
3.1. ANP-Based Modeling for Layout Planning
As a comprehensive decision-making approach, ANP is capable to integrate all relevant factors and criteria in decision problems [
58,
59]. ANP, which is an extension of AHP, allows for more complex interdependent relationships between elements involved in the decision problem. In AHP models, it is assumed that the elements of different decision levels along the hierarchy have unidirectional relationships between them. Within each cluster and between different clusters, the elements are not correlated with each other. Therefore, in the mathematical problems in which elements are correlated, AHP is not able to determine the weight of each criterion.
ANP provides planners and decision-makers with a more generalized model considering the interdependencies between higher-level and lower-level elements. In temporary facility layout planning, ANP is suitable to select the most important criteria for construction projects. Firstly, in layout planning problems, some criteria, such as safety criterion and the ability to dynamically change temporary facilities, are difficult to be quantified. In the ANP approach, the factors, which are incorporated into the evaluation model, can be either quantifiable or nonquantifiable. Secondly, when comparing the criteria for weight assessment, the decision-makers are able to check the consistency by calculating the consistency ratio, which is critical in decision problems involving opposing influences on the objective. Furthermore, pairwise comparisons are conducted in ANP by engineers, decision-makers and planners to utilize their knowledge and experiences in construction layout planning. This can be practical to generate the optimal layout planning solution for a construction project. Therefore, according to the research objective and the features of the ANP method, it is found that ANP is a suitable approach to prioritizing among the temporary facility layout planning criteria.
The basic research step of the ANP-based decision-making process are as follows.
Development of ANP network, which defines the influential relationship between the clusters and elements.
Pairwise comparisons by the experts and decision-makers based on the previous step. The data input process is completed during this step, which formulates the pairwise comparison matrix.
Consistency check. Through the consistency check, the consistency ratio (CR) is calculated.
Formation of unweighted supermatrix, weighted supermatrix and the limit matrix.
Based on the ANP decision-making process, the detailed model development and calculation process is explained in the following sections [
59,
60,
61].
3.1.1. Step 1: ANP Network Generation
Based on ANP methodology, the temporary facility layout decision problem can be transformed into a network structure, which is established according to the links and interdependencies between the considered factors in the evaluation problem. Different kinds of relationships between the factors are incorporated into the network.
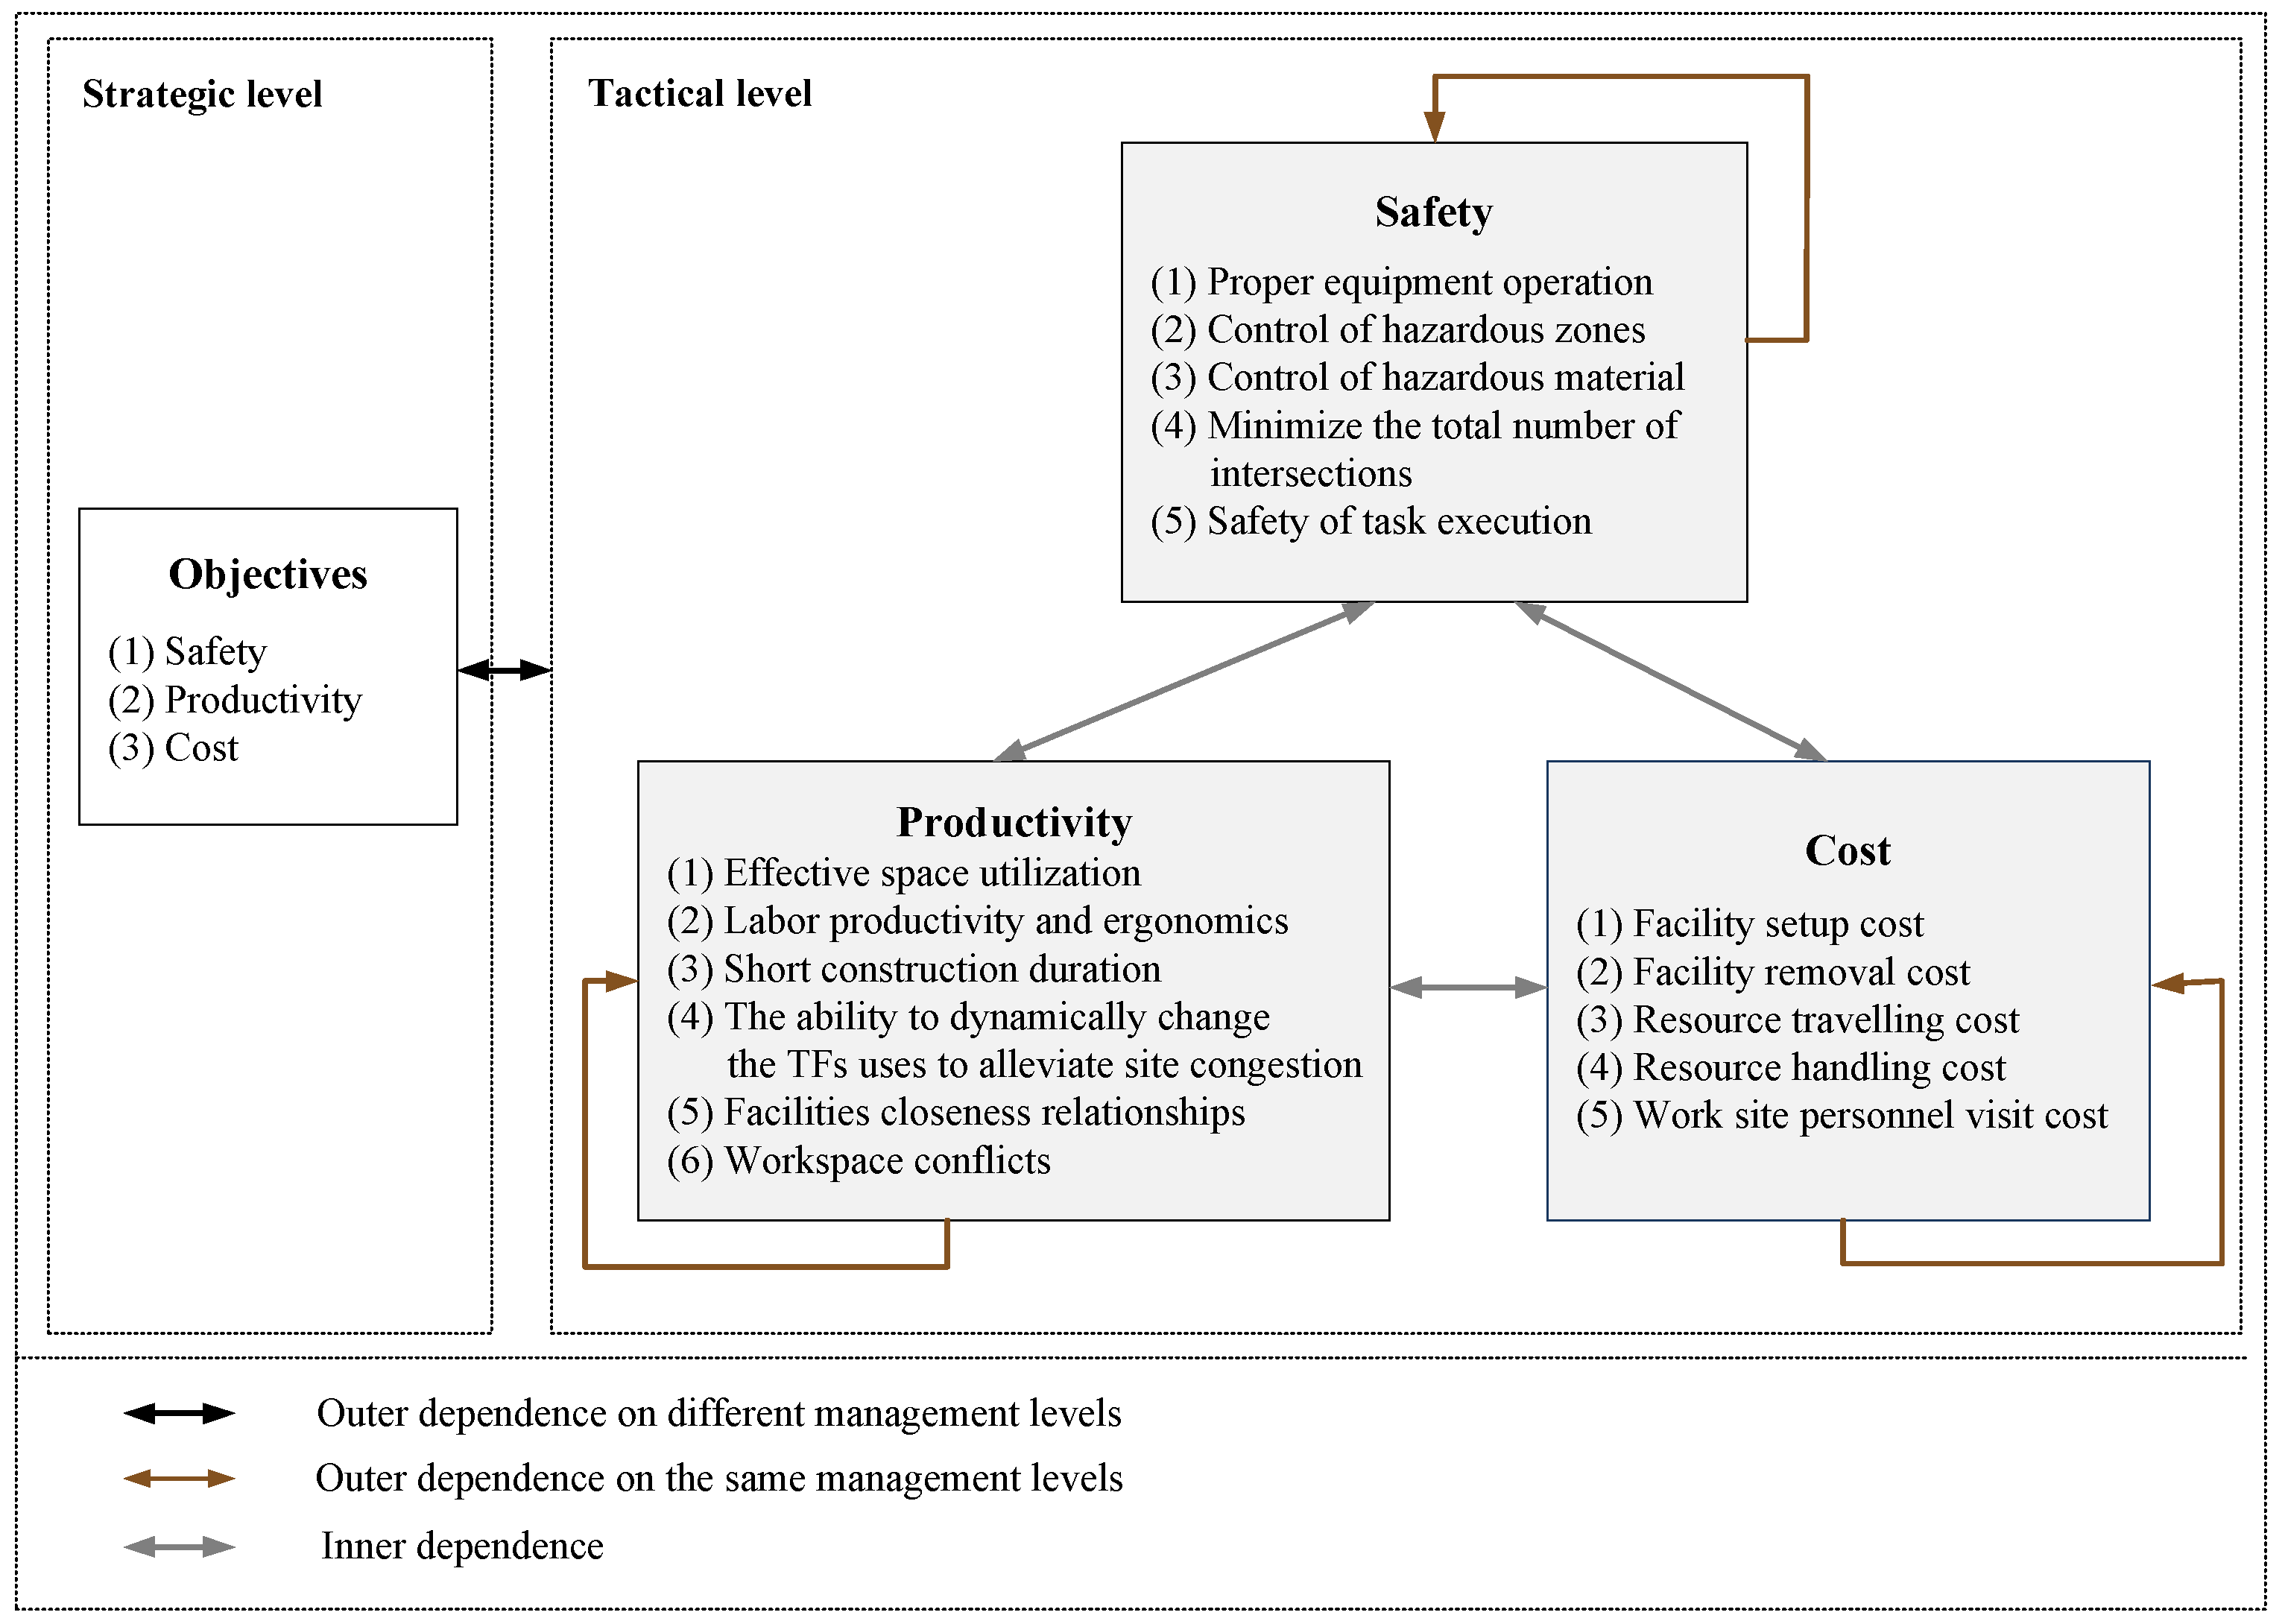
In the network structure, different clusters and elements connect with each other while the connections represent the relationships existing between the clusters and the elements. For temporary facility layout planning, a generic network structure is presented in
Figure 2, which involves clusters, elements and relationships between them. At the strategic level, the layout planning objective is connected to the decision problem, including construction safety, labor productivity and construction cost. At the lower level, groups of sub-criteria are related to the corresponding objective, which form a cluster with different tactical planning criteria. The interdependencies between clusters and elements in the layout planning network structure are illustrated in
Figure 2.
3.1.2. Step 2: Pairwise Comparisons
Based on the generated temporary facility layout decision network structure, the relative importance of clusters and elements are required for final evaluation. In order to derive priorities, pairwise comparisons are conducted between clusters and elements according to the relationships and interdependencies.
The experienced engineer or construction planner can make a judgement based on the fundamental AHP scale developed by Saaty [
62], which is a ratio scale of 1–9. In this scale method, given a control criterion, a score of 1 indicates equal importance of two elements while a score of 9 indicates heightened importance of the
ith element (row element in the matrix) versus
jth element (column element in the matrix) [
63]. The dominance between clusters and elements are reflected through the judgement. Considering all influences with respect to the same criterion, comparisons are made to derive the overall priorities. For each relevant relation between clusters and/or elements in the network structure, a pairwise comparison is required to be conducted.
For an n × n pairwise comparison matrix, the total number of pairwise comparisons that should be performed is
, where n is the total number of elements required to be compared. Moreover, within the matrix, a reciprocal value can be automatically calculated and assigned for reverse comparison. The pairwise comparison number
should meet the following equation:
where
is the pairwise comparison number, which is calculated by the value of fundamental scale [
64].
Through the pairwise comparisons, the final matrix is generated, which is a near consistent pairwise comparison matrix. The considered dependence between clusters and elements in the layout planning network structure includes several kinds of dependence: (1) outer dependence with respect to the objective criterion, (2) inner dependence, and (3) outer dependence on the same management level. As illustrated in
Table 2, the pairwise comparisons of objectives with respect to the objective criterion are conducted. The relation between the objective criteria is defined as the outer dependence with respect to the objective criterion.
Table 3 shows the pairwise comparison matrix between the elements of productivity clusters on the criterion of control of hazard zones, which is one of the cases of outer dependence on the same management level. Another category of pairwise comparisons is the inner dependence, which is illustrated in
Table 4. The elements in
Table 4 belong to the safety cluster, and their relationships are inner dependent.
3.1.3. Step 3: Consistency Check
Through the derived comparison matrices, the eigenvectors of the matrices are obtained, which represent the weights of the elements. The local priority vector is computed as Equation (2):
where A is defined as the matrix of pairwise comparison values; w is the priority vector, which is called the principal eigenvector; and
is the maximum or principal eigenvalue of matrix A.
In order to obtain the pairwise comparison matrices, the local priority vectors are derived, which are illustrated in
Table 5 and
Table 6.
After the local priority vectors are derived, the consistency is verified through a consistency index (CI) and a consistency ratio (CR). Lack of consistency in the pairwise comparisons indicates lack of understanding of the problem by the layout planners, which is caused by wrong decisions [
65,
66]. The consistency ratio is acceptable if it is less than 0.1 [
64]. The CI and CR are defined as Equation (3):
where
represents the consistency ratio;
represents the consistency index;
represents the random index; and n is the size of matrix A.
3.1.4. Step 4: Supermatrix and Global Priority Calculation
Through pairwise comparisons, the relative importance is obtained. However, this is not enough for demonstration of the differences between clusters and elements. Therefore, the supermatrix, as shown in Equation (4), is calculated for further evaluation. The supermatrix represents the relative importance between the elements in the matrix, e.g.,
W12 indicates the relative importance between the
C1 element on the row and
C2 element on the column in Equation (4). The local priority vectors are derived from the pairwise comparison matrices, which are inserted into the supermatrix. As illustrated in
Table 5, the supermatrix is not normalized and the sum of the elements on each column does not equal to one, which is defined as the unweighted supermatrix:
In order to derive the weighted supermatrix, normalization is required to be conducted on the unweighted supermatrix. The normalized weighted supermatrix
can be calculated by multiplying the unweighted supermatrix W shown in Equation (4) and the weighting matrix. The weighting matrix is determined by the comparisons between the criteria of elements in the Strategic Level shown in
Figure 2. To ensure that the weighted supermatrix reaches stabilization or convergence, the limit relative ordering vector of the supermatrix is calculated as Equation (5):
The weighted supermatrix can be raised to large powers to obtain the global priority vector. As illustrated in
Table 6, the limit supermatrix represents the resulting matrix, which reflects all effects of relationships and interdependence in the network structure.
The limit supermatrix is the final resultant matrix from the decision-making process of ANP model, which shows the overall rankings of all criteria. The relative importance between the criteria and priorities for each criterion are illustrated clearly. From
Table 6, it is concluded that the most importance criterion is the LPE criteria, while the least importance criterion is the FCR criterion. As the weight changes may affect the final performance rankings of different alternatives, a sensitivity analysis is conducted to assess the stability of the rankings of potential layout planning alternatives in the following sections.
3.2. Sensitivity Analysis of Multiple Criteria
The sensitivity analysis of the criteria is capable of determining the most sensitive criteria with weight changes and can assist the decision-makers to find out the optimal alternative. In this research, an OAT-based sensitivity analysis is performed with respect to all weights to assess the stability of the alternative rankings for the temporary facility layout problem.
The OAT analyzing method is able to identify the most sensitive parameters among all influencing factors in the model [
67]. In the sensitivity analysis, the weights of input factors are changed to check the results which the weight changes produce [
68]. In this process, the weights of all other factors can be fixed, or at least change to an extent to their baseline value, which makes the comparability of the different results possible. Generally, the OAT-based sensitivity analysis includes three steps as follows [
69]:
Range of percent change (RPC) definition. The changing range is defined as a set of discrete percent change from an original criterion weight value. The change range is required to be within the RPC. In this temporary facility layout planning problem, a single weight range of ±40% is adopted, which is applied to all criteria to see changes of the results.
Increment of percent change (IPC) definition. The proposed evaluation engine conducts a series of runs where each criterion weight is changed in percent increments according to the IPC.
Weight calculation. When the main changing criterion c
m varies, its weight at the certain percent change (PC) can be calculated as Equation (6):
where c
m represents the main changing criterion; W(c
m, 0) represents the weight of the main changing criterion c
m at the base run; pc is the percent change of the main changing criterion; and n is the total number of criteria.
Weight adjustment. In order to satisfy the constraint that the sum of each weight of criterion equals one, the weights of the other criteria need to be adjusted proportionally. The weight of other criterion W(c
i, p) is derived in accordance with W(c
m, p) as Equation (7):
where W(c
m, pc) is the weight of the main changing criterion c
m at the certain percent change; W(c
i, 0) is the weight of the
ith criterion c
i at the base run; W(c
m, 0) is the weight of the main changing criterion c
m at the base run.
Through the described sensitivity analysis, the weight of the main changing criterion is altered by an IPC within the RPC. After the main changing criterion changes from the first criterion (PEO criterion) to the nth criterion (WPC criterion), the sensitivity evaluation summary is generated for all simulation runs including the input criteria and output results. Combined with the specific performance of each alternative, the overall rankings among all alternatives are generated from the simulation. According to the simulation outputs, the decision-makers can check the result changes due to the weight changes and make the final decisions.
4. Application Example
An application example is analyzed to illustrate the use of the proposed model and demonstrate its capabilities in temporary facility layout planning. The input information for the planning includes: (1) the relative importance judged by the selected experts in the in-depth investigation; and (2) the performance assessment for each criterion in the given alternatives.
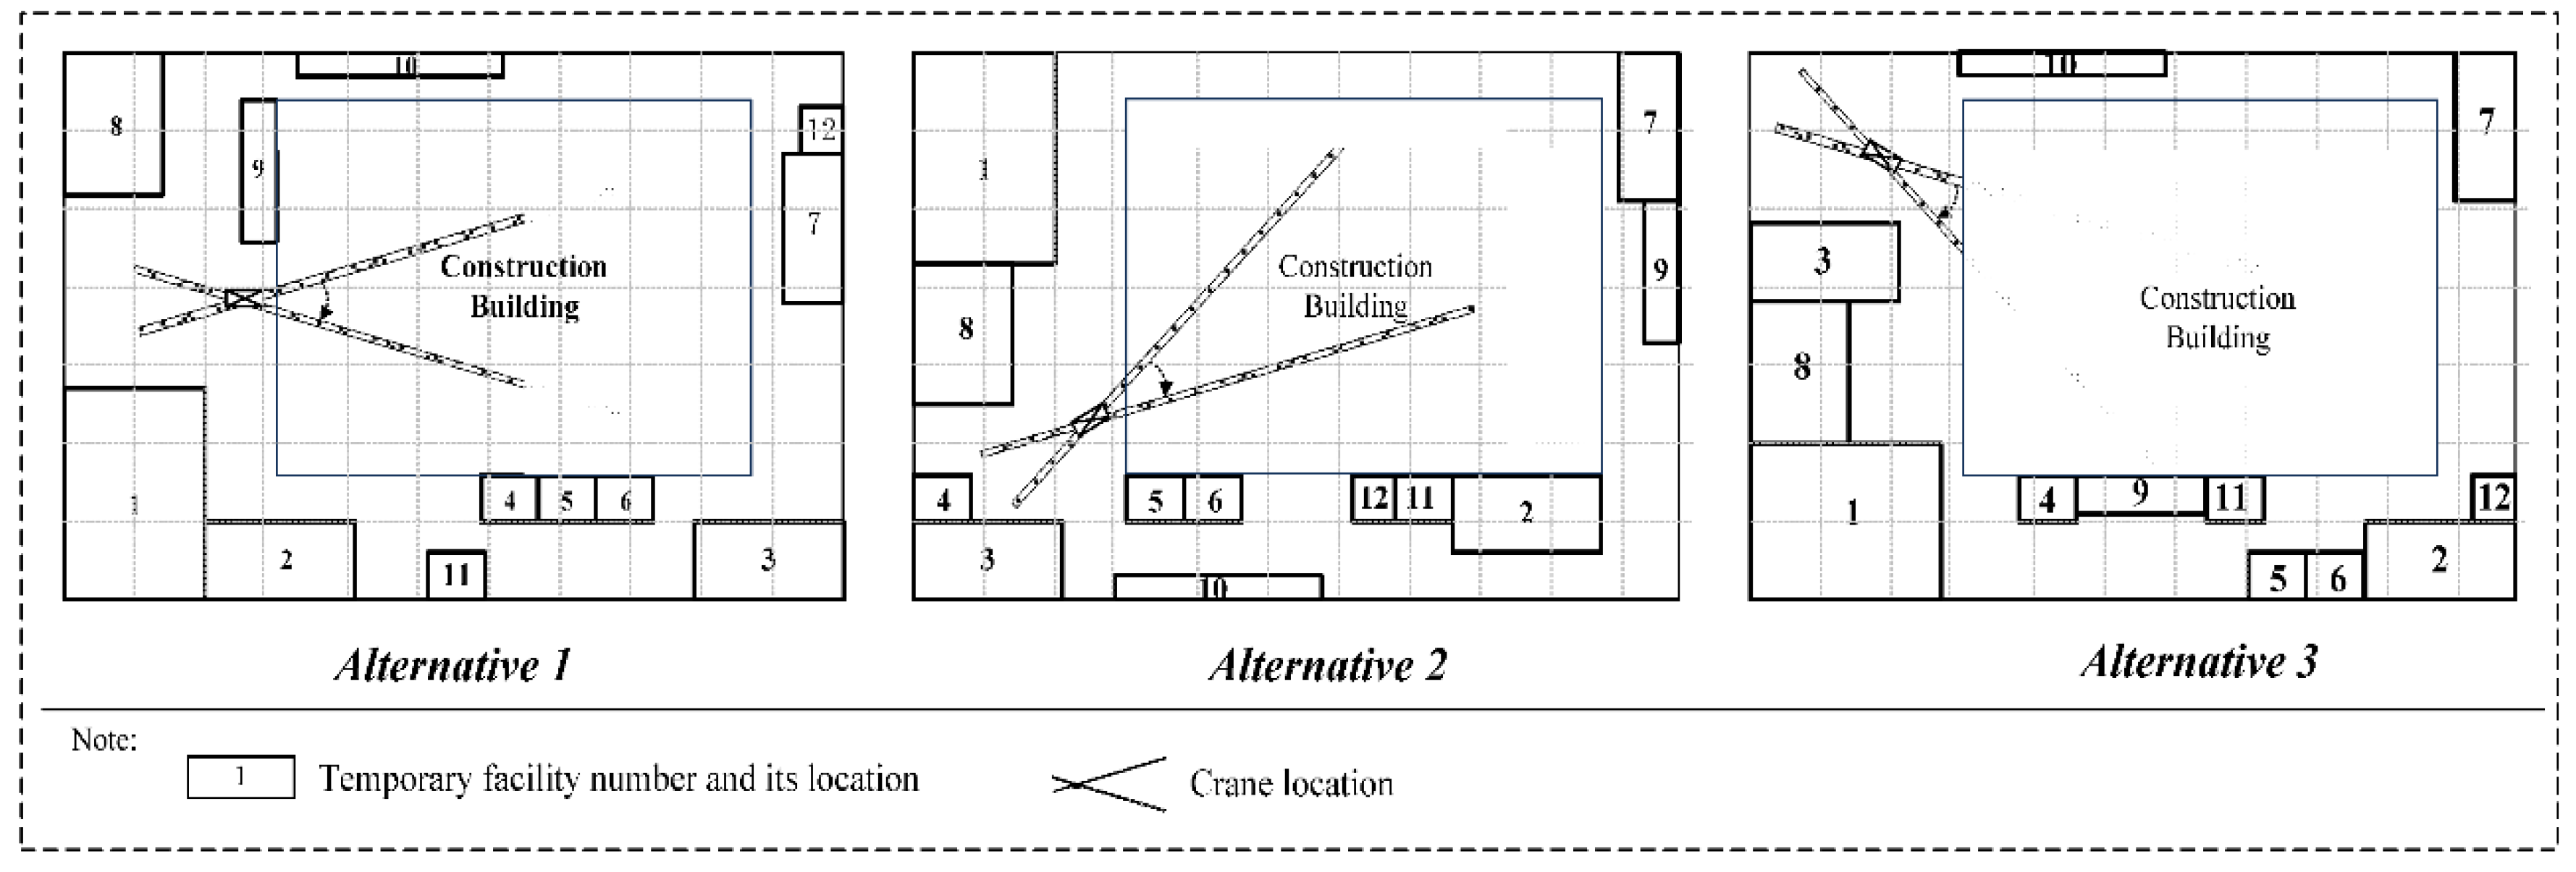
The proposed framework is applied to a real-life multistory building project. On the jobsite, the construction needs the assistance of a set of temporary facilities, which include the storage facilities, workshops, tower cranes, parking lots, field offices, equipment storage, material storage facilities, and garage building. In this case, as shown in
Figure 3, three potential layout planning alternatives are predetermined. The detailed positions and spatial relationships for each alternative are illustrated in
Figure 3, and the rectangles with different numbers represent different facilities.
As one of the most important temporary facilities on site, tower crane positioning is a critical temporary facility task which directly influences the performance of the assisted activities. For example, in Alternative 1, the tower crane is placed to the west of the constructing building, while it is placed to the southwest of the building in Alternative 2. In Alternative 3, it is placed to the northwest of the building. The activities supported by the tower cranes in the three alternatives are different, and the activity performance also varies with the alternative changing. Furthermore, there are another twelve temporary facilities to be positioned on the jobsite. It remains a complex decision-making task to select the optimal layout plan and to properly optimize the locations of temporary facilities.
In order to support planners and decision-makers in the challenging decision task, the proposed framework was applied to identify the optimal solution for temporary facility layout in this case. The relative importance among different criteria was judged by eight selected construction superintendents, managers and experts. The work experiences and background of the selected experts are shown in
Table 7.
Through the detailed descriptions of the proposed ANP-based framework, the relative importance of the criteria was assessed through a questionnaire investigation. The average value of the results from eight experts was utilized as the input of the model. The model is solved through the Super Decisions software to analyze and evaluate the judgment matrices [
70]. Then, the unweighted supermatrix and limit supermatrix were obtained from the evaluation, as shown in
Table 5 and
Table 6. The priorities were extracted from the limit supermatrix (shown in
Table 6) to generate the weight of each criterion and to study the relative importance of criteria and sub-criteria.
As illustrated in
Figure 4, the weight results are illustrated. The generated weights for all criteria provide further insights into the layout planning for the construction planners and decision-makers. From
Figure 4a,b, it is concluded that criteria of LPE and minimization of the TNI are the most important sub-criteria at the tactical level. The weights are 0.1000 and 0.0976, respectively. On the other hand, the criteria of FCRs and the ability to dynamically change the temporary facilities (ACT) are the least important sub-criteria among all sub-criteria, which are respectively 0.0369 and 0.0407. Therefore, construction layout planners and decision-makers can determine the weights of different criteria and further evaluate the performance of the criteria.
In order to determine the overall ranking of all alternatives, the performance value of each criterion was measured and quantified to be within the range of 0 to 100% due to the features of each alternative. Specifically, the performance degree is 100% when the construction managers are completely satisfied by the actual performance for a certain criterion. In this example, the performance degree for each criterion of each alternative is shown in
Table 8.
The sensitivity analysis directly utilizes the criteria weights obtained from the ANP-based approach and the performance degree for each criterion to determine the most sensitive criteria in the layout problem. In this example, the RPC was defined from –40% to 40% while the IPC was defined from –2% to 2%, which were applied to all sub-criteria. The simulation process involved 640 runs while each run generated a single result for the alternative. Through the simulation runs, the optimal alternative can be concluded from the results for each combination of weights. For example, when TNI is the main changing criterion, results from the 40 simulation runs are illustrated
Table 9. The criteria weights, the overall performance for each alternative and the optimal alternative are summarized in
Table 8. It can be concluded when the weight of TNI criterion changes within the range between –40% and 40%, the optimal alternative is Alternatives 2 or 3. Specifically, the optimal alternative is Alternative 2 in most conditions. On the other hand, Alternative 1 is never the optimal alternative.
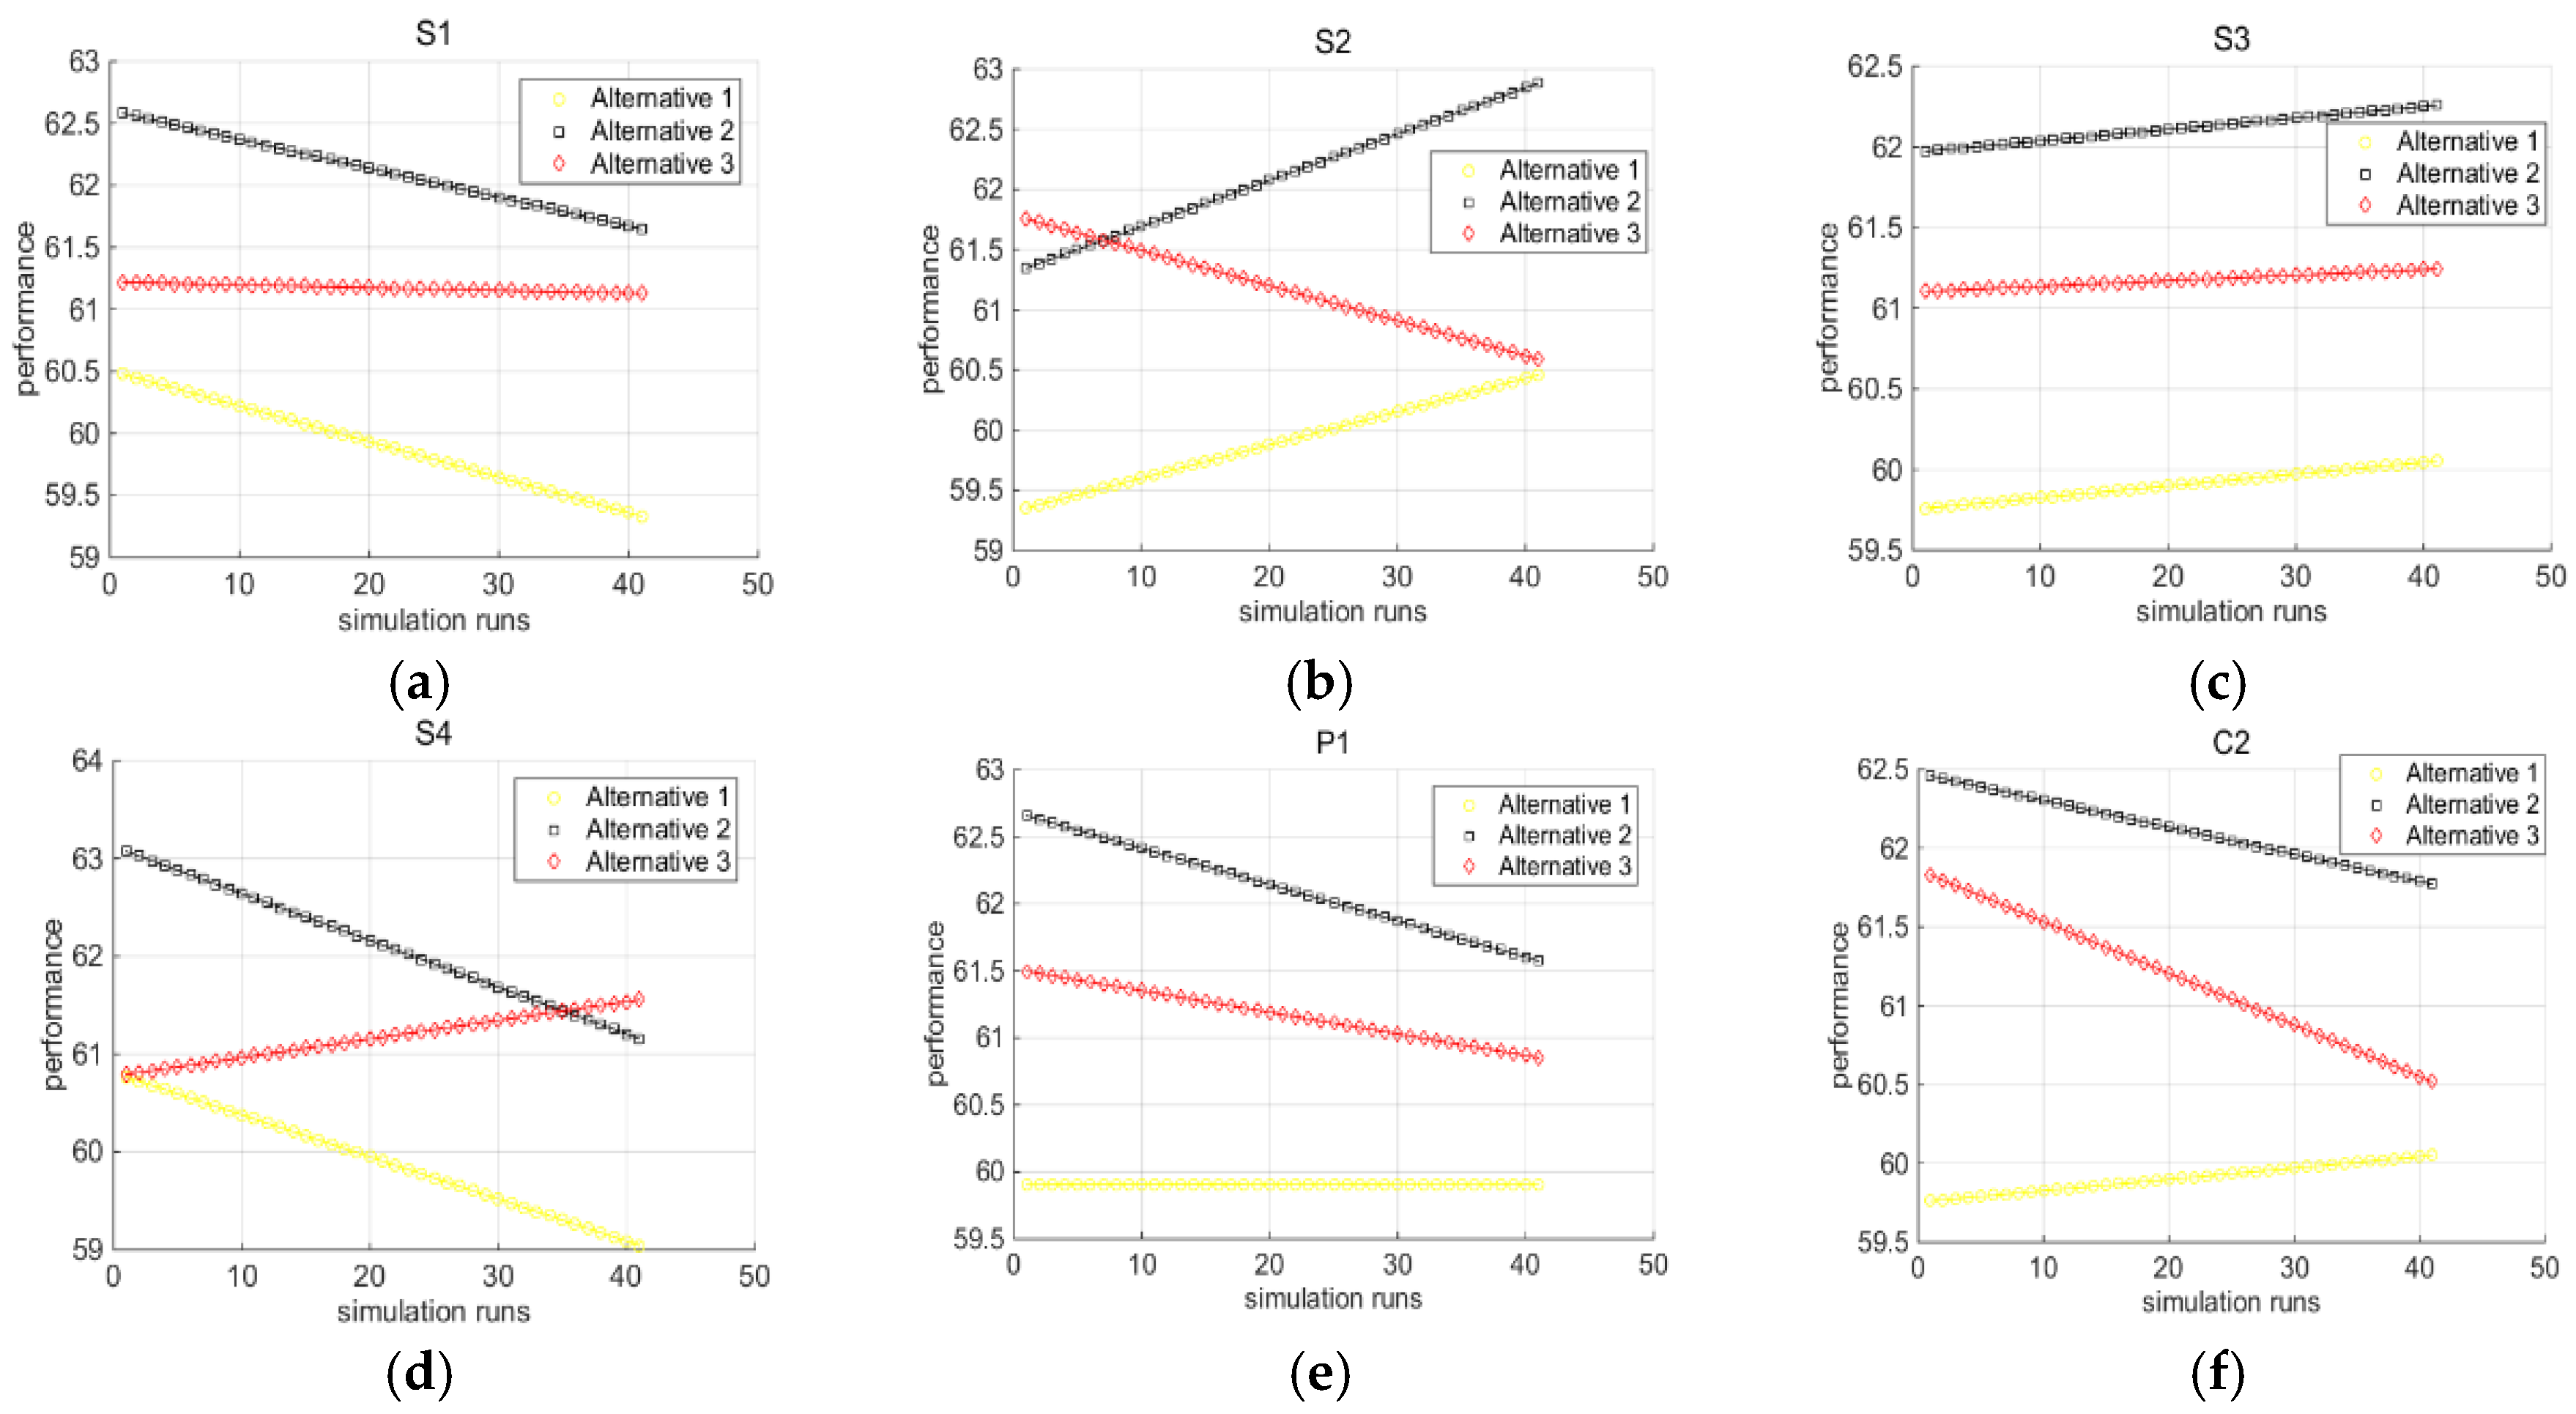
In addition to the TNI criterion changing case, there are another 15 criteria changing cases. Six typical cases were selected to evaluate the result changes, as illustrated in
Figure 5. In addition to the six typical cases shown in
Figure 5, the results of the other 10 typical cases are similar to the case of PEO criterion (shown in
Figure 5a). In the selected cases, the main changing criteria are individually PEO, CHZ, CHM, TNI, ESU and FRC criterion. As shown in
Figure 5, it can be concluded that:
CHZ and TNI are the most sensitive criteria among all criteria. When the weight of CHZ or TNI criterion changes, significant change can be caused to the results and final decision. As shown in
Figure 5b, with the main criterion CHZ changing, the most suitable layout alternative changes from Alternative 3 (shown in the red dashed line) to Alternative 2 (shown in the black dashed line), while Alternative 2 is optimal in most cases. As shown in
Figure 5d, the optimal layout alternative changes from Alternative 2 to Alternative 3 while Alternative 2 is optimal in most simulation runs.
As illustrated in
Figure 5a,c,e,f, Alternative 2 is always the optimal plan. With the weight changing, the performance of Alternative 2 may be improving or decreasing; however, its performance value is always higher than the other two alternatives.
In all cases, Alternative 1 is never the optimal plan. Therefore, Alternative 1 is considered to be the most unacceptable plan among all plans, which indicates that planners should avoid selecting Alternative 1 in the final decision.
Through the sensitivity analysis, the result stability of the optimal alternative is evaluated and assessed. All potential optimal alternatives are generated from the simulation runs. According to the simulation results, the decision-makers are able to avoid selecting the alternative which is impossible to be the optimal one, and further determine the most preferred solution among the potential optimal alternatives. This can significantly improve the performance of the temporary facility layout planning in actual construction practices.
5. Discussions
In order to optimize multiple construction objectives and determine the optimal temporary facility layout plan, an effective and appropriate assessment approach is critical. However, the ability is limited in formulating a multi-criteria layout optimization framework. Based on the previous studies, this research establishes the criteria system which integrates all relevant indicators related to temporary facility layout planning. By evaluating the criteria system, this study identifies the relative importance of the criteria and sub-criteria in temporary facility layout planning through an in-depth investigation. Meanwhile, based on the OAT approach, a sensitivity analysis was conducted to analyze the result stability of the optimal layout alternative, which provides further insights into the decision-making process for construction planners and managers.
From
Table 10, it can be seen that minimization of the TNI, PEO and STE rank the second, third and fourth place among all sub-criteria, respectively. Considering that TNI, PEO and STE are three sub-criteria belonging to the safety criterion, it is shown that safety criterion is significantly critical in the temporary facility planning. This is consistent with the fact that the previous layout planning research mainly focused on the safety impact on the temporary facility layout [
2,
15,
71]. It is indicated that safety is the most significant factor in the planning task. In our research, the specific safety sub-criteria that impact layout planning are identified. Meanwhile, LPE belonging to the productivity criterion ranks first among all sub-criteria. This is also indicated by the previous research, which mainly focused on evaluating the productivity influences on the layout performance [
11,
72]. Therefore, labor productivity is another important factor in temporary facility layout planning. Furthermore, cost criterion is required to be taken into account in the layout planning, as the construction project has a budget limit [
4,
13].
Secondly, the previous methods applied in temporary facility layout planning mainly focused on one or two criteria related to this field, such as safety and productivity. The previous research did not consider all relevant sub-criteria in the facility planning. In this study, the established criteria system integrates a set of sub-criteria to effectively and efficiently determine the optimal layout plan, which has not yet been seen in the previous efforts.
Furthermore, in this research, the sensitivity analysis shows that the results are not very sensitive to the weight changes. With the weight changing, the results of the selected optimal alternatives are relatively stable except two changing conditions. Therefore, the decision-makers can effectively estimate the possible optimal alternatives and avoid selecting the other alternatives which will never be the optimal solutions.
6. Conclusions
The study proposed an integrated framework for multi-criterion temporary facility layout evaluation and decision-making, aiming at optimizing multiple construction objectives and determining the optimal layout alternative. The proposed framework presented a two-phase decision process, which integrated the ANP approach, simulation-based sensitivity analysis, and optimization methods. The generic temporary facility layout framework and network structure were formulated. With the ANP modeling approach, the spatial layout decision problem was transformed into a multi-criterion mathematical problem. It supports the construction planners and managers in generating the relative importance among objectives and criteria at the practical level and determining the weight value of each criterion in the layout problem. Through the OAT-based simulation, the sensitive factors that significantly impact the layout performance were identified and the potential optimal alternatives were determined.
In the present research, the proposed model was implemented on an application example to validate its effectiveness and capabilities. From the results of the case study, the overall rankings of sub-criteria were provided to the decision-makers, which indicated that some sub-criteria belonging to the productivity and safety criteria were relatively important. In the application example, it can assist site managers with the decision-making task to determine the optimal solution for temporary facility layout. The most important sub-criteria were identified through the ANP-based model, which were specifically the LPE, minimization of the TNI and PEO. Therefore, the facilities should be arranged reasonably according the evaluation results. Considering the cost impact on layout planning, the facility removal cost should be minimized through effective layout optimization. Furthermore, the sensitivity analysis generated the possible optimal alternatives through the simulation process and help construction planners to avoid selecting the alternatives which would never be the optimal solutions.
The analysis results highlight the new and unique capabilities of the temporary facility layout planning model in generating the optimal alternative considering multiple criteria. This provides the construction managers and planners with a useful tool to improve the overall performance of temporary facility planning in construction projects.


