Landslide Susceptibility Modeling Based on GIS and Novel Bagging-Based Kernel Logistic Regression

 ,
,  ,
,  , ,
, ,  , , ,
, , ,
Abstract
:1. Introduction
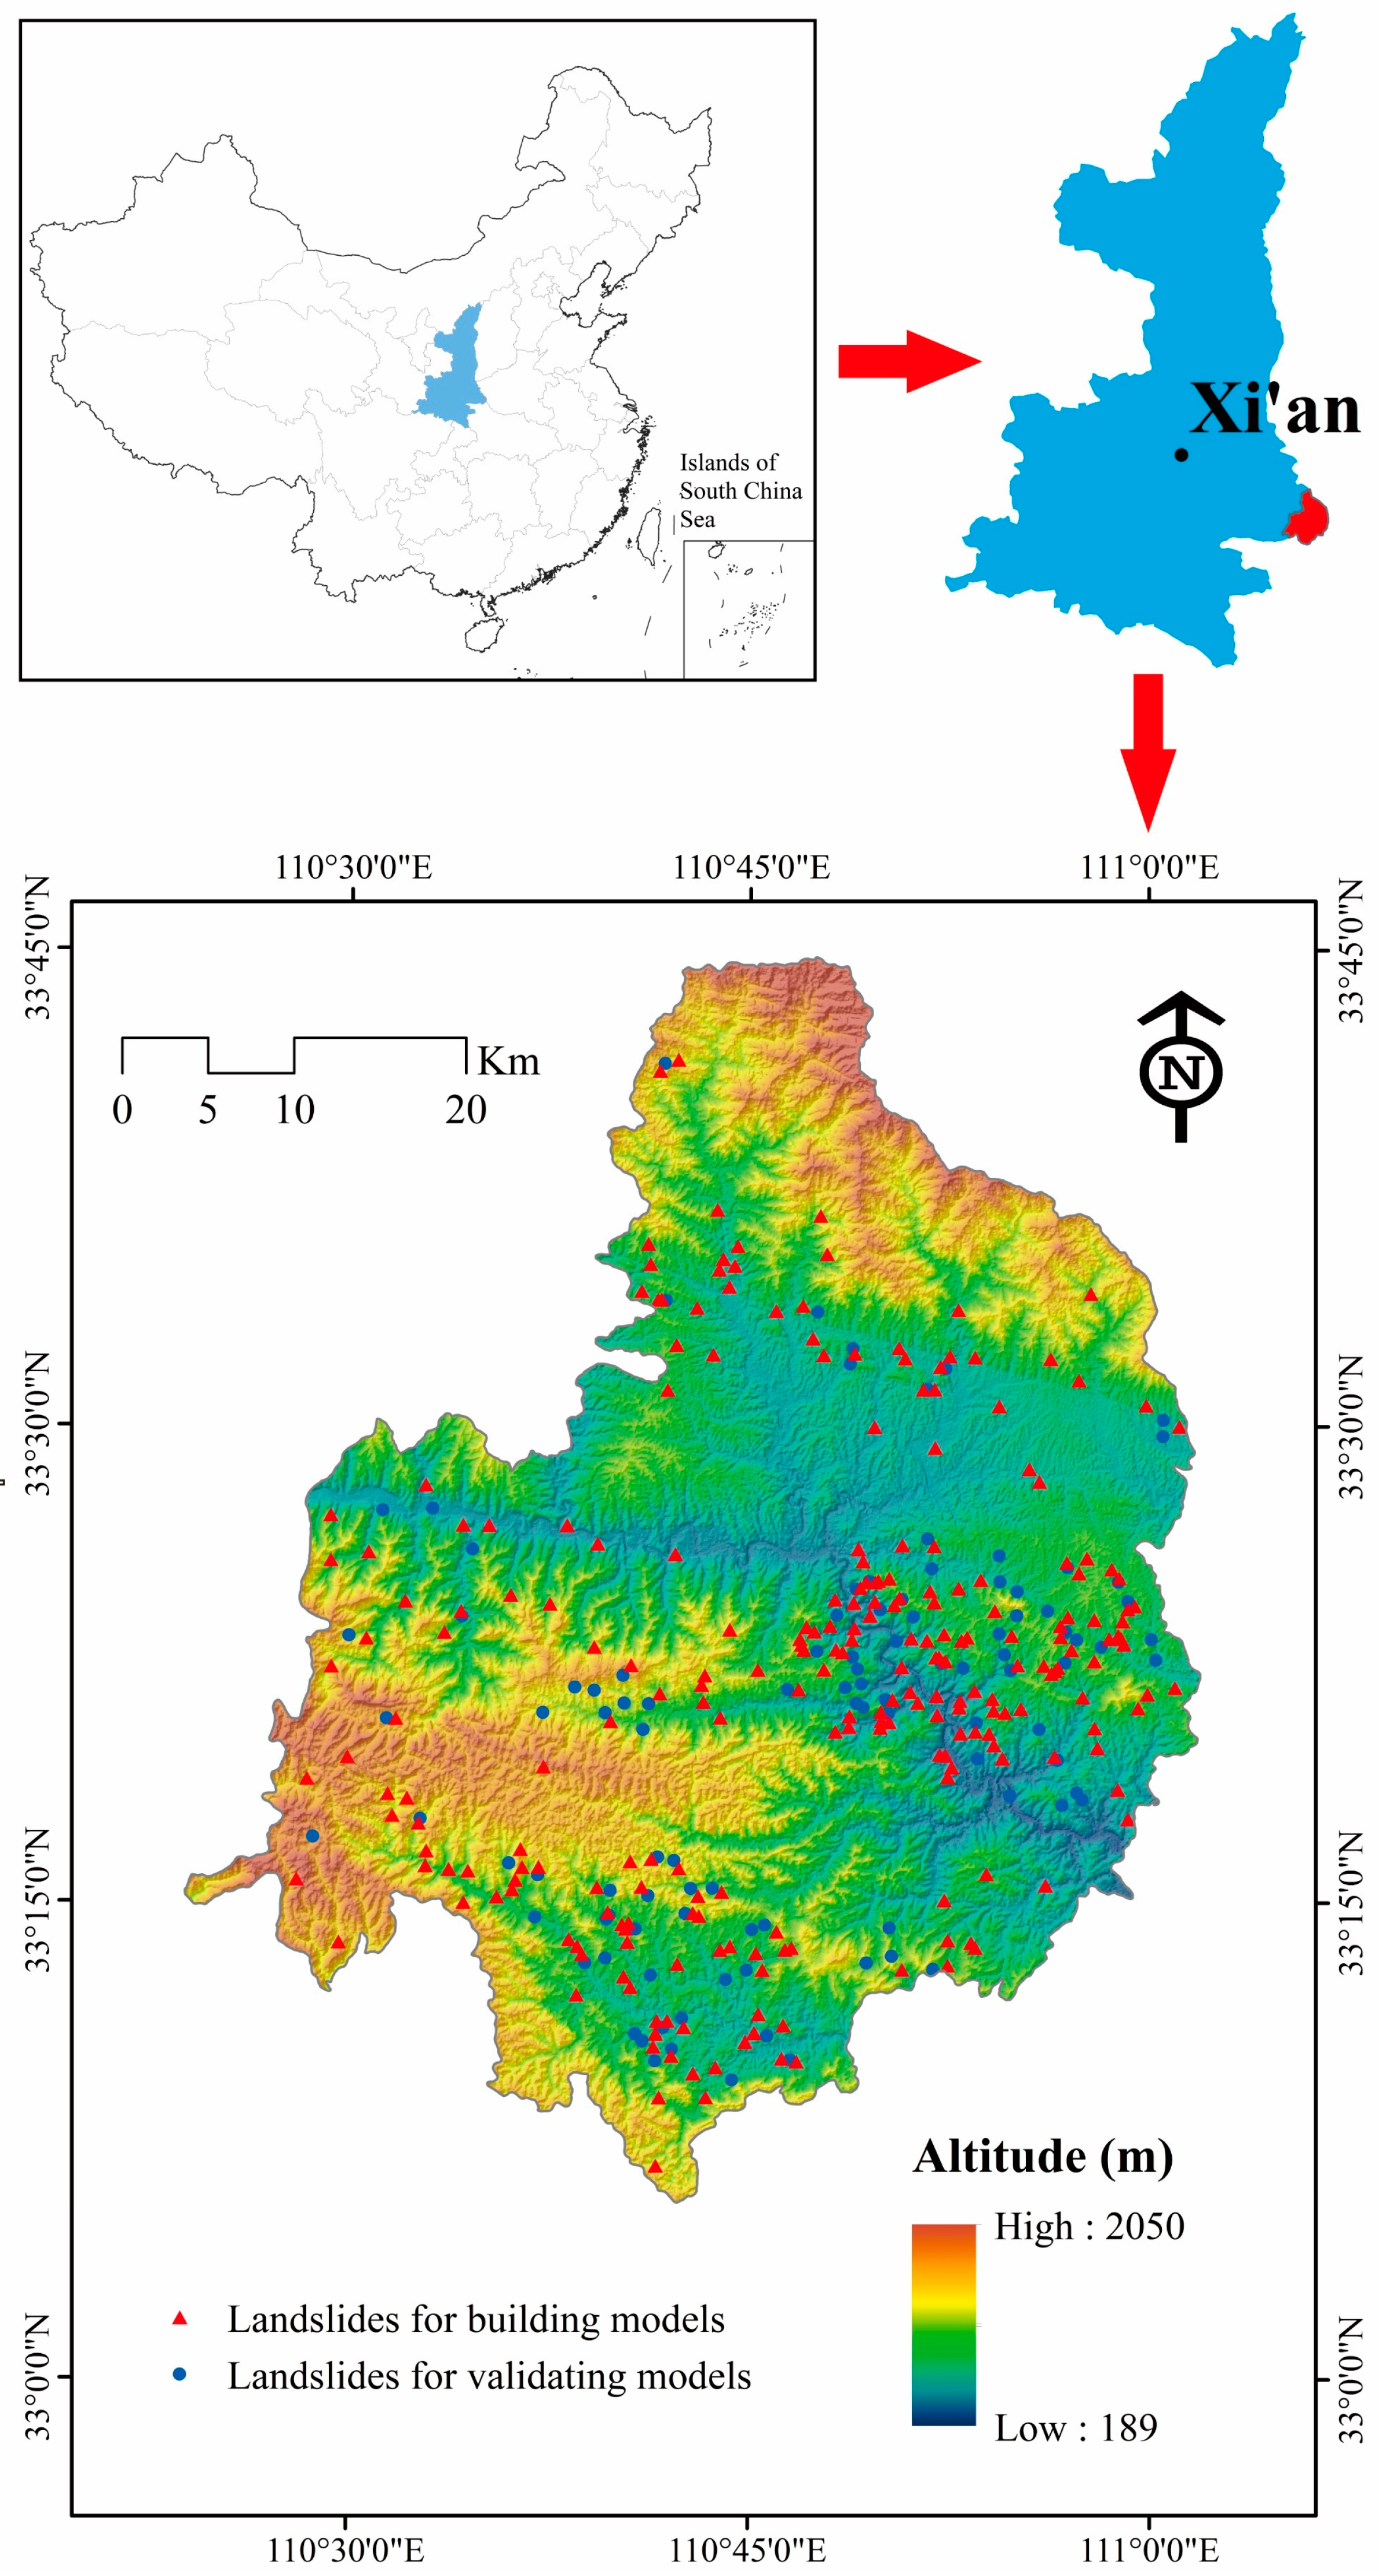
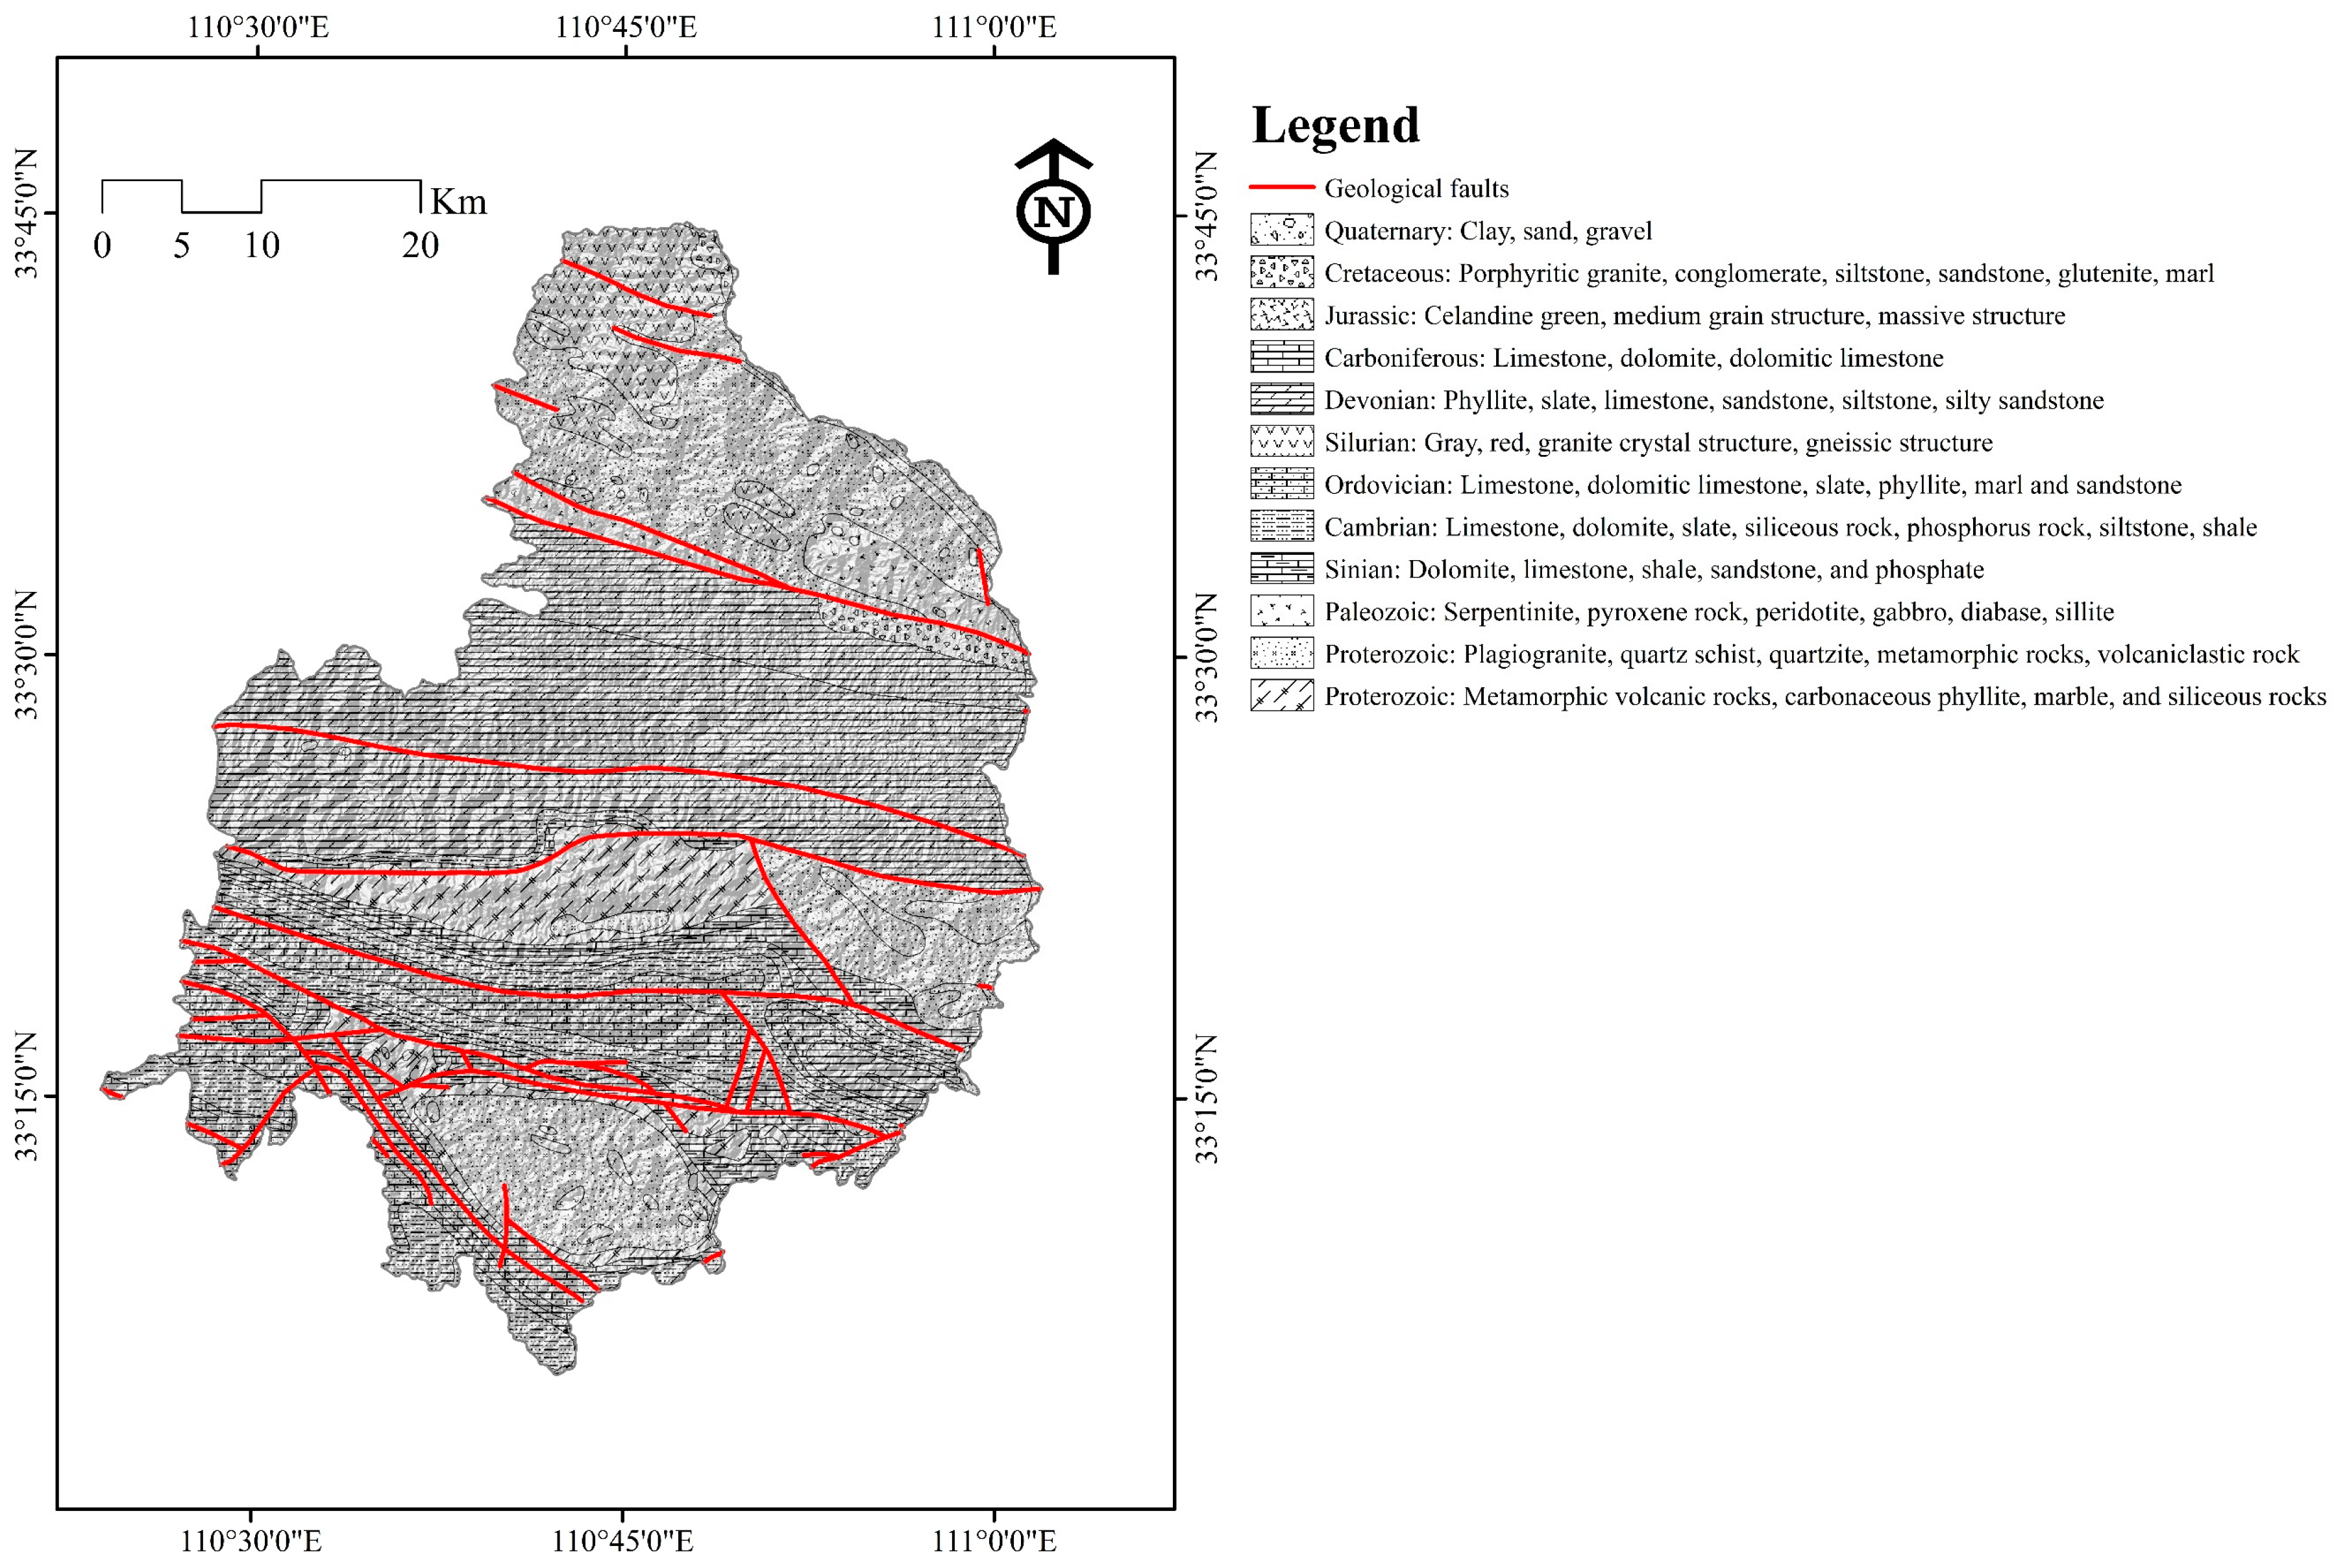
2. Study Area and Data Used
3. Modeling Approaches
3.1. Bagging
3.2. Kernel Logistic Regression
4. Results
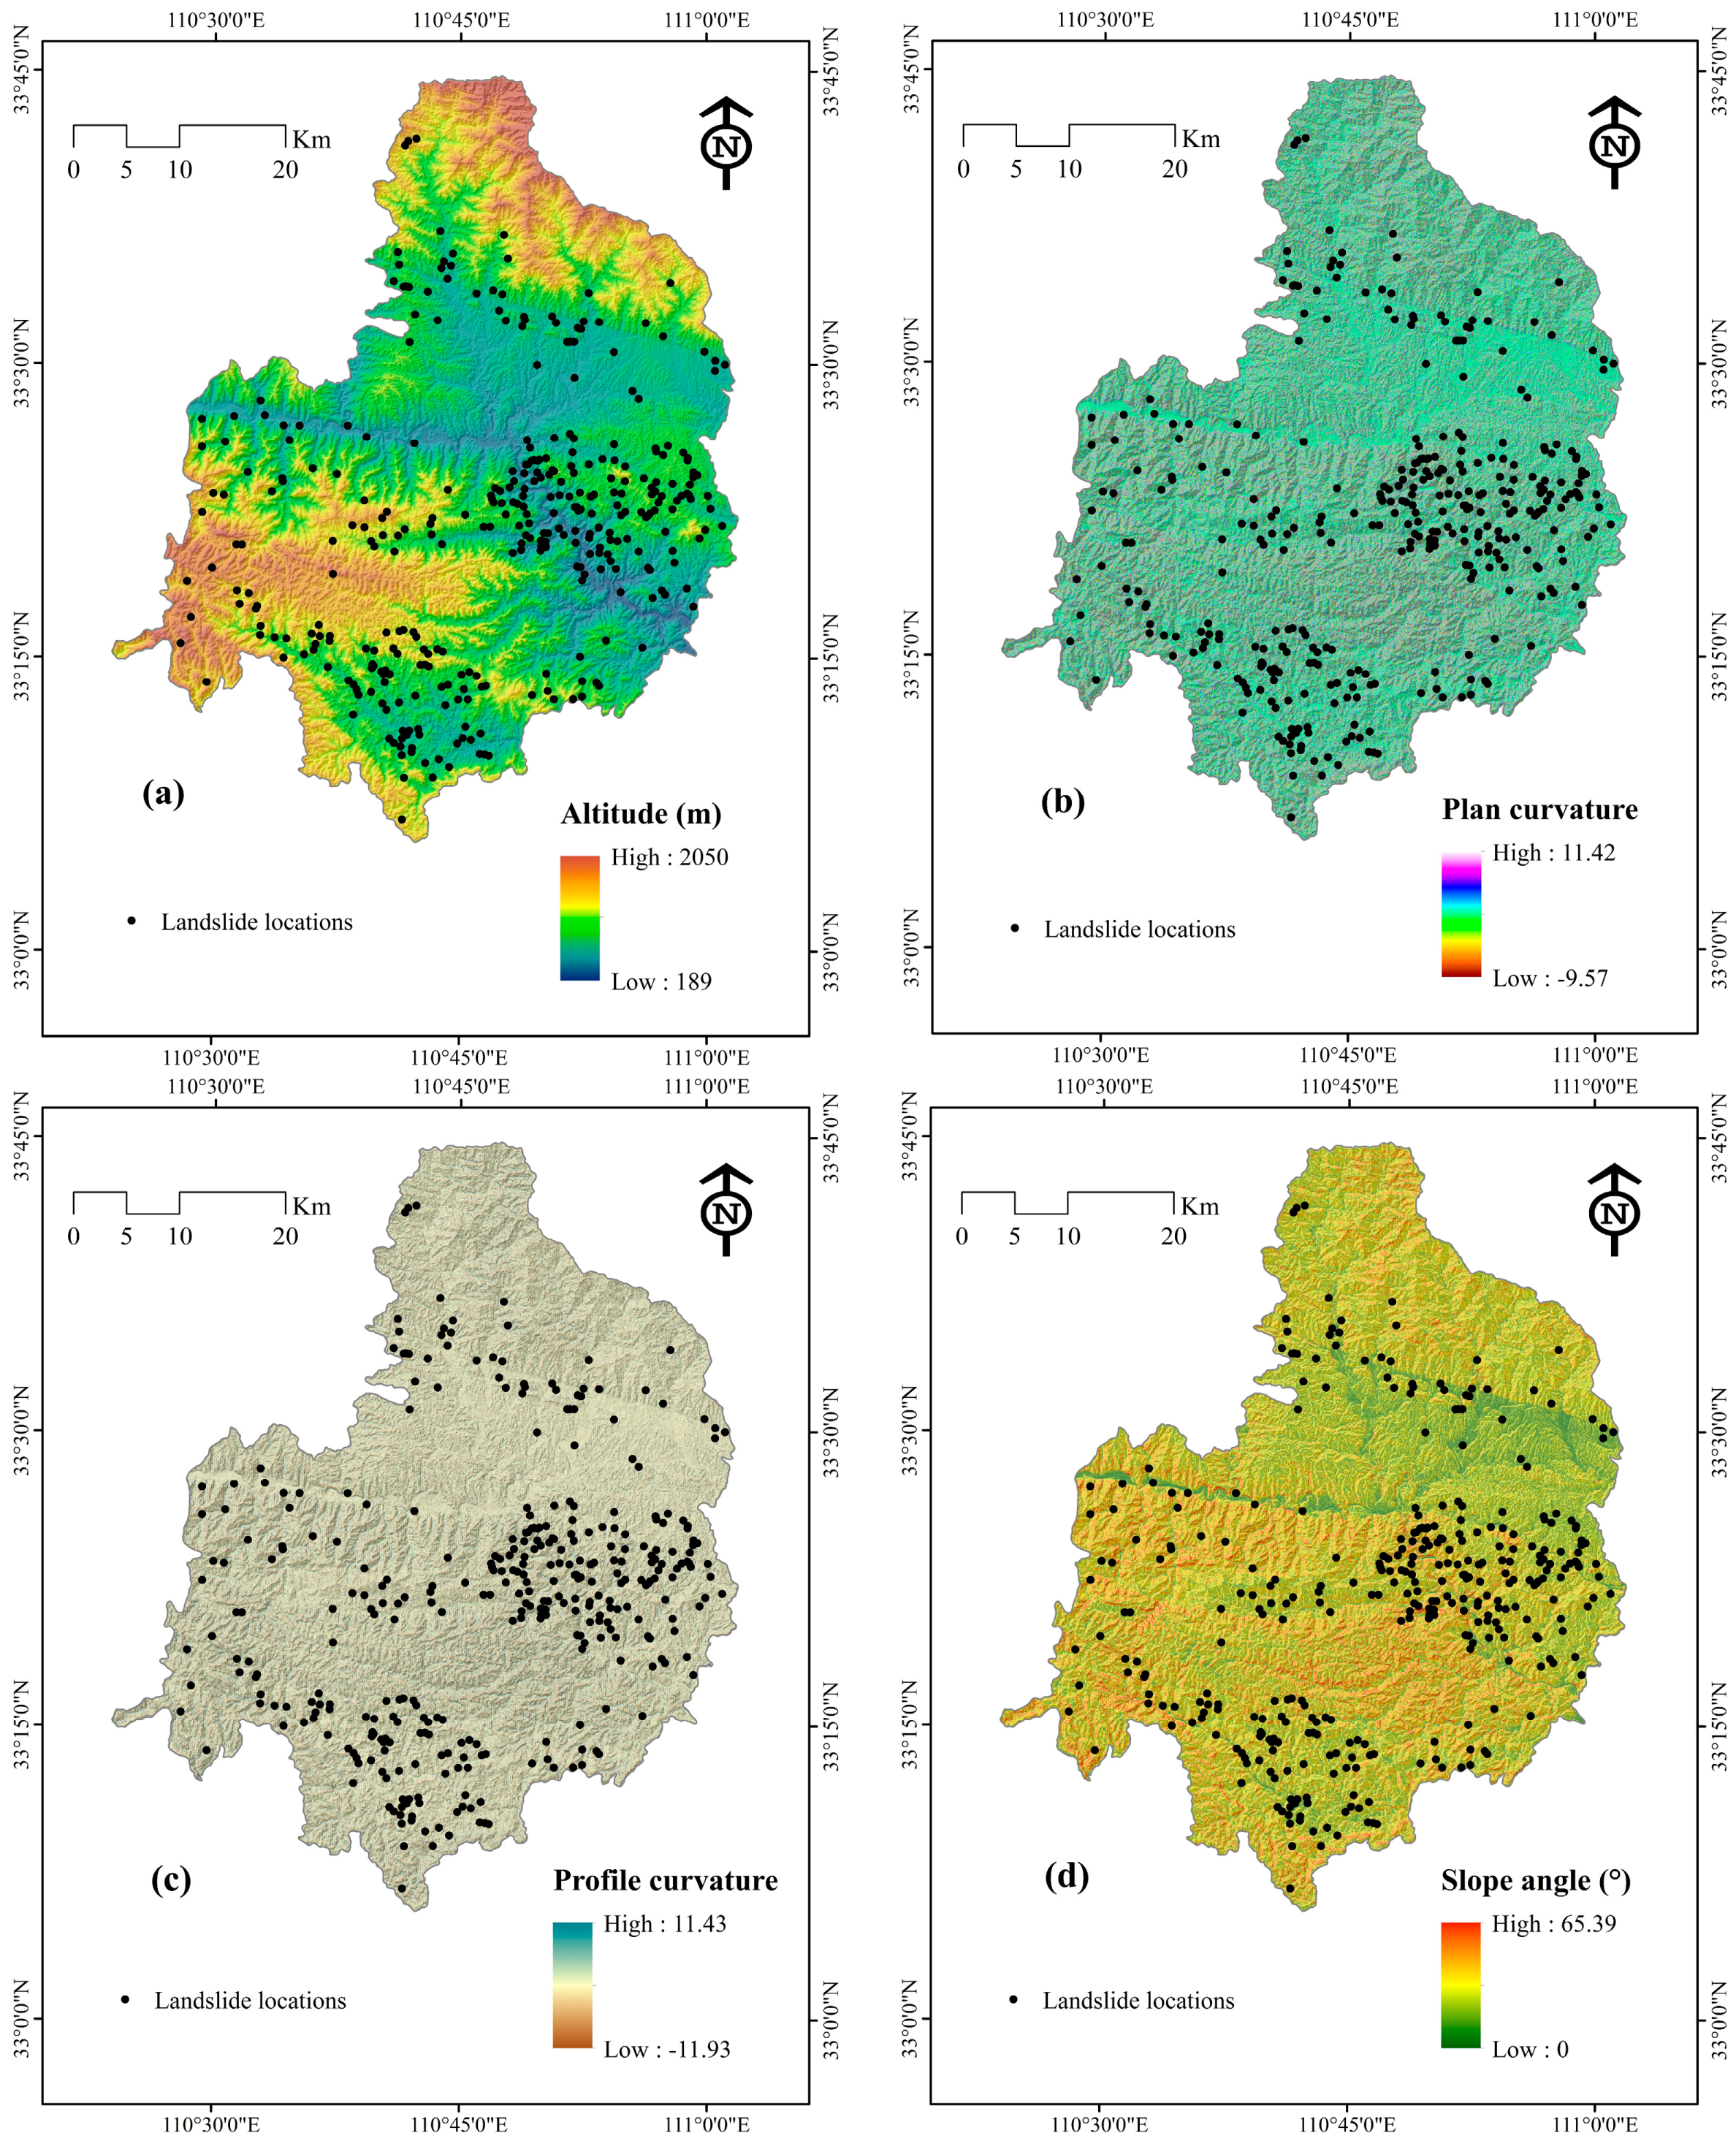
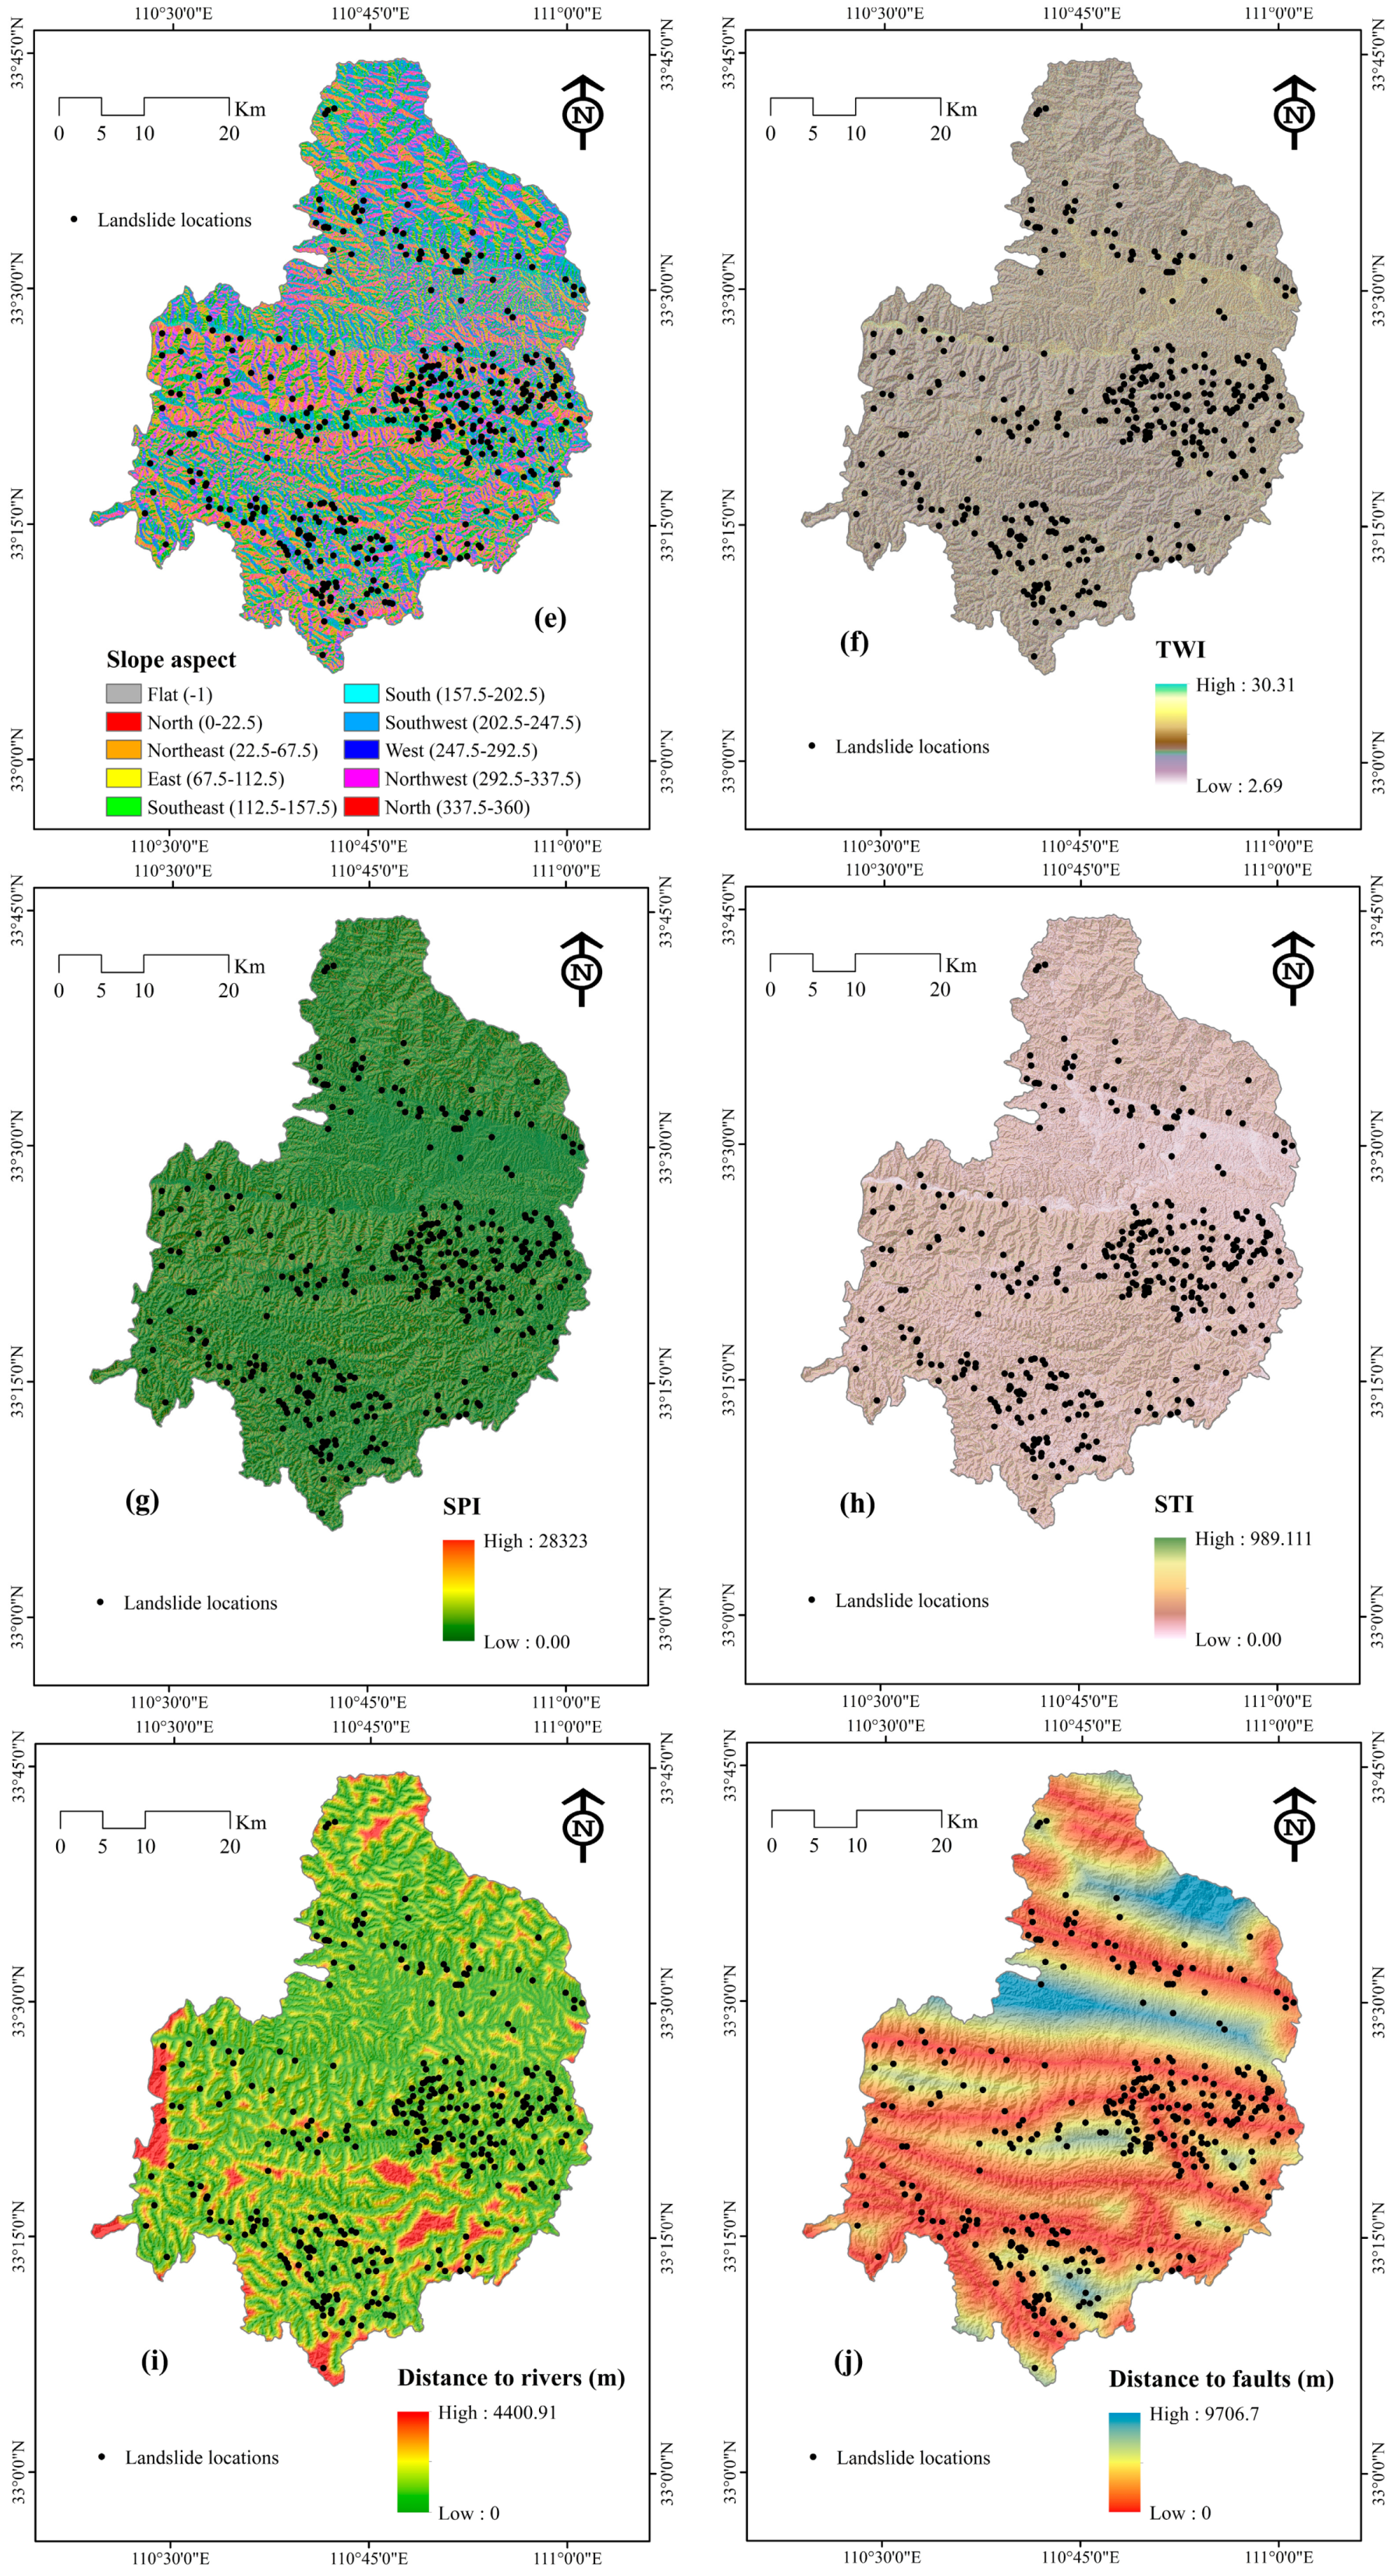
4.1. Selection of Landslide Conditioning Factors
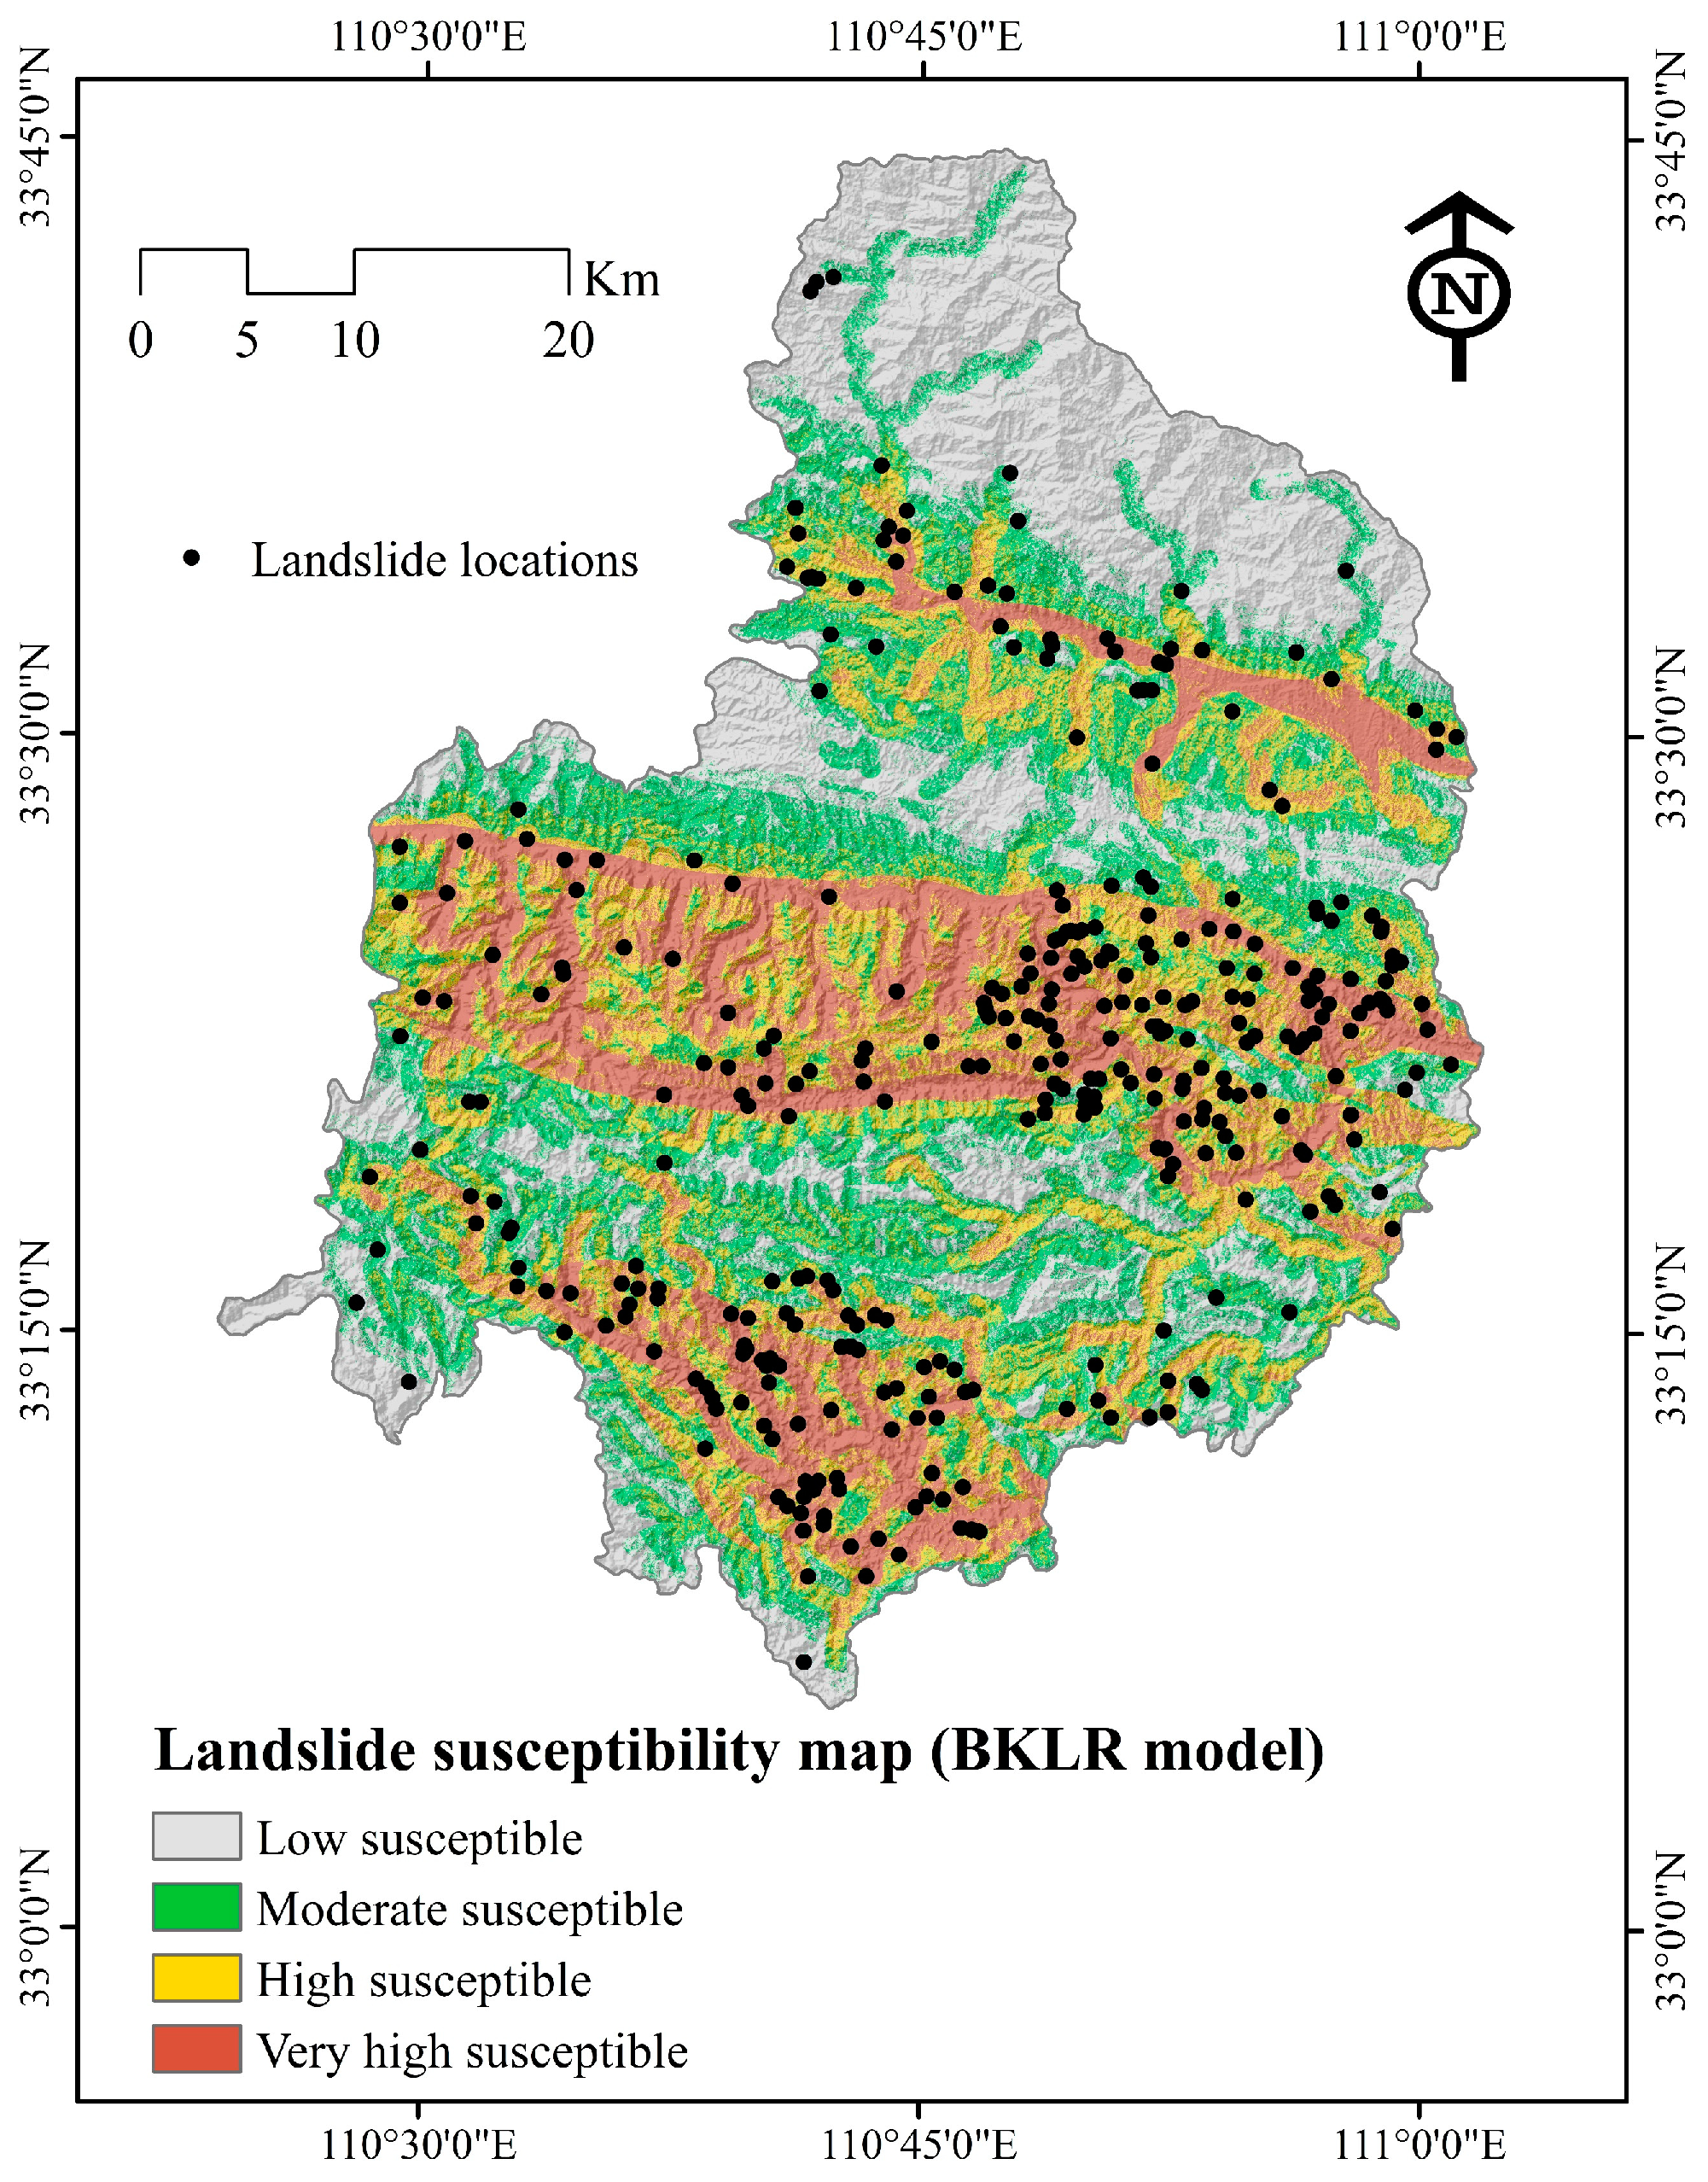
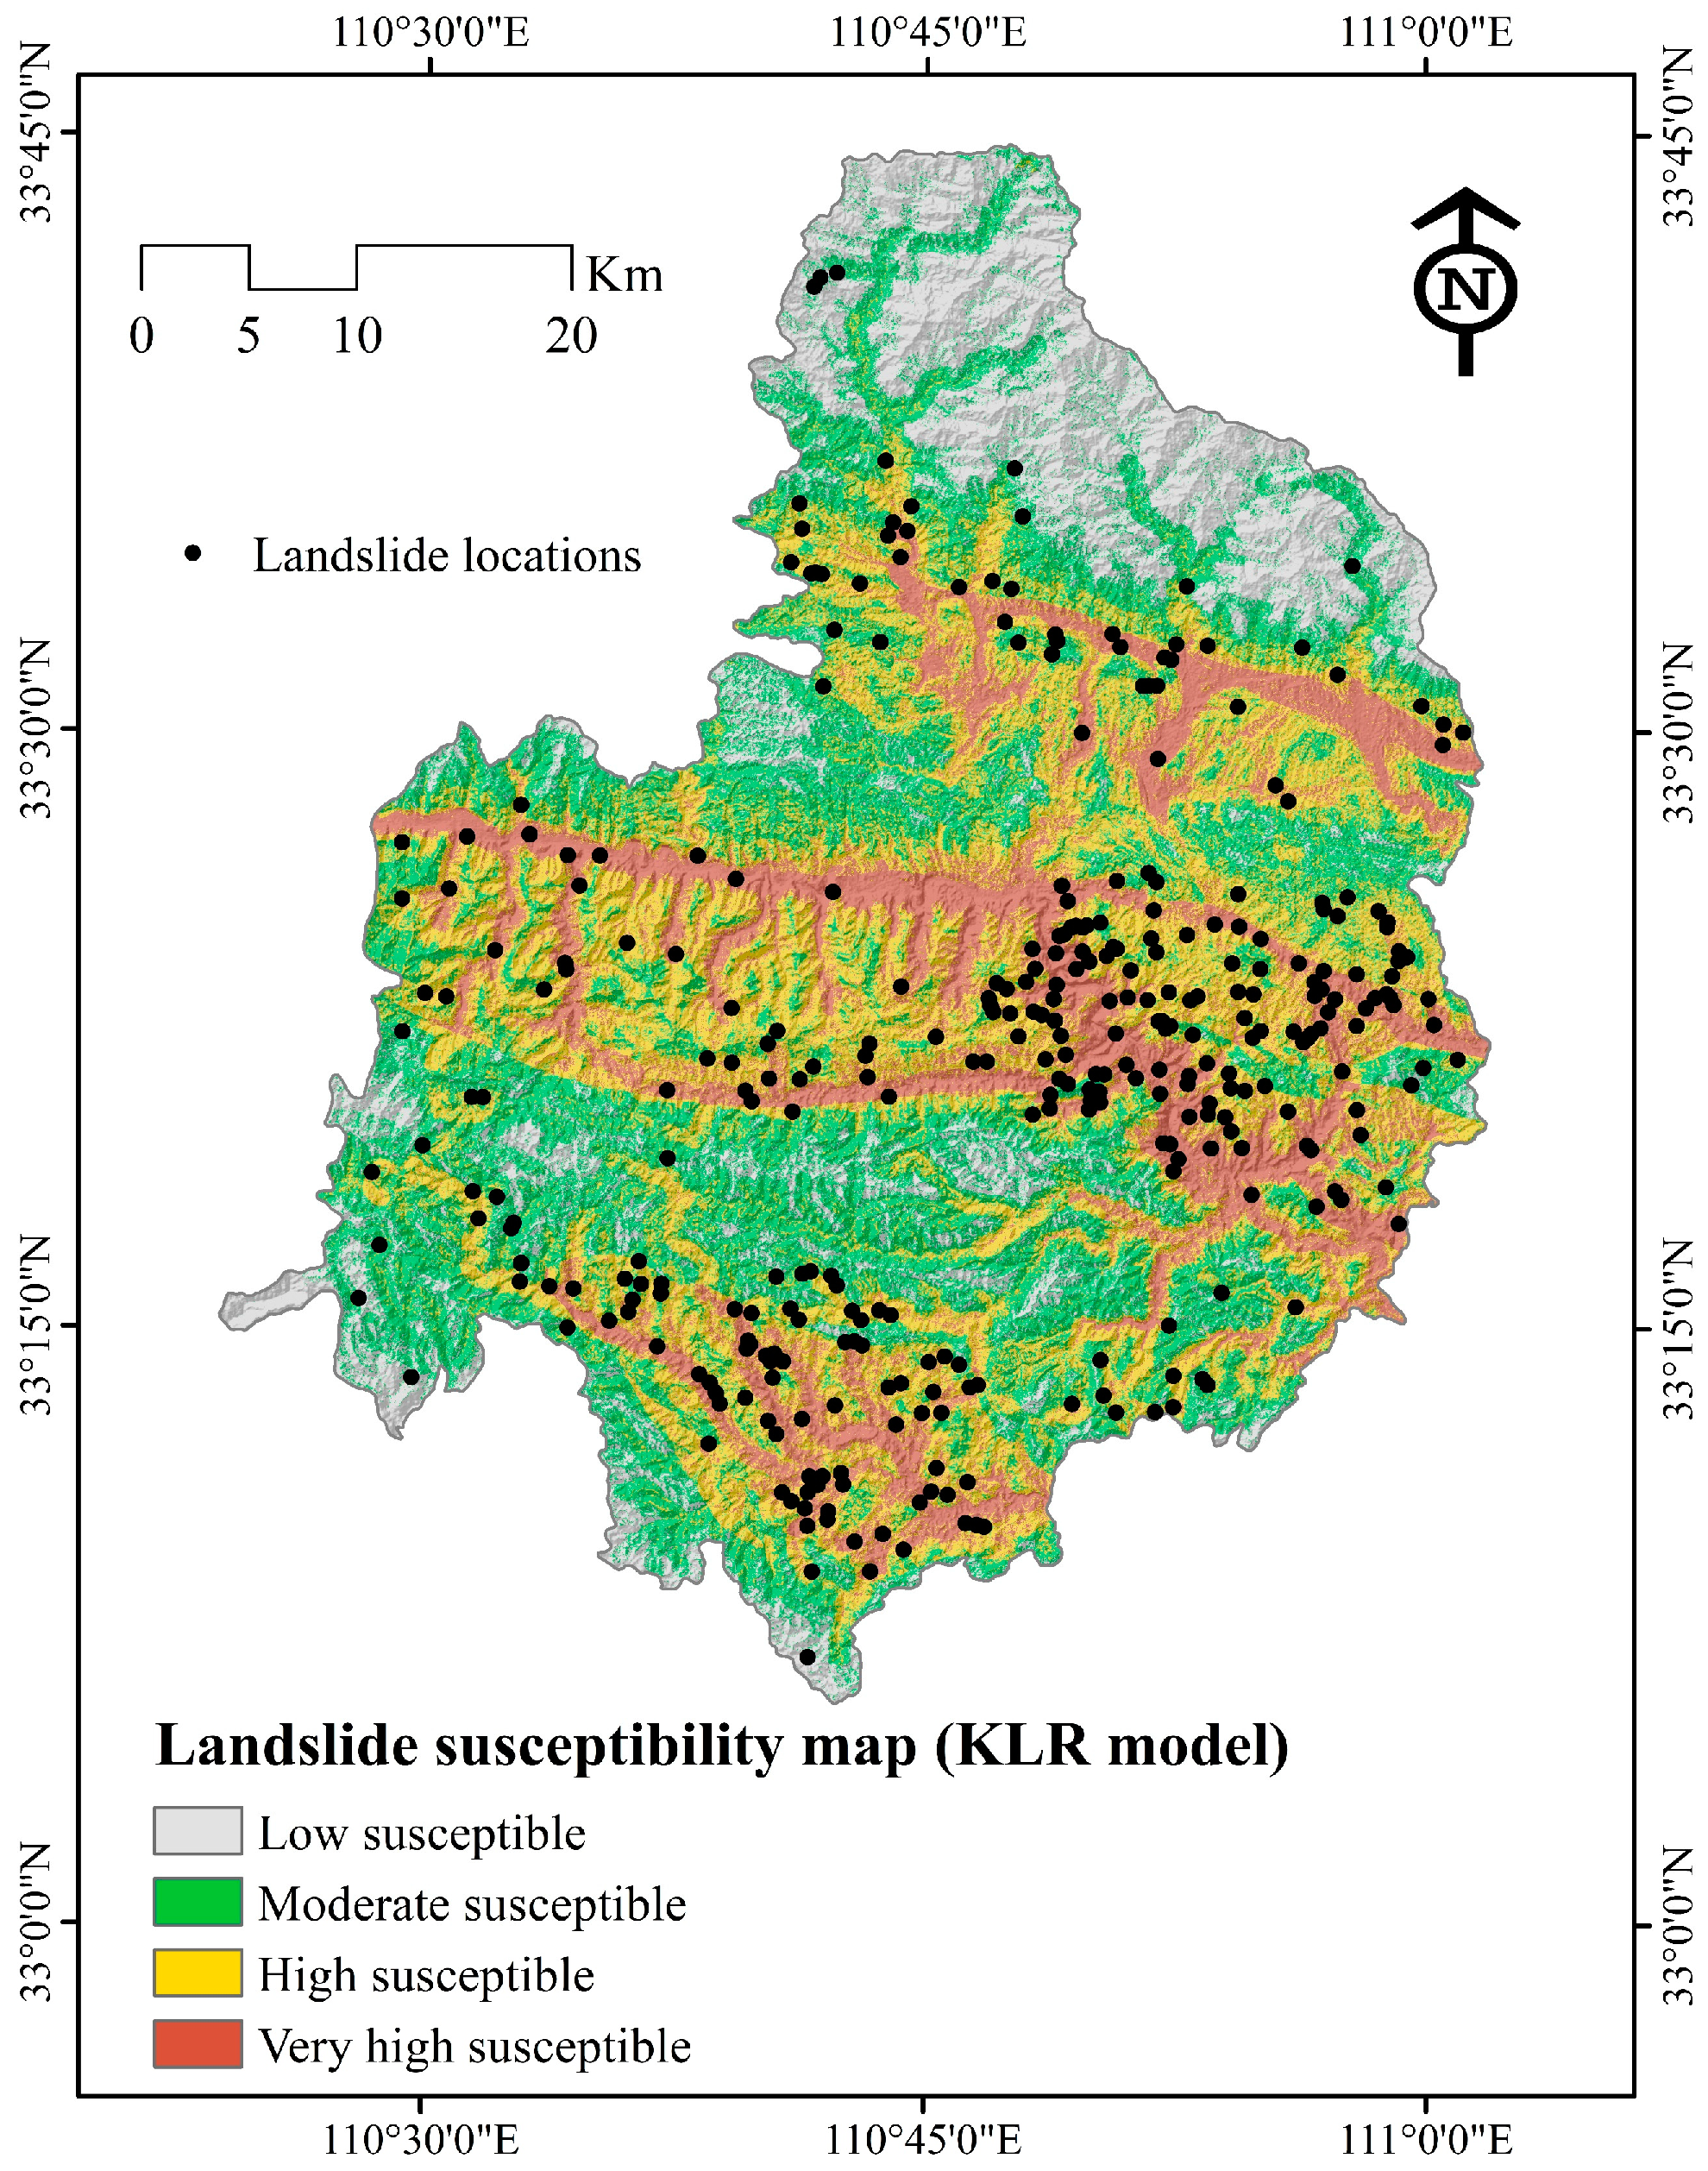
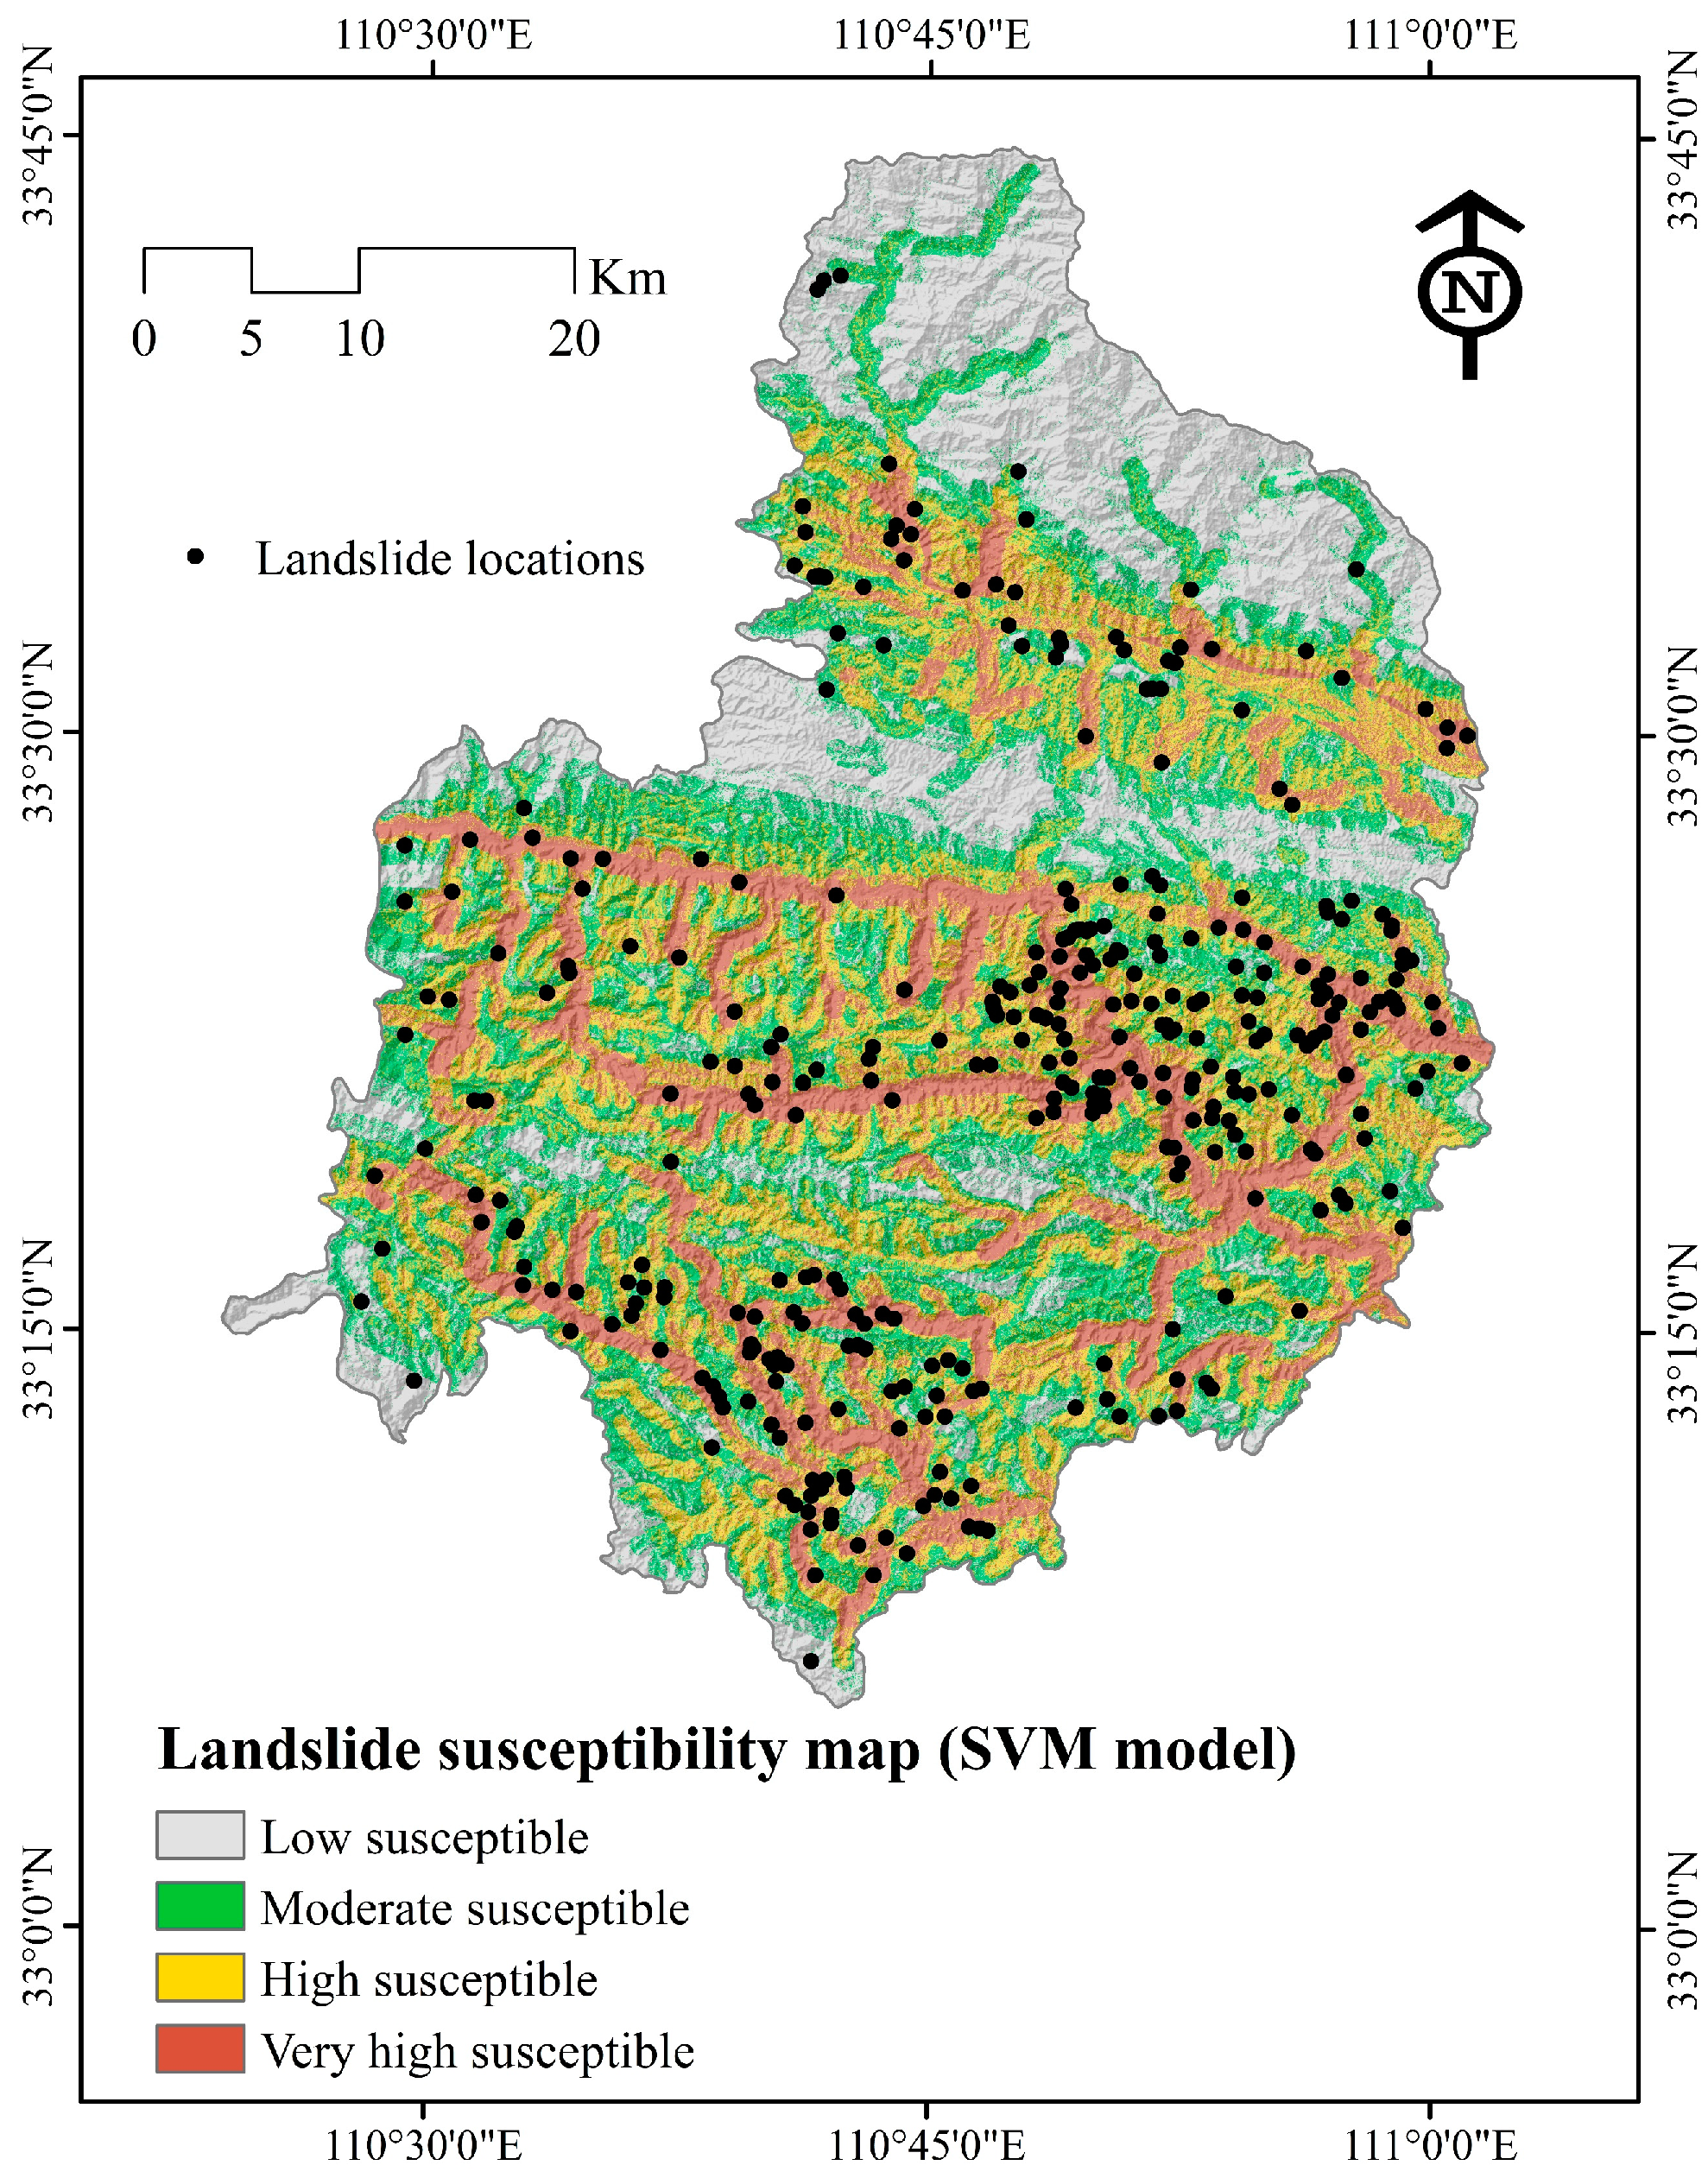
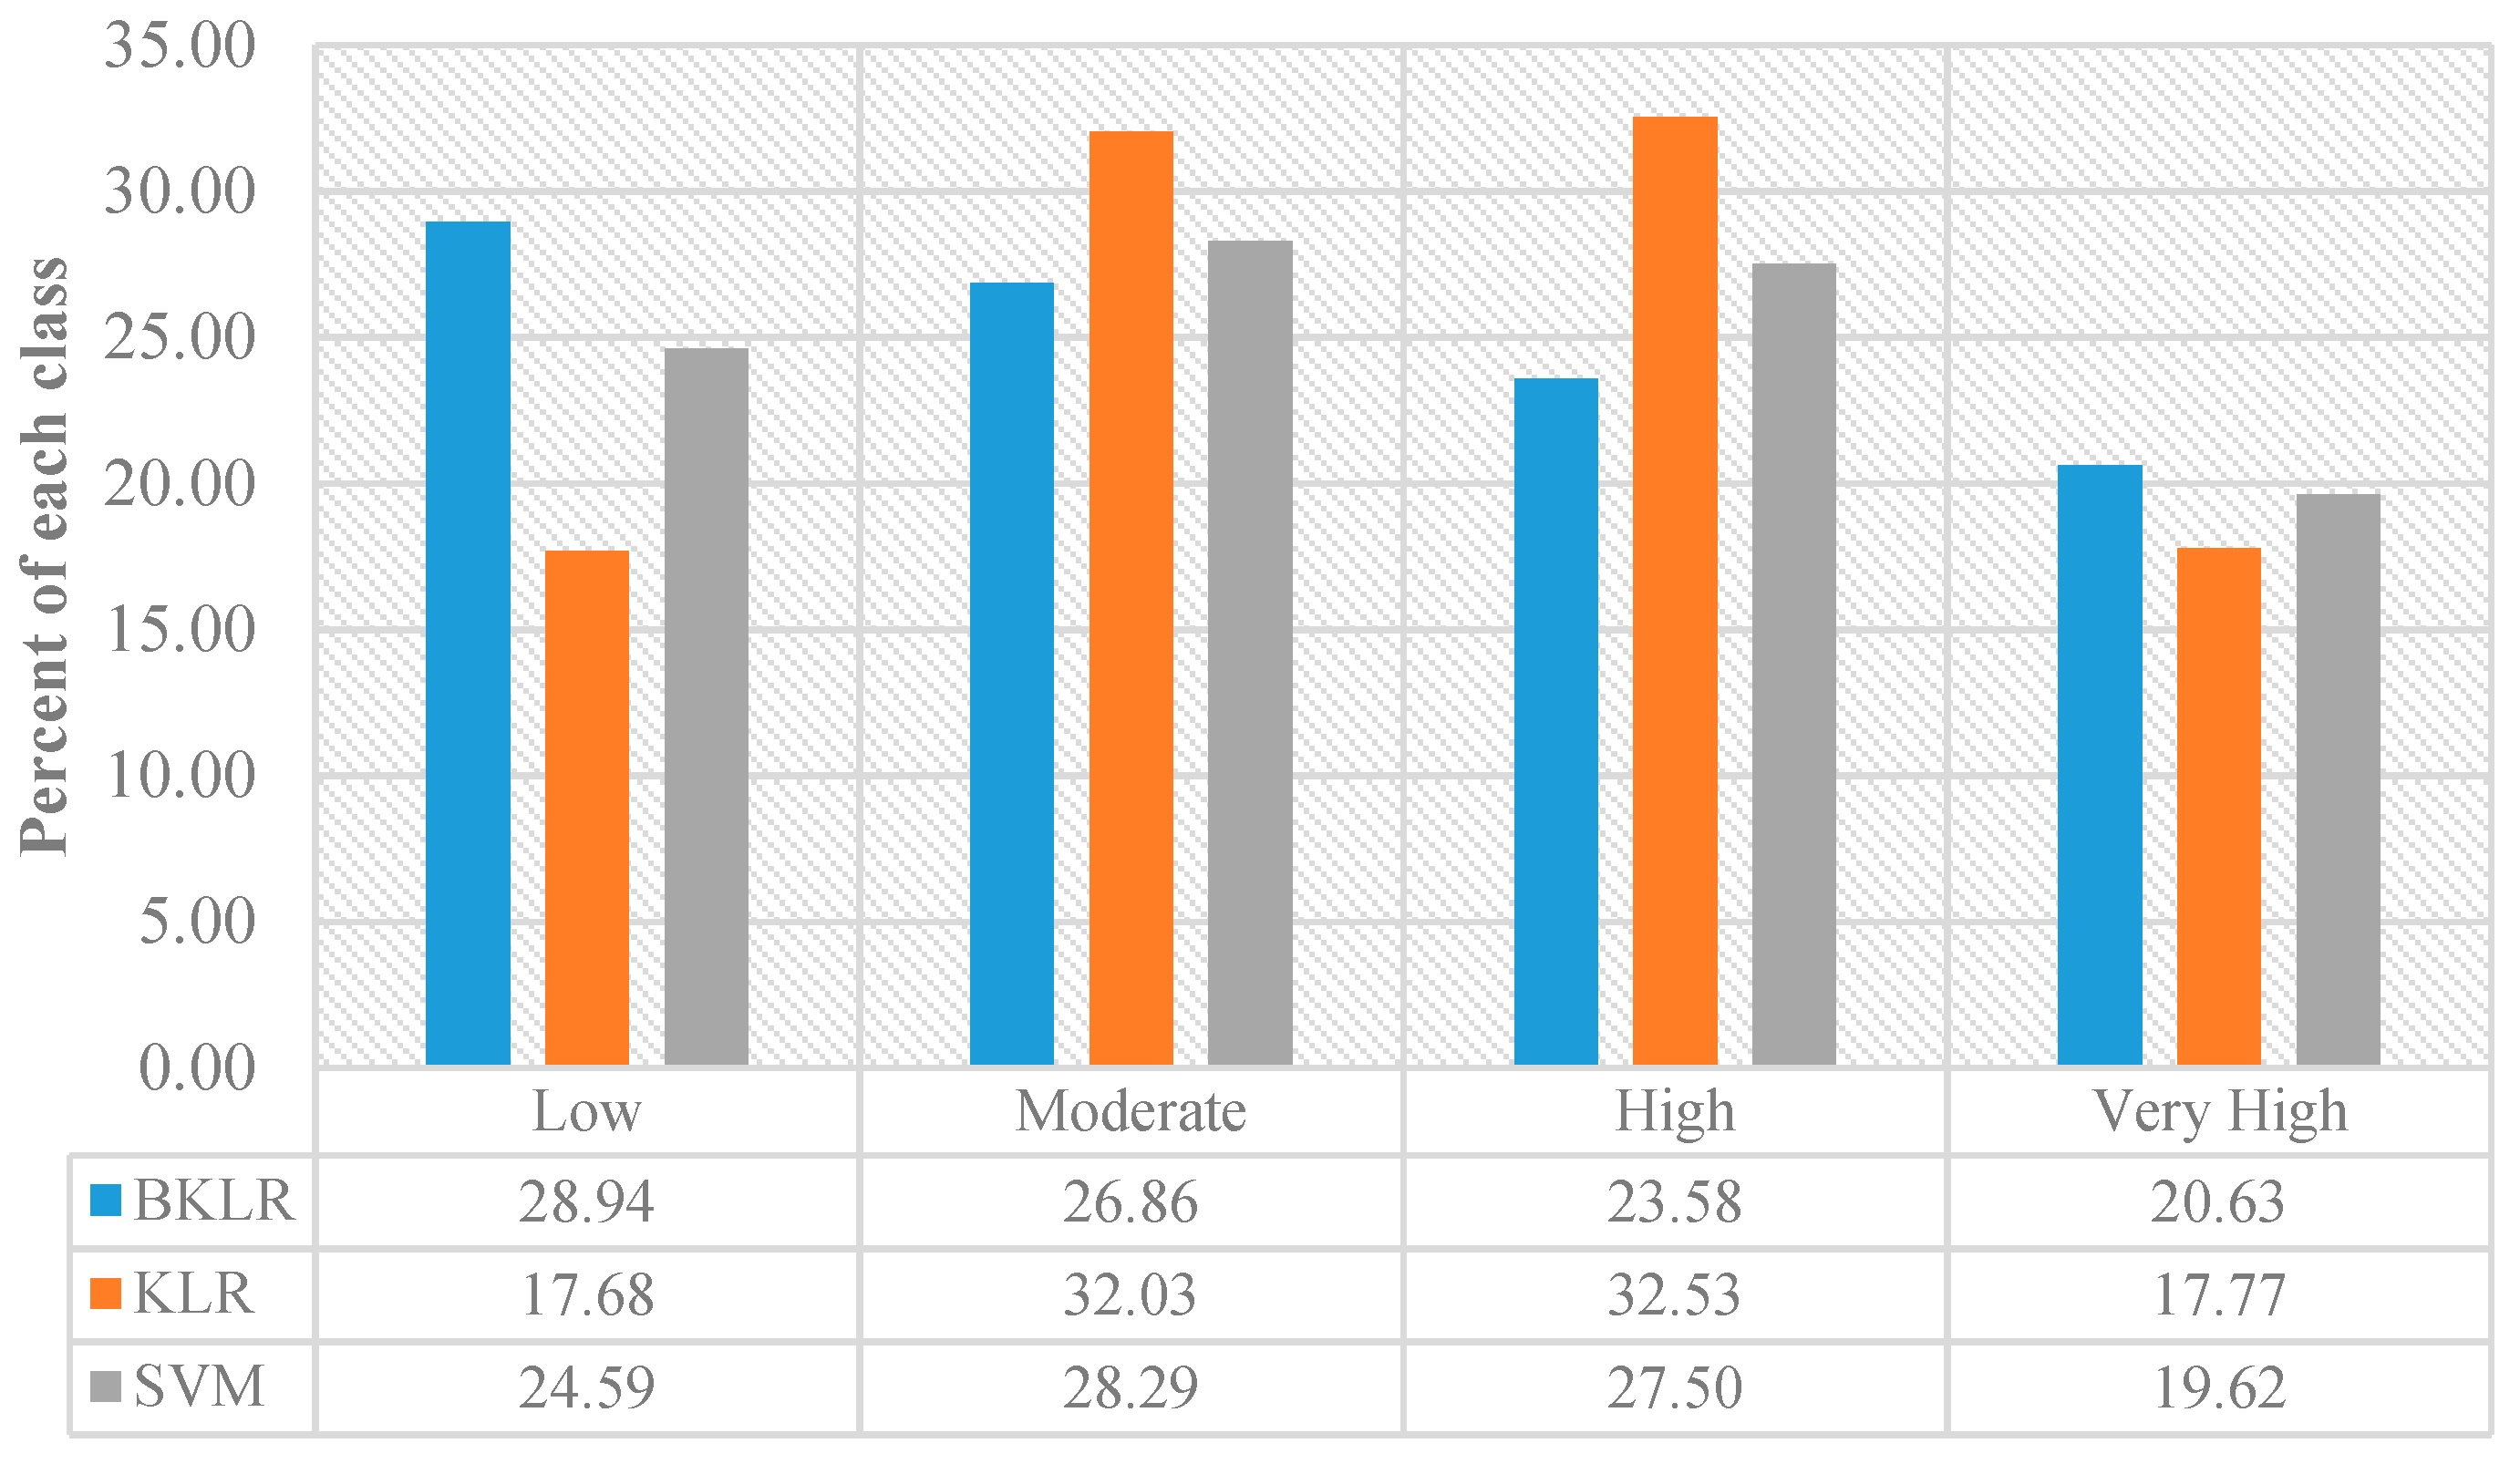
4.2. Generation of Landslide Susceptibility Maps
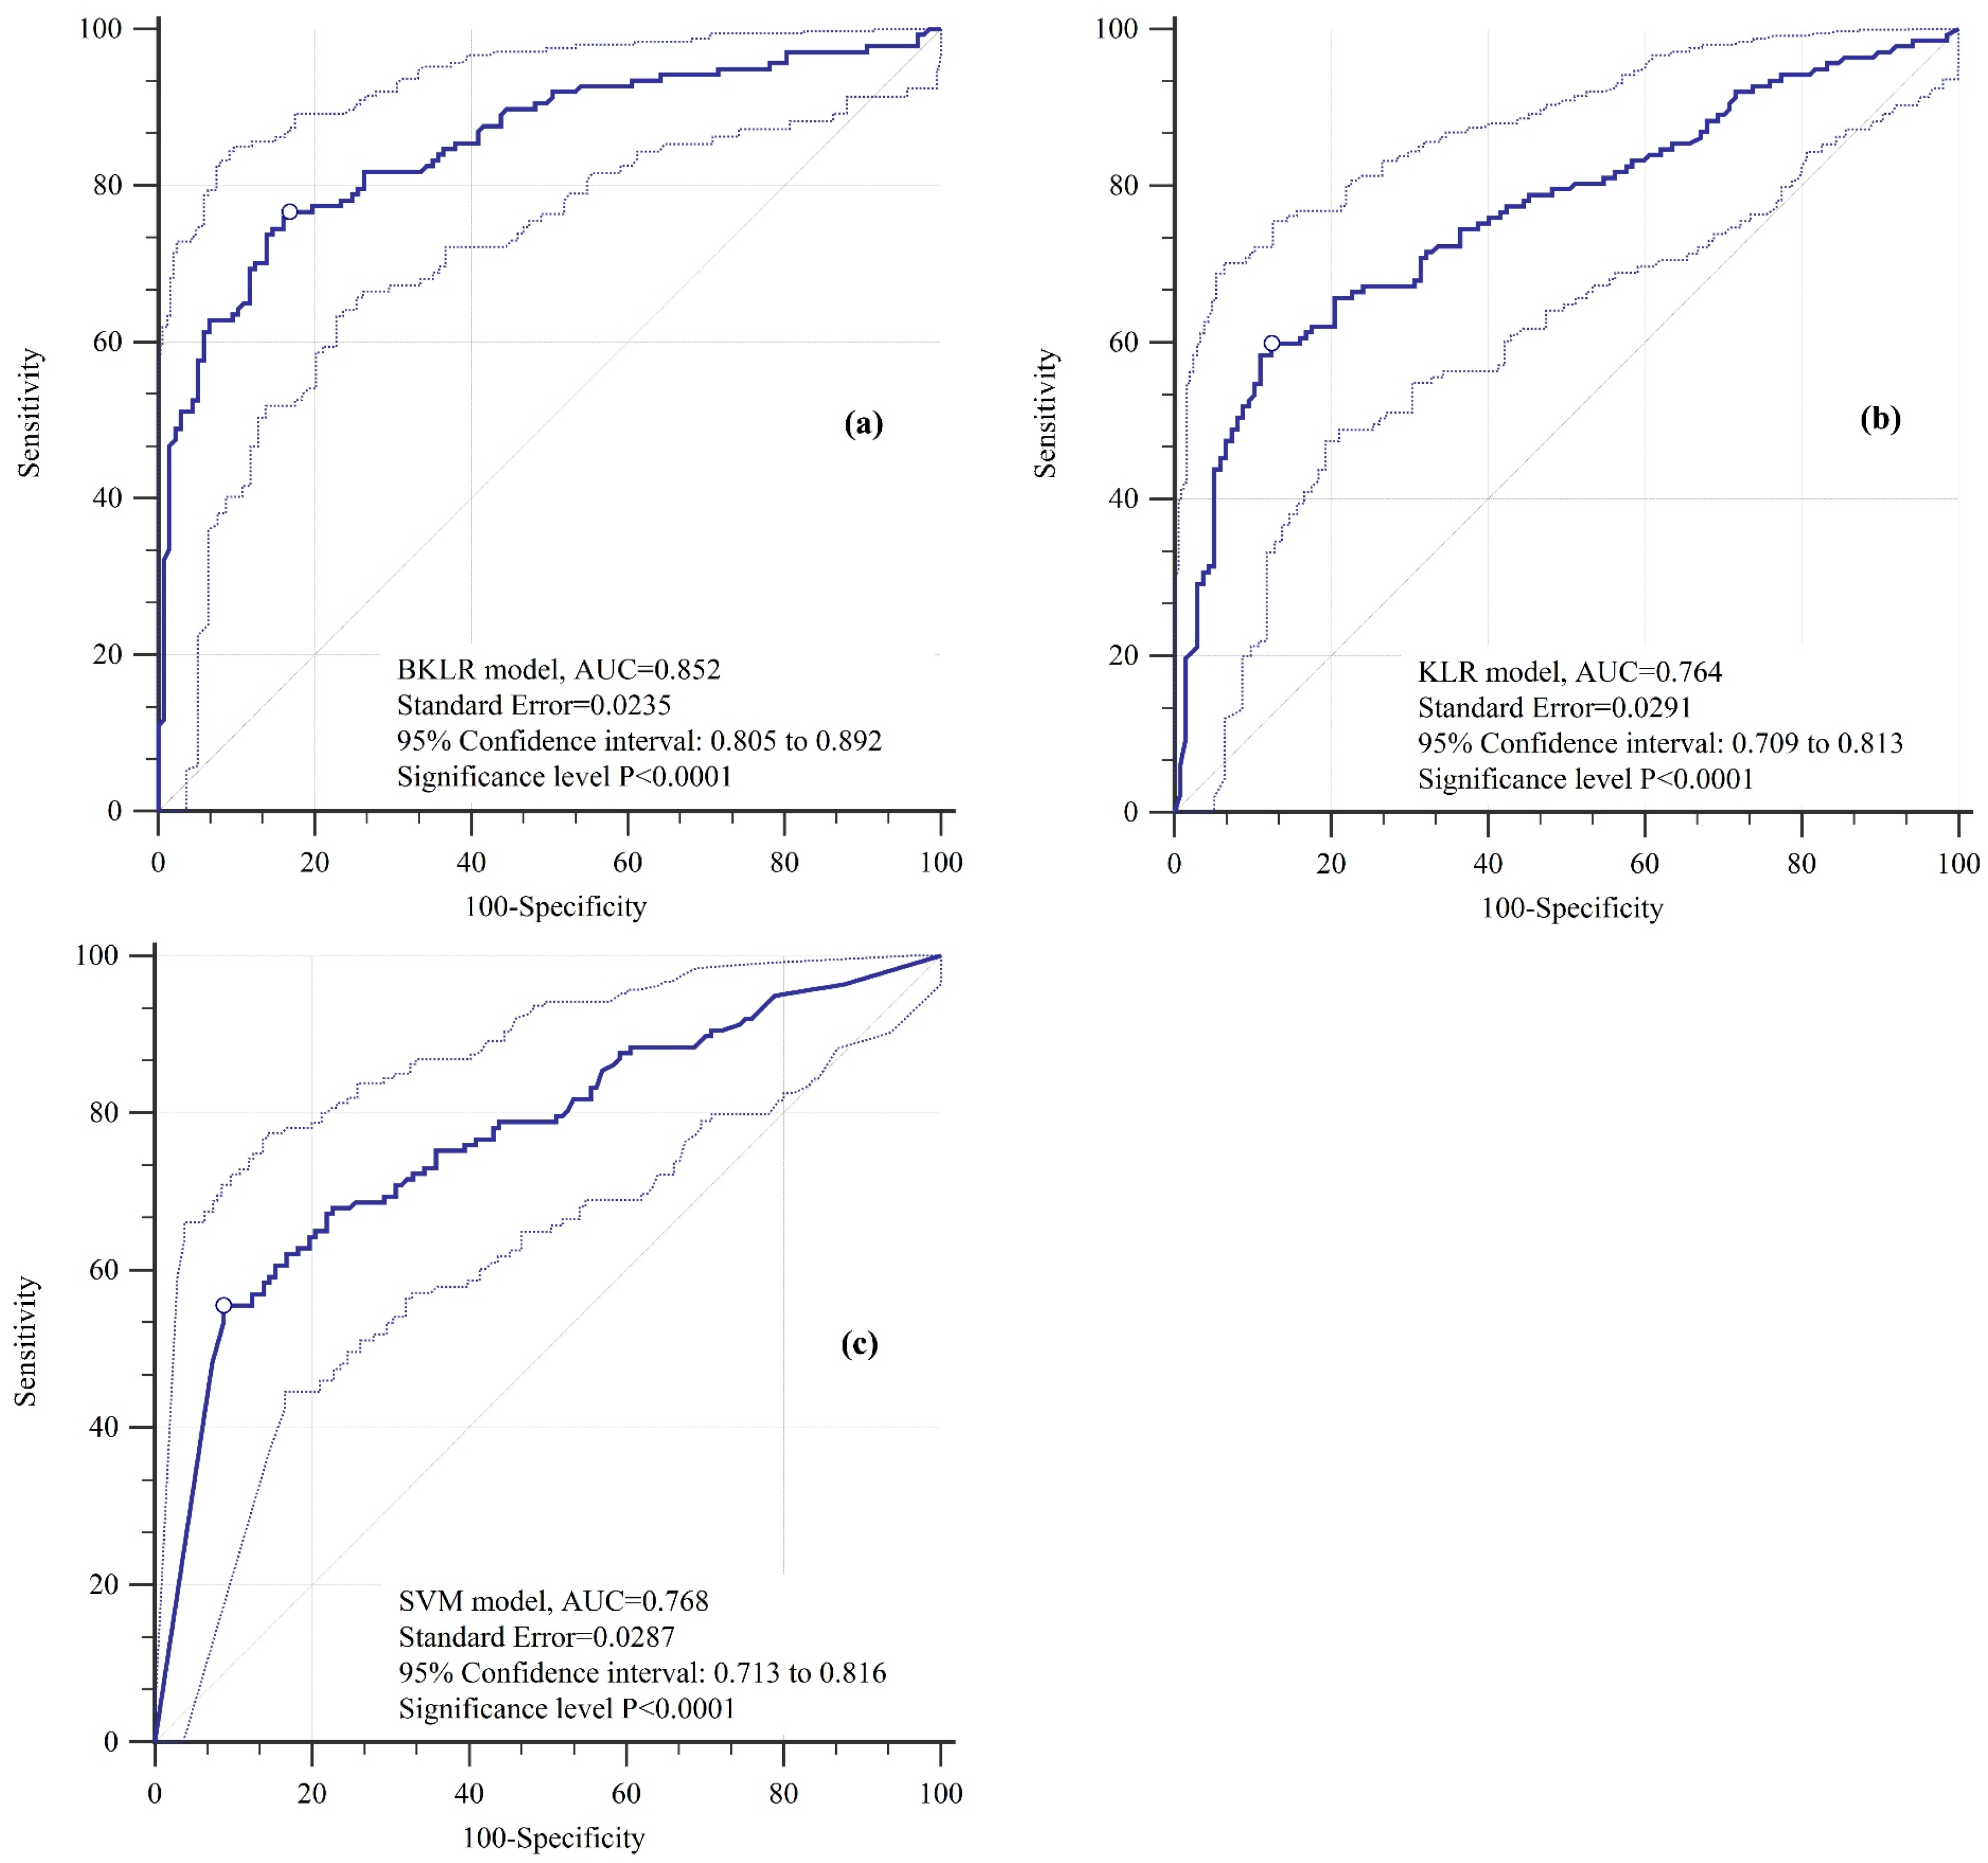
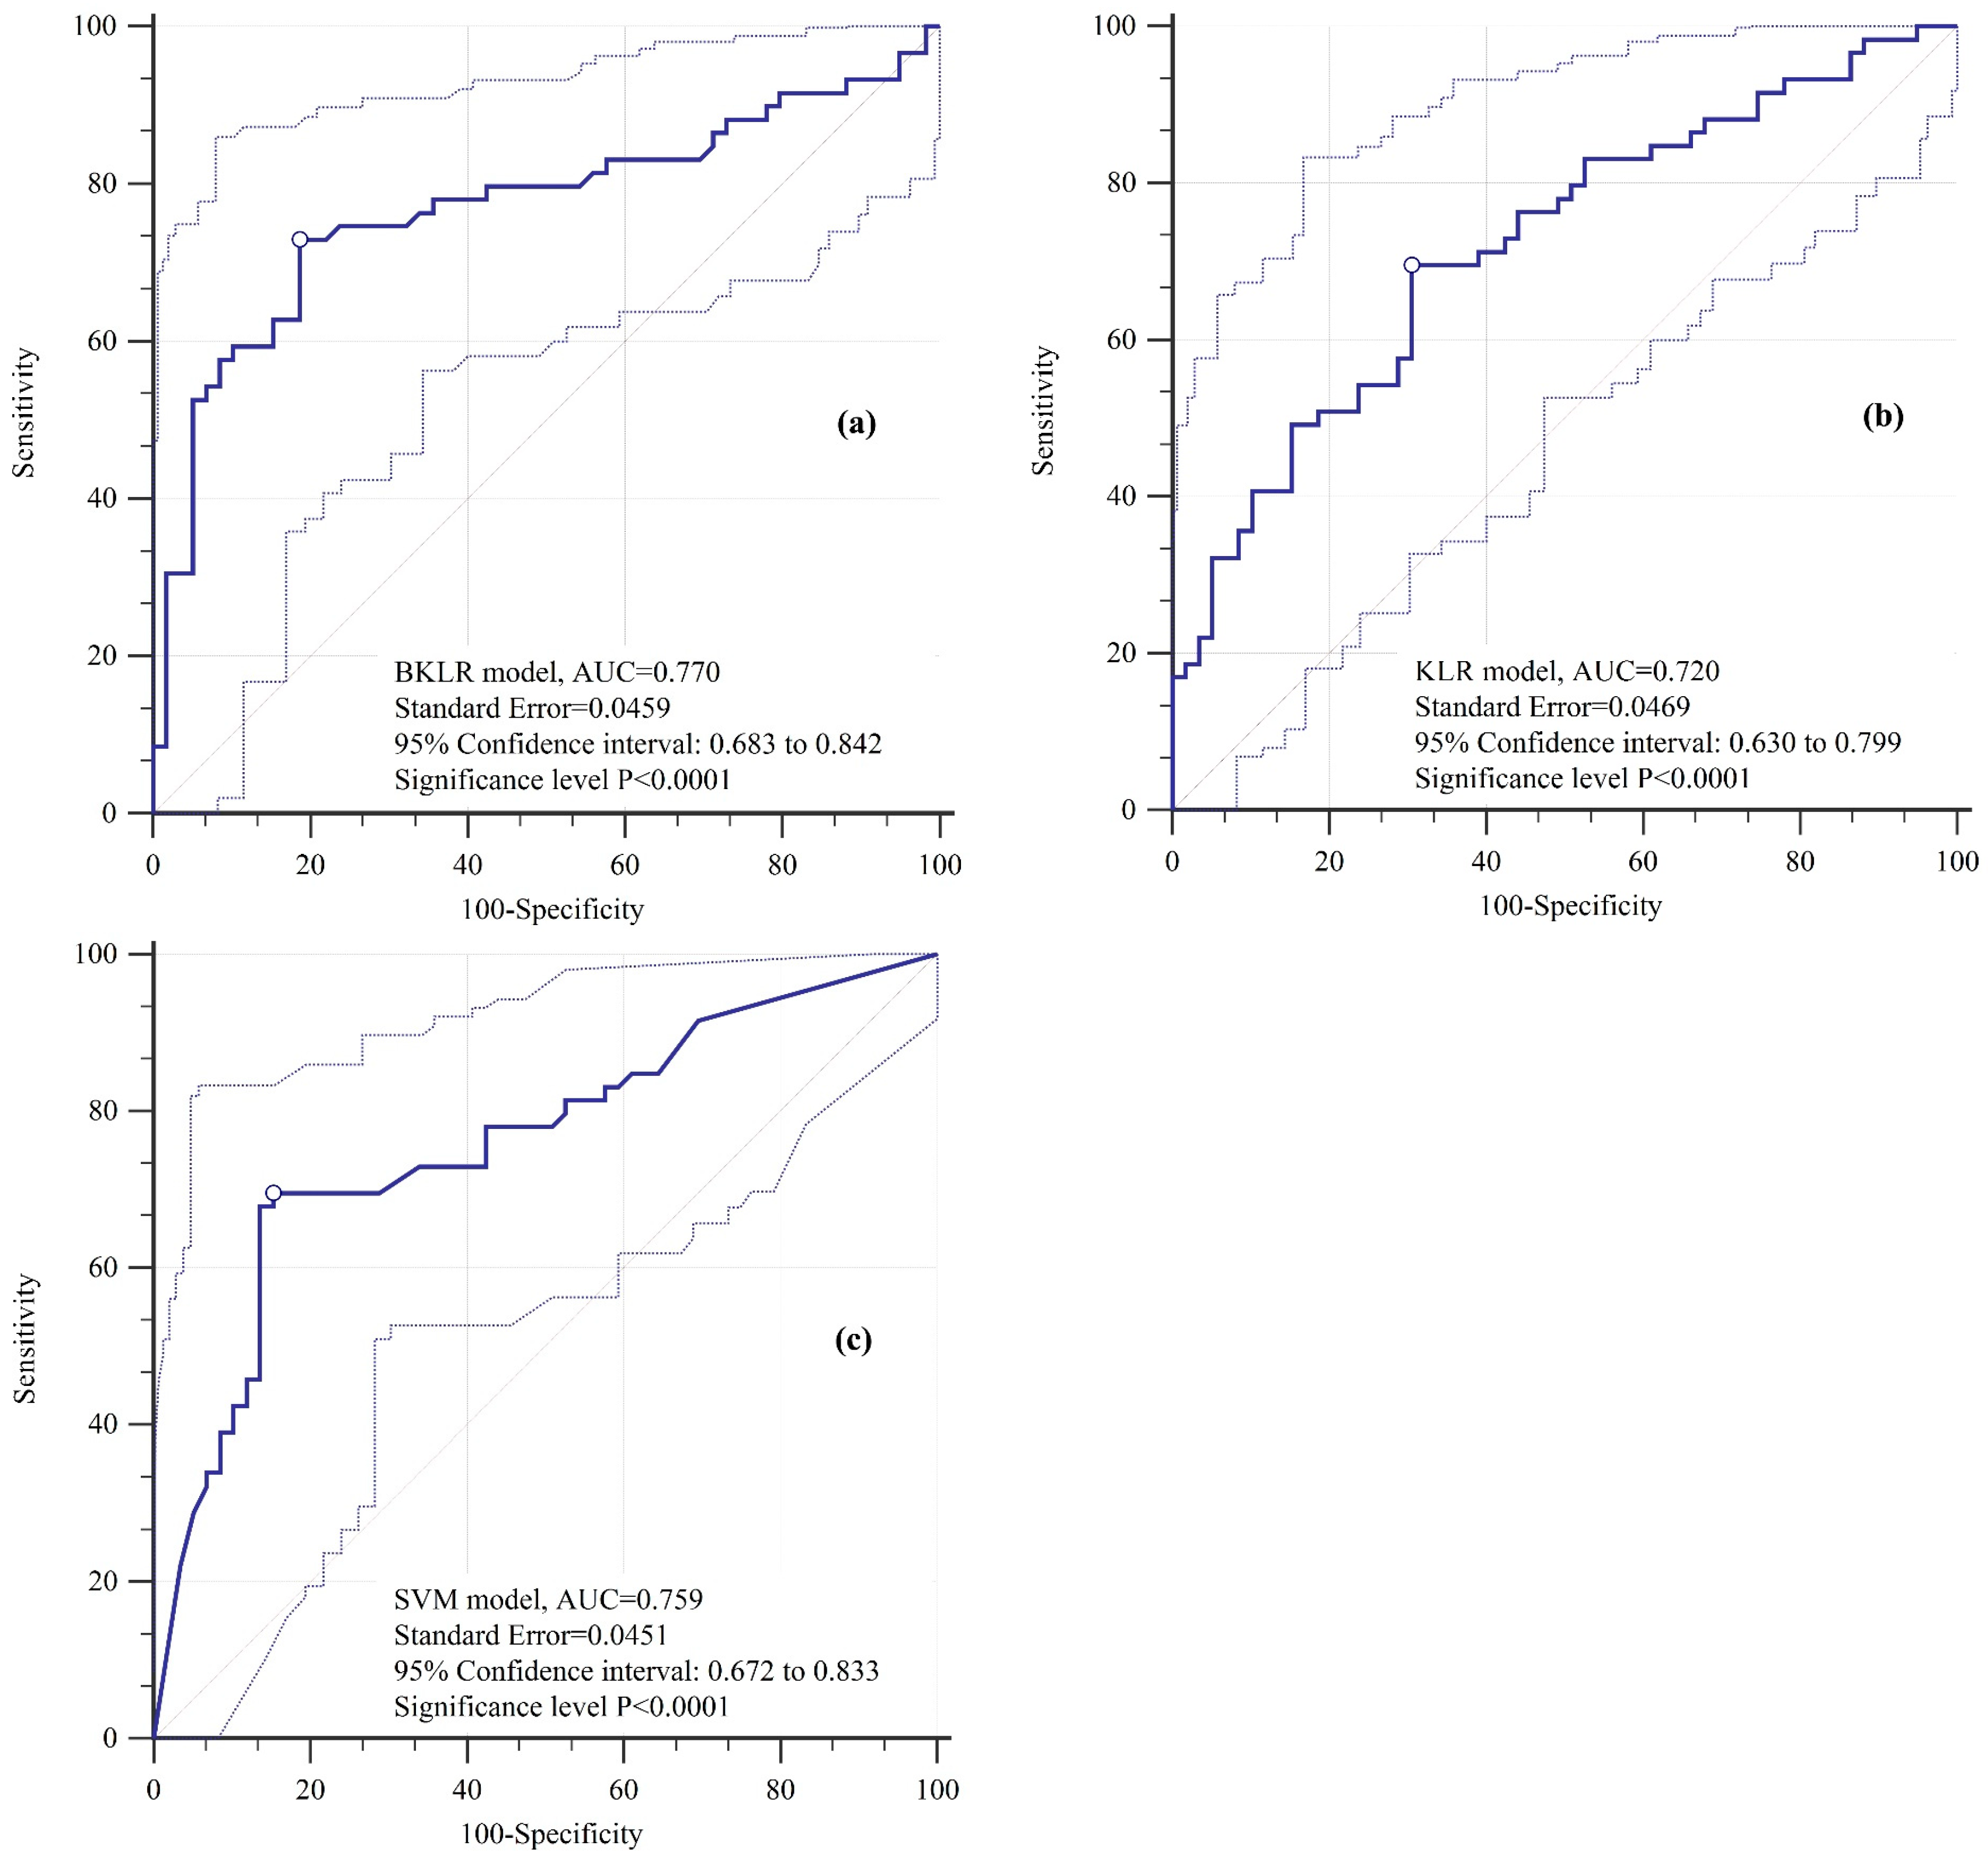
4.3. Validation and Comparison of Models
5. Discussion
6. Conclusions
Author Contributions
Acknowledgments
Conflicts of Interest
References
- Malamud, B.D.; Turcotte, D.L.; Guzzetti, F.; Reichenbach, P. Landslide inventories and their statistical properties. Earth Surf. Process. Landf. 2004, 29, 687–711. [Google Scholar] [CrossRef]
- Glade, T. The Temporal and Spatial Occurrence of Rainstorm-Triggered Landslide Events in New Zealand: An Investigation into the Frequency, Magnitude and Characteristics of Landslide Events and Their Relationship with Climatic and Terrain Characteristics: A Thesis Submitted [to the] Victoria University of Wellington in Fulfilment of the Requirements for the Degree of Doctor of Philosophy in Physical Geography; Victoria University of Wellington: Kelburn, New Zealand, 1997. [Google Scholar]
- Mohammady, M.; Pourghasemi, H.R.; Pradhan, B. Landslide susceptibility mapping at golestan province, iran: A comparison between frequency ratio, dempster–shafer, and weights-of-evidence models. J. Asian Earth Sci. 2012, 61, 221–236. [Google Scholar] [CrossRef]
- Sassa, K.; Canuti, P. Landslides-Disaster Risk Reduction; Springer Science & Business Media: Berlin, Germany, 2008. [Google Scholar]
- Quan-min, X.; Xiang, B.; Yuan-you, X. Systematic analysis of risk evaluation of landslide hazard. Rock Soil Mech. 2005, 26, 71–74. [Google Scholar]
- Pradhan, B.; Lee, S. Delineation of landslide hazard areas on penang island, malaysia, by using frequency ratio, logistic regression, and artificial neural network models. Environ. Earth Sci. 2010, 60, 1037–1054. [Google Scholar] [CrossRef]
- Tien Bui, D.; Lofman, O.; Revhaug, I.; Dick, O. Landslide susceptibility analysis in the hoa binh province of vietnam using statistical index and logistic regression. Nat. Hazards 2011, 59, 1413–1444. [Google Scholar]
- Aditian, A.; Kubota, T.; Shinohara, Y. Comparison of GIS-based landslide susceptibility models using frequency ratio, logistic regression, and artificial neural network in a tertiary region of ambon, Indonesia. Geomorphology 2018, 318, 101–111. [Google Scholar] [CrossRef]
- Ding, Q.; Chen, W.; Hong, H. Application of frequency ratio, weights of evidence and evidential belief function models in landslide susceptibility mapping. Geocarto Int. 2017, 32, 619–639. [Google Scholar] [CrossRef]
- Zhang, Z.; Yang, F.; Chen, H.; Wu, Y.; Li, T.; Li, W.; Wang, Q.; Liu, P. GIS-based landslide susceptibility analysis using frequency ratio and evidential belief function models. Environ. Earth Sci. 2016, 75, 1–12. [Google Scholar] [CrossRef]
- Tien Bui, D.; Shahabi, H.; Shirzadi, A.; Chapi, K.; Alizadeh, M.; Chen, W.; Mohammadi, A.; Ahmad, B.; Panahi, M.; Hong, H.; et al. Landslide detection and susceptibility mapping by airsar data using support vector machine and index of entropy models in cameron highlands, malaysia. Remote Sens. 2018, 10, 1527. [Google Scholar] [CrossRef]
- Chen, W.; Pourghasemi, H.R.; Naghibi, S.A. A comparative study of landslide susceptibility maps produced using support vector machine with different kernel functions and entropy data mining models in China. Bull. Eng. Geol. Environ. 2018, 77, 647–664. [Google Scholar] [CrossRef]
- Tsangaratos, P.; Ilia, I.; Hong, H.; Chen, W.; Xu, C. Applying information theory and GIS-based quantitative methods to produce landslide susceptibility maps in nancheng county, China. Landslides 2017, 14, 1091–1111. [Google Scholar] [CrossRef]
- Youssef, A.M.; Al-Kathery, M.; Pradhan, B. Landslide susceptibility mapping at al-hasher area, jizan (saudi arabia) using gis-based frequency ratio and index of entropy models. Geosci. J. 2015, 19, 113–134. [Google Scholar] [CrossRef]
- Devkota, K.C.; Regmi, A.D.; Pourghasemi, H.R.; Yoshida, K.; Pradhan, B.; Ryu, I.C.; Dhital, M.R.; Althuwaynee, O.F. Landslide susceptibility mapping using certainty factor, index of entropy and logistic regression models in gis and their comparison at mugling–narayanghat road section in nepal himalaya. Nat. Hazards 2013, 65, 135–165. [Google Scholar] [CrossRef]
- Roşian, G.; Csaba, H.; KingaOlga, R.; Boţan, C.; Gavrilă, I.G. Assessing landslide vulnerability using bivariate statistical analysis and the frequency ratio model. Case study: Transylvanian plain (Romania). Z. Geomorphol. 2016, 60, 359–371. [Google Scholar] [CrossRef]
- Felicísimo, Á.M.; Cuartero, A.; Remondo, J.; Quirós, E. Mapping landslide susceptibility with logistic regression, multiple adaptive regression splines, classification and regression trees, and maximum entropy methods: A comparative study. Landslides 2013, 10, 175–189. [Google Scholar] [CrossRef]
- Shirzadi, A.; Chapi, K.; Shahabi, H.; Solaimani, K.; Kavian, A.; Ahmad, B.B. Rock fall susceptibility assessment along a mountainous road: An evaluation of bivariate statistic, analytical hierarchy process and frequency ratio. Environ. Earth Sci. 2017, 76, 152. [Google Scholar] [CrossRef]
- Pourghasemi, H.R.; Rossi, M. Landslide susceptibility modeling in a landslide prone area in mazandarn province, north of Iran: A comparison between GLM, GAM, MARS, and M-AHP methods. Theor. Appl. Climatol. 2016, 130, 609–633. [Google Scholar] [CrossRef]
- Nicu, I.C. Application of analytic hierarchy process, frequency ratio, and statistical index to landslide susceptibility: An approach to endangered cultural heritage. Environ. Earth Sci. 2018, 77, 79. [Google Scholar] [CrossRef]
- Razavizadeh, S.; Solaimani, K.; Massironi, M.; Kavian, A. Mapping landslide susceptibility with frequency ratio, statistical index, and weights of evidence models: A case study in northern Iran. Environ. Earth Sci. 2017, 76, 499. [Google Scholar] [CrossRef]
- Althuwaynee, O.F.; Pradhan, B.; Park, H.-J.; Lee, J.H. A novel ensemble bivariate statistical evidential belief function with knowledge-based analytical hierarchy process and multivariate statistical logistic regression for landslide susceptibility mapping. Catena 2014, 114, 21–36. [Google Scholar] [CrossRef]
- Pourghasemi, H.R.; Kerle, N. Random forests and evidential belief function-based landslide susceptibility assessment in western mazandaran province, iran. Environ. Earth Sci. 2016, 75, 185. [Google Scholar] [CrossRef]
- Prefac, Z.; Dumitru, S.; Chendeș, V.; Sîrodoev, I.; Cracu, G. Assessment of landslide susceptibility using the certainty factor model: Răşcuţa catchment (curvature subcarpathians) case study. Carpath. J. Earth Environ. Sci. 2016, 11, 617–626. [Google Scholar]
- Chen, W.; Xie, X.; Peng, J.; Shahabi, H.; Hong, H.; Tien Bui, D.; Duan, Z.; Li, S.; Zhu, A.-X. Gis-based landslide susceptibility evaluation using a novel hybrid integration approach of bivariate statistical based random forest method. CATENA 2018, 164, 135–149. [Google Scholar] [CrossRef]
- Chen, W.; Pourghasemi, H.R.; Zhao, Z. A gis-based comparative study of dempster-shafer, logistic regression and artificial neural network models for landslide susceptibility mapping. Geocarto Int. 2017, 32, 367–385. [Google Scholar] [CrossRef]
- Erfanian, M.; Farajollahi, H.; Souri, M.; Shirzadi, A. Comparing the efficiency of weight of evidence, logistic regression and frequency ratio methods for mapping groundwater spring potential in ghelgazi watershed, kordestan province of iran. JWSS-Isfahan Univ. Technol. 2016, 20, 59–72. [Google Scholar] [CrossRef]
- Shahabi, H.; Hashim, M.; Ahmad, B.B. Remote sensing and gis-based landslide susceptibility mapping using frequency ratio, logistic regression, and fuzzy logic methods at the central zab basin, Iran. Environ. Earth Sci. 2015, 73, 8647–8668. [Google Scholar] [CrossRef]
- Mandal, S.; Mandal, K. Modeling and mapping landslide susceptibility zones using gis based multivariate binary logistic regression (lr) model in the rorachu river basin of eastern Sikkim Himalaya, India. Model. Earth Syst. Environ. 2018, 4, 69–88. [Google Scholar] [CrossRef]
- Pradhan, B. A comparative study on the predictive ability of the decision tree, support vector machine and neuro-fuzzy models in landslide susceptibility mapping using GIS. Comput. Geosci. 2013, 51, 350–365. [Google Scholar] [CrossRef] [Green Version]
- Oh, H.J.; Pradhan, B. Application of a neuro-fuzzy model to landslide-susceptibility mapping for shallow landslides in a tropical hilly area. Comput. Geosci. 2011, 37, 1264–1276. [Google Scholar] [CrossRef]
- Chen, W.; Panahi, M.; Tsangaratos, P.; Shahabi, H.; Ilia, I.; Panahi, S.; Li, S.; Jaafari, A.; Ahmad, B.B. Applying population-based evolutionary algorithms and a neuro-fuzzy system for modeling landslide susceptibility. CATENA 2019, 172, 212–231. [Google Scholar] [CrossRef]
- Tien Bui, D.; Tuan, T.A.; Klempe, H.; Pradhan, B.; Revhaug, I. Spatial prediction models for shallow landslide hazards: A comparative assessment of the efficacy of support vector machines, artificial neural networks, kernel logistic regression, and logistic model tree. Landslides 2016, 13, 361–378. [Google Scholar] [CrossRef]
- Ngadisih Bhandary, N.P.; Yatabe, R.; Dahal, R.K. Logistic Regression and Artificial Neural Network Models for Mapping of Regional-Scale Landslide Susceptibility in Volcanic Mountains of West Java (Indonesia). In Proceedings of the International Symposium on Earthhazard and Disaster Mitigation: The Symposium on Earthquake and Related Geohazard Research for Disaster Risk Reduction, Bandung, Indonesia, 11–12 October 2016; p. 060001. [Google Scholar]
- Chen, W.; Shahabi, H.; Shirzadi, A.; Hong, H.; Akgun, A.; Tian, Y.; Liu, J.; Zhu, A.-X.; Li, S. Novel hybrid artificial intelligence approach of bivariate statistical-methods-based kernel logistic regression classifier for landslide susceptibility modeling. Bull. Eng. Geol. Environ. 2018, 1–23. [Google Scholar] [CrossRef]
- Zabihi, M.; Pourghasemi, H.R.; Pourtaghi, Z.S.; Behzadfar, M. Gis-based multivariate adaptive regression spline and random forest models for groundwater potential mapping in iran. Environ. Earth Sci. 2016, 75, 1–19. [Google Scholar] [CrossRef]
- Nefeslioglu, H.; Sezer, E.; Gokceoglu, C.; Bozkir, A.; Duman, T. Assessment of landslide susceptibility by decision trees in the metropolitan area of istanbul, turkey. Math. Probl. Eng. 2010, 2010. [Google Scholar] [CrossRef]
- Hong, H.; Pradhan, B.; Xu, C.; Bui, D.T. Spatial prediction of landslide hazard at the yihuang area (China) using two-class kernel logistic regression, alternating decision tree and support vector machines. Catena 2015, 133, 266–281. [Google Scholar] [CrossRef]
- Chen, W.; Xie, X.; Wang, J.; Pradhan, B.; Hong, H.; Tien Bui, D.; Duan, Z.; Ma, J. A comparative study of logistic model tree, random forest, and classification and regression tree models for spatial prediction of landslide susceptibility. CATENA 2017, 151, 147–160. [Google Scholar] [CrossRef]
- Chen, W.; Xie, X.; Peng, J.; Wang, J.; Duan, Z.; Hong, H. Gis-based landslide susceptibility modelling: A comparative assessment of kernel logistic regression, naïve-bayes tree, and alternating decision tree models. Geomat. Nat. Hazards Risk 2017, 8, 950–973. [Google Scholar] [CrossRef]
- Huang, Y.; Zhao, L. Review on landslide susceptibility mapping using support vector machines. Catena 2018, 165, 520–529. [Google Scholar] [CrossRef]
- Lin, G.F.; Chang, M.J.; Huang, Y.C.; Ho, J.Y. Assessment of susceptibility to rainfall-induced landslides using improved self-organizing linear output map, support vector machine, and logistic regression. Eng. Geol. 2017, 224, 62–74. [Google Scholar] [CrossRef]
- Youssef, A.M.; Pourghasemi, H.R.; Pourtaghi, Z.S.; Al-Katheeri, M.M. Landslide susceptibility mapping using random forest, boosted regression tree, classification and regression tree, and general linear models and comparison of their performance at Wadi Tayyah Basin, Asir Region, Saudi Arabia. Landslides 2016, 13, 839–856. [Google Scholar] [CrossRef]
- Chen, W.; Pourghasemi, H.R.; Panahi, M.; Kornejady, A.; Wang, J.; Xie, X.; Cao, S. Spatial prediction of landslide susceptibility using an adaptive neuro-fuzzy inference system combined with frequency ratio, generalized additive model, and support vector machine techniques. Geomorphology 2017, 297, 69–85. [Google Scholar] [CrossRef]
- Nasiri Aghdam, I.; Varzandeh, M.H.M.; Pradhan, B. Landslide susceptibility mapping using an ensemble statistical index (Wi) and adaptive neuro-fuzzy inference system (ANFIS) model at alborz mountains (Iran). Environ. Earth Sci. 2016, 75, 553. [Google Scholar] [CrossRef]
- Tien Bui, D.; Pradhan, B.; Lofman, O.; Revhaug, I.; Dick, O.B. Landslide susceptibility mapping at hoa binh province (Vietnam) using an adaptive neuro-fuzzy inference system and GIS. Comput. Geosci. 2012, 45, 199–211. [Google Scholar] [CrossRef]
- Pham, B.T.; Bui, D.T.; Pourghasemi, H.R.; Indra, P.; Dholakia, M. Landslide susceptibility assesssment in the uttarakhand area (India) using GIS: A comparison study of prediction capability of naïve bayes, multilayer perceptron neural networks, and functional trees methods. Theor. Appl. Climatol. 2015, 1–19. [Google Scholar] [CrossRef]
- Tsangaratos, P.; Ilia, I. Comparison of a logistic regression and naïve bayes classifier in landslide susceptibility assessments: The influence of models complexity and training dataset size. CATENA 2016, 145, 164–179. [Google Scholar] [CrossRef]
- Tien Bui, D.; Pradhan, B.; Revhaug, I.; Nguyen, D.B.; Pham, H.V.; Bui, Q.N. A novel hybrid evidential belief function-based fuzzy logic model in spatial prediction of rainfall-induced shallow landslides in the lang son city area (Vietnam). Geomat. Nat. Hazards Risk 2015, 6, 243–271. [Google Scholar]
- Chen, W.; Shirzadi, A.; Shahabi, H.; Ahmad, B.B.; Zhang, S.; Hong, H.; Zhang, N. A novel hybrid artificial intelligence approach based on the rotation forest ensemble and naïve bayes tree classifiers for a landslide susceptibility assessment in langao county, china. Geomat. Nat. Hazards Risk 2017, 8, 1955–1977. [Google Scholar] [CrossRef]
- Zhou, C.; Yin, K.; Cao, Y.; Ahmed, B.; Li, Y.; Catani, F.; Pourghasemi, H.R. Landslide susceptibility modeling applying machine learning methods: A case study from longju in the three gorges reservoir area, China. Comput. Geosci. 2018, 112, 23–37. [Google Scholar] [CrossRef]
- Süzen, M.L.; Kaya, B.Ş. Evaluation of environmental parameters in logistic regression models for landslide susceptibility mapping. Int. J. Digit. Earth 2012, 5, 338–355. [Google Scholar] [CrossRef]
- Breiman, L. Bagging predictors. Mach. Learn. 1996, 24, 123–140. [Google Scholar] [CrossRef] [Green Version]
- Mbogning, C.; Broët, P. Bagging survival tree procedure for variable selection and prediction in the presence of nonsusceptible patients. BMC Bioinform. 2016, 17, 1–21. [Google Scholar] [CrossRef] [PubMed]
- Bühlmann, P. Bagging, boosting and ensemble methods. In Handbook of Computational Statistics; Springer: Berlin, Germany, 2012; pp. 985–1022. [Google Scholar]
- Sugiyama, M.; Simm, J. A computationally-efficient alternative to kernel logistic regression. In Proceedings of the IEEE International Workshop on Machine Learning for Signal Processing, Tokyo, Japan, 29 August–1 September 2010; pp. 124–129. [Google Scholar]
- Mercer, J. Functions of positive and negative type, and their connection with the theory of integral equations. Philos. Trans. R. Soc. London Ser. A Contain. Pap. A Math. Phys. Character 1909, 209, 415–446. [Google Scholar] [CrossRef]
- Chen, W.; Panahi, M.; Pourghasemi, H.R. Performance evaluation of GIS-based new ensemble data mining techniques of adaptive neuro-fuzzy inference system (ANFIS) with genetic algorithm (GA), differential evolution (DE), and particle swarm optimization (PSO) for landslide spatial modelling. CATENA 2017, 157, 310–324. [Google Scholar] [CrossRef]
- Isabelle, G.; Elisseeff, A. An introduction to variable and feature selection. J. Mach. Learn. Res. 2003, 3, 1157–1182. [Google Scholar]
- Witten, I.H.; Frank, E.; Mark, A.H. Data Mining: Practical Machine Learning Tools and Techniques, 3rd ed.; Morgan kaufmann: Burlington, MA, USA, 2011. [Google Scholar]
- Chen, W.; Li, H.; Hou, E.; Wang, S.; Wang, G.; Panahi, M.; Li, T.; Peng, T.; Guo, C.; Niu, C.; et al. Gis-based groundwater potential analysis using novel ensemble weights-of-evidence with logistic regression and functional tree models. Sci. Total Environ. 2018, 634, 853–867. [Google Scholar] [CrossRef]
- Pourghasemi, H.R.; Rahmati, O. Prediction of the landslide susceptibility: Which algorithm, which precision? CATENA 2018, 162, 177–192. [Google Scholar] [CrossRef]
- Pham, B.T.; Prakash, I.; Bui, D.T. Spatial prediction of landslides using a hybrid machine learning approach based on random subspace and classification and regression trees. Geomorphology 2018, 303, 256–270. [Google Scholar] [CrossRef]
- Chung, C.-J.F.; Fabbri, A.G. Validation of spatial prediction models for landslide hazard mapping. Nat. Hazards 2003, 30, 451–472. [Google Scholar] [CrossRef]
- Chen, W.; Zhang, S.; Li, R.; Shahabi, H. Performance evaluation of the gis-based data mining techniques of best-first decision tree, random forest, and naïve bayes tree for landslide susceptibility modeling. Sci. Total Environ. 2018, 644, 1006–1018. [Google Scholar] [CrossRef]
- Chen, W.; Yan, X.; Zhao, Z.; Hong, H.; Bui, D.T.; Pradhan, B. Spatial prediction of landslide susceptibility using data mining-based kernel logistic regression, naive bayes and rbfnetwork models for the long county area (China). Bull. Eng. Geol. Environ. 2018, 1–20. [Google Scholar] [CrossRef]
- Chen, W.; Shahabi, H.; Shirzadi, A.; Li, T.; Guo, C.; Hong, H.; Li, W.; Pan, D.; Hui, J.; Ma, M.; et al. A novel ensemble approach of bivariate statistical-based logistic model tree classifier for landslide susceptibility assessment. Geocarto Int. 2018, 33, 1398–1420. [Google Scholar] [CrossRef]
- Yesilnacar, E. The Application of Computational Intelligence to Landslide Susceptibility Mapping in Turkey. Ph.D. Thesis, Department of Geomatics, University of Melbourne, Victoria, Australia, 2005; p. 423. [Google Scholar]
- Gruber, S.; Haeberli, W. Permafrost in steep bedrock slopes and its temperature-related destabilization following climate change. J. Geophys. Res. Earth Surf. 2007, 112. [Google Scholar] [CrossRef] [Green Version]
- Buma, J.; Dehn, M. A method for predicting the impact of climate change on slope stability. Environ. Geol. 1998, 35, 190–196. [Google Scholar] [CrossRef]
- Zeng, Z.; Wang, H. Recognition of lithology and its use in identification of landslide-prone areas using remote sensing data. In Landslide Disaster Mitigation in Three Gorges Reservoir, China; Wang, F., Li, T., Eds.; Springer: Berlin/Heidelberg, Germany, 2009; pp. 487–496. [Google Scholar]
- Chen, W.; Peng, J.; Hong, H.; Shahabi, H.; Pradhan, B.; Liu, J.; Zhu, A.X.; Pei, X.; Duan, Z. Landslide susceptibility modelling using gis-based machine learning techniques for chongren county, Jiangxi province, China. Sci. Total Environ. 2018, 626, 1121–1135. [Google Scholar] [CrossRef] [PubMed]
- Ayalew, L.; Yamagishi, H.; Ugawa, N. Landslide susceptibility mapping using GIS-based weighted linear combination, the case in tsugawa area of agano river, Niigata prefecture, Japan. Landslides 2004, 1, 73–81. [Google Scholar] [CrossRef]
- Sasaki, Y. Shallow Landslide Process and Hazard Mapping Using a Soil Strength Probe; Engineering Geology for Society and Territory—Volume 2; Lollino, G., Giordan, D., Crosta, G.B., Corominas, J., Azzam, R., Wasowski, J., Sciarra, N., Eds.; Springer International Publishing: Cham, French, 2015; pp. 957–960. [Google Scholar]
- Magliulo, P.; Di Lisio, A.; Russo, F.; Zelano, A. Geomorphology and landslide susceptibility assessment using gis and bivariate statistics: A case study in southern italy. Nat. Hazards 2008, 47, 411–435. [Google Scholar] [CrossRef]
- Gokceoglu, C. Discussion on “combining landslide susceptibility maps obtained from frequency ratio, logistic regression, and artificial neural network models using aster images and gis” by choi et al. (2012), engineering geology, 124, 12–23. Eng. Geol. 2012, 129–130, 104–105. [Google Scholar] [CrossRef]
- Pham, B.T.; Prakash, I. A novel hybrid model of bagging-based naïve bayes trees for landslide susceptibility assessment. Bull. Eng. Geol. Environ. 2017. [Google Scholar] [CrossRef]


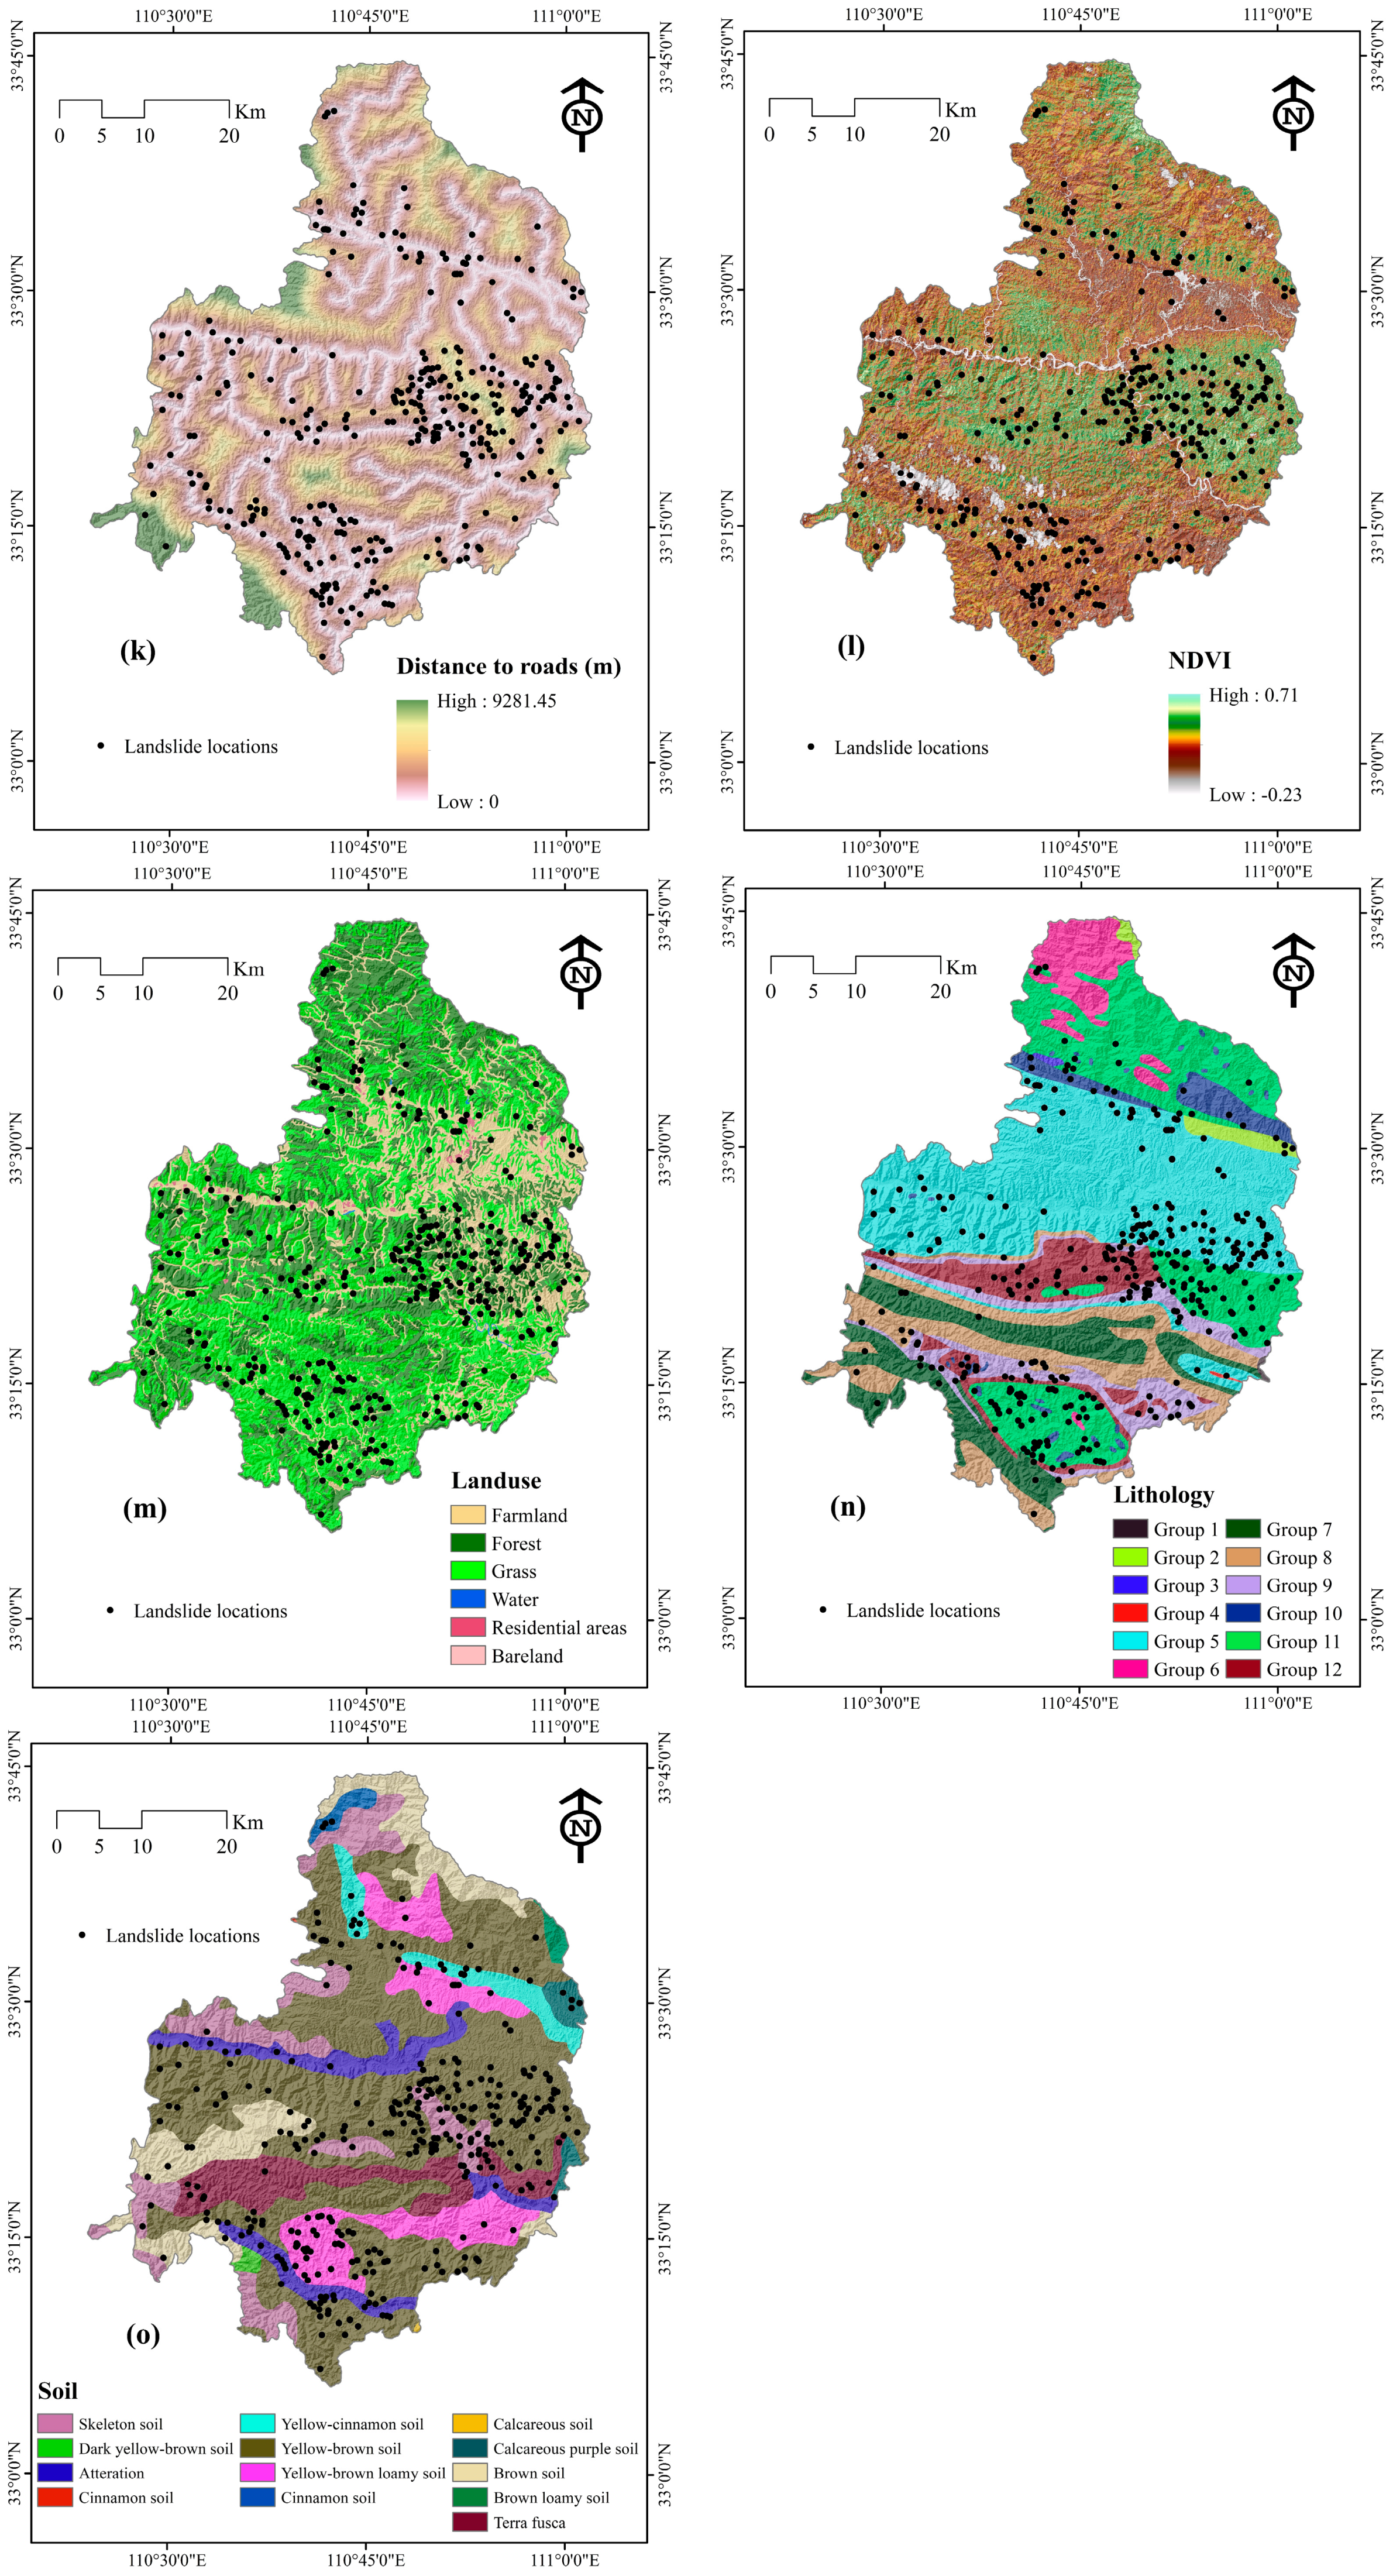
| Category | Factors | GIS Data Type | Scale or Resolution |
|---|---|---|---|
| Topographic factors | Altitude | ARC/INFO GRID | 30 × 30 m |
| Plan curvature | ARC/INFO GRID | 30 × 30 m | |
| Profile curvature | ARC/INFO GRID | 30 × 30 m | |
| Slope angle | ARC/INFO GRID | 30 × 30 m | |
| Slope aspect | ARC/INFO GRID | 30 × 30 m | |
| TWI | ARC/INFO GRID | 30 × 30 m | |
| SPI | ARC/INFO GRID | 30 × 30 m | |
| STI | ARC/INFO GRID | 30 × 30 m | |
| Environmental factors | Distance to rivers | ARC/INFO GRID | 30 × 30 m |
| Distance to roads | ARC/INFO GRID | 30 × 30 m | |
| NDVI | ARC/INFO GRID | 30 × 30 m | |
| Land use | ARC/INFO polygon coverage | 1:100,000 | |
| Soil | ARC/INFO polygon coverage | 1:1,000,000 | |
| Geological factors | Lithology | ARC/INFO polygon coverage | 1:200,000 |
| Distance to faults | ARC/INFO GRID | 30 × 30 m |
| Parameter | Model | ||
|---|---|---|---|
| BKLR | KLR | SVM | |
| True positive | 189 | 164 | 167 |
| True negative | 192 | 171 | 178 |
| False positive | 52 | 73 | 66 |
| False negative | 55 | 80 | 77 |
| Positive predictive rate (%) | 0.785 | 0.692 | 0.718 |
| Negative predictive rate (%) | 0.777 | 0.681 | 0.699 |
| Sensitivity (%) | 0.774 | 0.672 | 0.686 |
| Specificity (%) | 0.788 | 0.701 | 0.730 |
| Accuracy (%) | 0.781 | 0.686 | 0.708 |
| Kappa index | 0.562 | 0.372 | 0.416 |
| RMSE | 0.391 | 0.500 | 0.463 |
| Parameter | Model | ||
|---|---|---|---|
| BKLR | KLR | SVM | |
| True positive | 67 | 56 | 62 |
| True negative | 90 | 76 | 90 |
| False positive | 14 | 28 | 14 |
| False negative | 37 | 48 | 42 |
| Positive predictive rate (%) | 0.826 | 0.667 | 0.814 |
| Negative predictive rate (%) | 0.708 | 0.614 | 0.680 |
| Sensitivity (%) | 0.644 | 0.542 | 0.593 |
| Specificity (%) | 0.864 | 0.729 | 0.864 |
| Accuracy (%) | 0.754 | 0.636 | 0.729 |
| Kappa index | 0.509 | 0.371 | 0.458 |
| RMSE | 0.439 | 0.506 | 0.470 |
© 2018 by the authors. Licensee MDPI, Basel, Switzerland. This article is an open access article distributed under the terms and conditions of the Creative Commons Attribution (CC BY) license (http://creativecommons.org/licenses/by/4.0/).
Share and Cite
Chen, W.; Shahabi, H.; Zhang, S.; Khosravi, K.; Shirzadi, A.; Chapi, K.; Pham, B.T.; Zhang, T.; Zhang, L.; Chai, H.; et al. Landslide Susceptibility Modeling Based on GIS and Novel Bagging-Based Kernel Logistic Regression. Appl. Sci. 2018, 8, 2540. https://0-doi-org.brum.beds.ac.uk/10.3390/app8122540
Chen W, Shahabi H, Zhang S, Khosravi K, Shirzadi A, Chapi K, Pham BT, Zhang T, Zhang L, Chai H, et al. Landslide Susceptibility Modeling Based on GIS and Novel Bagging-Based Kernel Logistic Regression. Applied Sciences. 2018; 8(12):2540. https://0-doi-org.brum.beds.ac.uk/10.3390/app8122540
Chicago/Turabian StyleChen, Wei, Himan Shahabi, Shuai Zhang, Khabat Khosravi, Ataollah Shirzadi, Kamran Chapi, Binh Thai Pham, Tingyu Zhang, Lingyu Zhang, Huichan Chai, and et al. 2018. "Landslide Susceptibility Modeling Based on GIS and Novel Bagging-Based Kernel Logistic Regression" Applied Sciences 8, no. 12: 2540. https://0-doi-org.brum.beds.ac.uk/10.3390/app8122540