Mode Separation for Multimodal Ultrasonic Lamb Waves Using Dispersion Compensation and Independent Component Analysis of Forth-Order Cumulant

1
School of Electronic and Information Engineering, Nanjing University of Information Science and Technology, Nanjing 210044, China
2
Collaborative Innovation Center of Atmospheric Environment and Equipment Technology, Jiangsu Key Laboratory of Meteorological Exploration and Information Processing, Nanjing 210044, China
*
Author to whom correspondence should be addressed.
Appl. Sci. 2019, 9(3), 555; https://0-doi-org.brum.beds.ac.uk/10.3390/app9030555
Submission received: 31 December 2018
/
Revised: 1 February 2019
/
Accepted: 2 February 2019
/
Published: 7 February 2019
(This article belongs to the Special Issue Nondestructive Testing and Imaging Based on Electromagnetic Fields and Waves)
Abstract
:Ultrasonic Lamb wave testing has been successfully applied in nondestructive testing. However, because of Lamb wave multimodal and dispersion characteristics, the received signals are often multimodal and overlapping, which makes them very complicated. This paper proposes a mode separation method by combining dispersion compensation with the independent component analysis of fourth-order cumulant. Taking two-mode overlapped signals as an example, the single-mode dispersion compensation is performed according to the measured distance difference between the two sets of signals. The two sets of signals are returned to the same distance. The fourth-order cumulant independent component analysis method is further used to process the Lamb wave signals of different superposition situations at the same distance. The corresponding mode signal contained in the two sets of signals is separated through the joint diagonalization of the whitened fourth-order cumulant matrix. The different modes are compensated and separated successively, achieving the multimodal signal separation. Experimental results in steel plates show that the presented method can accurately achieve mode separation for the multimodal overlapping Lamb waves. This is helpful for the signal processing of multimodal Lamb waves.
1. Introduction
The ultrasonic Lamb wave technique has been successfully applied in the nondestructive testing (NDT) of plates. It has the advantage of a long propagation distance, which is particularly suitable for testing large areas through the thickness of the waveguide [1,2,3,4]. However, several challenges still exist in Lamb wave nondestructive testing. Lamb waves are multimodal waves within a frequency region with a dispersive nature because their velocities are frequency dependent. In the actual testing, Lamb wave signals have different modes for any given plate thickness and excitation frequency, and the dispersion of each mode is different; that is, different frequency components of a specific propagation mode propagate at different speeds, which leads to the signal stretching in time and reducing the spatial resolution [5]. It can be seen from the dispersion characteristics that the phase velocities of some modes are very close under certain excitation conditions. Lamb wave signals are often overlapped in both time and frequency domains, and signal interpretations are often difficult.
In recent years, many signal processing methods have been applied to the dispersion compensation and mode separation of Lamb waves [6,7,8,9,10]. Hilbert-Huang transform (HHT) [9] obtained high time-frequency resolution through empirical mode decomposition [10] and Hilbert spectrum. Xu et al. [11] used the spectral phase and signal delay function to model the guided wave dispersion and used the single-mode compensation function to compensate the mixed guided wave signals, making the single-mode dispersion signal back to the excitation signal. They effectively extracted each of the multimodal guided waves. However, in the actual measurement, the specific excitation signals are unknown, resulting in a large error in the separation result. To separate dispersive multimodal Lamb waves overlapped in time and frequency domains, the separation method based on dispersion compensation and fractional differential [12,13,14] is presented. Chen et al. [15] and Xu et al. [16] proposed the wavelet ridge algorithm to extract the time-frequency ridges of modes, reconstructing their waveforms with their respective time-frequency information. The ridges extracted for adjacent modes with similar dispersion characteristics are often overlapped, which increases the difficulty of identification. Song et al. [17] proposed the multimodal guided wave signal separation in long bones based on the time-frequency blind signal separation. The experiment only derives the relevant group velocity problem based on the separated signal, and does not give an intuitive separation result to the actual measurement signal. Moreover, the time-frequency distribution may be interfered with by factors such as cross terms, resulting in a decrease in the accuracy of the separation result.
In order to separate multimodal overlapped Lamb waves effectively, this paper proposes a mode separation method by means of the combination of dispersion compensation with independent component analysis (ICA) [18] of fourth-order cumulant. ICA is a type of blind signal separation method, and it can avoid the influence of cross terms in the time-frequency distribution method. In the proposed method, taking two-mode overlapped signals as an example, the single-mode dispersion compensation is performed according to the measured distance difference between the two sets of signals. The two sets of signals are returned to the same distance. The fourth-order cumulant ICA method is further used to process the Lamb wave signals of different superposition situations at the same distance. The corresponding mode signal contained in the two sets of signals at the same position is separated. The different modes are compensated and separated successively, thereby achieving the multimodal signal separation.
2. Methods
2.1. Lamb Wave Dispersion Compensation
The Lamb wave dispersion can be expressed as the function of the phase velocity changing with the frequency. The dispersion function is described as different frequency components of a certain excitation signal passing through the transformation system. Let the excitation signal be k(t). The received Lamb wave propagating a certain distance can be expressed as
where is the time, is the spectrum of k(t), ω is the angular frequency, d is the propagation distance, is the phase velocity of the Lamb wave [19], and j is the imaginary unit.
According to the Lamb wave dispersion compensation theory, the dispersion compensation is the inverse process of the dispersion transformation. The theoretical dispersion transformation function is known to perform dispersion compensation on the received Lamb wave signal. The dispersion compensation function is
Therefore, the original signal can be expressed as
where Y(ω) is the spectrum of .
2.2. Mode Separation for Multimodal Overlapped Lamb Waves
Multimodal Lamb wave signal separation based on dispersion compensation and fourth-order cumulant ICA includes two steps - multimodal Lamb wave dispersion compensation to the measured signals and ICA blind separation for Lamb wave signals after the compensation. For the convenience of description, it is assumed that the received mixed Lamb wave signals consist of two-mode signals. They have different dispersion characteristics. The mixed Lamb wave signals, and , corresponding to the positons at a and b along the propagation path, are measured. The distance between a and b is . It is set that the two-mode signals of the Lamb wave at position a are and . The mode separation is to estimate and according to the measured signals of and .
First, the mixed signal at the position b is compensated by using the dispersion characteristic of the first mode and the compensation distance is . The signal after compensation is denoted as , then
where is the compensation function of the th (p = 1,2) mode obtained according to Equation (2), and is the frequency spectrum of .
The signal matrix is set to . Its covariance matrix is defined as R(t). R(t) = E[Y(t)YT(t)]. The fourth-order cumulant ICA algorithm is used to get the signals of the modes from the signal matrix Y(t).
The fourth-order cumulant ICA blind signal separation is generally expressed as follows. When both the mode Lamb wave signal and propagation parameters are unknown, each mode signal is retrieved from received multimodal overlapped Lamb wave signal matrix Y(t) [20,21,22]. The matrix is whitened and the fourth-order cumulant matrix of the whitened matrix is calculated. Then the diagonalization of the cumulant matrix is performed to find the best estimation matrix.
The whitened Y(t) is defined as Z(t),
where V is the whitening matrix. It can be obtained by eigenvalue decomposition of the covariance matrix
where E is the orthogonal matrix corresponding to the eigenvectors of R. D is the diagonal matrix of Y(t).
The fourth-order cumulant matrix of is defined as [23],
To speed up the computation, the Givens transformation [24] is used to optimize the diagonalization of the cumulant matrix .
For the cumulant matrix , the Givens matrix is used as
To make become a diagonal matrix, G is the rotation matrix. Let
then,
Therefore,
Finally, the estimated Lamb wave signal matrix is defined as D,
Here, RZ is the covariance matrix of .
It is worth noting that the two sets of measured signals after the first mode dispersion compensation only contain the same first mode signals, and the other modes have different dispersion. Therefore, only the first mode signal at position a can be separated at this time.
If the signal at position b is compensated with the dispersion characteristic of the second mode, the signal of the second mode at the position a can be estimated by repeating the above operation. The effect of the separation can be evaluated by superimposing the estimated signals and comparing with the original measured signals.
3. Results
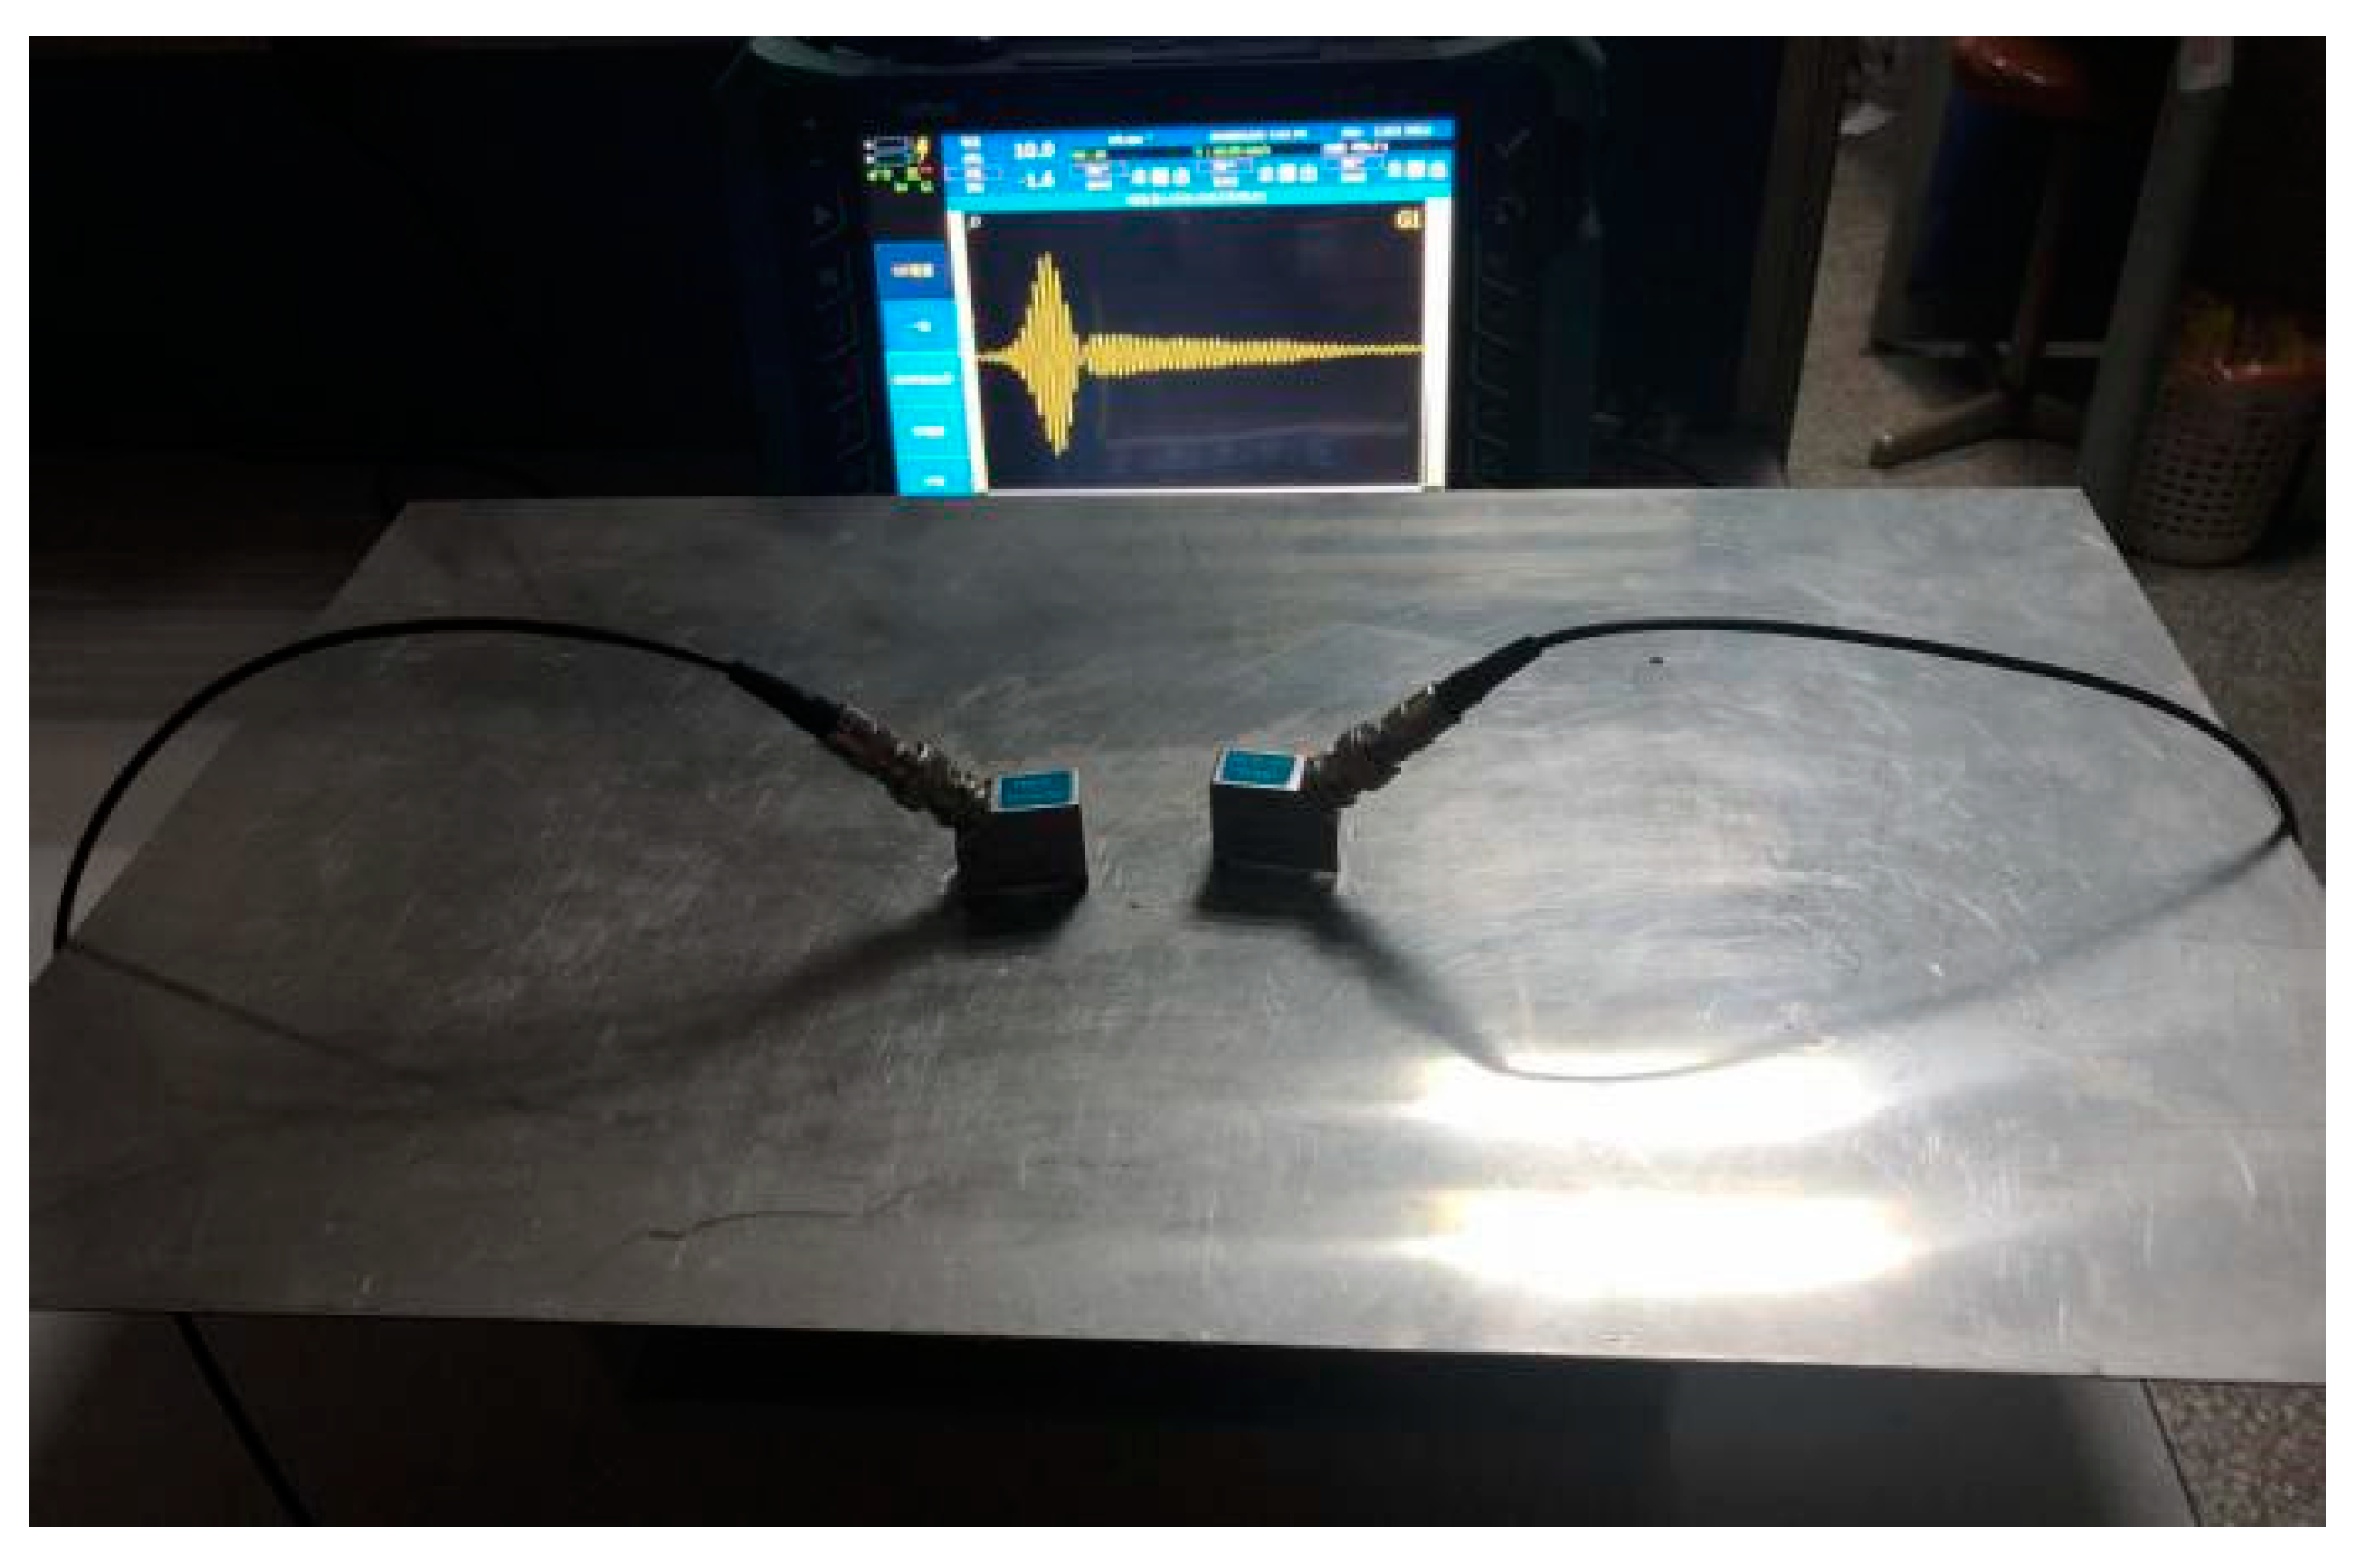
In order to verify the feasibility of the above method, it has been applied to experimentally obtained Lamb wave signals. The Olympus MX2 flaw detector was used to send the excitation signal and receive mixed Lamb wave signals. The workpiece was a stainless-steel plate with the thickness of 1 mm. The multimodal Lamb waves were excited and received by oblique transducers of 10 mm × 10 mm with the central frequency of 2.5 MHz and the incident angle of 26°. A coupling agent was used to facilitate the effective transmission of acoustic energy between the transducers and the steel plate. The data measured by the detector were imported into the computer and processed on the Matlab platform. The whole experiment is shown in Figure 1.
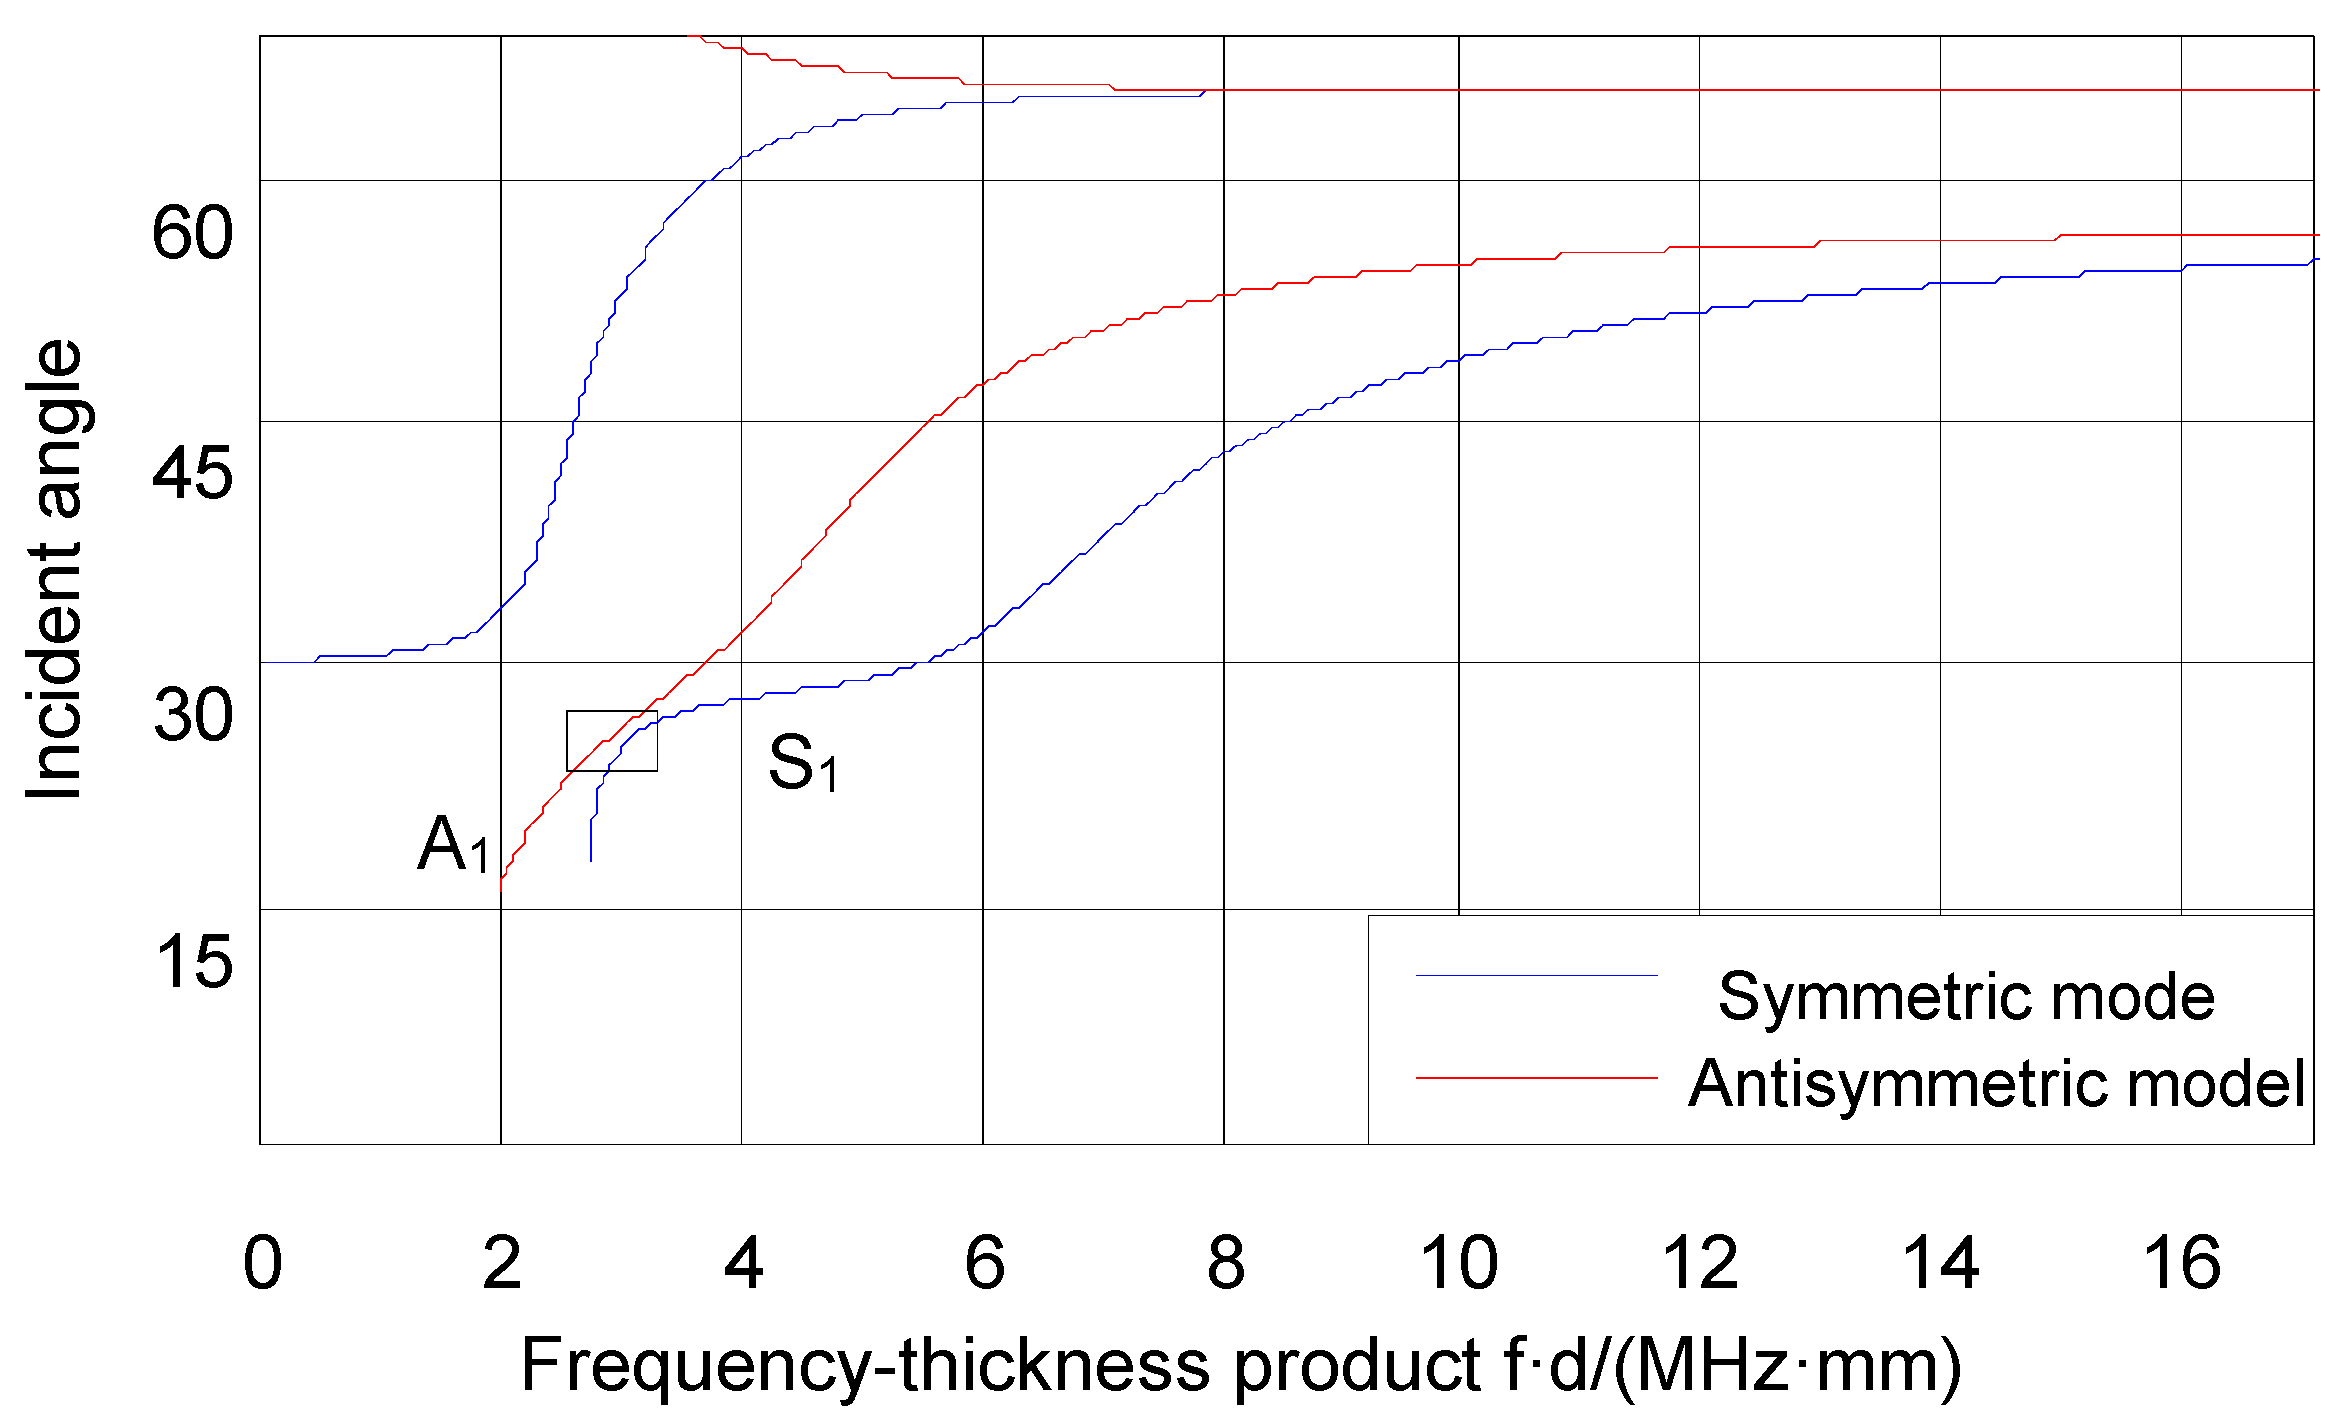
Theoretically, it can be known from the Lamb waves incident angle dispersion curve, as shown in Figure 2, that and modes can be excited when the incidence angle is 26°. Although the two modes are very close to each other at a certain frequency domain, there is always no intersection, which will not lead to conversion between modes. Their corresponding center frequencies are 3 MHz and 3.15 MHz, respectively.
The multimodal Lamb wave signals at the propagation distance of 1.6 cm and 2.7 cm are recorded and shown in Figure 3.
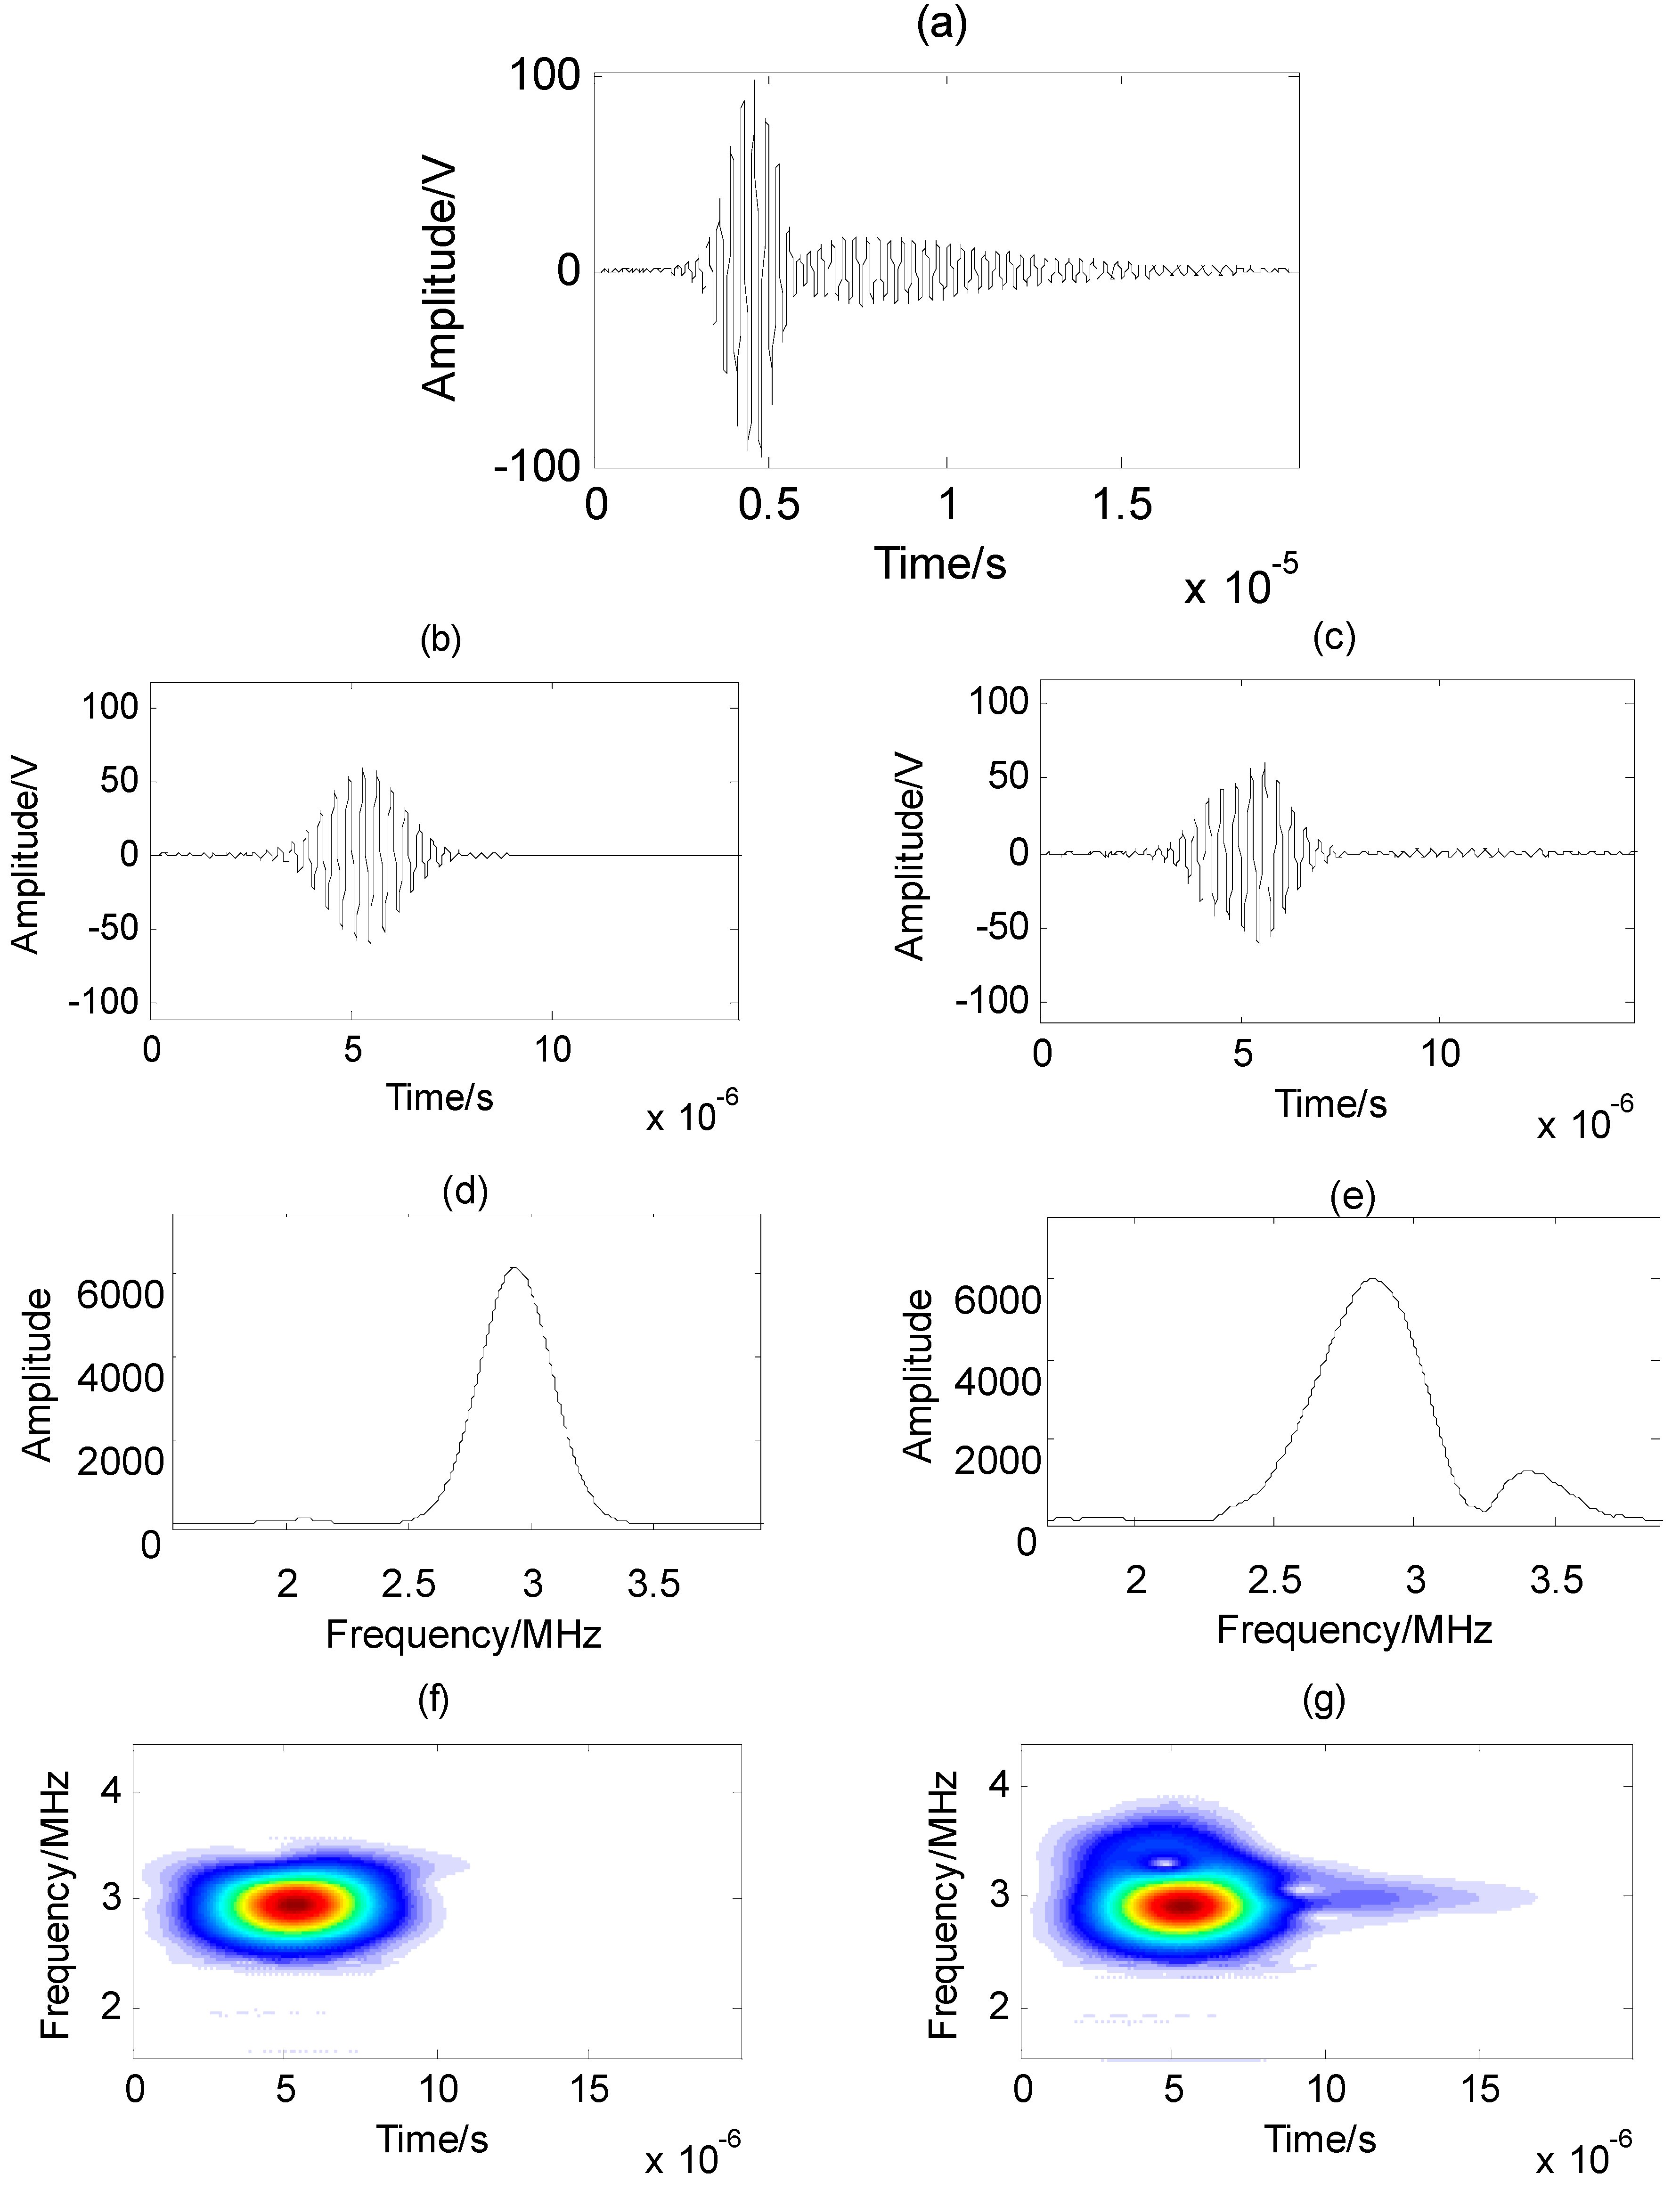
According to the above method, the A1 mode signal at the distance of 1.6 cm is retrieved, as shown in Figure 4. The multimodal Lamb wave signal at the distance of 2.7 cm after compensation using the A1 mode dispersion characteristic is shown in Figure 4a. The separated A1 mode signal using the proposed method at the distance of 1.6 cm is shown in Figure 4b. Its amplitude spectrum is shown in Figure 4d, and its time-frequency distribution is shown in Figure 4f. The separated A1 mode signal using the time-frequency blind signal separation method at the distance of 1.6 cm is shown in Figure 4c. Its amplitude spectrum is shown in Figure 4e, and its time-frequency distribution is shown in Figure 4g.
The S1 mode signal at the distance of 1.6 cm is also retrieved, as shown in Figure 5. The multimodal Lamb wave signal at the distance of 2.7 cm after compensation using the S1 mode dispersion characteristic is show in Figure 5a. The separated S1 mode signal using the proposed method at the distance of 1.6 cm is shown in Figure 5b. Its amplitude spectrum is shown in Figure 5d and its time-frequency distribution is shown in Figure 5f. The separated S1 mode signal using the time-frequency blind signal separation method at the distance of 1.6 cm is shown in Figure 5c. Its amplitude spectrum is shown in Figure 5e, and its time-frequency distribution is shown in Figure 5g.
In order to further verify the proposed method, the separated A1 and S1 mode signals are added and shown in Figure 6a,b. The original measured mixed Lamb wave signal at the distance of 1.6 cm is also shown in the figure. In Figure 6a, the reconstructed signal is obtained using the time-frequency blind signal separation method. In Figure 6b, the reconstructed signal is obtained using the proposed method. The time-frequency distributions of the original signal and the reconstructed signal are shown in Figure 6b,c, respectively.
4. Discussion
From Figure 3, the signal start time at the distance of 1.6 cm is about 2.8 μs and the signal start time at the distance of 2.7 cm is about 3.6 μs. With the increase in distance, both A1 and S1 modes will continue to disperse. The amplitude of the signals will decrease, and the duration will extend.
The A1 mode signal at the distance of 1.6 cm is retrieved, as shown in Figure 4. The multimodal Lamb wave signal at the distance of 2.7 cm after compensation using the A1 mode dispersion characteristic is shown in Figure 4a. The signal start time after compensation has been compensated back to around 2.8 μs. The separated A1 mode signal using the proposed method at the distance of 1.6 cm is shown in Figure 4b. The separated A1 mode signal using the time-frequency blind signal separation method at the distance of 1.6 cm is shown in Figure 4c. Their amplitude spectra are shown in Figure 4d,e, respectively. Their time-frequency distributions are shown in Figure 4f,g, respectively. It can be seen from the time signals that the extracted signal using the time-frequency blind signal separation method has large errors due to the influence of Lamb wave dispersion and the source signal cross-term interference or local correlation under the calculation of global time-frequency distribution. It can be seen from the amplitude spectra and the time-frequency distributions that the separated A1 mode signal using the time-frequency blind signal separation method still contains some part of the S1 mode signal. There is still some part of the S1 mode amplitude on the right side of the amplitude spectrum, and the tail energy remains in the time-frequency distribution. Therefore, the separation precision is low. However, the accuracy of separation is improved by using the proposed method. The separation result has better smoothness, which is consistent with the dispersion of the A1 mode Lamb wave. From Figure 4f, the time-frequency of the extracted A1 mode signal is non-stationary. From Figure 4d, the central frequency of the extracted A1 mode signal is 2.98 MHz, and the frequency range is from 2.5 to 3.35 MHz.
The S1 mode signal at the distance of 1.6 cm is retrieved, as shown in Figure 5. The multimodal Lamb wave signal at the distance of 2.7 cm after compensation using the S1 mode dispersion characteristic is shown in Figure 5a. The separated S1 mode signal using the proposed method at the distance of 1.6 cm is shown in Figure 5b. The separated S1 mode signal using the time-frequency blind signal separation method at the distance of 1.6 cm is shown in Figure 5c. Their amplitude spectra are shown in Figure 5d,e, respectively. Their time-frequency distributions are shown in Figure 5f,g, respectively. It can be seen from the time signals that the extracted signal using the time-frequency blind signal separation method has large errors due to the influence of Lamb wave dispersion and the source signal cross-term interference or local correlation under the calculation of global time-frequency distribution. There are even some irregular signals in the time signal. It can be seen from the amplitude spectra and the time-frequency distributions that the separated S1 mode signal using the time-frequency blind signal separation method still contains some part of the A1 mode signal and lacks some part of its mode signal. Therefore, the separation precision is low. However, the accuracy of separation is improved by using the proposed method. The separation result has better smoothness, which is consistent with the dispersion of the S1 mode Lamb wave. The right part of the amplitude spectrum is slightly irregular, which means it has some minor errors. From Figure 5f, the time-frequency of the extracted S1 mode signal is non-stationary. From Figure 5d, the central frequency of the extracted S1 mode signal is 3.14 MHz, and the frequency range is from 2.7 to 3.55 MHz.
The experimental results from Figure 4 and Figure 5 show that the proposed method can separate the single mode contained in the multimodal mixed signals. The separated signals and spectra indicate that the results have better smoothness. The dispersion degree of the A1 mode is slow, delaying on the time domain, and the time waveform changes less along the distance. On the contrary, the phase speed of the S1 mode changes quickly in the low frequency band; the time signal changes significantly along the distance, and the amplitude becomes smaller and the duration longer with the increase of the distance. Figure 4d and Figure 5d show the amplitude spectra of the separated A1 mode and S1 mode. Except for a slight irregularity at both ends, it is in line with the theoretical analysis of the Lamb wave dispersion. The A1 mode center frequency is 2.98 MHz, and the S1 mode is 3.14 MHz.
In order to further verify the proposed method, the separated A1 and S1 modes are added and compared with the experimental original measured signal at the distance of 1.6 cm in Figure 6. From Figure 6a, to the time-frequency blind signal separation method, the reconstructed signal is very different from the original signal. The result is obvious because the extracted signal mode signals are inaccurate and incomplete. In this method, the dispersion of Lamb waves are not considered resulting in the inaccuracy and incompleteness of single mode separation. On the contrary, to the proposed method, from Figure 6b, it can be seen that the mixed signals after separation and addition is the same as the original signal. The start and end time points are also the same. The front part of the reconstructed signal is more consistent with that of the original signal, and only a few peaks are slightly larger than the original signal. The tail of the signal is slightly less than that of the original signal. Considering that the tail of the signal is almost the main component of the S1 mode and its dispersion degree is relatively fast, there may have been incomplete compensation in the dispersion compensation, which might lead to errors in the signal separation. Figure 6c,d are the time-frequency distributions of the original Lamb wave signal and the reconstructed Lamb wave signal, respectively. It can be seen that their time-frequency energy distributions are consistent. The maximum energy distribution is about 4.5 μs, which implies that the separated A1 mode and S1 mode are consistent with the original single modes.
5. Conclusions
The dispersion and multimodal characteristics of Lamb waves have demonstrated the difficulty of signal separation for each component modes. The blind signal separation method has also been used in the field of ultrasonic guided waves. However, the separation method used in the past can only deal with the signals separated under certain conditions, and the experimental conditions are harsh. For the conventional one-shot and one-receiving Lamb wave signals, one location point can only measure a set of signals, and it is impossible to directly use the blind separation method for signal separation. On the basis of summarizing the advantages and disadvantages of previous blind separation methods, combining with the dispersion compensation method, the signal dispersion is simplified and then combined with the blind separation method. The multimodal Lamb wave signal could be separated.
Aiming at the separation, we have presented a mode separation method for multimodal ultrasonic Lamb waves using dispersion compensation and fourth-order cumulant ICA in this paper. The four-order cumulant ICA algorithm is used to separate each mode signal from the overlapping Lamb wave signals after the dispersion compensation. Experimental results confirm the effectiveness of the proposed method. It is also noticed that there are some errors for the separated signals in the experiments. The introduction of particle swarm optimization or their optimization methods [24,25,26] to the present method might reduce the errors further. Regardless, the present method is helpful for the signal processing of multimodal Lamb wave dispersion.
Author Contributions
X.C. and D.M. designed, accomplished, and evaluated this study.
Funding
This research was funded by project grants from the 333 high level personnel training project Jiangsu Province of China, the Natural Science Foundation of Jiangsu Province of China (BK20161536), and the Priority Academic Program Development of Jiangsu Higher Education Institutions.
Conflicts of Interest
The authors declare no conflict of interest.
References
- Fletcher, S.; Lowe, M.; Ratassepp, M.; Brett, C. Detection of Axial Cracks in Pipes Using Focused Guided Waves. J. Nondestr. Eval. 2012, 31, 56–64. [Google Scholar] [CrossRef]
- Chen, X.; Wan, M. Parameter measurement of the cylindrically curved thin layer using low-frequency circumferential Lamb waves. Ultrasonics 2005, 43, 357–364. [Google Scholar] [CrossRef] [PubMed]
- Hernandez Crespo, B.; Courtney, C.R.P.; Engineer, B. Calculation of Guided Wave Dispersion Characteristics Using a Three-Transducer Measurement System. Appl. Sci. 2018, 8, 1253. [Google Scholar] [CrossRef]
- Lee, K.; Yoon, S. Relationships of the group velocity of the time-reversed Lamb wave with bone properties in cortical bone in vitro. J. Biomech. 2017, 55, 147–151. [Google Scholar] [CrossRef] [PubMed]
- Ambrozinski, L.; Piwakowski, B.; Stepinski, T.; Uhl, T. Evaluation of dispersion characteristics of multimodal guided waves using slant stack transform. NDT E Int. 2014, 68, 88–657. [Google Scholar] [CrossRef]
- Ma, D.; Chen, X.; Gao, Y. Separating multimodal Lamb wave signals based on smooth pseudo-Wigner time-frequency blind source separation method. Appl. Sci. 2019. submitted. [Google Scholar]
- Chen, X.; Wang, C. Tsallis Distribution-Based Fractional Derivative Method for Lamb Wave Signal Recovery. Res. Nondestruct. Eval. 2015, 26, 174–188. [Google Scholar] [CrossRef]
- Cai, J.; Yuan, S.; Wang, T. Signal Construction-Based Dispersion Compensation of Lamb Waves Considering Signal Waveform and Amplitude Spectrum Preservation. Materials 2017, 10, 4. [Google Scholar] [CrossRef]
- Fan, S.; Zhang, H.; Lv, D. Travel time extraction of multi-mode Lamb wave with HHT. Tech. Acoust. 2007, 4, 628–631. [Google Scholar]
- Chen, X.; Li, J. Noise reduction for ultrasonic Lamb wave signals by empirical mode decomposition and wavelet transform. J. Vibroeng. 2013, 15, 1157–1165. [Google Scholar]
- Xu, K.; Tan, Z.; Ta, D.; Wang, W. Dispersion Compensation and Mode Separation of the Ultrasonic Guided Wave. Acta Acoust. 2014, 39, 99–103. [Google Scholar]
- Chen, X.; Gao, Y.; Wang, C. Fractional derivative method to reduce noise and improve SNR for lamb wave signals. J. Vibroeng. 2015, 17, 4211–4218. [Google Scholar]
- Chen, X.; Wang, C.L. Noise removing for Lamb wave signals by fractional differential. J. Vibroeng. 2014, 16, 2676–2684. [Google Scholar]
- Chen, X.; Wang, C.L. Noise suppression for Lamb wave signals by Tsallis mode and fractional-order differential. Acta Phys. Sin. 2014, 63, 184301. [Google Scholar]
- Chen, X.; Gao, Y.; Bao, L. Lamb wave signal retrieval by wavelet ridge. J. Vibroeng. 2014, 16, 464–476. [Google Scholar]
- Xu, K.; Ta, D.; Wang, W. Multiridge-based analysis for separating individual modes from multimodal guided wave signals in long bones. IEEE Trans. Ultrason. Freq. 2010, 57, 2480–2490. [Google Scholar]
- Song, X.; Ta, D.; Wang, W. Study on multi-mode guided wave signals in long bones based on time-frequency distribution blind signal separation. Acta Acoust. 2011, 36, 318–324. [Google Scholar]
- Zheng, W. Research on Hybrid Signal Separation Algorithm Based on EMD and ICA. Master’s Thesis, Harbin Institute of Technology, Harbin, China, 2018. [Google Scholar]
- Ni, L.; Chen, X. Mode separation for multimode Lamb waves based on dispersion compensation and fractional differential. Acta Phys. Sin. 2018, 67, 204301. [Google Scholar]
- Chen, X.; Han, X.; Wang, Z. The method of double tree complex wavelet transform and high order cumulant for gear box signal noise reduction is improved. J. TaiYuan Univ. Technol. 2018, 49, 813. [Google Scholar]
- Kawamoto, M.; Matsuoka, K.; Masahiro, O. Blind separation of sources using temporal correlation of the observed signals. IEICE Trans. Fundam. Electron. Commun. Comput. Sci. 1997, 80, 695–704. [Google Scholar]
- Belouchrani, A.; Moeness, G.A. Blind source separation based on time-frequency signal representations. IEEE Trans. Signal Process. 1998, 46, 2888–2897. [Google Scholar] [CrossRef]
- Reng, P.L. Adaptive beamforming algorithm based on fourth-order cumulant. Electron. Softw. Eng. 2018, 16, 93–96. [Google Scholar]
- Chen, X.; Zou, S. Improved Wi-Fi Indoor Positioning Based on Particle Swarm Optimization. IEEE Sens. J. 2017, 17, 7143–7148. [Google Scholar] [CrossRef]
- Xu, W.; Zhang, C.; Ji, X.; Xing, H. Inversion of a Thunderstorm Cloud Charging Model Based on a 3D Atmospheric Electric Field. Appl. Sci. 2018, 8, 2642. [Google Scholar] [CrossRef]
- Chen, X.; Guo, Y. Fingerprint based WiFi indoor localization using simulated annealing algorithm and Elman neural network. Appl. Sci. 2019. submitted. [Google Scholar]
Figure 1.
Experimental schematic.

Figure 2.
Lamb waves incident angle dispersion curve.

Figure 3.
Multimodal Lamb wave signals at the propagation distance of (a) 1.6 cm and (b) 2.7 cm.

Figure 4.
(a) The compensated multimodal Lamb wave signal at the distance of 2.7 cm; (b) separated A1 mode time domain waveform using the proposed method; (c) separated A1 mode time domain waveform using the time-frequency blind signal separation method; (d) amplitude spectrum of A1 mode separated using the proposed method; (e) amplitude spectrum of A1 mode separated using the time-frequency blind signal separation method; (f) time-frequency distribution of A1 mode separated using the proposed method; (g) time-frequency distribution of A1 mode separated using the time-frequency blind signal separation method.

Figure 5.
(a) The compensated multimodal Lamb wave signal at the distance of 2.7 cm; (b) separated S1 mode time domain waveform using the proposed method; (c) separated S1 mode time domain waveform using the time-frequency blind signal separation method; (d) amplitude spectrum of S1 mode separated using the proposed method; (e) amplitude spectrum of S1 mode separated using the time-frequency blind signal separation method; (f) time-frequency distribution of S1 mode separated using the proposed method; (g) time-frequency distribution of S1 mode separated using the time-frequency blind signal separation method.

Figure 6.
(a) The reconstructed multimodal signal using the time-frequency blind signal separation method and the original signal at the distance of 1.6 cm; (b) the reconstructed multimodal signal using the proposed method and the original signal at the distance of 1.6 cm; (c) the time-frequency distribution of the original signal at the distance of 1.6 cm; (d) the time-frequency distribution of the reconstructed signal at the distance of 1.6 cm.

© 2019 by the authors. Licensee MDPI, Basel, Switzerland. This article is an open access article distributed under the terms and conditions of the Creative Commons Attribution (CC BY) license (http://creativecommons.org/licenses/by/4.0/).
Share and Cite
MDPI and ACS Style
Chen, X.; Ma, D. Mode Separation for Multimodal Ultrasonic Lamb Waves Using Dispersion Compensation and Independent Component Analysis of Forth-Order Cumulant. Appl. Sci. 2019, 9, 555. https://0-doi-org.brum.beds.ac.uk/10.3390/app9030555
AMA Style
Chen X, Ma D. Mode Separation for Multimodal Ultrasonic Lamb Waves Using Dispersion Compensation and Independent Component Analysis of Forth-Order Cumulant. Applied Sciences. 2019; 9(3):555. https://0-doi-org.brum.beds.ac.uk/10.3390/app9030555
Chicago/Turabian StyleChen, Xiao, and Dandan Ma. 2019. "Mode Separation for Multimodal Ultrasonic Lamb Waves Using Dispersion Compensation and Independent Component Analysis of Forth-Order Cumulant" Applied Sciences 9, no. 3: 555. https://0-doi-org.brum.beds.ac.uk/10.3390/app9030555
Note that from the first issue of 2016, this journal uses article numbers instead of page numbers. See further details here.