Article

European Strategies for Adaptation to Climate Change with the Mayors Adapt Initiative by Self-Organizing Maps

by
Francisco Javier Abarca-Alvarez
1,2,*,
Miguel Lorenzo Navarro-Ligero
1,
Luis Miguel Valenzuela-Montes
1,3 and
Francisco Sergio Campos-Sánchez
1,2
1
Department of Urban and Spatial Planning, University of Granada, 18071 Granada, Spain
2
Higher Technical School of Architecture, University of Granada, 18071 Granada, Spain
3
Higher Technical School of Civil Engineering, University of Granada, 18071 Granada, Spain
*
Author to whom correspondence should be addressed.
Submission received: 17 August 2019 / Revised: 10 September 2019 / Accepted: 10 September 2019 / Published: 13 September 2019
(This article belongs to the Special Issue New Trends of Sustainability in Civil Engineering and Architecture)

Abstract

:

Featured Application

The methodology developed in this research has direct application in understanding European initiatives and policies for adaptation to climate change through the identification of differentiated strategic adaptation frameworks.

Abstract

The European Union (EU) has assigned municipal governments a key role in the transformations needed to achieve its climate and energy objectives. One of the main initiatives of the EU has been the “The Covenant of Mayors”, launched in 2008, with impacts beyond Europe due to integration with the “Global Covenant of Mayors for Climate and Energy”. This research focuses on local measures to adapt to climate change, verifying their differences between themselves, and aims to identify and characterize patterns in the different adaptation strategies examined. Further aims are (i) the collection of good practices, framed in the Mayors Adapt initiative, managing multidimensional data from the context and from its adaptation proposals; (ii) the classification of strategies in profiles and patterns using artificial neural networks based on the previous variables; (iii) the characterization and comparison of such profiles. The results substantiate the existence of several well-differentiated approaches, connected with their geographical context, vulnerability and politics. These results provide valuable information for its interpretation and for the planning of climate change adaptation actions, highlighting the value of the creation of networks of institutional collaboration targeted at each strategic framework.

1. Introduction

Over more than a decade, climate change has become one of the main concerns for 68% of Europeans [1], which, together with the confirmation of the effect that cities have on the global emissions of greenhouse gases (GHG) [2] (with 2% of the Earth’s surface generating between 31% and 80% of such gases at global level [3]), has led to the transformation of international political agendas in recent years [4].
Within the framework of the European 20-20-20 targets [5], which set a reduction of 20% of the European Union’s GHGs, an increase to 20% of energy consumption being based on renewable resources and the improvement of 20% of energy efficiency in general terms by 2020, a major municipal-level initiative called “The Covenant of Mayors” (CoM) was launched in January 2008 and updated in October 2015. It arose to support the efforts of local entities regarding the implementation of a Sustainable Energy Action Plan (SEAP) and to support their contribution to the mitigation of emissions. The seminal and probably most important idea of the CoM is the exchange and application of best practices between European cities and towns [6]. The initiative takes advantage of the resilience and ingenuity of individual cities as they pursue ambitious policy [7], while up-scaling such achievements through the constitution of European transnational network [8].
In 2014, the EU updated its 20-20-20 targets [9], intensifying its commitments, albeit in a non-binding way for the countries involved. The Commissioner for Climate Action considered that, together with the reduction of GHG to mitigate climate change, the European Union needed to strengthen its resilience to the unavoidable effects of climate change [10]. The path had already been paved in The European Commission White Paper 2009, “Adapting to climate change: Toward a European framework for action” [11]. According to Kane and Shogren, we mitigate climate risk-cutting GHGs emissions to reduce the likelihood of adverse environmental or climatological conditions, and we adapt to climate risk by modifying production and consumption decisions to reduce the severity of adverse environmental or climatological conditions should they occur [12].
To address this incipient need to boost adaptation, on 16 October 2014, the European Commission’s Directorate General for Climate Action launched a new, local initiative called Mayors Adapt (MA), which should coexist with pre-existing programs such as LIFE (L’Instrument Financier pour l’Environnement) [13] or CoM. Even before the official constitution of the MA, the European Committee of the Regions (CoR) recommended the consolidation of municipal programs for the exchange of good practices, such as the CoM, as well as the promotion of new ones [14], such as the MA, highlighting the key role of the local level, as well as the relevance of forums for the exchange of ideas, guaranteeing policy coherence and synergies between the different initiatives.
While the CoM focuses on the reduction of GHG, which is a clear mitigation strategy, the MA is endeavored to the adaptation of cities to the effects of climate change. In spite of their well-defined objectives and clear strategic differences, in 2015, the CoM and the MA merged into the Covenant of Mayors for Climate and Energy (CoM–C&E), the latter being integrated in 2016 with the Compact of Mayors (a trans-European initiative) in what would then be named the Global Covenant of Mayors for Climate and Energy (GCoM), with a clear global aspiration beyond European borders.
This process of transformation and integration with other initiatives, until the current GCoM, has not been exempt from controversy, being considered by some authors as an incomplete initiative [15]. It raises the questions of whether the standardization of procedures for appraisal, transfer and up-scaling of initiatives within the CoM framework are ready or not to be implemented in the MA framework, given that the local actions can be deeply influenced by their geographical, political and cultural contexts, disregarding climate goals and strategies [16].
In a similar way, scientific studies often seek to understand the strategies of CoMs by making classifications from an approach based on mitigation objectives [17]. However, this is not the case when analyzing the adaptation approach, as there are very few studies that have compared European local adaptation measures on a wide scale [18]. The research presented here aims to fill the gap in systematic studies on adaptation initiatives, by exploring and classifying actions labeled as “good practices” [19] by the Mayors Adapt program during its year of activity prior to its integration with the CoM.
The aim of this work is the development of a new method for the comparative evaluation of European adaptation initiatives. For this purpose, the strategies and municipal good practices in the framework of the MA are analyzed in an exploratory and heuristic way. In order to do so, the context (geographical framework, biogeographical framework and impact of climate change) of these good practices is analyzed, as well as the adaptation strategies elaborated by their municipal governments (actions, approach, methodology and estimated difficulty of development), obtaining such information from 84 different municipal strategies from the initiative’s repository [19]. There are some studies that have carried out comparative analyses of adaptation strategies that allow a good contextualization [18,20], even providing a classification of the strategies, basing their knowledge on the division into groups based on one-dimensional factors and often previously selected. The methodology proposed for the classification of strategies aims to avoid assuming a priori a given relevance of the variables. For this purpose, a heuristic methodology is proposed for the classification of information patterns and profiles by means of a methodology based on artificial neural networks, specifically Self-Organizing Maps [21], which has proved effective in patterns recognition in other areas [22,23,24,25,26,27,28,29], to finally carry out the characterization and critical comparison of such profiles by using non-parametric statistical techniques [30,31] and odds ratio analysis (OR) [32,33]. This classification and characterization is intended to be useful to understand the different strategies and their relationship with others belonging to the same typology or strategic pattern and as a frame of reference for future implementations of local climate change adaptation policies and actions, and with the possibility of drawing comparisons with other strategies, such as the CoM mitigation strategies.
The paper is structured as follows: Section 2 introduces the strategic context of the CoM and MA initiatives; Section 3 shows the state of the art in research, identifying types of climate change strategies in the EU; Section 4 describes the sources of information and procedures carried out on them; Section 5 shows the results achieved, describing and characterizing the different patterns and profiles of adaptation strategies found in the good practices studied in the Mayors Adapt initiative; Section 6 gives the main contributions of the work in relation to the state of the art. Finally, the main conclusions are highlighted in the last section of the document.

2. Strategic Context of the Covenant of Mayors and the Mayors Adapt Initiative

One of the most important European policies in the field of cities is the Second European Action Plan for Energy Efficiency [34], which established the basis for EU objectives and identified “energy efficiency in built-up areas” as a priority action. In 2007, the political framework for energy and climate policies was set [35], attempting to limit global climate change to 2 °C, serving as the germ of the well-known 20-20-20 targets [5]. Various directives from 2009 and 2010 were aligned to these targets, aiming to promote “Renewable Energy Sources” [36], the target set for the realization of “nearly zero-energy buildings”, which set goals for the end of 2018 in public buildings and in 2020 for the private sector [37], as well as certain initiatives of great implementation significance at the municipal level, such as “The Covenant of Mayors” (CoM). The CoM was established by the European Commission (EC) in January 2008 and updated in October 2015 [38]. CoM, together with cities, involves countries and regions in the reduction of GHG [39]. It is signed voluntarily by Mayors in order to reach the 20-20-20 targets [6], guided by coordinated tools and methodologies [4] in an innovative model of multi-level governance towards environmental sustainability [39], encouraging, alongside traditional vertical forms of climate governance, the emergence of a horizontal level that facilitates comparison between the municipalities and spill-over effects [40].
Initially, in 2008, the CoM was subscribed to by 96 cities, reaching 640 cities in September 2009 [41], surpassing the figure of 2100 signatory municipalities in February 2011. Following the successful implementation in these first months [38]. Spatially, the high degree of implementation and number of signatures of the agreements can be observed in Figure 1a, and it can be verified in Figure 1b that the contribution of monitoring reports failed to reach such levels by far [42]. In October 2017, the CoM’s implementation reached more than 7600 municipalities, representing more than 238 million inhabitants [43], raising the number of signatory municipalities to 9600 by June 2019, involving more than 326 million inhabitants [38].
In January 2014, the European Council adopted a new climate and energy framework that adjusted the previous 20-20-20 targets for 2020 in what we could state by analogy as the new 40-27-30 targets for 2030, which made a commitment to meet the previous targets and setting new targets with a 40% reduction in GHG, an increase in renewable resources to 27% and an improvement in energy efficiency of 30% [9]. This new European climate and energy framework, while strengthening commitments, was not made binding, with no particular attention paid to implementation at the local level [40].
Faced with scientific data warning that global warming and its effects were worsening, the European Committee of the Regions suggested in June 2014 that the targets should become binding, and even rise further to the 50-40-40 triad in an attempt to prevent a catastrophic rise in temperatures of more than 2 °C [44].
Within this framework, the European Commission appreciated that an additional effort should be made to transfer, through specific initiatives, the determinations already marked in the White Paper of 2009 [11] as a development of the Green Book of 2007 [45] and should allow the framework to be consolidated with the EU Adaptation Strategy [46]. The initiative created for this was the Mayors Adapt (MA) initiative, considered a sister of the CoM, based on the same principles, but focused on adaptation to climate change [47]. The MA brings together cities as areas particularly vulnerable to extreme weather events and other effects of climate change [10]. To ensure the momentum of the MA, cities that took the lead in adapting to climate change at the EU level were incorporated into the MA. A forum was created to exchange local ideas and best practices [47]. Cities committed themselves to contributing to the overall objective of the EU Adaptation Strategy by developing local adaptation strategies or integrating adaptation to climate change into plans already developed [10]. The municipalities also committed themselves to reviewing the results of these plans every two years [48]. This periodic monitoring would allow, as it did in the CoM, a better understanding of the actions and a consistent comparison of climate plans over time [49]. With the MA, the European Union sought to join European cities in tackling climate change by increasing support for local activities, providing a platform for increased commitment and networking by cities [10], inspiring action [48], and raising public awareness not only of the issue, but also of the very actions needed to adapt to climate change [50]. While the CoM initiative aims to reduce GHGs, the MA aims to adapt infrastructure and policies to climate impacts by providing a framework for local authorities to take action [51]. Among the impacts that municipalities face are extreme weather events such as heat waves, storms, floods and drought, as well as long-term changes such as economic losses and public health problems [50]. By joining the MA initiative, municipalities receive personalized support, information from networking events and learning from “best practices” and informational guides and materials [48]. Among the requirements for membership of the MA are to be constituted as a local authority, either a city or an organized agglomeration, democratically constituted by elected representatives, with a political leader who can act on their behalf, and who is located in the European Union (EU), in a candidate or potential candidate country of the EU, in a European Free Trade Association or in a neighboring country to the south. On 15 October 2015, the MA was officially merged with the CoM in the new Covenant of Mayors for Climate and Energy (CoM–C&E). This occurred on the recommendation of the Committee of the Regions to achieve the necessary coordination of energy and climate policy issues [52] in what is described as an effort to promote an integrated approach to climate and energy action [53]. It is hoped that the initiative will arouse increasing interest among municipalities to integrate climate adaptation concepts into operational planning [54]. Finally, the information repository of the cities participating in the MA [55] would be closed in 2018, part of its contents being dumped in the platform of the European Environment Agency that was already working [56]. The MA, in its year of life, coexisted with other international initiatives also focused on adaptation to climate change, such as the C40 with adaptation action, Making Cities Resilient, the European Green Capital Award, European Green Leaf or Rockefeller 100 resilient cities [57], although none of them had the open will to incorporate small municipalities. Figure 2 shows the leadership of certain cities in belonging to several of these city networks.
On 22 June 2016, CoM–C&E joined, while maintaining its autonomy, the Compact of Mayors, a global network of cities formally initiated in 2014 by the UN and oriented towards the mitigation of and adaptation to climate change. The integration would result in the Global Covenant of Mayors for Climate and Energy (GcoM), announced as the largest global movement for local action on climate and energy [53]. A total of 9664 cities from 59 countries have now joined CoM–C&E, representing more than 326 million inhabitants [38]. According to the latest available reports, the GcoM has reached 9149 cities, covering a population of more than 780 million [58].

3. Review of Scientific Work to Identify Profiles of Climate Change Plans or Strategies in the EU

The scientific work focusing on previous European initiatives to combat the effects of climate change is not very abundant; most of it being focused, as we shall see below, on mitigation criteria, with very little work focused on actions and initiatives to adapt to climate change.
There are very few studies aimed at creating an integrated classification of mitigation and adaptation strategies for certain SEAPs at an urban level. Among them is the work of Pasimeni et al. [16] analyzing three sectors, namely, Urban Adaptation and Heath, Transport and Infrastructure and Energy, trying to find synergies between the implementation of adaptation and mitigation measures into local planning process.
Between those research focused on mitigation, we can see that some work compares the results of different initiatives, specifically the European initiative of the CoM and the UN initiative of the Compact of Mayors [43], but most of the work focuses on assessing the mode and degree of implementation of SEAPs within the framework of the CoM. Among these studies, we can observe those that make comparisons between multiple territories, such as, for example, the comparison of the reduction of emissions by saving energy in buildings of 4741 participants in the CoM [59], the influence of such savings on the air quality of 146 cities [60], the analysis of emission reduction strategies of 124 cities with more than 100,000 inhabitants [61], the evaluation of the advantages and motivations of an energy approach analyzing 41 municipalities [62] or the general vision of the methodologies applied [4]. Among the studies focused on specific territories, we can find works in France [63], in Denmark [64] and evaluations of the effectiveness of the SEAPs in Genoa in Italy [65], a work that evidences the type of measures implemented in Portugal [66], or studies that compare the implementation of CoMs in Italy and the United Kingdom, both with a qualitative and qualitative approach [67]. Other studies have investigated the motivations that lead governments to join city networks in the face of climate change [66,68,69,70,71,72], the evaluation of involvement and participation through indicators [36,39], the creation of indicators for evaluating SEAPs based on energy efficiency [73] or the identification of good practices and guidelines to increase municipalities’ own participation [4]. Unlike previous works, other works use multi-criteria analysis methodologies to support local administrations in SEAP programming [74], for scenario feasibility analysis [75] or for implementing decision support tools for local planning [76].
Reckien analyzed 200 climate change plans [77], showing that only 56 of them had a strategy or adaptation plan. Despite the absence of papers analyzing the MA initiatives, there is some research incorporating strategies and actions that relate to adaptation, although not specifically focused on such European initiatives. Among them, we can highlight two works. In the first of the works, the adaptation initiatives carried out in the SEE (South Eastern Europe) OrientGate project are studied and framed, more than on the scale of municipal policy and action, but on the scale of the European and national policies of the countries participating in the project [54]. In the second work, a Local Adaptation Strategies (LAS) database is created, based on information obtained from scientific papers and municipal repositories, comparing a total of 147 examples from 20 countries, highlighting the main barriers, the main risks and vulnerable sectors and the key responses, identifying patterns of relations between LAS and by regions and analyzing them through their non-parametric frequencies and analysis [18]. Taking into account the objectives of the research presented here, this last reference by Aguiar et al. in 2018 constitutes a singularly relevant framework for knowledge and discussion.
Most of these studies are based on a structured analysis, based on the objectives of the strategies themselves. Faced with this, this research proposes an eminently exploratory and holistic methodology.

4. Materials and Methods

First of all, in connection with the state of the art, the justification of the adopted methodology is carried out.

4.1. Justification of the Chosen Methodology

The comparative analyses between adaptation strategies that we can find in the state of the art allow for contextualization and refined knowledge, allowing the formulation, refinement and testing of the indicators that guide improved local responses [18,78,79]. Some studies have proposed classifications for obtaining knowledge [18,20], proposing the analysis of strategies by dividing them into groups based on factors such as climatic characteristics, level of urbanization and ambitions towards CO2 reductions [20] or the geographical regions to which they belong [18].
If we classify the distribution patterns for a variable, we observe the dimension or topic of “Climate Impacts”. Figure 3 shows that the countries with the greatest number of good practices distribute their cases in multiple impacts, making it very difficult to draw conclusions and patterns through an analysis of a single variable.
Similarly, when observing the distribution of foreseen climate impacts in different biogeographic regions (Figure 4, top), we can verify that most of them are extensively present across time. For example, extreme temperatures are taken into account in Mediterranean, Atlantic, Continental and Boreal regions. This also occurs when analyzing the impacts according to the geographical location (Figure 4, bottom). While sea-level rise obviously receives greater attention on coastal municipalities, most of the other impacts are considered in several geographical locations.
This simple preliminary analysis based on absolute frequencies evidences the convenience of carrying out other studies or the analysis of multivariable or holistic data that integrate multiple dimensions simultaneously in order to construct patterns that are relevant.
As opposed to an analysis of a single variable, and in contrast to the approach of the research described above, the work presented here proposes the use of a method that does not presuppose a priori any determining variable for classification, but on the contrary, focuses on a heuristic methodology for obtaining patterns and profiles, in the form of scenarios, considering the totality of the data handled, proposing for this purpose the use of methodologies from the AI (Artificial Intelligence) such as the ANN (Artificial Neural Networks) and specifically SOM (Self-Organizing Maps).
In view of the foregoing, the proposal distinguishes three methodological phases: (i) the collection of good practices from the Mayors Adapt initiative; (ii) the classification of strategies into profiles according to both context and adaptation proposals, using techniques based on artificial neural networks; (iii) the characterization and comparison of such profiles with each other.

4.2. Collection of Best Practices from Mayors Adapt

This research compiled each and every one of the 84 “City profiles” identified as “good practices” in the initiative repository [19], taken from the 258 cities participating in the initiative according to the latest web archive of the initiative, dated 13 May 2016 [55]. It should be noted that the initiative does not provide further information on the methodology carried out or on the requirements for such a distinction as “good practices”. The selection of good practices were available online until 18 April 2018, as can be seen on archive.org [19], and they are integrated into The European Climate Adaptation Platform Climate-ADAPT [56] until today, since the initiative was officially merged into the Covenant of Mayors for Climate and Energy on 15 October 2015 [52].
Each good practice had a respective worksheet, both with information systematically classified by categories and free text information describing the actions to be carried out. All of them have been systematically coded. The data available for each adaptation strategy are given in Table 1.
By comparing the specific case studies incorporated in the 84 local good practices [19] with the 149 Local Adaptation Strategies presented in Aguiar et al., [18], it can be verified by means of Table 2 that only 24 of them match, reaching 60 new local adaptation initiatives in this research, meaning that this new study is fully justified.
Regarding the European representativeness of the study, it can be said that the 84 cities studied together reach a total population of 26,099,398 inhabitants, which represents 5.12% of the population of the countries to which they belong and 5.33% of the population of the EU28 (European Union 28).

4.3. Classification of Strategies into Profiles

For the systematic analysis of multidimensional data sources, such as the data available from the strategies framed in the MA, various approaches have been used for decades, among which the paradigm of artificial neural networks (ANN), coming from the field of Artificial Intelligence (AI), stands out as a data mining technique which is clearly heuristic [82], and specifically the Self-Organizing Maps (SOM) is noteworthy as a type of this that stands out for its power for variable analysis as opposed to classical linear methods and especially for its representations [83]. The ANN is a type of machine learning method that has been used profusely in the prediction, classification and recognition of patterns [22], highlighting the SOM for their ability, from non-ordered data, to create profiles and representations as a landscape of the phenomenon described by the data [25]. SOMs together with K-means are the most popular clustering methods [82]. Some authors attribute better results to the former, adding the advantage of presenting topological relationships graphically between data [84], which is what the methodology was initially created for [21]. SOMs have been widely used in engineering, among others to pre-process data, extract properties, process analysis or for pattern recognition [23]; its own author, Teuvo Kohonen, used it to obtain patterns and structures of world poverty and welfare [24], opening the methodology seminally to the social sciences and geography. Gradually, the SOM methodology has been used in a constructive way in several areas close to urban and spatial planning, such as the analysis of urban systems [85], the identification of urban dispersion dynamics [26], the characterization of urban fabrics [27], the evaluation of economic and financial conditions over time [28], the characterization of exemplary European neighborhoods by means of profiles [29] or in assisting decision-making by means of digital government tools [86].
The SOMs use unsupervised training and therefore require little operator intervention, making them very useful in the exploratory and knowledge discovery phases [87]. From the data of the study, called the input layer, which in our case are the features of the selected local adaptation initiatives, their organization is obtained by means of a representation in a two-dimensional map of each local initiative, maintaining topological relations and similarity with the rest of initiatives, locating those instances that present features with greater similarity among themselves in the map.
The construction of the SOM incorporates all the information obtained from the variable files (Table 1) that can be compared with the rest of the initiatives, managing a multitude of entities that have to be coded from a contextual and semantic analysis of the available data. Qualitative variables, making up most of the information obtained, are not directly incorporated into the SOM as numerical values [88], but the categories are coded by means of dummy variables, i.e., representing in a binary way the presence or absence of each quality. In this work, the software Viscovery SOMine 5.0.2.t. was used for the construction of the SOM model, chosen for its excellent visual representations [28].
Once the SOM model is created, clusters of local adaptation initiatives are defined through a Ward-Cluster analysis [89]. The number of profiles to be reached can be defined by means of different methods and well-differentiated criteria [90], and even the use of several of them at the same time is frequent [91]. There are methods to define the number of clusters or profiles with a statistical approach, using cohesion and/or separation metrics, generally based on dispersion measurements based on the sum of squares [92], with the Ball and Hall index [93] or Calinski and Harabasz [94], the Davies–Bouldin index (DB) [95], the Silhouette Coefficient [96], the Cubic Clustering Criterion (CCC) [91] or the dendrogram observation method [91] particularly worth highlighting. A complementary or alternative to statistical approaches is the a priori method of Hair Jr. et al. [97], who proposed the establishment of an adjusted range of clusters based on the researcher’s experience and on manageability, simplicity and efficiency, taking into account a practical judgment based on common sense and technical foundations. This criterion tends to finally consolidate an adjusted range based on the experience of the researcher, which is estimated to allow the interpretation of the clusters. Finally, by means of a practical judgment, based on theoretical foundations and common sense, the final number of profiles is determined, usually resulting in a better solution than one based exclusively on statistical criteria [97]. In view of the above, and uniquely due to the exploratory and heuristic nature of the work, it is considered pertinent to restrict the solution of the number of profiles to a conceptual criterion of the problem, reaching a number of profiles for which a useful and relevant interpretation of local adaptation strategies can be made. In this way, an iterative process is carried out by which the number of profiles is increased, evaluated through technical and critical judgment, stopping the process when it is no longer possible to clearly explain the meaning of a new profile or when fragmentation ceases to have practical value.

4.4. Characterization and Comparison of Profiles

The characterization and subsequent comparison of profiles was carried out in two steps:
Firstly, a series of non-parametric tests was carried out in which the relevance of the groupings and profiles obtained was evaluated. Considering that the nature of the information is eminently categorical, and consequently, without normality in the distribution of the data, it was decided to carry out nonparametric tests of Chi2 with Yates correction [30], contrasting the independence of each variable in relation to their categorization in each of the profiles obtained previously.
Along with the statistical significance obtained, the second step consisted of evaluating the magnitude of the results through the size of the effect [31], in line with the recommendations of the American Statistical Association [98]. As is well known, statistical significance does not provide information on the strength of the association, which is usually measured by effect size [33]. This is why it is calculated for each pair of profiles and varies its effect size, understood as the strength of the association, and specifically as the ratio of probability that the event occurs versus the probability that it does not occur, which is generally called the odds ratio (OR). OR has been used as the “magnitude of effect” in cases with dichotomous results [32,33], such as those found in our case study, and comparisons of magnitude can even be made between such effect sizes derived from OR and those from Cohen’s d [33].

5. Results

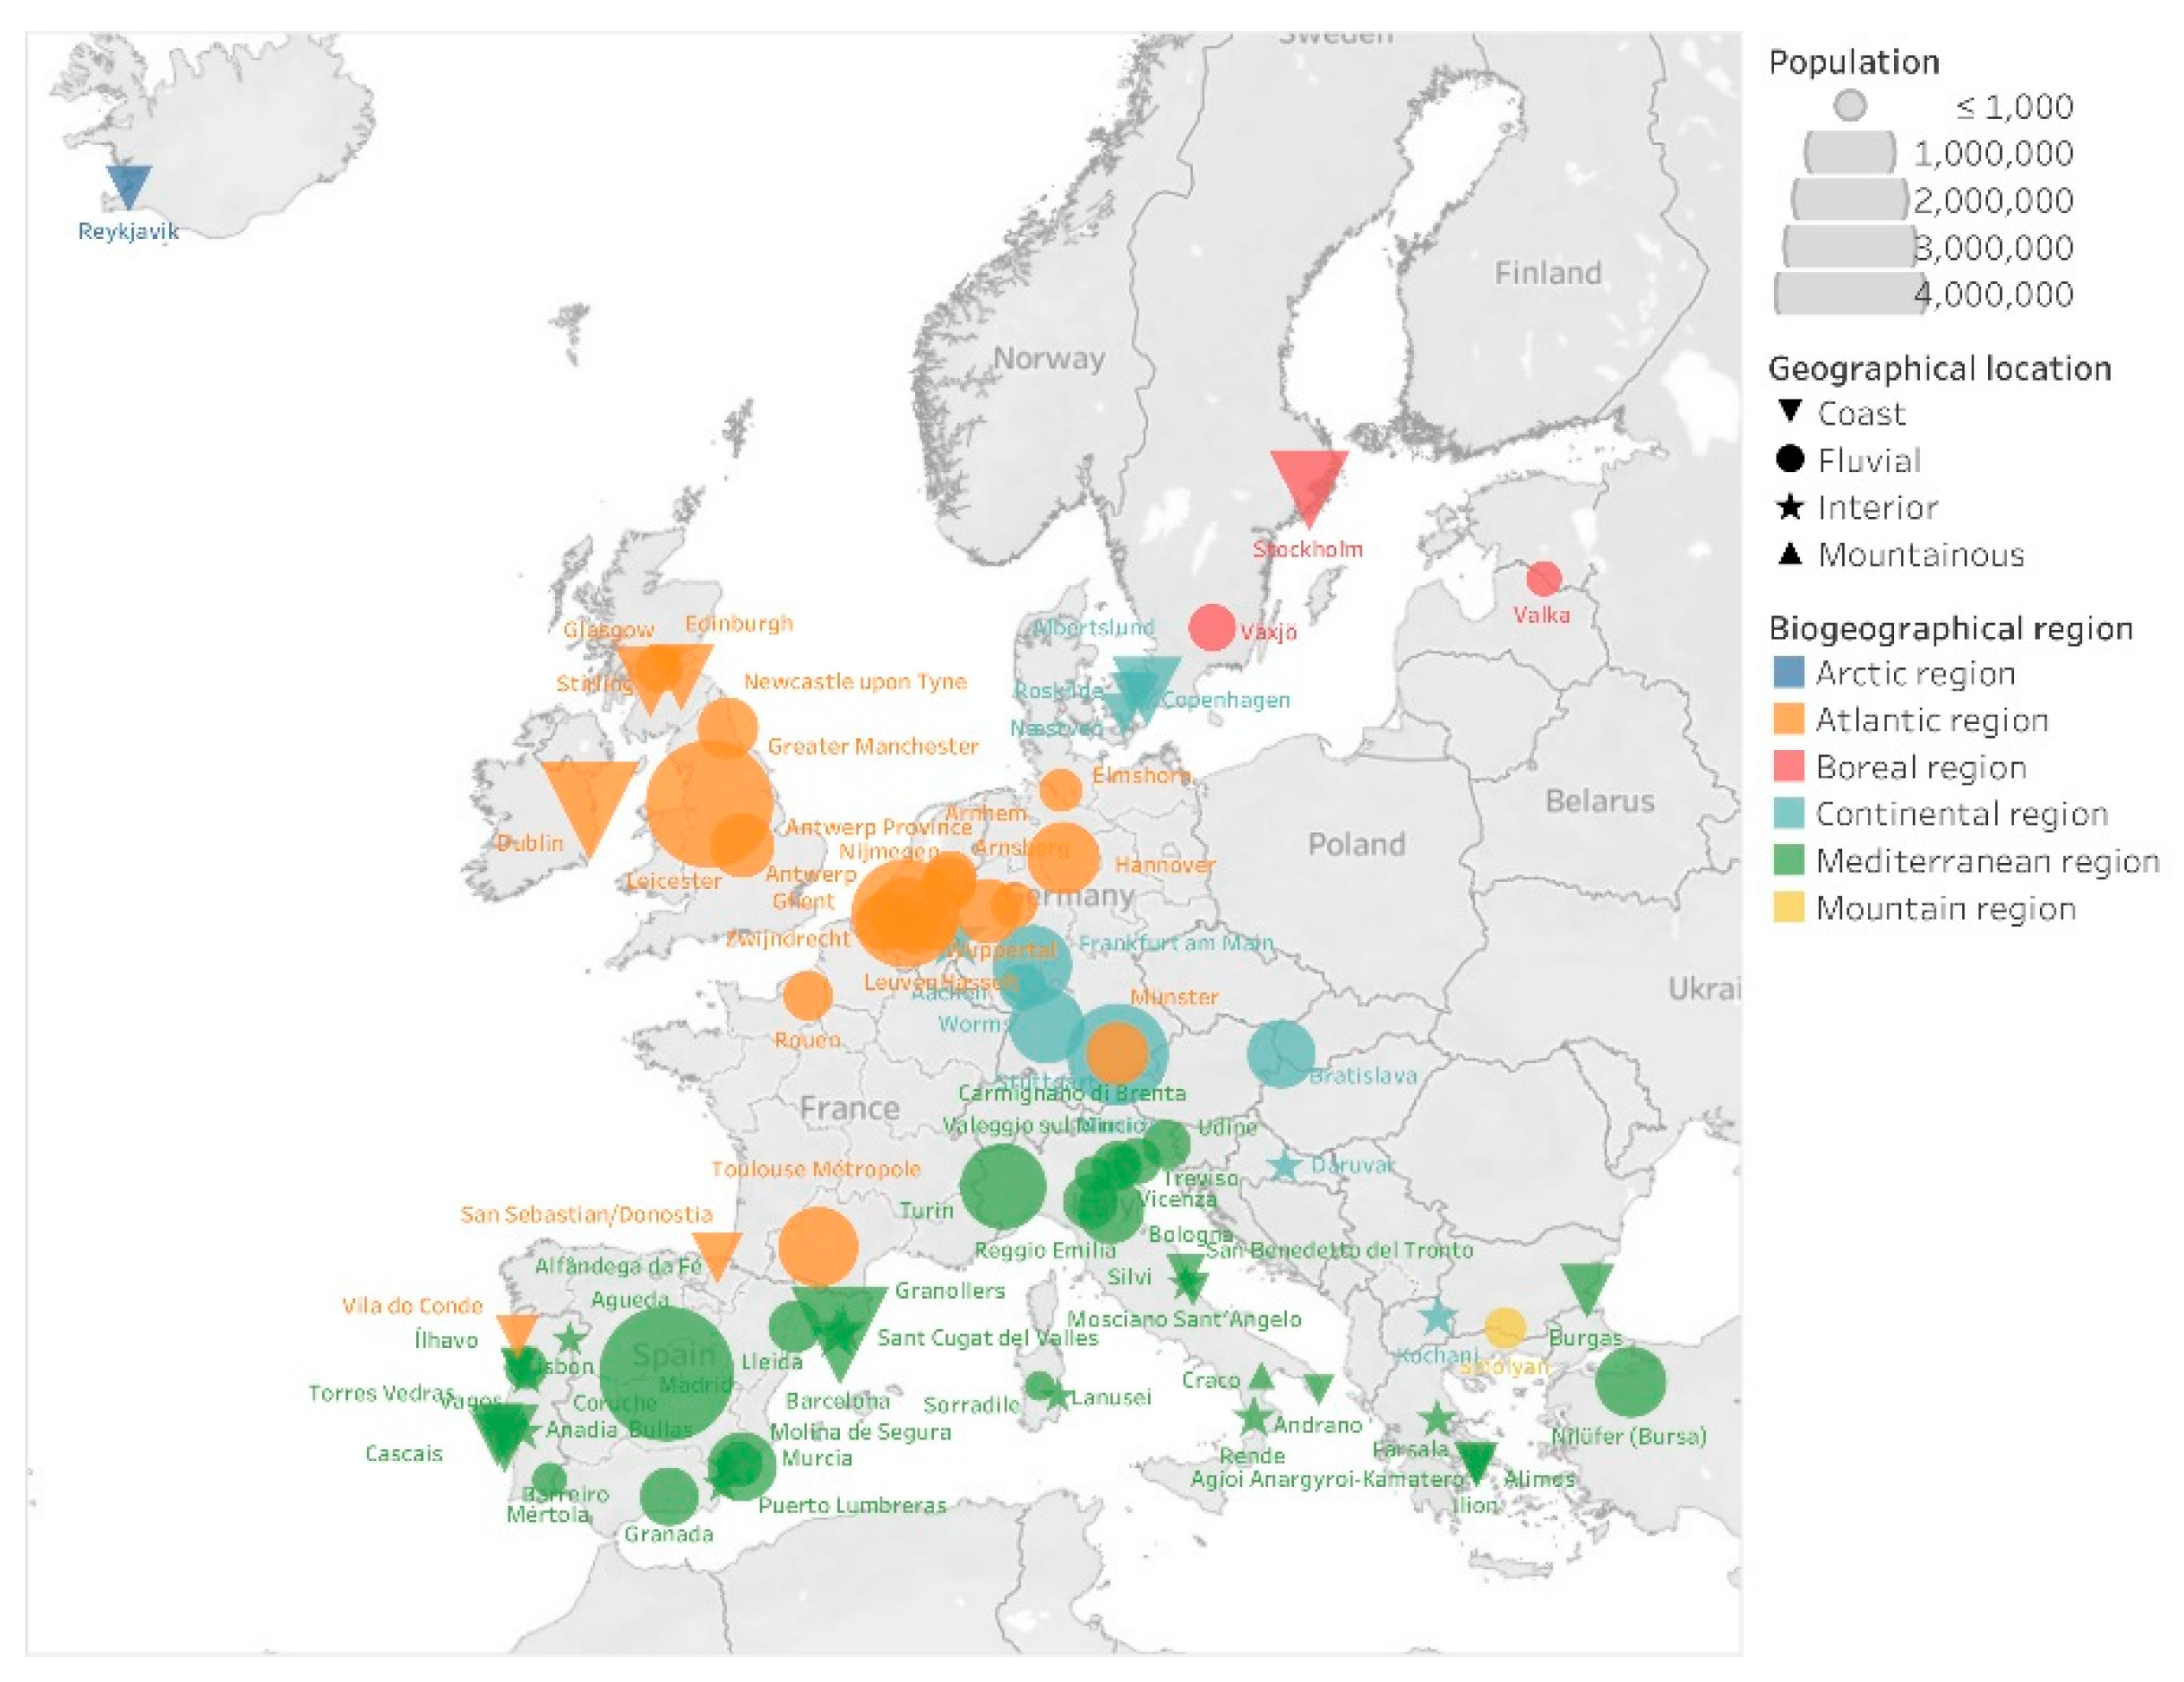
5.1. Collection of Best Practices From the Mayors Adapt Initiative

Looking at the distribution of case studies by country (Table 2) and their spatial distribution (Figure 5), we can see that more than half of the case studies are concentrated in four countries. This shows that Italy, with 16 cities (19.05% of the case studies), has only 3.12% of its population represented; Portugal, with 12 cities (14.29%), reaches a representation level of 11.02% of its total population; Spain, with 11 cities represented (13.10%), reaches 12.91% of the population being included; and finally, Germany, with 10 cities (11.90%), reaches 5.38% of its total population. On the other hand, some countries stand out in that, although they have few cities in the study, they reach a percentage of their total population that is certainly relevant. Among them, the following stand out: Iceland, with one city in the study (1.19%), representing 36.26% of its national population; Ireland, also with one city (1.19%), covering 35.75% of the total population; and Belgium, with six cities in the study (7.14%), reaching 24.04% of its national population.

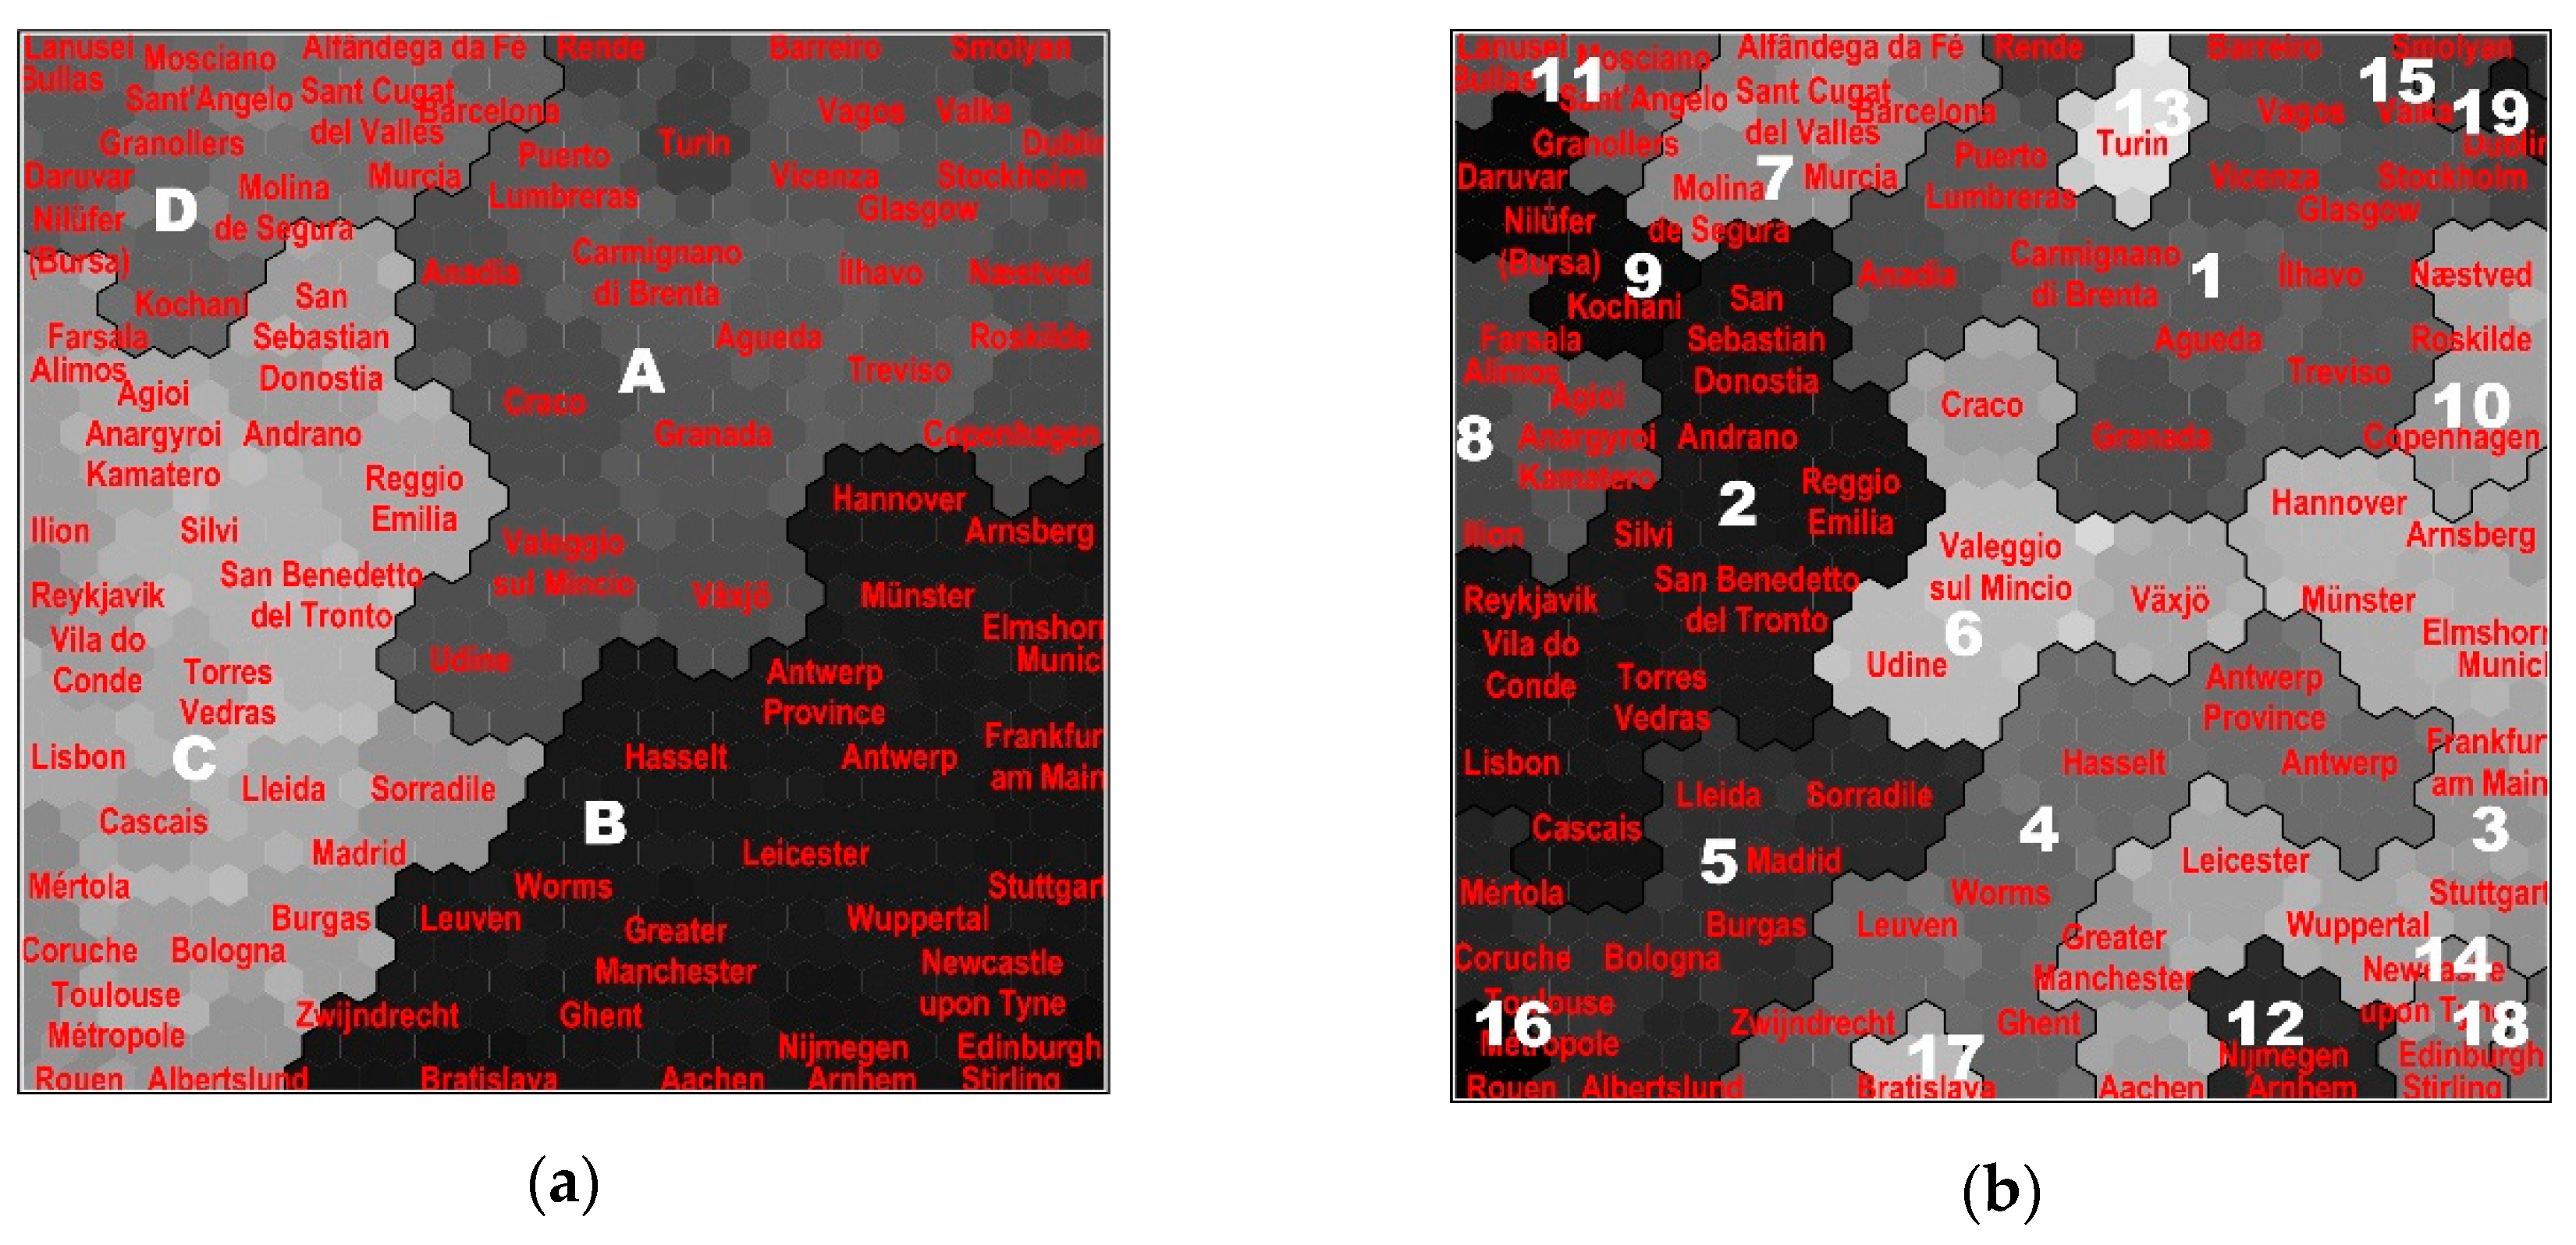
5.2. Classification of Strategies Into Profiles

After the codification of the information of the municipal strategies of adaptation to climate change, as described in the methodology, the data are introduced in the ANN, with the SOM type, and the iterative process of determining the appropriate number of clusters is carried out. In this process, two classifications are determined as relevant, in four and in 19 clusters. This is a hierarchical analysis, meaning that the 19 classes are included in the four clusters of superior hierarchical rank, allowing an initial analysis and interpretation of conglomerates based on the four classes, which we call patterns (from A to D) in this research, finally allowing detail in each of the 19 profiles (from 1 to 19). In our case, a larger number of profiles did not provide additional information that could be easily and intuitively interpreted. Figure 6a,b present the SOM with the classification in four patterns (a) and in 19 profiles (b).

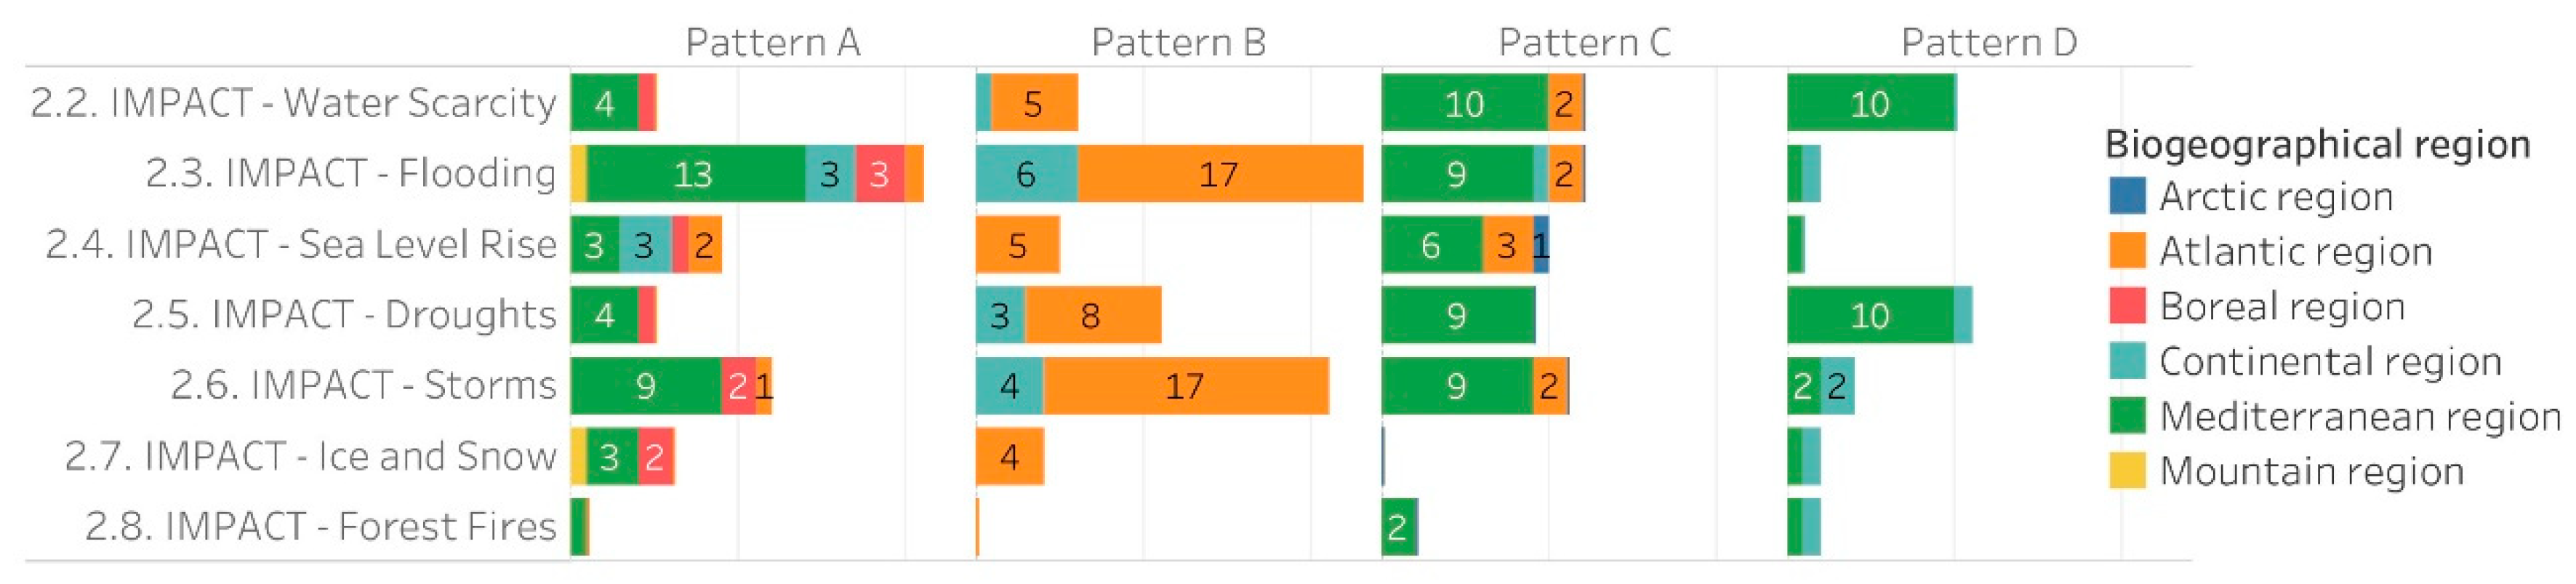
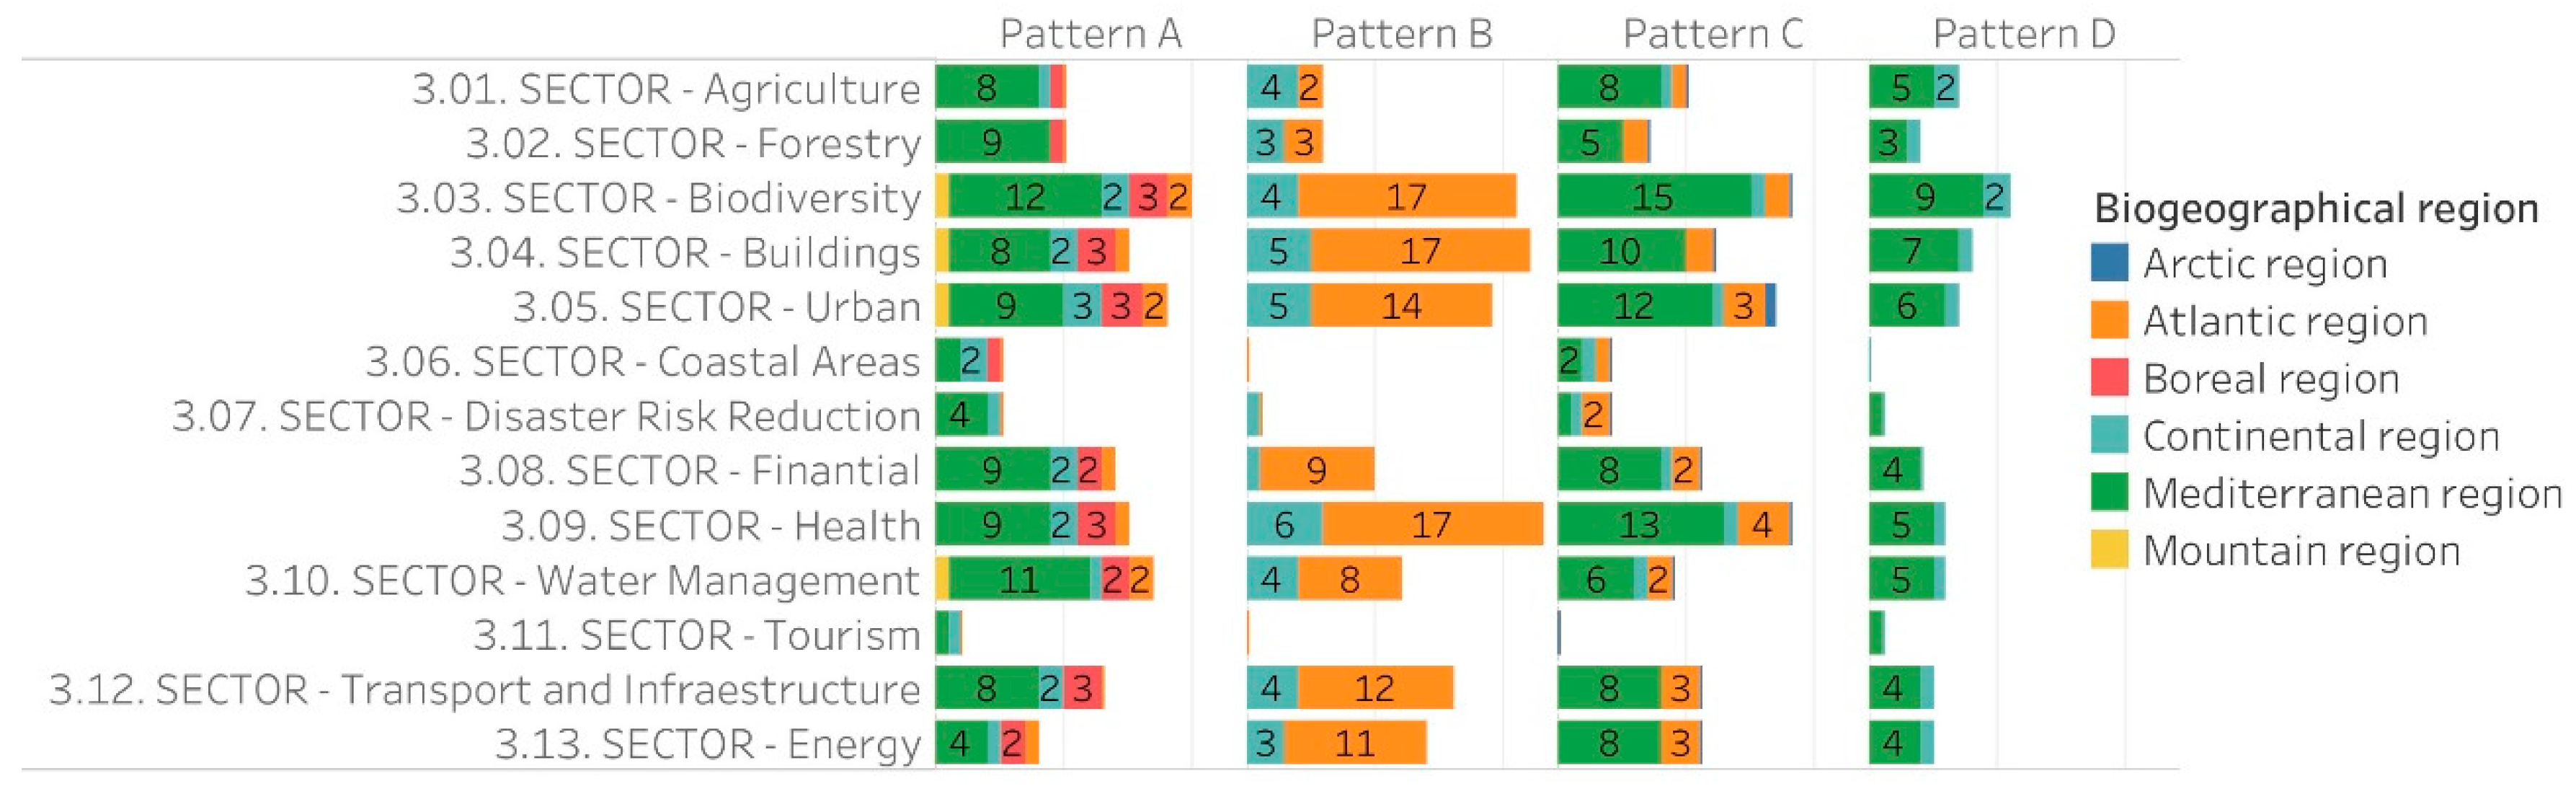
5.3. Characterization and Comparison of Profiles

Figure 7 and Figure 8 repeat the frequency analysis for each of the four main patterns observed. In this case, significant differences between them are clearly observed, especially when crossing them with variables such as the different bioregions. This type of quantification is especially effective with few profiles or patterns. In order to evaluate a greater number of profiles, other statistical tests are carried out to guide the analyst in his conclusions.
Table 3 shows a selection of the results of the clustering of the 19 profiles by SOM and Ward Cluster, consisting of the four dominant or main profiles, in terms of the number and representativeness of the strategies. It is also a synthesis that incorporates the results of a Chi2 test for each of the profiles and each of the 132 items and/or variables considered, amounting to a total of 2508 hypothesis contrasts. Together with statistical significance, the size of the effect (OR) is provided, providing very relevant information on the impact. Specifically, the size of the effect describes the probability of what the variable describes occurring within the pattern or profile under study, increasing the probability beyond 50% in values above 1 (maximum value OR = ∞), and decreasing in the same direction with values below the unit (minimum value OR = 0).
Some relevant results obtained from the analysis of profiles are shown below, detailing the four main patterns found and the main profile within each of them:
Pattern A, risk reduction from an economic and physical protection approach: a pattern composed of 24 cities that have often declared catastrophe caused by climate change, with expected climate change impacts due to flooding, with eminent economic protection motivation and low environmental motivation, and with risk reduction actions largely based on physical protection actions.
As a dominant profile, the following stand out:
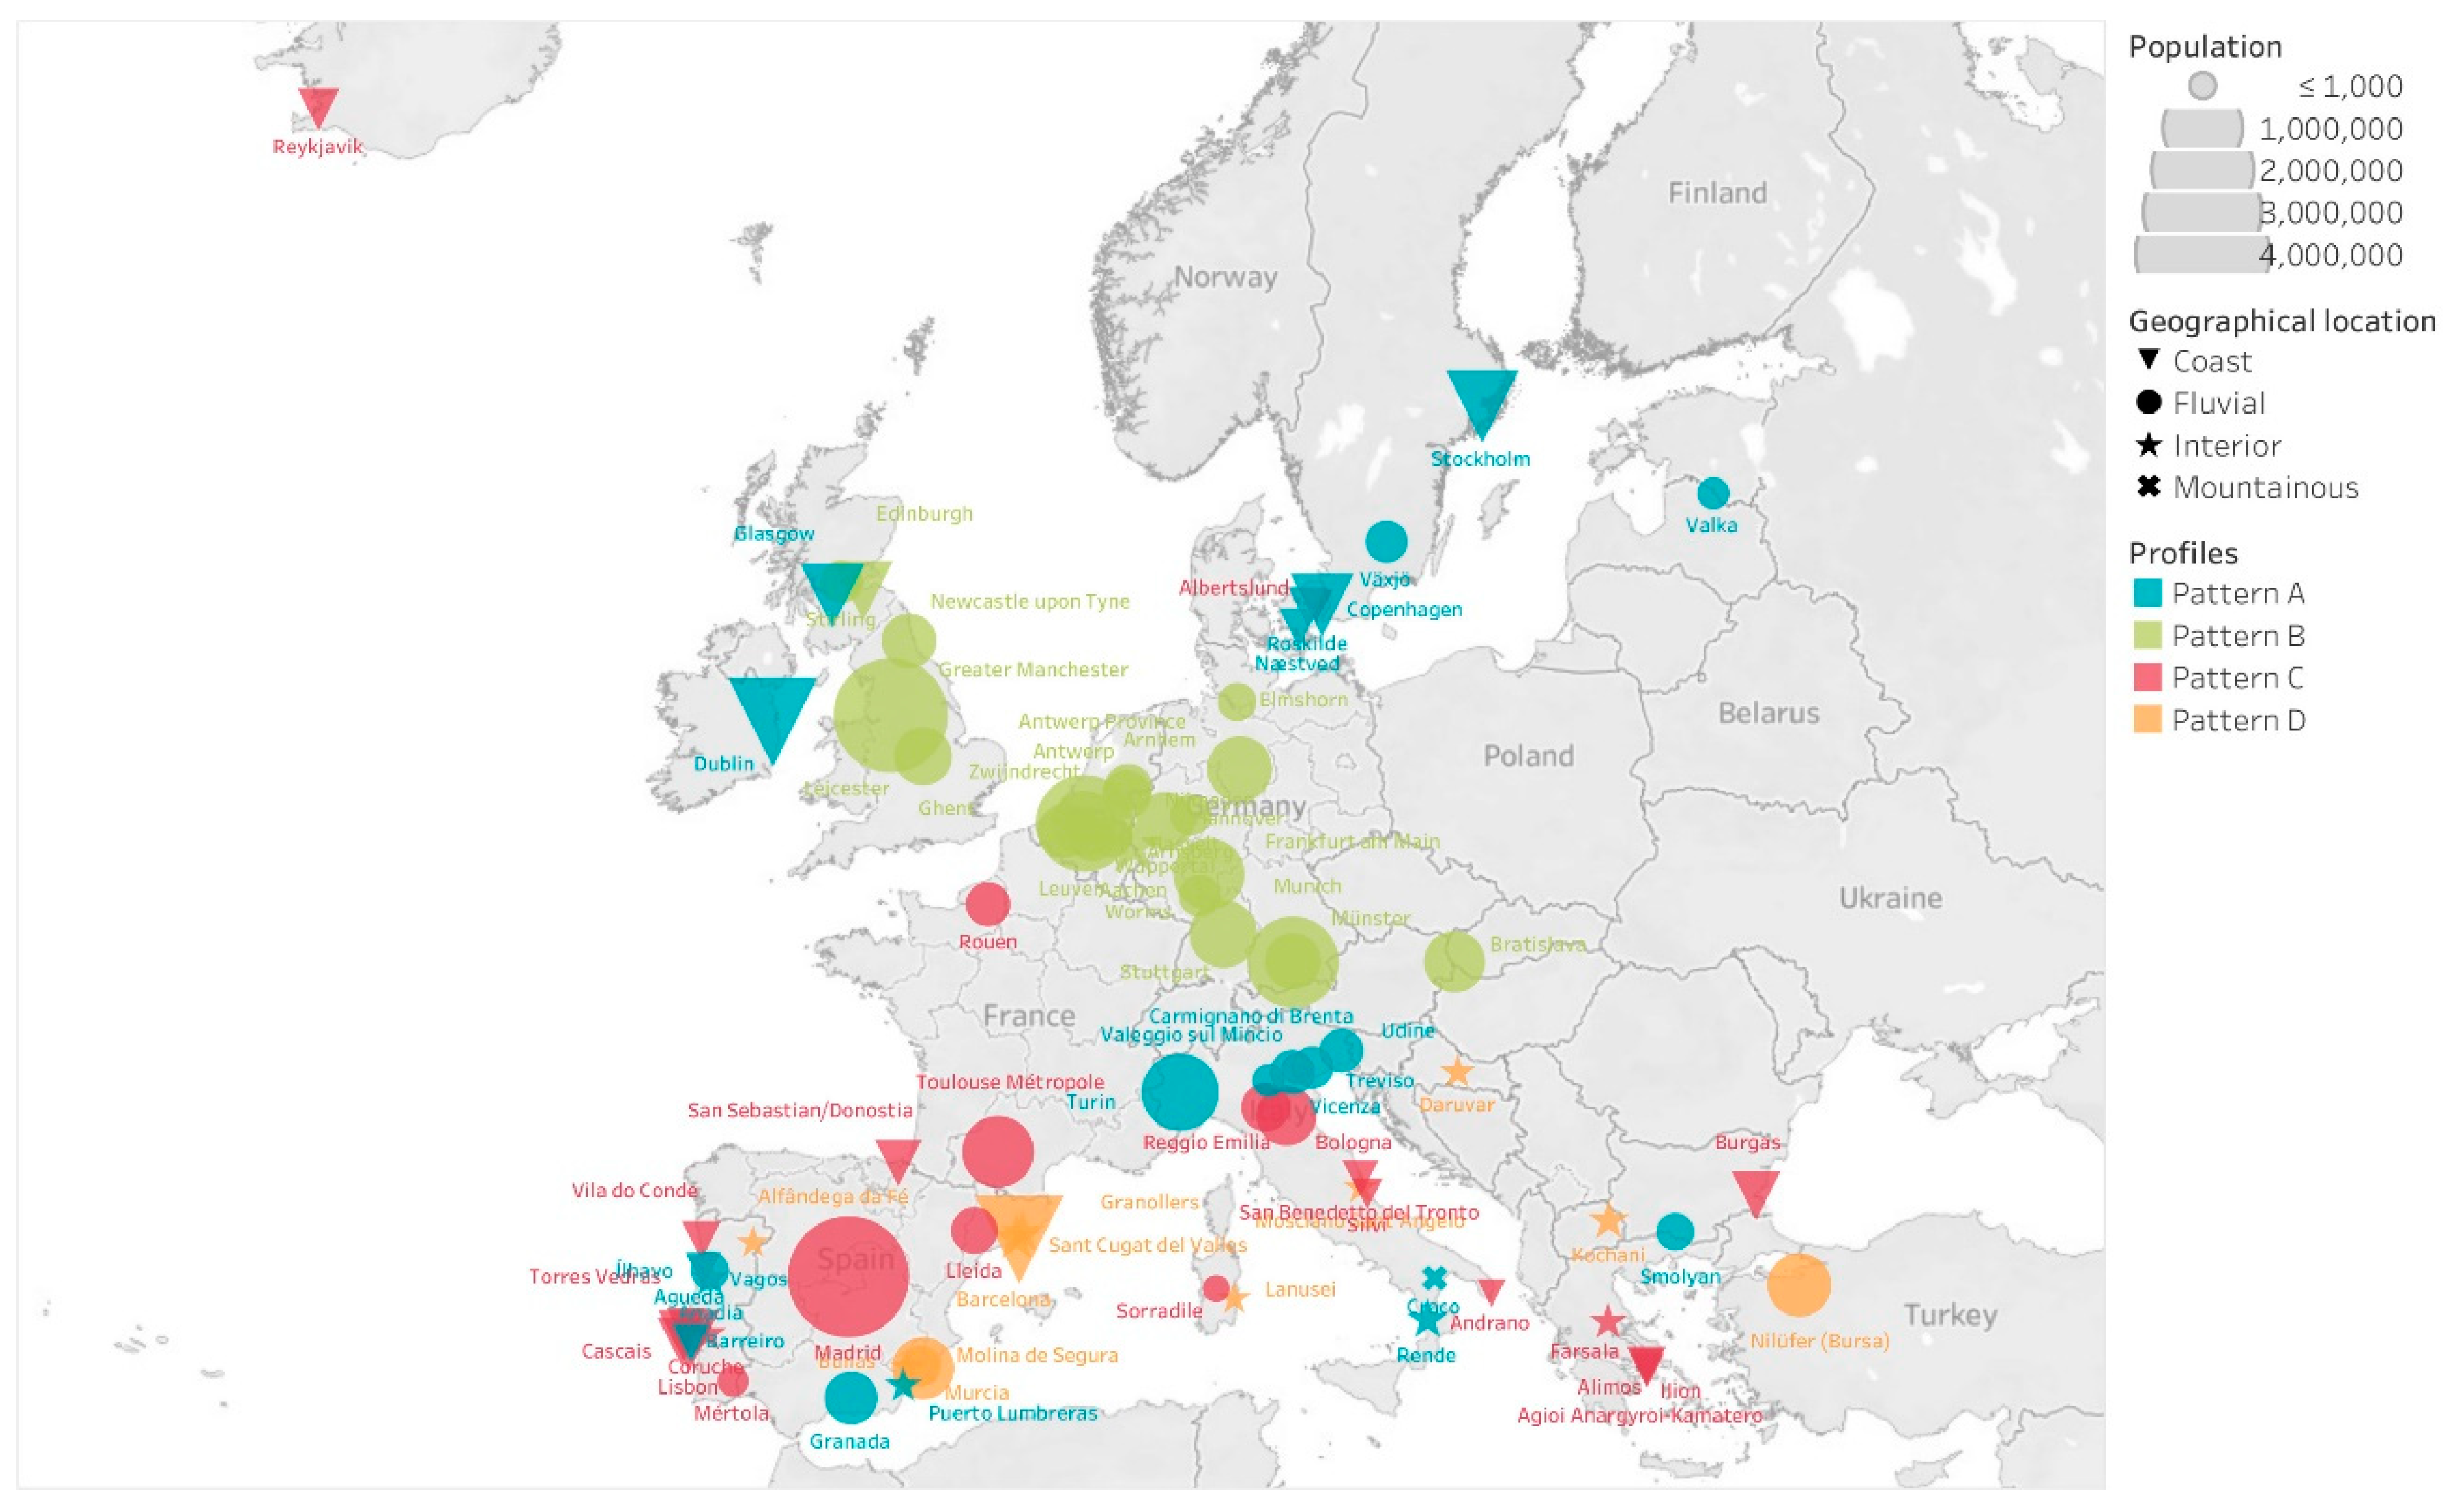
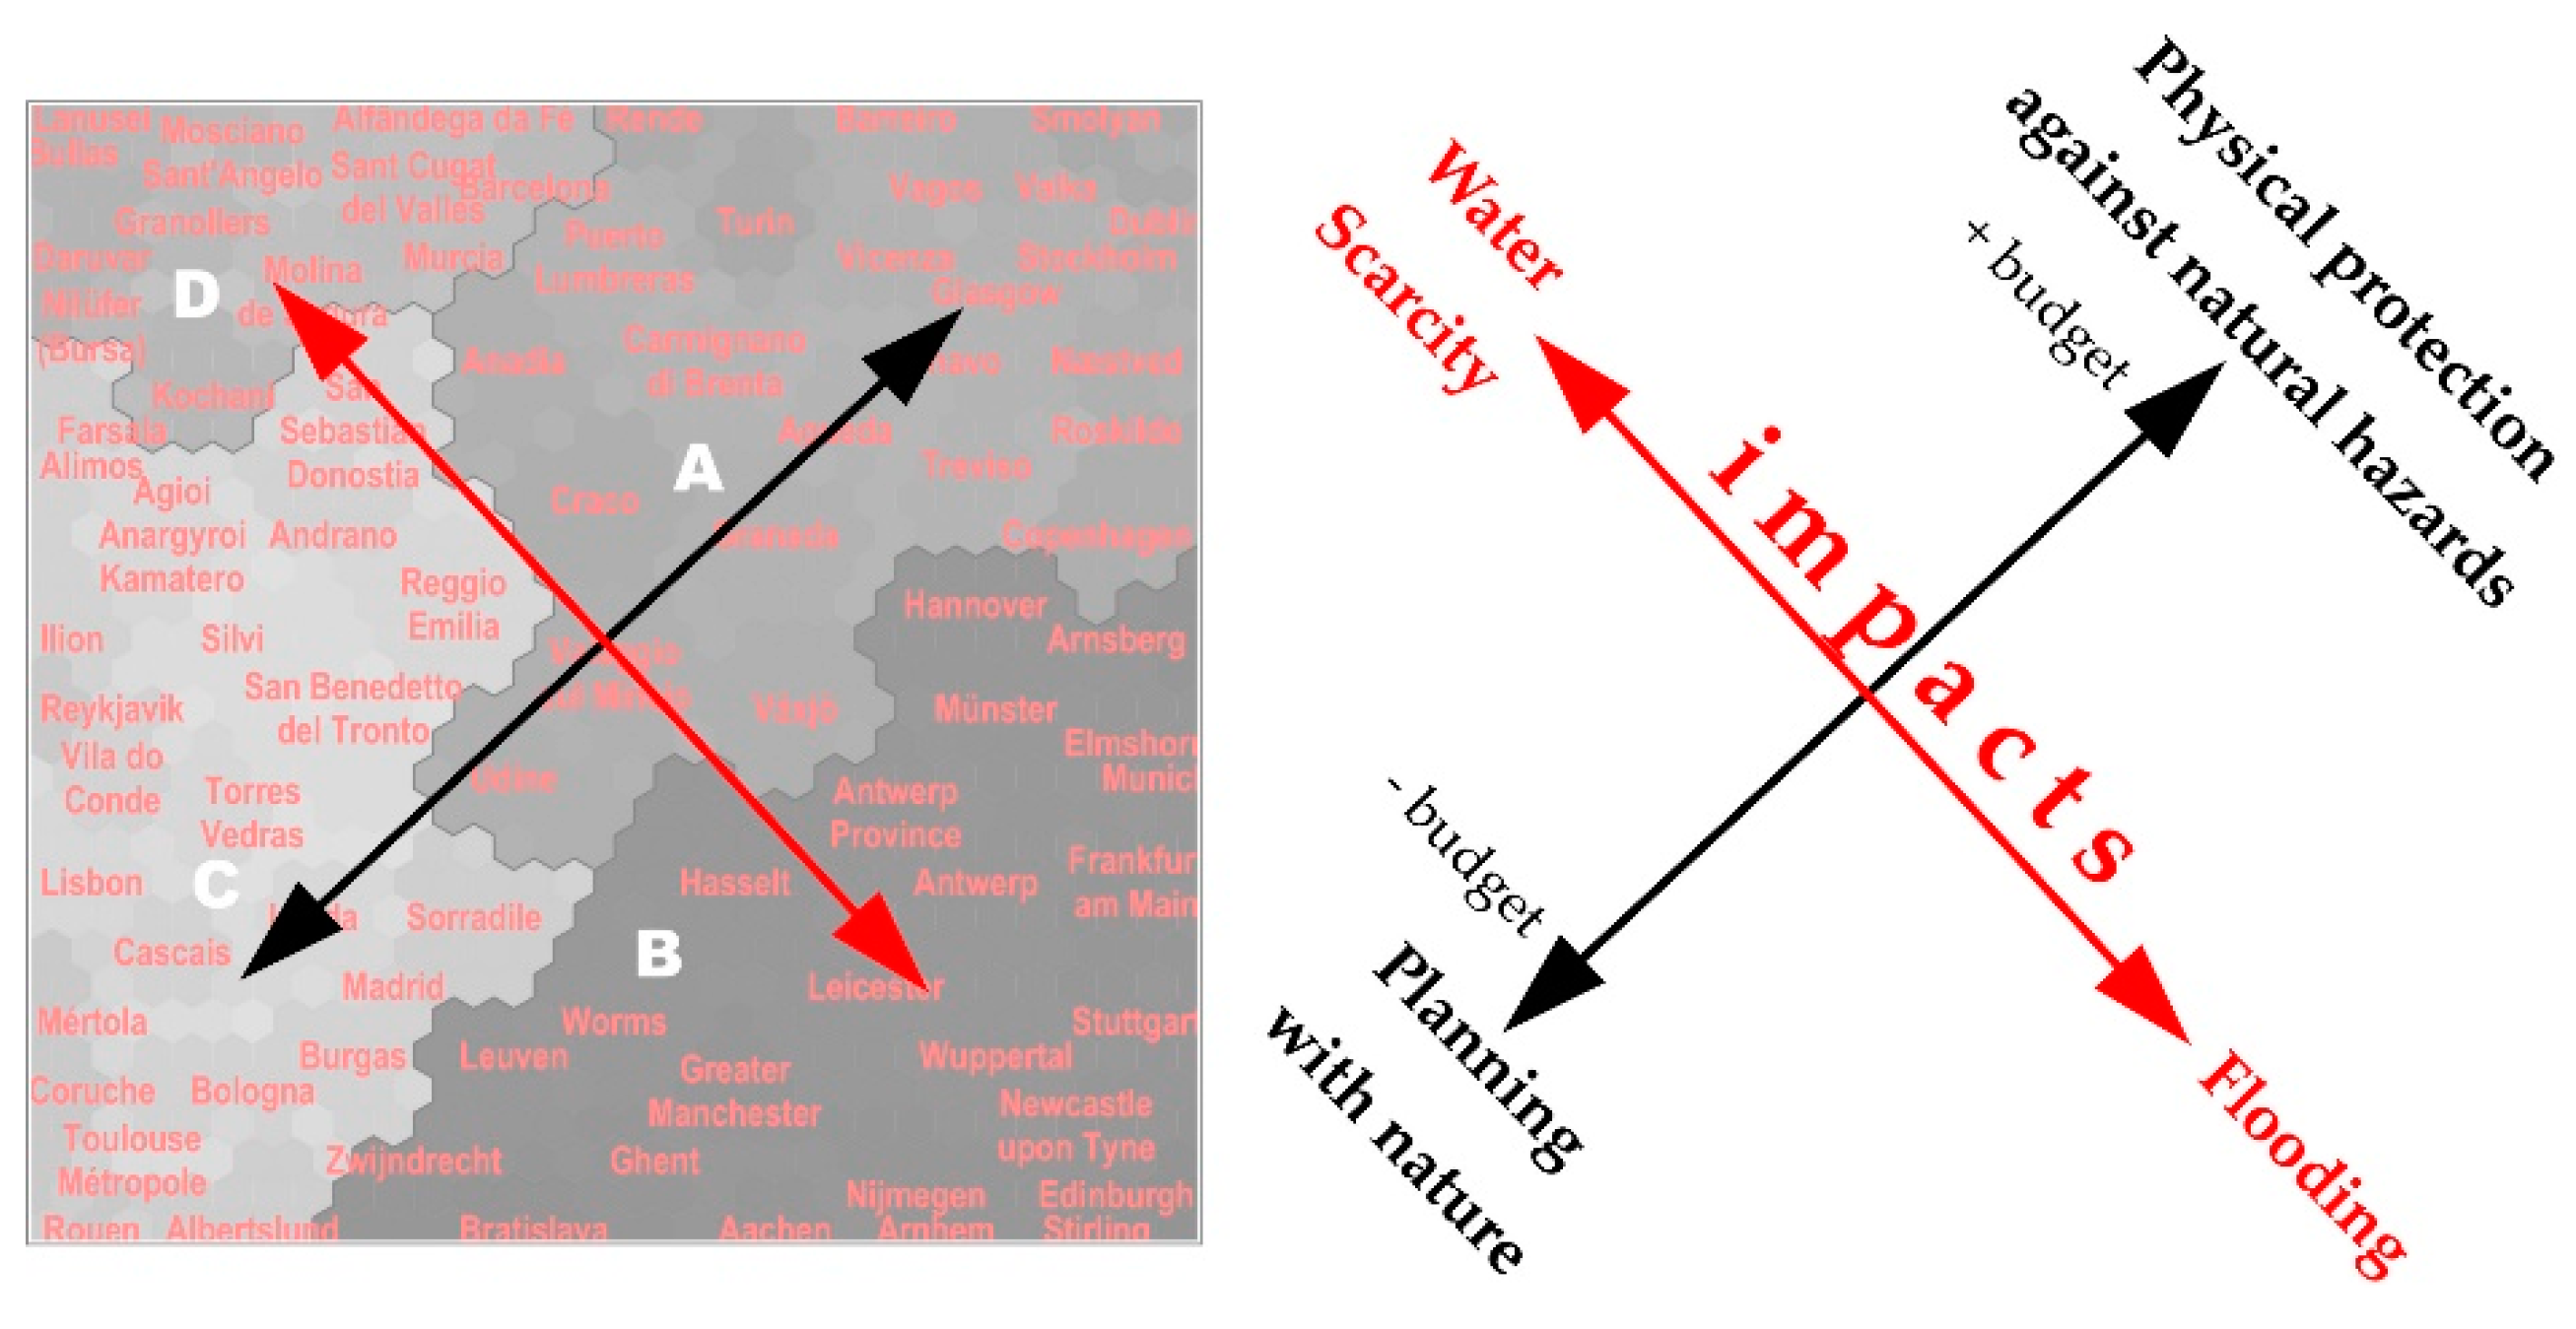
  • Profile 1, cities with risk reduction through physical protection: Cities in Portugal (OR = 5.7), Italy (OR = 2.2) and the Mediterranean region (OR = 6.7) often do not declare a disaster caused by climate change (OR = 4.8). A relatively small size of the effect of the impact of climate change by extreme temperatures (OR = 0.3) and droughts (OR = 0.2) compared to other effects such as flooding, sea level rise, etc. They have high economic motivation (OR = 9.0), with a very low focus on mitigation (OR = 19.41). Among the actions, those aimed at disaster reduction risk (OR = 8.3), such as the creation of dams, canals, or similar flood protections (OR = 18.2) and security against natural hazards (OR = 3.5) stand out. In this profile, we can find the good practices of the cities of Águeda, Anadia, Barreiro, Carmignano di Brenta, Glasgow, Granada, Ílhavo, Puerto Lumbreras, Rende, Stockholm, Treviso, Vagos and Vicenza.
As secondary profiles or variants of Pattern A:
  • Profile 15, mountain and forest cities, focusing on early warning and emission control: Smolyan and Valka.
  • Profile 6, mountain and/or river cities with high heritage value, focused on responsible land use: Craco, Udine, Valeggio sul Mincio and Växjö.
  • Profile 19, coastal heritage city, focused on protection against the rise of the sea and cultural goods: Dublin.
  • Profile 10, coastal cities, focusing on protection against rising sea levels through physical barriers and risk control areas: Copenhagen, Næstved and Roskilde.
  • Profile 13, cities focusing on private mitigation actions and economic protection for adaptation: Turin.
Pattern B, floodable river cities: This pattern is composed of 24 cities, primarily in river environments impacted by floods and storms. There is a clear focus on resilience improvement measures based on climate-based planning and urbanization with measures to improve flood prevention networks and systems.
As a dominant profile, the following stand out:
  • Profile 3, floodable river cities, mainly German, focused on climate-adapted planning: these are river cities (OR = 11.5), which include most of the German cities in the study (OR = ∞) and a UK city, located in the Atlantic (OR = 5.8) and continental regions (OR = 4.6), with impacts from flooding (OR = ∞) and storms (OR = 9.2). They focus mainly on disaster risk reduction actions (OR = 6.6) based on the fight against natural risks (OR = 4.0) and on resilience (OR = 7.6) and urban and planning actions (OR = ∞) as climate-adapted urbanization and landscape strategies (OR = 4.5). This includes the cities of Aachen, Arnsberg, Elmshorn, Frankfurt am Main, Greater Manchester, Hannover, Leicester, Munich, Münster, Stuttgart and Wuppertal.
As secondary profiles or variants of Pattern B:
  • Profile 4, mainly Belgian or nearby river cities, focusing on prevention and safety against heat waves and floods: Antwerp, Antwerp Province, Ghent, Hasselt, Leuven, Worms and Zwijndrecht.
  • Profile 12, Dutch river cities, with increased attention to extreme temperature impacts and flooding, focusing on natural protection actions: Arnhem and Nijmegen.
  • Profile 17, dry and floodable continental river cities, focusing on the naturalization of the medium and the city: Bratislava.
  • Profile 18, UK fluvial, dry, floodable and coastal cities, medium naturalization and city, business boost and safety measures against heat waves: Edinburgh.
  • Profile 14: English river cities, with a focus on self-protection, equity and business: Newcastle upon Tyne and Stirling.
Pattern C, mainly Mediterranean and coastal cities, focused on adaptation through conservation measures and planning sensitive to nature and climate: this pattern is made up of 24 cities, mainly in Mediterranean and coastal environments. Many of the measures focus on the environmental field, regenerating natural environments, creating natural corridors and connections with cities, improving biodiversity and certain measures towards mitigation.
As a dominant profile, the following stand out:
  • Profile 2, coastal cities that are focused on measures for the conservation, regeneration and protection of natural spaces and coastlines: coastal cities (OR = 32.6), mainly in Italian, Portuguese, Spanish and Mediterranean regions but also in the Arctic due to an Icelandic case. They show attention to the impact of sea level rise (OR = 13.4). They propose actions for the regeneration and naturalization of natural areas (OR = 12.5), especially aquatic areas (OR = 9.2), the creation of corridors (OR = 38.6) connected to the city (OR = 5.7), the improvement of biodiversity (OR = 11.6) and a regulatory approach (OR = 3.8). Although an indoor city is included, it shares the measures with the rest. This includes the cities of Andrano, Cascais, Lisbon, Reggio Emilia, Reykjavik, San Benedetto del Tronto, San Sebastian/Donostia, Silvi, Torres Vedras and Vila do Conde.
As secondary profiles or variants of Pattern C:
  • Profile 5, cities with drought, extreme temperatures and fires, focused on the promotion and regeneration of the natural and urban environment, climate-sensitive urbanization and protection against heat waves: Albertslund, Bologna, Burgas, Coruche, Lleida, Madrid, Mértola and Sorradile.
  • Profile 16, inland Atlantic river cities with extreme temperatures and water scarcity, focusing on mitigation, urban reuse, land-use reduction and social protection: Rouen and Toulouse Métropole.
  • Profile 8, Mediterranean coastal cities with extreme temperatures, focused on forest fire control and mitigation: including the cities of Agioi Anargyroi-Kamatero, Alimos, Farsala and Ilion.
Pattern D, inland cities with drought and water scarcity, focused on efficient water management: This pattern is made up of 12 cities, mainly Mediterranean and inland, with foreseen impacts due to high temperatures, water scarcity and drought. The main measure in which most of the cities in this pattern coincide is the actions to improve efficiency in the use and management of water.
As a dominant profile, the following stand out:
  • Profile 7, mainly Mediterranean inland or coastal cities with drought and extreme temperatures, which are focused on the management and saving of water and resources: Alfândega da Fé, Barcelona, Molina de Segura, Murcia and Sant Cugat del Valles.
As secondary profiles or variants of Pattern D:
  • Profile 9, inland continental cities with drought and extreme temperatures, focused on water saving, agricultural self-production and measures to improve natural spaces and urban regeneration: Daruvar, Kochani and Nilüfer (Bursa).
  • Profile 11, inland Mediterranean cities with drought and extreme temperatures and fires, focused on changing the agrarian system, saving water and resources, mitigation and awareness: Bullas, Granollers, Lanusei and Mosciano Sant’Angelo.

6. Discussion

Among the main specific results and contributions of this work, we have given the construction methodology and the strategic patterns and profiles finally obtained.
When analyzing the distribution of good practices among the different Profiles and Patterns, marking at the same time the country in which each city is inserted (Figure 9), it can be observed that in certain Profiles and Patterns, the presence of certain countries predominates.
However, the spatial representation of the obtained strategic patterns will undoubtedly be even more evident and conclusive (Figure 10), with relevant differences observed with respect to state-of-the-art studies that base their spatial distribution in the Northern, Eastern, Western and Southern European regions [18].
The most striking differences with respect to the state of the art are found in the distribution of Pattern B, related to flood impacts mainly in Central Europe, with its spatial distribution being observed throughout much of the Western region, but also in the Northern region and partially in the Eastern region. On the other hand, it can be verified that there are patterns in adaptation actions throughout Europe. However, instead of fitting into the European regions described by Aguiar et al. [18], namely bioregions (Figure 7 and Figure 8) or countries’ borders (Figure 9), they rather emerge in a more complex set of dimensions related to the impact of climate change. This is an important innovation compared to other similar works.
Among the dimensions with great impacts, the geographical location stands out, but it is also observed that it significantly affects the approach to responding to risk. In this sense, the analysis of the patterns and profiles obtained clearly shows the existence of different approaches when it comes to managing or planning (Figure 11). Some profiles are oriented towards protection against risk with important transformations and infrastructure (Pattern A), showing certain opposition to those who focus on planning with and towards nature (Pattern C), the former generally having a higher economic cost than the latter. These approaches are nuanced depending on the type of impact of expected climate change, with water scarcity (Pattern D) at one end, or floods generally at the other end (Pattern B), being decisive.
When analyzing the SOM map of the strategies obtained (Figure 6 and Figure 11), clear coincidences are observed, with the most urgent European vulnerabilities detected by Aguiar et al. in 2018 [18] as key elements, which are floods and water scarcity. Figure 11 shows a synthesis of the patterns observed in the strategy map obtained using the proposed SOM methodology. From the proposed patterns and profiles, it can be concluded that there is indeed no single way of planning for climate change in Europe, but that multiple interests and motivations can be observed [18,99], and consequently, different strategic approaches should be taken into account when building collaborative networks between interested municipalities.
If we analyze the limitations of the research, we can mention those presented by the SOM analysis methodology, which coincide with the shortcomings of the data with which it operates. The data with which we have worked have a certain limitation in the number of observations, which only reaches 84, which are the case studies expressly identified as good practices by the MA, but without having information to support that such selection responds to a specific methodology and criteria, which could be considered a weakness of such selection and consequently of this study. This number, without being high, does not present any problem to be used by the ANN SOM with robustness and efficiency. On the other hand, the data of each initiative have the added difficulty of specifying a non-automatic coding, especially when coding the actions proposed by the strategies. Undoubtedly, as Aguiar et al. notes in the Local Adaptation Strategies database they build, this type of work can be expanded and used to improve the understanding and promotion of local adaptation measures in Europe [18]. Likewise, certain interpretative difficulties can be attributed to the methodology of the work, typical of heuristic approaches in which there is no previously marked hypothesis to corroborate. However, the statistical analyses used (non-parametric tests and effect sizes) help in the interpretation process, avoiding interpretative arbitrariness in the process.
This paper proposes to open, or reinforce its scope of, certain lines of research linked to adaptation policies, European governance, or specifically in relation to institutional merges, which arose around the CoM for strategic purposes (Gesing, 2018). These suggestions illustrate the usefulness of the proposed method for identifying relevant issues from raw information:
(i) In quantitative terms, participation in the city network has reached very high levels, surpassing the 9600 signatory municipalities between the launch in 2008 and June 2019, with high repercussions in small cities [100,101]. The evaluation of the success of the MA in its year of life between 2014 and 2015 does not yield results as encouraging as those of the CoM, not even when analyzing the impact beyond 2015 of the initiatives inherited from the MA when integrated with the CoM through its merger in 2015 in the initiative CoM–C&E and in 2016 in the GCoM. Only 149 local authorities had signed by 8 February 2016 [55], compared with CoM’s 640 in a significantly shorter period of life [41]. If we consider the level of implementation of municipal adaptation plans or strategies as a qualitative indicator of the degree of development and involvement of municipalities in the initiative, we can observe that, in 2016, of the 84 good practices studied in this work, 33% of them were at a level of implementation and development catalogued as Level 1: Preparing the ground, 42% were at a medium level that includes Level 2: Assessing risk and vulnerabilities, Level 3: Identifying adaptation options and Level 4: Assessing adaptation options. Finally, only 21% were in Level 5: Implementation, and 4% in Level 6: Monitoring and evaluation. Bearing in mind that this is a selection of good practices, the data show the low level of development and implementation of most municipal strategies, since, at the end of the MA, 75% of them were still immersed in the strategic design phase. A simple quantitative analysis of information from the Covenant of Mayors portal [102] shows, as of June 2019, that the 177 declared adaptation actions could be considered as insignificant compared to the 6003 mitigation actions, obviously without evaluating the fact that a high number of signatories necessarily implies the achievement of their objectives [36]. Our work seems to enlighten that certainly an enormous loss of visibility and transcendence of the MA exists with respect to the already successful CoM, and consequently, there is a loss of relevance of adaptation actions with respect to mitigation actions, at least within the framework of the CoM initiative in its different stages. This should be verified by other research specifically geared towards policy and governance.
(ii) Another issue that this work suggests further research is the interest in building a battery of indicators to monitor the implementation of adaptation policies, which should be specifically designed for each strategic profile. The increasing frequency of extreme climate events [18] does not seem to be accompanied by consistent growth in actions focused on climate adaptation. One of the keys to CoM’s success and to the good progress made in approaching emission reduction and renewable energy production objectives [59] has been its quantitative approach [39], which is materialized in permanent monitoring and evaluation [65]. The MA presented its own monitoring and evaluation instruments, but with the institutional merger into the CoM–C&E, there is no doubt that the previous instruments of the CoM have served as the framework and practically the only reference for implementation, as can be seen in the statistics, infographics and general information compiled in the portal of the integrated initiative [102]. Without a doubt, the fact that the different CoM strategies share the instruments of monitoring and accounting for GHG reduction has favored an evaluation that makes it possible to compare the degree of implementation or success of measures, legitimizing the EU’s grants to municipalities in a transparent and quantitative manner, while also favoring networking, in a virtuous dynamic of collaboration and sharing of strategies and concrete actions for mitigation. On the other hand, in adaptation, insofar as each municipality appears to have unique and differentiated problems with respect to other territories, comparative monitoring has become difficult and questionable, and more seriously, networking has become equally difficult as local entities do not find similarities with other municipalities that encourage effort. Faced with this difficulty, this research offers a methodological framework that facilitates the creation of new networks for each pattern or strategic profile, thus ensuring that municipalities share much more than the impacts of climate change or a specific problem in isolation.
(iii) It is considered useful to improve the approach to adaptation as a new research challenge, and every effort must be made to incorporate it into decision-making processes [54], working towards the consolidation of transnational networks of knowledge and synergies [54,72] and the recovery of monitoring and information systems [54], and incorporating citizens as much as possible in the decision-making processes.
(iv) It will be interesting to assess the interest in implementing a system of accreditations, voluntary seals or certifications that recognize and make visible the effort, dedication and investment in the adaptation of both municipalities and supra-municipal institutions, and both public and private organizations and companies.
In any case, it should be remembered that CoM initiatives and therefore the MA have been useful in fostering coordination and increasing mutual trust among their participants [67], getting cities involved, making them a medium and target for climate actions [42], and allowing mayors to influence climate change initiatives [103].
Finally, it can be stated that by means of this research, the promotion of research that favors a holistic and global approach to the problem of adaptation can be considered key, making it easier and more robust to identify patterns between different geographical, political and strategic contexts, approaches, motivations, effects and impacts of climate change.

7. Conclusions

Municipal strategies belonging to the CoM initiative have delivered instruments for monitoring GHG reductions as a key mitigation measure at the European level over the last decade. However, its analogous initiative, the Mayor Adapt, has found difficulties in being able to compare the degree of implementation of their measures between different cities, since there are notable differences between the various strategies to be implemented to reduce exposure to the risks caused by climate change. Faced with this problem, this paper proposes a methodology to explore patterns in different adaptation strategies.
For this purpose, a holistic analysis was carried out of all available variables on each adaptation strategy of the good practices of the Mayors Adapt initiative. These include geographical dimensions, climate change impact, motivation and adaptation approach, and planned actions. A methodology based on techniques from the field of Artificial Intelligence was used, such as artificial neural networks and specifically using Self-Organizing Maps. It has been possible to identify differentiated strategic approaches based on these variables and features. Such patterns and profiles were statistically characterized by non-parametric tests and effect sizes. In the work, up to 19 different profiles of cities were detailed according to their strategies, encompassed in four patterns with common qualities. Among such patterns, together with those described in our results, two clearly differentiated groups should be highlighted. The first presents an eminently adaptive approach, which would include Patterns A and B described in our outcomes, with 48 cities, which are mainly fluvial, with recent floods, with a motivation towards the preservation of economic resources and reduction of natural risks through the provision and creation of infrastructure to limit exposure to risk. The second group includes 36 cities, included in Patterns C and D, usually located in the inland or in areas of coastal influence and specifically in the Mediterranean biogeographical region, with impacts mainly due to water scarcity and extreme temperatures, presenting a mainly environmental motivation, and which could be framed with a certain orientation towards mitigation and with methodologies based on activation, such as education and awareness and a dissemination of measures or the creation of planning networks.
The results of this work show a high variability between approaches and interests. This condition may have repercussions on the usefulness of municipal networks for the exchange of existing strategies, not facilitating the discussion of problems and minimally common solutions. Therefore, greater attention to city profiles may serve as a previous step for delivering tailor-made criteria to the appraisal and monitoring of initiatives. It can also guide a more effective way of generating city-networks that in spite of their geographical distance, are able to up-scale the impact of their individual efforts at the EU level.
Highlighting with a special emphasis on the relevance of local initiatives such as the Mayors Adapts or the Covenant of Mayors, this work formulated a series of future research and recommendations based on the discussion and conclusions reached, aimed at promoting adaptation actions within the European framework, in an attempt to reverse the scarcity dynamics of relative relevance and repercussion of adaptation initiatives in the face of climate change, always understood as a complement to mitigation initiatives, which have been widely recognized.
Future work could be linked to deepen the political and strategic considerations set out above, to extent to other European adaptation initiatives or to other territorial areas, to create a decision support system oriented to the recommendation of strategic adaptation actions, taking into account the approach and the local conditions of the municipality or towards the elaboration of performance indicators of the strategies of each of the profiles and/or patterns proposed in the work.

Author Contributions

Conceptualization, F.J.A.-A., M.L.N.-L. and L.M.V.-M.; Data curation, F.J.A.-A.; Formal analysis, F.J.A.-A.; Funding acquisition, L.M.V.-M.; Investigation, F.J.A.-A., M.L.N.-L., L.M.V.-M. and F.S.C.-S.; Methodology, F.J.A.-A.; Project administration, L.M.V.-M.; Software, F.J.A.-A.; Supervision, L.M.V.-M.; Validation, F.J.A.-A. and M.L.N.-L.; Writing—original draft, F.J.A.-A.; Writing—review & editing, F.J.A.-A., M.L.N.-L., L.M.V.-M. and F.S.C.-S.

Funding

This research was funded by Consejería de Economía, Innovación, Ciencia y Empleo, Andalusian Regional Government (Spain) grant number P12-RNM-1514. And The APC was funded by University of Granada (Spain).

Conflicts of Interest

The authors declare no conflict of interest.

References

  1. European Parliament; European Commission. European’s Attitude toward Climate Change. Special Eurobarometer; European Commission: Brussels, Belgium, 2008; Volume 300. [Google Scholar]
  2. Oliver-Solà, J.; Armero, M.; de Foix, B.M.; Rieradevall, J. Energy and environmental evaluation of municipal facilities: Case study in the province of Barcelona. Energy Policy 2013, 61, 920–930. [Google Scholar] [CrossRef]
  3. Lombardi, M.; Pazienza, P.; Rana, R. The EU environmental-energy policy for urban areas: The Covenant of Mayors, the ELENA program and the role of ESCos. Energy Policy 2016, 93, 33–40. [Google Scholar] [CrossRef]
  4. Amorim, E.V. Sustainable Energy Action Plans: Project Management Intercomparison. Procedia Technol. 2014, 16, 1183–1189. [Google Scholar] [CrossRef] [Green Version]
  5. European Commission. 20 20 by 2020 Europe’s Climate Change Opportunity; European Commission: Brussels, Belgium, 2008. [Google Scholar]
  6. European Commission, Covenant of Mayors. Reporting Guidelines on Sustainable Energy Action Plan and Monitoring; European Commission: Brussels, Belgium, 2014. [Google Scholar]
  7. Heyvaert, V. What’s in a name? The covenant of mayors as transnational environmental regulation. Rev. Eur. Comp. Int. Environ. Law 2013, 22, 78–90. [Google Scholar] [CrossRef]
  8. Kern, K.; Bulkeley, H. Cities, Europeanization and Multi-level Governance: Governing Climate Change through Transnational Municipal Networks. JCMS 2009, 47, 209–332. [Google Scholar] [CrossRef]
  9. European Commission. A Policy Framework for Climate and Energy in the Period from 2020 to 2030; European Commission: Brussels, Belgium, 2014. [Google Scholar]
  10. Climate ADAPT Mayors Adapt—The Covenant of Mayors Initiative on Adaptation to Climate Change. Available online: https://climate-adapt.eea.europa.eu/metadata/portals/mayors-adapt-the-covenant-of-mayors-initiative-on-adaptation-to-climate-change (accessed on 1 May 2019).
  11. European Commission. White Paper. Adapting to Climate Change: Towards a European Framework for Action; European Commission: Brussels, Belgium, 2009; p. 17. [Google Scholar]
  12. Kane, S.; Shogren, J.F. Linking adaptation and mitigation in climate change policy. Clim. Chang. 2000, 45, 75–102. [Google Scholar] [CrossRef]
  13. European Parliament; European Commission. Regulation No 1293/2013 on the establishment of a Programme for the Environment and Climate Action (LIFE) and repealing Regulation (EC) No 614/2007. Off. J. Eur. Union 2013, 24, L347/185. [Google Scholar]
  14. Committee of the Regions. Opinion of the Committee of the Regions—Towards an Integrated Urban Agenda for the EU. Off. J. Eur. Union 2014, 7, C271/11. [Google Scholar]
  15. Gesing, F. Transnational Municipal Climate Networks and the Politics of Standardisation: The Contested Role of Climate Data in the New Global Covenant of Mayors for Climate and Energy. Polit. Gov. 2018, 6, 126. [Google Scholar] [CrossRef]
  16. Pasimeni, M.R.; Valente, D.; Zurlini, G.; Petrosillo, I. The interplay between urban mitigation and adaptation strategies to face climate change in two European countries. Environ. Sci. Policy 2019, 95, 20–27. [Google Scholar] [CrossRef]
  17. Kona, A.; Melica, G.; Rivas Calvete, S.; Zancanella, P.; Iancu, A.; Gabrielaitiene, I.; Saheb, Y.; Janssens-Manhout, G.; Bertoldi, P. The Covenant of Mayors in Figures and Performance Indicators: 6-Year Assessment; Publications office of the European Union: Luxemburg, 2015; ISBN 978-92-79-45599-5. [Google Scholar]
  18. Aguiar, F.C.; Bentz, J.; Silva, J.M.N.; Fonseca, A.L.; Swart, R.; Santos, F.D.; Penha-Lopes, G. Adaptation to climate change at local level in Europe: An overview. Environ. Sci. Policy 2018, 86, 38–63. [Google Scholar] [CrossRef]
  19. Mayors Adapt City Profiles of Mayors Adapt. Available online: https://web.archive.org/web/20180412060004/http://climate-adapt.eea.europa.eu/eu-adaptation-policy/covenant-of-mayors/city-profile (accessed on 1 May 2019).
  20. Kona, A.; Bertoldi, P.; Monforti-Ferrario, F.; Rivas, S.; Dallemand, J.F. Covenant of mayors signatories leading the way towards 1.5 degree global warming pathway. Sustain. Cities Soc. 2018, 41, 568–575. [Google Scholar] [CrossRef]
  21. Kohonen, T. Self-organized formation of topologically correct feature maps. Biol. Cybern. 1982, 43, 59–69. [Google Scholar] [CrossRef]
  22. Kauko, T. Using the self-organising map to identify regularities across country-specific housing-market contexts. Environ. Plan. B Plan. Des. 2005, 32, 89–110. [Google Scholar] [CrossRef]
  23. Kohonen, T.; Oja, E.; Simula, O.; Visa, A.; Kangas, J. Engineering applications of the self-organizing map. Proc. IEEE 1996, 84, 1358–1384. [Google Scholar] [CrossRef]
  24. Kaski, S.; Kohonen, T. Exploratory Data Analysis by the Self-Organizing Map: Structures of Welfare and Poverty in the World. In Proceedings Third International Conference Neural Networks in Neural Networks Financial Engineering; World Scientific: Singapore, 1996; pp. 498–507. [Google Scholar]
  25. Kohonen, T. Self-Organizing Maps; Springer: Berlin/Heidelberg, Germany, 1995; ISBN 9783642852152. [Google Scholar]
  26. Diappi, L.; Bolchim, P.; Buscema, M. Improved Understanding of Urban Sprawl Using Neural Networks. In Recent Advances in Design and Decision Support Systems in Architecture and Urban Planning; Van-Leeuwen, J.P., Timmermans, H.J.P., Eds.; Springer: Politecn Milan, Dept Architecture and Planning, Milan, Italy, 2004; pp. 33–49. ISBN 1-4020-2408-8. [Google Scholar]
  27. Abarca-Alvarez, F.J.; Fernández-Avidad, Á. Generation of Downtown Planning-Ordinances using Self Organizing Maps. In Design & Decision Support Systems; Technische Universiteit Eindhoven: Eindhoven, The Netherlands, 2010; pp. 63–79. ISBN 978-90-6814-181-8. [Google Scholar]
  28. Sarlin, P. Exploiting the self-organizing financial stability map. Front. Artif. Intell. Appl. 2012, 243, 248–257. [Google Scholar] [CrossRef]
  29. Abarca-Alvarez, F.J.; Osuna-Pérez, F. Cartografías semánticas mediante redes neuronales: Los mapas auto-organizados (SOM) como representación de patrones y campos. EGA Rev. Expresión Gráfica Arquit. 2013, 18. [Google Scholar] [CrossRef]
  30. Yates, F. Contingency Tables Involving Small Numbers and the χ2 Test. Suppl. J. R. Stat. Soc. 1934, 1, 217–235. [Google Scholar] [CrossRef]
  31. Sullivan, G.M.; Feinn, R. Using Effect Size—Or Why the P Value Is Not Enough. J. Grad. Med. Educ. 2012, 4, 279–282. [Google Scholar] [CrossRef]
  32. Coe, R.; Merino, C. Magnitud del efecto: Una guía para investigadores y usuarios. Rev. Psicol. 2003, 21, 147–177. [Google Scholar]
  33. Chen, H.; Cohen, P.; Chen, S. How big is a big odds ratio? Interpreting the magnitudes of odds ratios in epidemiological studies. Commun. Stat. Simul. Comput. 2010, 39, 860–864. [Google Scholar] [CrossRef]
  34. European Commission. Action Plan for Energy Efficiency; European Commission: Brussels, Belgium, 2006. [Google Scholar]
  35. European Commission. Limiting Global Climate Change to 2 degrees Celsius. In The Way Ahead for 2020 and Beyond; European Commission: Brussels, Belgium, 2007. [Google Scholar]
  36. Christoforidis, G.C.; Chatzisavvas, K.C.; Lazarou, S.; Parisses, C. Covenant of Mayors initiative-Public perception issues and barriers in Greece. Energy Policy 2013, 60, 643–655. [Google Scholar] [CrossRef]
  37. European Parliament. Directive 2010/31/EU of the European Parliament and of the Council of 19 May 2010 on the energy performance of buildings. Off. J. Eur. Union 2010, 23, L153/13. [Google Scholar]
  38. CoM Covenant of Mayors—Europe Office. Available online: https://www.covenantofmayors.eu/ (accessed on 1 June 2019).
  39. Famoso, F.; Lanzafame, R.; Monforte, P.; Scandura, P.F. Analysis of the covenant of mayors initiative in sicily. Energy Procedia 2015, 81, 482–492. [Google Scholar] [CrossRef]
  40. Kemmerzell, J. Innovations in European climate governance and their impact on local climate policy: An analysis of German major cities. In Climate Change in Cities Innovations in a Multi-Level Governance; Hughes, S., Chu, E.K., Mason, S.G., Eds.; Springer: Berlin/Heidelberg, Germany, 2018; pp. 39–57. ISBN 9783319650036. [Google Scholar]
  41. Van Staden, M.; Musco, F. Local Governments and Climate Change: Sustainable Energy Planning and Implementation in Small and Medium Sized Communities; Springer: Berlin/Heidelberg, Germany, 2010; ISBN 9781402095313. [Google Scholar]
  42. Kona, A.; Melica, G.; Koffi, B.; Iancu, A.; Zancanella, P.; Calvete, S.R.; Bertoldi, P.; Janssens-Maenhout, G.; Monforti-Ferrario, F. Covenant of Mayors: Greenhouse Gas Emissions Achievements and Projections; Publications office of the European Union: Luxemburg, 2016; ISBN 9789279630224. [Google Scholar]
  43. Bertoldi, P.; Kona, A.; Rivas, S.; Dallemand, J.F. Towards a global comprehensive and transparent framework for cities and local governments enabling an effective contribution to the Paris climate agreement. Curr. Opin. Environ. Sustain. 2018, 30, 67–74. [Google Scholar] [CrossRef]
  44. Committee of the Regions. Opinion of the Committee of the Regions—A policy framework for climate and energy in the period from 2020 to 2030. Off. J. Eur. Union 2014, 4, C415/14. [Google Scholar]
  45. European Commission. Green Paper. Adapting to Climate Change in Europe—Options for EU Action; European Commission: Brussels, Belgium, 2007. [Google Scholar]
  46. European Commission. An EU Strategy on Adaptation to Climate Change; European Commission: Brussels, Belgium, 2013. [Google Scholar]
  47. Mayors Adapt Mayors Adapt Signature. Available online: https://www.covenantofmayors.eu/news-and-events/events/previous-events/397-mayors-adapt-signature-ceremony.html (accessed on 1 May 2019).
  48. European Commission. European Commission Joins Forces with European Cities to Tackle Climate Change; European Commission: Brussels, Belgium, 2014; Volume MEMO/14/20. [Google Scholar]
  49. Castán Broto, V.; Bulkeley, H. A survey of urban climate change experiments in 100 cities. Glob. Environ. Chang. 2013, 23, 92–102. [Google Scholar] [CrossRef] [PubMed]
  50. URBACT Mayors Adapt: The Covenant of Mayors new initiative on Adaptation to Climate Change. Available online: https://urbact.eu/mayors-adapt-covenant-mayors-new-initiative-adaptation-climate-change (accessed on 1 May 2019).
  51. European Environment Agency Mayors Adapt Available online:. Available online: https://www.eea.europa.eu/data-and-maps/data-providers-and-partners/mayors-adapt (accessed on 1 May 2019).
  52. Committee of the Regions. Resolution on the European Commission’s Work Programme 2015. Off. J. Eur. Union 2015, 6, C140/1. [Google Scholar]
  53. Climate ADAPT Covenant of Mayors. Available online: https://climate-adapt.eea.europa.eu/eu-adaptation-policy/covenant-of-mayors (accessed on 1 May 2019).
  54. Pietrapertosa, F.; Khokhlov, V.; Salvia, M.; Cosmi, C. Climate change adaptation policies and plans: A survey in 11 South East European countries. Renew. Sustain. Energy Rev. 2018, 81, 3041–3050. [Google Scholar] [CrossRef]
  55. Mayors Adapt Participating Cities/Provinces. Mayor Adapt Signatories. Available online: https://web.archive.org/web/20160513200508/http://mayors-adapt.eu/taking-action/participating-cities/ (accessed on 1 May 2019).
  56. European Environment Agency the European Climate Adaptation Platform Climate-ADAPT. Available online: https://climate-adapt.eea.europa.eu (accessed on 1 May 2019).
  57. Mayors Adapt Participation of 650 European cities in European and global city initiatives related to adaptation. Available online: https://www.eea.europa.eu/data-and-maps/figures/participation-of-650-european-cities-2 (accessed on 1 May 2019).
  58. GCoM. Global Covenant of Mayors for Climate & Energy; European Commission: Brussels, Belgium, 2018. [Google Scholar]
  59. Pablo-Romero, M.P.; Pozo-Barajas, R.; Sánchez-Braza, A. Analyzing the effects of the benchmark local initiatives of Covenant of Mayors signatories. J. Clean. Prod. 2018, 176, 159–174. [Google Scholar] [CrossRef]
  60. Monforti-Ferrario, F.; Kona, A.; Peduzzi, E.; Pernigotti, D.; Pisoni, E. The impact on air quality of energy saving measures in the major cities signatories of the Covenant of Mayors initiative. Environ. Int. 2018, 118, 222–234. [Google Scholar] [CrossRef] [PubMed]
  61. Croci, E.; Lucchitta, B.; Janssens-Maenhout, G.; Martelli, S.; Molteni, T. Urban CO2 mitigation strategies under the Covenant of Mayors: An assessment of 124 European cities. J. Clean. Prod. 2017, 169, 161–177. [Google Scholar] [CrossRef]
  62. Kamenders, A.; Rosa, M.; Kass, K. Low carbon municipalities. The impact of energy management on climate mitigation at local scale. Energy Procedia 2017, 128, 172–178. [Google Scholar] [CrossRef]
  63. Yalçin, M.; Lefèvre, B. Local Climate Action Plans in France: Emergence, Limitations and Conditions for Success. Environ. Policy Gov. 2012, 22, 104–115. [Google Scholar] [CrossRef]
  64. Hoff, J.V.; Strobel, B.W. A Municipal ‘Climate Revolution’? The Shaping of Municipal Climate Change Policies. J. Transdiscipl. Environ. Stud. 2013, 12, 4–16. [Google Scholar]
  65. Delponte, I.; Pittaluga, I.; Schenone, C. Monitoring and evaluation of Sustainable Energy Action Plan: Practice and perspective. Energy Policy 2017, 100, 9–17. [Google Scholar] [CrossRef]
  66. Coelho, S.; Russo, M.; Oliveira, R.; Monteiro, A.; Lopes, M.; Borrego, C. Sustainable energy action plans at city level: A Portuguese experience and perception. J. Clean. Prod. 2018, 176, 1223–1230. [Google Scholar] [CrossRef] [Green Version]
  67. Domorenok, E. Voluntary instruments for ambitious objectives? The experience of the EU Covenant of Mayors. Env. Polit. 2019, 28, 293–314. [Google Scholar] [CrossRef]
  68. Zahran, S.; Grover, H.; Brody, S.D.; Vedlitz, A. Risk, Stress, and Capacity: Explaining Metropolitan Commitment to Climate Protection. Urban Aff. Rev. 2008, 43, 447–474. [Google Scholar] [CrossRef]
  69. Krause, R.M. Policy innovation, intergovernmental relations, and the adoption of climate protection initiatives by US cities. J. Urban Aff. 2011, 33, 45–60. [Google Scholar] [CrossRef]
  70. Sharp, E.B.; Daley, D.M.; Lynch, M.S. Understanding local adoption and implementation of climate change mitigation policy. Urban Aff. Rev. 2011, 47, 433–457. [Google Scholar] [CrossRef]
  71. Wang, R. Leaders, followers, and laggards: Adoption of the US Conference of Mayors Climate Protection Agreement in California. Environ. Plan. C Gov. Policy 2012, 30, 1116–1128. [Google Scholar] [CrossRef]
  72. Lee, T. Local energy agencies and cities’ participation in translocal climate governance. Environ. Policy Gov. 2018, 28, 131–140. [Google Scholar] [CrossRef]
  73. Cipriano, X.; Gamboa, G.; Danov, S.; Mor, G.; Cipriano, J. Developing indicators to improve energy action plans in municipalities: An accounting framework based on the fund-flow model. Sustain. Cities Soc. 2017, 32, 263. [Google Scholar] [CrossRef]
  74. Dall’O’, G.; Norese, M.F.; Galante, A.; Novello, C. A multi-criteria methodology to support public administration decision making concerning sustainable energy action plans. Energies 2013, 6, 4308–4330. [Google Scholar] [CrossRef]
  75. Marinakis, V.; Doukas, H.; Xidonas, P.; Zopounidis, C. Multicriteria decision support in local energy planning: An evaluation of alternative scenarios for the Sustainable Energy Action Plan. Omega (UK) 2017, 69, 1–16. [Google Scholar] [CrossRef]
  76. Kyriakarakos, G.; Patlitzianas, K.; Damasiotis, M.; Papastefanakis, D. A fuzzy cognitive maps decision support system for renewables local planning. Renew. Sustain. Energy Rev. 2014, 39, 209–222. [Google Scholar] [CrossRef]
  77. Reckien, D.; Flacke, J.; Dawson, R.J.; Heidrich, O.; Olazabal, M.; Foley, A.; Hamann, J.J.P.; Orru, H.; Salvia, M.; de Gregorio Hurtado, S.; et al. Climate change response in Europe: What’s the reality? Analysis of adaptation and mitigation plans from 200 urban areas in 11 countries. Clim. Chang. 2014, 122, 331–340. [Google Scholar] [CrossRef]
  78. Vogel, B.; Henstra, D. Studying local climate adaptation: A heuristic research framework for comparative policy analysis. Glob. Environ. Chang. 2015, 31, 110–120. [Google Scholar] [CrossRef]
  79. Grandin, J.; Haarstad, H.; Kjærås, K.; Bouzarovski, S. The politics of rapid urban transformation. Curr. Opin. Environ. Sustain. 2018, 31, 16–22. [Google Scholar] [CrossRef]
  80. European Environment Agency. European Biogeographical Regions and the Regional Seas; European Environment Agency: Copenhagen, Denmark, 2007. [Google Scholar]
  81. World Bank Population Total. Available online: https://data.worldbank.org/indicator/SP.POP.TOTL (accessed on 1 May 2019).
  82. Park, D.H.; Kim, H.K.; Choi, I.Y.; Kim, J.K. A literature review and classification of recommender systems research. Expert Syst. Appl. 2012, 39, 10059–10072. [Google Scholar] [CrossRef]
  83. Martín Guerrero, J.D.; Marcelli, D.; Soria-Olivas, E.; Mari, F.; Martínez-Martínez, J.M.; Soley Bech, I.; Martínez-Sober, M.; Scatizzi, L.; Gómez-Sanchis, J.; Stopper, A.; et al. Self-Organising Maps: A new way to screen the level of satisfaction of dialysis patients. Expert Syst. Appl. 2012, 39, 8793–8798. [Google Scholar] [CrossRef]
  84. Bação, F.; Lobo, V.; Painho, M. Self-organizing maps as substitutes for k-means clustering. Comput. Sci. 2005, 3516, 476–483. [Google Scholar] [CrossRef]
  85. Kropp, J. A neural network approach to the analysis of city systems. Appl. Geogr. 1998, 18, 83–96. [Google Scholar] [CrossRef]
  86. Júnior, E.L.A.G.; Breda, G.D.; Marques, E.Z.; de Souza Mendes, L. Knowledge Discovery: Data Mining by Self-Organizing Maps; Springer: Berlin/Heidelberg, Germany, 2013; pp. 185–200. [Google Scholar]
  87. Vesanto, J. SOM-based data visualization methods. Intell. Data Anal. 1999, 3, 111–126. [Google Scholar] [CrossRef]
  88. Cottrell, M.; Ibbou, S.; Letrémy, P. SOM-based algorithms for qualitative variables. Neural Netw. 2004, 17, 1149–1167. [Google Scholar] [CrossRef] [PubMed] [Green Version]
  89. Ward, J.H., Jr. Hierarchical Grouping to Optimize an Objective Function. J. Am. Stat. Assoc. 1963, 58, 236–244. [Google Scholar] [CrossRef]
  90. Tabrizi, T.S.; Khoie, M.R.; Sahebkar, E.; Rahimi, S.; Marhamatil, N. Towards a Patient Satisfaction Based Hospital Recommendation System. In Proceedings of the 2016 International Joint Conference on Neural Networks (IJCNN), Vancouver, BC, Canada, 24–29 July 2016; pp. 131–138. [Google Scholar]
  91. Ketchen, D.J.; Shook, C.L. The Application of Cluster Analysis in Strategic Management Reseach: An Anlysis and Critique. Strateg. Manag. J. 1996, 17, 441–458. [Google Scholar] [CrossRef]
  92. Zhao, Q.; Xu, M.; Fränti, P. Sum-of-Squares Based Cluster Validity Index and Significance Analysis. In Proceedings of the 9th International Conference on Adaptative and Natural Computing Algorithms, ICANNGA, Kuopio, Finland, April 2009; Springer: Berlin/Heidelberg, Germany, 2009; Volume 9, pp. 313–322. ISBN 978-3-642-04920-0. [Google Scholar]
  93. Ball, G.H.; Hall, D.J. A Novel Method of Data Analysis And pattern Classification; Standford Research Institute: Menlo Park, CA, USA, 1965. [Google Scholar]
  94. Calinski, T.; Harabasz, J. A Dendrite Method for Cluster Analysis. Commun. Stat. 1974, 3, 1–27. [Google Scholar]
  95. Davies, D.L.; Bouldin, D.W. A Cluster Separation Measure. IEEE Trans. Pattern Anal. Mach. Intell. 1979, PAMI-1, 224–227. [Google Scholar] [CrossRef]
  96. Lletí, R.; Ortiz, M.C.; Sarabia, L.A.; Sánchez, M.S. Selecting variables for k-means cluster analysis by using a genetic algorithm that optimises the silhouettes. Anal. Chim. Acta 2004, 515, 87–100. [Google Scholar] [CrossRef]
  97. Hair, J.F., Jr.; Black, W.C.; Babin, B.J.; Anderson, R.E. Multivariate Data Analysis, 7th ed.; Prentice Hall: Upper Saddle River, NJ, USA, 2009; ISBN 9780138132637. [Google Scholar]
  98. Wasserstein, R.L.; Lazar, N.A. The ASA’s statement on p-values: Context, process, and purpose. Am. Stat. 2016, 1305. [Google Scholar] [CrossRef]
  99. Heidrich, O.; Reckien, D.; Olazabal, M.; Foley, A.; Salvia, M.; de Gregorio Hurtado, S.; Orru, H.; Flacke, J.; Geneletti, D.; Pietrapertosa, F.; et al. National climate policies across Europe and their impacts on cities strategies. J. Environ. Manag. 2016, 168, 36–45. [Google Scholar] [CrossRef] [Green Version]
  100. Melica, G.; Bertoldi, P.; Kona, A.; Iancu, A.; Rivas, S.; Zancanella, P. Multilevel governance of sustainable energy policies: The role of regions and provinces to support the participation of small local authorities in the Covenant of Mayors. Sustain. Cities Soc. 2018, 39, 729–739. [Google Scholar] [CrossRef]
  101. Matak, N.; Krajačić, G.; Pilato, A.M. Integrating sustainable energy action plans for island municipalities: Case study of Korcula. Therm. Sci. 2016, 20, 1037–1048. [Google Scholar] [CrossRef] [Green Version]
  102. CoM Good Practices. Available online: https://www.covenantofmayors.eu/plans-and-actions/good-practices.html (accessed on 23 June 2019).
  103. Radulovic, D.; Skok, S.; Kirincic, V. Energy efficiency public lighting management in the cities. Energy 2011, 36, 1908–1915. [Google Scholar] [CrossRef]
Figure 1. (a) Implementation of the Covenant of Mayors (CoM) by 2016 [42]; (b) CoM signatories with monitoring reports in the CoM Monitoring Emission Inventory dataset 2016 [42]. Source: Kona et al., 2016.
Applsci 09 03859 g001
Figure 2. Participation of 650 European cities in European and global city initiatives related to adaptation [57]. The map lists the number of European and international initiatives with a relation to climate-change adaptation in which cities are involved [57]. Source: https://www.eea.europa.eu.
Applsci 09 03859 g002
Figure 3. Distribution by country of Climate Impact. Source: Compiled by the authors from Mayors Adapt information [19].
Applsci 09 03859 g003
Figure 4. Distribution of Climate Impacts in different biogeographical regions (top) and different geographical locations (bottom). Source: Compiled by the authors from Mayors Adapt information [19].
Applsci 09 03859 g004
Figure 5. Distribution of the 84 good practices of the Mayors Adapt initiative. The population of the city, the geographical location and the biogeographical region to which the municipality belongs are indicated. Source: compiled by the authors from Mayors Adapt information [19].
Applsci 09 03859 g005
Figure 6. Maps of Mayors Adapt (MA) adaptation strategies. Obtained by means of Self-Organizing Maps (SOM). You can see in both figures the same location in the map of each municipal strategy. According to the operation of the SOMs, the closer the map is, the greater the similarity of the input variables. Two different classifications are shown: (a) classification in four main clusters or Patterns; (b) classification in 19 clusters or Profiles. Source: Compiled by the authors.
Applsci 09 03859 g006
Figure 7. Distribution of initiatives according to Climate Impacts in the different biogeographical regions for each of the patterns. Source: Compiled by the authors.
Applsci 09 03859 g007
Figure 8. Distribution of the initiatives according to the vulnerable sectors facing climate change in the different biogeographical regions for each one of the four patterns. Source: Compiled by the authors.
Applsci 09 03859 g008
Figure 9. Distribution of the Mayors Adapt initiative’s good practices developed in each country for each profile and pattern determined in the research. Source: Compiled by the authors.
Applsci 09 03859 g009
Figure 10. Spatial distribution of the four strategic patterns of initiatives found in the research among the 84 good practices of the Mayors Adapt initiative. The population of the city and the geographical location to which the municipality belongs are indicated. Source: compiled by the authors.
Applsci 09 03859 g010
Figure 11. Synthetic scheme of the patterns observed in the map of municipal strategies created by means of the SOM methodology. Source: Compiled by the authors.
Applsci 09 03859 g011
Table 1. Available and/or coded data for each “good practice” of the Mayors Adapt initiative. Source: Compiled by the authors from Mayors Adapt information [19].
TopicsSubtopicsCategories
Geographical locationFluvial, coast, interior or mountainous.
CountryBelgium, Bulgaria, Croatia, Czech Republic, Denmark, France, Germany, Greece, Iceland, Ireland, Italy, Latvia, Macedonia, Netherlands, Portugal, Spain, Sweden, Turkey or United Kingdom.
Biogeographical regions [80]Mediterranean, Atlantic, Continental, Boreal, Mountain or Arctic.
Catastrophe declarationYes/No
Climate Change ImpactsExtreme Temperatures, Water Scarcity, Flooding, Sea Level Rise, Droughts, Storms, Ice and Snow and Forest Fires.
MotivationEnvironmental, Social or Economical.
ActionsAgricultureTransformation of methodologies of agricultural production, Self-production or Urban agriculture.
Biodiversity, Environment, Air Management and ForestryWaste management, Optimization of resource consumption, Climate comfort, Water spaces of environmental value, Conservation-preservation or protection of land, Regeneration and naturalization of natural spaces, Creation of natural corridors, Improve albedo, Improvement or preservation of biodiversity, Forest fire alert plan, Firewall on hills and/or provision of facilities for fire, Reducing carbon emissions or Development of carbon sinks.
BuildingsImprovement of resistance or protection of vulnerable equipment or housing, Green roofs, Green or energy-saving facades, Reusing obsolete typologies, Impulse of social facilities or Protection of cultural heritage beings.
Disaster Risk ReductionSecurity against natural hazards, Resilience, Self-Protection, Creation of dams, canals, or similar flood protections, Avoid risk areas, Climate or vulnerability map or climate records, Equality or social protection.
Energy ManagementEnergy efficiency, Improving public buildings energy efficiency or Improving private buildings energy efficiency.
FinancialEconomic protection (insurance, etc.), Monitoring of tourist indicators or Encouraging economic activities that reduce climate exposure.
HeathImprovement in food and water quality and safety, Measures for safety against heat waves or Pest management and disease control
Transport or MobilitySustainable mobility: safe streets and reduction of private vehicles and Connecting cycling routes to the network of regional parks.
Urban and Spatial PlanningIncrease or improvement of free or green spaces, Urban connection to natural corridors, Strategies for urbanization and landscaping adapted to the climate -water, air, sun, etc., Optimization of the location of urban developments, Regeneration and renovation of abandoned or deteriorated areas or Reduction of land consumption or increase density.
Water ManagementSecurity and guarantee of supplies and networks, Efficiency in the use and management of water, Improvement of storm networks or systems to prevent flooding, Control and management of groundwater, Spaces or places to control excessive rainfall and Permeable surfaces.
FocusingAdaptation-Driven Actions and Mitigation-Driven Actions
MethodologySelf-GoverningPeople Initiatives and Business Initiatives.
Enabling methodsEducation and awareness, Creation and dissemination of networks, knowledge and collective work, Facilitate the exchange of goods, resources and information, Coordination or supervision, Knowledge creation or Simulation or research.
RegulationsIncentives, Planning, Regulations and Plans.
Provision methodsPhysical transformation and Human resources for risk prevention.
Level of ImplementationLevel 1: Preparing the ground, Level 2: Assessing risk and vulnerabilities, Level 3: Identifying adaptation options, Level 4: Assessing adaptation options, Level 5: Implementation, Level 6: Monitoring and evaluation.
Difficulty of ImplementationDifficulty: 1 to 5.
Table 2. Comparison between the case studies of Aguiar et al., 2018 [18] and the Mayors Adapt (MA) initiative’s local Good Practices [19]. Distribution of case studies by country and population and population coverage of the Mayors Adapt initiative’s local Good Practices [19]. Source of population data, World Bank [81].
CountryEU28Local Adaptation Strategies (LAS) (Aguiar et al., 2018)Mayors Adapt Initiative’s Local Adaptation of Good Practices (MA-GP)
N (LAS)Match LAS & MAN (MA-GP)In MA-GP and Out of LASof Total of MAPopulation IncludedCountry Population (2015)Country Population (%)
Belgium20667.142,703,80311,249,42024.04
Bulgaria00222.38270,9417,177,9913.77
Croatia10111.1910,5004,203,6040.25
Czech Rep.3000----
Denmark91434.76775,2225,683,48313.64
Finland2000----
France121212.38825,00066,538,3911.24
Germany24410611.904,397,71181,679,7695.38
Greece30444.76169,10810,820,8831.56
Hungary11000----
Iceland 00111.19120,000330,81536.27
Ireland20111.191,660,0004,643,74035.75
Italy31161519.051,896,94560,730,5823.12
Latvia30111.1999701,977,5270.50
Macedonia 00111.1938,0922,078,4531.83
Netherlands20222.38320,00016,939,9231.89
Norway 4000----
Portugal28612614.291,141,44410,358,07611.02
Romania1000----
Slovakia51101.19422,9325,423,8017.80
Spain7311813.105,995,90246,443,99412.91
Sweden71212.38996,0009,799,18610.16
Turkey 00111.19478,50078,665,8300.61
U. Kingdom206607.144,503,92065,128,8616.92
EU2814924846010026,099,398489,874,3295.33
Total 509,557,7625.12
Table 3. Synthesis of the 19 profiles obtained. The dominant profiles (1, 3, 2, 7) are shown for each of the patterns obtained (A, B, C, D). Source: Compiled by the authors. N = 84; n = subsample; χ2 = Chi Square Test; OR = odds ratio. Bold = Statistical Significance (p-value ≤ 0.05).
TopicsCategories (Sub-Topics)nProfile 1 (in Pattern A)Profile 3 (in Pattern B)Profile 2 (in Pattern C)Profile 7 (in Pattern D)
χ2ORχ2ORχ2ORχ2OR
Geographical locationFluvial441.1950.517.53311.478.1740.080.3270.59
Coast250.5571.59-0.0019.7032.630.2420.57
Interior140.4551.640.5230.46-0.002.0843.72
Mountainous1-0.00-0.00-0.00-0.00
Bio-geographical regionsMediterranean436.8776.70-0.001.6072.465.065
Atlantic243.2850.177.6265.760.4090.59-0.00
Continental12-0.005.0394.64-0.00-0.00
Boreal30.7582.88-0.00-0.00-0.00
Mountain1-0.00-0.00-0.00-0.00
Arctic1-0.00-0.007.472-0.00
Catastrophe declaration216.8264.750.8721.88-0.00-0.00
Climate Change ImpactsExtreme Temperatures694.4510.260.0010.980.0360.851.153
Water Scarcity331.6940.41-0.000.4100.638.211
Flooding580.4461.605.6710.0051.055.9840.10
Sea Level Rise250.5571.592.5870.2013.7013.410.2420.57
Droughts364.7400.200.0351.132.4220.297.084
Storms480.0680.855.8939.210.2360.722.9950.17
Ice and Snow120.0151.110.2790.56-0.000.1421.55
Forest Fires50.0831.40-0.00-0.00-0.00
MotivationEnvironmental709.6290.150.5232.172.2681.061
Social460.0050.960.0000.990.1040.800.0591.26
Economical389.6278.960.0001.012.9190.26-0.00
ActionsAgriculture8-0.00-0.000.0031.06-0.00
Biodiversity, Environment, Air and Forestry6710.760.143.2092.8771.2860.35
Buildings240.0361.130.0100.93-0.00-0.00
Disaster Risk Reduction545.2608.293.9086.592.9160.324.5410.12
Energy Management191.9580.251.3230.311.0330.35-0.00
Financial6-0.00-0.00-0.00-0.00
Heath271.9800.330.1031.240.7670.49-0.00
Transport or Mobility90.3511.66-0.001.0232.39-0.00
Urban and Spatial Planning547.5250.197.0280.1611.34-0.00
Water Management581.6630.460.9662.204.4820.252.380
FocusingAdaptation-Driven Actions820.3730.3062.8350.120.128
Mitigation-Driven Actions5719.410.050.1381.315.3745.5830.10
MethodologySelf-Governing7-0.00-0.00-0.00-0.00
Enabling methods4211.010.060.1050.811.8160.381.9140.23
Regulation720.9710.480.2791.770.1701.579.0730.09
Provision methods740.2601.740.0961.410.7090.480.3320.51
Level of ImplementationL1. Preparing the ground280.7280.55-0.003.6323.551.7013.24
L2. Assessing risk & vulnerability181.7240.261.6772.410.0140.910.0060.91
L3. Identifying adaptation options130.0000.994.2224.060.2600.57-0.00
L4. Assessing adaptation options111.3472.360.1780.63-0.00-0.00
L5. Implementation114.2224.060.1780.630.0960.710.2231.73
L6. Monitoring & Evaluation3-0.001.1203.55-0.00-0.00

