Selection of Appropriate Thermal Indices for Applications in Human Biometeorological Studies


1
Emeritus Deutscher Wetterdienst, Corneliusstr. 2a, 64546 Mörfelden-Walldorf, Germany
2
Research Centre Human Biometeorology, Deutscher Wetterdienst, Stefan-Meier-Str. 4, 79104 Freiburg, Germany
*
Author to whom correspondence should be addressed.
Atmosphere 2019, 10(1), 18; https://0-doi-org.brum.beds.ac.uk/10.3390/atmos10010018
Submission received: 15 October 2018
/
Revised: 24 December 2018
/
Accepted: 30 December 2018
/
Published: 7 January 2019
(This article belongs to the Section Biometeorology)
Abstract
:Application of thermal indices has become very popular over the last three decades. It is mostly aimed at urban areas and is also used in weather forecasting, especially for heat health warning systems. Recent studies also show the relevance of thermal indices and their justification for thermal perception. Only twelve out of 165 indices of human thermal perception are classified to be principally suitable for the human biometeorological evaluation of climate for urban and regional planning: this requests that the thermal indices provide an equivalent air temperature of an isothermal reference with minor wind velocity. Furthermore, thermal indices must be traceable to complete human energy budget models consisting of both a controlled passive system (heat transfer between body and environment) and a controlling active system, which provides a positive feedback on temperature deviations from neutral conditions of the body core and skin as it is the case in nature. Seven out of the twelve indices are fully suitable, of which three overlap with the others. Accordingly, the following four indices were selected as appropriate: Universal Thermal Climate Index (UTCI), Perceived Temperature (PTJ), Physiologically Equivalent Temperature (PET), and rational Standard Effective Temperature (SET*).
1. Introduction
Human biometeorology is concerned with contingency planning, protection of health, regional and urban planning, design of open spaces, various aspects of tourism and recreation areas, and research in climate change. It contributes to heat warnings and medical issues in weather forecasting. All these facets require a rational, thermo-physiologically consistent assessment of the human thermal environment. This is frequently accomplished by applying thermal indices. There is a long and extended discussion in human biometeorology about such thermal indices and which of them is the best and the most appropriate [1,2,3,4,5,6,7,8]. In addition, several studies have been conducted in order to determine which index fits best and when the level of thermal neutrality and heat stress is reached and can be quantified in several climate regions [9].
This study shows a methodical framework for the selection of thermal indices for applications in human biometeorological studies, especially in weather forecasting and, above all, urban issues classifications and the quantification of open spaces or recreation areas. The method is explained in principle and is applied to the specific problem of an assessment of the human thermal environment. The results of this study especially contribute to the VDI (Verein Deutscher Ingenieure/Association of German Engineers) guideline 3787/2 on “methods for the human biometeorological evaluation of climate for urban and regional planning” currently under revision [10].
De Freitas and Grigorieva [7,8] have recently provided a comprehensive catalogue of 165 thermal indices and simulation devices developed and applied during the last 100 years and designed to assess the thermal environment according to human thermal physiology and sensation. This work of merit is the base of the study presented here. The present study selects the suitable indices for the thermophysiologically relevant quantification of atmospheric environment. This provides the basis for the different human biometeorological applications for assessing the short-term impacts of weather and the long-term development of climate.
2. Method
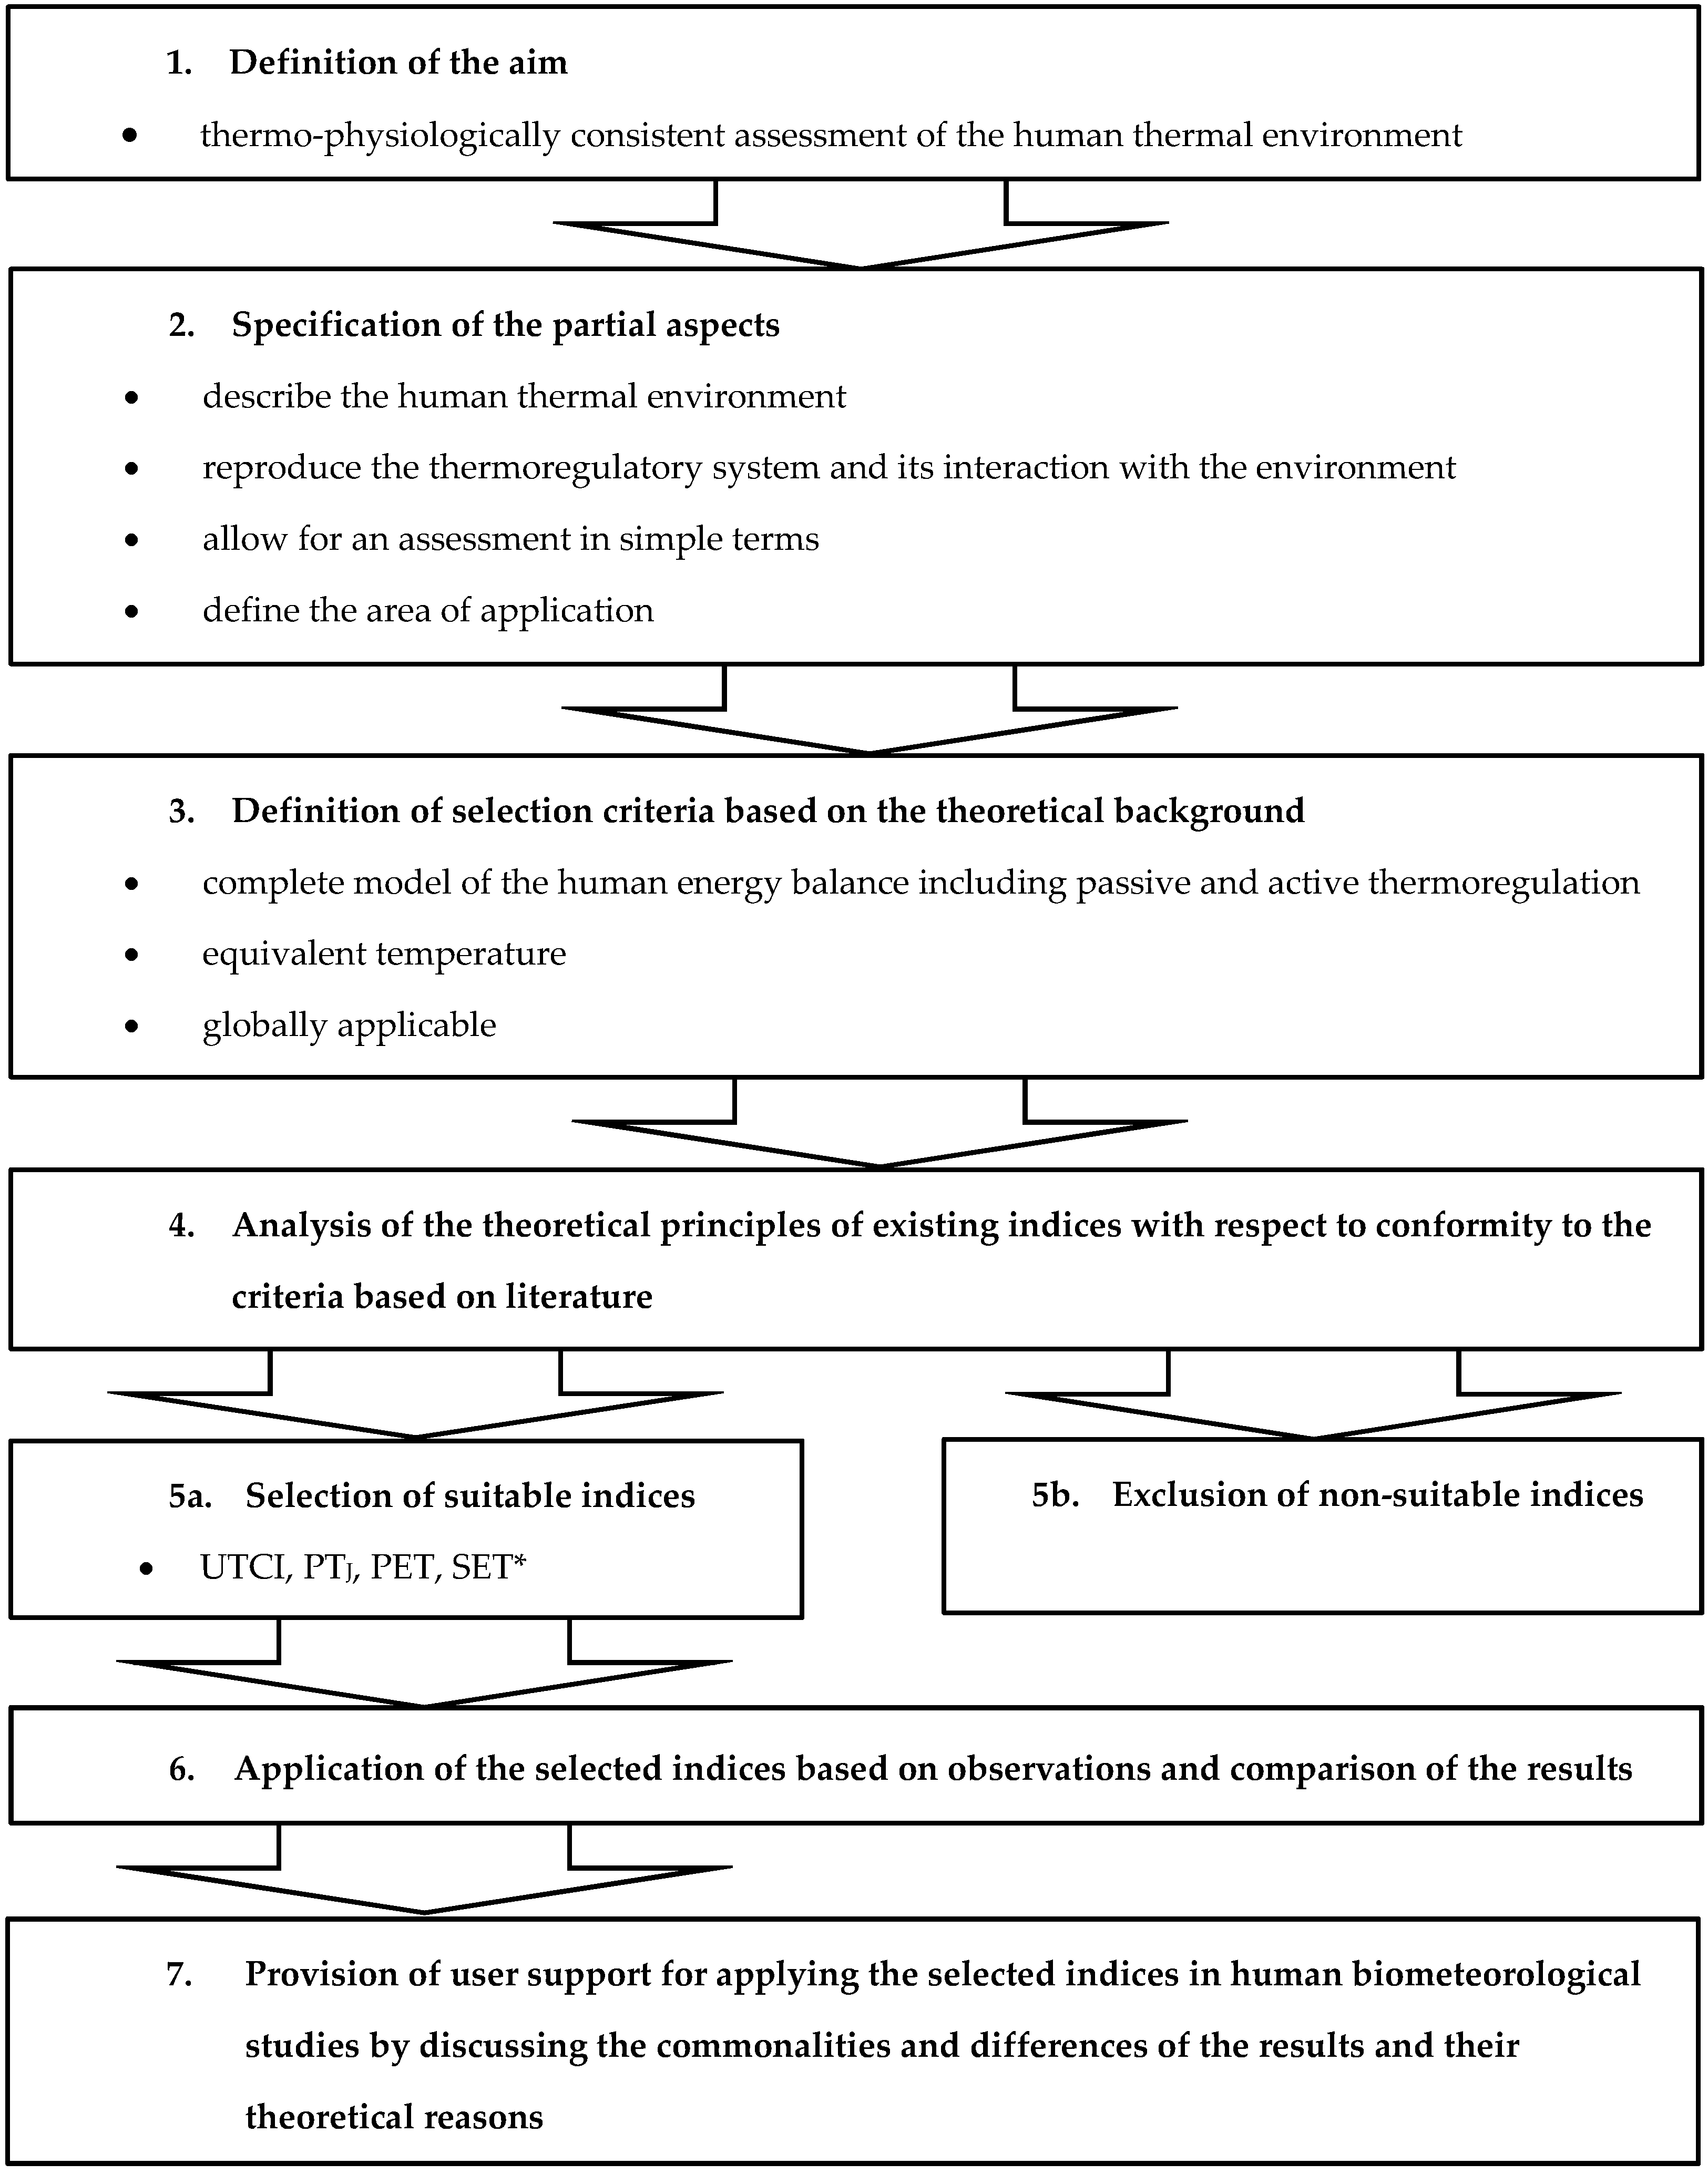
The methodical framework for the selection of thermal indices for applications in human biometeorological studies consists of seven steps (Figure 1).
The definition of the aim of the selection process is the first step, continued by the specification of the partial aspects as second step. With respect to the thermophysiologically relevant assessment of the atmospheric environment it is necessary to physically describe the human thermal environment and to reproduce the human thermoregulatory system and its interaction with the environment. The index should allow for an assessment in simple terms. The area of its application has to be defined.
The third step of the methodical framework consists of the definition of the selection criteria based on the theoretical background, which comprises the thermoregulation of the human body in this study. The human organism is endothermic homeostatic, i.e., it is in a state of a dynamic balance of its inner environment. This core compartment of the body consists of the brain and the organs of chest and abdominal cavities. It should have a temperature tcr of about 37 °C and is the predominantly regulated element. In contrast, the shell compartment consisting of the extremities and the skin is poikilothermic. Together with the respiratory system, the shell represents the body’s interface with the meteorological environment. The temperature of the skin compartment, tsk, as well as its fractional body mass can vary dependent on body’s environment [11]. Heat is generated within the cells of the organism in order to guarantee the basal metabolic rate, which is needed to preserve live functions. Metabolism increases under activity and provides the organism with the energy it needs to perform internal and external work. The organism produces more heat than is actually required for internal and external performance. Thus, the required homeostasis can only be maintained by a net heat transfer off the cells. Thermophysical properties of the body’s tissues (conduction) and fluids (convection) determine the rate of heat transfer to the body’s surface, where especially decisive are the blood perfusion and the cardio-vascular system linked to it [1]. Hence, the body’s environment, typically the atmosphere, is used as energy sink. The state of the atmosphere varies with region and season and on any given site rapidly also during the day. Because of this variation, the (passive) sensible and latent fluxes from the skin to the atmosphere must be regulated, i.e., the body needs thermoregulation as the (active) controlling system. The physiological system of thermoregulation consists of cold and warm signals from receptors over the entire body. The signals are integrated in the central nervous system in form of deviations from set points for the specific effectors [1,12]. The state of thermoregulation is noticed as a thermal sensation (from cold to hot) and a perception of comfort/discomfort. This triggers a behavioral thermoregulation quicker than the physiological reaction itself [12]. It effects efforts to reduce thermal stress and resulting strain by measures, such as to put on or take off clothes, to change posture, to increase or decrease activity, to take shelter, etc. [1]. Thus, thermal regulation links conscious temperature sensations with autonomic and behavioral responses of the organism to its thermal environment [13].
“The human thermal environment can be defined in terms of six basic parameters: air temperature ta, mean radiant temperature tmrt, relative humidity rh, and air velocity v of the environment, and additionally by the insulation of clothing Icl worn and the activity of the person described by the net metabolic heat production M-W, W/m2, [1]”. Hence, it will be difficult to describe the thermal environment for humans with a single equation or to simulate it by means of technical devices because of the complexity of the human - atmosphere exchange fluxes of energy. In addition, not only must these fluxes, as the passive system of thermoregulation, be maintained in balance for homeostasis of the human organism, it is also necessary to describe the active central nervous system of thermoregulation appropriately, which then stimulates the thermal effectors output [1,14,15], i.e., blood flow between body core and shell as well as, especially under warm/humid conditions, vasodilatation and sweating and, under cold conditions, vasoconstriction and increased metabolism by enlarged muscle tension and shivering where required.
Thus, as a consequence of this theoretical background, the following criteria for suitable indices have been defined (Table 1):
- The index needs to be ascribable to models providing a “rational representation of the human body involving heat transfer between the body and the environment, the anthropometry and thermal properties of the body and a dynamic (transient) representation of the human thermoregulatory system [1,16]”. These are in first principles complete models of the human energy balance including passive and active thermoregulation which are integrated to steady state. If this is not achievable within an integration time of two hours [17], the physiological state at the end of the interval should be taken. In case this criterion is fulfilled the symbol ”M” is used in the further analysis, if not “m”.
- The index needs to take the form of an equivalent temperature, i.e., the air temperature of an isothermal (tmrt = ta) reference environment with minor wind velocity so that a reference subject will show identical (selected) thermo-physiological values in actual and in reference environment (symbol “T”, otherwise “t”). Concerning thermal sensation such an equivalent temperature has the advantage to be self-explanatory comparing it with the actual ambient temperature ta.
- The index needs to be worldwide applicable (symbol “W”, otherwise “w”), i.e., an index which not restricted to specific regions, such as the “Equatorial Comfort Index (ECI) [18]”.
The above-mentioned criteria directly lead to the following criteria for rating the index to be non-suitable (Table 1):
- The index is non-suitable if it is not a whole body index, i.e., is restricted to only one part of the body (symbol “p”), such as the wind chill equivalent temperature (WCET) for the exposed facial skin [19].
- The index is non-suitable if it is a simulation device or a single meteorological parameter (symbol “s”), such as the “Kata Thermometer” [22] or the “Sultriness value” [23] for the dew-point temperature, because such physical or engineering approaches cannot account for the complex passive and active thermoregulation of man [1].
Additionally, a question mark may appear next to a symbol for the reasons why an index is accepted or not. This may mainly be the case if the index handles the active thermoregulation only to a limited degree.
Step four of the methodical framework for the selection of thermal indices for applications in human biometeorological studies consists of the revision of the theoretical principles of existing indices with respect to conformity to the criteria based on literature. The comprehensive catalogue of 165 thermal indices and simulation devices by De Freitas and Grigorieva, [7,8] provides the source of the existing indices. The indices have been analyzed based on the corresponding publications. A question mark may also appear in connection with Russian publications for which only the title is available in English, but no English abstract could be found by web searches, a question mark may appear. This is the case for ~12% of the indices, which, however, in the majority analyze an Icl that is required in order to avoid body cooling or respiratory heat loss, i.e., there are no equivalent temperature indices (“t”).
3. Results
De Freitas and Grigorieva [7,8] have grouped the register of indices in eight primary classification categories: “A” simulation devices for integrated measurements, “B” single sensor (parameter) index, “C”: algebraic or statistical models, “D”: proxy thermal strain index, “E”: proxy thermal stress index, “F”: energy balance strain index, “G”: energy balance stress index, and “H”: special purpose index. According to this classification, Table 2 summarizes the number of indices considered suitable or non-suitable for the intended purpose and provides the reasons for acceptance or non-acceptance using the symbols explained in Table 1.
Categories “A” and “B” exclusively cover simulation devices and single sensor parameter indices, respectively, which, from their first principles, are unable to account for the complex active and passive thermoregulation.
Algebraic equations and mere statistical models fall into category “C”. In a narrower sense, algebraic equations take the form of a polynomial with real number coefficients and especially do not have the form of a differential equation. Hence, they are “single” equations and are, in principle, inadequate to provide a complete description of the transient human energy balance up to the steady state. This is similar for statistical models, provided they are not parameterized versions of complete thermo-physiological heat balance models such as those subsumed under categories “F” and “G”. For this reason, all the indices of category “C” are characterized by the reason symbol “m”.
When assessing the indices classified as “D” to “G”, the definitions of thermal stress and strain should be kept in mind: Thermal stress is any change in the thermal relation between a temperature regulator and its environment, which would result in hyper- or hypothermia, if uncompensated by temperature regulation [24]. Thermal strain is any deviation of body temperatures induced by sustained thermal stress that cannot be fully compensated by temperature regulation [24]. Accordingly, thermal strain is the overall physiological response resulting from heat stress [25]. Here, a temperature regulator is an organism that regulates its body temperature by autonomic and/or behavioral processes [24]. A thermoeffector is an organ system and its action, respectively, that affect heat balance in a controlled manner as part of the processes of temperature regulation [24].
A proxy is “a variable that is not in itself directly relevant, but that serves in place of an unobservable or immeasurable variable” [26]. In order for a variable to be a good proxy, it must have a close correlation, not necessarily linear, with the variable of interest. Hence, with the exception of 2 out of 30 indices in the categories “D” and “E”, the proxy for thermal strain and stress can be excluded, because they are not based on complete heat balance models. Additionally, because they relate to variables that assess strain, the indices in “D” all in all are not equivalent temperatures: “t”. This applies with only two exceptions also for category “E”.
In category “F” as well, the energy balance strain indices are not categorized as equivalent temperatures. This also applies to the Physiological Subjective Temperature (PST, in °C) [27], which is derived from the net heat storage of the body SR, W/m2, after an exposition of 15–20 min, raised to the power of 0.75 and converted into a temperature value applying the Stefan-Boltzmann law. Then, PST is equal tmrt minus (SR < 0) or tmrt plus (SR > 0) this temperature value.
In category “G”, i.e., energy balance stress indices, twelve out of 42 indices are regarded as potentially suitable for human biometeorological studies and also for the revision of VDI 3787/2 [10]. Among these 12, five are not an equivalent temperature “t”, thereof four versions of the Predicted Mean Vote PMV or the Predicted Percentage of Dissatisfied PPD [28]. Here, only the comfort zone of PMV meets the demands for a model with suitable passive and active thermoregulation; it is also a special case of the ASHRAE (American Society of Heating, Refrigerating and Air-Conditioning Engineers) two-node model [29,30] valid for steady state and comfortable values of secretion of sweat Ecomf and skin temperature tsk,comf, both depending exclusively on M-W. The fifth is the rational predicted mean vote PMV* [30], which uses the rational effective temperature ET* [29,30] instead of the operational temperature in PMV and thus is completely compatible with the above-mentioned requirements of “M, W”. Both PMV [28] and PMV* [30] are included here, because they constitute the thermo-physiological base of the Perceived Temperature PTJ index [31]. The seven other models account for passive and active thermoregulation (“M”), are globally applicable (“W”), and provide an equivalent temperature (“T”).
In category “G”, i.e., energy balance stress index, the following indices are excluded as non-suitable: (i) Outdoor Thermal Environment Index, OTEI, as well as the outdoor modified effective temperature ETVO [32], even though their base is the ASHRAE two-node model [29], which is judged as suitable. These indices, however, do not handle the absorbed short-wave (solar) radiation as an integral part of the sensible energy fluxes via the skin; thus, this energy gain does not interact with the thermoregulatory mechanisms; (ii) the apparent temperature AT [21,33] and its derivatives the wind chill equivalent temperature WCET [34], the outdoor apparent temperature OAT [35], and the heat index HI [20], because an active thermoregulatory system is missing or, at least, is represented only rudimentarily; (iii) the Heat Budget Index HEBIDEX [36,37,38] because of its bounded rationality of active thermoregulation.
Category “H”, i.e., special purpose indices, generally includes no equivalent temperatures, because the indices are constructed to meet special demands, such as draught sensation by DRI [39].
Table 3 itemizes those indices that would be suitable for the above-mentioned purposes (“Suitability”): column “VDI selected” shows which of them are adapted in the end, whereas column “Adaptation” indicates which of them include behavioral adaptation, i.e., account for an Icl dependent on the meteorological conditions of the actual environment.
The results above contribute to step 5a of the methodical framework. The selected indices are:
1. UTCI, the Universal Thermal Climate Index [40,41]: UTCI refers to an isothermal environment, calm air (v ~ 0.3 m/s at 1.1 m above ground) and rh = 50% up to ta = 29 °C and at temperatures above 29 °C a fixed water vapor pressure of 20 hPa, that is equivalent to 50% at 29 °C. The reference subject’s M-W is assumed to be 135 W/m2. The basic thermoregulatory model is the “UTCI-Fiala multi-node model (187 nodes) of human heat transfer and temperature regulation [42]”. It is combined with a clothing ensemble as worn by general population with a realistic insulation distributed over the different body segments. The clothing insulation is behaviorally adapted dependent on ta; the heat and humidity resistance of clothing is a function of v and the reference subject’s movement (4 km/h) [43], i.e., the overall insulation usually differs between the reference environment defined for calm air and the actual environment. The operational UTCI procedure [44] is a laborious parameterization of the basic models, combining the precision of complex multi-node models with low computational costs.
2. PTJ, the Perceived Temperature [45] in its revised version [31]: PTJ refers to an isothermal environment where v is reduced to a slight draught enabling forced convection and rh = 50%. The reference subject’s M-W is assumed to be 135 W/m2. In terms of thermophysiology, PTJ is constituted by PMV [28] and PMV* [29,30], “M, W”, which it converts to an equivalent temperature, “T”. Fanger’s [28] PMV is applied restricted to the comfort zone and enables behavioral adaptation. This behavioral adaptation is realized by varying the intrinsic clothing insulation between a wintery, Icl = 1.75 clo, and a summery, Icl = 0.5 clo, clothing ensemble and requesting that PMV equals zero. Here, the insulation is identical in both the actual and reference environment. Outside the comfort zone, PMV* is calculated anchored on the two boundary values for the variable insulation zone, which results in two parameterizations of the ASHRAE two-node model [29] so as to obtain realistic values of skin tsk, core temperature tcr, and skin wettedness w to be used for PTJ. The computational costs for PTJ are low due to the parameterizations as well as Fanger’s [28] relatively simple comfort equation for steady state.
3. PET, the Physiologically Equivalent Temperature [46,47]: PET is ta in an environment that is assumed as a typical isothermal indoor setting, with v = 0.1 m/s at 1.1 m above ground and a water vapor pressure of 12 hPa (50% at 20 °C). The reference subject is assumed to perform light activity (80 W work metabolism, corresponding to M-W of 83.7 W/m2) and wear a clothing ensemble with Icl = 0.9 clo. In terms of thermophysiology, PET is based on the Munich Energy-balance Model for Individuals, MEMI [48]. MEMI is a two-node model and differs largely “from the Gagge two-node model [30] by calculating the physiological sweat rate as function of tsk and of tcr and by the separate calculation of heat flows from parts of the body surface that are covered or uncovered by clothing [47]”. MEMI offers an analytical solution of the human energy balance for steady state and avoids temporal integration compared to transient models. Because of the dependence on tsk and on tcr, there are quadratic equations, among others, to be solved by iteration and where the sign in the solution is selected using bins of tsk and tcr with boundaries that are obviously set statistically. MEMI is applied unmodified in determining the thermophysiological state in the actual environment. Following this, PET as ta of the reference environment is calculated by applying, unchanged, all heat exchanges of the actual environment, which are associated with the thermoregulatory control mechanisms of the actual environment, namely, tsk, w, the clothing surface temperature and the latent heat flow from evaporation of sweat. Then, ta is iterated up to a balanced energy budget by adopting the meteorological settings of the reference environment. Hence, in a first approximation, PET is constructed in a way comparable to a standard operative temperature, and thus differs from the other two-node indices the structure of which is comparable to a standard humid operational temperature.
4. SET*, the rational Standard Effective Temperature [29,30,49]: SET* is originally defined for typical indoor environments and as ta of an isothermal environment at still air and rh = 50%. In this environment, the reference subject, in steady state and wearing clothing with a standardized Icl for the activity concerned, has the same heat stress (tsk) and thermoregulatory strain (w) as in the actual environment [30]. A sedentary subject with M-W of 73 W/m2, resulting in an intrinsic Icl of 0.6 clo, is assumed. In terms of thermophysiology, SET* is based on the ASHRAE two-node model, which provides this index (as well as the rational Effective Temperature ET*) as standard output after a temporal integration of 120 one-minute steps.
There are indices which were not selected, though they formally agree with the criteria defined in this study (Table 3). The reasons for the exclusion are given in the following:
1. OUT_SET*, the Standard Effective Temperature Outdoors [30,50]: The thermophysiological part of OUT_SET* is identical to SET* (one selected). The proposed calculation of tmrt outdoors shows significant deficits, especially in the long-wave spectral range, resulting in unrealistic high values of absorbed radiant energy [51].
2. ET*, the new Effective Temperature [14]: The index is a former version of the more recent “rational Effective Temperature ET*” included in the ASHRAE two-node model [29,30]. ET* is the hypothetical ta of an isothermal environment at still air and rh = 50% in which a subject would have the same heat stress (tsk) and thermoregulatory strain (w) as in the actual environment. Hence, the value of ET* varies with the clothing insulation and metabolic rate of interest of the subject concerned; in contrast to SET*, it therefore is not universal. This gives reason for preferring SET*.
3. HToh, the Humid Operative Temperature [14,30,52]: Relying on the ASHRAE two-node model, HToh has the same thermophysiological base as ET* and differs only in rh = 100% as reference humidity, compared to 50% for ET*. “The reference humidity of 50% is more easily associated as the probable average humidity in environments, which were experienced in everyday living, than 100% that is used in HToh and the standard humid operative temperature Tsoh [49]”. Hence, SET*/ET* is preferred.
The sixth step of the methodical framework consists of the application of the selected indices based on observations and comparison of the results. These results are discussed with respect to the commonalities and differences and their theoretical reasons (step seven).
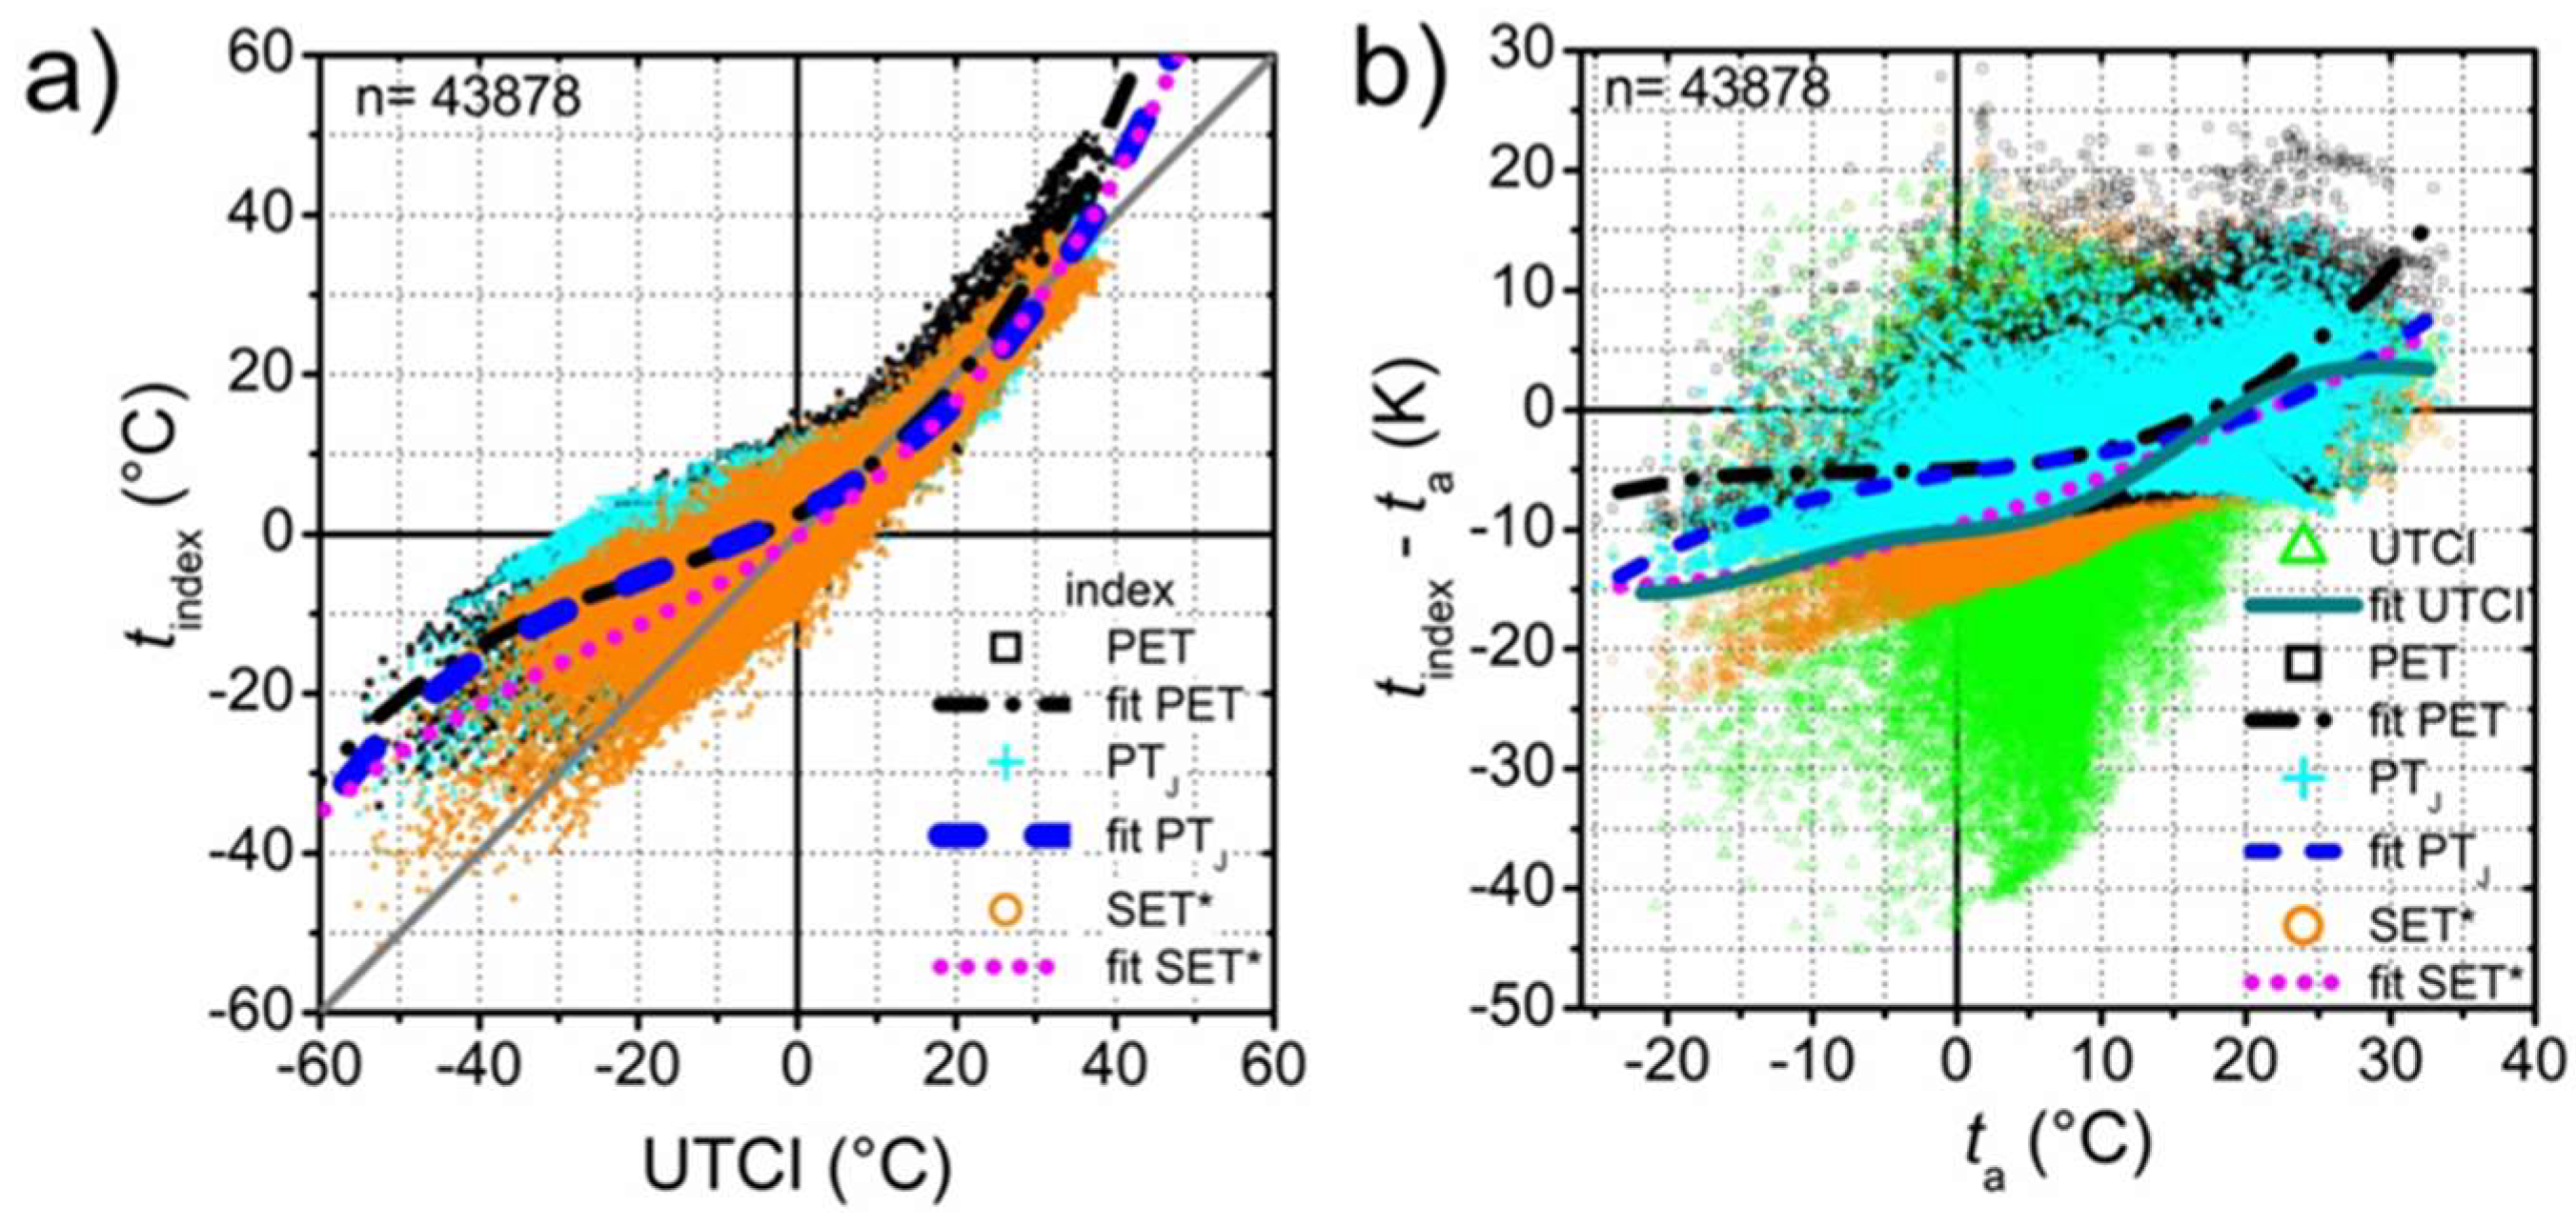
The four selected indices UTCI, PTJ, PET, SET* are calculated based on identical environmental input from 5 European observational sites between 78.9° N and 30.9° N (Figure 2). Tmrt is derived using exclusively measured radiant components. Concerning the index values, there is a high correlation (r2 > 0.98) between PTJ, PET and SET* and a lower (r2 > 0.82) but still highly significant correlation between each of the indices and UTCI, which reflects the higher level of detail in UTCI (Figure 2a).
Among the four selected models, the thermophysiological base of UTCI, the UTCI-Fiala multi-node model [42], provides the highest level of detail with regard to the body model as well as the clothing ensemble chosen dependent on ta in order to account for seasonal behavioral adaptation. In addition, its heat and humidity resistance is, above all, a function of v. The other indices are based on two-node assumptions and use intrinsic clothing insulation which is fixed or, like PTJ, use a behavioral adaptation.
Especially in colder up to comfortable environments, the variability of UTCI, e.g., over ta, is significantly increased compared to the other indices (Figure 2b), though identical environmental input is used for their calculation. In an actual environment outdoors, v is usually increased compared to the reference assumed calm. For UTCI, Icl therefore is generally lower in the actual environment than in the reference, whereas it is constant for the other indices. In the colder zone, the fits for UTCI and for SET* with its constant Icl = 0.6 clo are more or less congruent (Figure 2b), though the variance of UTCI is significantly increased. This proves the degrading effect of wind on overall Icl in UTCI. PTJ, and SET* values are roughly identical under warm conditions, because the difference in applied Icl is small and the thermo-physiological base is identical. In the cold, however, the SET* values are significantly lower due to the differences in Icl = 0.6 clo of SET* and the behaviorally adapted Icl = 1.75 clo of PTJ. Because PET references a fixed Icl = 0.9 clo that, under summery environments, is raised compared to the other indices, and because it is constructed comparable to a standard operative temperature, PET tends to relative high values and thus to exaggerated thermal sensation under hot environments of low humidity. On the other hand, under cold environments the assumed PET reference humidity of 12 hPa in the reference environment limits the latent respiratory heat loss but increases it by diffusion via the skin. Because Icl is relatively low and because PET does not include shivering, tsk and tcr are significantly lower compared to the ASHRAE model which reduces the sensible heat fluxes via the skin. Under wintery conditions, PET therefore shows values comparable to those of PTJ with its higher Icl = 1.75 clo and its markedly higher M-W.
4. Discussion
Human biometeorology is targeted to assess the human thermal environment in a manner that satisfies human thermoregulation, which is intimately connected to human thermal perception, stress and strain. This is why thermoregulatory models are required. They have to be mathematical representations of the human, rationally constructed from physiology, heat transfer and thermodynamic principles [16] in order to achieve this aim. In addition to the controlled passive system, which describes the energy fluxes between a person and its environment, a prerequisite is that thermoregulatory models include a controlling active system. This active system provides a positive feedback on temperature deviations from neutral conditions of the body core and skin as it is the case in nature [1,12,15,53,54]. These requirements are (at least implicitly) included in the four selected approaches UTCI, PTJ, PET and SET* in order to assess the human thermal environment for biometeorological purposes.
The basic models used for the proposed thermal indices vary strongly where the controlled passive system is concerned, specifically the anatomic properties and the heat transfer phenomena between body core and skin as well as between body surface and the atmospheric environment [55]. However, they differ only slightly or negligibly with regard to the active controlling mechanisms [15]. The two-node approaches strongly simplify the controlled passive systems, while their controlling system uses the same principles as the mechanisms functioning in nature.
The UTCI-Fiala multi-node model [42] shows the highest level of detail with regard to the body model as well as the clothing ensemble. However, if frequently applied for operational purposes as mentioned above, it requires the selected parameterized form [44]. It sophisticatedly accounts for behavioral adaptation resulting in heat and water vapor transfer coefficients that differ between actual and reference environment. PTJ is a parameterized version of the ASHRAE two-node model; in contrast to PET and SET*, it therefore can account for behavioral adaptation. Because it is based on intrinsic clothing insulation, there are no differences between actual and reference environment.
The validity of parameterizations is limited to the range of input variables which have been applied in deriving them. This is global for UTCI and PTJ. These indices usually do not provide access to all individual thermoregulatory variables included in the underlying models. They have the advantage of low computational costs; however, it is costly to account for improvements in the underlying thermoregulatory models.
Each of the selected indices results in an equivalent temperature where a subjective thermal assessment of the human environment is intuitively possible by comparing it to ta. The temperature range of the indices is akin, somewhat enlarged for UTCI in the cold zone, for PET in the warm zone. A table assessing thermal sensation and thermal stress and strain is available for each of the indices. Here, the temperature range for identical assessment categories varies strongly between the indices. This directly reflects the difference in the clothing insulation assumed for the reference subject and variable in the parameterized indices. Outdoors, indices accounting for behavioral adaptation provide advantages in case the human thermal evaluations extend to more than one regional bioclimatic zone and/or to more than one season.
The selection criteria for the evaluation in this study (Table 1) differ from those applied by de Freitas and Grigorieva [7,8], with the effect that the evaluations deviate slightly from one another. Nevertheless, all selected indices range among the highest total scores awarded [7,8]. Beyond this, the usability of the selected indices will be optimized to meet user needs. These indices will comply even better with their criteria by using the annex of the above-cited guideline VDI 3787/2 [10], which is currently under revision and will provide the calculation of tmrt outdoors.
Indices that are parameterized based on thermophysiological models with a high score of validity [7,8] should also range in a comparable score, which may be reduced only slightly due to the inaccuracy inherent in all parameterizations. With respect to PTJ, this may be expected to some degree under warm/humid atmospheres while, under cold conditions, the thermophysiological parameters approximately do not differ from the results of the underlying two-node model.
Though the catalogue by de Freitas and Grigorieva [7,8] is comprehensive, there are some indices not included that are in operational use, e.g., COMFA, the energy budget model comfort formula A [56,57], for deviation from comfort conditions, which also accounts for varying clothing insulation dependent on v. COMFA, however, does not account for active thermoregulation. The others are: EHT, the Equivalent Homogenous Temperature according to Wyon [58], which applies an improved version of the Stolwijk model [53]; 65MNSET*, the 65 Multi-Node Standard Effective Temperature [59], which is another enhancement of the Stolwijk model [53]; DTS, the Dynamic Thermal Sensation [60], but which is implicitly included in UTCI; the overall comfort vote [61], which is as 19-node model designed for non-uniform and transient environments for predicting local thermal sensation and local comfort, both of which are connected afterward to whole-body information. The specified multi-node models have to be directly applied in operation and thus are connected with computational costs higher than the selected indices.
Recently, a modified PET, mPET, has become available [62] that retains the definition of the PET reference environment and the fundamental parts of the underlying thermophysiology [48], but improves both passive and active thermoregulation significantly. This is achieved by applying an enhanced body model, by introducing conductive heat transfer inside the body and improving the heat transfer inside the body using Pennes’ [63] bio-heat equation, and, above all, by accounting for up to three layers in the clothing model able to vary in heat and water vapor transfer coefficients and also for vapor condensation in the layers able to alter both the dry and the wet energy flux profiles. If this is done, clothing insulation adapts behaviorally to the actual ta [43] and is then applied identically to both environments, actual and reference. Because the model is semi-unsteady and can embrace up to 25 nodes, it requires up to 1200 times steps to produce the body temperature profiles and stable energy fluxes in order to finally solve the human heat balance equation for steady state and to calculate mPET. This increases the computational costs compared to the simpler PET two-node version. mPET principally fits the requirements to be included in the final selection, but more test and applications are required.
5. Conclusions
Four approaches, UTCI, PTJ, PET and SET*, are suitable for the aim of the thermo-physiologically consistent assessment of the human thermal environment. The selected four indices will be included in the revised VDI guideline 3787/2. This will enable the user to select the suitable index for his/her specific purpose and to support his conclusions by comparison with the results of one of the other indices. The intended annex to VDI 3787/2 will also provide the calculation of tmrt outdoors. Hence, SET* developed for indoor conditions will also become applicable outdoors for human thermal assessment. PTJ constitutes the basis of the heat health warnings [64] of the Deutscher Wetterdienst (DWD). It is produced in a post-processing to DWD’s numerical weather forecast and is computed every day in order to produce 72-h forecast maps for the European region. PTJ is also a tool for various questions in climate and climate change impact research, such as to create maps of the baseline and future bioclimate that allow a direct comparison of the differences in the vulnerability of populations to thermal stress across different geographical regions [65]. The PET applications focus on thermal evaluations in bioclimatic assessments, such as urban and regional planning and mapping, on research into climate change and other important scientific applications [66,67]. UTCI, as the most recent index, shows widespread use in many research and practical applications relating to the human thermal environment due to its most differentiated model base and the completely new approach of a clothing ensemble model.
Because of the strong progress in computer technology compared to the 1980s and 1990s, it is nowadays possible to operationally employ parameterizations or even at least simple thermoregulatory models. Today, such applications may no longer be regarded as too complex for routine industrial applications [3]. In operational tasks such as human bioclimatic assessment of highly complex urban environments, the two-node approaches enable the corresponding models to be applied. Hence, the individual passive energy fluxes as well as the skin and core temperatures from the active system will usually be available, which may help to better describe the thermophysiological state of the body. The computational costs of the two-node models are higher compared to those of parameterizations, but they have the advantage that any improvement, e.g., in the model’s thermophysiology, has immediate operational effect.
In view of further studies, the selected four indices UTCI, PTJ, PET and SET* are appropriate methods for a broad range of different human biometeorological applications for assessing the short-term impacts of weather and the long-term development of climate, such as applications in epidemiology and health research, biometeorological forecasts, various aspects of tourism and recreation areas, assessments of regional and local features of bioclimate, bioclimatic mapping, urban bioclimate, design of open spaces, and research in impacts of climate change.
Author Contributions
Conceptualization, H.S. and A.M.; Methodology, H.S.; Validation, H.S.; Formal Analysis, H.S.; Resources, H.S.; Data Curation, H.S.; Writing-Original Draft Preparation, H.S.; Writing-Review & Editing, H.S., G.L. and A.M.; H.S. and G.L.; Visualization, H.S. and G.L.; Supervision, A.M.
Funding
This research received no external funding.
Acknowledgments
This study was accomplished in the framework of the working group NA 134-02-02-59 UA with the objective to revise the VDI guideline 3837/2 on “Methods for the human biometeorological evaluation of climate and air quality for urban and regional planning at regional level”. We thank G. Jendritzky in the chair, C. Fröhling, VDI, and the co-workers for fruitful discussions and effective motivation. We are also grateful to G. Engel, DWD, for the English proofreading.
Conflicts of Interest
The authors declare no conflict of interest.
References
- Parsons, K.C. Environments. The Effects of Hot, Moderate, and Cold Environments on Human Health, Comfort and Performance, 2nd ed.; Taylor & Francis: London, UK; New York, NY, USA, 2003; p. 518. ISBN 0-415-23793-9. [Google Scholar]
- Herrmann, H. Die Schwüle—Eine Vergleichende Untersuchung. Ph.D. Thesis, Universität Köln, Köln, Germany, 1959; p. 76. [Google Scholar]
- Graveling, R.A.; Morris, L.A.; Graves, R.J. Working in Hot Conditions in Mining: A Literature Review; Historical Research Report TM/88/13; Institute of Occupational Medicine: Edinburgh, UK, 1988; p. 128. [Google Scholar]
- Epstein, Y.; Moran, D.S. Thermal comfort and the Heat Stress Indices. Ind. Health 2006, 44, 388–398. [Google Scholar] [CrossRef] [PubMed]
- Auliciems, A.; Szokolay, S.V. Thermal Comfort. PLEA Note 3; Second Revised Edition; University of Queensland: Brisbane, QLD, Austualia, 2007; p. 66. ISBN 0 86776 729 4. [Google Scholar]
- Pantavou, K.; Santamouris, M.; Asimakopoulos, D.; Theoharatos, G. Empirical calibration of thermal indices in an urban outdoor Mediterranean environment. Build. Environ. 2014, 80, 283–292. [Google Scholar] [CrossRef]
- De Freitas, C.R.; Grigorieva, E.A. A comprehensive catalogue and classification of human thermal climate indices. Int. J. Biometeorol. 2015, 59, 109–120. [Google Scholar] [CrossRef] [PubMed]
- De Freitas, C.R.; Grigorieva, E.A. A comparison and appraisal of a comprehensive range of human thermal climate indices. Int. J. Biometeorol. 2017, 61, 487–512. [Google Scholar] [CrossRef] [PubMed]
- Potchter, O.; Cohen, P.; Lin, T.P.; Matzarakis, A. Outdoor human thermal perception in various climates: A comprehensive review of approaches, methods and quantification. Sci. Total Environ. 2018, 631–632, 390–406. [Google Scholar] [CrossRef] [PubMed]
- Guideline VDI 3787/Part 2. Environmental Meteorology, Methods for the Human Biometeorological Evaluation of Climate and Air Quality for Urban and Regional Planning at Regional Level: Part I: Climate. Kommission Reinhaltung der Luft im VDI und DIN-Normenausschuss KRdL; VDI/DIN Handbuch Reinhaltung der Luft, Band 1B: Umweltmeteorologie; Beuth-Verlag: Berlin, Germany, 2008.
- Aschoff, J.; Wever, R. Kern und Schale im Wärmehaushalt des Menschen. Naturwissenschaften 1958, 45, 477–485. [Google Scholar] [CrossRef]
- Pandolf, K.B.; Burr, R. (Eds.) Medical Aspects of Harsh Environments; Office of The Surgeon General at TMM Publications, Borden Institute, Walter Reed Army Medical Center: Washington, DC, USA, 2001; Volume 1, Available online: http://www.usariem.army.mil/pages/download/harshenvironmentsvol1.pdf (accessed on 28 July 2011).
- Hensel, H.; Schafer, K. Thermoreception and Temperature, Regulation in Man. In Recent Advances in Medical Thermology; Ring, E.F.J., Phillips, B., Eds.; Springer: Boston, MA, USA, 1984. [Google Scholar]
- Gagge, A.P.; Stolwijk, J.A.J.; Nishi, Y. An effective temperature scale based on a simple model of human physiological regulatory response. ASHRAE Trans. 1971, 77, 247–262. [Google Scholar]
- Fiala, D.; Lomas, K.J.; Stohrer, M. Computer prediction of human thermoregulatory and temperature responses to a wide range of environmental conditions. Int. J. Biometeorol. 2001, 45, 143–159. [Google Scholar] [CrossRef]
- Yokota, M.; Berglund, L.G.; Xu, X. Thermoregulatory modeling use and application in the military workforce. Appl. Ergon. 2014, 45, 663–670. [Google Scholar] [CrossRef]
- Höppe, P. Different aspects of assessing indoor and outdoor thermal comfort. Energy Build. 2002, 34, 661–665. [Google Scholar] [CrossRef]
- Webb, C.G. An analysis of some observations of thermal comfort in an equatorial climate. Br. J. Ind. Med. 1959, 16, 279–310. [Google Scholar] [CrossRef]
- OFCM. Report on Wind Chill Temperature and Extreme Heat Indices: Evaluation and Improvement Projects; FCM-R19-2003; US Department of Commerce, Federal Coordinator for Meteorological Services and Supporting Research: Washington, DC, USA, 2003; p. 75. Available online: http://www.ofcm.gov/jagti/r19-ti-plan/r19-ti-plan.htm (accessed on 15 November 2006).
- Rothfusz, L.P. The Heat Index “Equation” (or, more than you ever Wanted to Know about Heat Index). NWS Southern Region Technical Attachment 1990, SR/SSD 90-23; Fort Worth, TX, USA, 1990; p. 2. Available online: https://www.weather.gov/media/bgm/ta_htindx.PDF (accessed on 17 April 2010).
- Steadman, R.G. The Assessment of Sultriness. Part II: Effects of Wind, Extra Radiation and Barometric Pressure on Apparent Temperature. J. Appl. Meteor. 1979, 18, 874–885. [Google Scholar] [CrossRef] [Green Version]
- Hill, L.; Griffith, O.W.; Flack, M. The measurement of the rate of heat-loss at body temperature by convection, radiation, and evaporation. Philos. Trans. R. Soc. Lond. Ser. B Contain. Pap. Biol. Character 1916, 207, 183–220. [Google Scholar] [CrossRef]
- Scharlau, K. Die Schwüle als meßbare Größe. Bioklim. Beibl. 1943, 10, 19–23. [Google Scholar]
- IUPS Glossary of Terms for Thermal Physiology. 3rd Ed. revised by The Commission for Thermal Physiology of the International Union of Physiological Sciences (IUPS Thermal Commission). J. Ther. Biol. 2003, 28, 75–106. [CrossRef]
- Gallagher, M. Development of a perceptual hyperthermia index to evaluate heat strain during treadmill exercise. Eur. J. Appl. Physiol. 2012, 112, 2025–2034. [Google Scholar] [CrossRef] [PubMed]
- Upton, G.; Cook, I. A Dictionary of Statistics; University Press: Oxford, UK, 2002; p. 464. [Google Scholar]
- Blazejczyk, K.; Matzarakis, A. Assessment of bioclimatic differentiation of Poland based on the human heat balance. Geogr. Pol. 2007, 80, 63–82. [Google Scholar]
- Fanger, P.O. Thermal Comfort. Analysis and Applications in Environmental Engineering; McGraw-Hill Company: Detroit, MI, USA, 1972; p. 244. [Google Scholar]
- ASHRAE. ASHRAE Handbook: Fundamentals, 8; American Society of Heating and Air-Conditioning Engineers: Atlanta, GA, USA, 2001; ISBN 1-931862-70-2. [Google Scholar]
- Gagge, A.P.; Fobelets, A.P.; Berglund, P.E. A Standard Predictive Index of Human Response to the Thermal Environment. ASHRAE Trans. 1986, 92, 709–731. [Google Scholar]
- Staiger, H.; Laschewski, G.; Grätz, A. The perceived temperature – a versatile index for the assessment of the human thermal environment. Part A: Scientific basics. Int. J. Biometeorol. 2012, 56, 165–176. [Google Scholar] [CrossRef] [PubMed]
- Nagano, K.; Horikoshi, T. New index indicating the universal and separate effects on human comfort under outdoor and non-uniform thermal conditions. Energy Build. 2011, 43, 1694–1701. [Google Scholar] [CrossRef] [Green Version]
- Steadman, R.G. A universal scale of apparent temperature. J. Appl. Meteorol. 1984, 23, 1677–1687. [Google Scholar] [CrossRef]
- Steadman, R.G. Indices of windchill of clothed persons. J. Appl. Meteorol. 1971, 10, 674–683. [Google Scholar] [CrossRef]
- Steadman, R.G. Norms of apparent temperature in Australia. Austr. Meteorol. Mag. 1994, 43, 1–16. [Google Scholar]
- De Freitas, C.R. Assessment of human bioclimate based on thermal response. Int. J. Biometeorol. 1985, 29, 97–119. [Google Scholar] [CrossRef] [PubMed]
- De Freitas, C.R. Human Thermal Climates of New Zealand; New Zealand Meteorological Service, Miscellaneous Publication: Wellington, New Zealand, 1986. [Google Scholar]
- De Freitas, C.R.; Ryken, M.G. Climate and physiological heat strain during exercise. Int. J. Biometeorol. 1989, 33, 157–164. [Google Scholar] [CrossRef] [PubMed]
- Fanger, P.O.; Melikov, A.K.; Hanzawa, H.; Ring, J. Air turbulence and sensation of draught. Energy Build. 1988, 12, 21–39. [Google Scholar] [CrossRef]
- Jendritzky, G.; Havenith, G.; Weihs, P.; Batchvarova, E. Towards a Universal Thermal Climate Index UTCI for Assessing the Thermal Environment of the Human Being; COST Action 730 on UTCI: Freiburg, Germany, 2009. [Google Scholar]
- Jendritzky, G.; de Dear, R.; Havenith, G. UTCI—Why another thermal index? Int. J. Biometeorol. 2012, 56, 421–428. [Google Scholar] [CrossRef] [PubMed]
- Fiala, D.; Havenith, G.; Bröde, P.; Kampmann, B.; Jendritzky, G. UTCI-Fiala multi-node model of human heat transfer and temperature regulation. Int. J. Biometeorol. 2012, 56, 429–441. [Google Scholar] [CrossRef]
- Havenith, G.; Fiala, D.; Blazejczyk, K.; Richards, M.; Bröde, P.; Holmer, I.; Rintanmaki, H.; Benshabat, Y.; Jendritzky, G. The UTCI-clothing model. Int. J. Biometeorol. 2012, 56, 461–470. [Google Scholar] [CrossRef]
- Bröde, P.; Fiala, D.; Blazejczyk, K.; Holmer, I.; Jendritzky, G.; Kampmann, B.; Tinz, B.; Havenith, G. Deriving the operational procedure for the Universal Thermal Climate Index (UTCI). Int. J. Biometeorol. 2012, 56, 481–494. [Google Scholar] [CrossRef]
- Jendritzky, G.; Staiger, H.; Bucher, K.; Graetz, A.; Laschewski, G. The Perceived Temperature—The Method of the Deutscher Wetterdienst for the Assessment of Cold Stress and Heat Load for the Human Body. In Proceedings of the Internet Workshop on Windchill, Windchill-Conference, Canada, 3–7 April 2000; Available online: http://ec.gc.ca/workshop/papers/pdf/session_1_paper_4_e.pdf (accessed on 8 April 2000).
- Mayer, H.; Höppe, P. Thermal comfort of man in different urban environments. Theor. Appl. Climatol. 1987, 38, 43–49. [Google Scholar] [CrossRef]
- Höppe, P. The physiological equivalent temperature—A universal index for the biometeorological assessment of the thermal environment. Int. J. Biometeorol. 1999, 43, 71–75. [Google Scholar] [CrossRef] [PubMed]
- Höppe, P. Die Energiebilanz des Menschen; Universitat Munchen, Meteorologisches Institut: München, Germany, 1984; p. 194. [Google Scholar]
- Gonzalez, R.R.; Nishi, Y.; Gagge, A.P. Experimental evaluation of Standard Effective Temperature. A new biometeorological index of man’s thermal discomfort. Int. J. Biometeorol. 1974, 18, 1–15. [Google Scholar] [CrossRef] [PubMed]
- Pickup, J.; de Dear, R.J. An outdoor thermal comfort index (OUT-SET*)—Part I—The model and its assumptions. In Biometeorology and Urban Climatology at the Turn of the Millennium, Proceedings of the Conference ICB-ICUC’99, Sydney, Australia, 8–12 November 1999; de Dear, R.J., Kalma, J.D., Oke, T.R., Auliciems, A., Eds.; World Meteorological Organization: Geneva, Switzerland, 2000; pp. 279–283. [Google Scholar]
- Park, S.; Tuller, S.E. Comparison of human radiation exchange models in outdoor areas. Theor. Appl. Climatol. 2011, 105, 357–370. [Google Scholar] [CrossRef]
- Nishi, Y.; Gagge, A.P. Humid operative temperature: A biophysical index of thermal sensation and discomfort. J. Physiol. (Paris) 1971, 63, 365–368. [Google Scholar]
- Stolwijk, J.A.J. A Mathematical Model of Physiological Temperature Regulation in Man. NASA Contract Report 1855; Maryland, 1971; p. 78. Available online: http://ntrs.nasa.gov/archive/nasa/casi.ntrs.nasa.gov/19710023925_1971023925.pdf (accessed on 2 August 2011).
- Stolwijk, J.A.J.; Hardy, J.D. Temperature regulation in man—A theoretical study. Pflügers Arch. 1966, 291, 129–162. [Google Scholar] [CrossRef]
- Jendritzky, G.; Fiala, D.; Havenith, G.; Koppe, C.; Laschewski, G.; Staiger, H.; Tinz, B. Thermische Umweltbedingungen. Promet 2007, 33, 83–94. [Google Scholar]
- Brown, R.D.; Gillespie, T.G. Estimating outdoor thermal comfort using a cylindrical radiation thermometer and an energy budget model. Int. J. Biometeorol. 1986, 30, 43–52. [Google Scholar] [CrossRef]
- Kenny, N.A.; Warland, J.S.; Brown, R.D.; Gillespie, T.G. Part A: Assessing the performance of the COMFA outdoor thermal comfort model on subjects performing physical activity, Part B: Revisions to the COMFA outdoor thermal comfort model for application to subjects performing physical activity. Int. J. Biometeorol. 2009, 53, 415–441. [Google Scholar] [CrossRef]
- Huizenga, C.; Hui, Z.; Arens, E. A model of human physiology and comfort for assessing complex thermal environments. Build. Environ. 2001, 36, 691–699. [Google Scholar] [CrossRef] [Green Version]
- Tanabe, S.-I.; Kobayashi, K.; Nakamo, J.; Ozeki, Y.; Konishi, M. Evaluation of thermal comfort using multi-node thermoregulation (65MN) and radiation models and computational fluid dynamics (CFD). Energy Build. 2002, 34, 637–646. [Google Scholar] [CrossRef]
- Fiala, D.; Lomas, K.J.; Stohrer, M. First principles modelling of thermal sensation response in steady-state and transient conditions. ASHRAE Trans. 2003, 109, 179–188. [Google Scholar]
- Zhang, H.; Arens, E.; Huizenga, C.; Han, T. Thermal sensation and comfort models for non-uniform and transient environments: Part I: Local sensation of individual body parts, Part II::Local comfort of individual body parts, Part III: Whole-body sensation and comfort. Building and Environment 2010, 45, 380–410. [Google Scholar] [CrossRef]
- Chen, Y.-C.; Matzarakis, A. Modified physiologically equivalent temperature—Basics and applications for western European climate. Theor. Appl. Climatol. 2018, 132, 1275–1289. [Google Scholar] [CrossRef]
- Pennes, H.H. Analysis of tissue and arterial blood temperatures in the resting human forearm. J. Appl. Physiol. 1948, 85, 35–41. [Google Scholar] [CrossRef] [PubMed]
- Koppe, C.; Jendritzky, G. Inclusion of short-term adaptation to thermal stresses in a heat load warning procedure. Meteorol. Z. 2005, 14, 271–278. [Google Scholar] [CrossRef]
- Jendritzky, G.; Tinz, B. The thermal environment of the human being on the global scale. Glob. Health Action 2009, 2, 1021. [Google Scholar] [CrossRef] [PubMed]
- Matzarakis, A.; Amelung, B. Physiologically equivalent temperature as indicator for impacts of climate change on thermal comfort of humans. In Seasonal Forecasts, Climatic Change and Human Health; Thomson, M.C., Garcia-Herrera, R., Beniston, M., Eds.; Springer: Dordrecht, The Netherlands, 2008; pp. 161–172. [Google Scholar]
- Giannaros, T.M.; Kotroni, V.; Lagouvardos, K.; Matzarakis, A. Climatology and trends of the Euro-Mediterranean thermal bioclimate. Int. J. Climatol. 2018, 38, 3290–3308. [Google Scholar] [CrossRef]
Figure 1.
Methodical framework for the selection of thermal indices for applications in human biometeorological studies.
Figure 1.
Methodical framework for the selection of thermal indices for applications in human biometeorological studies.

Figure 2.
(a) PET, PTJ, SET* (tindex) dependent on UTCI; (b) UTCI, PET, PTJ, SET* (tindex) minus ambient temperature ta dependent on ta; Indices: each calculated based on identical environmental input from 5 European observational sites between 78.9° N and 30.9° N; tmrt derived using exclusively measured radiant components.


Table 1.
Selection criteria for indices with respect to suitability in human biometeorological applications and studies.
Table 1.
Selection criteria for indices with respect to suitability in human biometeorological applications and studies.
| Criterion | Symbol in Case Index Is Suitable | Symbol in Case Index Is Non-Suitable |
|---|---|---|
| complete model of the human energy balance including passive and active thermoregulation | M | m |
| equivalent temperature | T | t |
| worldwide applicable | W | w |
| restricted to only one part of the body | - | p |
| defined exclusively for warm/humid/dry or for cold environments (regional in climatological terms) | - | r |
| simulation device or a single meteorological parameter | - | s |
Table 2.
Summary of thermal indices and their suitability or non-suitability for overall thermal comfort and stress quantification (for an explanation of the symbols and the reasons for their (non)-suitability see Table 1).
Table 2.
Summary of thermal indices and their suitability or non-suitability for overall thermal comfort and stress quantification (for an explanation of the symbols and the reasons for their (non)-suitability see Table 1).
| Classification | Category | Amount | Not Suitable (Amount) | Reasons | Principally Suitable (Amount) | Reasons |
|---|---|---|---|---|---|---|
| Simulation devices for integrated measurements | A | 11 | 11 | s | -- | |
| Single sensor (parameter) index | B | 6 | 6 | s | -- | |
| Algebraic or statistical models | C | 37 | 37 | m, p, t, r | -- | |
| Proxy thermal strain index | D | 14 | 14 | m, t, r | -- | |
| Proxy thermal stress index | E | 16 | 16 | m(?), w, p, t, r | -- | |
| Energy balance strain index | F | 28 | 28 | m(?), r, t | -- | |
| Energy balance stress index | G | 42 | 30 | m(?), r, t | 7 | M, W, T |
| 1 | M, W, t | |||||
| 4 | M(?), W, t | |||||
| Special purpose index | H | 11 | 11 | m(?), w, r, t | -- | |
| Sum | 165 | 153 | 12 |
Table 3.
Human energy balance stress indices suitable (Y = yes, N = no).
| Category | Index | Energy Balance Stress Index | Authors | Suitability | VDI Selected | Identical with/Included in | Adaptation |
|---|---|---|---|---|---|---|---|
| G | UTCI | Universal Thermal Climate Index | [40,41,42,43,44] | MWT | Y | Y | |
| G | PTj | Perceived Temperature | [31,45] | MWT | Y | Y | |
| G | PET | Physiologically Equivalent Temperature | [46,47] | MWT | Y | N | |
| G | SET* | Standard Effective Temperature | [30,49] | MWT | Y | N | |
| G | OUT_SET* | Standard Effective Temperature Outdoors | [30,49,50] | MWT | N | SET* | N |
| G | ET* | New Effective Temperature | [14] | MWT | N | ET*/SET*/PMV* | N |
| G | HToh | Humid Operative Temperature | [14,30,52] | MWT | N | ET*/SET* | N |
© 2019 by the authors. Licensee MDPI, Basel, Switzerland. This article is an open access article distributed under the terms and conditions of the Creative Commons Attribution (CC BY) license (http://creativecommons.org/licenses/by/4.0/).
Share and Cite
MDPI and ACS Style
Staiger, H.; Laschewski, G.; Matzarakis, A. Selection of Appropriate Thermal Indices for Applications in Human Biometeorological Studies. Atmosphere 2019, 10, 18. https://0-doi-org.brum.beds.ac.uk/10.3390/atmos10010018
AMA Style
Staiger H, Laschewski G, Matzarakis A. Selection of Appropriate Thermal Indices for Applications in Human Biometeorological Studies. Atmosphere. 2019; 10(1):18. https://0-doi-org.brum.beds.ac.uk/10.3390/atmos10010018
Chicago/Turabian StyleStaiger, Henning, Gudrun Laschewski, and Andreas Matzarakis. 2019. "Selection of Appropriate Thermal Indices for Applications in Human Biometeorological Studies" Atmosphere 10, no. 1: 18. https://0-doi-org.brum.beds.ac.uk/10.3390/atmos10010018
Note that from the first issue of 2016, this journal uses article numbers instead of page numbers. See further details here.