Analysis of the Air Quality and the Effect of Governance Policies in China’s Pearl River Delta, 2015–2018


1
Business School, University of Shanghai for Science and Technology, Shanghai 200093, China
2
Antai College of Economics and Management, Shanghai Jiao Tong University, Shanghai 200240, China
3
Fintech Research institute & School of Information Management and Engineering, Shanghai University of Finance and Economics, Shanghai 200433, China
*
Author to whom correspondence should be addressed.
†
All the authors contributed equally to this paper.
Atmosphere 2019, 10(7), 412; https://0-doi-org.brum.beds.ac.uk/10.3390/atmos10070412
Submission received: 29 June 2019
/
Revised: 11 July 2019
/
Accepted: 16 July 2019
/
Published: 18 July 2019
(This article belongs to the Special Issue Effects of Policy, Mitigation Measures and Economic Recession on Air Quality Trends)
Abstract
:The evaluation of China’s air pollution and the effectiveness of its governance policies is currently a topic of general concern in the academic community. We have improved the traditional evaluation method to construct a comprehensive air quality assessment model based on China’s major air pollutants. Using the daily air pollutant data of 2015–2018, we calculated and analyzed the monthly air quality of nine cities in the Pearl River Delta of China, and conducted a comparative study on the effect of the air pollution control policies of the cities in the Pearl River Delta. We found that the air quality control policies in those nine cities were not consistent. Specifically, the pollution control policies of Guangzhou and Foshan have achieved more than 20% improvement. The pollution control policies of Dongguan and Zhaoqing have also achieved more than 10% improvement. However, due to the relative lag of the formulation and implementation of air pollution control policies, the air quality of Jiangmen, Zhuhai and Zhongshan has declined. Based on the analysis of the air quality assessment results and the effects of governance policies in each city during the study period, we propose suggestions for further improvement of the effectiveness of air pollution control policies in the region.
1. Introduction
During human production activities, various pollutants are released into the atmosphere [1,2]. These pollutants linger in the atmosphere for a certain period of time and participate in the atmospheric circulation by exchanging materials with vegetation, ocean, soil, etc. When the concentration of these pollutants in the atmosphere exceeds the safety threshold, it will cause acute or chronic damage to humans, animals and plants, directly or indirectly [3,4,5,6,7].
Since China’s reform and opening up in 1978, especially since the beginning of the 21st century, the extensive economic growth model relying on energy consumption has brought intensive pollutant emissions [8,9,10,11,12], making environmental pollution one of the most serious social problems in China [13,14,15,16]. Meanwhile, the investment in environmental pollution mitigation and control also continues to rise (see Figure 1) [17].
After entering the 21st century, air pollution in China has transformed from coal-smoke pollution to combined pollution made up of coal-smoke and motor vehicle exhaust [18,19,20,21,22]. Its main characteristics are smog and photochemical smog occur frequently [23,24,25]; particulate pollution and organic pollution (contaminants in the environment that can be biodegraded by microorganisms) are aggravated [26,27,28]; the concentration of nitrogen dioxide is high (the 24-h average concentration exceeds the national standard limit of 80 ) [29,30,31,32], while inhalable particles have become the most important contributor to poor air quality [33,34,35,36]. According to research of the Chinese Academy of Engineering, currently, the concentration of air pollutants (including PM2.5, PM10, NOx, etc.) in most cities of China is 5–20 times higher than the highest allowable concentration limit in western countries [37]. The Annual Air Quality Report released by the Ministry of Environmental Protection of China also pointed out that among the 74 air quality key monitoring cities such as Beijing-Tianjin-Hebei, Yangtze River Delta and Pearl River Delta cities, most cities suffer from air pollution of varying degrees that exceed regulatory standards [38]. In order to control air pollution, the Ministry of Environmental Protection of China issued a stricter Air Quality Standard in 2012, which was officially implemented in 2016 [39,40]. This new standard has included the six main air pollutants into statistical coverage: sulphur dioxide (SO2), nitrogen dioxide (NO2), particulate matters with a particle size of 10 or less (PM10), particulate matters with a particle size of 2.5 or less (PM2.5), carbonic oxide (CO) and ozone (O3). This standard has also issued the technical regulations related to the revised Air Quality Index (AQI) and specified the grading schedule, calculation method and air quality grades of the new AQI [41]. Therefore, since this new standard and related regulations have been implemented for almost three years, it is necessary to study the changes in air pollution of the typical regions of China, which bears both academic value and practical significance.
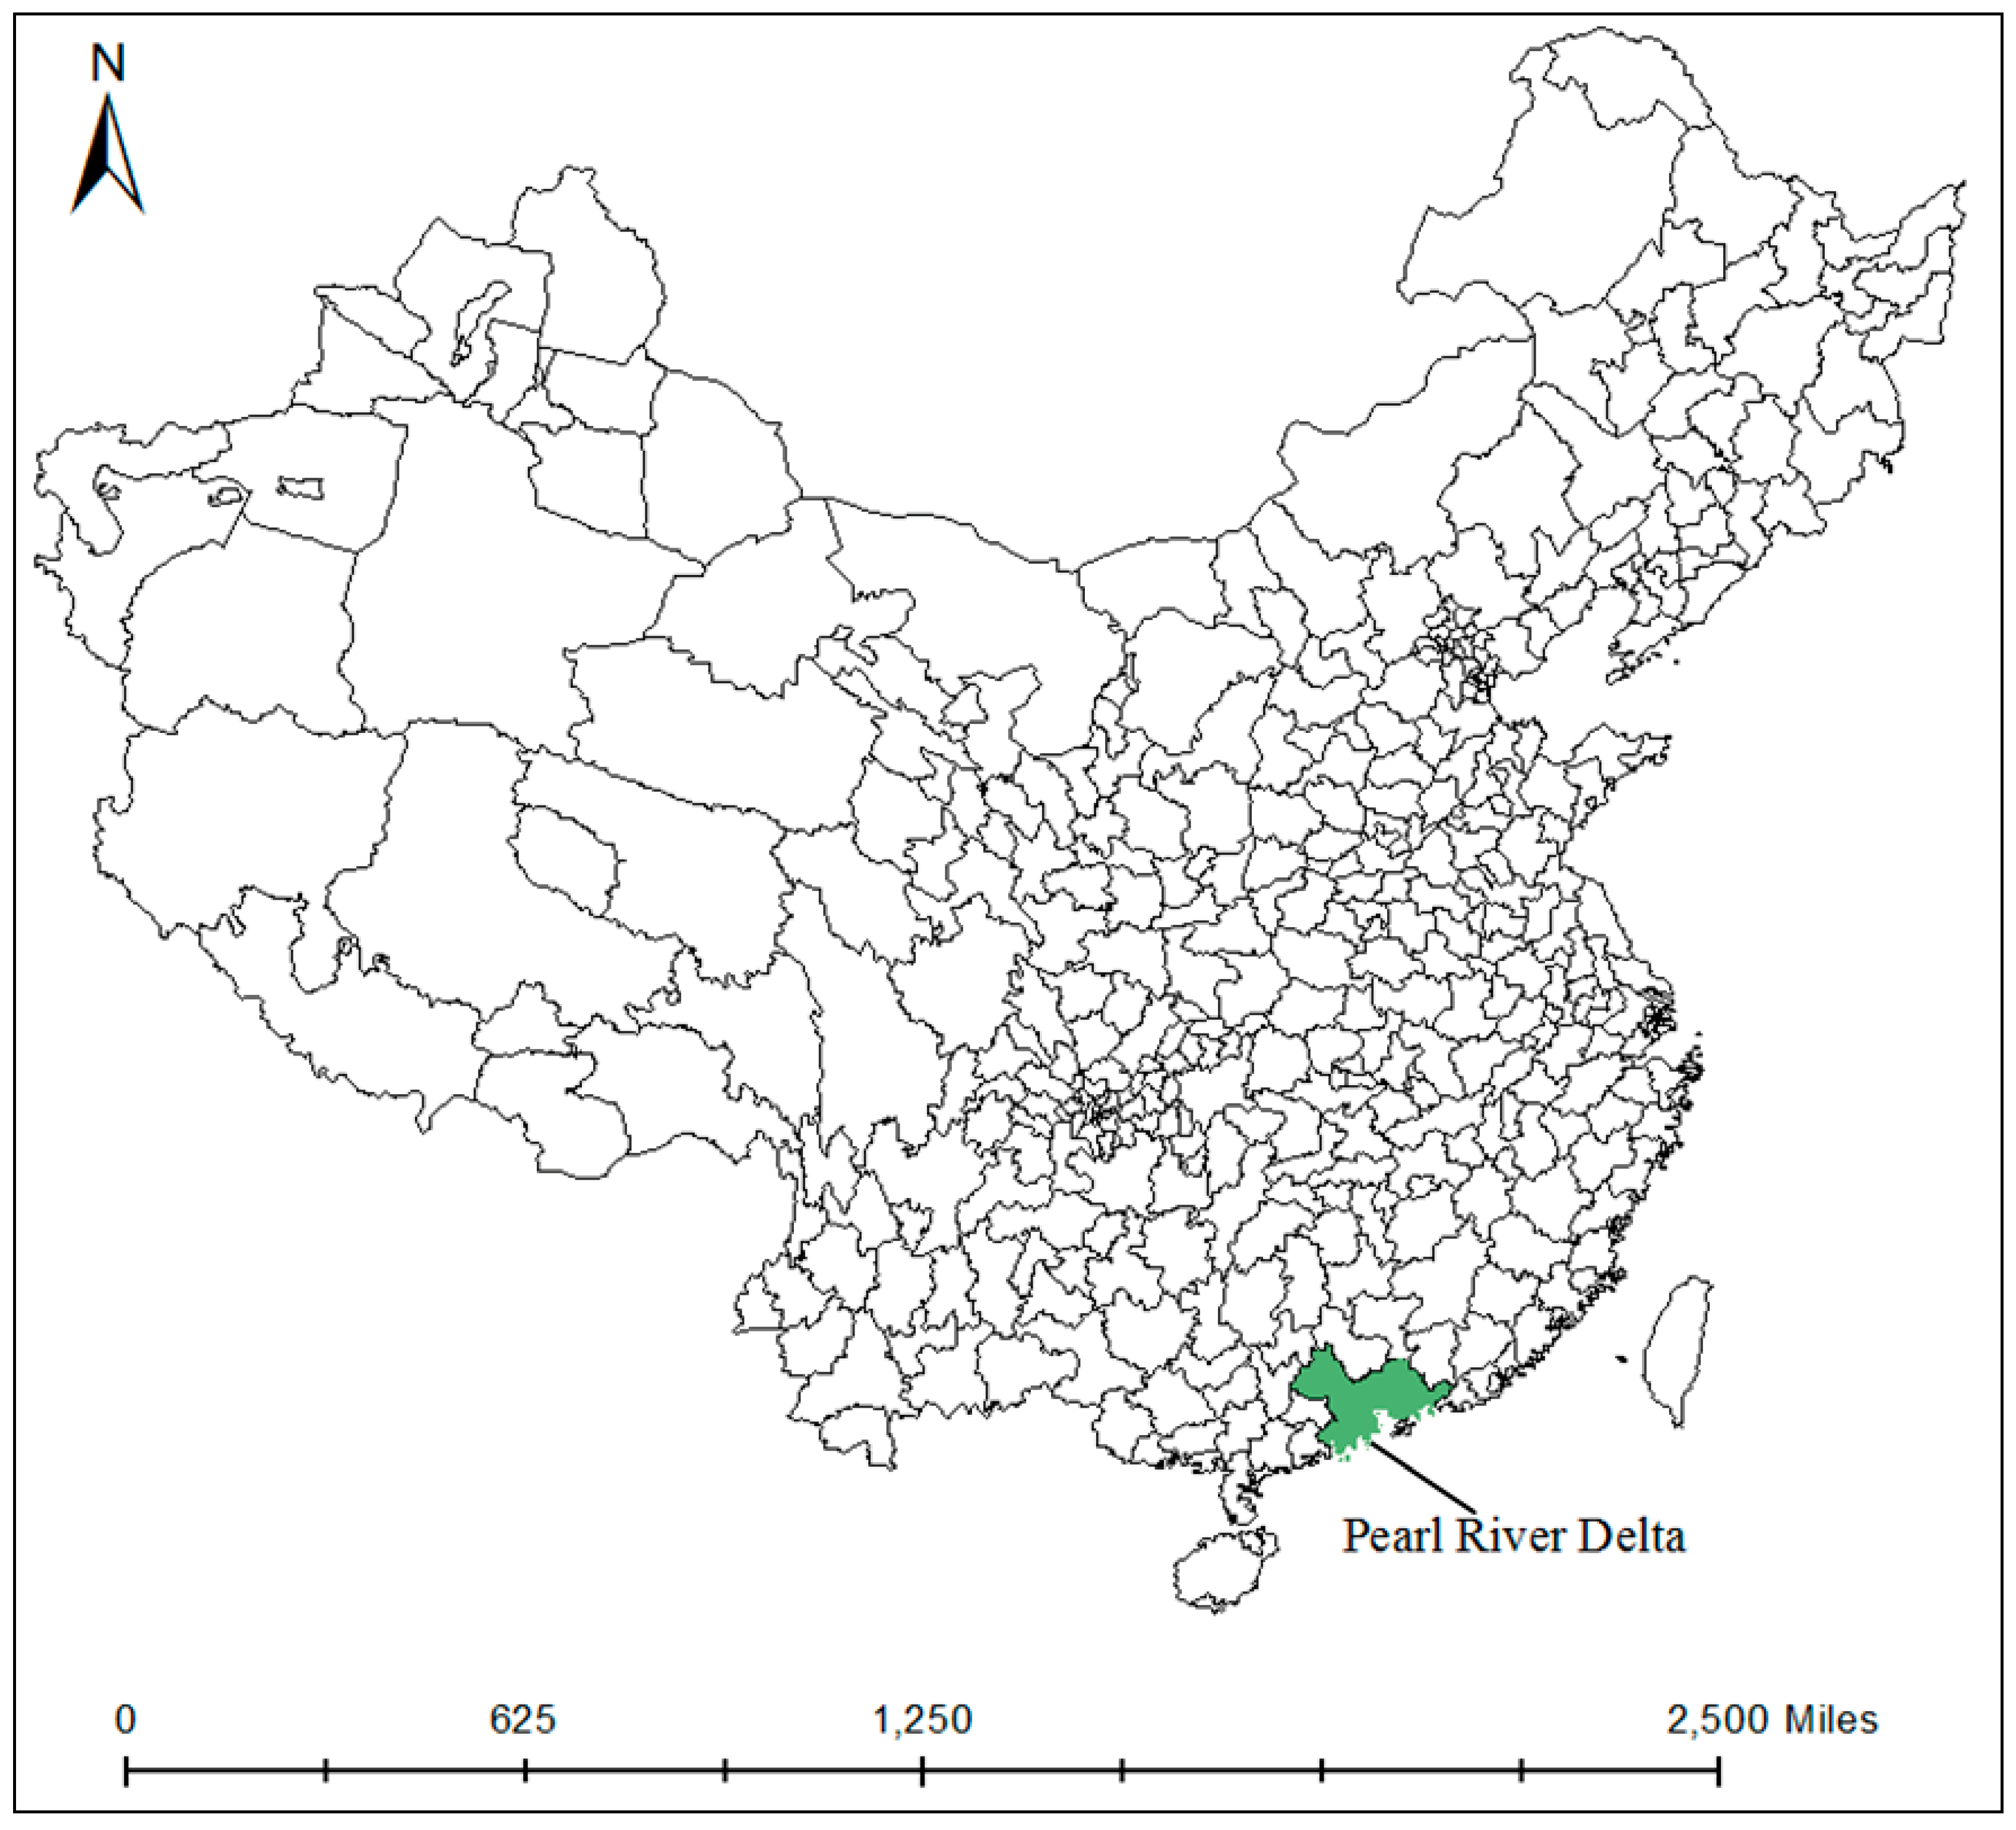
This paper has selected the nine cities in the PRD region, the typical region which can represent the economic development and air pollution in China, as the object of this study. The PRD region is located in the south-central part of Guangdong Province, China’s number one province with the strongest economy (see Figure 2).
In 2017, the regional GDP of the PRD region reached 7.58 trillion Yuan, accounting for 79.7% of Guangdong Province’s total GDP [42], and 9.17% of China’s national GDP [43]. The PRD region is indeed one of the core urban agglomerations in China’s economy. However, at the same time, with the accelerating urbanization in the PRD region, rapid development of its industrial and construction industries, and ever-growing energy consumption, there has also been a sharp increase in the air pollutant emissions, resulting in deteriorating air quality and frequent occurrence of haze weather (see Figure 3) [44].
According to official statistics, in 2013, the number of haze days (when one or more major pollutant concentration indicators exceeded the limits in the national standard [39]) in the PRD region reached 65 days. The average concentration of nitrogen dioxide reached 42 , which was higher than the national standard; the average concentration of inhalable particles reached 70 , which had increased by 18.6%; the average concentration of PM2.5 was 47 , which had not met the national Level II air quality standard [45].
The academia has also paid close attention to the air quality of the PRD urban agglomeration. Lin et al. selected six cities in the PRD region to study the relationship between the hourly peak concentration of PM2.5 and the mortality rate. By using the generalized additive Poisson models, they found significant associations between these two and pointed out that the hourly peak concentration of PM2.5 might be an important factor of the mortality rate of the PRD region [46]. Yang et al. used the high-resolution pollution maps to study the exposure of local residents to air pollution and the health effects of air pollution in the PRD region. By using the Land Use Regression (LUR) models and based on ground-based measurements, they generated high-resolution pollution maps for both PM2.5 and NO2 in the PRD region. By using the above research methods, their model could explain 60.5% of the spatial variation in NO2 and 88.4% of the spatial variation in PM2.5 in the PRD region [47]. Xu et al. studied the influence of city features on the spatial variations of urban carbon sinks based on the geographic proximity data of the PRD region. They found that in the PRD region: (1) Carbon sink function varied with both the distance from the city center and with the city size. The lowest carbon sink may be observed around suburban industrial zones. (2) Carbon sinks decreased with increases in road grades and were lowest near the city expressways [48]. Liu et al. studied the effects of shipping emissions on urban air quality in the PRD region. By using the Shipping Emission Calculation model and an Air Quality Simulation model, they found that in 2013, on average, marine shipping emissions contributed 0.33 and 0.60 respectively to the land SO2 and PM2.5 concentrations in the PRD region [49]. Wang et al. quantified and studied the relationship between the urban form and CO2 emission efficiency in the PRD region. After calculating the CO2 economic efficiency (CEE) and CO2 social efficiency (CSE) of various cities in the PRD region from 1990 to 2013, they further introduced seven landscape metrics to quantify three dimensions of the urban form (extension, irregularity, and compactness) by using remote sensing data. Finally, they discovered a negative correlation between urban sprawl and CEE as well as CSE. They also found out that the urban growth in the PRD region decreases CO2 economic efficiency [50]. By using the WRF-CMAQ Model, Huang et al. studied the source apportionment of PM2.5 in the dry season (November 2010) of the PRD region and adopted the Brute-Force method (BFM) to simulate the contribution of different regions to the PM2.5 pollution in this region. They found that local emissions are important contributors to the PM2.5 pollution in Guangzhou and Foshan; meanwhile, emissions from Dongguan and Huizhou also contribute to the PM2.5 pollution in Guangzhou; while emissions in Guangzhou, Dongguan and Huizhou are major contributors to the PM2.5 pollution in Foshan [51].
However, there are still some deficiencies in the studies of air quality of the PRD cities.
- (1)
- They didn’t take all the six air pollutants covered by China’s current air quality measurement standards into account. Most studies only focused on particulate pollutants such as PM2.5 and PM10.
- (2)
- In the current national air quality standards of China, the calculation of the Air Quality Index (AQI) only depends on the air pollutant with the highest concentration value, which cannot fully reflect the overall air quality of PRD cities [39].
- (3)
- The upper limit for various air pollutants’ concentration index in China’s current national air quality standards is not reasonable. For example, the upper limit for the 24-h average PM2.5 index is only 500, which is often exceeded in the actual measurement in both PRD region and across the country, which is also referred to as “off-the-chart” [41].
Therefore, based on the monthly monitoring data of the six pollutants in various PRD cities published by the Ministry of Environmental Protection [52], and the Guangdong Provincial Department of Environmental Protection [53], this paper has constructed a comprehensive air quality evaluation model that covers the six major air pollutants in China (SO2, NO2, PM10, PM2.5, CO and O3) by introducing the entropy value into the traditional TOPSIS method. Furthermore, this paper has quantified and compared the air quality of different PRD cities based on the data of the six major air pollutants in those cities from July 2015 to June 2018. By comparing the air quality scores of different PRD cities and analyzing the effectiveness of their respective air pollution control policies, this paper aims to provide a scientific basis for the design and implementation of future pollution control policies in the PRD region.
In the following parts of this paper, we have completed the following research work: (1) constructing the TOPSIS Comprehensive Evaluation model that has introduced the entropy value; (2) calculating the air quality scores of various PRD cities by using the comprehensive evaluation model and the data of the six major air pollutants from July 2015 to June 2018; (3) analyzing the main reasons behind the fluctuations in air quality scores of different PRD cities based on the calculation results, and (4) providing conclusions of this paper as well as policy recommendations for future air pollution control in the PRD region based on the calculation results and analysis in previous parts.
2. Materials and Methods
As a comprehensive evaluation method for multi-objective decision making based on limited options, the TOPSIS evaluation method has a lot of advantages in that it can eliminate the dimensional differences between different indicators by normalizing the raw data, make full use of the normalized data, and obtain the evaluation scores of different options or plans by objectively reflecting the gap between different options and plans [54,55,56]. However, there are still some problems in the application of this method. For example, the weight of various indicators is given in advance, which means the evaluation result is based on subjective judgment to some extent [57,58]. In order to make up for this imperfection of the TOPSIS evaluation method and more objectively evaluate the air quality of the PRD cities based on the six major air pollutants, this paper has integrated the entropy value into the TOPSIS evaluation method based on research trends in recent years to scientifically calculate the weight of each indicator and achieve more objective evaluation results [59,60,61]. The specific calculation steps are as follows:
2.1. Normalization
Let the Decision Matrix of the Air Quality Evaluation Problem be , which can be written as:
As the dimensions of different evaluation indicators in the decision-making problem are not aligned, we need to normalize the elements of the Decision Matrix :
Using the above formula, we could obtain the normalized decision matrix as below:
2.2. Determine the Weight of Different Indicators by the Entropy Method
- (1)
- Calculate the proportion of the th option or plan with the th indicator ():
- (2)
- (3)
- Calculate the variation coefficient of the th indicator (). For the th indicator, the bigger the variation coefficient, the smaller the entropy value is, i.e.,
- (4)
- Calculate the weight of the th indicator:
2.3. Construct the Normalized Weighted Decision Matrix
After obtaining the weights of different indicators, this paper further constructs the normalized Weighted Decision Matrix :
in which , which represents the weights of various indicators.
2.4. Calculate the Comprehensive Evaluation Score of Various Options/Plans
After constructing the normalized weighted decision matrix, this paper has determined the best and the worst air quality solutions through below formula, i.e., the optimal solution () and the negative optimal solution () of this model:
Then, this paper has further calculated the relative proximity between the air quality values of various PRD cities () and the optimal solution:
At last, the air quality evaluation results () of various cities could be obtained by the formula below:
According to this formula, the higher the score, the better the city’s air quality is; while the lower the score, the worse the city’s air quality is.
3. Results
This study is based on the official monitoring data of the air quality or air pollutants of various PRD cities from July 2015 to June 2018, published by China’s National Environmental Monitoring Center [64], Data Center of China’s Ministry of Environmental Protection [52], and Guangdong Provincial Department of Environmental Protection [53]. This dataset includes the daily concentration data of six major air pollutants (PM2.5, PM10, CO, NO2, O3 and SO2) in 1096 days, which is complete. Based on the daily data, we calculated the monthly average concentration data of the six pollutants in nine PRD cities within the study period.
Based on the official statistical data of air pollutants as mentioned above and by using the TOPSIS comprehensive evaluation model which combined the entropy value as described in Part 2 (please refer the MATLAB algorithms in Appendix B and Appendix C), this paper has calculated the air quality evaluation scores of the nine cities in the PRD region from July 2015 to June 2018 as shown in Figure 4 below (please also refer to Table A1, Table A2, Table A3 and Table A4 in Appendix A).
4. Discussion
Based on the above calculation results, this paper has found distinct differences in the air quality of different PRD cities from July 2015 to June 2018, with clear seasonal trends. More specifically:
- (1)
- The air quality of the four cities of Guangzhou, Foshan, Dongguan and Zhaoqing has shown significant improvement when comparing the ending score with that of the beginning period, with improvement of 25%, 22%, 16% and 15% respectively. However, what is worth noticing is that the overall air quality of these four cities during the study period is far from satisfaction. The air quality score of Guangzhou has ranked bottom among PRD cities for several months before September 2016 and only improved gradually until the latter half of 2017; although the air quality score of Dongguan has been among the top tier in the PRD region since October 2017, its level in the first half of the study period is not so optimistic; while the overall air quality score of Foshan and Zhaoqing has not been ideal. The main reason for this is: as the provincial capital and a megacity, Guangzhou has always been high on industrial waste gas emissions and the number of mobile pollution sources such as motor vehicles [65], which has taken a toll its air quality, while the poor air quality of Dongguan, Foshan and Zhaoqing has something to do with their geographical location; these three cities are located in the hinterland of the PRD, so they are not only affected by the pollutants from the northern part of China but also susceptible to pollution transmitted from other cities [66,67]. Faced with such a serious situation, these four cities have taken active measures to improve their air quality. After scientifically analyzing the main sources of its air pollutants, Guangzhou has made industrial firing coal (mainly for industrial boilers), motor vehicle and ship emissions, volatile organic compounds (VOC) and dust pollution as their key pollution control targets, and completed the construction of an Air Quality Monitoring and Early Warning Center in early 2018 in order to closely monitor and control the air quality of the entire city. After investigating their city’s pollution sources, Dongguan has made a list of key monitoring areas and enterprises for air pollution prevention and control and helped enterprises make plan adjustments based on scientific information according to the seasonal characteristics and wind directions to minimize air pollution. Foshan and Zhaoqing have made industrial firing coal, construction site earthwork and high-emission vehicles as their main targets for air pollution prevention and control, and adopted measures including environmental regulation and technology upgrading to better monitor and manage air pollution sources. Although these pollution control measures have achieved certain results, whether these four cities could continue to maintain the improved air quality still requires further study based on new data to be acquired.
- (2)
- Although during the study period, Shenzhen and Huizhou have not achieved such a significant improvement in air quality as Guangzhou did (Shenzhen’s and Huizhou’s air quality scores have improved by 4.6% and 7.8% respectively), since October 2017, the air quality scores of these two cities have been ranked top among PRD cities. Based on the annual framework of air pollution control designed by Guangdong Province, Shenzhen has set up the air pollution control targets and key measures based on a three-year cycle and emphasized on the air pollutants generated from its industrial, construction, shipping and catering industries according to the city’s own characteristics. For the industries, it has pushed forward measures such as the clean production transformation in coal-fired power generation, management of volatile organic compounds (VOCs) from production lines and the furniture industry, and rectification or shut-down of polluting enterprises. It has issued a series of local regulations regarding the above measures and achieved significant results. At the same time, Shenzhen has made great efforts to rectify mobile pollution sources with the help of technological advancement. By the end of 2017, Shenzhen had upgraded all its buses to 100% electric power-driven, and become the city in the entire world with the largest number of electric buses [68,69]. Huizhou has also made advances in pollution control policies. In the management of industrial pollution sources, it has adopted advanced technologies to control smoke and dust emissions and completed the low-emission transformation of coal-fired power plants in the city with help of the low-nitrogen combustion technology and flue gas denitration technology. Regarding the other two major polluting industries in the city; the cement production industry and auto repair industry, Huizhou has actively promoted the denitration technology and water-based paint transformation technology and facilitated the development of new-energy vehicles by means of government subsidies. These policies have achieved remarkable results in improving urban air quality.
- (3)
- The air quality of the three cities of Jiangmen, Zhuhai and Zhongshan has declined during the study period, by 13%, 11% and 7.2% respectively. On the one hand, this is due to the geographical location of these cities. These three cities are located at the southern end of the Pearl River Delta. Although the geographical proximity to the ocean makes their air pollutants more easily blown away by the sea breeze, all three cities are in the downwind direction and are still affected by air pollutants from the upwind cities. The main wind direction in the PRD region is the north wind, especially in autumns and winters [70,71]. Therefore, the air quality of these three cities at the downwind direction has shown a clear decline during autumns and winters. Moreover, since September 2017, the wind speed in the PRD region has weakened [72,73], and thus the lingering time of air pollutants such as ozone and particulate pollutants in these cities increased, which has also aggravated the deterioration of air quality in these three cities. On the other hand, the time that these three cities started to implement air pollution control policies has been comparatively late, which has also led to severe air pollution to some extent. For example, Jiangmen didn’t begin to set up a gridded air pollution monitoring system that accurately locates pollution sources until the second half of 2017. Although the construction pace of the system has been fast, it is comparatively late in terms of the whole pollution control campaign. Zhuhai has also issued its annual air pollution control plan based on the annual framework of air pollution control designed by Guangdong Province, but this plan is clearly not as detailed as that of Shenzhen and Huizhou, and has not reflected its own city characteristics. Historically speaking, the air quality of Zhuhai has been good. In 2016 and 2017, the air quality of Zhuhai has ranked top for several times among the key monitoring cities of China according to the data released by the Ministry of Environmental Protection, which is also agreed by the calculation results of this paper. However, it is worth noticing that Zhuhai’s air quality has decreased since 2018 and has been overtaken by that of Shenzhen. The formulation and implementation of air pollution control policies in Zhongshan are also lagging behind. The “Plan for Zhongshan City Air Pollution Prevention and Control Enhancement Measures”, which accurately broke down the city’s pollution sources, was only adopted in October 2017, and the gridded air quality monitoring system of Zhongshan only started construction afterwards, even later and slower in progress than that of Jiangmen. Moreover, as far as the specific air pollution control measures are concerned, many of those measures are short-term and “campaign-style” such as increasing the frequency of sprinkling near dust pollution sources, enhancing traffic control in order to reduce mobile pollution sources, sudden investigation and penalty on violations of environmental regulations and laws, etc.
- (4)
- There are obvious seasonal fluctuations in the air quality of PRD cities. According to the calculation results, the air quality in the Pearl River Delta is relatively better during summers, while worse during autumns and winters. Apart from the reasons of geographical locations and wind directions as mentioned above, climate characteristics are also an important reason behind. The Pearl River Delta has a typical coastal subtropical climate, and is susceptible to typhoons from June to October every year, with torrential rainfall. Therefore, despite the hot summer weather, it is difficult for air pollutants to accumulate in the atmosphere, and the lingering time is comparatively shorter. However, during winters, due to weakening of the wind and decrease of precipitation, the air pollution problem becomes more prominent. Moreover, during winters, the wind direction is always the same in the PRD region, and the air pollution sources in this region are concentrated in the most economically developed cities in PRD, Guangzhou and Shenzhen, which are located in the central part of the region. Therefore, it is very easy for air pollutants such as ozone and particulate pollutants to be transmitted into downwind cities, thus resulting in the decline of air quality. This strong seasonal fluctuation pattern has made it difficult to control air pollution in the downwind cities and in the entire region.
5. Conclusions
This paper has introduced the entropy value into the traditional TOPSIS evaluation model and constructed a comprehensive evaluation model based on the six main air pollutants included in China’s current Ambient Air Quality Standards (GB 3095-2012), i.e., SO2, NO2, PM10, PM2.5, CO and O3. Based on the official air pollutant data of the nine cities in the Pearl River Delta (PRD) region from July 2015 to June 2018, this paper has quantified and analyzed the air quality evaluation scores of various PRD cities within the study period on a monthly basis. The purpose is to contribute to the existing studies on China’s air quality measurement and evaluation, and provide a scientific basis for air pollution control and related policy-making in the PRD region. The conclusions of this paper are: During the study period, there have been distinct differences in the air quality of cities in the PRD region. Considering the climatic factors such as typhoon and different precipitation levels, there are obvious seasonal characteristics in their air quality. More specifically: (1) The air quality of Guangzhou, Foshan, Dongguan and Zhaoqing has improved by 25%, 22%, 16% and 15% respectively when comparing their air quality score of the last period with that of the beginning period. However, the overall air quality of these four cities during the study period was far from satisfactory. Apart from reasons of excessive industrial waste gas emissions and mobile pollution sources such as motor vehicles, geographical locations and climatic conditions are also important contributors to this situation. (2) Although the air quality of Shenzhen and Huizhou has not shown big improvements during the study period, their air quality has always been among the best in the PRD region. Moreover, during the study period, there have been remarkable achievements in the pollution control of key industries and pollution control by taking advantage of scientific and technological progress. (3) The air quality of Jiangmen, Zhuhai and Zhongshan has experienced a decrease of 13%, 11% and 7.2% respectively if comparing their air quality score of the last period with that of the beginning period. Apart from geographical reasons, the implementation of air pollution control policies is also relatively weak in these cities.
Based on the findings above, this paper has provided below policy recommendations in order to further enhance air pollution control in different PRD cities:
- (1)
- Take advantage of the regional integration of the PRD region in Guangdong Province’s urban and rural planning, and promote integrated and coordinated pollution control policy design and implementation across different PRD cities. In July 2010, Guangdong Province officially issued the “Pearl River Delta Urban and Rural Planning Integration Plan (2009–2020)”, in which environmental protection is an important component. Based on the analysis above, in order for cities in the Pearl River Delta to overcome geographical and climatic constraints when dealing with air pollution, they must work together. Therefore, in the face of the transmission and spread of air pollution across the PRD region, these cities need to seize the opportunity of regional integration of the PRD region, and work together to achieve information sharing and joint prevention and control of air pollution in order to eventually realize the integration in air pollution control work. Moreover, from the perspective of administrative structure, all the PRD cities are under the jurisdiction of the Guangdong Provincial Government, which also makes it easier for them to achieve synergy in coordinated air pollution control.
- (2)
- Currently, the air pollution control policies of different PRD cities are not aligned, which requires these cities to formulate targeted policies and measures based on integrated pollution control actions as well as the characteristics of their own pollution sources and their own major air pollutants. These cities also need to gradually adjust and coordinate the pace of their air pollution control work across the entire PRD region. Based on our analysis above, cities that launched pollution control policies relatively late, such as Jiangmen, Zhuhai and Zhongshan, could learn from the advanced experiences of Shenzhen and Huizhou in order to formulate and implement medium- and long-term air pollution control policies, avoid “campaign-style” short-term governance model, and achieve sustainability in air pollution control.
- (3)
- Utilize advanced technology to upgrade existing industries and equipment in order to minimize the economic and social costs of air pollution control policies. Given that the industrial and construction industries in the PRD region, especially those in Guangzhou and Shenzhen, are the main sources of air pollution, although non-discretionary implementation of air pollution control measures such as shut-down policies could achieve immediate and significant effects, this would also inevitably result in huge economic and social costs, and even cause social unrest. Therefore, the cities in the PRD region should utilize advanced technology to upgrade existing industries and their equipment that produces pollution in order to reduce air pollutant emissions and achieve sustainable development without impacting their productivity and even enlarging their production capacity at the same time.
Author Contributions
Conceptualization, W.Y. and Y.Y.; methodology, H.G.; software, H.G.; validation, W.Y. and Y.Y.; formal analysis, W.Y.; investigation, H.G.; resources, W.Y.; data curation, Y.Y.; writing original draft preparation, H.G.; writing review and editing, W.Y. and G.Y.; visualization, Y.Y. and G.Y.; supervision, W.Y.; project administration, Y.Y.
Funding
Weixin Yang is financially supported by the Humanities and Social Sciences Research Fund of the University of Shanghai for Science and Technology, and the Decision-making Consultation Research Project of Shanghai Municipal Government. The authors gratefully acknowledge the above financial supports.
Conflicts of Interest
The authors declare no conflict of interest.
Appendix A

Table A1.
Air quality evaluation score of cities in the PRD region (July 2015 to March 2016).
| Guangzhou | Shenzhen | Foshan | Dongguan | Zhongshan | Zhuhai | Jiangmen | Zhaoqing | Huizhou | |
|---|---|---|---|---|---|---|---|---|---|
| Jul. 2015 | 0.3474 | 0.5413 | 0.3611 | 0.3729 | 0.4928 | 0.5412 | 0.4938 | 0.3948 | 0.4990 |
| Aug. 2015 | 0.3426 | 0.5605 | 0.3967 | 0.3716 | 0.5033 | 0.5822 | 0.5097 | 0.4502 | 0.5236 |
| Sep. 2015 | 0.3821 | 0.5231 | 0.3830 | 0.3563 | 0.4677 | 0.5583 | 0.4743 | 0.3890 | 0.5032 |
| Oct. 2015 | 0.4457 | 0.4765 | 0.3954 | 0.4239 | 0.4344 | 0.4163 | 0.4288 | 0.4457 | 0.5554 |
| Nov. 2015 | 0.4573 | 0.4962 | 0.4109 | 0.4389 | 0.4486 | 0.4447 | 0.4620 | 0.3992 | 0.5267 |
| Dec. 2015 | 0.3845 | 0.5117 | 0.3747 | 0.4407 | 0.4316 | 0.4279 | 0.4804 | 0.4553 | 0.5727 |
| Jan. 2016 | 0.4267 | 0.4909 | 0.4517 | 0.4735 | 0.5118 | 0.4724 | 0.5170 | 0.4713 | 0.5671 |
| Feb. 2016 | 0.4550 | 0.5243 | 0.5110 | 0.5491 | 0.5453 | 0.5293 | 0.5472 | 0.5729 | 0.5265 |
| Mar. 2016 | 0.3783 | 0.4748 | 0.400 | 0.4060 | 0.4642 | 0.4766 | 0.4750 | 0.4563 | 0.4919 |
Table A2.
Air quality evaluation score of cities in the PRD region (April 2016 to December 2016).
| Guangzhou | Shenzhen | Foshan | Dongguan | Zhongshan | Zhuhai | Jiangmen | Zhaoqing | Huizhou | |
|---|---|---|---|---|---|---|---|---|---|
| Apr. 2016 | 0.4183 | 0.5147 | 0.4658 | 0.4949 | 0.5083 | 0.5146 | 0.4781 | 0.3908 | 0.5304 |
| May. 2016 | 0.4085 | 0.5166 | 0.3939 | 0.3983 | 0.4904 | 0.4976 | 0.4175 | 0.3854 | 0.5254 |
| Jun. 2016 | 0.3422 | 0.5647 | 0.3358 | 0.3352 | 0.6149 | 0.6377 | 0.4783 | 0.3639 | 0.4734 |
| Jul. 2016 | 0.2896 | 0.4205 | 0.3106 | 0.3415 | 0.4508 | 0.5383 | 0.3679 | 0.3639 | 0.3831 |
| Aug. 2016 | 0.3622 | 0.5029 | 0.3557 | 0.3826 | 0.4373 | 0.5188 | 0.4092 | 0.3976 | 0.4887 |
| Sep. 2016 | 0.3837 | 0.5000 | 0.3928 | 0.3965 | 0.4439 | 0.4782 | 0.4005 | 0.4285 | 0.5593 |
| Oct. 2016 | 0.4718 | 0.5598 | 0.3925 | 0.4263 | 0.4260 | 0.4425 | 0.3607 | 0.4341 | 0.5989 |
| Nov. 2016 | 0.4077 | 0.5418 | 0.3636 | 0.4375 | 0.4654 | 0.5044 | 0.3614 | 0.4071 | 0.5961 |
| Dec. 2016 | 0.4457 | 0.5279 | 0.4117 | 0.4878 | 0.4223 | 0.4886 | 0.3919 | 0.4531 | 0.5443 |
Table A3.
Air quality evaluation score of cities in the PRD region (January 2017 to September 2017).
Table A3.
Air quality evaluation score of cities in the PRD region (January 2017 to September 2017).
| Guangzhou | Shenzhen | Foshan | Dongguan | Zhongshan | Zhuhai | Jiangmen | Zhaoqing | Huizhou | |
|---|---|---|---|---|---|---|---|---|---|
| Jan. 2017 | 0.4154 | 0.5965 | 0.3619 | 0.4794 | 0.4787 | 0.5679 | 0.4015 | 0.4452 | 0.5667 |
| Feb. 2017 | 0.4219 | 0.5295 | 0.3884 | 0.3992 | 0.4289 | 0.5436 | 0.4032 | 0.4580 | 0.5253 |
| Mar. 2017 | 0.4373 | 0.5328 | 0.4379 | 0.4546 | 0.4793 | 0.5045 | 0.4424 | 0.4524 | 0.5233 |
| Apr. 2017 | 0.4135 | 0.5586 | 0.3996 | 0.4208 | 0.5048 | 0.6117 | 0.4450 | 0.4909 | 0.4961 |
| May. 2017 | 0.3640 | 0.5042 | 0.3408 | 0.3818 | 0.4054 | 0.5278 | 0.3641 | 0.4064 | 0.5366 |
| Jun. 2017 | 0.3503 | 0.6224 | 0.3890 | 0.3836 | 0.6169 | 0.7237 | 0.5576 | 0.4166 | 0.5204 |
| Jul. 2017 | 0.3880 | 0.5492 | 0.3558 | 0.4275 | 0.4387 | 0.6202 | 0.3885 | 0.3630 | 0.5532 |
| Aug. 2017 | 0.4034 | 0.4958 | 0.4501 | 0.3869 | 0.4492 | 0.5610 | 0.4415 | 0.5087 | 0.4283 |
| Sep. 2017 | 0.3306 | 0.4723 | 0.3234 | 0.3419 | 0.4036 | 0.5105 | 0.3528 | 0.3257 | 0.4788 |
Table A4.
Air quality evaluation score of cities in the PRD region (October 2017 to June 2018).
| Guangzhou | Shenzhen | Foshan | Dongguan | Zhongshan | Zhuhai | Jiangmen | Zhaoqing | Huizhou | |
|---|---|---|---|---|---|---|---|---|---|
| Oct. 2017 | 0.5140 | 0.5508 | 0.4443 | 0.4836 | 0.3979 | 0.4222 | 0.3653 | 0.4557 | 0.5727 |
| Nov. 2017 | 0.5034 | 0.5326 | 0.4785 | 0.4974 | 0.4332 | 0.3929 | 0.3993 | 0.5312 | 0.5420 |
| Dec. 2017 | 0.4919 | 0.5329 | 0.4465 | 0.4840 | 0.4374 | 0.4424 | 0.4000 | 0.4673 | 0.5406 |
| Jan. 2018 | 0.4102 | 0.5646 | 0.4086 | 0.4388 | 0.4690 | 0.4662 | 0.4311 | 0.3768 | 0.5405 |
| Feb. 2018 | 0.4867 | 0.5463 | 0.4445 | 0.4775 | 0.4271 | 0.4292 | 0.3922 | 0.4573 | 0.5537 |
| Mar. 2018 | 0.4791 | 0.5418 | 0.4513 | 0.4790 | 0.4400 | 0.4247 | 0.4044 | 0.4727 | 0.5437 |
| Apr. 2018 | 0.4720 | 0.5437 | 0.4395 | 0.4727 | 0.4421 | 0.4410 | 0.4055 | 0.4483 | 0.5438 |
| May. 2018 | 0.4516 | 0.5522 | 0.4305 | 0.4614 | 0.4494 | 0.4455 | 0.4129 | 0.4264 | 0.5444 |
| Jun. 2018 | 0.4352 | 0.5661 | 0.4420 | 0.4336 | 0.4571 | 0.4839 | 0.4314 | 0.4524 | 0.5379 |
Appendix B
| Algorithm 1. The MATLAB Algorithm for Determining the Weight of Different Indicators by the Entropy Method |
| R=[] |
| [rows,cols]=size(R); |
| k=1/log(rows); |
| Rmin = min(R); |
| Rmax = max(R); |
| A = max(R) − min(R); |
| y = R − repmat(Rmin,51,1); |
| for j = 1: size(y,2) |
| y(:,j) = y(:,j)/A(j) |
| end |
| S = sum(y,1) |
| Y = zeros(rows,cols); |
| for i = 1: size(Y,2) |
| Y(:,i) = y(:,i)/S(i) |
| end |
| lnYij=zeros(rows,cols); |
| for i=1:rows |
| for j=1:cols |
| if Y(i,j)==0 |
| lnYij(i,j)=0; |
| else |
| lnYij(i,j)=log(Y(i,j)); |
| end |
| end |
| end |
| ej=−k*(sum(Y.*lnYij,1)); |
| weights=(1−ej)/(cols−sum(ej)); |
| F = zeros(rows,cols); |
| for k = 1: size(R,2) |
| F(:,k) = weights(k)*y(:,k) |
| end |
| format long |
| F = sum(F,2) |
Appendix C
| Algorithm 2. The MATLAB Algorithm for Calculating the Comprehensive Evaluation Score by the TOPSIS Evaluation Method |
| function [ output_args ] = TOPSIS(A,W,M,N) |
| [ma,na]=size(A); |
| A=xiangliangguiyi(A); |
| for i=1:na |
| B(:,i)=A(:,i)*W(i); |
| end |
| V1=zeros(1,na); |
| V2=zeros(1,na); |
| BMAX=max(B); |
| BMIN=min(B); |
| for i=1:na |
| if i<=size(M,2) |
| V1(M(i))=BMAX(M(i)); |
| V2(M(i))=BMIN(M(i)); |
| end |
| if i<=size(N,2) |
| V1(N(i))=BMIN(N(i)); |
| V2(N(i))=BMAX(N(i)); |
| end |
| end |
| for i=1:ma |
| C1=B(i,:)−V1; |
| S1(i)=norm(C1); |
| C2=B(i,:)−V2; |
| S2(i)=norm(C2); |
| T(i)=S2(i)/(S1(i)+S2(i)); |
| end |
References
- Zeng, S.; Zheng, Y. Analysis of a Severe Pollution Episode in December 2017 in Sichuan Province. Atmosphere (Basel) 2019, 10, 156. [Google Scholar] [CrossRef]
- Zhang, S.; Zhong, L.; Chen, X.; Liu, Y.; Zhai, X.; Xue, Y.; Wang, W.; Liu, J.; Xu, K. Emissions Characteristics of Hazardous Air Pollutants from the Incineration of Sacrificial Offerings. Atmosphere (Basel) 2019, 10, 332. [Google Scholar] [CrossRef]
- Li, L.; Yang, W. Total Factor Efficiency Study on China’s Industrial Coal Input and Wastewater Control with Dual Target Variables. Sustainability 2018, 10, 2121. [Google Scholar] [CrossRef]
- Yang, Y.; Yang, W. Does Whistleblowing Work for Air Pollution Control in China? A Study Based on Three-party Evolutionary Game Model under Incomplete Information. Sustainability 2019, 11, 324. [Google Scholar] [CrossRef]
- Yang, W.; Li, L. Analysis of Total Factor Efficiency of Water Resource and Energy in China: A Study Based on DEA-SBM Model. Sustainability 2017, 9, 1316. [Google Scholar] [CrossRef]
- Anh, H.Q.; Tomioka, K.; Tue, N.M.; Tuyen, L.H.; Chi, N.K.; Minh, T.B.; Viet, P.H.; Takahashi, S. A preliminary investigation of 942 organic micro-pollutants in the atmosphere in waste processing and urban areas, northern Vietnam: Levels, potential sources, and risk assessment. Ecotoxicol. Environ. Saf. 2019, 167, 354–364. [Google Scholar] [CrossRef] [PubMed]
- Xiang, Y.; Zhang, T.; Liu, J.; Lv, L.; Dong, Y.; Chen, Z. Atmosphere boundary layer height and its effect on air pollutants in Beijing during winter heavy pollution. Atmos. Res. 2019, 215, 305–316. [Google Scholar] [CrossRef]
- Yang, W.; Li, L. Energy Efficiency, Ownership Structure, and Sustainable Development: Evidence from China. Sustainability 2017, 9, 912. [Google Scholar] [CrossRef]
- Wang, W.; Tang, X.; Yang, X.; Zhang, B.; Zhang, Y.; Höök, M. Energy savings in China’s energy sectors and contributions to air pollution reduction in the 12th Five Year Plan. J. Clean. Prod. 2018, 200, 305–317. [Google Scholar] [CrossRef]
- Ling, Z.; Huang, T.; Li, J.; Zhou, S.; Lian, L.; Wang, J.; Zhao, Y.; Mao, X.; Gao, H.; Ma, J. Sulfur dioxide pollution and energy justice in Northwestern China embodied in West-East Energy Transmission of China. Appl. Energy 2019, 238, 547–560. [Google Scholar] [CrossRef]
- Wang, X.; Chen, J.; Cheng, T.; Zhang, R.; Wang, X. Particle number concentration, size distribution and chemical composition during haze and photochemical smog episodes in Shanghai. J. Environ. Sci. 2014, 26, 1894–1902. [Google Scholar] [CrossRef] [PubMed]
- Yang, W.; Li, L. Efficiency evaluation of industrial waste gas control in China: A study based on data envelopment analysis (DEA) model. J. Clean. Prod. 2018, 179, 1–11. [Google Scholar] [CrossRef]
- Lang, J.; Li, S.; Cheng, S.; Zhou, Y.; Chen, D.; Zhang, Y.; Zhang, H.; Wang, H. Chemical Characteristics and Sources of Submicron Particles in a City with Heavy Pollution in China. Atmosphere (Basel) 2018, 9, 388. [Google Scholar] [CrossRef]
- Tilt, B. China’s air pollution crisis: Science and policy perspectives. Environ. Sci. Policy 2019, 92, 275–280. [Google Scholar] [CrossRef]
- Chen, S.; Guo, C.; Huang, X. Air Pollution, Student Health, and School Absences: Evidence from China. J. Environ. Econ. Manag. 2018, 92, 465–497. [Google Scholar] [CrossRef]
- Xu, Y.; Xue, W.; Lei, Y.; Zhao, Y.; Cheng, S.; Ren, Z.; Huang, Q. Impact of Meteorological Conditions on PM2.5 Pollution in China during Winter. Atmosphere (Basel) 2018, 9, 429. [Google Scholar] [CrossRef]
- National Bureau of Statistics of China. China Statistical Yearbook, 2000–2017; China Statistic Press: Beijing, China, 2018.
- Zeng, Y.; Cao, Y.; Qiao, X.; Seyler, B.C.; Tang, Y. Air pollution reduction in China: Recent success but great challenge for the future. Sci. Total Environ. 2019, 663, 329–337. [Google Scholar] [CrossRef] [PubMed]
- Wei, Y.; Gu, J.; Wang, H.; Yao, T.; Wu, Z. Uncovering the culprits of air pollution: Evidence from China’s economic sectors and regional heterogeneities. J. Clean. Prod. 2018, 171, 1481–1493. [Google Scholar] [CrossRef]
- Shen, Y.; Ahlers, A.L. Blue sky fabrication in China: Science-policy integration in air pollution regulation campaigns for mega-events. Environ. Sci. Policy 2019, 94, 135–142. [Google Scholar] [CrossRef] [Green Version]
- Li, R.; Wang, Z.; Cui, L.; Fu, H.; Zhang, L.; Kong, L.; Chen, W.; Chen, J. Air pollution characteristics in China during 2015–2016: Spatiotemporal variations and key meteorological factors. Sci. Total Environ. 2019, 648, 902–915. [Google Scholar] [CrossRef]
- Yang, W.; Yuan, G.; Han, J. Is China’s air pollution control policy effective? Evidence from Yangtze River Delta cities. J. Clean. Prod. 2019, 220, 110–133. [Google Scholar] [CrossRef]
- Ma, M.; Bai, K.; Qiao, F.; Shi, R.; Gao, W. Quantifying impacts of crop residue burning in the North China Plain on summertime tropospheric ozone over East Asia. Atmos. Environ. 2018, 194, 14–30. [Google Scholar] [CrossRef]
- Wang, Y.; Sun, M.; Yang, X.; Yuan, X. Public awareness and willingness to pay for tackling smog pollution in China: A case study. J. Clean. Prod. 2016, 112, 1627–1634. [Google Scholar] [CrossRef]
- Yang, W.; Li, L. Efficiency Evaluation and Policy Analysis of Industrial Wastewater Control in China. Energies 2017, 10, 1201. [Google Scholar] [CrossRef]
- Lü, H.; Huang, Y.-H.; Huang, X.-J.; Cai, Q.-Y. The state of particulate matter (PM) contamination, PM-bound heavy metals and persistent organic pollutants (POPs) in megacities China. Curr. Opin. Environ. Sci. Health 2019, 8, 15–22. [Google Scholar] [CrossRef]
- Li, X.; Song, H.; Zhai, S.; Lu, S.; Kong, Y.; Xia, H.; Zhao, H. Particulate matter pollution in Chinese cities: Areal-temporal variations and their relationships with meteorological conditions (2015–2017). Environ. Pollut. 2019, 246, 11–18. [Google Scholar] [CrossRef] [PubMed]
- Liu, Y.; Li, X.; Tang, G.; Wang, L.; Lv, B.; Guo, X.; Wang, Y. Secondary organic aerosols in Jinan, an urban site in North China: Significant anthropogenic contributions to heavy pollution. J. Environ. Sci. 2019, 80, 107–115. [Google Scholar] [CrossRef]
- Zheng, F.; Yu, T.; Cheng, T.; Gu, X.; Guo, H. Intercomparison of tropospheric nitrogen dioxide retrieved from Ozone Monitoring Instrument over China. Atmos. Pollut. Res. 2014, 5, 686–695. [Google Scholar] [CrossRef] [Green Version]
- Zhou, L.; Wang, W.; Hou, S.; Tong, S.; Ge, M. Heterogeneous uptake of nitrogen dioxide on Chinese mineral dust. J. Environ. Sci. 2015, 38, 110–118. [Google Scholar] [CrossRef]
- Hou, Y.; Wang, L.; Zhou, Y.; Wang, S.; Liu, W.; Zhu, J. Analysis of the tropospheric column nitrogen dioxide over China based on satellite observations during 2008–2017. Atmos. Pollut. Res. 2018. [CrossRef]
- Cui, Y.; Zhang, W.; Bao, H.; Wang, C.; Cai, W.; Yu, J.; Streets, D.G. Spatiotemporal dynamics of nitrogen dioxide pollution and urban development: Satellite observations over China, 2005–2016. Resour. Conserv. Recycl. 2019, 142, 59–68. [Google Scholar] [CrossRef]
- Huang, Y.; Du, W.; Chen, Y.; Shen, G.; Su, S.; Lin, N.; Shen, H.; Zhu, D.; Yuan, C.; Duan, Y.; et al. Household air pollution and personal inhalation exposure to particles (TSP/PM2.5/PM1.0/PM0.25) in rural Shanxi, North China. Environ. Pollut. 2017, 231, 635–643. [Google Scholar] [CrossRef] [PubMed]
- Zhou, W.; Shen, M.; Lam, J.C.W.; Zhu, M.; Liu, L.; Chen, H.; Du, B.; Zeng, L.; Zeng, E.Y. Size-dependent distribution and inhalation exposure characteristics of particle-bound chlorinated paraffins in indoor air in Guangzhou, China. Environ. Int. 2018, 121, 675–682. [Google Scholar] [CrossRef] [PubMed]
- Xu, T.; Hou, J.; Cheng, J.; Zhang, R.; Yin, W.; Huang, C.; Zhu, X.; Chen, W.; Yuan, J. Estimated individual inhaled dose of fine particles and indicators of lung function: A pilot study among Chinese young adults. Environ. Pollut. 2018, 235, 505–513. [Google Scholar] [CrossRef] [PubMed]
- Li, H.; Li, J.; Li, H.; Yu, H.; Yang, L.; Chen, X.; Cai, Z. Seasonal variations and inhalation risk assessment of short-chain chlorinated paraffins in PM2.5 of Jinan, China. Environ. Pollut. 2019, 245, 325–330. [Google Scholar] [CrossRef] [PubMed]
- People’s Daily Online Research of the Chinese Academy of Engineering: The Harm of Air Pollution to the Human Body is Comparable to SARS. Available online: http://scitech.people.com.cn/n/2013/0813/c1007-22549139.html (accessed on 31 January 2019).
- Ministry of Environmental Protection of the People’s Republic of China. Air Quality Report on the 74 Key Monitored Cities in China, 2015–2018; China Environmental Science Press: Beijing, China, 2018.
- Ministry of Environmental Protection of the People’s Republic of China. Ambient Air Quality Standards: GB3095-2012; China Environmental Science Press: Beijing, China, 2012.
- Yuan, G.; Yang, W. Evaluating China’s Air Pollution Control Policy with Extended AQI Indicator System: Example of the Beijing-Tianjin-Hebei Region. Sustainability 2019, 11, 939. [Google Scholar] [CrossRef]
- Ministry of Environmental Protection of the People’s Republic of China. Technical Regulation on Ambient Air Quality Index (on trial): HJ 633-2012; China Environmental Science Press: Beijing, China, 2012.
- Guangdong Provincial Bureau of Statistics. Statistical Communique of the National Economic and Social Development of Guangdong, 2017; Guangdong People’s Publishing House: Guangzhou, China, 2018.
- National Bureau of Statistics of China. China Statistical Yearbook, 2016–2017; China Statistic Press: Beijing, China, 2018.
- China Environmental Monitoring Station. Air Quality Report for Cities in June 2018; China Environmental Publishing House: Beijing, China, 2018. [Google Scholar]
- Department of Environmental Protection of Guangdong Province. 2013 Report on the State of Guangdong Provincial Environment; Guangdong People’s Publishing House: Guangzhou, China, 2014.
- Lin, H.; Ratnapradipa, K.; Wang, X.; Zhang, Y.; Xu, Y.; Yao, Z.; Dong, G.; Liu, T.; Clark, J.; Dick, R.; et al. Hourly peak concentration measuring the PM2.5-mortality association: Results from six cities in the Pearl River Delta study. Atmos. Environ. 2017, 161, 27–33. [Google Scholar] [CrossRef]
- Yang, X.; Zheng, Y.; Geng, G.; Liu, H.; Man, H.; Lv, Z.; He, K.; de Hoogh, K. Development of PM2.5 and NO2 models in a LUR framework incorporating satellite remote sensing and air quality model data in Pearl River Delta region, China. Environ. Pollut. 2017, 226, 143–153. [Google Scholar] [CrossRef]
- Xu, Q.; Dong, Y.; Yang, R. Influence of the geographic proximity of city features on the spatial variation of urban carbon sinks: A case study on the Pearl River Delta. Environ. Pollut. 2018, 243, 354–363. [Google Scholar] [CrossRef]
- Liu, H.; Jin, X.; Wu, L.; Wang, X.; Fu, M.; Lv, Z.; Morawska, L.; Huang, F.; He, K. The impact of marine shipping and its DECA control on air quality in the Pearl River Delta, China. Sci. Total Environ. 2018, 625, 1476–1485. [Google Scholar] [CrossRef]
- Wang, S.; Wang, J.; Fang, C.; Li, S. Estimating the impacts of urban form on CO2 emission efficiency in the Pearl River Delta, China. Cities 2019, 85, 117–129. [Google Scholar] [CrossRef]
- Huang, Y.; Deng, T.; Li, Z.; Wang, N.; Yin, C.; Wang, S.; Fan, S. Numerical simulations for the sources apportionment and control strategies of PM2.5 over Pearl River Delta, China, part I: Inventory and PM2.5 sources apportionment. Sci. Total Environ. 2018, 634, 1631–1644. [Google Scholar] [CrossRef] [PubMed]
- Data Center of China’s Ministry of Ecology and Environment. Concentration of Main Pollutants in Cities of China, 2015–2018. Available online: http://datacenter.mep.gov.cn/websjzx/queryIndex.vm (accessed on 16 February 2019).
- Guangdong Provincial Department of Environmental Protection. Real-time Monitoring Information of Air Quality of Cities in Guangdong Province; Guangdong People’s Publishing House: Guangzhou, China, 2018.
- Zareie, A.; Sheikhahmadi, A.; Khamforoosh, K. Influence maximization in social networks based on TOPSIS. Expert Syst. Appl. 2018, 108, 96–107. [Google Scholar] [CrossRef]
- Chen, P. Effects of normalization on the entropy-based TOPSIS method. Expert Syst. Appl. 2019, 136, 33–41. [Google Scholar] [CrossRef]
- Salih, M.M.; Zaidan, B.B.; Zaidan, A.A.; Ahmed, M.A. Survey on fuzzy TOPSIS state-of-the-art between 2007 and 2017. Comput. Oper. Res. 2019, 104, 207–227. [Google Scholar] [CrossRef]
- Wang, T.C.; Lee, H. Da Developing a fuzzy TOPSIS approach based on subjective weights and objective weights. Expert Syst. Appl. 2009, 36, 8980–8985. [Google Scholar] [CrossRef]
- Lu, L.; Yuan, Y. A novel TOPSIS evaluation scheme for cloud service trustworthiness combining objective and subjective aspects. J. Syst. Softw. 2018, 143, 71–86. [Google Scholar] [CrossRef]
- Chauhan, R.; Singh, T.; Tiwari, A.; Patnaik, A.; Thakur, N.S. Hybrid entropy – TOPSIS approach for energy performance prioritization in a rectangular channel employing impinging air jets. Energy 2017, 134, 360–368. [Google Scholar] [CrossRef]
- Huang, W.; Shuai, B.; Sun, Y.; Wang, Y.; Antwi, E. Using entropy-TOPSIS method to evaluate urban rail transit system operation performance: The China case. Trans. Res. Part A Policy Pract. 2018, 111, 292–303. [Google Scholar] [CrossRef]
- Tang, H.; Shi, Y.; Dong, P. Public blockchain evaluation using entropy and TOPSIS. Expert Syst. Appl. 2019, 117, 204–210. [Google Scholar] [CrossRef]
- You, M.; Shu, C.; Chen, W.; Shyu, M. Analysis of cardinal grey relational grade and grey entropy on achievement of air pollution reduction by evaluating air quality trend in Japan. J. Clean. Prod. 2017, 142, 3883–3889. [Google Scholar] [CrossRef]
- Wu, Q.; Lin, H. Daily urban air quality index forecasting based on variational mode decomposition, sample entropy and LSTM neural network. Sustain. Cities Soc. 2019, 50, 101657. [Google Scholar] [CrossRef]
- China’s National Environmental Monitoring Center. The City Air Quality Publishing Platform. Available online: http://106.37.208.233:20035/ (accessed on 16 February 2019).
- Guangzhou Statistics Bureau. Statistical Communique of the National Economic and Social Development of Guangzhou in 2018; Guangdong People’s Publishing House: Guangzhou, China, 2019.
- Fang, X.; Fan, Q.; Liao, Z.; Xie, J.; Xu, X.; Fan, S. Spatial-temporal characteristics of the air quality in the Guangdong−Hong Kong−Macau Greater Bay Area of China during 2015–2017. Atmos. Environ. 2019, 210, 14–34. [Google Scholar] [CrossRef]
- Du, Z.; Lawrence, W.R.; Zhang, W.; Zhang, D.; Yu, S.; Hao, Y. Interactions between climate factors and air pollution on daily HFMD cases: A time series study in Guangdong, China. Sci. Total Environ. 2019, 656, 1358–1364. [Google Scholar] [CrossRef] [PubMed]
- Xinhua News Agency The Public Transport Vehicles in Shenzhen have Achieved Pure Electrification. Available online: http://www.gov.cn/xinwen/2017-12/28/content_5250968.htm (accessed on 30 June 2019).
- Yuan, G.; Yang, W. Study on optimization of economic dispatching of electric power system based on Hybrid Intelligent Algorithms (PSO and AFSA). Energy 2019, 183, 926–935. [Google Scholar] [CrossRef]
- Lu, X.; Fung, J.C.H. Source apportionment of sulfate and nitrate over the Pearl River Delta region in China. Atmosphere (Basel) 2016, 7, 98. [Google Scholar] [CrossRef]
- Lopes, D.; Ferreira, J.; Hoi, K.I.; Miranda, A.I.; Yuen, K.V.; Mok, K.M. Weather research and forecasting model simulations over the Pearl River Delta Region. Air Qual. Atmos. Health 2019, 12, 115–125. [Google Scholar] [CrossRef]
- Xie, J.; Liao, Z.; Fang, X.; Xu, X.; Wang, Y.; Zhang, Y.; Liu, J.; Fan, S.; Wang, B. The characteristics of hourly wind field and its impacts on air quality in the Pearl River Delta region during 2013–2017. Atmos. Res. 2019, 227, 112–124. [Google Scholar] [CrossRef]
- Kong, L.; Hu, M.; Tan, Q.; Feng, M.; Qu, Y.; An, J.; Zhang, Y.; Liu, X.; Cheng, N. Aerosol optical properties under different pollution levels in the Pearl River Delta (PRD) region of China. J. Environ. Sci. 2020, 87, 49–59. [Google Scholar] [CrossRef]
Figure 1.
The annual total energy consumption and total investment in environmental pollution control in China (2000–2017).
Figure 1.
The annual total energy consumption and total investment in environmental pollution control in China (2000–2017).

Figure 2.
Pearl River Delta in China.

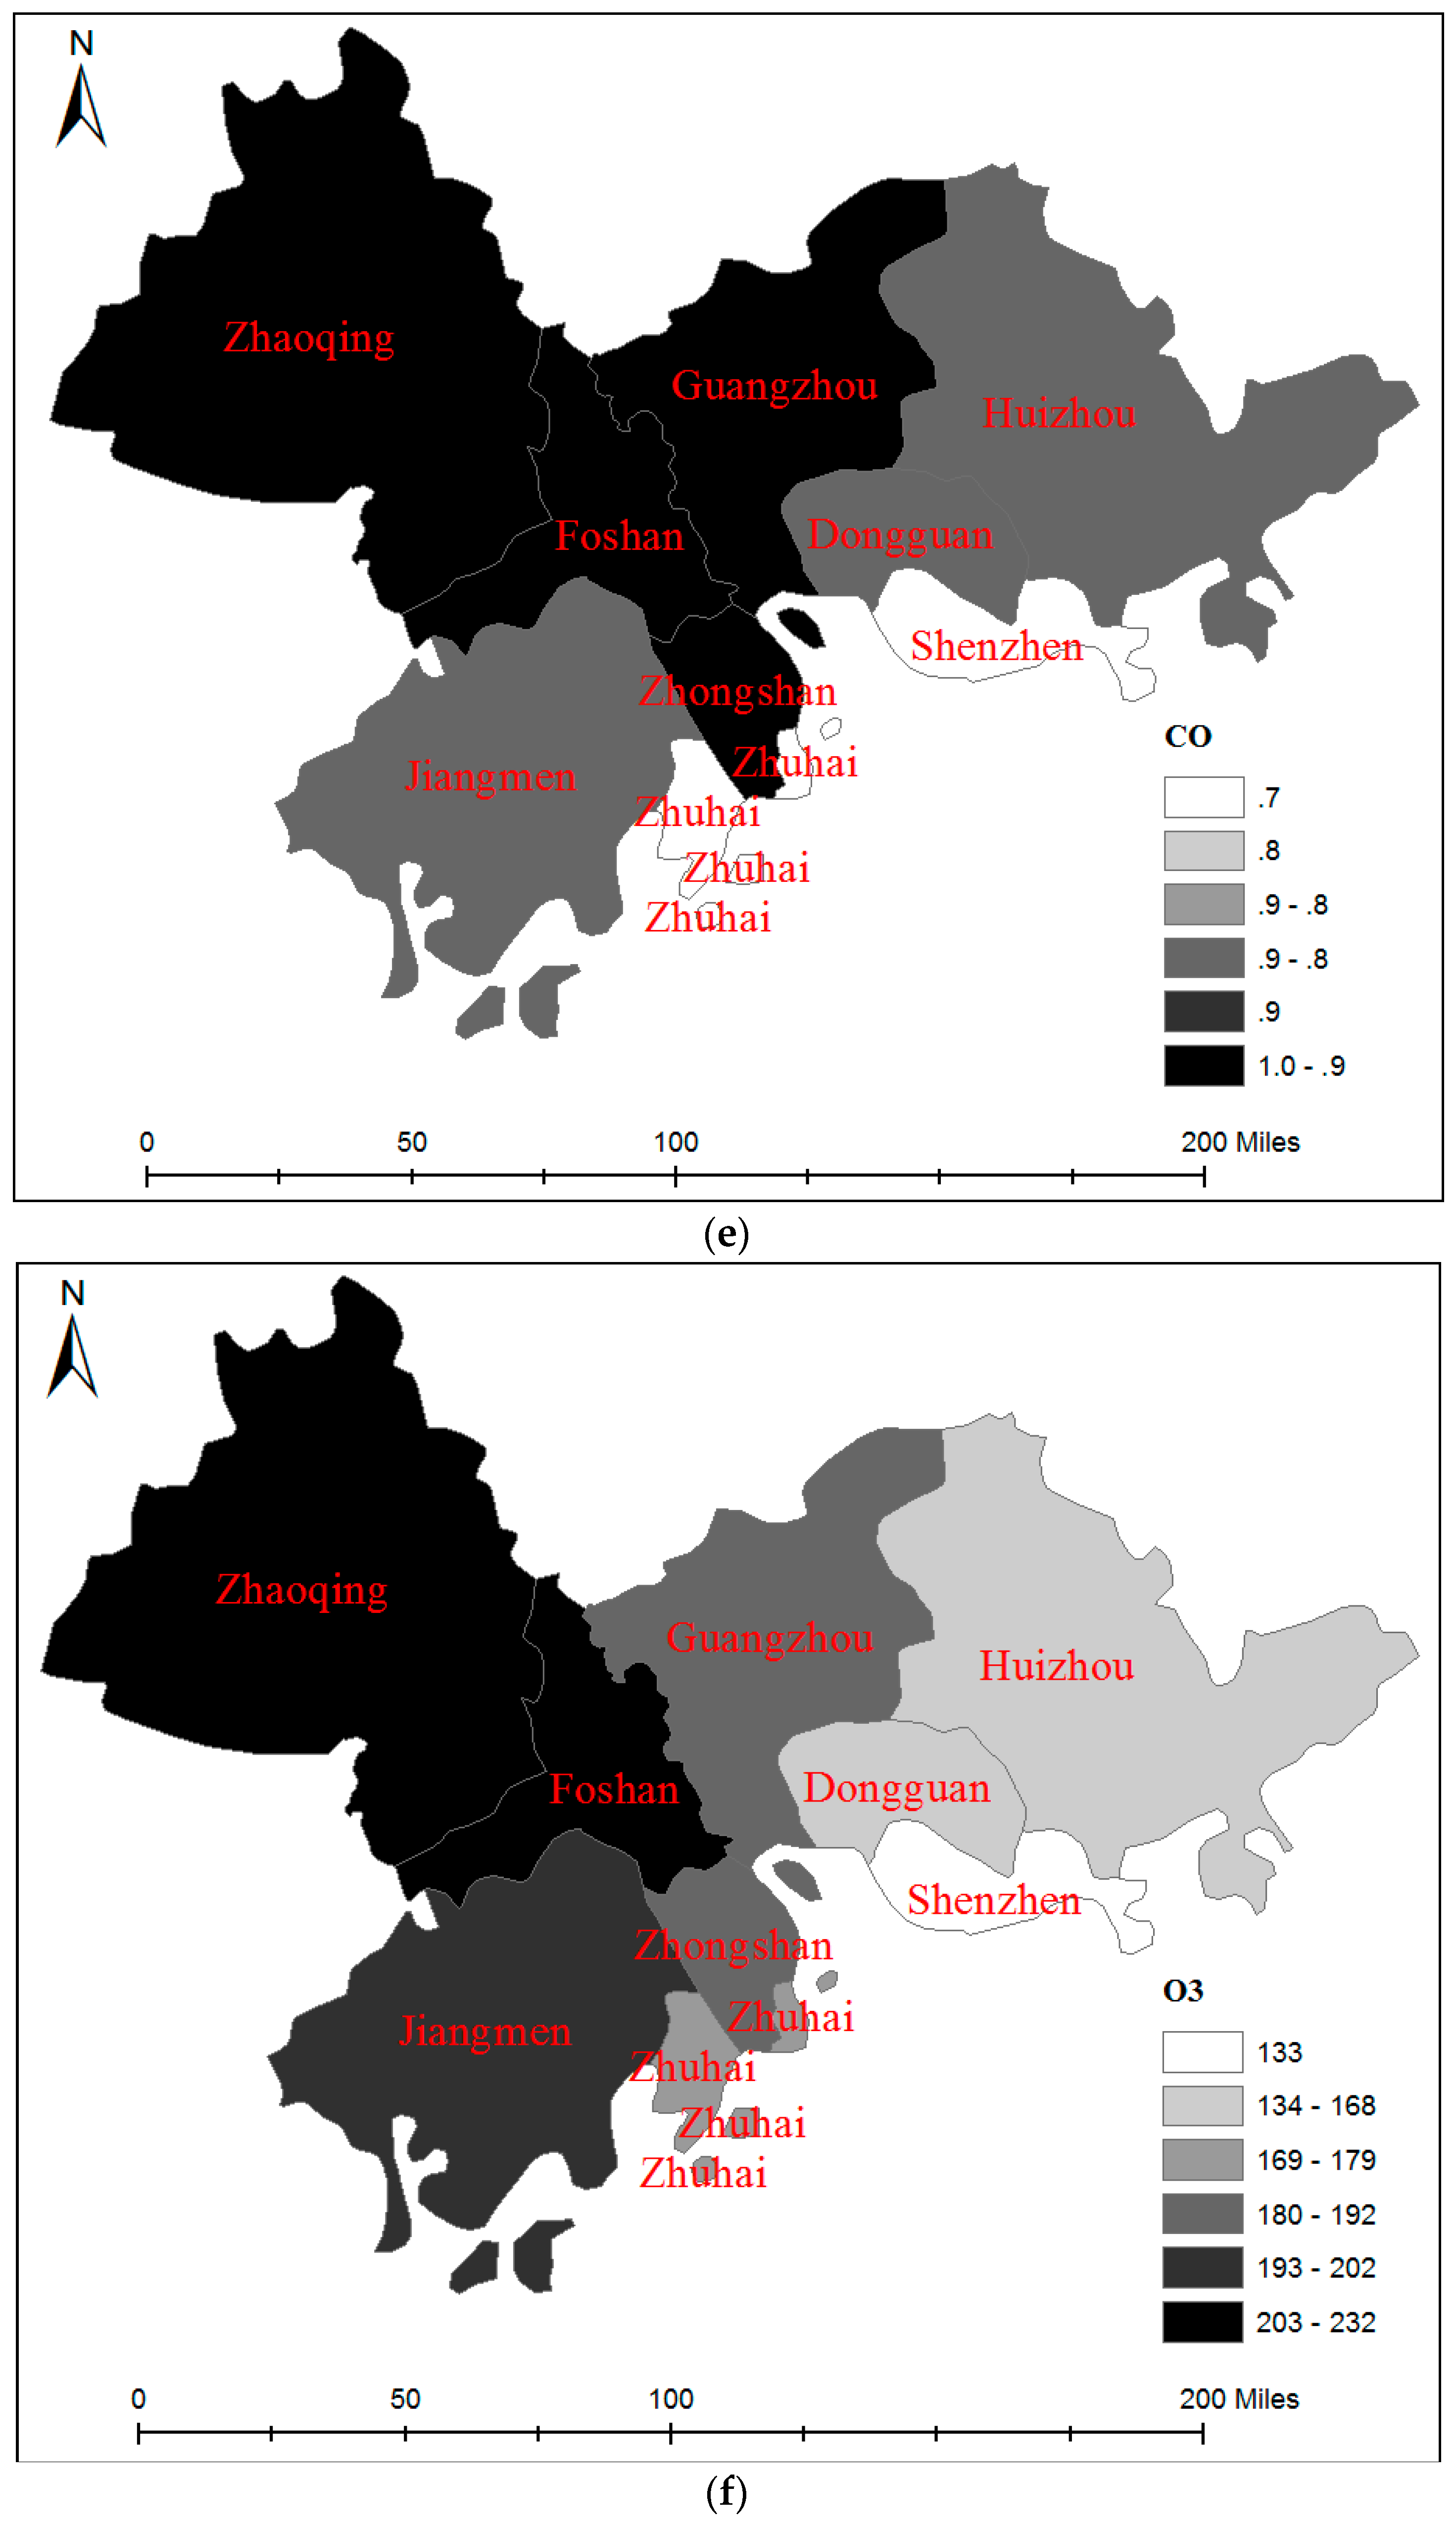
Figure 3.
Monthly average concentration of the six major pollutants in cities in the Pearl River Delta, June 2018: (a) PM2.5 (); (b) PM10 (); (c) SO2 (); (d) NO2 (); (e) CO (); (f) O3 () (The concentration value intervals in the above figures are all automatically generated by the system).
Figure 3.
Monthly average concentration of the six major pollutants in cities in the Pearl River Delta, June 2018: (a) PM2.5 (); (b) PM10 (); (c) SO2 (); (d) NO2 (); (e) CO (); (f) O3 () (The concentration value intervals in the above figures are all automatically generated by the system).


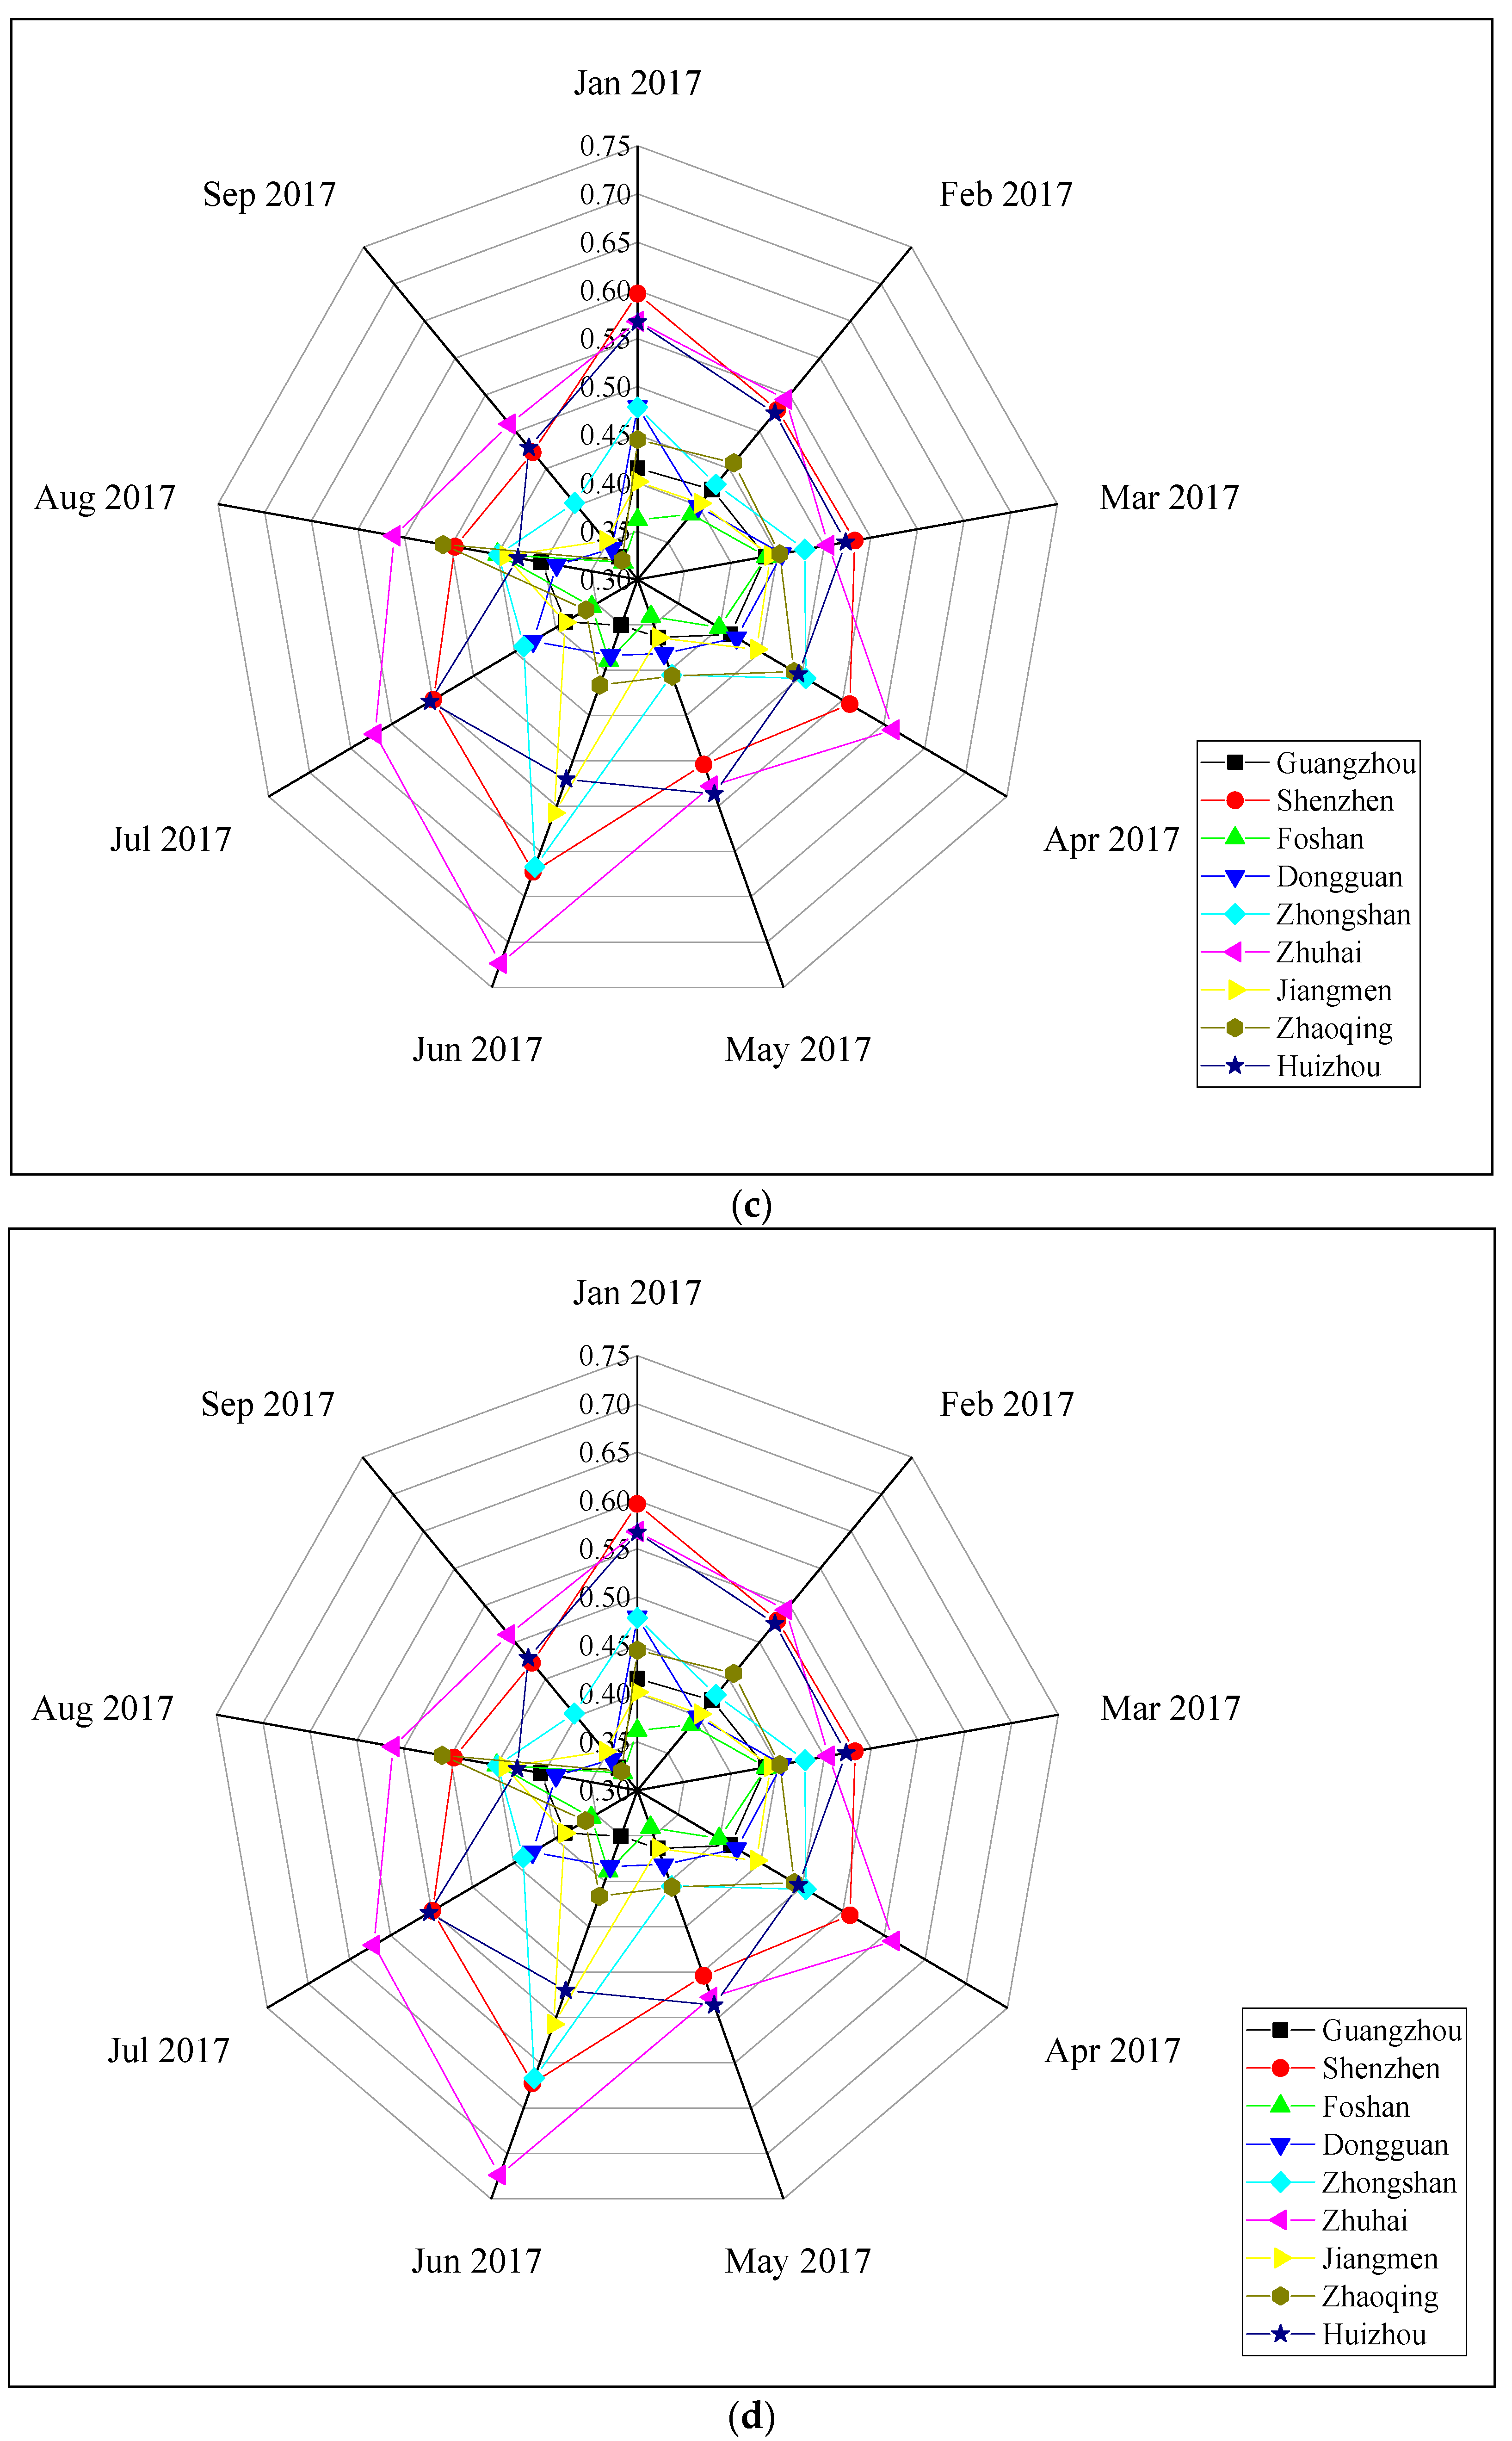
Figure 4.
Air quality evaluation scores of cities in the PRD region: (a) July 2015 to March 2016; (b) April 2016 to December 2016; (c) January 2017 to September 2017; (d) October 2017 to June 2018 (the range of scores is 0–1.).
Figure 4.
Air quality evaluation scores of cities in the PRD region: (a) July 2015 to March 2016; (b) April 2016 to December 2016; (c) January 2017 to September 2017; (d) October 2017 to June 2018 (the range of scores is 0–1.).


© 2019 by the authors. Licensee MDPI, Basel, Switzerland. This article is an open access article distributed under the terms and conditions of the Creative Commons Attribution (CC BY) license (http://creativecommons.org/licenses/by/4.0/).
Share and Cite
MDPI and ACS Style
Gao, H.; Yang, W.; Yang, Y.; Yuan, G. Analysis of the Air Quality and the Effect of Governance Policies in China’s Pearl River Delta, 2015–2018. Atmosphere 2019, 10, 412. https://0-doi-org.brum.beds.ac.uk/10.3390/atmos10070412
AMA Style
Gao H, Yang W, Yang Y, Yuan G. Analysis of the Air Quality and the Effect of Governance Policies in China’s Pearl River Delta, 2015–2018. Atmosphere. 2019; 10(7):412. https://0-doi-org.brum.beds.ac.uk/10.3390/atmos10070412
Chicago/Turabian StyleGao, Hao, Weixin Yang, Yunpeng Yang, and Guanghui Yuan. 2019. "Analysis of the Air Quality and the Effect of Governance Policies in China’s Pearl River Delta, 2015–2018" Atmosphere 10, no. 7: 412. https://0-doi-org.brum.beds.ac.uk/10.3390/atmos10070412
Note that from the first issue of 2016, this journal uses article numbers instead of page numbers. See further details here.