Modelling the Technical–Economic Relevance of the ETICS Construction Process

1
Institute of Civil Engineering, Technical University of Berlin, 10623 Berlin, Germany
2
Department of Civil Engineering and Architecture, Tallinn University of Technology, 19068 Tallinn, Estonia
Buildings 2018, 8(11), 155; https://0-doi-org.brum.beds.ac.uk/10.3390/buildings8110155
Submission received: 13 October 2018
/
Revised: 2 November 2018
/
Accepted: 3 November 2018
/
Published: 9 November 2018
Abstract
:The increased number of energy efficiency requirements of the European Union has increased the renovation rate of apartment buildings. The external thermal insulation composite system (ETICS) is often used to upgrade the façade. However, the construction process shortcomings very often cause defects shortly after completion. This paper develops a technical–economic relevance assessment model of the onsite degradation factors for better quality assurance in an SME. The model quantifies the technical significance of the degradation factors along with the future repair costs. The technical severity of 103 factors is evaluated by 12 experts, and the data is validated with the Friedman’s test. The occurrence ratio, detectability, and latency period are foreseen by five experts and validated with the Delphi technique. The results of the three sample simulations emphasize the activities during substrate preparation and application of adhesive as well as a base coat with reinforcement mesh. The application of a finishing coat and installation of insulation plates have less relevance. It is recommended to upskill the craftsmen in regard to working with mixtures as the shortcomings are covered simultaneously and the failure detection period is short. The measures to protect against external weather effects are recommended due to their relatively high impact. Half of the shortcomings appear during the first two years.
1. Introduction
Reducing the energy consumption of the built environment is a topic that has been tackled by the European Commission in recent decades [1,2]. The increased number of energy efficiency requirements has increased the refurbishment rate of apartment buildings covered with an external thermal insulation composite system (ETICS) [3,4]. In Germany, Institut für Bauforschung [5] investigated the dwellings which did not achieve the expected energy efficiency expectations after refurbishment. The study found that the construction process activities are responsible for 66% of the cases of failure. Neumann [6], on the other hand, assumes that three-quarters of the failures due to on-site construction activities are avoidable. Defects caused during the construction process affect the performance of the system and incur financial consequences. As there are many requirements to be followed during the construction process, it is rational to focus on the activities which occur most often, are harder to detect, are technically more relevant, and will cause high repair costs in the future.
The results of the studies on technical [7] and economic relevance will be presented separately. The results of these individual studies have diverse recommendations due to the different components involved in the evaluation models. A single united model is essential to combine the perspectives and provide recommendations to the industry. This paper develops a common technical–economic relevance (TER) model which enables the onsite construction process activities of ETICS to be prioritized, taking into account a combination of aspects. The systematized framework quantifies and merges the qualitative technical experience of experts and time-dependent economic data.
The onsite activities of ETICS influence the deterioration in each stage of the application process. As each layer of the system has a different technical purpose, the significance to the system’s performance is diverse. Regulation No. 305/2011 (Construction Products Regulation) [8] of the European Parliament and the European Council has set the general guidelines for building products, while the façade system-specific guidelines are presented in the European Technical Approval Guidelines for External Thermal Insulation Composite Systems with Rendering (ETAG 004) [9]. The documents describe the essential requirements that construction products and buildings need to meet during their economically reasonable working life. Much research in the field of ETICS observes the quality aspects in isolation, making a rational relevance comparison impossible. The case studies of deteriorations have been diagnosed in several books [6,10,11], as well as studied in the controlled environment laboratory [12,13,14]. These and many other studies reveal a number of possible causes which should be compared to a single system.
Skitmore and Marston [15] and Woodward [16] have argued that construction quality is correlated to its cost. The elimination of inadequacies during the construction process takes fewer resources and less effort in comparison to future repair activities. The developed economic relevance model developed in another research paper, based on the method of failure mode effects analysis (FMEA), evaluates the onsite inadequacies while considering their repair costs, occurrence probability, and detectability during the application process. The approach differs from the traditional FMEA model, as economic severity replaces technical severity. A similar approach has been used by Shafiee et al. [17], Rhee and Ishii [18], and Carmignani [19] to highlight the financial impact of the failures. The need to include other relevant components of the traditional risk assessment model is emphasized by Bowles [20]. He argues that the economic aspect is underrated and should be considered during decision-making. The FMEA model has been criticized due to the multiplication of variables on the equal scale by Pillay [21], Bowles [20], and Carmignani [19]. The main criticism concerns the need for weighting factors in the calculation, as detectability and occurrence are not as relevant and their impact should be reduced. Carmignani [19] and Bowles [20] additionally point out the inaccuracy of predicted future costs. It can be acquiesced that the costs may change due to economic and political as well as technological alterations. However, the developed method enables reapplication as relevant alterations occur.
This paper combines the four factors (technical severity, financial impact, occurrence, and detectability) into a merged assessment model. The interpretation of the results enables the quality to be improved through resource allocation during the construction process as the focus is set on highly relevant activities. This paper describes the framework of the model and the interaction of variables, as well as a selection of degradation factors for the simulations. The received weighted technical severity value (SV) and the economic risk priority number (ERPN) are visualized on a two-dimensional risk matrix to set the priorities of on-site activities. The model is tested on three simulations and the results are discussed.
Scope and Limitations
Construction products are rapidly improving as new construction technology emerges. The model is developed with the aim to quantify the relevance of onsite shortcomings of ETICS of existing dwellings. Therefore, the data collected for the simulation model concerns systems with the following characteristics:
- the subject is an existing multiapartment building;
- external walls are made out of masonry or prefabricated concrete panels;
- the fixing method is either purely bonded with adhesive or mechanically fixed with anchors and supplementary adhesive;
- reinforcement consists of base coat and fiberglass mesh;
- the thermal insulation product is made out of mineral wool or expanded polystyrene with a thickness from 150 mm to 250 mm;
- the study concerns the region of Estonia, which lies in zone Dfb (warm summer, fully humid, snow climate) according to the Köppen–Geiger map.
The simulations in this study concern three different project-based cost scenarios with the characteristics shown in Table 1.
2. Materials and Methods
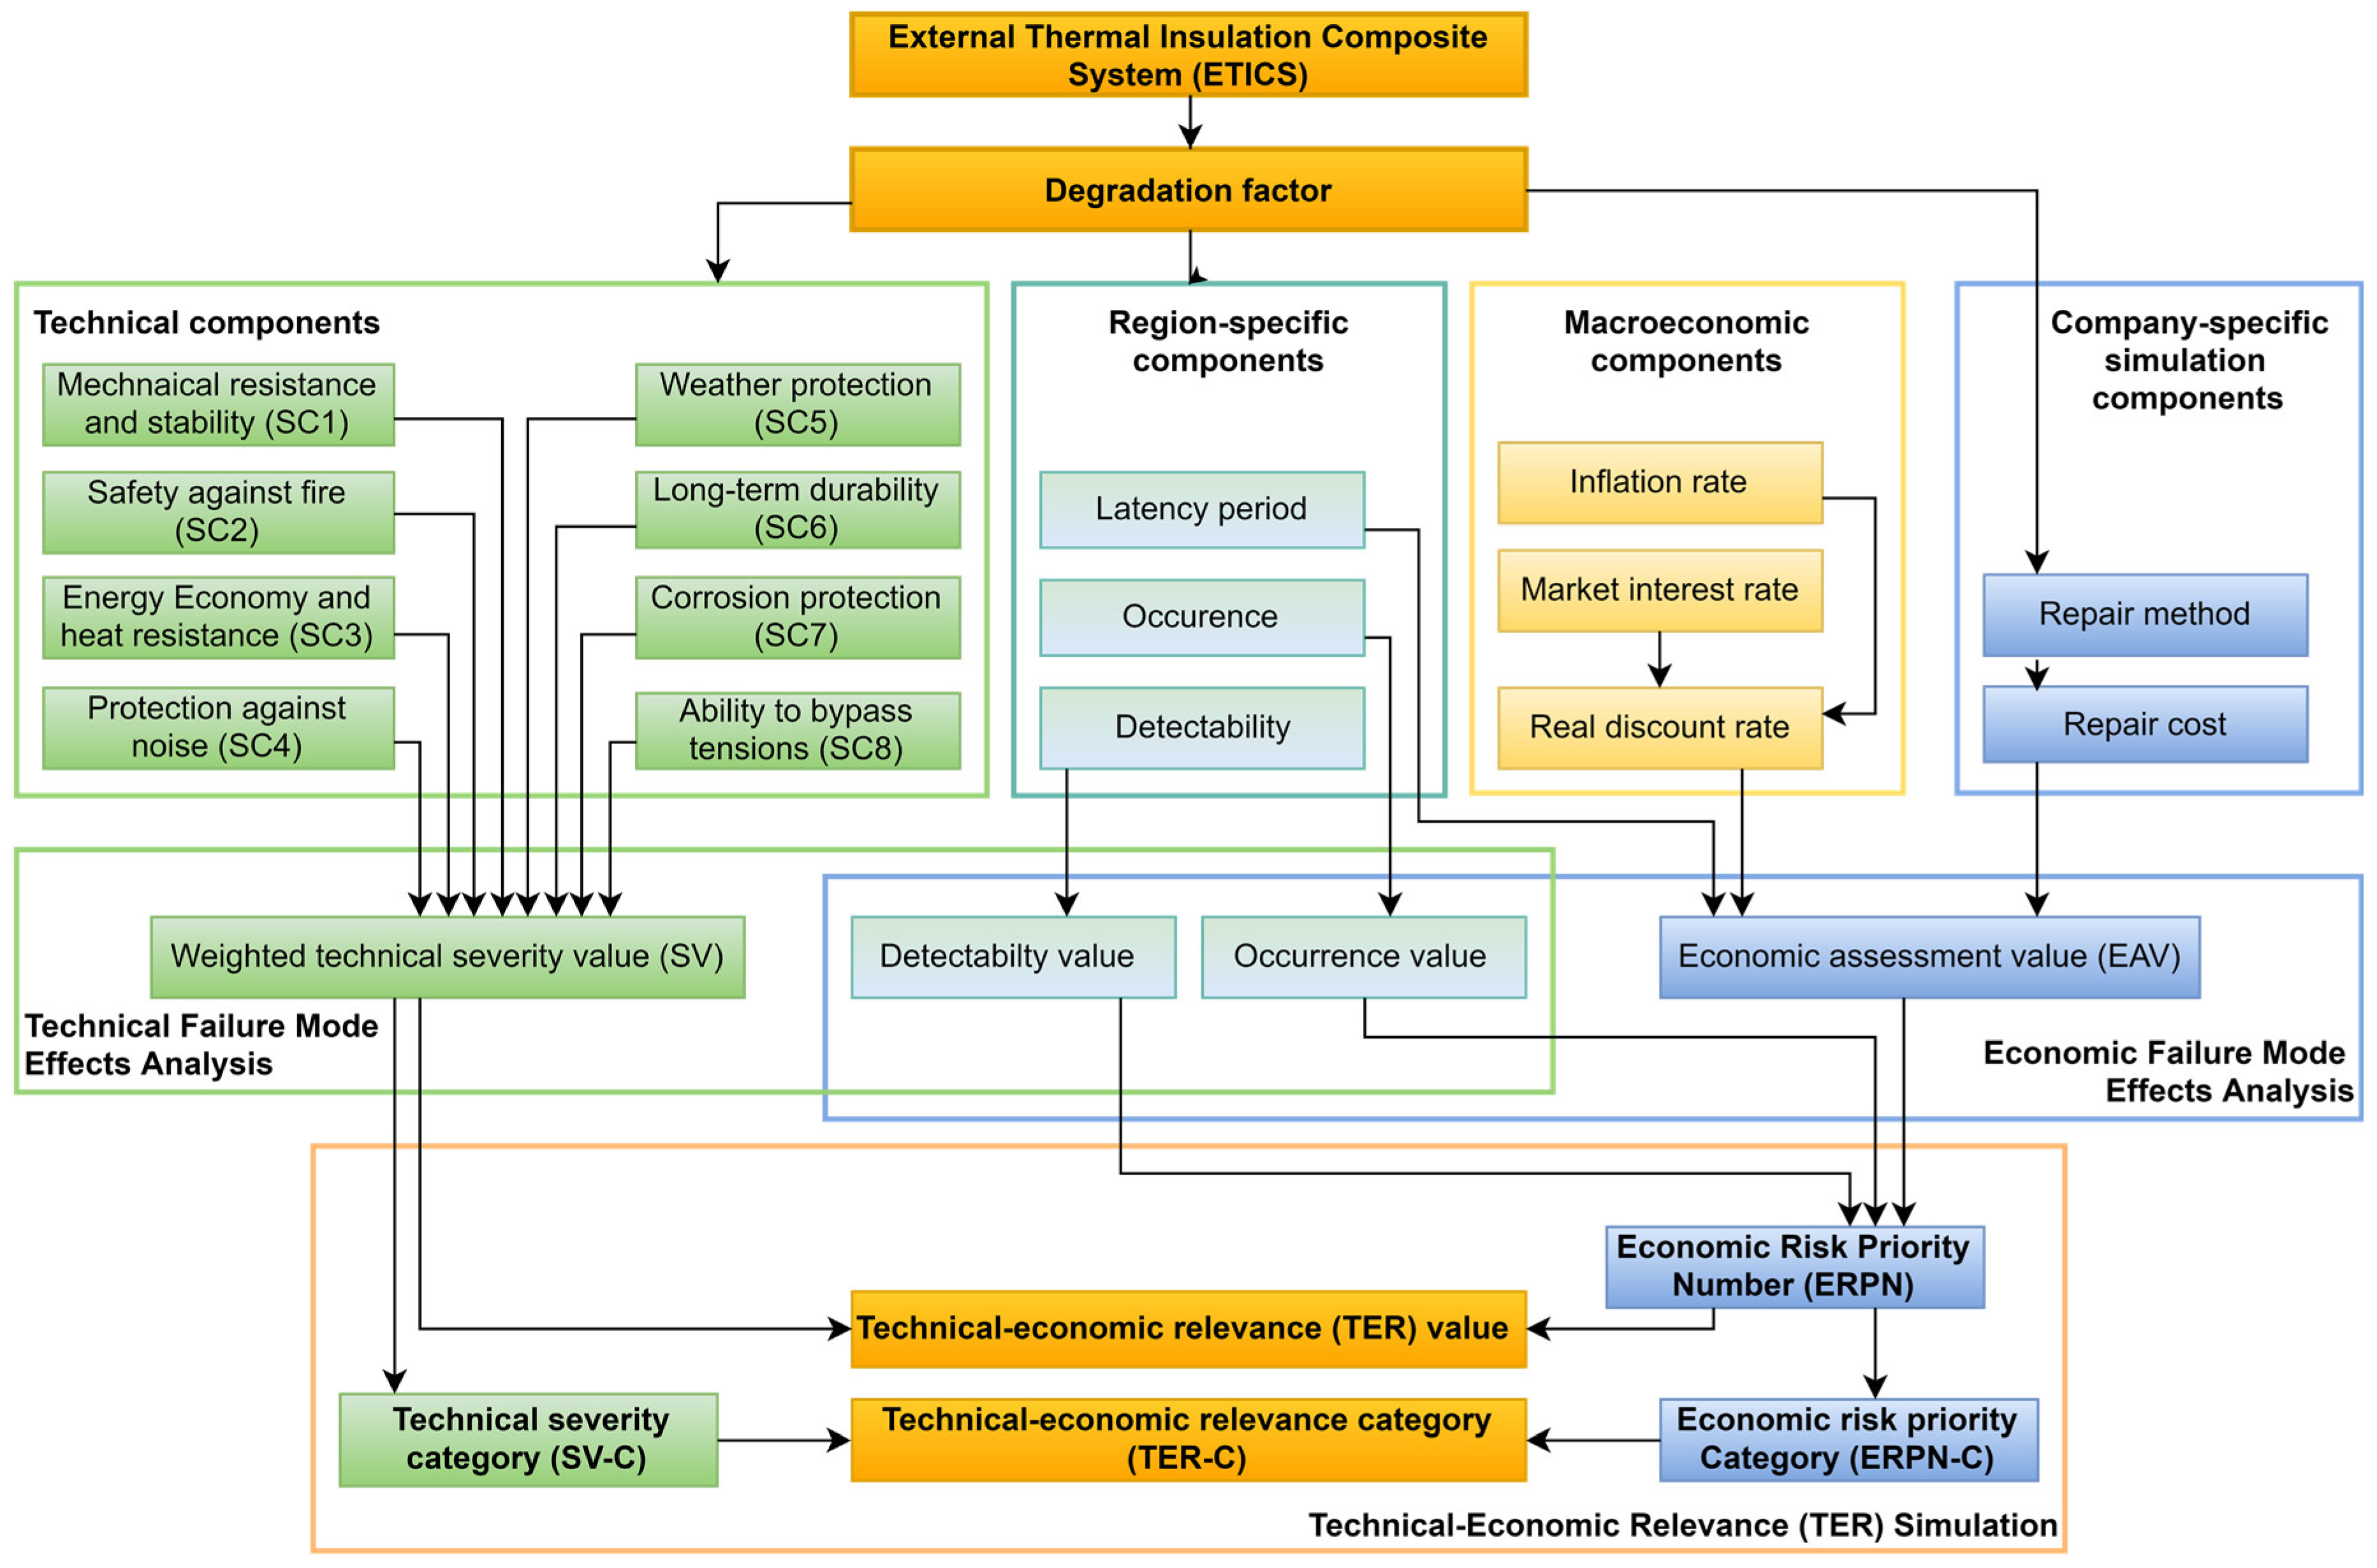
The technical–economic relevance (TER) model of ETICS is a complex system, which quantifies the technical severity as well as the future costs incurred by the shortcomings and considers the occurrence possibility along with detectability during the construction works. The framework of the model (Figure 1) visualizes the simplified interaction of the components included in the model, while the research design (Figure 2) visualizes the process of the model. This paper represents a further development in the research on technical severity [7] and economic risk assessment and approaches both aspects in a unified TER model.
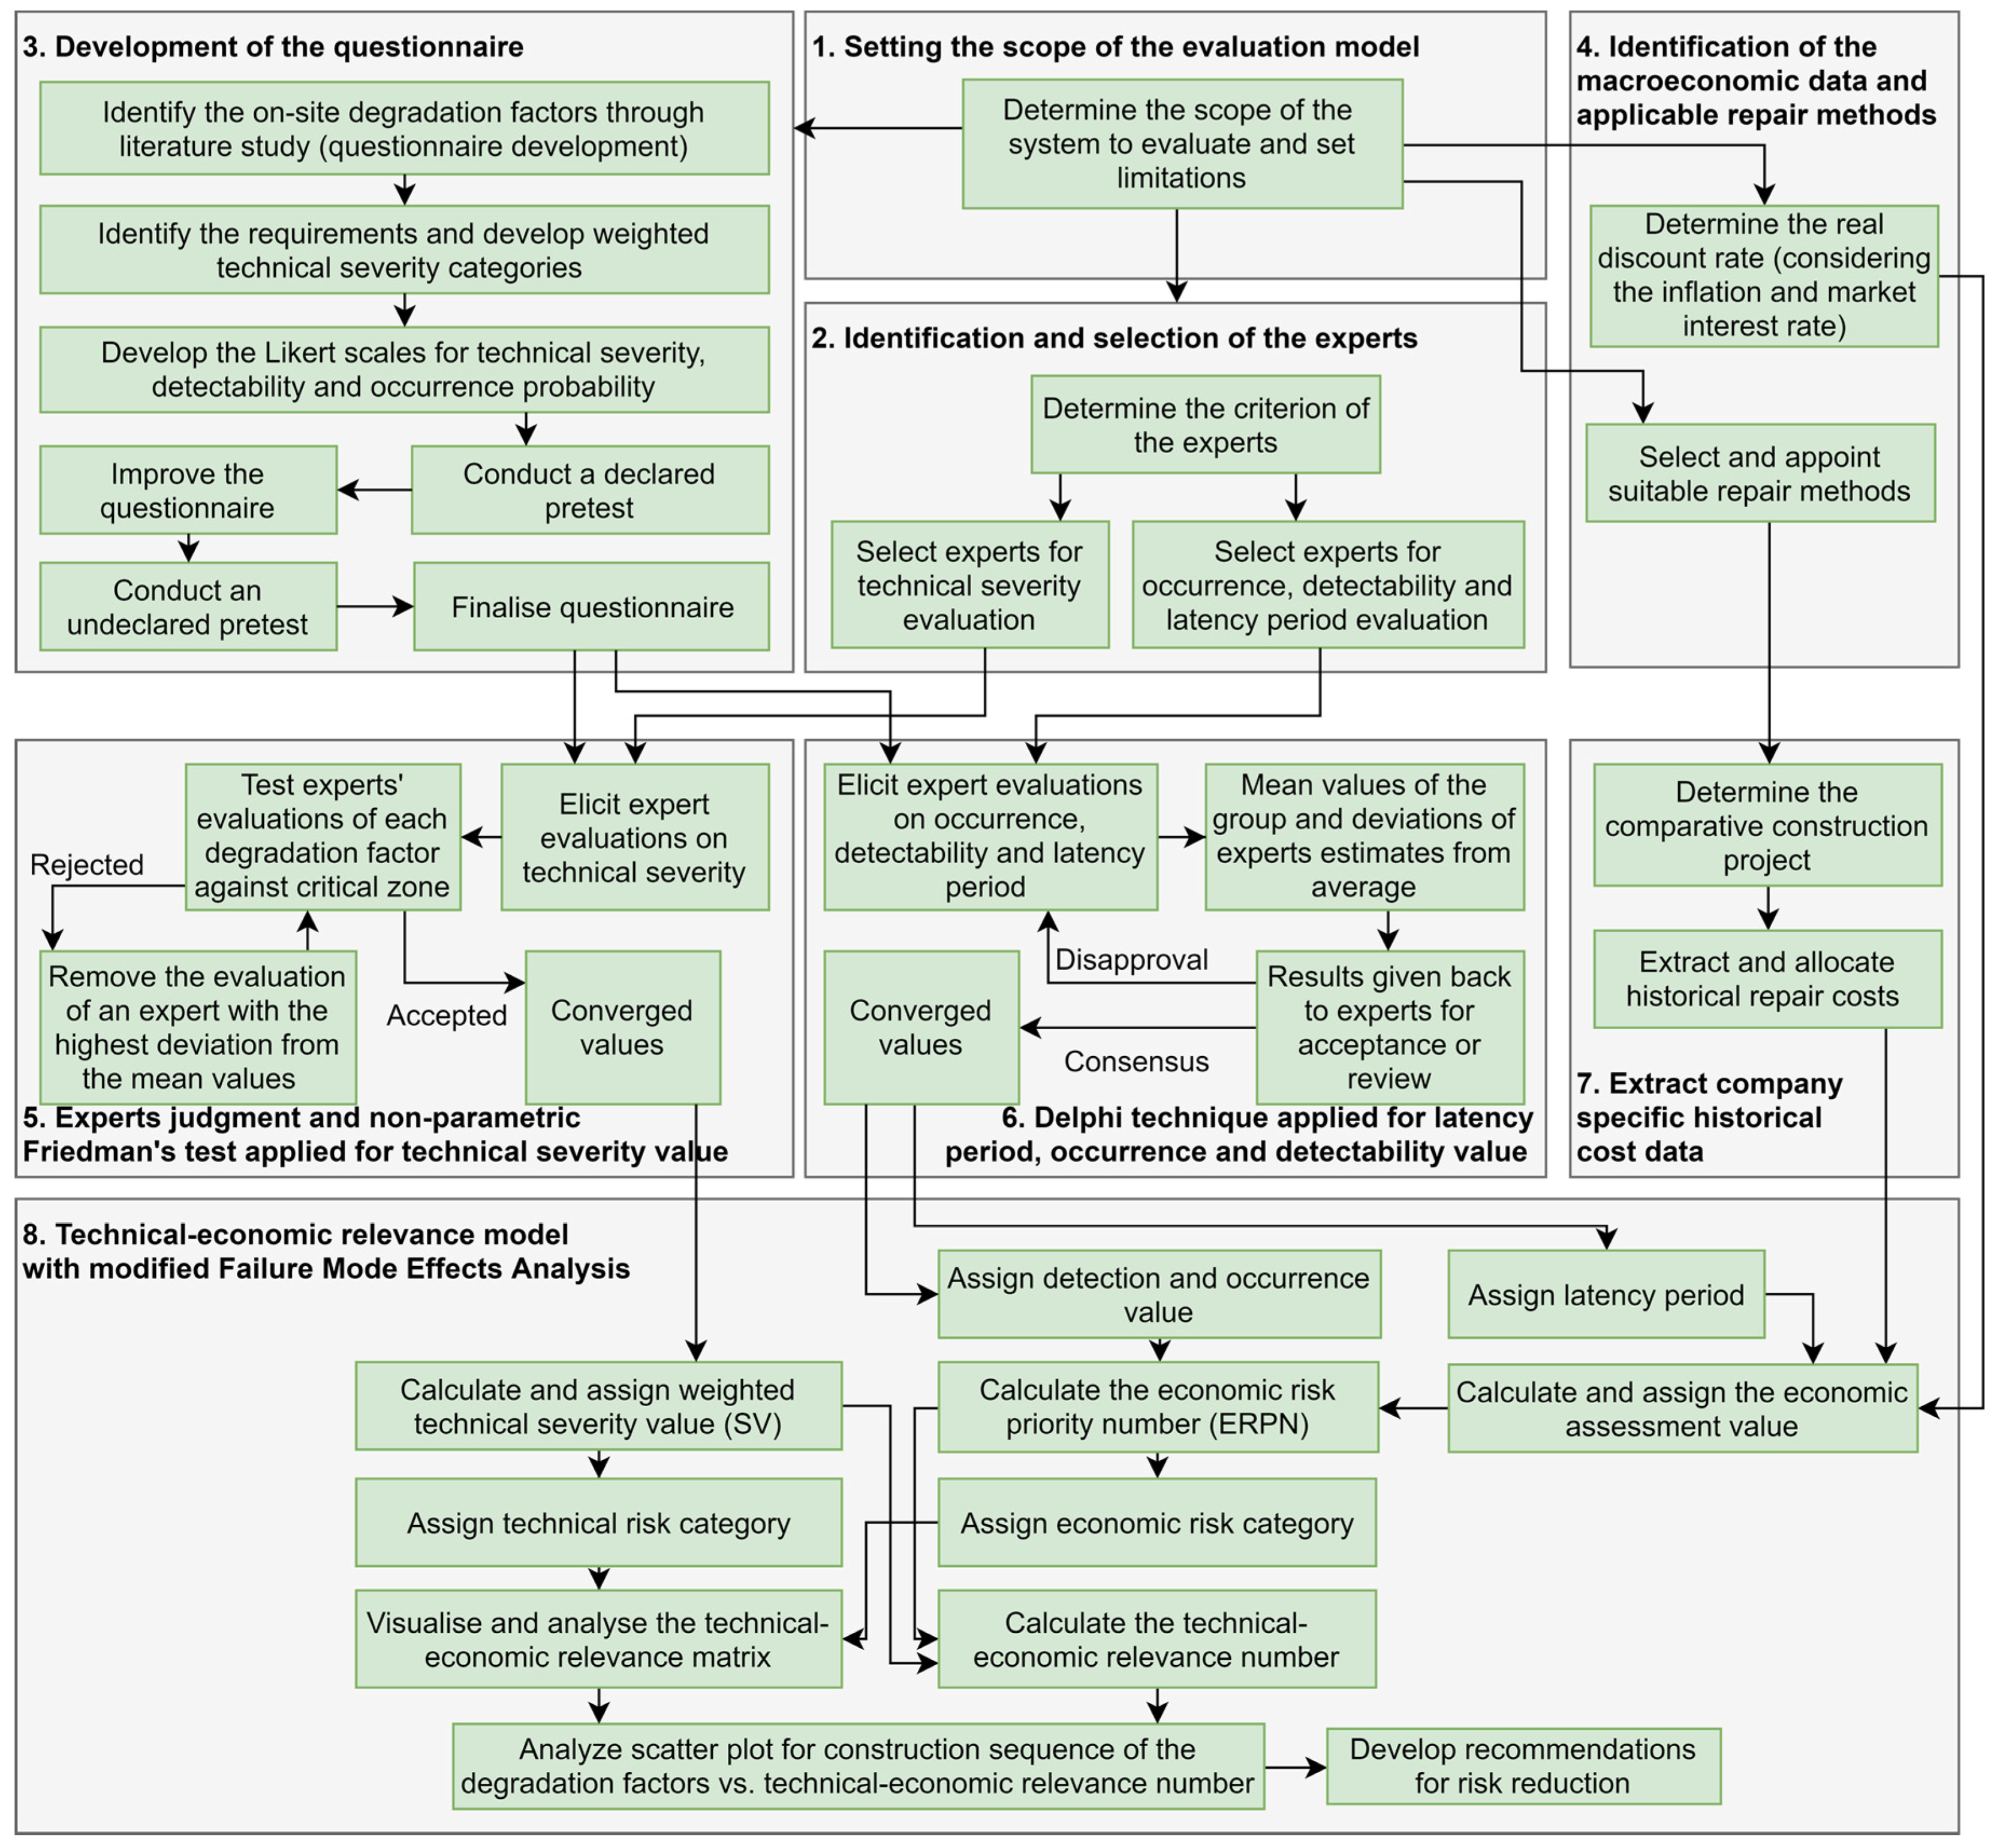
The research design is divided into eight phases, which are marked as grey areas in Figure 2. The model can be followed by individual companies to calculate firm-specific risks in the context of economic changes, seasonal influences, and other macroeconomic aspects.
Firstly, the scope of the system as well as specific limitations are to be set (phase 1). Then, the degradation factors are to be selected and described as a questionnaire (phase 2). This is followed by the selection of the experts (phase 3). To consider the economic aspects, the macroeconomic data needs to be extracted to discount the future costs and to specify the repair method (phase 4). The data collection and analysis is divided into two evaluations due to the difference in the nature of the data. The evaluation of technical aspects requires in-depth knowledge and understanding of the façade system (phase 5). The occurrence ratio, detectability, and latency period of the shortcoming is more region-, company-, and craftsmen-specific and concerns the forecasting as well as practical observations (phase 6). Historical cost data is company-specific and is extracted from similar construction projects described in the system’s scope (phase 7). As all the data has been acquired (phase 8), the SV and ERPN position each degradation factor into a risk category and their TER value is calculated for ranking. This enables analysis of the results and the development of recommendations.
The subchapter of the research methods provides an overview of the methodology for the selection of degradation factors (Section 2.1) and experts as well as the construction company for historical data extraction (Section 2.2). The concepts concerning the SV are discussed in Section 2.3. The region-specific data (probability of the occurrence, detectability, and latency period) is discussed in Section 2.4, and the calculation of the ERPN is provided in Section 2.5. The final section presents the aggregation of all of the components as well as the categorization of the risk.
2.1. Onsite Degradation Factors of ETICS
The general requirements for ETICS are set by the European Technical Approval Guidance ETAG 004 [9] and are applicable for the material producers. Based on these requirements, the material producer provides installation guidelines and limitations according to their system specifications. These documents describe the set of requirements that the onsite activities must meet. During the onsite construction process, there are specific activities which are needed to achieve the finished end product. The list of degradation factors was developed through two stages—literature study and verification by two experts.
The list of shortcomings was formulated from descriptive instructions, recommendations, harmonized standards and set requirements [9,22,23,24,25,26], research regarding simulations or material studies conducted in laboratory conditions [12,13,14,27,28,29,30,31,32,33,34,35,36,37,38,39,40,41,42,43,44,45,46,47,48,49,50,51], field research [3,4,5,34,52,53,54,55,56,57,58,59,60,61,62,63,64], and books on the topic [6,10,11]. The selected factors were verified by two experts, who had more than 12 years’ experience with ETICS. The reviews were conducted individually and independently, while the results of other evaluations were not revealed. One expert who verified the list was located in Germany and had a doctoral degree, while the second was located in Estonia and had a master’s degree in the field of construction. Eleven irrelevant factors were removed from the further analysis, and the wording of 16 shortcomings was rephrased to reduce the illegibility and the suitability of the systems checked. The final list of selected degradation factors is presented in Appendix A.
2.2. Identification and Selection of the Experts and Characteristics of the Construction Company
There is no quantified data available on the research subject. Therefore, the expert’s judgement was used in this study to collect subjective data. The selection of experts plays an essential role in the quality of the data [65]. The criteria for the selection of the experts were their in-depth knowledge and understanding of technical considerations of ETICS as well as practical onsite experience. According to Olson [66], variations across reviewers’ backgrounds are allowed. In his study in the construction industry, Hallowell et al. [67] suggested that the identification of experts could be conducted through the membership of a nationally recognized committee or by the participation of similar studies. The expert should meet at least four of the following requirements:
- At least five years of professional experience in the construction industry;
- Tertiary education degree in the field of civil engineering or other related fields;
- Professional registration in the field of construction;
- Member or chair of a nationally recognized committee for ETICS;
- Writer or editor of a book or book chapter on the topic;
- A faculty member at an accredited institution of higher learning;
- Invited to present at a conference on the topic;
- The primary or secondary writer of at least three peer-reviewed journal articles.
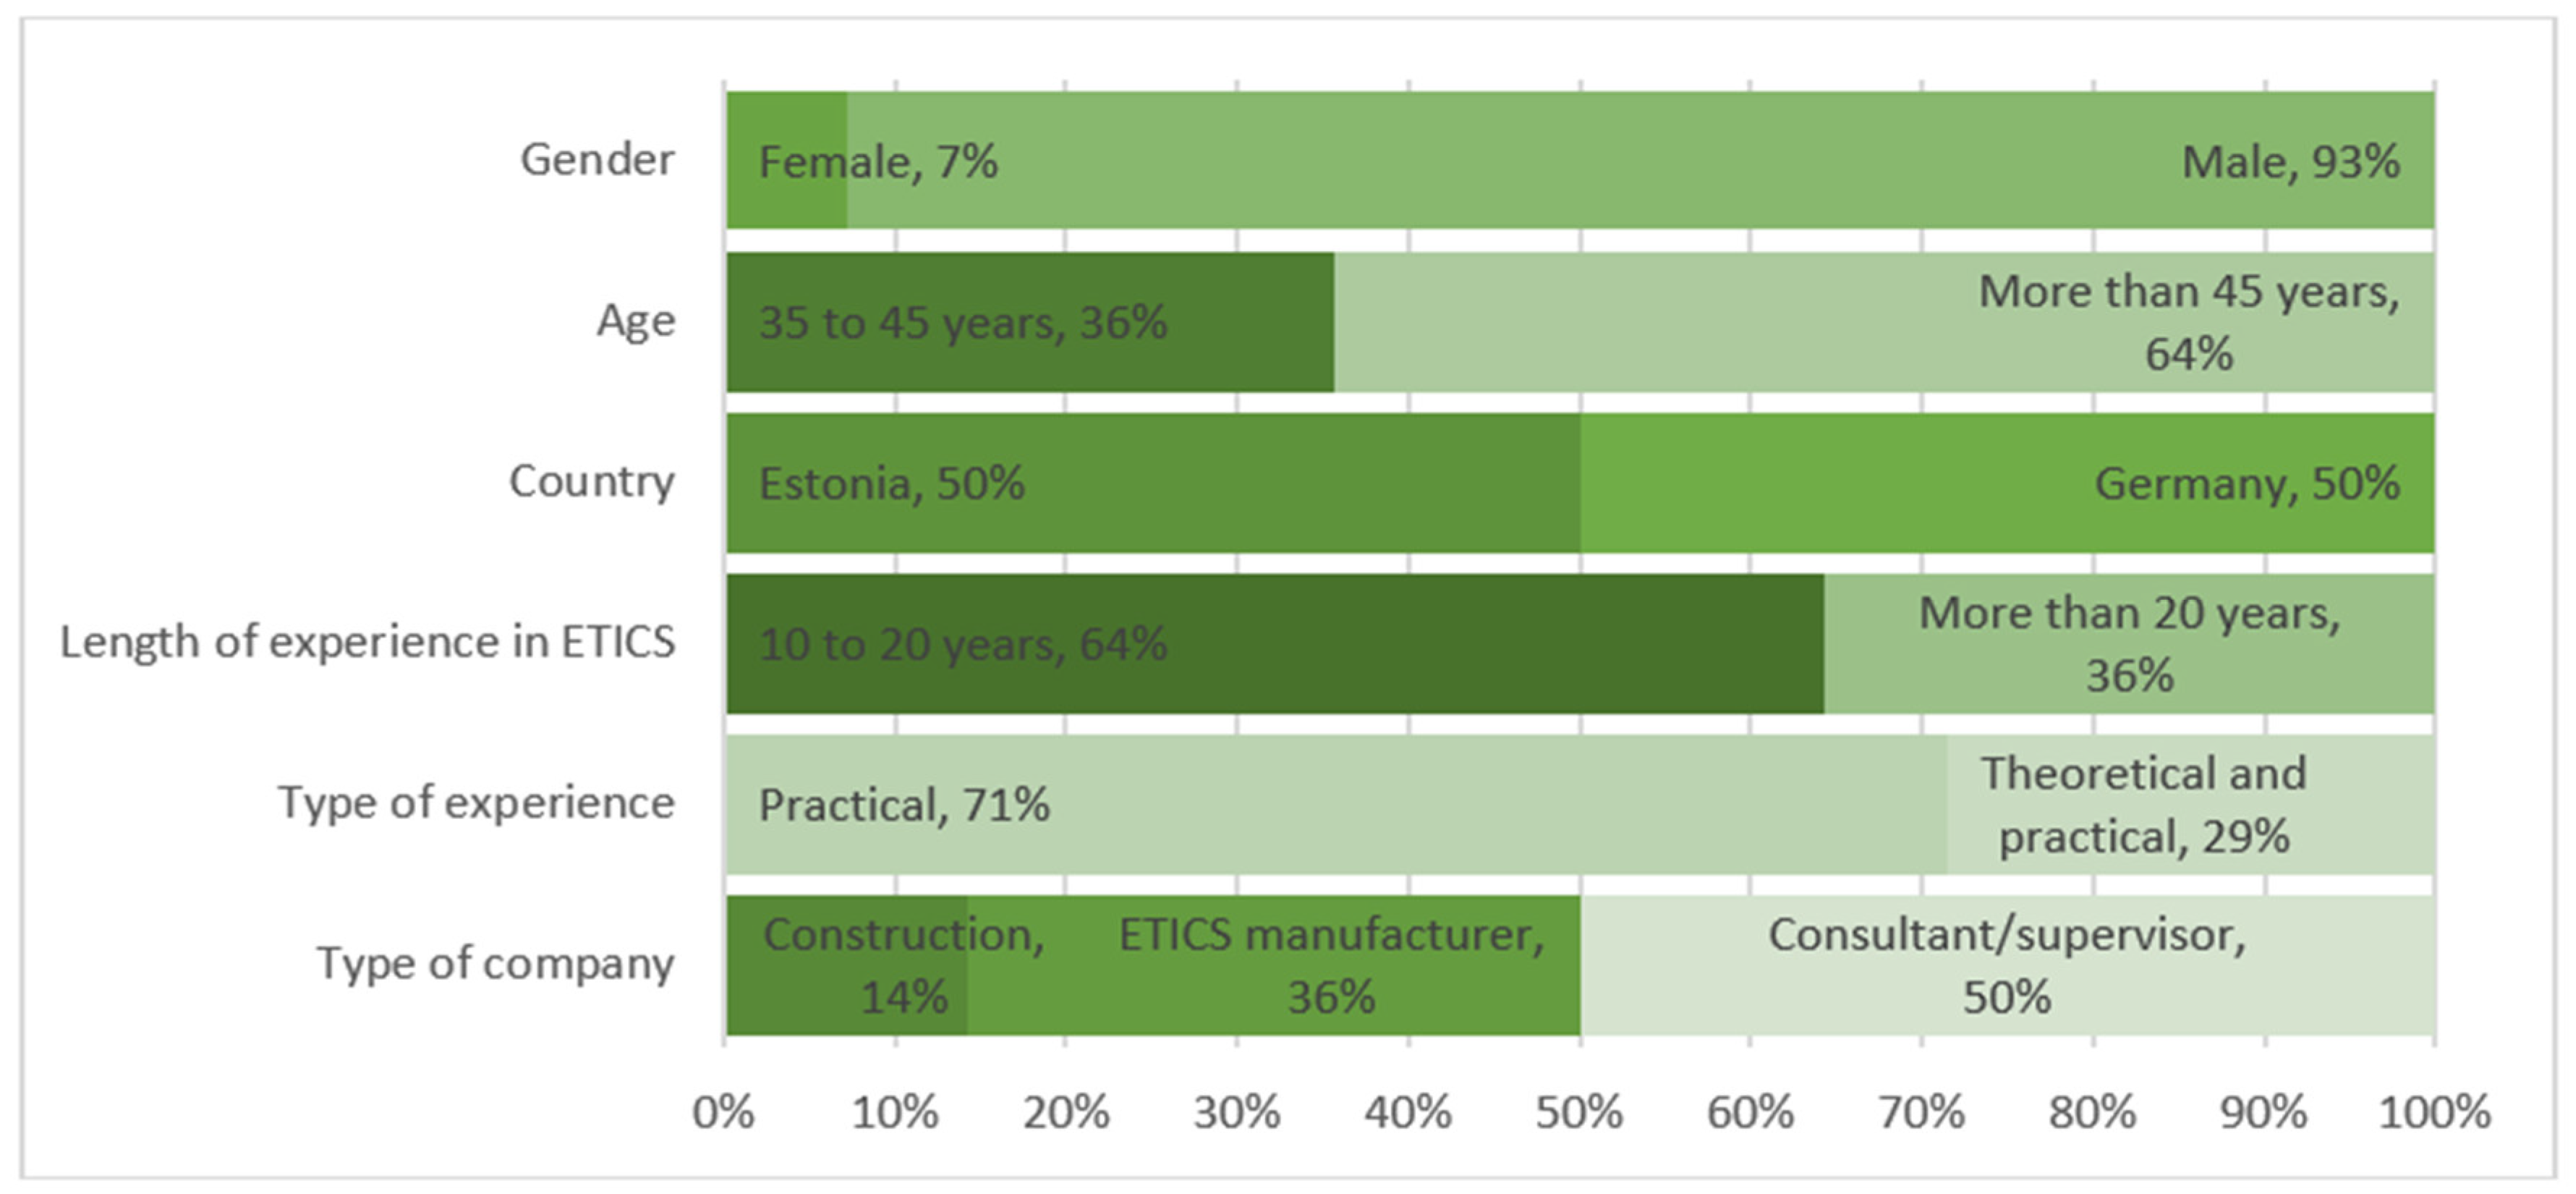
As the model is developed for usage in small and medium enterprises (SME), it is expected that the number of experts will remain small. The most suitable number of panellists has not been determined in the literature. The size of the group depends on the availability of the experts, available resources and research topic [68]. In other research in the construction industry, a small number of experts is used in various studies. Studies have included 3 to 93 panellists in the construction industry [68]. Hallowell et al. [67] proposed a panel size of between 8 and 12 experts, while Rowe et al. [69] suggested including 5 or more experts on the panel and pointed out that there are “no clear distinctions in panel accuracy” when the panel size varies from 5 to 11 experts. Hence, for the user of the model, it is suggested to include at least 5 experts. Figure 3 visualizes the demographics of the experts involved in this study.
For the simulations of the model, the historical cost data of a construction company was used. The construction company is located in Estonia and had specialized in façade construction for more than 15 years by the time the data was collected. The estimator who provided the data has more than 15 years’ experience in the field of ETICS and has had tertiary education. For the user of the model, it is recommended to use company-specific cost data and extract the costs from recent construction projects.
2.3. Weighted Technical Severity Value
For the building products used in the European Union, the general international technical requirement is set by the Regulation (EU) No 305/2011 [8] (also Construction Products Regulation or CPR), which is the basis for the ETICS-specific guideline ETAG 004 [9]. The Construction Products Regulation presumes that buildings and construction products meet the performance requirements during their economically reasonable working life and describes seven essential requirements for the construction products.
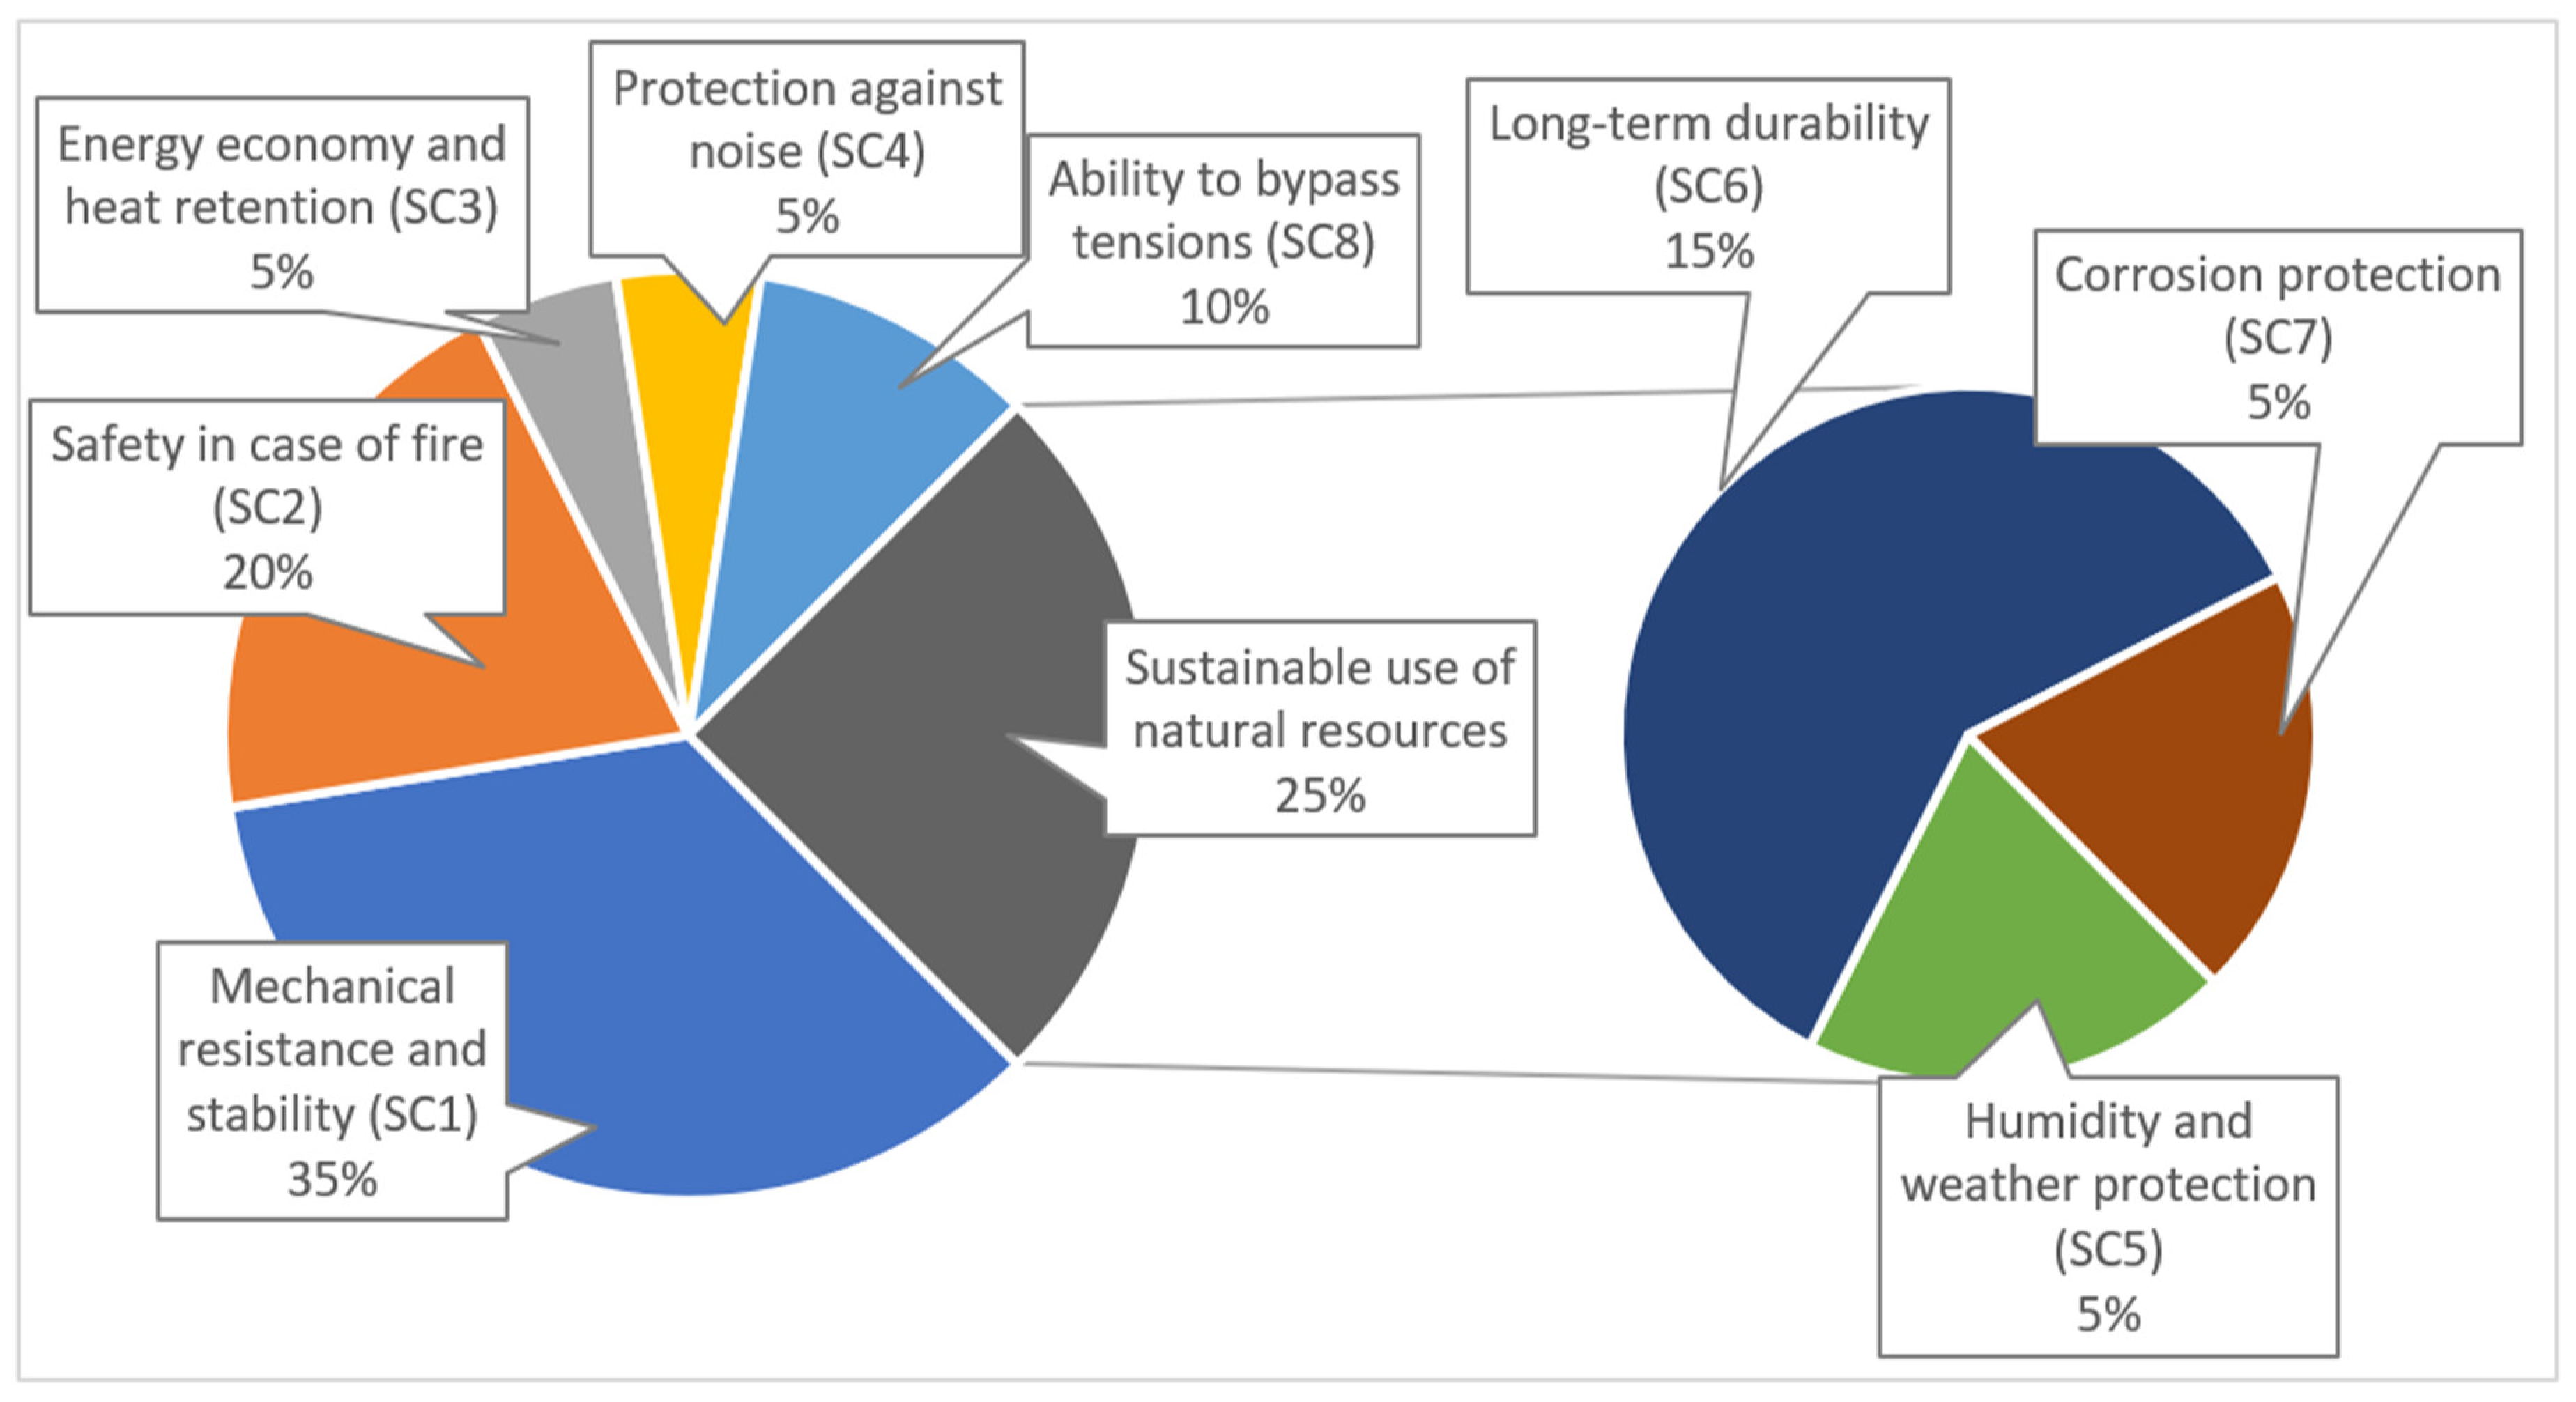
“Mechanical resistance and stability” (SC1), “safety in case of fire” (SC2), “energy economy and heat retention” (SC3), and “protection against noise” (SC4) are considered in this study as described in the regulation. “Sustainable use of natural resources” is explained in ETAG 004 as measures of the “aspects of durability and serviceability”, which concern durability in several aspects which are differentiated in this study. The system is required to protect against short-term weather effects (“humidity and weather protection” (SC5)), deliver its functions during the whole service life (“long-term durability” (SC6)), and be resistant to corrosion (“corrosion protection” (SC7)). “Safety in use” considers the resistance to combined stresses caused by normal loads. For clarity, in this research, the term “ability to bypass tensions” (SC8) is used. “Hygiene, health, and environment” considers the effect on the indoor and outdoor environment as well as pollution due to the release of dangerous substances, which is not seen as a separate severity category in this façade construction technology-related study.
Each degradation factor affects the performance of each severity category, which influences the total performance of the façade. Aurnhammer [70] has estimated technical defects concerning the diminishing of the value to the users. In the case of a shortcoming in any segment, the final resulting value decreases. The degradation severity is evaluated with a weighted impact method, in which all categories sum up to 100%, describing the total failure in each category. Based on the weighting method developed by Aurnhammer [70], the adjusted distribution (Figure 4) provides an evaluation model to calculate the SV.
For the severity evaluation, the 6-point Likert scale is used to include the value of zero, which simplifies the interpretation of the cases where no influence is foreseen. The SV for each expert is calculated with Equation (1). The mean SV of all experts is the input value for TER calculation.
where
- SVDF,e is the weighted technical severity value (SV) of an expert;
- SRDF,SC,e is the individual rating of an expert for a severity category;
- SRSC,max is the maximum rating value for the severity category;
- TSC is the weight of the severity category according to Figure 4.
The experts’ judgments on technical severity were collected in 2016. Twelve experts out of the identified 14 accepted the invitation to participate in this study. Half of them were located in Germany and the other half in Estonia. Nine of the participants had practical experience and three of them also had theoretical experience. Eight experts had more than ten years of experience in the field, while four had more than 20 years of experience. Six participants worked as consultants or supervisors, four of them as technical specialists for a product manufacturer, and one in the construction company. The validity of severity values based on an expert’s judgement was tested with the nonparametric Friedman’s test, which increases the credibility of quantification of subjective evaluations [71,72]. The Friedman’s test is used for each degradation factor separately to detect expert values which are in the critical zone. The 103 degradation factors concerned 991 individual evaluations. Fifty-three degradation factors received positive Friedman test results in the first analysis. Eighty-two individual evaluations were in the critical zone and a maximum of four rounds were applied. After the Friedman’s test, the datasets concerned 4 to 12 experimental units.
2.4. Detectability, Occurrence, and Latency Period
For each degradation factor, the developed model requires data regarding detectability and occurrence probability, as well as the latency period for the discounting of repair costs. The latency period is a time range between the occurrence of the on-site shortcoming and the time when the degradation has evolved and requires repair activities. The occurrence probability measures how often the shortcomings occur, and detectability measures how difficult it is to notice the shortcoming during the construction works. As this study aims to identify the situation in Estonia, the Estonian experts were asked to participate in the region-specific data collection. Five of the seven Estonian experts agreed to participate in the survey conducted in 2018. All of them had between 10 and 20 years of practical experience in the field and tertiary education.
For the evaluation of detectability and occurrence probability, a 5-point Likert scale was used. The latency period was detected with the accuracy of one year. The data was collected using the Delphi technique, where independent and anonymous expert judgements are combined through mathematical aggregation [73]. The experts were asked to provide their evaluation individually and anonymously to each other. The responses from all experts were summarized and mean values calculated. The collective mean results were sent to all experts who were then asked to revise their evaluation or agree/disagree with the collective result. Three participants agreed with the collective results. Two experts reviewed the group results after a reminding phone call and stated their agreement with the consensus. Hallowell et al. [67] have described the “bandwagon effect”, where decision-makers may feel pressure to confirm the opinion of a group. Due to the fast agreement with the consensus and to investigate whether there was the described effect, the team of experts was brought physically together. The highest and lowest evaluations were discussed with the group to check whether there were hidden assumptions. Positively, the consensus was not changed after the meeting. The primary reason was that the individual evaluations depend highly on the skills and experience of the expert and the results may vary. The data collection process was conducted in 2018. A more specific description of the method as well as the results are presented in other papers by the author [7].
2.5. Economic Risk Priority Number
The outcome of the economic relevance calculation for each degradation factor is the ERPN, calculated with Equation (2):
where
- ERPNDF is the economic risk priority number (ERPN);
- EAVDF is the economic assessment value;
- DVDF is detectability;
- OVDF is the likelihood of occurrence.
An economic assessment value is developed to quantify future repair costs of specific degradation factors. In regard to the life cycle costing method, which reflects the expenses in each phase of the building [74], the current model focuses only on the future repair costs of the shortcoming of a construction process activity. The discounted repair costs are leveraged with the construction cost index for new residential buildings provided by Eurostat to maintain comparability during economic fluctuations. As the simulations in this model are based on the situation of Estonia, the construction cost index for quarter 4 in 2017 was 116.6% [75], considering the year 2010 as the reference year. The economic assessment value is calculated with Equation (3):
where
- EAVDF is the economic assessment value;
- NPVDF is the discounted repair costs of a degradation factor;
- CCI is the construction cost index.
The repair costs are the time-relevant component and are calculated with the net present value (NPV) method as shown in Equation (4):
where
- NPVDF is the net present value of the repair costs for a degradation factor;
- Rr is the real discount rate per annum;
- LPDF is the latency period of a degradation factor;
- CR is the repair cost of the selected repair method.
The economic relevance model focuses on the features of the Estonian market. The real interest rate of 0.52% considers the inflation of 3.73% [76] and the average 5- to 10-year loan interest rate for entrepreneurs, which is 4.25% [77].
Professionals in the field [3,6,10,11,23,78] have thoroughly described the repair methods which are reliable to use for ETICS. To ensure comparability, the cost calculations examine the area of 1 m2. The usage of industry data has provided valuable and more exact results in other studies [79]. Therefore, the cost data for the simulations is provided by an experienced professional from one active construction company and is based on the costs of projects simultaneously under construction from September 2017 until January 2018 in Estonia. The cost difference ratio to the initial construction cost of simulation 1 is shown in Table 2.
2.6. Technical–Economic Relevance Value of the Degradation Factors
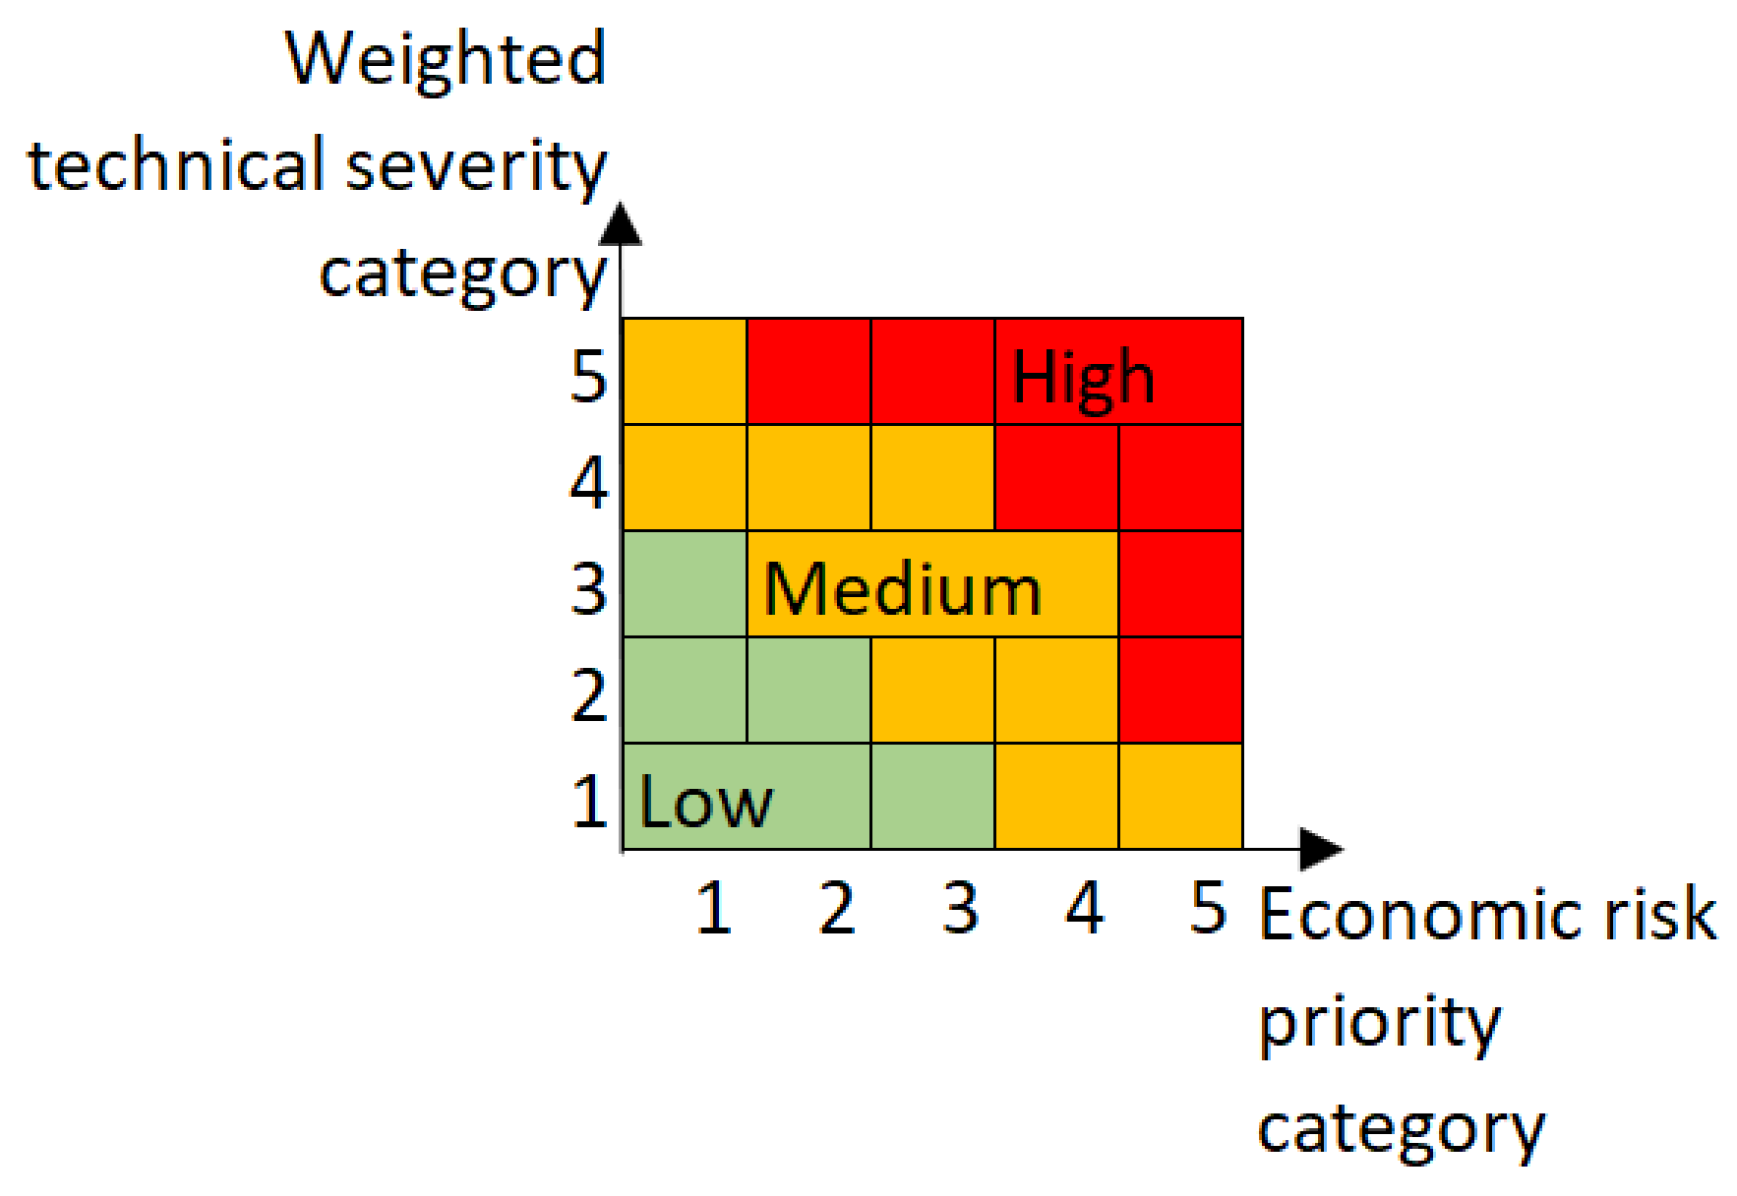
The discussed ERPN and SV are to be considered in one model. The traditional risk matrix concerns the likelihood of occurrence and consequence on the x- and y-axis. In this study, the consequence concerns the weighted technical severity impact of a degradation factor. However, there are more components considered on the other axis. It concerns the occurrence, detectability, and economic impact, which are combined into an ERPN. The risk matrix (Figure 5) positions each degradation factor in a risk category. The positioning of the matrix is in the Cartesian coordinate system, and the numerical values correspond to risk levels—a higher score means increased risk. This work is based on a 5 × 5 cell matrix, having 25 risk cells, as often used in research [80,81]. The 25 risk cell matrix is divided into three risk categories. The categories are described as follows: “low” is acceptable, no action required; “medium” is tolerable, additional action required; “high” is not acceptable, immediate action required.
As there are three risk categories, an additional ranking within a single risk category is required to prioritize the degradation factors to each other. Therefore, the degradation factor is also described with the TER value for further analysis with Equation (5).
where
- TERDF is the technical–economic relevance (TER) number;
- SVDF is the weighted technical severity value (SV);
- ERPNDF is the economic risk priority number (ERPN).
The ERPN and SV are classified into five categories. Category 5 represents the highest economic or technical relevance, and category 1 the lowest. The highest value is the maximum value received during the evaluations, and other categories are distributed equally. For the conducted simulations, the maximum ERPN is 910.2, and the SV is 0.633. The evenly distributed category ranges are shown in Table 3.
3. The Technical–Economic Relevance of the Degradation Factors
The input values for the TER simulation are the SV and the ERPN, whose average impact by layers is shown in Figure 6. Higher value means higher relevance. The comparison shows which component influences the outcome and in which direction. As the components are described in more detail in other papers, the influence of the components is described only in layers in this paper.
The average SV is very high in the layer of reinforcement for all simulations. Simulation 1 has high values in the same range for the substrate and adhesive layers. The increased relevance of simulation 1 is caused by the fixing method (purely bonded), which emphasizes the degradation factors that decrease adherence properties. The lowest average SV is for a layer of insulation. In regard to the SV, it must be noted that the standard deviation is relatively high, meaning that the risk categorization should provide relevant information for better decision-making.
Economic relevance is highest in the substrate, adhesive, and additional details’ layers. The main cause is the high repair costs, as the replacement of the whole system is considered. The detectability increased the relevance in the adhesive and reinforcement layers. These defects are covered at the same time as they occur, and problems can be identified only during the brief application period. The occurrence value was highest in the additional details’ layer, followed by the substrate layer.
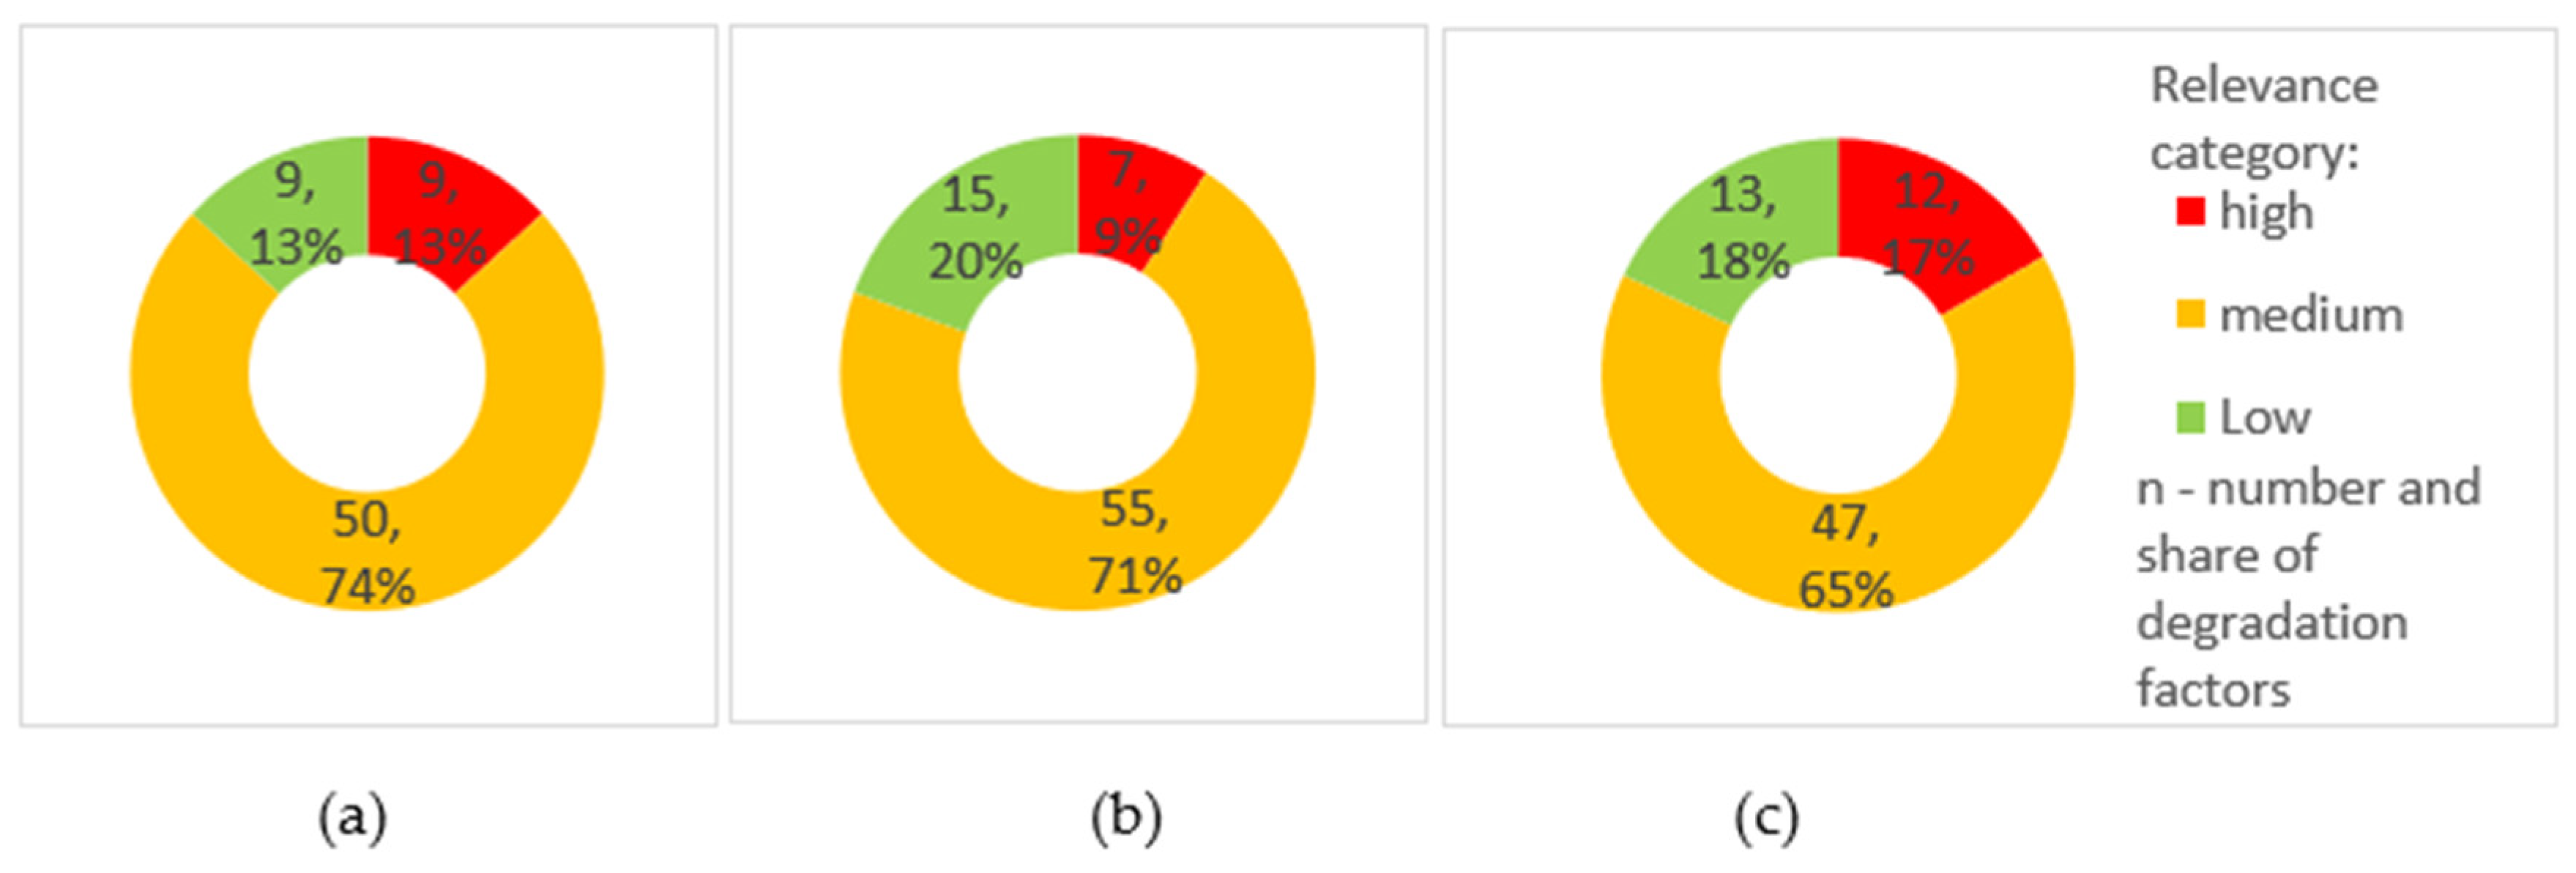
The categorization distributes the degradation factors of the simulations into three risk categories, which are required to focus on the more relevant shortcomings. Figure 7 shows the share of degradation factors and their count in numbers. The visualization shows that the high category concerns 9% to 17% (7 to 12 factors) of the degradation factors, the medium category 65% to 74% (47 to 55 factors), and the low category 13% to 18% (9 to 15 factors).
For the analysis of the degradation factors within a single risk category, the product of the two variables, the TER value, is used. Figure 8 compares the average TER values of the simulations by layers. There are two main reasons behind the difference in values between the simulations in the substrate, adhesive, and additional details’ layers. Simulation 1 describes the purely bonded ETICS with polystyrene as the insulation material, meaning that the adhesive layer has a higher significance for ensuring mechanical stability, thus increasing the SV. Simulation 3 refers to the ETICS with mineral wool, fixed with mechanical anchors and additional adhesive. The higher repair costs of the inner layers, where the whole system is to be replaced, increases the average ERPN. Simulation 2 has the lowest ERPN due to the lower cost of polystyrene plates, which are fixed with mechanical anchors and supplementary adhesive.
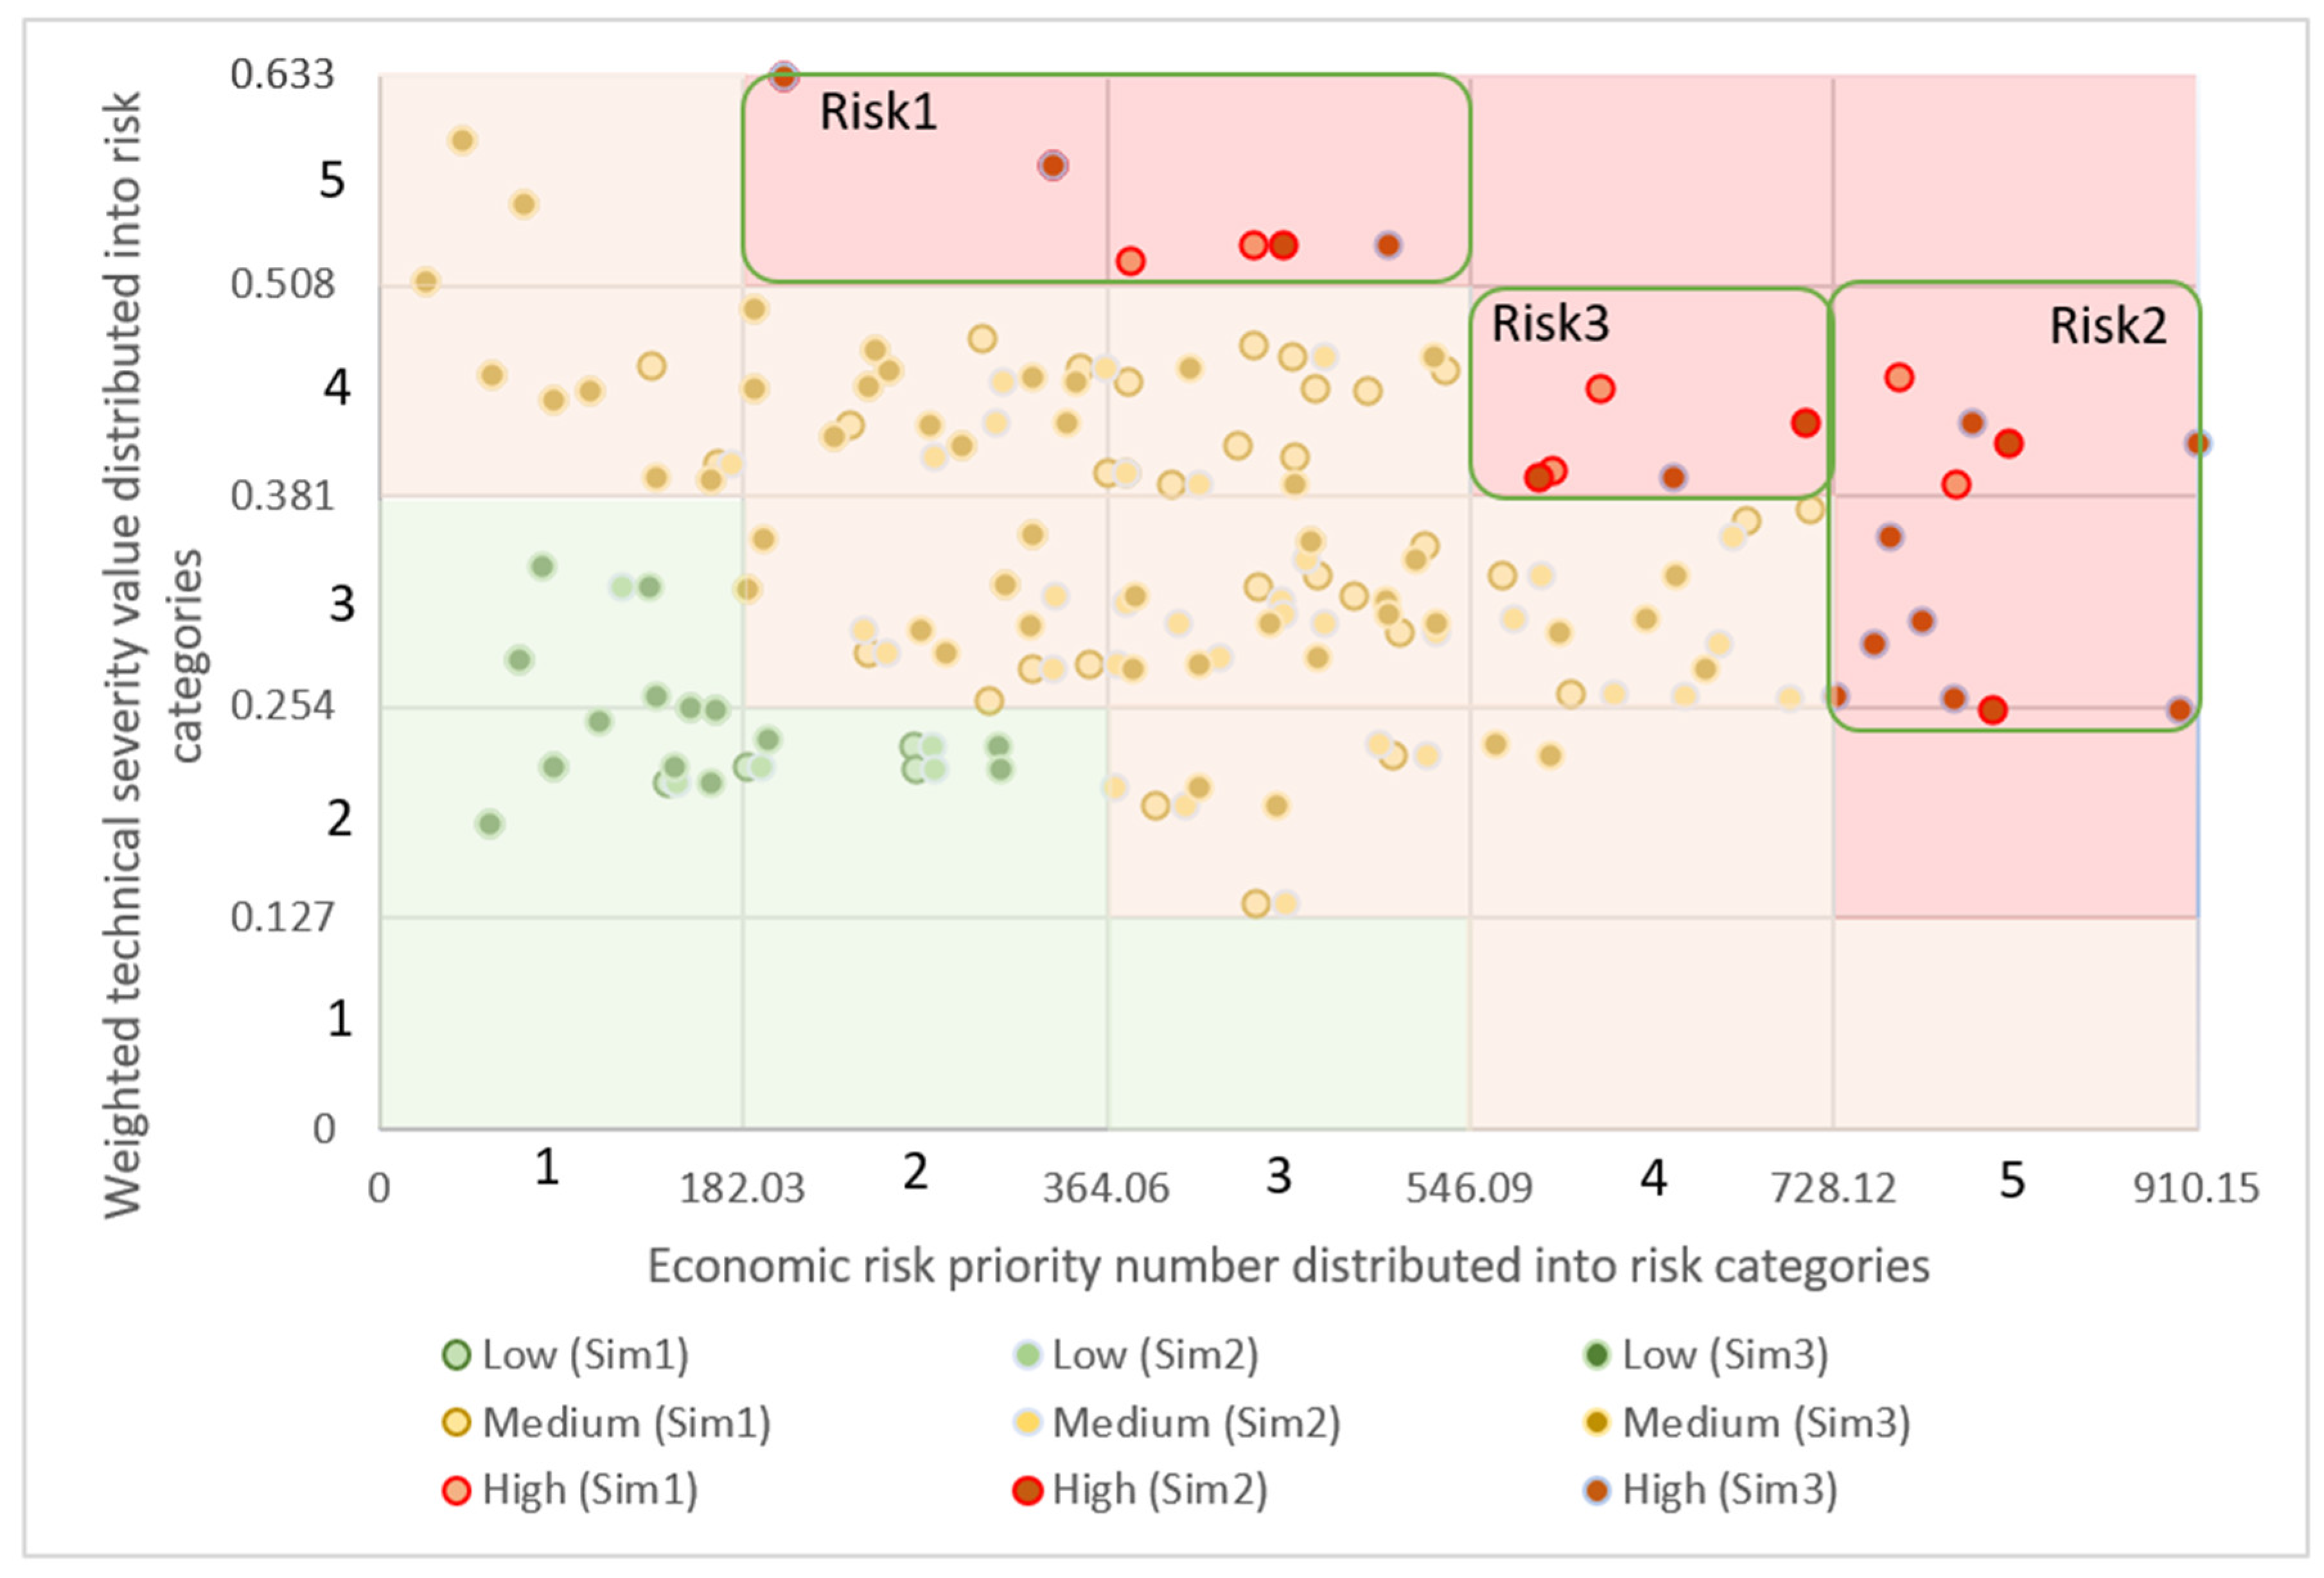
The TER model positions the degradation factors on the risk matrix as seen in Figure 9. For further analysis, the categories are discussed in the following groups:
- SV in category 5, ERPN in categories 2 to 5 (Risk1);
- ERPN value in category 5, SV in categories 2 to 5 (Risk2);
- ERPN and SV in category 4 (Risk3).
- Medium risk category
- Low risk category
“Risk1” is the group with the highest SV and concerns three unique degradation factors relevant for all simulations and one degradation factor relevant for simulation 1. The freezing of adhesive during the curing process (M9b), relevant for simulation 1, has a strong influence on the adhesion properties as the system is purely bonded. Other shortcomings relevant for all simulations concern the layer of reinforcement and insulation—continuous gaps between the substrate and adhesive which enable airflow in the system (I4), thin reinforcement mortar thickness (R6), and freezing of the reinforcement layer (M9c).
“Risk2” describes the degradation factors with the highest ERPN category and concerns eight shortcomings. All shortcomings in this group belong to the substrate and adhesive layers. Only one degradation factor belongs to simulation 1—substrate covered with old paint (S4b). All other factors belong to simulation 3, which is the expected result due to the higher repair cost of the mineral wool. The highest values have degradation factors which describe the low load-bearing capacity (S5a), coverage of the substrate with old or existing paint (S4a), and an insufficient amount of adhesive (D3a). The insufficient amount of adhesive received high values in the technical severity category of safety against fire, which is reduced due to possible airflow in the system. The other relevant factors influence mainly the stability of the system influenced by fixation—unleveraged adhesive on the mineral wool (D5), dry curing conditions of the cement-based adhesive (M11a), usage of unsuitable adhesive (S7a), and not pre-processed detached areas (S6a) are the other relevant shortcomings in this group.
Group “Risk3” describes the shortcomings in category 4 for both components. A relevant degradation factor for all simulations is the improperly finished windowsills, enabling moisture to penetrate into the system (X2). Other risks concern simulation 1 and simulation 2. They describe the works that decrease the adhesion properties—low humidity of the substrate (S8b), insufficient adhesive (D3b), problematic load-bearing capacity of the substrate (S5a), and reduced area of adhesive due to a lack of pressure applied during the attachment of insulation plates (D8b).
The medium-risk category has the largest amount of degradation factors. The degradation factors in the substrate, adhesive, and additional details’ layers received the highest TER values. The highly relevant shortcomings in the substrate layer concern the preparation of the substrate surface—cleaning from biological growth (S3b), dust (S2b), and old paint (S4a), as well as problematic load-bearing capacity (S5b) and detached and unfilled areas of the surface (S6a). Additionally, the usage of an unsuitable adhesive type (S72, S7b) is relevant. The mixture preparation and curing conditions received higher TER values. Relevant are the low-humidity weather factors of the substrate (S8a), high temperature (M10b), and low relative humidity (M11a). For the application process, the exceeded working time of the mixture (D7a, D7b), high share of kneading water (M3b), and additional unsuitable ingredients (M8) are noted. The occasion when the adhesive is not applied on the border of the insulation plates (D1b) is relevant for simulations 1 and 2. The shortcomings during the application of additional details concern moisture penetration into the system through problematic fixed frame connections (X4) and penetrations into the system due to objects attached on the façade (X7).
The low-risk category concerns mainly the shortcomings in the layers of the finishing coat, insulation, and mechanical anchors. In the finishing layer, low relevance is set for the increased and decreased thickness of the applied mortar (F3, F4) and missing primer (F1). In the mechanical anchors layer, the highly or deeply placed anchor plates (A7, A6), wrong placement of the anchors in comparison to the manufacturer’s recommendations (A5), as well as uncleaned anchor holes (A10) are noted as irrelevant. The shortcomings during the application of insulation plates show that the increased width of the neighbouring polystyrene insulation plates (I7), crossed joints (I5), broken and not filled polystyrene plates (I9), and missing fire-retardant areas if required (I10) are the least problematic (I10). The reason for their low values lies in the ERPN, as the defects are easily detectable and do not occur very often.
For further analysis, the TER values of the simulations are positioned in accordance with their sequence in the construction process in Figure 10. The circles around the degradation factors show their belonging to the risk category. The horizontal lines show the average TER values by layers; the groups with a green line are discussed more specifically. The figure shows that construction works have the highest relevance for simulation 1 in the substrate and adhesive layers, while in other layers, the impact is relatively similar to other simulations. This difference is mainly due to the fixation type, which increases the technical risk. The lowest risk can be noted for simulation 2, which concerns the insulation plates made out of polystyrene and fixed with mechanical anchors and supplementary adhesive. Simulation 3 is in between, with the exception of the work concerning additional details, which is marked as group TE9. Simulation 3 has a comparable average technical risk to simulation 2, but increased economic impact due to the higher cost of mineral wool as the insulation material.
The increased deviation between simulations is noticed within the substrate layer (group “TE1”). The group includes eight degradation factors in the substrate layer, of which four concern simulation 1. The common factors are the occasions when the substrate is covered with old paint and it reacts with adhesive (S4a, S4b) or is under the load-bearing capacity (S5a, S5b). Other highly relevant shortcomings are the very low humidity of the substrate (S8b), which is a risk in the curing process mainly for inorganic mixtures and unsuitable adhesive types (S7b). The low-relevance group “TE2” contains the shortcomings which concern the substrate coverage with oil (S1a, S1b). Although the factors of substrate covered with old paint (S4a and S4b) and substrate covered with dust or dirt (S1a and S1b) have the same technical effect on the system, the ERPN of the low relevance group is decreased substantially due to good detectability and low occurrence probability, which reduce the relevance value by more than five times.
The high relevance group “TE3” brings together the factors in the adhesive layer, concerning the application of insufficient adhesive (D3a, D3b) as well as missing adhesive in the centre (D2a) as insulation plates made out of polystyrene are applied. The differentiation from the average is caused by a high occurrence value. The low relevance group “TE4” describes wrong material storage conditions (M1a, M1b) and an insufficient mixing procedure which leaves clots in the mixture (M2a, M2b). In contrast to “TE3”, the high deviation is due to a very low occurrence value. For the same reason, the group “TE5” differentiates from the average. The technical severity of the degradation factor from “TE5”, which describes continuous gaps in the system due to the installation application (I4), is highly influenced by the effect of fire protection as the requirement is highly influenced by airflow within the system.
The groups “TE6” and “TE8” include a number of factors which have a negative deviation from the trendline. The groups include the majority of degradation factors in the insulation, mechanical anchors, and finishing layers. The degradation factors in the reinforcement layer (group “TE7”) have a positive deviation, but the values remain in the middle area compared to all factors. The degradation factors that occur during the installation of additional details (group “TE9”) received relatively high values. Problematic are the windowsills (X2) and fixed frame connections (X4), as well as unfinished penetrations through the system when objects are added on the surface of the system (X7). The value of the failures in this group is increased due to the high occurrence rate.
4. Implications of the Latency Period on the Decision-Making Process
The stakeholders in the construction process should reduce the occurrence of degradation factors for a better overall outcome. However, the economic reasonability of resource allocation is influenced by the contractual defect liability period, which is, by law, two years in many cases.
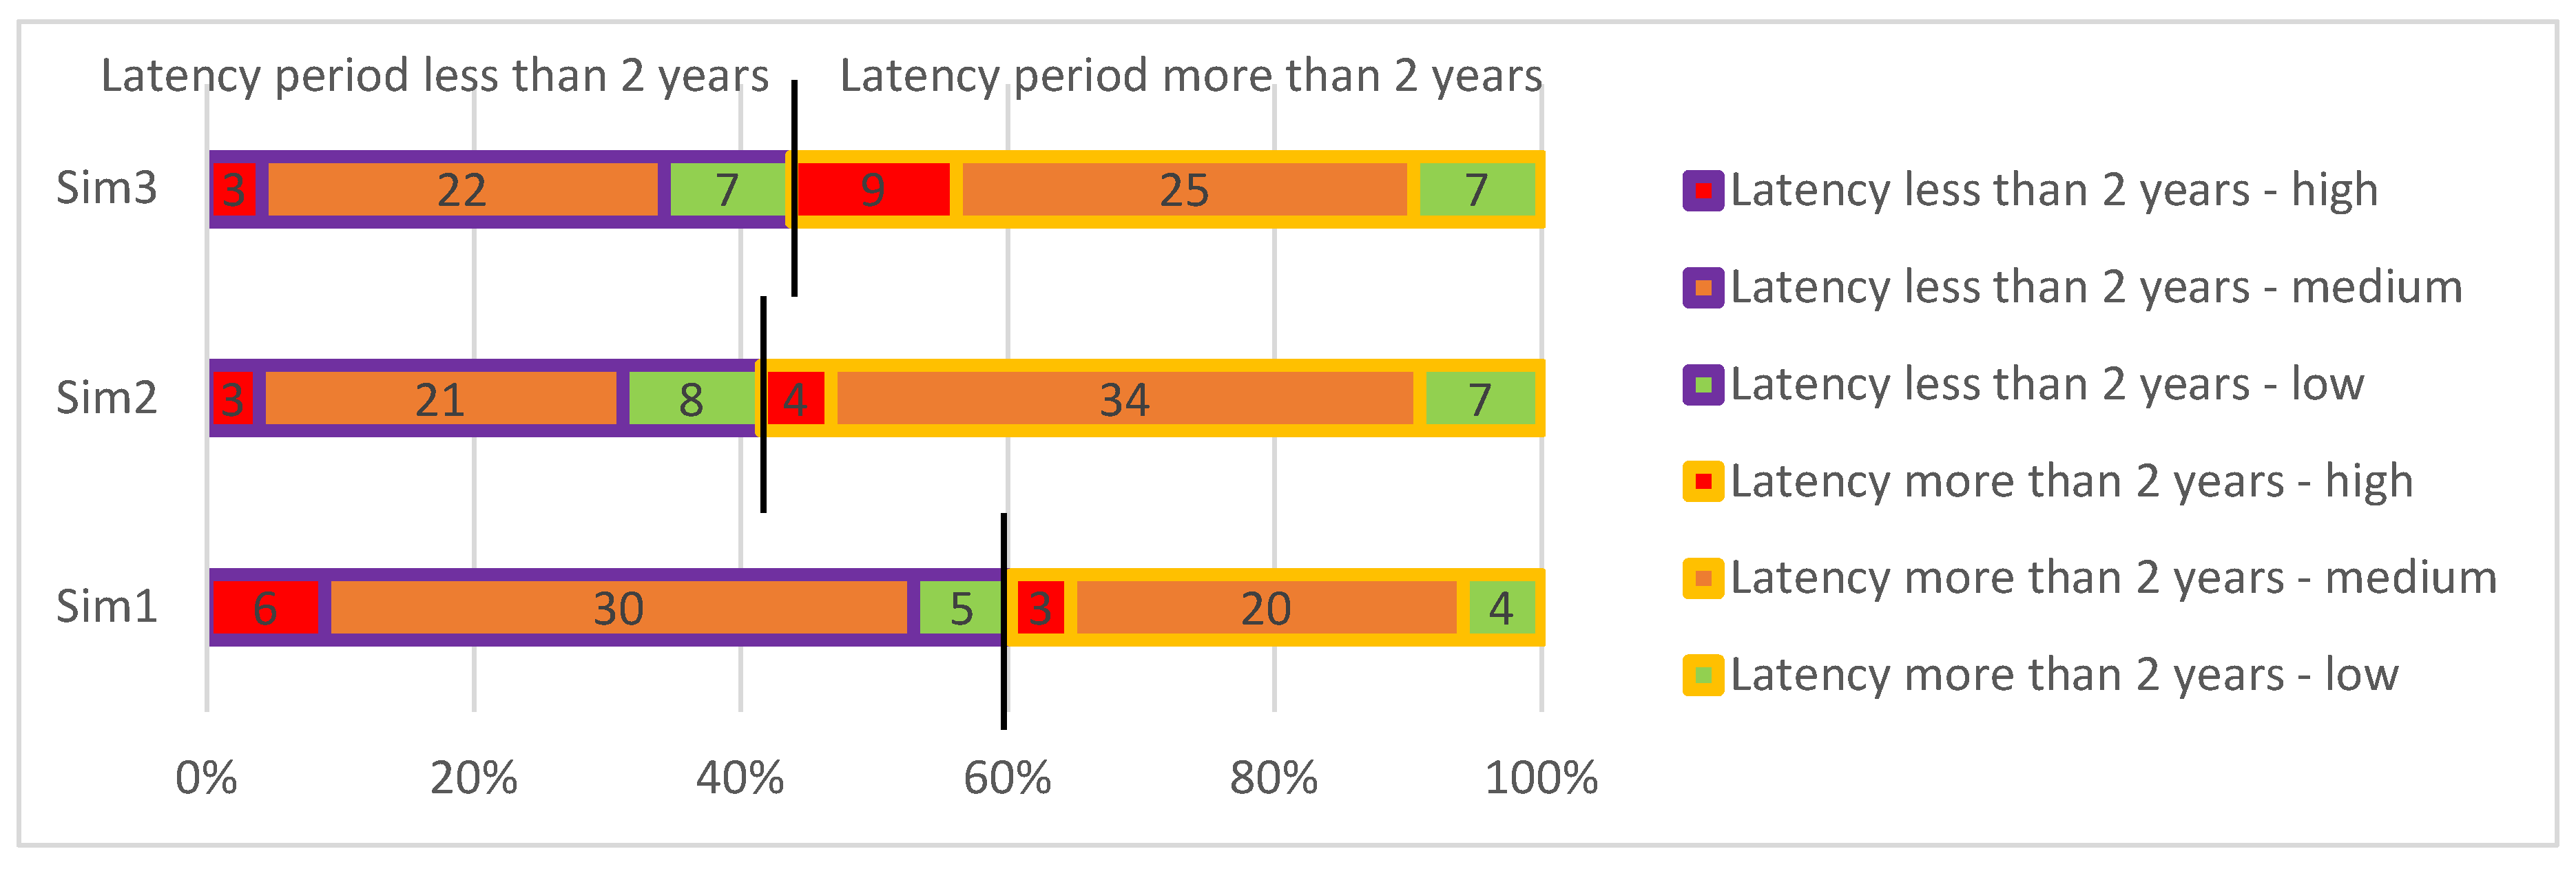
The latency distribution of the degradation factors shows that the majority of shortcomings appear after the two years of construction for the systems attached to mechanical anchors (simulations 1 and 2), while the majority of the shortcomings for the purely bonded system appear during the first 2 years (simulation 3). Figure 11 presents the distribution of the shortcomings according to the latency period. Simulations 1 and 2 have more degradation factors with the high- and medium-risk categories, which appear after the latency period of two years.
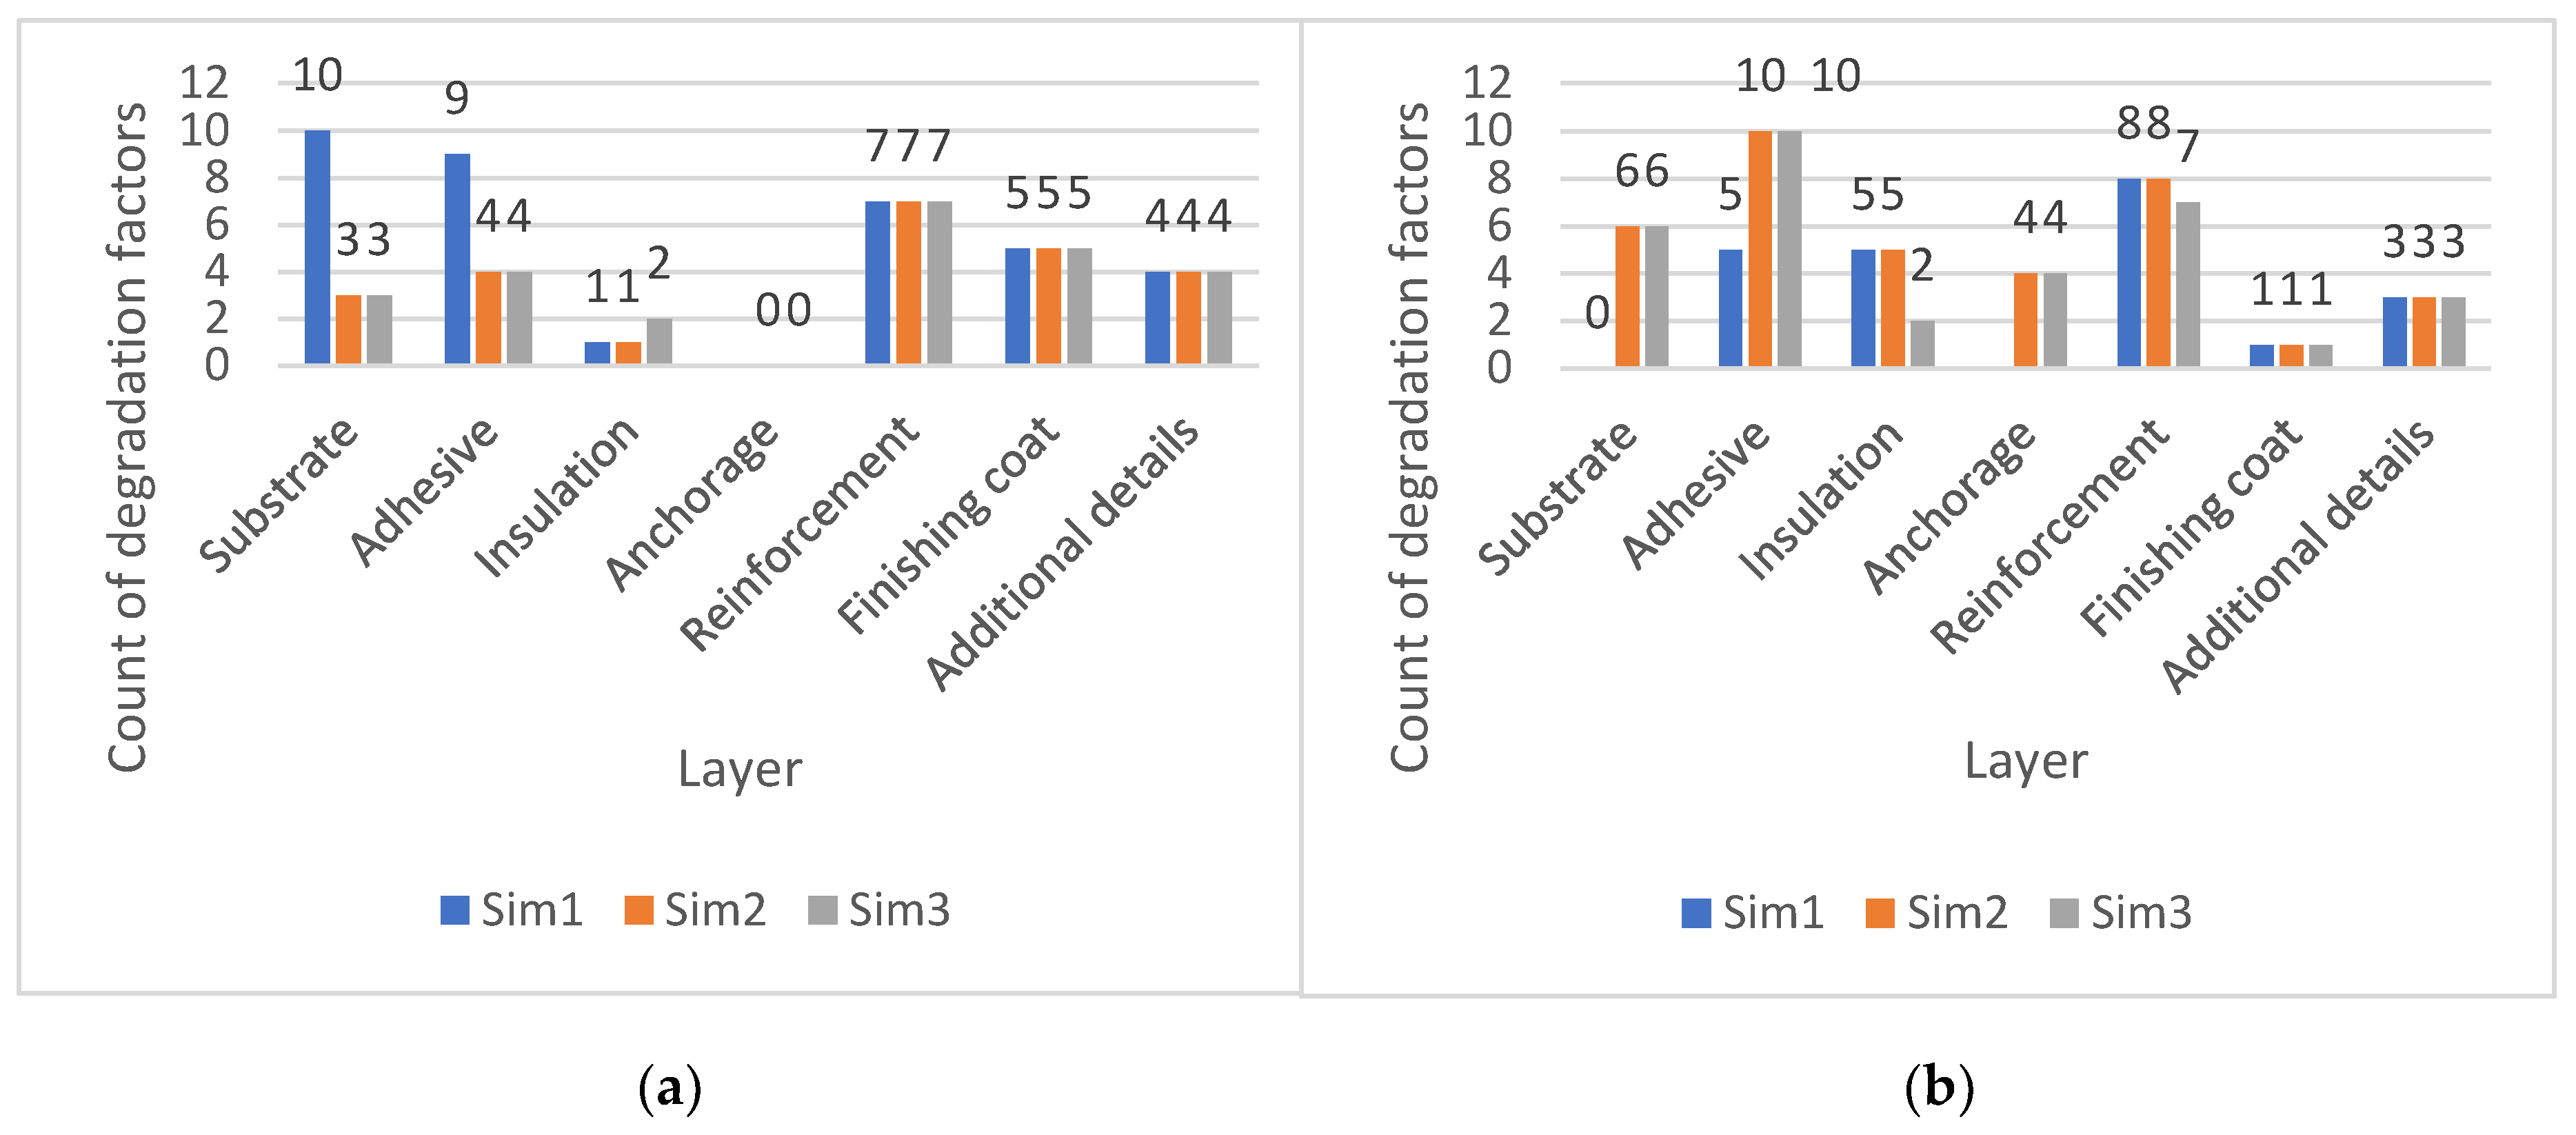
In order to take a closer look, the high- and medium-risk category degradation factors have been differentiated by layers and a 2-year liability period in Figure 12. The latency period of the shortcomings in the substrate and adhesive layers for the purely bonded system (simulation 1) differentiate from the other simulations—19 factors out of 24 appear during the first two years after construction. This means that the adhesion properties are more relevant to the contractor and problems show visible signs of deterioration during the short period after application. Additionally, in the finishing layer, five of six relevant shortcomings appear during the two-year period in all simulations. These defects are technically less relevant, but are visibly detectable and occur quite often. Especially in these layers, the legal liability is covered by the contractor.
5. Conclusions and Suggestions
The increased number of energy efficiency requirements have increased the refurbishment rate of apartment buildings covered with an external thermal insulation composite system (ETICS). The majority of visible defects in the years following completion are caused by shortcomings during the construction process. To avoid failures, quality control should focus on the factors which have increased technical relevance as well as financial impact.
The technical–economic relevance (TER) model expands the traditional FMEA approach by adding the impact of future costs caused by the shortcomings of technical severity, detectability, and occurrence of the failure. The model evaluates and differentiates the significant onsite construction activities in terms of system type for more rational resource allocation and is also suitable for small- and medium-sized enterprises. The model was tested on three simulations which quantify the onsite degradation factors of ETICS.
In this study, 103 degradation factors were evaluated through expert judgment. The data was validated with the Delphi technique and nonparametric Friedman’s test. Cost data for three simulations was received from one active company from the industry. The results emphasize the relevance of onsite activities during substrate preparation and the application of adhesive and a base coat with reinforcement mesh. Less relevance is assigned to the activities during the application of a finishing coat and installation of insulation plates.
According to the results of this study, the following onsite aspects should be considered to increase the quality of the façade system:
- The shortcomings during the preparation of the substrate and application of adhesive have a very high impact on the technical severity as well as a fatal outcome on the system as the critical limit is exceeded. The possible high cost of replacement should be replaced by an increase in the quality and more careful inspection during the application process. The majority of the shortcomings of the purely bonded system appear in the two years following construction.
- The frequently occurring and systematic problems occur due to the installation of additional details, such as windowsills, connections between fixed frames and ETICS, and other penetrations through the system. These defects cause significant technical degradation as well as having high repair costs. It is suggested to reduce the moisture penetration into the systems.
- The weather-related degradation factors are relevant for most of the layers which concern mixtures. Freezing or drying out of the mixtures, as well as high humidity remaining in the system, have a relatively high impact on the technical outcome. Good climate through coating as well as temperature and humidity control are highly recommended.
- During the application of the adhesive and reinforcement layers, the shortcomings will be covered simultaneously, which makes it difficult to detect and repair the mistakes during the process. The habits and working methods of individual artisans have a high impact as the activities are repeated. To avoid the shortcomings in these layers, the upscaling of skills and work methods is highly suggested.
The simulations have provided logical results and are relevant to the decision-making process. For more specific modelling, a sublevel of onsite activities could be applied in future studies. For example, the mixtures can be differentiated by their nature and ingredients, which are only partially observed in this research. The construction process shortcomings have different severity impacts on various mixture types. Additionally, the additional details in this study are only generally described. It would be worthwhile to select specific solutions for additional details and develop their degradation factors in a more specific manner.
Funding
This work was supported by institutional research funding of the Estonian Ministry of Education and Research IUT1−15: “Nearly-zero energy solutions and their implementation on deep renovation of buildings”.
Acknowledgments
The author would like to show their gratitude to the experts from Germany and Estonia, as well as the participating construction companies who shared their experience and knowledge during this research.
Conflicts of Interest
The author declares no conflict of interest.
Appendix A

Table A1.
Data (1).
| Sequence | ID | Layer | Factor | SV | SV-C | ERPN (Sim1) | ERPN-C (Sim1) | TER (Sim1) | TER-C (Sim1) | ERPN (Sim2) | ERPN-C (Sim2) | TER (Sim2) | TER-C (Sim2) | ERPN (Sim3) | ERPN-C (Sim3) | TER (Sim3) | TER-C (Sim3) |
|---|---|---|---|---|---|---|---|---|---|---|---|---|---|---|---|---|---|
| 1 | S1a | S | Substrate is covered with grease or oil | 0.327 | 3 | 121 | 1 | 40 | Low | 135 | 1 | 44 | Low | ||||
| 2 | S1b | S | Substrate is covered with grease or oil | 0.460 | 4 | 137 | 1 | 63 | Med. | ||||||||
| 3 | S2a | S | Substrate is covered with dust or dirt | 0.320 | 3 | 339 | 2 | 109 | Med. | 378 | 3 | 121 | Med. | ||||
| 4 | S2b | S | Substrate is covered with dust or dirt | 0.449 | 4 | 375 | 3 | 169 | Med. | ||||||||
| 5 | S3a | S | Substrate is covered with biological growth | 0.318 | 3 | 451 | 3 | 144 | Med. | 504 | 3 | 160 | Med. | ||||
| 6 | S3b | S | Substrate is covered with biological growth | 0.445 | 4 | 468 | 3 | 209 | Med. | ||||||||
| 7 | S4a | S | Substrate is covered with paint or other material which can chemically react with adhesive | 0.356 | 3 | 678 | 4 | 241 | Med. | 756 | 5 | 269 | High | ||||
| 8 | S4b | S | Substrate is covered with paint or other material which can chemically react with adhesive | 0.452 | 4 | 762 | 5 | 344 | High | ||||||||
| 9 | S5a | S | Substrate is under the required load-bearing capacity | 0.425 | 4 | 714 | 4 | 303 | High | 797 | 5 | 338 | High | ||||
| 10 | S5b | S | Substrate is under the required load-bearing capacity | 0.457 | 4 | 534 | 3 | 244 | Med. | ||||||||
| 11 | S6a | S | Substrate has large unevenness or has detached areas | 0.261 | 3 | 653 | 4 | 170 | Med. | 729 | 5 | 190 | High | ||||
| 12 | S6b | S | Substrate has large unevenness or has detached areas | 0.333 | 3 | 470 | 3 | 157 | Med. | ||||||||
| 13 | S7a | S | Unsuitable surface (too smooth) which reduces adhesion properties | 0.292 | 3 | 670 | 4 | 196 | Med. | 748 | 5 | 218 | High | ||||
| 14 | S7b | S | Unsuitable surface (too smooth) which reduces adhesion properties | 0.373 | 3 | 716 | 4 | 267 | Med. | ||||||||
| 15 | S8a | S | Substrate has very low humidity (inorganic adhesive) | 0.308 | 3 | 568 | 4 | 175 | Med. | 634 | 4 | 195 | Med. | ||||
| 16 | S8b | S | Substrate has very low humidity (inorganic adhesive) | 0.445 | 4 | 611 | 4 | 272 | High | ||||||||
| 17 | S9a | S | Substrate is very wet (raining prior to application of adhesive) | 0.305 | 3 | 400 | 3 | 122 | Med. | 446 | 3 | 136 | Med. | ||||
| 18 | S9b | S | Substrate is very wet (raining prior to application of adhesive) | 0.411 | 4 | 430 | 3 | 177 | Med. | ||||||||
| 19 | S10a | S | Substrate is frozen during the application (inorganic adhesive) | 0.450 | 4 | 312 | 2 | 140 | Med. | 348 | 2 | 157 | Med. | ||||
| 20 | S10b | S | Substrate is frozen during the application (inorganic adhesive) | 0.476 | 4 | 302 | 2 | 144 | Med. | ||||||||
| 21 | M1a | D | Unsuitable mixture storage conditions | 0.301 | 3 | 243 | 2 | 73 | Med. | 271 | 2 | 82 | Med. |
Table A2.
Data (2).
| Sequence | ID | Layer | Factor | SV | SV-C | ERPN (Sim1) | ERPN-C (Sim1) | TER (Sim1) | TER-C (Sim1) | ERPN (Sim2) | ERPN-C (Sim2) | TER (Sim2) | TER-C (Sim2) | ERPN (Sim3) | ERPN-C (Sim3) | TER (Sim3) | TER-C (Sim3) |
|---|---|---|---|---|---|---|---|---|---|---|---|---|---|---|---|---|---|
| 22 | M1b | D | Unsuitable mixture storage conditions | 0.424 | 4 | 235 | 2 | 100 | Med. | ||||||||
| 23 | M2a | D | The mixing procedures do not remove clots | 0.206 | 2 | 368 | 3 | 76 | Med. | 411 | 3 | 84 | Med. | ||||
| 24 | M2b | D | The mixing procedures do not remove clots | 0.259 | 3 | 305 | 2 | 79 | Med. | ||||||||
| 25 | M3a | D | High share of kneading water | 0.284 | 3 | 421 | 3 | 120 | Med. | 469 | 3 | 134 | Med. | ||||
| 26 | M3b | D | High share of kneading water | 0.351 | 3 | 523 | 3 | 184 | Med. | ||||||||
| 27 | M4a | D | Low share of kneading water | 0.310 | 3 | 453 | 3 | 140 | Med. | 505 | 3 | 157 | Med. | ||||
| 28 | M4b | D | Low share of kneading water | 0.327 | 3 | 439 | 3 | 144 | Med. | ||||||||
| 29 | D1a | D | Missing adhesive on the edges of insulation (polystyrene) | 0.404 | 4 | 302 | 2 | 122 | Med. | ||||||||
| 30 | D1b | D | Missing adhesive on the edges of insulation (polystyrene) | 0.472 | 4 | 474 | 3 | 223 | Med. | ||||||||
| 31 | D2a | D | Missing adhesive in the center of insulation (polystyrene) | 0.317 | 3 | 343 | 2 | 109 | Med. | ||||||||
| 32 | D2b | D | Missing adhesive in the center of insulation (polystyrene) | 0.396 | 4 | 334 | 2 | 132 | Med. | ||||||||
| 33 | D3a | D | Insufficient adhesive surface area | 0.414 | 4 | 680 | 4 | 281 | High | 758 | 5 | 314 | High | ||||
| 34 | D3b | D | Insufficient adhesive surface area | 0.389 | 4 | 658 | 4 | 256 | High | ||||||||
| 35 | D4 | D | Adhesive is not rubbed into the insulation plate (mineral wool) | 0.276 | 3 | 664 | 4 | 183 | Med. | ||||||||
| 36 | D5 | D | Adhesive is not treated with notch towel (mineral wool) | 0.306 | 3 | 772 | 5 | 236 | High | ||||||||
| 37 | D7a | D | Working time of the adhesive is exceeded | 0.342 | 3 | 464 | 3 | 159 | Med. | 518 | 3 | 177 | Med. | ||||
| 38 | D7b | D | Working time of the adhesive is exceeded | 0.445 | 4 | 495 | 3 | 220 | Med. | ||||||||
| 39 | D8a | D | Low pressure during the application of insulation plates | 0.253 | 2 | 807 | 5 | 204 | High | 901 | 5 | 228 | High | ||||
| 40 | D8b | D | Low pressure during the application of insulation plates | 0.397 | 4 | 587 | 4 | 233 | High | ||||||||
| 41 | D9a | D | Large unevenness of the adhesive layer | 0.231 | 2 | 585 | 4 | 135 | Med. | 653 | 4 | 151 | Med. | ||||
| 42 | D9b | D | Large unevenness of the adhesive layer | 0.320 | 3 | 569 | 4 | 182 | Med. | ||||||||
| 43 | M9a | D | Low temperature (freezing) during application and/or curing process | 0.425 | 4 | 308 | 2 | 131 | Med. | 344 | 2 | 146 | Med. | ||||
| 44 | M9b | D | Low temperature (freezing) during application and/or curing process | 0.523 | 5 | 376 | 3 | 196 | High | ||||||||
| 45 | M10a | D | High temperature (hot) during the curing process | 0.305 | 3 | 474 | 3 | 144 | Med. | 528 | 3 | 161 | Med. | ||||
| 46 | M10b | D | High temperature (hot) during the curing process | 0.405 | 4 | 458 | 3 | 185 | Med. | ||||||||
| 47 | M11a | D | Low humidity (dry) during the curing process | 0.260 | 3 | 706 | 4 | 184 | Med. | 788 | 5 | 205 | High |
Table A3.
Data (3).
| Sequence | ID | Layer | Factor | SV | SV-C | ERPN (Sim1) | ERPN-C (Sim1) | TER (Sim1) | TER-C (Sim1) | ERPN (Sim2) | ERPN-C (Sim2) | TER (Sim2) | TER-C (Sim2) | ERPN (Sim3) | ERPN-C (Sim3) | TER (Sim3) | TER-C (Sim3) |
|---|---|---|---|---|---|---|---|---|---|---|---|---|---|---|---|---|---|
| 48 | M11b | D | Low humidity (dry) during the curing process | 0.366 | 3 | 684 | 4 | 250 | Med. | ||||||||
| 49 | M8 | D | Not recommended ingredients added to the mixture | 0.466 | 4 | 457 | 3 | 213 | Med. | 473 | 3 | 220 | Med. | 528 | 3 | 246 | Med. |
| 50 | I1 | I | Polystyrene is exposed to UV radiation for an extended period | 0.401 | 4 | 170 | 1 | 68 | Med. | 176 | 1 | 71 | Med. | ||||
| 51 | I2 | I | Insulation plates installed shortly after manufacturing (unfinished diffusion) | 0.263 | 3 | 597 | 4 | 157 | Med. | 618 | 4 | 162 | Med. | ||||
| 52 | I3a | I | Mineral wool insulation plates have very high relative humidity (wet) | 0.304 | 3 | 326 | 2 | 99 | Med. | ||||||||
| 53 | I3b | I | Insulation plates have very high relative humidity (wet) | 0.136 | 2 | 438 | 3 | 60 | Med. | 454 | 3 | 62 | Med. | ||||
| 54 | I4 | I | Continuous gaps between the substrate and insulation material | 0.532 | 5 | 437 | 3 | 233 | High | 453 | 3 | 241 | High | 505 | 3 | 269 | High |
| 55 | I5 | I | Corners of neighboring insulation plates are crossed or too close | 0.230 | 2 | 268 | 2 | 62 | Low | 277 | 2 | 64 | Low | 309 | 2 | 71 | Low |
| 56 | I6 | I | Corners of the openings have crossed joints | 0.277 | 3 | 327 | 2 | 91 | Med. | 338 | 2 | 94 | Med. | 377 | 3 | 105 | Med. |
| 57 | I7 | I | Insulation plates’ joint width of neighboring insulation plates is too wide | 0.208 | 2 | 144 | 1 | 30 | Low | 149 | 1 | 31 | Low | 167 | 1 | 35 | Low |
| 58 | I8 | I | Large height difference between neighboring insulation plates | 0.195 | 2 | 389 | 3 | 76 | Med. | 403 | 3 | 79 | Med. | 449 | 3 | 88 | Med. |
| 59 | I9 | I | Broken areas of the insulation plates are not filled with the same material | 0.217 | 2 | 268 | 2 | 58 | Low | 278 | 2 | 60 | Low | 310 | 2 | 67 | Low |
| 60 | I10 | I | Missing or narrow fire-retardant areas | 0.218 | 2 | 184 | 2 | 40 | Low | 191 | 2 | 42 | Low | ||||
| 61 | A1 | A | Increased diameter of the drilled anchor hole | 0.423 | 4 | 275 | 2 | 117 | Med. | 275 | 2 | 117 | Med. | ||||
| 62 | A10 | A | Hole of the anchor is not cleaned | 0.235 | 2 | 195 | 2 | 46 | Low | 195 | 2 | 46 | Low | ||||
| 63 | A5 | A | Location of anchors is not as foreseen | 0.261 | 3 | 139 | 1 | 36 | Low | 139 | 1 | 36 | Low | ||||
| 64 | A3 | A | Decreased amount of anchors in the continuous areas | 0.355 | 3 | 193 | 2 | 68 | Med. | 193 | 2 | 68 | Med. | ||||
| 65 | A8 | A | Decreased amount of anchors in the corner areas | 0.392 | 4 | 138 | 1 | 54 | Med. | 138 | 1 | 54 | Med. | ||||
| 66 | A9 | A | Usage of unsuitable anchor type | 0.452 | 4 | 327 | 2 | 148 | Med. | 327 | 2 | 148 | Med. | ||||
| 67 | A2 | A | Decreased diameter of the anchor plate | 0.338 | 3 | 82 | 1 | 28 | Low | 82 | 1 | 28 | Low | ||||
| 68 | A6 | A | Anchor plate is installed too deeply into the insulation material | 0.219 | 2 | 148 | 1 | 32 | Low | 148 | 1 | 32 | Low | ||||
| 69 | A7 | A | Anchor plate is placed too high on the surface of the insulation material | 0.246 | 2 | 110 | 1 | 27 | Low | 110 | 1 | 27 | Low | ||||
| 70 | R1 | R | External layer of the insulation plate is too smooth, reducing adhesion | 0.395 | 4 | 374 | 3 | 148 | Med. | 374 | 3 | 148 | Med. |
Table A4.
Data (4).
| Sequence | ID | Layer | Factor | SV | SV-C | ERPN (Sim1) | ERPN-C (Sim1) | TER (Sim1) | TER-C (Sim1) | ERPN (Sim2) | ERPN-C (Sim2) | TER (Sim2) | TER-C (Sim2) | ERPN (Sim3) | ERPN-C (Sim3) | TER (Sim3) | TER-C (Sim3) |
|---|---|---|---|---|---|---|---|---|---|---|---|---|---|---|---|---|---|
| 71 | M1c | R | Unsuitable material storage conditions | 0.494 | 4 | 188 | 2 | 93 | Med. | 188 | 2 | 93 | Med. | 188 | 2 | 93 | Med. |
| 72 | M2c | R | The mixing procedures do not remove clots | 0.391 | 4 | 166 | 1 | 65 | Med. | 166 | 1 | 65 | Med. | 166 | 1 | 65 | Med. |
| 73 | M3c | R | High share of kneading water | 0.469 | 4 | 248 | 2 | 116 | Med. | 248 | 2 | 116 | Med. | 248 | 2 | 116 | Med. |
| 74 | M4c | R | Low share of kneading water | 0.418 | 4 | 228 | 2 | 95 | Med. | 228 | 2 | 95 | Med. | 228 | 2 | 95 | Med. |
| 75 | R6 | R | Thin mortar layer | 0.580 | 5 | 338 | 2 | 196 | High | 338 | 2 | 196 | High | 338 | 2 | 196 | High |
| 76 | R2 | R | Decreased overlap of the mesh | 0.358 | 3 | 327 | 2 | 117 | Med. | 327 | 2 | 117 | Med. | 327 | 2 | 117 | Med. |
| 77 | R3 | R | Folded mesh | 0.254 | 3 | 156 | 1 | 40 | Low | 156 | 1 | 40 | Low | 156 | 1 | 40 | Low |
| 78 | R4 | R | Missing diagonal mesh | 0.328 | 3 | 313 | 2 | 103 | Med. | 313 | 2 | 103 | Med. | 313 | 2 | 103 | Med. |
| 79 | R5 | R | Mesh not filled with mortar, placed on the edge of the layer | 0.413 | 4 | 291 | 2 | 120 | Med. | 291 | 2 | 120 | Med. | 291 | 2 | 120 | Med. |
| 80 | R7 | R | Layer is not applied in wet-to-wet conditions | 0.354 | 3 | 466 | 3 | 165 | Med. | 466 | 3 | 165 | Med. | 466 | 3 | 165 | Med. |
| 81 | R8 | R | Usage of incompatible mesh | 0.458 | 4 | 255 | 2 | 117 | Med. | 255 | 2 | 117 | Med. | 255 | 2 | 117 | Med. |
| 82 | M9c | R | Low temperature (freezing) during application and/or curing process | 0.633 | 5 | 203 | 2 | 129 | High | 203 | 2 | 129 | High | 203 | 2 | 129 | High |
| 83 | M10c | R | High temperature (hot) curing conditions | 0.447 | 4 | 245 | 2 | 110 | Med. | 245 | 2 | 110 | Med. | 245 | 2 | 110 | Med. |
| 84 | M11c | R | Low humidity (dry) curing conditions | 0.446 | 4 | 188 | 2 | 84 | Med. | 188 | 2 | 84 | Med. | 188 | 2 | 84 | Med. |
| 85 | M12c | R | Usage of winter mixtures during unsuitable weather conditions | 0.326 | 3 | 184 | 2 | 60 | Med. | 184 | 2 | 60 | Med. | 184 | 2 | 60 | Med. |
| 86 | X6 | X | Shock resistance solution is not used (i.e., no double reinforcement mesh, corner details with metal or additional protective plate installed) | 0.300 | 3 | 511 | 3 | 153 | Med. | 529 | 3 | 159 | Med. | 590 | 4 | 177 | Med. |
| 87 | F2 | F | Reinforcement mixture or primary coat is not cured | 0.252 | 2 | 169 | 1 | 43 | Low | 169 | 1 | 43 | Low | 169 | 1 | 43 | Low |
| 88 | F1 | F | Missing primer if required | 0.219 | 2 | 86 | 1 | 19 | Low | 86 | 1 | 19 | Low | 86 | 1 | 19 | Low |
| 89 | M1d | F | Unsuitable material storage conditions | 0.557 | 5 | 73 | 1 | 41 | Med. | 73 | 1 | 41 | Med. | 73 | 1 | 41 | Med. |
| 90 | M2d | F | The mixing procedures do not remove clots | 0.454 | 4 | 56 | 1 | 26 | Med. | 56 | 1 | 26 | Med. | 56 | 1 | 26 | Med. |
| 91 | M3d | F | High share of kneading water | 0.510 | 5 | 23 | 1 | 12 | Med. | 23 | 1 | 12 | Med. | 23 | 1 | 12 | Med. |
| 92 | F3 | F | Thick render layer/differences in thickness | 0.183 | 2 | 56 | 1 | 10 | Low | 56 | 1 | 10 | Low | 56 | 1 | 10 | Low |
| 93 | F4 | F | Thin render layer | 0.283 | 3 | 69 | 1 | 20 | Low | 69 | 1 | 20 | Low | 69 | 1 | 20 | Low |
| 94 | M9d | F | Low temperature (freezing) during application and/or curing process | 0.595 | 5 | 42 | 1 | 25 | Med. | 42 | 1 | 25 | Med. | 42 | 1 | 25 | Med. |
Table A5.
Data (5).
| Sequence | ID | Layer | Factor | SV | SV-C | ERPN (Sim1) | ERPN-C (Sim1) | TER (Sim1) | TER-C (Sim1) | ERPN (Sim2) | ERPN-C (Sim2) | TER (Sim2) | TER-C (Sim2) | ERPN (Sim3) | ERPN-C (Sim3) | TER (Sim3) | TER-C (Sim3) |
|---|---|---|---|---|---|---|---|---|---|---|---|---|---|---|---|---|---|
| 95 | M10d | F | High temperature (hot) curing conditions | 0.439 | 4 | 87 | 1 | 38 | Med. | 87 | 1 | 38 | Med. | 87 | 1 | 38 | Med. |
| 96 | M11d | F | Low humidity (dry) curing conditions | 0.445 | 4 | 105 | 1 | 47 | Med. | 105 | 1 | 47 | Med. | 105 | 1 | 47 | Med. |
| 97 | X1 | X | Structural expansion joint is not installed/finished properly | 0.288 | 3 | 245 | 2 | 71 | Med. | 254 | 2 | 73 | Med. | 283 | 2 | 81 | Med. |
| 98 | X2 | X | Windowsill is not appropriately finished (i.e., curved upwards, proper sealants) | 0.392 | 4 | 561 | 4 | 220 | High | 580 | 4 | 228 | High | 648 | 4 | 254 | High |
| 99 | X3 | X | Unsolved rainwater drainage (i.e., drainpipe or drip profiles not used) | 0.459 | 4 | 351 | 2 | 161 | Med. | 363 | 2 | 166 | Med. | 405 | 3 | 186 | Med. |
| 100 | X4 | X | Fixed frame connection is not finished accurately (i.e., missing sealants) | 0.333 | 3 | 562 | 4 | 187 | Med. | 582 | 4 | 194 | Med. | 649 | 4 | 216 | Med. |
| 101 | X5 | X | Roof edge covers are not installed correctly (i.e., vertical detail too short) | 0.225 | 2 | 507 | 3 | 114 | Med. | 525 | 3 | 118 | Med. | 586 | 4 | 132 | Med. |
| 102 | X7 | X | Unfinished penetrations through the system (i.e., fixed without sealants) | 0.389 | 4 | 397 | 3 | 154 | Med. | 411 | 3 | 160 | Med. | 458 | 3 | 178 | Med. |
| 103 | X8 | X | Unsuitable plinth detail solutions (i.e., incorrect fixing, overlapping of details) | 0.280 | 3 | 356 | 2 | 100 | Med. | 368 | 3 | 103 | Med. | 411 | 3 | 115 | Med. |
References
- European Parliament. Directive 2012/27/EU of the european parliament and of the council of 25 October 2012 on energy efficiency. Off. J. Eur. Union 2012, 10, 1–56. [Google Scholar]
- European Parliament. Directive 2002/91/EC of the european parliament and of the council of 16 December 2002 on the energy performance of buildings. Off. J. Eur. Union 2002, OJ L 1, 65–71. [Google Scholar]
- Amaro, B.; Saraiva, D.; de Brito, J.; Flores-Colen, I. Statistical survey of the pathology, diagnosis and rehabilitation of ETICS in walls. J. Civ. Eng. Manag. 2014, 20, 1–16. [Google Scholar] [CrossRef]
- Künzel, H.; Künzel, H.M.; Sedlbauer, K. Long-term performance of external thermal insulation systems (ETICS). Acta Archit. 2006, 5, 11–24. [Google Scholar]
- Böhmer, H.; Simon, J. Schäden beim Energieeffizienten Bauen; Institute for Building Research (Institut für Bauforschung) e.V.: Hannover, Germany, 8 December 2011. [Google Scholar]
- Neumann, H.-H. Praxis Handbuch Wärmedämm-Verbundsysteme. Baustoffkunde, Verarbeitung, Schäden, Sanierung; Rudolf Müller: Cologne, Germany, 2009. [Google Scholar]
- Sulakatko, V.; Vogdt, F.U. Construction process technical impact factors on degradation of the external thermal insulation composite system. Sustainability 2018, 10, 3900. [Google Scholar] [CrossRef]
- European parliament. Regulation of the european parliament and of the council of 9 March 2011 laying down harmonised conditions for the marketing of construction products and repealing council directive 89/106/EEC. Off. J. Eur. Union 2011, 305, 43–88. [Google Scholar]
- European Organisation for Technical Approvals. ETAG 004 Guideline for European Technical Approval of External Thermal Insulation Composite Systems with Rendering; EOTA: Brussels, Belgium, 27 June 2013. [Google Scholar]
- Cziesielski, E.; Vogdt, F.U. Schäden an Wärmedämm-Verbundsystemen, 2nd ed.; Fraunhofer IRB: Stuttgart, Germany, 2007. [Google Scholar]
- Kussauer, R.; Ruprecht, M. Die Häufigsten Mängel bei Beschichtungen und WDVS, 2nd ed.; Rudolf Müller GmbH & Co. KG: Cologne, Germany, 1 July 2011. [Google Scholar]
- Arizzi, A.; Viles, H.; Cultrone, G. Experimental testing of the durability of lime-based mortars used for rendering historic buildings. Constr. Build. Mater. 2012, 28, 807–818. [Google Scholar] [CrossRef]
- Nilica, R.; Harmuth, H. Mechanical and fracture mechanical characterization of building materials used for external thermal insulation composite systems. Cem. Concr. Res. 2005, 35, 1641–1645. [Google Scholar] [CrossRef]
- Zirkelbach, D.; Künzel, H.M.; Slanina, P. Einfluss von Undichtheiten bei der Sanierung von Plattenbauten mit Wärmedämm-Verbundsystemen. WTA-Almanach 2008, 285–297. [Google Scholar]
- Skitmore, R.M.; Marston, V. Cost Modelling; Routledge: New York, NY, USA, 24 June 1999. [Google Scholar]
- Woodward, D.G. Life cycle costing—Theory, information acquisition and application. Int. J. Proj. Manag. 1997, 15, 335–344. [Google Scholar] [CrossRef]
- Shafiee, M.; Dinmohammadi, F. An FMEA-based risk assessment approach for wind turbine systems: A comparative study of onshore and offshore. Energies 2014, 7, 619–642. [Google Scholar] [CrossRef] [Green Version]
- Rhee, S.J.; Ishii, K. Using cost based FMEA to enhance reliability and serviceability. Adv. Eng. Inform. 2003, 17, 179–188. [Google Scholar] [CrossRef]
- Carmignani, G. An integrated structural framework to cost-based FMECA: The priority-cost FMECA. Reliab. Eng. Syst. Saf. 2009, 94, 861–871. [Google Scholar] [CrossRef]
- Bowles, J.B. An assessment of RPN prioritization in a failure modes effects and criticality analysis. In Proceedings of the Annual Reliability and Maintainability Symposium, Tampa, FL, USA, 27–30 January 2003. [Google Scholar]
- Pillay, A.; Wang, J. Modified failure mode and effects analysis using approximate reasoning. Reliab. Eng. Syst. Saf. 2003, 79, 69–85. [Google Scholar] [CrossRef]
- Sulakatko, V.; Lill, I.; Soekov, E.; Arhipova, R.; Witt, E.; Liisma, E. Towards nearly zero-energy buildings through analyzing reasons for degradation of facades. Procedia Econ. Financ. 2014, 18, 592–600. [Google Scholar] [CrossRef]
- Wissenschaftlich-Technische Arbeitsgemeinschaft für Bauwerkserhaltung und Denkmalpflege e.V. WTA Merkblatt 2–13: Wärmedämm-Verbundsysteme (WDVS). Wartung, Instandsetzung, Verbesserung.; Fraunhofer IRB Verlag: Stuttgart, Germany, January 2016. [Google Scholar]
- European Organisation for Technical Approvals. ETAG 014 Guideline for European Technical Approval of Plastic Anchors for Fixing of External Thermal Insulation Composite Systems with Rendering; EOTA: Brussels, Belgium, 15 March 2011. [Google Scholar]
- Estonian Centre for Standardisation. EVS-EN 13499: 2003 Thermal Insulation Products for Buildings—External Thermal Insulation Composite Systems (ETICS) Based on Expanded Polystyrene—Specification; EVS: Tallinn, Estonia, 17 September 2003. [Google Scholar]
- Estonian Centre for Standardisation. EVS-EN 13500:2004 Thermal Insulation Products for Buildings—External Thermal Insulation Composite Systems (ETICS) Based on Mineral Wool—Specification; EVS: Tallinn, Estonia, 23 November 2004. [Google Scholar]
- Bochen, J.; Gil, S.; Szwabowski, J. Influence of ageing process on porosity changes of the external plasters. Cem. Concr. Compos. 2005, 27, 769–775. [Google Scholar] [CrossRef]
- Collina, A.; Lignola, G.P. The External Thermal Insulation Composite System (ETICS): More than Comfort and Energy Saving. In Proceedings of the 3rd Portuguese Congress on Construction Mortars, Lisbon, Portugal, 18–19 March 2010. [Google Scholar]
- D’Orazioa, M.; Cursioa, G.; Graziania, L.; Aquilantib, L.; Osimanib, A.; Clementib, F.; Yéprémianc, C.; Laricciad, V.; Amoroso, S. Effects of water absorption and surface roughness on the bioreceptivity of ETICS compared to clay bricks. Build. Environ. 2014, 77, 20–28. [Google Scholar] [CrossRef]
- Daniotti, B.; Paolini, R. Evolution of Degradation and Decay in Performance of ETICS. In Proceedings of the 11th International Conference on Durability of Building Materials and Components, Istanbul, Turkey, 11–14 May 2008. [Google Scholar]
- Fernandes, L.; Silva, V.; Ferreira, V.M.; Labrincha, J.A. Influence of the kneading water content in the behaviour of single-coat mortars. Cem. Concr. Res. 2005, 35, 1900–1908. [Google Scholar] [CrossRef]
- Holm, A.; Künzel, H.M. Combined effect of temperature and humidity on the deterioration process of insulation materials in ETICS. In Proceedings of the 5th Symposium on Building Physics in the Nordic Countries, Gothenburg, Sweden, 24–26 August 1999. [Google Scholar]
- Künzel, H.M.; Gertis, K. Plattenbausanierung durch Außendämmung. Wie wichtig ist die Dampfdurchlässigkeit des Dämmsystems? IBP-Mitteilung 1996, 23, 23–24. [Google Scholar]
- Künzel, H.M.; Wieleba, R. Specific building-physical properties of ETICS on mineral-wool basis. In Proceedings of the 4th Congresso Português de de Argamassas e ETICS, Coimbra, Portugal, 30–31 March 2012. [Google Scholar]
- Norvaišiene, R.; Burlingis, A.; Stankeviˇcius, V. Impact of acidic precipitation to ageing of painted facades’ rendering. Build. Environ. 2007, 42, 254–262. [Google Scholar] [CrossRef]
- Norvaišiene, R.; Griciute, G.; Bliudžius, R. The changes of moisture absorption properties during the service life of external thermal insulation composite system. Mater. Sci. 2013, 19, 1–5. [Google Scholar] [CrossRef]
- Pakkala, T.; Suonketo, J. Hygrothermal Behaviour Testing of External Thermal Insulation Composite Systems with Rendering in Nordic Climate. In Proceedings of the 12th International Conference on Durability of Building Materials and Components, Porto, Portugal, 12–15 April 2011. [Google Scholar]
- Schrepfer, T. Faserbewehrte Putze auf hochdämmenden Untergründen. Bauphysik 2008, 30, 117–122. [Google Scholar] [CrossRef]
- Silva, C.M.; Flores-Colen, I.; Gaspar, S. Numerical analysis of renders’ adhesion using an interface model. Constr. Build. Mater. 2013, 38, 292–305. [Google Scholar] [CrossRef]
- Simões, N.; Simões, I.; Serra, C.; Tadeu, A. Thermographic inspection of external thermal insulation systems with mechanical fixing. In Proceedings of the SPIE Sensing Technology + Applications, Baltimore, MD, USA, 12 May 2015. [Google Scholar]
- Zirkelbach, D.; Holm, A.; Künzel, H. Influence of temperature and relative humidity on the durability of mineral wool in ETICS. In Proceedings of the 10DBMC International Conference On Durability of Building Materials and Components, Lyon, France, 7–20 April 2005. [Google Scholar]
- Topcu, D.; Merkel, H. Durability of External Wall Insulation Systems with Extruded Polystyrene Insulation Boards. In Proceedings of the 11th International Conference on Durability of Building Materials and Components, Istanbul, Turkey, 11–14 May 2008. [Google Scholar]
- Vallee, F.; Blanchard, N.; Rubaud, M.; Gandini, A. Investigation on the behaviour of polymer-cement composites in ETICS renderings. Durab. Build. Mater. Compon. 1999, 1–4, 1070–1080. [Google Scholar]
- Yin, X.; Li, H.; Haitao, B.; Ke, H. Weatherability studies on external insulation thermal system of expanded polystyrene board, polystyrene granule and polyurethane foam. J. Wuhan Univ. Technol. Sci. 2010, 25, 1027–1032. [Google Scholar] [CrossRef]
- Annila, P.J.; Pakkala, T.A.; Suonketo, J.; Lahdensivu, J. Examining of weather resistance of ETICS with stresses which correspond to weather conditions in Finland. In Proceedings of the International Conference on Ageing of Materials & Structures, Delft, The Netherlands, 26–28 May 2014. [Google Scholar]
- Pikkuvirta, J.; Annila, P.J.; Suonketo, J. New test method for wind-driven rain penetration of ETICS. In Proceedings of the International Conference on Ageing of Materials & Structures, Delft, The Netherlands, 26–28 May 2014. [Google Scholar]
- Balayssac, J.P.; Nicot, P.; Ruot, B.; Devs, O.; Détriché, C.H. Influence of admixtures on the cracking sensitivity of mortar layers applied to a mineral substrate. Constr. Build. Mater. 2011, 25, 2828–2836. [Google Scholar] [CrossRef]
- Barberousse, H.; Ruot, B.; Yéprémian, C.; Boulon, G. An assessment of façade coatings against colonisation by aerial algae and cyanobacteria. Build. Environ. 2007, 42, 2555–2561. [Google Scholar] [CrossRef]
- Barreira, E.; de Freitas, V.P. Experimental study of the hygrothermal behaviour of External Thermal Insulation Composite Systems (ETICS). Build. Environ. 2013, 63, 31–39. [Google Scholar] [CrossRef]
- Bochen, J. Study on the microstructure of thin-layer facade plasters of thermal insulating system during artificial weathering. Constr. Build. Mater. 2009, 23, 2559–2566. [Google Scholar] [CrossRef]
- Bochen, J.; Gil, S. Properties of pore structure of thin-layer external plasters under ageing in simulated environment. Constr. Build. Mater. 2009, 23, 2958–2963. [Google Scholar] [CrossRef]
- Flores-Colen, I.; de Brito, J.; Branco, F. In situ adherence evaluation of coating materials. Exp. Tech. 2009, 33, 51–60. [Google Scholar] [CrossRef]
- Gaspar, P.L.; de Brito, J. Limit states and service life of cement renders on façades. J. Mater. Civ. Eng. 2011, 23, 1396–1404. [Google Scholar] [CrossRef]
- Johansson, S.; Wadsö, L.; Sandin, K. Estimation of mould growth levels on rendered façades based on surface relative humidity and surface temperature measurements. Build. Environ. 2010, 45, 1153–1160. [Google Scholar] [CrossRef]
- Korjenic, A.; Steuer, R.; Št’Astník, S.; Vala, J.; Bednar, T. Beitrag zur Lösung des Problems der Algenbildung auf Außenwänden mit Wärmedämmverbundsystemen (WDVS). Bauphysik 2009, 31, 343–353. [Google Scholar] [CrossRef]
- Künzel, H.M. Austrocknung von Wandkonstruktionen mit Wärmedämm-Verbundsystemen. Bauphysik 1998, 20, 18–23. [Google Scholar]
- Künzel, H.M. Außendämmung bei Bestandsbauten Schäden, Ursachen, Instandsetzungen. Schäden Beim Energieeffizienten Bauen 2010, 45, 37–45. [Google Scholar]
- Künzel, H.M.; Fitz, C. Bauphysikalische Eigenschaften und Beanspruchung von Putzoberflächen und Anstrichstoffen H. WTA-Schriftenreihe 2004, 28, 49–72. [Google Scholar]
- Zillig, W.; Lenz, K.; Sedlbauer, K.; Krus, M. Condensation on facades—Influence of construction type and orientation. In Proceedings of the 2nd International Conference on Building Physics, Leuven, Belgium, 14–18 September 2003; pp. 437–444. [Google Scholar]
- Amaro, B.; Saraiva, D.; De Brito, J.; Flores-Colen, I. Inspection and diagnosis system of ETICS on walls. Constr. Build. Mater. 2013, 47, 1257–1267. [Google Scholar] [CrossRef]
- Barreira, E.; De Freitas, V.P. External thermal insulation composite systems: Critical parameters for surface hygrothermal behaviour. Adv. Mater. Sci. Eng. 2014, 2014, 650752. [Google Scholar] [CrossRef]
- Barreira, E.; de Freitas, V.P. The effect of nearby obstacles in surface condensations on external thermal insulation composite systems: Experimental and numerical study. J. Build. Phys. 2014, 37, 269–295. [Google Scholar] [CrossRef]
- Breuer, K.; Hofbauer, W.; Krueger, N.; Mayer, F.; Scherer, C.; Schwerd, R.; Sedlbauer, K. Wirksamkeit und Dauerhaftigkeit von Bioziden in Bautenbeschichtungen. Bauphysik 2012, 34, 170–182. [Google Scholar] [CrossRef]
- Edis, E.; Türkeri, N. Durability of external thermal insulation composite systems in Istanbul Turkey. ITU J. Fac. Arch. 2012, 9, 134–148. [Google Scholar]
- Chan, A.P.C.; Yung, E.H.K.; Lam, P.T.I.; Tam, C.M.; Cheung, S.O. Application of Delphi method in selection of procurement systems for construction projects. Constr. Manag. Econ. 2001, 19, 699–718. [Google Scholar] [CrossRef]
- Olson, K. An examination of questionnaire evaluation by expert reviewers. Field Methods 2010, 22, 295–318. [Google Scholar] [CrossRef]
- Hallowell, M.R.; Gambatese, J.A. Qualitative research: Application of the Delphi method to CEM research. J. Constr. Eng. Manag. 2010, 136, 99–107. [Google Scholar] [CrossRef]
- Ameyaw, E.E.; Hu, Y.; Shan, M.; Chan, A.P.C.; Le, Y. Application of Delphi method in construction engineering and management research: A quantitative perspective. J. Civ. Eng. Manag. 2016, 22, 991–1000. [Google Scholar] [CrossRef]
- Rowe, G.; Wright, G. Expert opinions in forecasting: The role of the Delphi technique. Princ. Forecast. 2001, 30, 125–144. [Google Scholar]
- Aurnhammer, H.E. Verfahren zur Bestimmung von Wertminderung bei (Bau-)Mängeln und (Bau-)Schäden. Baurecht 1978, 5, 48–56. [Google Scholar]
- O’Gorman, T.W. A comparison of the F-test, Friedman’s test, and several aligned rank tests for the analysis of randomized complete blocks. J. Agric. Biol. Environ. Stat. 2001, 6, 367–378. [Google Scholar] [CrossRef]
- McCrum-Gardner, E. Which is the correct statistical test to use? Br. J. Oral Maxillofac. Surg. 2008, 46, 38–41. [Google Scholar] [CrossRef] [PubMed]
- Skulmoski, G.J.; Hartman, F.T. The Delphi method for graduate research. J. Inf. Technol. Educ. 2007, 6, 1–21. [Google Scholar] [CrossRef]
- Li, W.; Zhu, J.; Zhu, Z. The Energy-saving benefit evaluation methods of the grid construction project based on life cycle cost theory. Energy Procedia 2012, 17, 227–232. [Google Scholar] [CrossRef]
- Eurostat. Construction Cost Index (CCI). 2018. Available online: http://ec.europa.eu/eurostat/tgm/refreshTableAction.do?tab=table&plugin=1&pcode=teiis510&language=en (accessed on 18 July 2018).
- Eurostat. HICP All-Items, Development of The annual Average Inflation Rates, 2005–2015. Online Data Codes: Prc_hicp_aind and prc_ipc_a. 2017. Available online: http://appsso.eurostat.ec.europa.eu/nui/submitViewTableAction.do (accessed on 17 January 2017).
- Bank of Estonia. Interest Rates. 2017. Available online: http://statistika.eestipank.ee/?lng=et#listMenu/1071/treeMenu/FINANTSSEKTOR/147/979 (accessed on 17 January 2017).
- Krus, M.; Künzel, H.M. Untersuchungen zum Feuchteverhalten von Fassaden nach Hydrophobierungsmaßnahmen. WTA J. 2003, 2, 149–166. [Google Scholar]
- Serpell, A.F. Towards a knowledge-based assessment of conceptual cost estimates. Build. Res. Inf. 2004, 32, 157–164. [Google Scholar] [CrossRef]
- Popov, G.; Lyon, B.K.; Hollcroft, B. Risk Assessment: A Practical Guide to Assessing Operational Risks; John Wiley & Sons, Inc.: Hoboken, NJ, USA, 2016. [Google Scholar]
- Ni, H.; Chen, A.; Chen, N. Some extensions on risk matrix approach. Saf. Sci. 2010, 48, 1269–1278. [Google Scholar] [CrossRef]
Figure 1.
The framework of the technical–economic relevance (TER) model.

Figure 2.
The research design of the technical–economic relevance (TER) model.

Figure 3.
Demographics of the experts included in various areas of research.

Figure 4.
The weight distribution of the severity categories [7].
Figure 4.
The weight distribution of the severity categories [7].

Figure 5.
Relevance matrix.

Figure 6.
Average of the weighted technical severity value (SV) and economic risk priority number (ERPN) by layers.
Figure 6.
Average of the weighted technical severity value (SV) and economic risk priority number (ERPN) by layers.

Figure 7.
Number and share of degradation factors in risk categories for (a) simulation 1, (b) simulation 2, and (c) simulation 3.
Figure 7.
Number and share of degradation factors in risk categories for (a) simulation 1, (b) simulation 2, and (c) simulation 3.

Figure 8.
Average technical–economic relevance (TER) value of the simulations by layers.

Figure 9.
The positioning of the degradation factors’ risk categories on the risk matrix.

Figure 10.
Technical–economic relevance (TER) values and risk categories of the degradation factors by the sequence of construction works.
Figure 10.
Technical–economic relevance (TER) values and risk categories of the degradation factors by the sequence of construction works.

Figure 11.
Count and share of degradation factors distributed by the 2-year latency period and risk category.
Figure 11.
Count and share of degradation factors distributed by the 2-year latency period and risk category.

Figure 12.
Distribution of the high- and medium-risk category degradation factors by layer and by latency period of (a) less than two years and (b) equal to or more than two years.
Figure 12.
Distribution of the high- and medium-risk category degradation factors by layer and by latency period of (a) less than two years and (b) equal to or more than two years.

Table 1.
Characteristics of the simulations.
| Simulation No. | ETICS Type | Insulation Type | Insulation Thickness | Fixing Method |
|---|---|---|---|---|
| Simulation 1 | ETICS 1 | Polystyrene | 200 mm | Purely bonded kit |
| Simulation 2 | ETICS 2 | Polystyrene | 200 mm | Mechanically fixed kit with supplementary adhesive |
| Simulation 3 | ETICS 3 | Mineral wool | 200 mm | Mechanically fixed kit with supplementary adhesive |
Table 2.
The comparative ratio of initial construction and repair costs.
| Description of Construction Work | Simulation 1 | Simulation 2 | Simulation 3 |
|---|---|---|---|
| The initial construction ETICS | 1.00 | 1.08 | 1.30 |
| Replacement of insulation | 1.74 | 1.80 | 2.01 |
| Replacement of reinforcement layer | 1.11 | 1.11 | 1.11 |
| Replacement of finishing layer | 0.50 | 0.50 | 0.50 |
Table 3.
Categorization of the economic risk priority number (ERPN) and weighted technical severity values (SV).
Table 3.
Categorization of the economic risk priority number (ERPN) and weighted technical severity values (SV).
| Category | Risk Description | ERPN | SV |
|---|---|---|---|
| 5 | very high | 728.2 < ERPNDF < 910.2 | 0.506 < SVDF < 0.633 |
| 4 | high | 546.1 < ERPNDF < 728.1 | 0.380 < SVDF < 0.505 |
| 3 | medium | 364.2 < ERPNDF < 546.1 | 0.253 < SVDF < 0.379 |
| 2 | low | 182.0 < ERPNDF < 364.1 | 0.127 < SVDF < 0.252 |
| 1 | very low | ERPNDF < 182.0 | SVDF < 0.126 |
© 2018 by the author. Licensee MDPI, Basel, Switzerland. This article is an open access article distributed under the terms and conditions of the Creative Commons Attribution (CC BY) license (http://creativecommons.org/licenses/by/4.0/).
Share and Cite
MDPI and ACS Style
Sulakatko, V. Modelling the Technical–Economic Relevance of the ETICS Construction Process. Buildings 2018, 8, 155. https://0-doi-org.brum.beds.ac.uk/10.3390/buildings8110155
AMA Style
Sulakatko V. Modelling the Technical–Economic Relevance of the ETICS Construction Process. Buildings. 2018; 8(11):155. https://0-doi-org.brum.beds.ac.uk/10.3390/buildings8110155
Chicago/Turabian StyleSulakatko, Virgo. 2018. "Modelling the Technical–Economic Relevance of the ETICS Construction Process" Buildings 8, no. 11: 155. https://0-doi-org.brum.beds.ac.uk/10.3390/buildings8110155
Note that from the first issue of 2016, this journal uses article numbers instead of page numbers. See further details here.