Article

Arachidonic Acid Evokes an Increase in Intracellular Ca2+ Concentration and Nitric Oxide Production in Endothelial Cells from Human Brain Microcirculation

1
Biomedicine School, Benemerita Universidad Autonoma de Puebla, 72000 Puebla, Mexico
2
Laboratory of General Physiology, Department of Biology and Biotechnology “L. Spallanzani”, University of Pavia, 27100 Pavia, Italy
3
Research Center, Salahaddin University, Erbil 44001, Iraq
4
Department of Life Sciences and Systems Biology, University of Torino, 10123 Torino, Italy
5
Department of Surgical Sciences, University of Torino, 10126 Torino, Italy
*
Author to whom correspondence should be addressed.
These authors contributed equally to this manuscript.
Submission received: 21 June 2019 / Revised: 4 July 2019 / Accepted: 8 July 2019 / Published: 9 July 2019
(This article belongs to the Special Issue Phospholipids: Dynamic Lipid Signaling in Health and Diseases)

Abstract

:
It has long been known that the conditionally essential polyunsaturated arachidonic acid (AA) regulates cerebral blood flow (CBF) through its metabolites prostaglandin E2 and epoxyeicosatrienoic acid, which act on vascular smooth muscle cells and pericytes to vasorelax cerebral microvessels. However, AA may also elicit endothelial nitric oxide (NO) release through an increase in intracellular Ca2+ concentration ([Ca2+]i). Herein, we adopted Ca2+ and NO imaging, combined with immunoblotting, to assess whether AA induces intracellular Ca2+ signals and NO release in the human brain microvascular endothelial cell line hCMEC/D3. AA caused a dose-dependent increase in [Ca2+]i that was mimicked by the not-metabolizable analogue, eicosatetraynoic acid. The Ca2+ response to AA was patterned by endoplasmic reticulum Ca2+ release through type 3 inositol-1,4,5-trisphosphate receptors, lysosomal Ca2+ mobilization through two-pore channels 1 and 2 (TPC1-2), and extracellular Ca2+ influx through transient receptor potential vanilloid 4 (TRPV4). In addition, AA-evoked Ca2+ signals resulted in robust NO release, but this signal was considerably delayed as compared to the accompanying Ca2+ wave and was essentially mediated by TPC1-2 and TRPV4. Overall, these data provide the first evidence that AA elicits Ca2+-dependent NO release from a human cerebrovascular endothelial cell line, but they seemingly rule out the possibility that this NO signal could acutely modulate neurovascular coupling.

1. Introduction

The 20-carbon omega-6 polyunsaturated fatty acid (PUFA) arachidonic acid (AA) is incorporated in the plasma membrane esterified to phospholipids at the second alcohol of glycerol in the sn-2 position and exerts multiple homeostatic, structural, and signalling functions [1]. AA is released from the membrane pool by the activation of three distinct phospholipases, A2, C, and D, upon cell stimulation to exert either an autocrine and/or a paracrine effect on adjoining cells [1,2]. For instance, synaptically released glutamate activates N-methyl-d-aspartate receptors (NMDARs), thereby raising intracellular Ca2+ levels within the dendritic tree and recruiting the Ca2+-dependent enzyme phospholipase A2 (PLA2). Neuronal PLA2, in turn, mobilizes AA from membrane phospholipids; hereafter, AA is converted by cyclooxygenase-2 (COX-2) into prostaglandin E2 (PGE2) to relax cerebral microvessels [3]. Likewise, neuronal activity causes an increase in astrocytic Ca2+ concentration, which also recruits PLA2 to stimulate the synthesis of a number of AA-derived metabolites that serve as vasodilatory mediators. These include PGE2 and epoxyeicosatrienoic acids (EETs) that are produced by COX-1 and cytochrome P450 epoxygenase [2,4], respectively. Alternately, astrocyte-derived AA is released onto neighbouring vascular smooth muscle cells (VSMCs) or pericytes where it can be metabolized into the vasoconstrictor 20-hydroxyeicosatetraenoic acid (20-HETE) by cytochrome P450 4A2 [2,4,5,6]. AA is thus regarded as a key regulator of neurovascular coupling (NVC), the mechanism whereby neuronal activity results in the elevation of local cerebral blood flow (CBF), which is indispensable to maintain proper supply of oxygen and nutrients to active brain regions [2,3,4,7]. For instance, the hemodynamic response to whisker stimulation in the somatosensory cortex was dramatically impaired by inhibiting the production of PGE2 and EETs by, respectively, pyramidal neurons and astrocytes [8]. Conversely, only EETs were responsible for the elevation in CBF evoked by stimulation of basal forebrain cholinergic neurons [9]. On the other hand, 20-HETE has been shown to induce capillary vasoconstriction in both the molecular [10] and granular [5] layer of the cerebellum, depending on the presence of nitric oxide (NO), that suppresses cytochrome P450 4A2 activity [2].
A recent series of studies demonstrated that cerebral endothelial cells, which line the lumen of brain microvessels and are in close apposition to both astrocyte end-feet and neuronal projections within the neurovascular unit, may also translate neuronal activity into NO-dependent vasodilation [11,12,13]. For instance, the neurotransmitter acetylcholine triggers a biphasic increase in intracellular Ca2+ concentration ([Ca2+]i) which leads to the recruitment of Ca2+/calmodulin (CaM)-sensitive endothelial NO synthase (eNOS) in hCMEC/D3 cells [14], which are a widely utilized human brain microvascular endothelial cell line [15]. Likewise, acetylcholine and glutamate were found to induce repetitive oscillations in [Ca2+]i and NO production in mouse brain microvascular endothelial cells [14,16]. The Ca2+ response to extracellular neurotransmitters in cerebrovascular endothelial cells is mainly mediated by inositol-1,4,5-trisphosphate (InsP3) receptors (InsP3Rs) and two-pore channels 1 and 2 (TPC1-2), which mediate Ca2+ release from endoplasmic reticulum (ER) and lysosomes, respectively, and by store-operated Ca2+ entry (SOCE), a widespread Ca2+-permeable route activated following depletion of the ER Ca2+ reservoir [14,16,17]. Intriguingly, it has long been known that AA directly induces Ca2+-dependent NO release in vascular endothelial cells [18,19,20,21] and endothelial colony-forming cells (ECFCs) [22]. The Ca2+ response to AA is shaped by multiple components of the endothelial Ca2+ toolkit, including InsP3Rs and TPC1, which mediate endogenous Ca2+ release, respectively, and transient receptor potential vanilloid 4 (TRPV4), which mediates extracellular Ca2+ influx [18,19,20,21,23]. Conversely, AA is seemingly unable to activate SOCE [24,25,26]. A recent investigation suggested that AA may be converted by cytochrome P450 2U1 epoxygenase into 20-HETE also in hCMEC/D3 cells and rat brain microvessels [27]. Furthermore, a preliminary report showed that AA may trigger intracellular Ca2+ signals in primary human brain microvascular endothelial cells, but the underlying signalling pathway was not clearly elucidated and their ability to promote NO was not evaluated [23].
Herein, we investigated for the first time whether and how exogenous AA induces intracellular Ca2+ signalling and NO release in hCMEC/D3 cells. AA elicited a biphasic increase in [Ca2+]i which was shaped by endogenous Ca2+ release through type 3 inositol-1,4,5-trisphosphate receptor isoform (InsP3R3) and two-pore channels 1 and 2 (TPC1-2) and extracellular Ca2+ influx through TRPV4. We further demonstrated that AA induced robust Ca2+-dependent NO release. However, AA-induced NO production was remarkably delayed as compared to intracellular Ca2+ signalling. In addition, AA-induced NO release was mainly dependent upon TPC1-2 and TRPV4 activation rather than InsP3R3. Overall, these data provide the evidence that AA is able to induce intracellular Ca2+ signalling and NO release in human brain microvascular endothelial cells, although this NO release is seemingly too slow to account for the vasorelaxing effects of AA observed in vivo.

2. Materials and Methods

2.1. Cell Culture

Human cerebral microvascular endothelial cells (hCMEC/D3) were obtained from Institut National de la Santé et de la Recherche Médicale (INSERM, Paris, France) and cultured as extensively illustrated elsewhere [17]. Only hCMEC/D3 cells between passage 25 and 35 were employed in the present investigation. The cells were seeded at a concentration of 27,000 cells/cm2 and grown in tissue culture flasks coated with 0.1 mg/mL rat tail collagen type 1, in a medium having the following composition: EBM-2 medium (Lonza, Basel, Switzerland) supplemented with 5% foetal bovine serum, 1 ng/mL basic fibroblast growth factor, 1% penicillin–streptomycin, 5 μg/mL ascorbic acid, 1.4 μM hydrocortisone, 1/100 chemically defined lipid concentrate (Life Technologies, Milan, Italy), and 10 mM 4-(2-hydroxyethyl)-1-piperazineethanesulfonic acid (HEPES). The cells were cultured at 37 °C, 5% CO2 saturated humidity.

2.2. Solutions

The composition of the physiological salt solution (PSS) used to load the cells with the Ca2+- and NO-sensitive dyes and to bath the cells during recordings had the following composition: 150 mM NaCl, 6 mM KCl, 1.5 mM CaCl2, 1 mM MgCl2, 10 mM glucose, and 10 mM HEPES. In order to obtain an extracellular solution devoid of Ca2+ (0Ca2+), Ca2+ was substituted with 2 mM NaCl and 0.5 mM EGTA was added. Solutions were titrated to pH 7.4 with NaOH. The osmolality of PSS was measured with an osmometer (Wescor 5500, Wescor, Logan, UT, USA) and resulted to be 300–310 mOsm/L.

2.3. [Ca2+]i and NO Imaging

Ca2+ imaging was carried out as described elsewhere [17]. Briefly, hCMEC/D3 cells were loaded with 4 µM Fura-2 acetoxymethyl ester (Fura-2/AM; 1 mM stock in dimethyl sulfoxide) in PSS. The cells were maintained in the presence of Fura-2 for 30 min at 37 °C and 5% CO2 saturated humidity. After de-esterification in PSS, the coverslip (8 mm) was mounted on the bottom of a Petri dish and the cells observed by an upright epifluorescence Axiolab microscope (Carl Zeiss, Oberkochen, Germany) equipped with a Zeiss ×40 Achroplan objective (water immersion, 2.0 mm working distance, 0.9 numerical aperture). The cells were excited alternately at 340 and 380 nm by using a filter wheel (Lambda 10, Sutter Instrument, Novato, CA, USA). The emitted fluorescence was detected at 510 nm by using an Extended-ISIS CCD camera (Photonic Science, Millham, UK). Custom-made software, working in the LINUX environment, was used to drive the CCD camera and the filter wheel, and to measure and plot on-line the fluorescence from 15 to 25 rectangular “regions of interest” (ROI), each corresponding to well defined single cells. [Ca2+]i was monitored by measuring, for each ROI, the ratio of the mean fluorescence emitted at 510 nm when exciting alternatively at 340 and 380 nm (Ratio (F340/F380)). An increase in [Ca2+]i causes an increase in the ratio [17]. Ratio measurements were performed and plotted on-line every 3 s. The experiments were performed at room temperature (22 °C), as discussed in [28].
NO was measured as described in [17]. Briefly, hCMEC/D3 cells were loaded with the membrane permeable NO-sensitive dye 4-amino-5-methylamino-2’,7’-difluorofluorescein (DAF-FM) diacetate (10 µM) in PSS. The cells were maintained in the presence of DAF-FM for 1 h at 37 °C and 5% CO2 saturated humidity. Subsequently, the dye was de-esterified in PSS for a further hour. DAF-FM fluorescence was measured by using the same equipment described for Ca2+ recordings but with a different filter set, i.e., excitation at 480 nm and emission at 535 nm wavelength (emission intensity was shortly termed “NOi”). The changes in DAF-FM fluorescence induced by AA were recorded and plotted on-line every 5 s. Again, off-line analysis was performed by using custom-made macros developed by Microsoft Office Excel software. The experiments were performed at room temperature (22 °C).

2.4. Western Blotting

Semi-confluent adherent cells were carefully lysate by using ice-cold RIPA buffer (150 mM NaCl, 25 mM Tris-HCl pH 7.6, 1% sodium deoxycholate, 1% NP-40, and 0.1% SDS) adding protease inhibitor cocktail (Sigma-Aldrich, Milan, Italy). In order to determine the protein concentration, a bicinchoninic acid kit (Thermo Fisher Scientific, Waltham, MA, USA) was used following the manufacturer’s instructions. Antibodies against TRPV4 (ab94868; Abcam, Cambridge, UK) and antibodies anti–β-actin (Sigma-Aldrich) were used as indicated by the manufacturer. Chemiluminescence assays were conducted by using western blotting plus ECL (Perkin Elmer, Milano, Italy).

2.5. Statistical Analysis

All the data were obtained from hCMEC/D3 cells from no fewer than three independent experiments. The peak amplitude of AA-evoked Ca2+ signals was measured as the difference between the ratio at the Ca2+ peak and the mean ratio of 30 sec baseline before the peak. The dose–response relationship was fitted by using the following equation:
Y   =   100 1 + E C 50 [ AA ]
where Y is the amplitude of the Ca2+ response, [AA] is the AA concentration, and EC50 is the half-maximal effective concentration, i.e., the [AA] that elicited 50% of the maximal response.
The peak amplitude of AA-induced NO production was evaluated as the difference between the maximal increase in DAF-FM fluorescence and the average of 1 min baseline before the peak. Pooled data are given as average ± standard error (SE) and statistical significance (p  < 0.05) was evaluated by two-tailed Student’s t test for unpaired observations or one-way ANOVA analysis followed by the post-hoc Dunnett’s test as appropriate. Data relative to both Ca2+ and NO signals are summarized as mean  ±  SE, whereas the number of cells analysed for each condition is indicated in the corresponding bar histograms.

2.6. Chemicals

Fura-2/AM and DAF-FM were purchased from Molecular Probes (Molecular Probes Europe BV, Leiden, The Netherlands). GSK1016790A (GSK) was obtained from Tocris (Bristol, UK). All the chemicals were of analytical grade and obtained from Sigma Chemical Co. (St. Louis, MO, USA).

3. Results

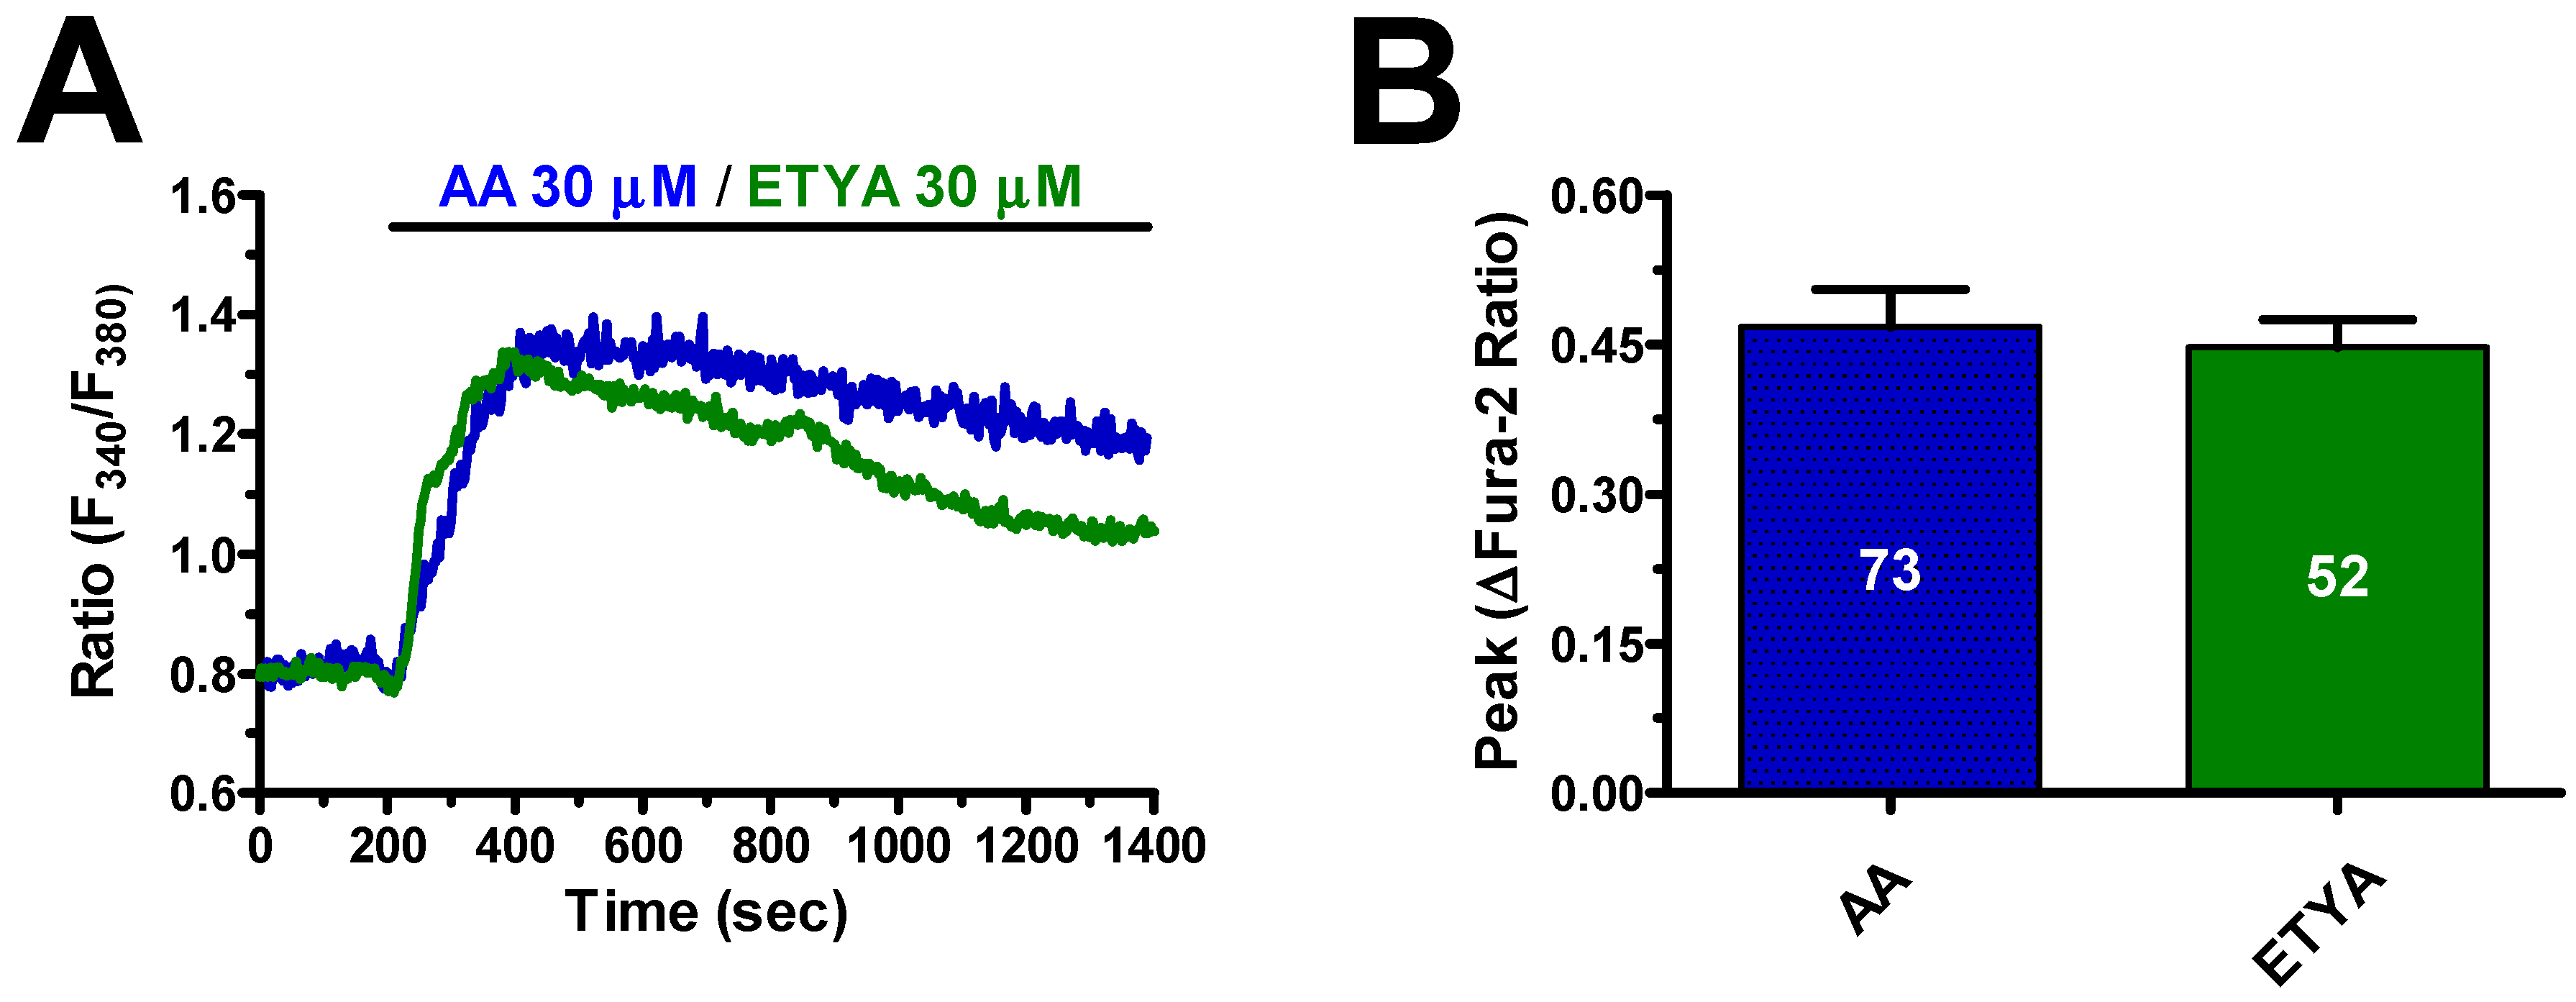
3.1. AA Triggers an Increase in [Ca2+]i in hCMEC/D3 Cells

In order to assess whether AA induces intracellular Ca2+ signals, hCMEC/D3 cells were loaded with the Ca2+-sensitive fluorophore, Fura-2, as described in paragraph 2.3. Neuronal activity leads to remarkable increase in synaptic AA concentration, which can rise up to 50–200 μM [29,30,31]. Accordingly, AA induced an increase in [Ca2+]i in hCMEC/D3 cells that started at 1 μM (Figure 1A), reached the maximal response at 300 μM, and whose dose–response relationship could be fitted by a sigmoidal curve with an EC50 of 8.4 μM (Figure 1B). A careful inspection of the Ca2+ traces revealed that 3 μM AA elicited a slow elevation in [Ca2+]i that remained stable during the continuous presence of the agonist in the bath (Figure 1A). Conversely, when applied at 30 μM and 300 μM, AA induced a rapid Ca2+ transient that slowly decayed to a sustained plateau of elevated [Ca2+]i (Figure 1A), as recently shown in ECFCs [22].
As synaptic AA concentration may achieve the mid-to-high micromolar range [29,30,31], we used 30 μM AA throughout the remainder of the study. The Ca2+ response to AA (30 μM) was reversible as, when AA was removed from the bath at the peak of the Ca2+ rise, the [Ca2+]i rapidly returned to the baseline, whereas the subsequent addition of AA raised intracellular Ca2+ levels again (Figure 1C). AA-induced endothelial Ca2+ signals may be triggered by many of its derivatives, such as 5,6- epoxyeicosatrienoic (5,6-EET) and 8,9-EET and leukotriene C4, which are synthesized, respectively, by cytochrome P450 epoxygenase and glutathione S-transferase 2 [32,33,34,35,36]. Therefore, we evaluated the Ca2+ response to the non-metabolized AA analogue, eicosatetraynoic acid (ETYA), as described in other types of endothelial cells [22,37]. As shown in Figure 2, ETYA (30 μM) induced an increase in [Ca2+]i whose kinetics and amplitude were similar to those of the Ca2+ signal induced by AA (30 μM) in the same batches of hCMEC/D3 cells (Figure 2A,B). Taken together, these findings demonstrate that AA has no need to be metabolized to induce intracellular Ca2+ signals in human brain microvascular endothelial cells.

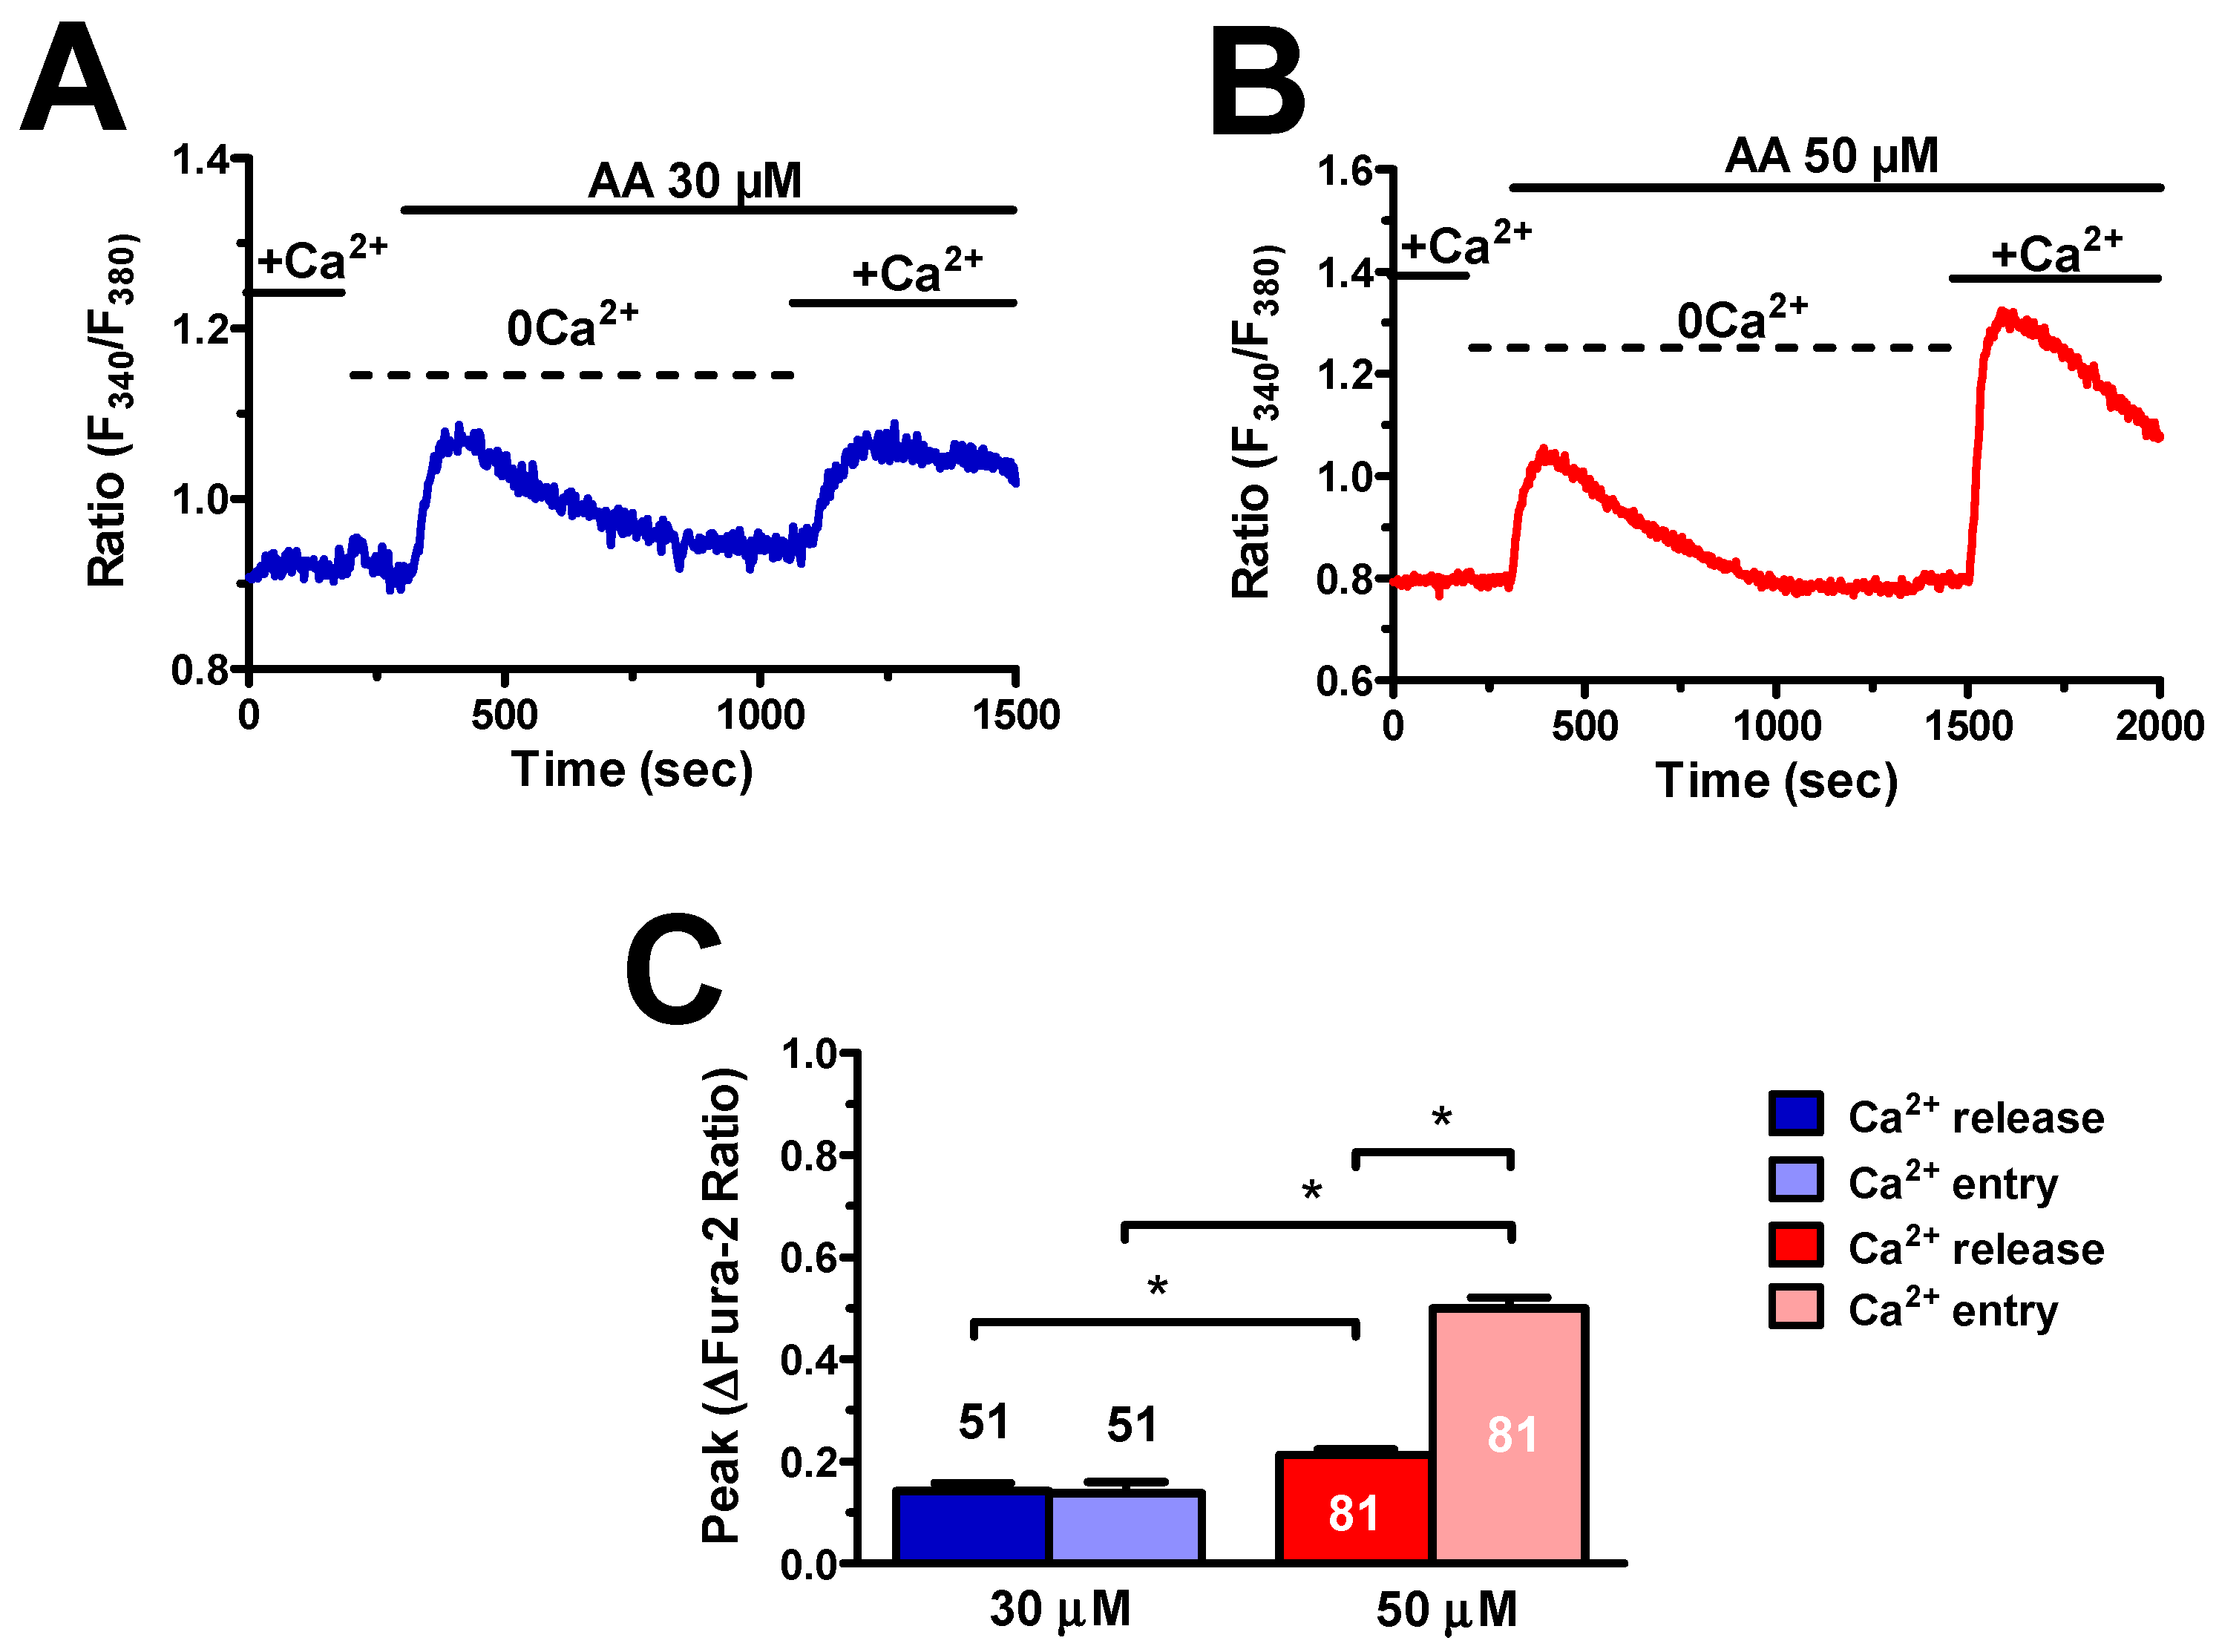
3.2. AA-Induced Intracellular Ca2+ Signals Required Endogenous Ca2+ Release and Extracellular Ca2+ Influx

As mentioned earlier, AA-induced endothelial Ca2+ signals impinge on endogenous Ca2+ release and extracellular Ca2+ influx [18,19,20,21]. In order to address this issue, we evaluated the Ca2+ response to AA in hCMEC/D3 cells in the absence of extracellular Ca2+ (0Ca2+), after which extracellular Ca2+ was restituted while maintaining the agonist in the perfusate. Under 0Ca2+ conditions, 30 μM AA induced a transient elevation in [Ca2+]i, which was due to Ca2+ mobilization from the intracellular stores, whereas reintroduction of external Ca2+ caused a second intracellular Ca2+ wave (Figure 3A), which was sustained by extracellular Ca2+ influx [22].
The same results were obtained when AA concentration was raised up to 50 μM (Figure 3B). As expected [22], endogenous Ca2+ release and extracellular Ca2+ influx were significantly (p < 0.05) higher at the highest AA concentration (Figure 3C). Overall, these findings demonstrate that intracellular Ca2+ release and extracellular Ca2+ influx mediate AA-evoked Ca2+ signals in hCMEC/D3 cells.

3.3. InsP3R3 and TPC1-2 Mediate AA-Induced Endogenous Ca2+ Release

Recent studies demonstrated that InsP3Rs and TPC1-2 mediate AA-induced endogenous Ca2+ release in human ECFCs [22] and rat pancreatic β cells [38]. Of note, a thorough characterization of their Ca2+ toolkit disclosed that hCMEC/D3 cells express only one of the three InsP3R isoforms, i.e. InsP3R3, and TPC1-2, while they lack InsP3R1-2 and RyR1-3 [17]. We first focused on the contribution of ER Ca2+ release through InsP3R3 to AA-induced intracellular Ca2+ release. As shown in Figure 4A, the endogenous Ca2+ response to AA (30 μM) was abrogated by 2-aminoethoxydiphenyl borate (2-APB) (50 μM, 20 min) (Figure 4B), which inhibits InsP3Rs under 0Ca2+ conditions [17,39], and by depletion of the ER Ca2+ content with cyclopiazonic acid (CPA) (10 μM) (Figure 4C). As previously described [17], CPA caused a transient elevation in [Ca2+]i by unmasking the passive ER Ca2+ leak followed by Ca2+ extrusion across the plasma membrane under 0Ca2+ conditions (Figure 4C). The following addition of AA (30 μM) under these conditions failed to increase the [Ca2+]i, thereby confirming the role of ER Ca2+ in AA-evoked intracellular Ca2+ response.
Next, we evaluated the contribution of lysosomal Ca2+ release through TPC1-2. The Ca2+ response to AA (30 μM) was prevented upon disruption of the lysosomal Ca2+ pool with glycyl-L-phenylalanine 2-naphthylamide (GPN) (200 μM) administered under 0Ca2+ conditions (Figure 4D). In addition, AA-evoked intracellular Ca2+ mobilization was suppressed by NED-19 (100 µM, 30 min) (Figure 4E), which selectively blocks TPC1-2 [17,40]. The statistical analysis of these results is shown in Figure 4F. In aggregate, these data provide the evidence that AA-evoked intracellular Ca2+ mobilization in hCMEC/D3 cells is mediated by InsP3R3 and TPC1-2.

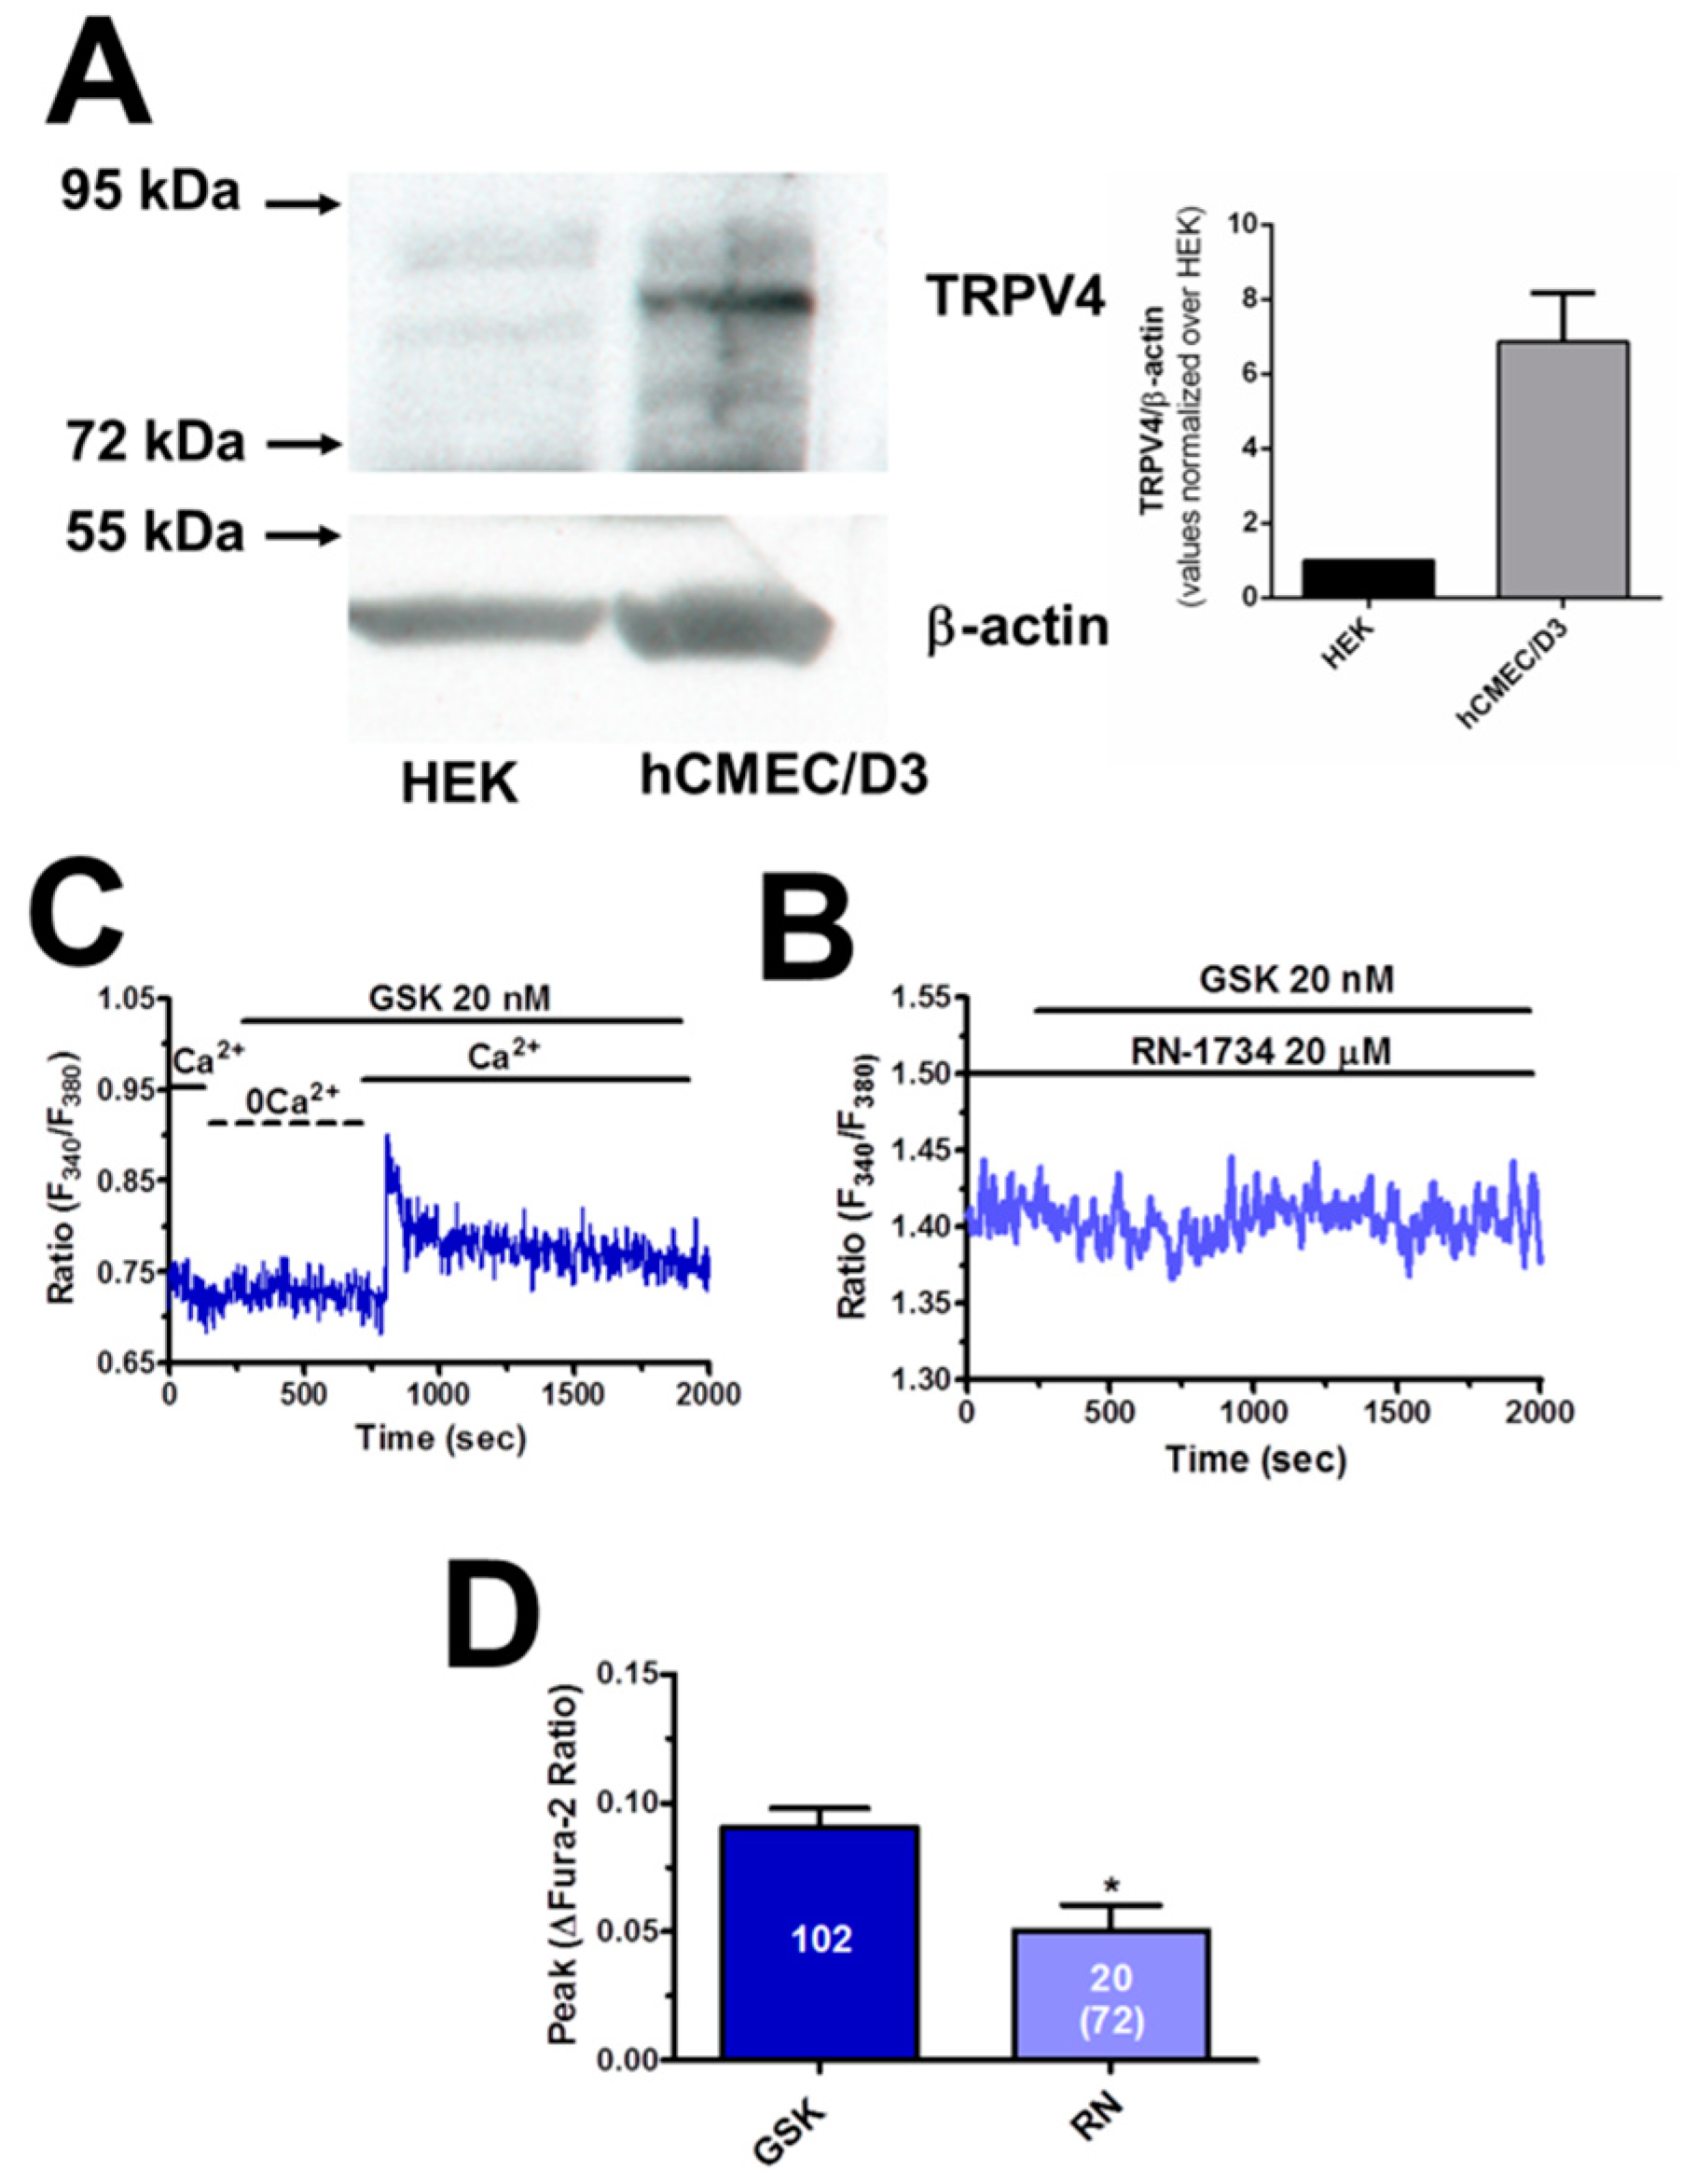
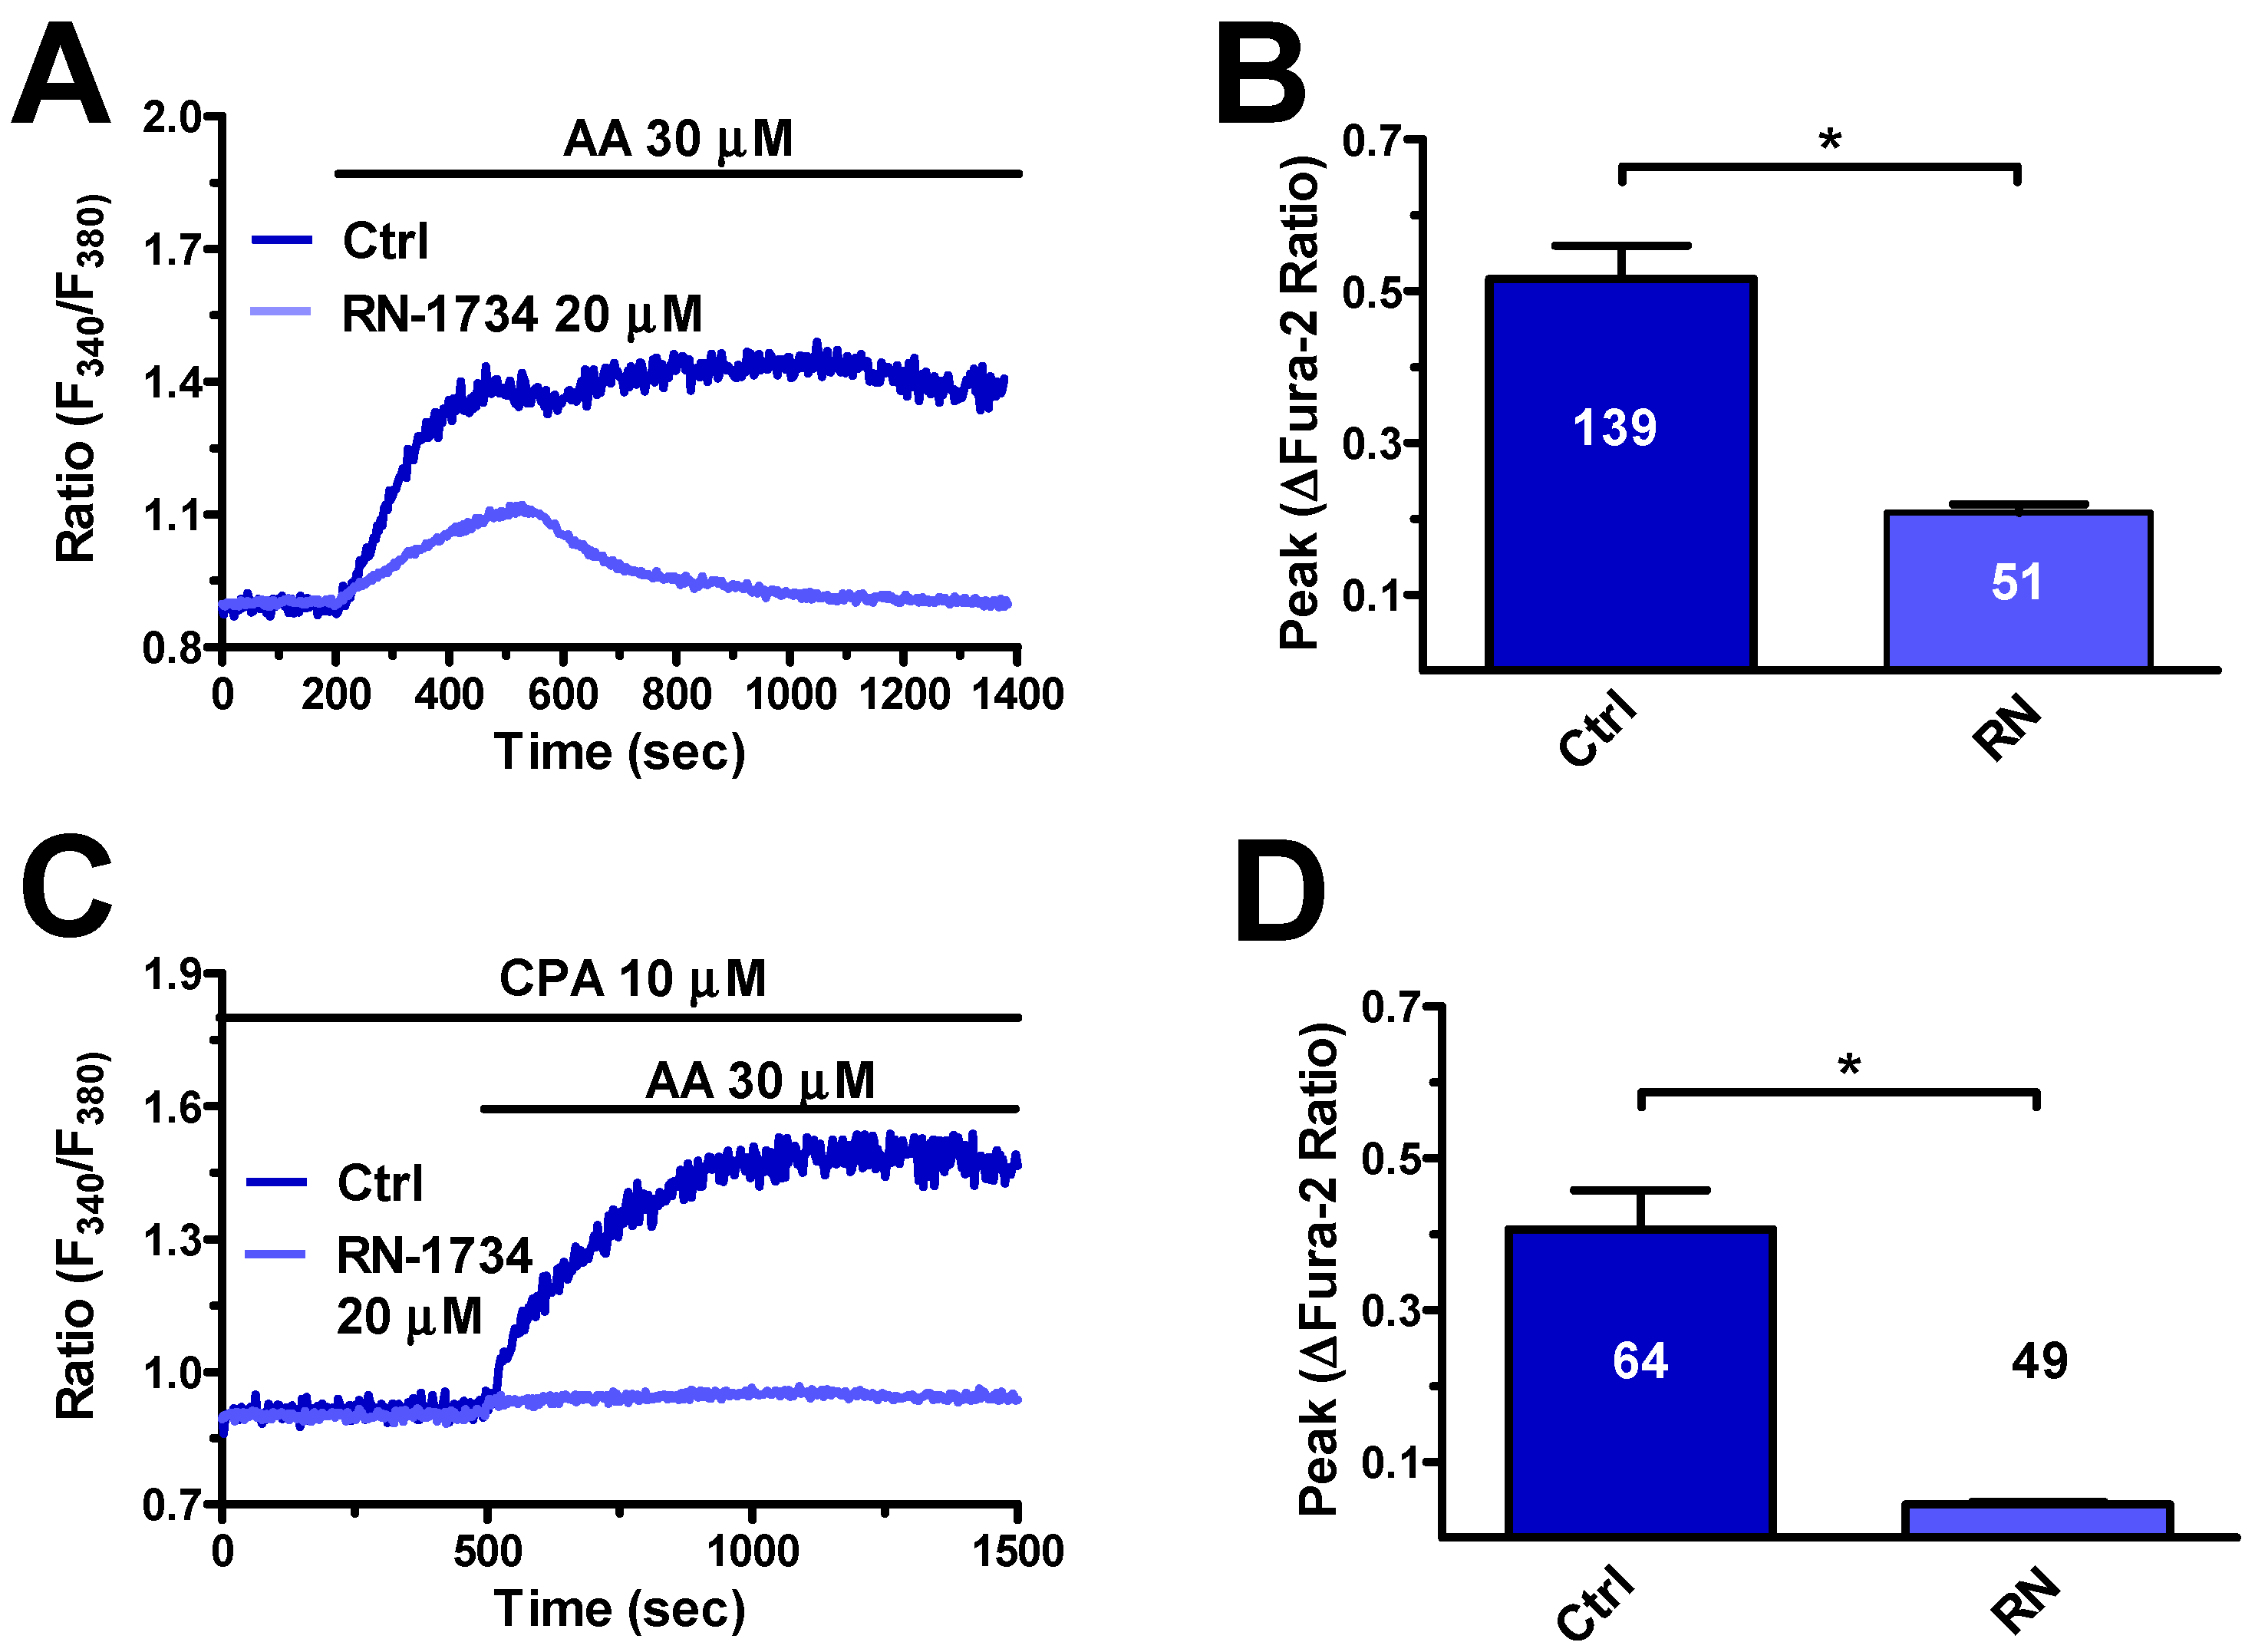
3.4. TRPV4 is Expressed and Mediates AA-Evoked Extracellular Ca2+ Influx

TRPV4 is virtually the only Ca2+-permeable pathway responsible for AA-induced extracellular Ca2+ influx in endothelial cells [22,37,43,44]. Therefore, we first assessed whether a functional TRPV4 protein was expressed in hCMEC/D3 cells. We carried out a Western Blot analysis by exploiting an affinity-purified antibody, which detected a major band at 91 kDa (Figure 5A), the expected molecular weight for TRPV4 [45]. Thereafter, we exposed hCMEC/D3 cells to GSK (20 nM), a specific TRPV4 agonist [45,46]. GSK (20 nM) caused a robust increase in [Ca2+]i in the presence, but not in the absence, of extracellular Ca2+ (Figure 5B), which is consistent with the notion that TRPV4 mediates extracellular Ca2+ influx. Notably, GSK-induced Ca2+ influx was suppressed by RN-1734 (20 μM, 20 min), a selective TRPV4 blocker [45,47], in the majority of the cells, whereas it was remarkably inhibited in the remaining (Figure 5C,D). These preliminary experiments provide the evidence that TRPV4 is expressed and mediates extracellular Ca2+ influx in hCMEC/D3 cells.
Next, we explored the role of TRPV4 in AA-evoked intracellular Ca2+ signals. In agreement with previous reports in endothelial cells [22,37,43,44], the pharmacological blockade of TRPV4 with RN-1734 (20 μM, 20 min) decreased the magnitude and curtailed the duration of AA-evoked Ca2+ response (Figure 6A,B). To further confirm this observation, we assessed whether AA could increase the [Ca2+]i after exhaustion of the ER Ca2+ pool and full SOCE activation with CPA (10 μM) in the presence of extracellular Ca2+. Accordingly, SOCE is elicited by pharmacological depletion of the ER Ca2+ reservoir with CPA and can no longer be activated if ER cisternae are not replenished with Ca2+ because of CPA-dependent SERCA inhibition [17,48]. Therefore, under these conditions, any extracellular stimulation will be able to increase the [Ca2+]i only by mainly acting on store-independent Ca2+-permeable channels, such as TRPV4, located on the plasma membrane [22,24]. Accordingly, previous experiments revealed that AA did not evoke any Ca2+ signal under 0Ca2+ conditions and following treatment with CPA (Figure 4C). Indeed, when AA (30 μM) was added upon SOCE activation with CPA (10 μM) for 30 min (early response to CPA not shown) in the presence of extracellular Ca2+, it elicited a sustained elevation in [Ca2+]i that was suppressed by RN-1734 (20 μM, 20 min) (Figure 6C,D). Therefore, these findings clearly show that TRPV4 mediates AA-induced Ca2+ influx in hCMEC/D3 cells.

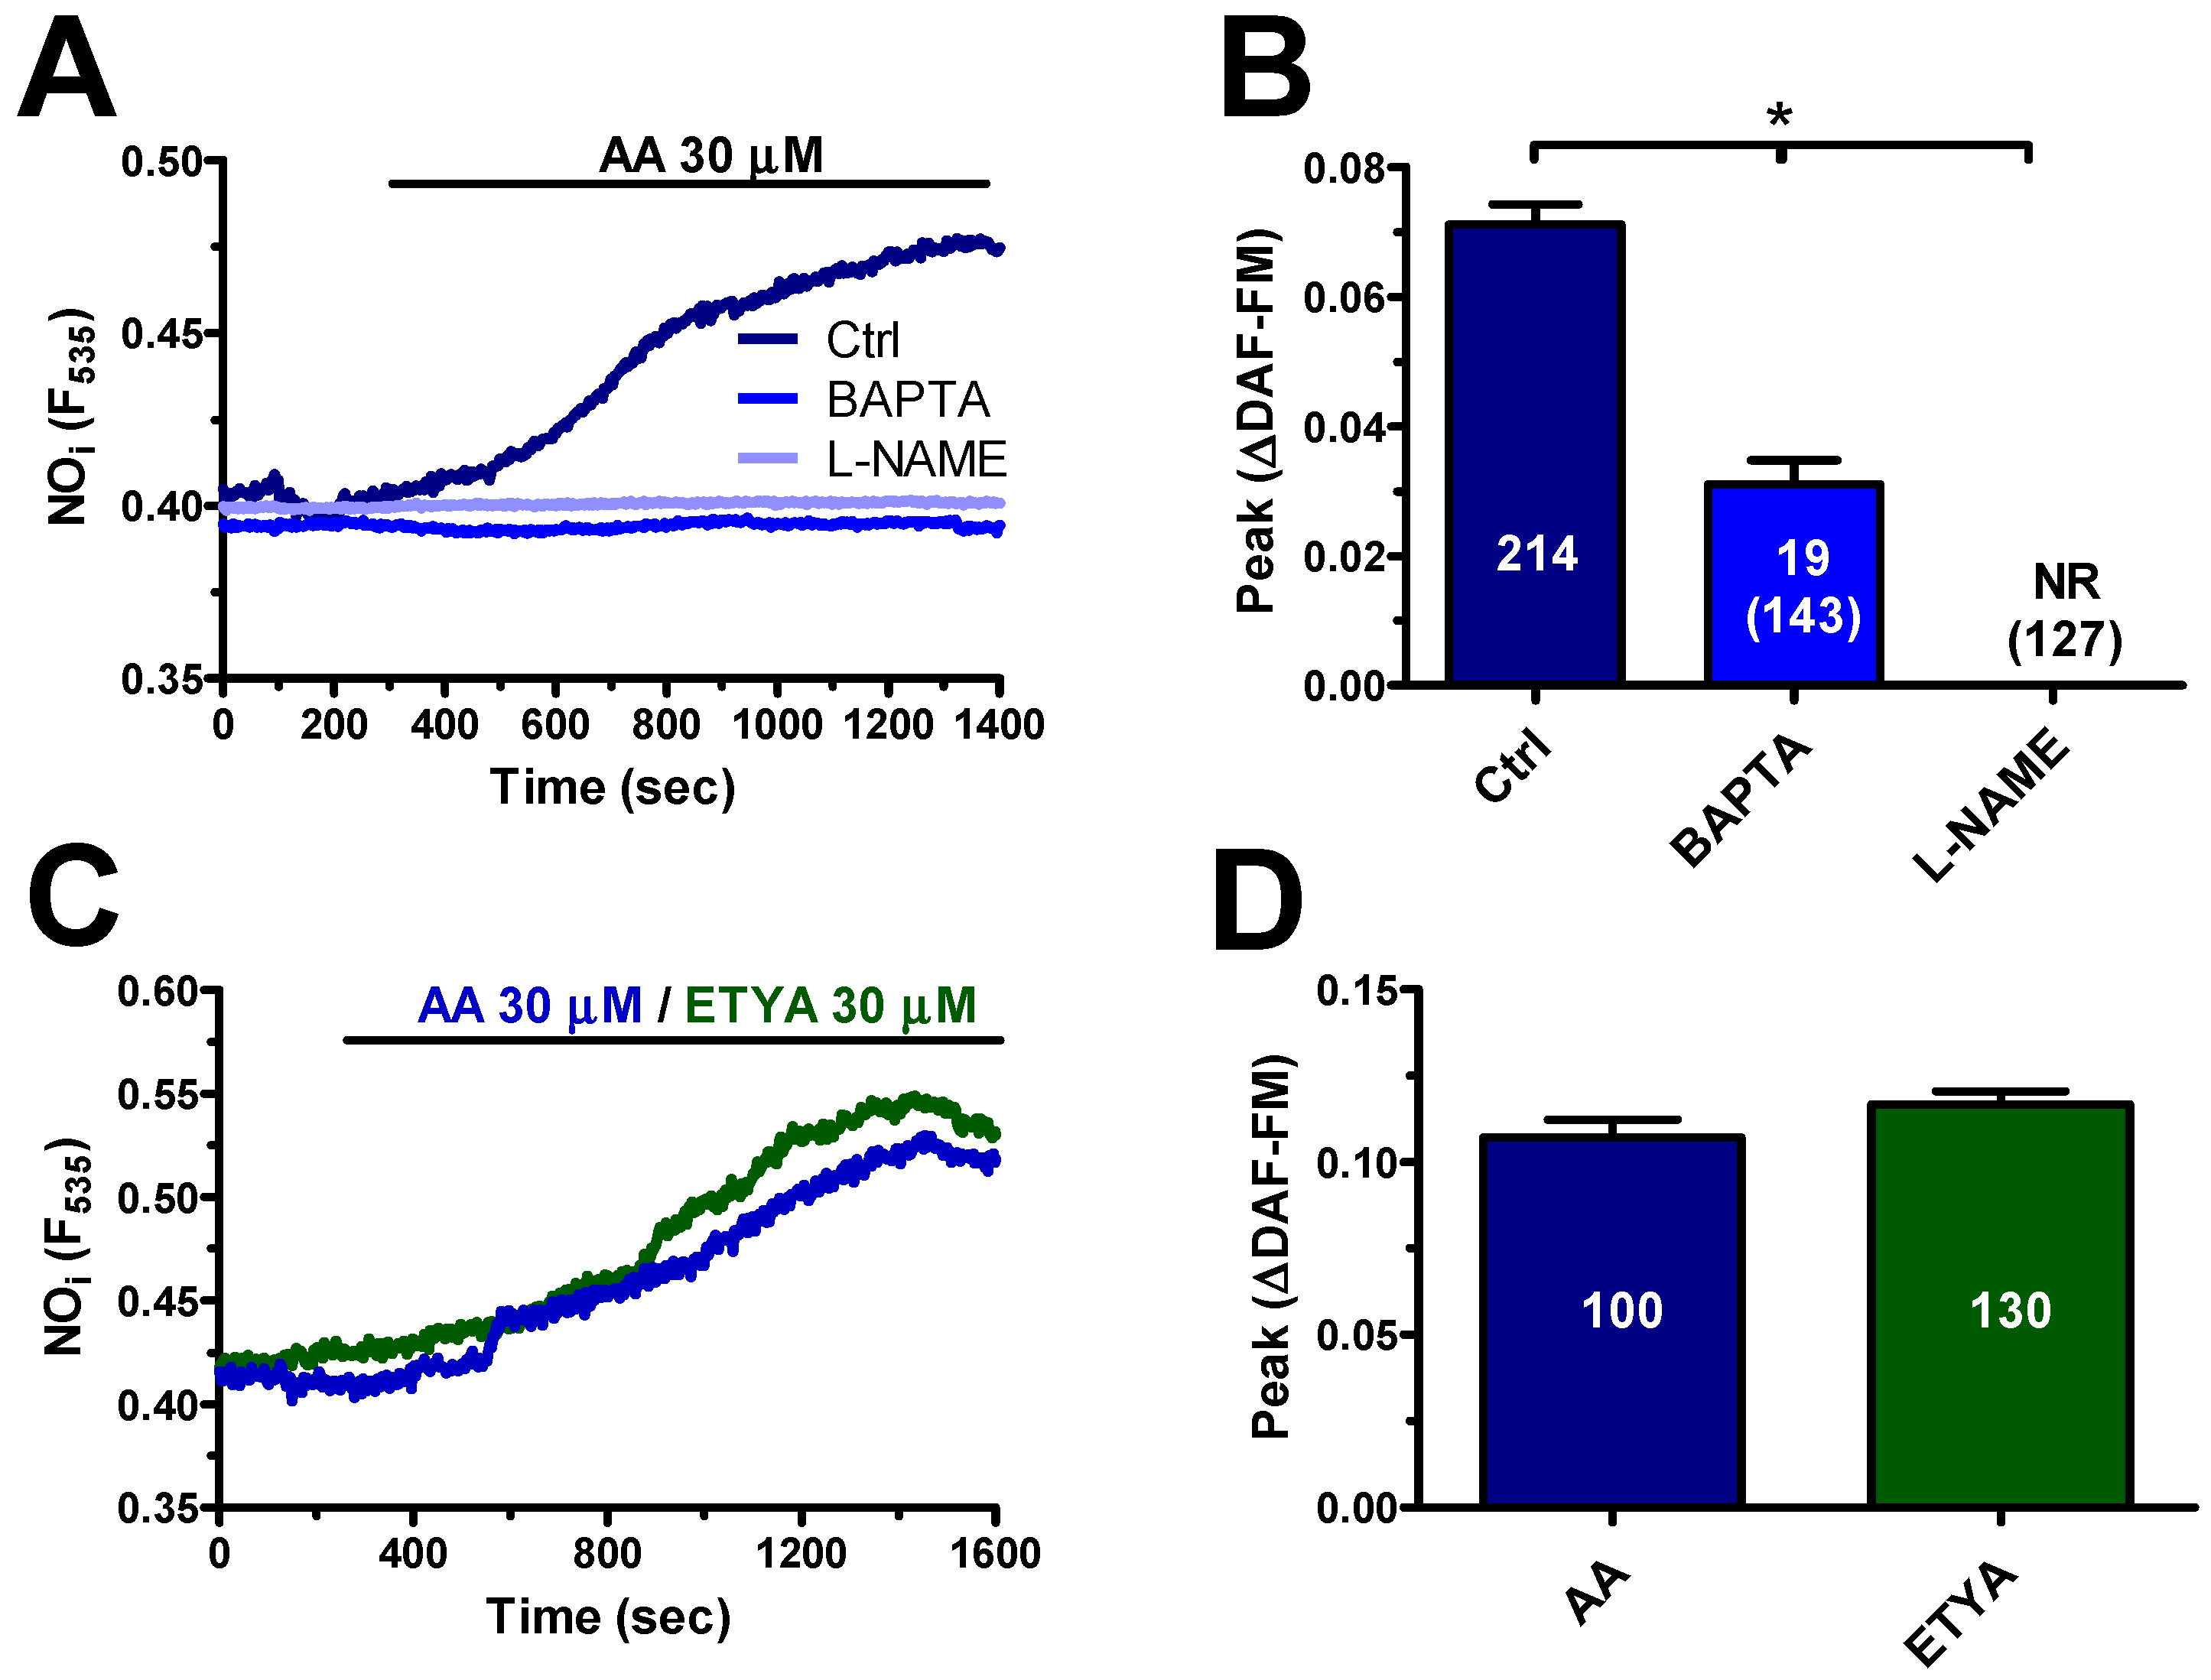
3.5. AA-Evoked Intracellular Ca2+ Signaling Drives NO Release in hCMEC/D3 Cells

In order to assess whether AA-evoked Ca2+ signalling results in NO release, hCMEC/D3 cells were loaded with the NO-sensitive dye, DAF-FM, as illustrated in Section 2.3. Unlike the neurotransmitter acetylcholine [17], AA (30 μM) elicited a delayed increase in DAF-FM fluorescence that significantly lagged behind the onset of the Ca2+ signal (Figure 7A): accordingly, the NO signal arose with a latency of 149.4 ± 6.2 sec (n = 368) and slowly increased with a time-to-peak of 1230 ± 39 sec (n = 339). AA-elicited NO release was abrogated by L-NG-Nitro-L-arginine methyl ester (L-NAME) (100 µM, 1 h) (Figure 7B), a widely employed NOS inhibitor [22,49], or 1,2-Bis(2-aminophenoxy)ethane-N,N,N′,N′-tetraacetic acid tetrakis(acetoxymethyl ester) (BAPTA) (30 µM, 2 h) (Figure 7A), a membrane-permeant buffer of Ca2+ levels [22,49]. Notably, ETYA (30 μM) induced an increase in DAF-FM fluorescence whose kinetics and magnitude were again overlapping with those of the signal elicited by AA (30 μM) (Figure 7B). These data, therefore, indicate that AA-evoked Ca2+ signalling results in NO release also in hCMEC/D3 cells.
In order to dissect the contribution of extra- and intracellular Ca2+ sources to NO production, hCMEC/D3 cells were challenged with AA (30 μM) under 0Ca2+ conditions. Removal of external Ca2+ significantly (p < 0.05) reduced AA-elicited NO release, whereas restoration of extracellular Ca2+ levels caused a further elevation in DAF-FM fluorescence (Figure 8B). Accordingly, also the pharmacological blockage of TRPV4 with RN-1734 (20 μM, 30 min) remarkably impaired AA-elicited NO synthesis (Figure 8C). We adopted the same pharmacological strategy as that described in Section 3.3 to dissect the contribution of the ER and lysosomal Ca2+ stores to AA-induced NO release. Surprisingly, inhibition of InsP3R3 with 2-APB (50 μM, 20 min) (Figure 8D) and depletion of the ER Ca2+ store with CPA (10 μM, 30 min) (Figure 8E) did not affect the NO signal. Conversely, preventing lysosomal Ca2+ release through TPC1-2 with GPN (200 µM, 30 min) (Figure 8F) and NED-19 (100 µM, 30 min) (Figure 8G) abolished AA-induced NO release. Altogether, these findings strongly suggest that TPC1-2 and TRPV4 are mainly responsible for the Ca2+-dependent recruitment of eNOS induced by AA in hCMEC/D3 cells. However, the slow kinetics of NO release are not compatible with a direct involvement of AA in NVC.

4. Discussion

Herein, we demonstrate for the first time that the conditionally essential PUFA AA is able to elicit NO release from a human brain microvascular endothelial cell line in a Ca2+-dependent manner. The Ca2+ response to AA involves endogenous Ca2+ release from the ER and lysosomal Ca2+ pools through, respectively, InsP3R3 and TPC1-2 and extracellular Ca2+ influx through TRPV4. However, only TPC1-2 channels and TRPV4 are seemingly coupled to eNOS activation and NO release. AA is the precursor of multiple vasoactive mediators shaping the hemodynamic response to neuronal activity. However, the slow kinetics of AA-evoked NO release make it unlikely that this signal directly contributes to NVC.

4.1. Intracellular Ca2+ Signals Induced by AA in hCMEC/D3 Cells

It has long been known that synaptic activity leads to a significant increase in the local AA concentration, which can raise up to 50–200 μM following the Ca2+-dependent recruitment of PLA2 in both postsynaptic neurons and perisynaptic astrocytes [29,30,31]. AA, in turn, regulates multiple synaptic processes, including neurotransmitter release [50], long-term potentiation [29,30], and local increase in CBF [2,7]. Intriguingly, a recent investigation demonstrated that 50 μM AA could elicit an increase in [Ca2+]i in primary human brain endothelial cells [23]. As endothelial Ca2+ signals are emerging as an unsuspected regulator of NVC [11,12,14,17,51] and AA may directly trigger Ca2+-dependent NO release in other endothelial cell types [18,19,20,21,22], we sought to assess whether it could elicit intracellular Ca2+ signals and NO release also in human cerebrovascular endothelial cells [15].

4.2. The Dose–Response Relationship of AA-Evoked Intracellular Ca2+ Signals in hCMEC/D3 Cells

We found that AA induced a dose-dependent increase in [Ca2+]i within the physiological concentration range that it reaches during synaptic activity. The EC50 of AA-evoked Ca2+ signal was indeed 8.4 μM, whereas the peak Ca2+ response was attained at 300 μM. A similar analysis revealed that breast tumor-derived endothelial cells (b-TECs) displayed a higher sensitivity as compared to hCMEC/D3 cells, as the Ca2+ response to AA arose at 0.5 μM and achieved its peak at 10 μM [37]. However, AA-evoked Ca2+ signals in ECFCs appeared at concentrations higher than 2 μM and attained the maximal amplitude at 100 μM [22,45]. Likewise, a sizeable elevation in [Ca2+]i was detected in human umbilical vein endothelial cells (HUVECs) challenged with 10–40 μM AA [36]. The endothelial Ca2+ response to AA can, however, be induced by many of its metabolites. For instance, 5,6-EET and 8,9-EET mediate AA-evoked Ca2+ response in mouse aortic endothelial cells [32,33], whereas leukotriene C4 is responsible for AA-induced Ca2+ influx in HUVECs [36]. Nevertheless, ETYA, a non-metabolizable analogue of AA, evoked an increase in in [Ca2+]i in hCMEC/D3 cells whose magnitude and kinetics were similar to those induced by AA, as also observed in bovine aortic endothelial cells [21], b-TECs [37] and ECFCs [22]. It is, therefore, possible to conclude that AA directly induces intracellular Ca2+ signalling in hCMEC/D3 cells.

4.3. The Complex Mechanism of AA-Evoked Intracellular Ca2+ Signals in hCMEC/D3 Cells: InsP3R3, TPC1-2, and TRPV4

A wide repertoire of mechanisms may be exploited by AA to increase the [Ca2+]i in endothelial cells. For instance, the Ca2+ response to AA is mediated by intracellular Ca2+ release through InsP3Rs and TPCs and by extracellular Ca2+ influx through TRPV4 in ECFCs [22], whereas TRPV4 mediates AA-evoked Ca2+ signals in b-TECs [43], mouse aortic [32,33] and pulmonary artery [35] endothelial cells. A preliminary report showed that AA induced both endogenous Ca2+ release and extracellular Ca2+ influx in primary human brain microvascular endothelial cells. This investigation suggested the involvement of ER Ca2+ release through InsP3Rs, but some Ca2+ mobilization still occurred in the presence of 2-APB. Furthermore, the pathway responsible for extracellular Ca2+ influx was not evaluated [23].

4.3.1. InsP3R3 and TPC1-2

Herein, manipulation of extracellular Ca2+ levels revealed that the Ca2+ response to AA in hCMEC/D3 cells required both intra- and extracellular Ca2+ sources. AA-evoked Ca2+ release was strongly impaired by preventing InsP3R3-dependent ER Ca2+ mobilization with 2-APB and CPA. In agreement with these observations, it has beed demonstrated that AA directly activates InsP3Rs in several cellular types [52,53,54]. Besides the ER Ca2+ pool, AA is capable of mobilizing lysosomal Ca2+ through the recently identified TPC1-2, as demonstrated in rat pancreatic β-cells [38] and ECFCs [22]. Accordingly, AA-evoked intracellular Ca2+ release was impaired by disrupting the lysosomal Ca2+ reservoir with GPN and by blocking TPC1-2 with NED-19. It is not clear how AA induces lysosomal Ca2+ release in hCMEC/D3 cells. It has recently been demonstrated that a remarkable Ca2+-mediated cross-talk is established between the ER and lysosomal Ca2+ pools [55,56,57]. For instance, the ER Ca2+ mobilized by InsP3 may be directly transferred into the acidic vesicles at ER-lysosome contact sites, thereby increasing the lysosomal Ca2+ content [58]. An increase in intraluminal Ca2+ could in turn activate TPC2 and, sometimes, also TPC1 [40]. An alternative hypothesis, which does not rule out the previous one, implies that InsP3-dependent Ca2+ release stimulates the Ca2+-dependent production of nicotinic acid adenine dinucleotide phosphate (NAADP), the physiological agonist of TPCs [40,59]. Finally, TPC1-2 could trigger InsP3-dependent Ca2+ release from the ER through the Ca2+-induced Ca2+ release process [60,61]. Whatever the interaction mode, it is clear that both InsP3R3 and TPC1-2 contribute to AA-evoked intracellular Ca2+ release in hCMEC/D3 cells.

4.3.2. TRPV4

As for extracellular Ca2+ influx, the available evidence hints at the involvement of TRPV4. First, a functional TRPV4 protein is expressed in these cells, as testified by Western Blot analysis and the Ca2+ response to GSK, a selective TRPV4 agonist [47]. In addition, GSK was found to induce exclusively extracellular Ca2+ influx and its action was inhibited by RN-1734, a specific TRPV4 blocker. Second, RN-1734 mimicked extracellular Ca2+ removal, by reducing the amplitude and curtailing the Ca2+ response to AA. Third, AA was still able to induce RN-1734-sensitive Ca2+ influx upon full activation of SOCE, which represents an alternative pathway for Ca2+ influx in hCMEC/D3 cells [17]. In addition, AA has long been known to inhibit [18,22,24,25], rather than inducing, SOCE. Finally, Orai3, which is expressed in hCMEC/D3 cells [17] and mediates AA-induced extracellular Ca2+ influx in HUVECs [36] and rat carotid artery vascular smooth muscle cells [62], is not directly gated by AA, but by leukotriene C4. Conversely, extracellular Ca2+ influx in hCMEC/D3 cells is not promoted by AA metabolites (see Paragraph 4.1). There is, therefore, strong evidence to support the conclusion that TRPV4 is responsible for AA-induced Ca2+ influx in hCMEC/D3 cells.

4.4. AA Induces NO Release in hCMEC/D3 Cells: The Rationale for the Present Investigation

The physiological role of AA metabolites in NVC has recently been extensively reviewed [2,7]. It has been largely accepted that neuronal activity leads to PGE2 synthesis via COX-2 and COX-1 in neurons and astrocytes, respectively, to EET production via cytochrome P450 epoxygenase in glial cells, and 20-HETE synthesis in VSMCs and pericytes via cytochrome P450 4A2 [2,4,5,6]. Intriguingly, the vasomotor effect of AA metabolites is finely tuned by NO, which suppresses 20-HETE formation, thereby enabling PGE2-dependent vasodilation in the somatosensory cortex [9] and the molecular layer of the cerebellum [63]. It has, however, long been known that the pharmacological blockade of all the signalling pathways leading to an increase in CBF, i.e., NO, PGE2, EET, and K+ signalling, does not lead to a complete inhibition of the hemodynamic response [4]. While the molecular mechanisms driving CBF may vary along the cerebrovascular tree, the signalling mechanisms of NVC could be highly redundant in order to ensure proper blood supply to the working brain [64]. Quite unexpectedly [4], it has been recently demonstrated that the hemodynamic response may be initiated at capillary level by various mechanisms [5,10,63], including the endothelial cell ability to detect neuronal activity [13]. In addition, synaptic activity was found to induce NO-mediated vasorelaxation in penetrating arterioles and capillaries through the activation of endothelial NMDARs [11]. These in vivo findings were confirmed by the evidence, provided in vitro, that glutamate and acetylcholine were able to induce repetitive Ca2+ transients in mouse brain endothelial cells [14,16]. Likewise, acetylcholine-induced intracellular Ca2+ signals and NO release were reported in hCMEC/D3 cells [17].

4.4.1. AA Induces Delayed NO Release in hCMEC/D3 Cells

As it has long been known that AA directly induces Ca2+-dependent NO release throughout peripheral circulation [18,65] and in ECFCs [22], which represent the only known truly endothelial precursors in flowing blood [66], we reasoned it was worth assessing whether this mechanism was at work also in brain microvascular endothelial cells. However, NO release started with a significantly longer latency (~150 sec) as compared to the onset of the Ca2+ signal, which was immediate. The delayed kinetics of the increase in DAF-FM noted in response to AA are similar to observations in mouse brain microvascular endothelial cells challenged with glutamate [14]. As discussed elsewhere [5,14,67], DAF-FM does not truly detect NO, but it rather reacts with multiple nitrogen derivatives, including ONOO, NO2, and N2O3. We cannot, therefore, rule out the hypothesis that the NO signal arises before the increase in DAF-FM fluorescence is detectable by our imaging system. Yet, it seems unlikely that such a delayed NO release may induce the rapid increase in CBF that follows neuronal activity with a latency of ~600 msec [68]. So, it is conceivable that the major role of AA-induced NO release from human cerebrovascular endothelial cell is other than controlling NVC. Early studies demonstrated that AA-dependent NO release stimulated angiogenesis in different types of endothelial cells, including bovine aortic endothelial cells [18], b-TECs [19,43], and ECFCs [22]. Of note, AA promotes proliferation and migration also in rat brain microvascular endothelial cells [69,70]. Future investigation is required to assess whether AA-induced NO production also stimulates angiogenesis in hCMEC/D3 cells.

4.4.2. AA Induced NO Release via TPC1-2 and TRPV4 in hCMEC/D3 Cells

The mechanism whereby AA induces NO release in hCMEC/D3 cells is, however, somehow different from that reported in other endothelial cell types. For instance, TRPV4 provides the source of Ca2+ necessary for AA-dependent recruitment of eNOS in b-TECs [19,43], while TRPV4 is supported by InsP3Rs and TPC1 in ECFCs [22]. Herein, we found that AA-evoked NO production in hCMEC/D3 cells was mainly driven by TPC1-2 and TRPV4 channels. Accordingly, the increase in DAF-FM fluorescence induced by AA was significantly reduced both by removal of extracellular Ca2+ and by pharmacological blockade of TRPV4 with RN-1734. Likewise, the impairment of lysosomal Ca2+ mobilization with GPN, which disrupts acidic vesicles, or NED-19, which blocks TPC1-2, suppressed AA-evoked NO release in hCMEC/D3 cells. These observations support the emerging role of lysosomal Ca2+ release in driving eNOS activation throughout vascular endothelium: TPC1 and/or TPC2 were indeed found to stimulate NO production in human and rat aortic endothelial cells [71], mouse [14] and human [17] brain microvascular endothelial cells, and ECFCs [22]. Conversely, preventing InsP3-dependent ER Ca2+ release with 2-APB, which inhibits InsP3R3, or with CPA, which depletes the ER Ca2+ store [17], did not significantly affect eNOS activation by AA. This result was somehow unexpected as InsP3R3 supports acetylcholine-induced NO production in hCMEC/D3 cells [17]. It is, therefore, conceivable that the pool of ER-embedded InsP3R3 is not coupled to eNOS.

5. Conclusions

We provided the first evidence that AA, whose metabolites are known to modulate CBF, is per se able to induce Ca2+-dependent NO release in a human cerebrovascular endothelial cell line. The Ca2+ response to AA requires endogenous Ca2+ release through ER-embedded InsP3R3 and lysosomal TPC1-2 and extracellular Ca2+ influx through TRPV4. However, only TPC1-2 and TRPV4 drive NO production, while InsP3R3 plays no sizeable role in this signal. This finding suggests that, besides being metabolized into the vasorelaxing mediators PGE2 and EETs, AA could induce NO release from human brain microvascular endothelial cells. It is, however, unlikely that AA-induced endothelial-dependent NO release is directly involved in the onset of the hemodynamic response to neuronal activity. These findings should, however, be confirmed in vivo by taking advantage of the availability of mouse models expressing endothelial genetic Ca2+ indicators [72]. However, a recent report confirmed that acetylcholine was able to induce endothelial NO release in vivo [73], as suggested by previous in vitro observations in hCMEC/D3 cells [17]. This same report provided the evidence that also synaptically released glutamate induced endothelial NO production [73], as previously observed in a mouse brain cerebrovascular endothelial cell line [14].

Author Contributions

R.B.-R., P.F., S.N., L.B. and T.G. performed and analysed the experiments. F.M. writing—original draft preparation, supervision and funding acquisition. All the authors read and reviewed the final draft of the manuscript.

Funding

This research was funded by: Italian Ministry of Education, University and Research (MIUR): Dipartimenti di Eccellenza Program (2018–2022)—Dept. of Biology and Biotechnology “L. Spallanzani”, University of Pavia (F.M. and L.B.), and by Fondo Ricerca Giovani from the University of Pavia (F.M. and L.B.). P.F. was supported by MAECI (Ministero degli Affari Esteri e della Cooperazione Internazionale).

Conflicts of Interest

The authors declare no conflict of interest.

References

  1. Munaron, L. Shuffling the cards in signal transduction: Calcium, arachidonic acid and mechanosensitivity. World J. Biol. Chem. 2011, 2, 59–66. [Google Scholar] [CrossRef] [PubMed]
  2. Harder, D.R.; Rarick, K.R.; Gebremedhin, D.; Cohen, S.S. Regulation of Cerebral Blood Flow: Response to Cytochrome P450 Lipid Metabolites. Compr. Physiol. 2018, 8, 801–821. [Google Scholar] [CrossRef] [PubMed]
  3. Iadecola, C. The Neurovascular Unit Coming of Age: A Journey through Neurovascular Coupling in Health and Disease. Neuron 2017, 96, 17–42. [Google Scholar] [CrossRef] [PubMed] [Green Version]
  4. Attwell, D.; Buchan, A.M.; Charpak, S.; Lauritzen, M.; Macvicar, B.A.; Newman, E.A. Glial and neuronal control of brain blood flow. Nature 2010, 468, 232–243. [Google Scholar] [CrossRef] [Green Version]
  5. Mapelli, L.; Gagliano, G.; Soda, T.; Laforenza, U.; Moccia, F.; D’Angelo, E.U. Granular Layer Neurons Control Cerebellar Neurovascular Coupling Through an NMDA Receptor/NO-Dependent System. J. Neurosci. 2017, 37, 1340–1351. [Google Scholar] [CrossRef] [PubMed]
  6. MacVicar, B.A.; Newman, E.A. Astrocyte regulation of blood flow in the brain. Cold Spring Harb. Perspect. Biol. 2015, 7. [Google Scholar] [CrossRef] [PubMed]
  7. Lecrux, C.; Hamel, E. Neuronal networks and mediators of cortical neurovascular coupling responses in normal and altered brain states. Philos. Trans. R. Soc. Lond. B Biol. Sci. 2016, 371. [Google Scholar] [CrossRef] [PubMed]
  8. Lecrux, C.; Toussay, X.; Kocharyan, A.; Fernandes, P.; Neupane, S.; Levesque, M.; Plaisier, F.; Shmuel, A.; Cauli, B.; Hamel, E. Pyramidal neurons are “neurogenic hubs” in the neurovascular coupling response to whisker stimulation. J. Neurosci. 2011, 31, 9836–9847. [Google Scholar] [CrossRef] [PubMed]
  9. Lecrux, C.; Kocharyan, A.; Sandoe, C.H.; Tong, X.K.; Hamel, E. Pyramidal cells and cytochrome P450 epoxygenase products in the neurovascular coupling response to basal forebrain cholinergic input. J. Cereb. Blood Flow Metab. 2012, 32, 896–906. [Google Scholar] [CrossRef]
  10. Hall, C.N.; Reynell, C.; Gesslein, B.; Hamilton, N.B.; Mishra, A.; Sutherland, B.A.; O’Farrell, F.M.; Buchan, A.M.; Lauritzen, M.; Attwell, D. Capillary pericytes regulate cerebral blood flow in health and disease. Nature 2014, 508, 55–60. [Google Scholar] [CrossRef] [Green Version]
  11. Hogan-Cann, A.D.; Lu, P.; Anderson, C.M. Endothelial NMDA receptors mediate activity-dependent brain hemodynamic responses in mice. Proc. Natl. Acad. Sci. USA 2019, 116, 10229–10231. [Google Scholar] [CrossRef] [Green Version]
  12. Guerra, G.; Lucariello, A.; Perna, A.; Botta, L.; De Luca, A.; Moccia, F. The Role of Endothelial Ca(2+) Signaling in Neurovascular Coupling: A View from the Lumen. Int. J. Mol. Sci. 2018, 19, 938. [Google Scholar] [CrossRef]
  13. Longden, T.A.; Dabertrand, F.; Koide, M.; Gonzales, A.L.; Tykocki, N.R.; Brayden, J.E.; Hill-Eubanks, D.; Nelson, M.T. Capillary K(+)-sensing initiates retrograde hyperpolarization to increase local cerebral blood flow. Nat. Neurosci. 2017, 20, 717–726. [Google Scholar] [CrossRef]
  14. Zuccolo, E.; Kheder, D.A.; Lim, D.; Perna, A.; Nezza, F.D.; Botta, L.; Scarpellino, G.; Negri, S.; Martinotti, S.; Soda, T.; et al. Glutamate triggers intracellular Ca(2+) oscillations and nitric oxide release by inducing NAADP- and InsP3 -dependent Ca(2+) release in mouse brain endothelial cells. J. Cell. Physiol. 2019, 234, 3538–3554. [Google Scholar] [CrossRef] [PubMed]
  15. Weksler, B.; Romero, I.A.; Couraud, P.O. The hCMEC/D3 cell line as a model of the human blood brain barrier. Fluids Barriers CNS 2013, 10, 16. [Google Scholar] [CrossRef] [PubMed]
  16. Zuccolo, E.; Lim, D.; Kheder, D.A.; Perna, A.; Catarsi, P.; Botta, L.; Rosti, V.; Riboni, L.; Sancini, G.; Tanzi, F.; et al. Acetylcholine induces intracellular Ca2+ oscillations and nitric oxide release in mouse brain endothelial cells. Cell Calcium 2017, 66, 33–47. [Google Scholar] [CrossRef] [PubMed]
  17. Zuccolo, E.; Laforenza, U.; Negri, S.; Botta, L.; Berra-Romani, R.; Faris, P.; Scarpellino, G.; Forcaia, G.; Pellavio, G.; Sancini, G.; et al. Muscarinic M5 receptors trigger acetylcholine-induced Ca(2+) signals and nitric oxide release in human brain microvascular endothelial cells. J. Cell. Physiol. 2019, 234, 4540–4562. [Google Scholar] [CrossRef]
  18. Mottola, A.; Antoniotti, S.; Lovisolo, D.; Munaron, L. Regulation of noncapacitative calcium entry by arachidonic acid and nitric oxide in endothelial cells. Faseb J. 2005, 19, 2075–2077. [Google Scholar] [CrossRef] [Green Version]
  19. Fiorio Pla, A.; Genova, T.; Pupo, E.; Tomatis, C.; Genazzani, A.; Zaninetti, R.; Munaron, L. Multiple roles of protein kinase a in arachidonic acid-mediated Ca2+ entry and tumor-derived human endothelial cell migration. Mol. Cancer Res. 2010, 8, 1466–1476. [Google Scholar] [CrossRef]
  20. Kohler, R.; Heyken, W.T.; Heinau, P.; Schubert, R.; Si, H.; Kacik, M.; Busch, C.; Grgic, I.; Maier, T.; Hoyer, J. Evidence for a functional role of endothelial transient receptor potential V4 in shear stress-induced vasodilatation. Arter. Thromb. Vasc. Biol. 2006, 26, 1495–1502. [Google Scholar] [CrossRef]
  21. Fiorio Pla, A.; Munaron, L. Calcium influx, arachidonic acid, and control of endothelial cell proliferation. Cell Calcium 2001, 30, 235–244. [Google Scholar] [CrossRef] [PubMed]
  22. Zuccolo, E.; Dragoni, S.; Poletto, V.; Catarsi, P.; Guido, D.; Rappa, A.; Reforgiato, M.; Lodola, F.; Lim, D.; Rosti, V.; et al. Arachidonic acid-evoked Ca2+ signals promote nitric oxide release and proliferation in human endothelial colony forming cells. Vascul. Pharmacol. 2016, 87, 159–171. [Google Scholar] [CrossRef] [PubMed]
  23. Evans, J.; Ko, Y.; Mata, W.; Saquib, M.; Eldridge, J.; Cohen-Gadol, A.; Leaver, H.A.; Wang, S.; Rizzo, M.T. Arachidonic acid induces brain endothelial cell apoptosis via p38-MAPK and intracellular calcium signaling. Microvasc. Res. 2015, 98, 145–158. [Google Scholar] [CrossRef] [PubMed]
  24. Peppiatt, C.M.; Holmes, A.M.; Seo, J.T.; Bootman, M.D.; Collins, T.J.; McDonald, F.; Roderick, H.L. Calmidazolium and arachidonate activate a calcium entry pathway that is distinct from store-operated calcium influx in HeLa cells. Biochem. J. 2004, 381, 929–939. [Google Scholar] [CrossRef] [PubMed] [Green Version]
  25. Holmes, A.M.; Roderick, H.L.; McDonald, F.; Bootman, M.D. Interaction between store-operated and arachidonate-activated calcium entry. Cell Calcium 2007, 41, 1–12. [Google Scholar] [CrossRef] [PubMed] [Green Version]
  26. Turovsky, E.A.; Zinchenko, V.P.; Kaimachnikov, N.P. Attenuation of calmodulin regulation evokes Ca(2+) oscillations: Evidence for the involvement of intracellular arachidonate-activated channels and connexons. Mol. Cell. Biochem. 2019, 456, 191–204. [Google Scholar] [CrossRef] [PubMed]
  27. Yu, X.; Wu, J.; Hu, M.; Wu, J.; Zhu, Q.; Yang, Z.; Xie, X.; Feng, Y.Q.; Yue, J. Glutamate affects the CYP1B1- and CYP2U1-mediated hydroxylation of arachidonic acid metabolism via astrocytic mGlu5 receptor. Int. J. Biochem. Cell Biol. 2019, 110, 111–121. [Google Scholar] [CrossRef] [PubMed]
  28. Bootman, M.D.; Rietdorf, K.; Collins, T.; Walker, S.; Sanderson, M. Ca2+-sensitive fluorescent dyes and intracellular Ca2+ imaging. Cold Spring Harb. Protoc. 2013, 2013, 83–99. [Google Scholar] [CrossRef] [PubMed]
  29. Williams, J.H.; Errington, M.L.; Lynch, M.A.; Bliss, T.V. Arachidonic acid induces a long-term activity-dependent enhancement of synaptic transmission in the hippocampus. Nature 1989, 341, 739–742. [Google Scholar] [CrossRef]
  30. Kato, K.; Uruno, K.; Saito, K.; Kato, H. Both arachidonic acid and 1-oleoyl-2-acetyl glycerol in low magnesium solution induce long-term potentiation in hippocampal CA1 neurons in vitro. Brain Res. 1991, 563, 94–100. [Google Scholar] [CrossRef]
  31. Bazan, N.G. Synaptic lipid signaling: Significance of polyunsaturated fatty acids and platelet-activating factor. J. Lipid Res. 2003, 44, 2221–2233. [Google Scholar] [CrossRef]
  32. Watanabe, H.; Vriens, J.; Prenen, J.; Droogmans, G.; Voets, T.; Nilius, B. Anandamide and arachidonic acid use epoxyeicosatrienoic acids to activate TRPV4 channels. Nature 2003, 424, 434–438. [Google Scholar] [CrossRef] [PubMed]
  33. Vriens, J.; Owsianik, G.; Fisslthaler, B.; Suzuki, M.; Janssens, A.; Voets, T.; Morisseau, C.; Hammock, B.D.; Fleming, I.; Busse, R.; et al. Modulation of the Ca2+ permeable cation channel TRPV4 by cytochrome P450 epoxygenases in vascular endothelium. Circ. Res. 2005, 97, 908–915. [Google Scholar] [CrossRef] [PubMed]
  34. Loot, A.E.; Popp, R.; Fisslthaler, B.; Vriens, J.; Nilius, B.; Fleming, I. Role of cytochrome P450-dependent transient receptor potential V4 activation in flow-induced vasodilatation. Cardiovasc. Res. 2008, 80, 445–452. [Google Scholar] [CrossRef] [PubMed] [Green Version]
  35. Jian, M.Y.; King, J.A.; Al-Mehdi, A.B.; Liedtke, W.; Townsley, M.I. High vascular pressure-induced lung injury requires P450 epoxygenase-dependent activation of TRPV4. Am. J. Respir Cell Mol. Biol. 2008, 38, 386–392. [Google Scholar] [CrossRef]
  36. Li, J.; Bruns, A.F.; Hou, B.; Rode, B.; Webster, P.J.; Bailey, M.A.; Appleby, H.L.; Moss, N.K.; Ritchie, J.E.; Yuldasheva, N.Y.; et al. Orai3 Surface Accumulation and Calcium Entry Evoked by Vascular Endothelial Growth Factor. Arter. Thromb Vasc. Biol. 2015, 35, 1987–1994. [Google Scholar] [CrossRef] [Green Version]
  37. Fiorio Pla, A.; Grange, C.; Antoniotti, S.; Tomatis, C.; Merlino, A.; Bussolati, B.; Munaron, L. Arachidonic acid-induced Ca2+ entry is involved in early steps of tumor angiogenesis. Mol. Cancer Res. 2008, 6, 535–545. [Google Scholar] [CrossRef] [PubMed]
  38. Yeung-Yam-Wah, V.; Lee, A.K.; Tse, A. Arachidonic acid mobilizes Ca2+ from the endoplasmic reticulum and an acidic store in rat pancreatic β cells. Cell Calcium 2012, 51, 140–148. [Google Scholar] [CrossRef]
  39. Moccia, F.; Dragoni, S.; Poletto, V.; Rosti, V.; Tanzi, F.; Ganini, C.; Porta, C. Orai1 and Transient Receptor Potential Channels as novel molecular targets to impair tumor neovascularisation in renal cell carcinoma and other malignancies. Anticancer Agents Med. Chem. 2014, 14, 296–312. [Google Scholar] [CrossRef]
  40. Pitt, S.J.; Reilly-O’Donnell, B.; Sitsapesan, R. Exploring the biophysical evidence that mammalian two-pore channels are NAADP-activated calcium-permeable channels. J. Physiol. 2016, 594, 4171–4179. [Google Scholar] [CrossRef] [Green Version]
  41. Faris, P.; Shekha, M.; Montagna, D.; Guerra, G.; Moccia, F. Endolysosomal Ca(2+) Signalling and Cancer Hallmarks: Two-Pore Channels on the Move, TRPML1 Lags Behind! Cancers 2018, 11, 27. [Google Scholar] [CrossRef]
  42. Kilpatrick, B.S.; Eden, E.R.; Schapira, A.H.; Futter, C.E.; Patel, S. Direct mobilisation of lysosomal Ca2+ triggers complex Ca2+ signals. J. Cell Sci. 2013, 126, 60–66. [Google Scholar] [CrossRef] [PubMed]
  43. Fiorio Pla, A.; Ong, H.L.; Cheng, K.T.; Brossa, A.; Bussolati, B.; Lockwich, T.; Paria, B.; Munaron, L.; Ambudkar, I.S. TRPV4 mediates tumor-derived endothelial cell migration via arachidonic acid-activated actin remodeling. Oncogene 2012, 31, 200–212. [Google Scholar] [CrossRef] [PubMed]
  44. Moccia, F. Remodelling of the Ca2+ Toolkit in Tumor Endothelium as a Crucial Responsible for the Resistance to Anticancer Therapies. Curr. Signal. Transd. Ther. 2017, 12. [Google Scholar] [CrossRef]
  45. Dragoni, S.; Guerra, G.; Fiorio Pla, A.; Bertoni, G.; Rappa, A.; Poletto, V.; Bottino, C.; Aronica, A.; Lodola, F.; Cinelli, M.P.; et al. A functional Transient Receptor Potential Vanilloid 4 (TRPV4) channel is expressed in human endothelial progenitor cells. J. Cell. Physiol. 2015, 230, 95–104. [Google Scholar] [CrossRef] [PubMed]
  46. Thoppil, R.J.; Adapala, R.K.; Cappelli, H.C.; Kondeti, V.; Dudley, A.C.; Gary Meszaros, J.; Paruchuri, S.; Thodeti, C.K. TRPV4 channel activation selectively inhibits tumor endothelial cell proliferation. Sci. Rep. 2015, 5, 14257. [Google Scholar] [CrossRef]
  47. White, J.P.; Cibelli, M.; Urban, L.; Nilius, B.; McGeown, J.G.; Nagy, I. TRPV4: Molecular Conductor of a Diverse Orchestra. Physiol. Rev. 2016, 96, 911–973. [Google Scholar] [CrossRef] [Green Version]
  48. Moccia, F.; Tanzi, F.; Munaron, L. Endothelial remodelling and intracellular calcium machinery. Curr. Mol. Med. 2014, 14, 457–480. [Google Scholar] [CrossRef]
  49. Zuccolo, E.; Bottino, C.; Diofano, F.; Poletto, V.; Codazzi, A.C.; Mannarino, S.; Campanelli, R.; Fois, G.; Marseglia, G.L.; Guerra, G.; et al. Constitutive Store-Operated Ca(2+) Entry Leads to Enhanced Nitric Oxide Production and Proliferation in Infantile Hemangioma-Derived Endothelial Colony-Forming Cells. Stem Cells Dev. 2016, 25, 301–319. [Google Scholar] [CrossRef]
  50. Carta, M.; Lanore, F.; Rebola, N.; Szabo, Z.; Da Silva, S.V.; Lourenco, J.; Verraes, A.; Nadler, A.; Schultz, C.; Blanchet, C.; et al. Membrane lipids tune synaptic transmission by direct modulation of presynaptic potassium channels. Neuron 2014, 81, 787–799. [Google Scholar] [CrossRef]
  51. Harraz, O.F.; Longden, T.A.; Hill-Eubanks, D.; Nelson, M.T. PIP2 depletion promotes TRPV4 channel activity in mouse brain capillary endothelial cells. eLife 2018, 7. [Google Scholar] [CrossRef] [PubMed]
  52. Fleming, N.; Mellow, L. Arachidonic acid stimulates intracellular calcium mobilization and regulates protein synthesis, ATP levels, and mucin secretion in submandibular gland cells. J. Dent. Res. 1995, 74, 1295–1302. [Google Scholar] [CrossRef] [PubMed]
  53. Marchi, S.; Rimessi, A.; Giorgi, C.; Baldini, C.; Ferroni, L.; Rizzuto, R.; Pinton, P. Akt kinase reducing endoplasmic reticulum Ca2+ release protects cells from Ca2+-dependent apoptotic stimuli. Biochem. Biophys. Res. Commun. 2008, 375, 501–505. [Google Scholar] [CrossRef] [PubMed]
  54. Rizzuto, R.; Marchi, S.; Bonora, M.; Aguiari, P.; Bononi, A.; De Stefani, D.; Giorgi, C.; Leo, S.; Rimessi, A.; Siviero, R.; et al. Ca(2+) transfer from the ER to mitochondria: When, how and why. Biochim. Biophys. Acta 2009, 1787, 1342–1351. [Google Scholar] [CrossRef] [PubMed]
  55. Faris, P.; Pellavio, G.; Ferulli, F.; Di Nezza, F.; Shekha, M.; Lim, D.; Maestri, M.; Guerra, G.; Ambrosone, L.; Pedrazzoli, P.; et al. Nicotinic Acid Adenine Dinucleotide Phosphate (NAADP) Induces Intracellular Ca(2+) Release through the Two-Pore Channel TPC1 in Metastatic Colorectal Cancer Cells. Cancers 2019, 11, 542. [Google Scholar] [CrossRef] [PubMed]
  56. Ronco, V.; Potenza, D.M.; Denti, F.; Vullo, S.; Gagliano, G.; Tognolina, M.; Guerra, G.; Pinton, P.; Genazzani, A.A.; Mapelli, L.; et al. A novel Ca(2)(+)-mediated cross-talk between endoplasmic reticulum and acidic organelles: Implications for NAADP-dependent Ca(2)(+) signalling. Cell Calcium 2015, 57, 89–100. [Google Scholar] [CrossRef] [PubMed]
  57. Garrity, A.G.; Wang, W.; Collier, C.M.; Levey, S.A.; Gao, Q.; Xu, H. The endoplasmic reticulum, not the pH gradient, drives calcium refilling of lysosomes. eLife 2016, 5, e15887. [Google Scholar] [CrossRef]
  58. Atakpa, P.; Thillaiappan, N.B.; Mataragka, S.; Prole, D.L.; Taylor, C.W. IP3 Receptors Preferentially Associate with ER-Lysosome Contact Sites and Selectively Deliver Ca(2+) to Lysosomes. Cell Rep. 2018, 25, 3180–3193.e7. [Google Scholar] [CrossRef]
  59. Di Nezza, F.; Zuccolo, E.; Poletto, V.; Rosti, V.; De Luca, A.; Moccia, F.; Guerra, G.; Ambrosone, L. Liposomes as a Putative Tool to Investigate NAADP Signaling in Vasculogenesis. J. Cell. Biochem. 2017, 118, 3722–3729. [Google Scholar] [CrossRef]
  60. Moccia, F.; Nusco, G.A.; Lim, D.; Kyozuka, K.; Santella, L. NAADP and InsP3 play distinct roles at fertilization in starfish oocytes. Dev. Biol. 2006, 294, 24–38. [Google Scholar] [CrossRef] [Green Version]
  61. Galione, A. A primer of NAADP-mediated Ca(2+) signalling: From sea urchin eggs to mammalian cells. Cell Calcium 2015, 58, 27–47. [Google Scholar] [CrossRef] [PubMed]
  62. Zhang, W.; Zhang, X.; Gonzalez-Cobos, J.C.; Stolwijk, J.A.; Matrougui, K.; Trebak, M. Leukotriene-C4 synthase, a critical enzyme in the activation of store-independent Orai1/Orai3 channels, is required for neointimal hyperplasia. J. Biol. Chem. 2015, 290, 5015–5027. [Google Scholar] [CrossRef] [PubMed]
  63. Mishra, A.; Reynolds, J.P.; Chen, Y.; Gourine, A.V.; Rusakov, D.A.; Attwell, D. Astrocytes mediate neurovascular signaling to capillary pericytes but not to arterioles. Nat. Neurosci. 2016, 19, 1619–1627. [Google Scholar] [CrossRef] [PubMed] [Green Version]
  64. Nippert, A.R.; Biesecker, K.R.; Newman, E.A. Mechanisms Mediating Functional Hyperemia in the Brain. Neuroscientist 2018, 24, 73–83. [Google Scholar] [CrossRef] [PubMed]
  65. Munaron, L. Intracellular calcium, endothelial cells and angiogenesis. Recent Pat. Anticancer Drug Discov. 2006, 1, 105–119. [Google Scholar] [CrossRef] [PubMed]
  66. Moccia, F. Endothelial Ca(2+) Signaling and the Resistance to Anticancer Treatments: Partners in Crime. Int. J. Mol. Sci. 2018, 19, 217. [Google Scholar] [CrossRef]
  67. Hall, C.N.; Garthwaite, J. What is the real physiological NO concentration in vivo? Nitric Oxide 2009, 21, 92–103. [Google Scholar] [CrossRef] [Green Version]
  68. Cauli, B.; Hamel, E. Revisiting the role of neurons in neurovascular coupling. Front. Neuroenergetics 2010, 2, 9. [Google Scholar] [CrossRef] [Green Version]
  69. Anfuso, C.D.; Giurdanella, G.; Motta, C.; Muriana, S.; Lupo, G.; Ragusa, N.; Alberghina, M. PKCalpha-MAPK/ERK-phospholipase A2 signaling is required for human melanoma-enhanced brain endothelial cell proliferation and motility. Microvasc. Res. 2009, 78, 338–357. [Google Scholar] [CrossRef]
  70. Giurdanella, G.; Motta, C.; Muriana, S.; Arena, V.; Anfuso, C.D.; Lupo, G.; Alberghina, M. Cytosolic and calcium-independent phospholipase A(2) mediate glioma-enhanced proangiogenic activity of brain endothelial cells. Microvasc. Res. 2011, 81, 1–17. [Google Scholar] [CrossRef]
  71. Brailoiu, G.C.; Gurzu, B.; Gao, X.; Parkesh, R.; Aley, P.K.; Trifa, D.I.; Galione, A.; Dun, N.J.; Madesh, M.; Patel, S.; et al. Acidic NAADP-sensitive calcium stores in the endothelium: Agonist-specific recruitment and role in regulating blood pressure. J. Biol. Chem. 2010, 285, 37133–37137. [Google Scholar] [CrossRef] [PubMed]
  72. Tallini, Y.N.; Brekke, J.F.; Shui, B.; Doran, R.; Hwang, S.M.; Nakai, J.; Salama, G.; Segal, S.S.; Kotlikoff, M.I. Propagated endothelial Ca2+ waves and arteriolar dilation in vivo: Measurements in Cx40BAC GCaMP2 transgenic mice. Circ. Res. 2007, 101, 1300–1309. [Google Scholar] [CrossRef] [PubMed]
  73. Tran, C.H.T.; Peringod, G.; Gordon, G.R. Astrocytes Integrate Behavioral State and Vascular Signals during Functional Hyperemia. Neuron 2018, 100, 1133–1148.e3. [Google Scholar] [CrossRef] [PubMed] [Green Version]
Figure 1. Arachidonic acid (AA) induces an increase in intracellular Ca2+ concentration ([Ca2+]i) in hCMEC/D3 cells. (A) Intracellular Ca2+ signals evoked by increasing doses of AA in the hCMEC/D3 cell line. In this and the following figures, agonists and drugs were administered as indicated by the horizontal bars above the traces. (B) Dose–response relationship of the amplitude of AA-evoked Ca2+ signals in hCMEC/D3 cells. The continuous line was obtained from a fit to a sigmoidal concentration-response curve by using Equation (1). (C) 30 μM AA evoked a rapid increase in [Ca2+]i that decayed to the baseline upon agonist removal from the perfusate. When AA was re-added at the same dose, it induced a second elevation in [Ca2+]i that achieved the same peak amplitude as the first one.
Cells 08 00689 g001
Figure 2. Arachidonic acid (AA) metabolism is not necessary for arachidonic acid-induced elevation in [Ca2+]i in hCMEC/D3 cells. (A) 30 μM eicosatetraynoic acid (ETYA), a non-metabolizable analogue of AA, elicits an intracellular Ca2+ signal which overlaps with the Ca2+ response to 30 μM AA in hCMEC/D3 cells. (B) Mean ± SE of the amplitude of ETYA- and AA-induced elevations in [Ca2+]i.
Cells 08 00689 g002
Figure 3. Arachidonic acid induces endogenous Ca2+ release and extracellular Ca2+ influx in hCMEC/D3 cells. (A) 30 μM AA evoked endogenous Ca2+ release under absence of extracellular Ca2+ (0Ca2+) conditions followed by a second increase in [Ca2+]i upon Ca2+ restitution to the bath in the continuous presence of the agonist. (B) 50 μM AA evoked endogenous Ca2+ release under 0Ca2+ conditions followed by a second increase in [Ca2+]i upon Ca2+ restitution to the bath in the continuous presence of the agonist. (C) Mean ± SE of the amplitude of endogenous Ca2+ release and extracellular Ca2+ influx induced by each concentration of AA. The asterisk indicates p < 0.05.
Cells 08 00689 g003
Figure 4. Type 3 inositol-1,4,5-trisphosphate receptor 3 InsP3R3 and two-pore channels 1 and 2 (TPC1-2) mediate endogenous Ca2+ release in response to arachidonic acid in hCMEC/D3 cells. (A) Endogenous Ca2+ mobilization induced by AA (30 μM) under 0Ca2+ conditions. (B) 2-aminoethoxydiphenyl borate (2-APB; 50 μM, 30 min) prevents AA-evoked endogenous Ca2+ release. In this and in the following panels, AA has always been applied at 30 μM. (C) Cyclopiazonic acid (CPA; 10 μM) inhibited Sarco-Endoplasmic Reticulum Ca2+-ATPase (SERCA) activity, thereby eliciting a transient elevation in [Ca2+]i followed by Ca2+ removal from the cytosol. The following addition of AA did not result in an increase in [Ca2+]i. (D) Glycyl-L-phenylalanine 2-naphthylamide (GPN; 200 μM) elicited a transient elevation in [Ca2+]i due to the disruption of the lysosomal Ca2+ pool and the following liberation of lysosomal Ca2+ content into the cytosol [41,42]. The following addition of AA did not result in an increase in [Ca2+]i. (E) NED-19) (100 μM, 30 min) blocked AA-evoked intracellular Ca2+ release. (F) Mean ± SE of the amplitude of the intracellular Ca2+ response to AA under the designated treatments. The asterisk indicates p < 0.05.
Cells 08 00689 g004
Figure 5. Transient Receptor Potential Vanilloid 4 (TRPV4) protein is expressed and mediates extracellular Ca2+ influx in hCMEC/D3 cells. (A) Left, representative Western blots illustrating TRPV4 and β-actin expression in HEK-293 cells (HEK) and hCMEC/D3 cells. Left, quantification of TRPV4/β-actin protein levels in hCMEC/D3 cells normalized on HEK cells from three independent experiments. (B) GSK1016790A (GSK; 20 nM) increased the [Ca2+]i in the presence, but not in the absence (0Ca2+), of extracellular Ca2+. (C) RN-1734 (20 μM, 20 min) blocked GSK-evoked extracellular Ca2+ influx. GSK was administered at 20 nM. (D) Mean ± SE of the amplitude of GSK-induced Ca2+ influx in the absence and in the presence of RN-1734 (RN). The total number of cells analysed in the presence of RN is indicated in the brackets. The asterisk indicates p < 0.05.
Cells 08 00689 g005
Figure 6. TRPV4 mediates arachidonic acid-induced extracellular Ca2+ influx in hCMEC/D3 cells. (A) Intracellular Ca2+ response to AA (30 μM) recorded in the presence and in the absence of RN-1734 (20 μM, 20 min). (B) Mean ± SE of the amplitude of AA-evoked Ca2+ influx in the absence and in the presence of RN-1734 (RN). The asterisk indicates p < 0.05. (C) AA (30 μM) evoked an increase in the [Ca2+]i in the presence of extracellular Ca2+ upon 30 min treatment with CPA (10 μM) to deplete the ER Ca2+ store and fully activate store-operated Ca2+ influx (SOCE). AA-evoked Ca2+ influx was abolished by pretreating the cells with RN-1734 (20 μM, 20 min). (D) Mean ± SE of the amplitude of AA-induced intracellular Ca2+ signals in the absence and in the presence of RN-1734 (RN) upon SOCE activation with CPA (10 μM). The asterisk indicates p < 0.05.
Cells 08 00689 g006
Figure 7. Arachidonic acid induces NO release in a Ca2+-dependent manner in hCMEC/D3 cells. (A) AA (20 μM) evoked a robust increase in the fluorescence in hCMEC/D3 cells loaded with the NO-selective fluorophore, 4-amino-5-methylamino-2’,7’-difluorofluorescein (DAF-FM). AA-elicited NO release was abrogated by L-NG-Nitro-L-arginine methyl ester (L-NAME; 100 μM, 1 h) or BAPTA (30 μM, 2 h). (B) Mean ± SE of the amplitude of AA-elicited NO release under the designated treatments. For L-NAME and BAPTA, the number of total cells analysed is indicated in the brackets. The asterisk indicates p < 0.05. (C) AA (30 μM) and ETYA (30 μM) induced an increase in DAF-FM fluorescence with overlapping kinetics and amplitude. (D) Mean ± SE of the amplitude of AA- and ETYA-evoked NO release in hCMEC/D3 cells. NR means no response.
Cells 08 00689 g007
Figure 8. TPC1-2 and TRPV4 support arachidonic acid-induced NO production in hCMEC/D3 cells. (A) AA (30 μM) evoked robust NO release under control conditions in hCMEC/D3 cells. (B) AA (30 μM) induced NO release under 0Ca2+ conditions, although this signal was lower as compared to control conditions. However, readdition of Ca2+ to the perfusate caused a second increase in DAF-FM fluorescence. (C) RN-1734 (20 μM, 20 min) reduced AA-evoked NO release. AA was administered at 30 μM. (D) 2-APB (50 μM, 30 min) did not affect AA-induced NO production. AA was administered at 30 μM. (E) CPA (10 μM, 30 min) did not impair AA-evoked NO release. AA was administered at 30 μM. (F) GPN (200 μM, 30 min) remarkably reduced AA-induced NO production. AA was administered at 30 μM. (G) NED-19 (100 μM, 30 min) impaired AA-evoked NO release. AA was administered at 30 μM. (H) Mean ± SE of the amplitude of AA-evoked NO release under the designated treatments. The asterisk indicates p < 0.05. The total number of analysed cells is indicated in the brackets.
Cells 08 00689 g008

