hiPSC-Derived Cardiomyocyte Model of LQT2 Syndrome Derived from Asymptomatic and Symptomatic Mutation Carriers Reproduces Clinical Differences in Aggregates but Not in Single Cells

 ,
,  ,
, 
Abstract
:1. Introduction
2. Materials and Methods
2.1. Patient Characteristics
2.2. Genetic Screening
2.3. hiPSC Generation, Culture and Characterization
2.4. Cardiomyocyte Differentiation
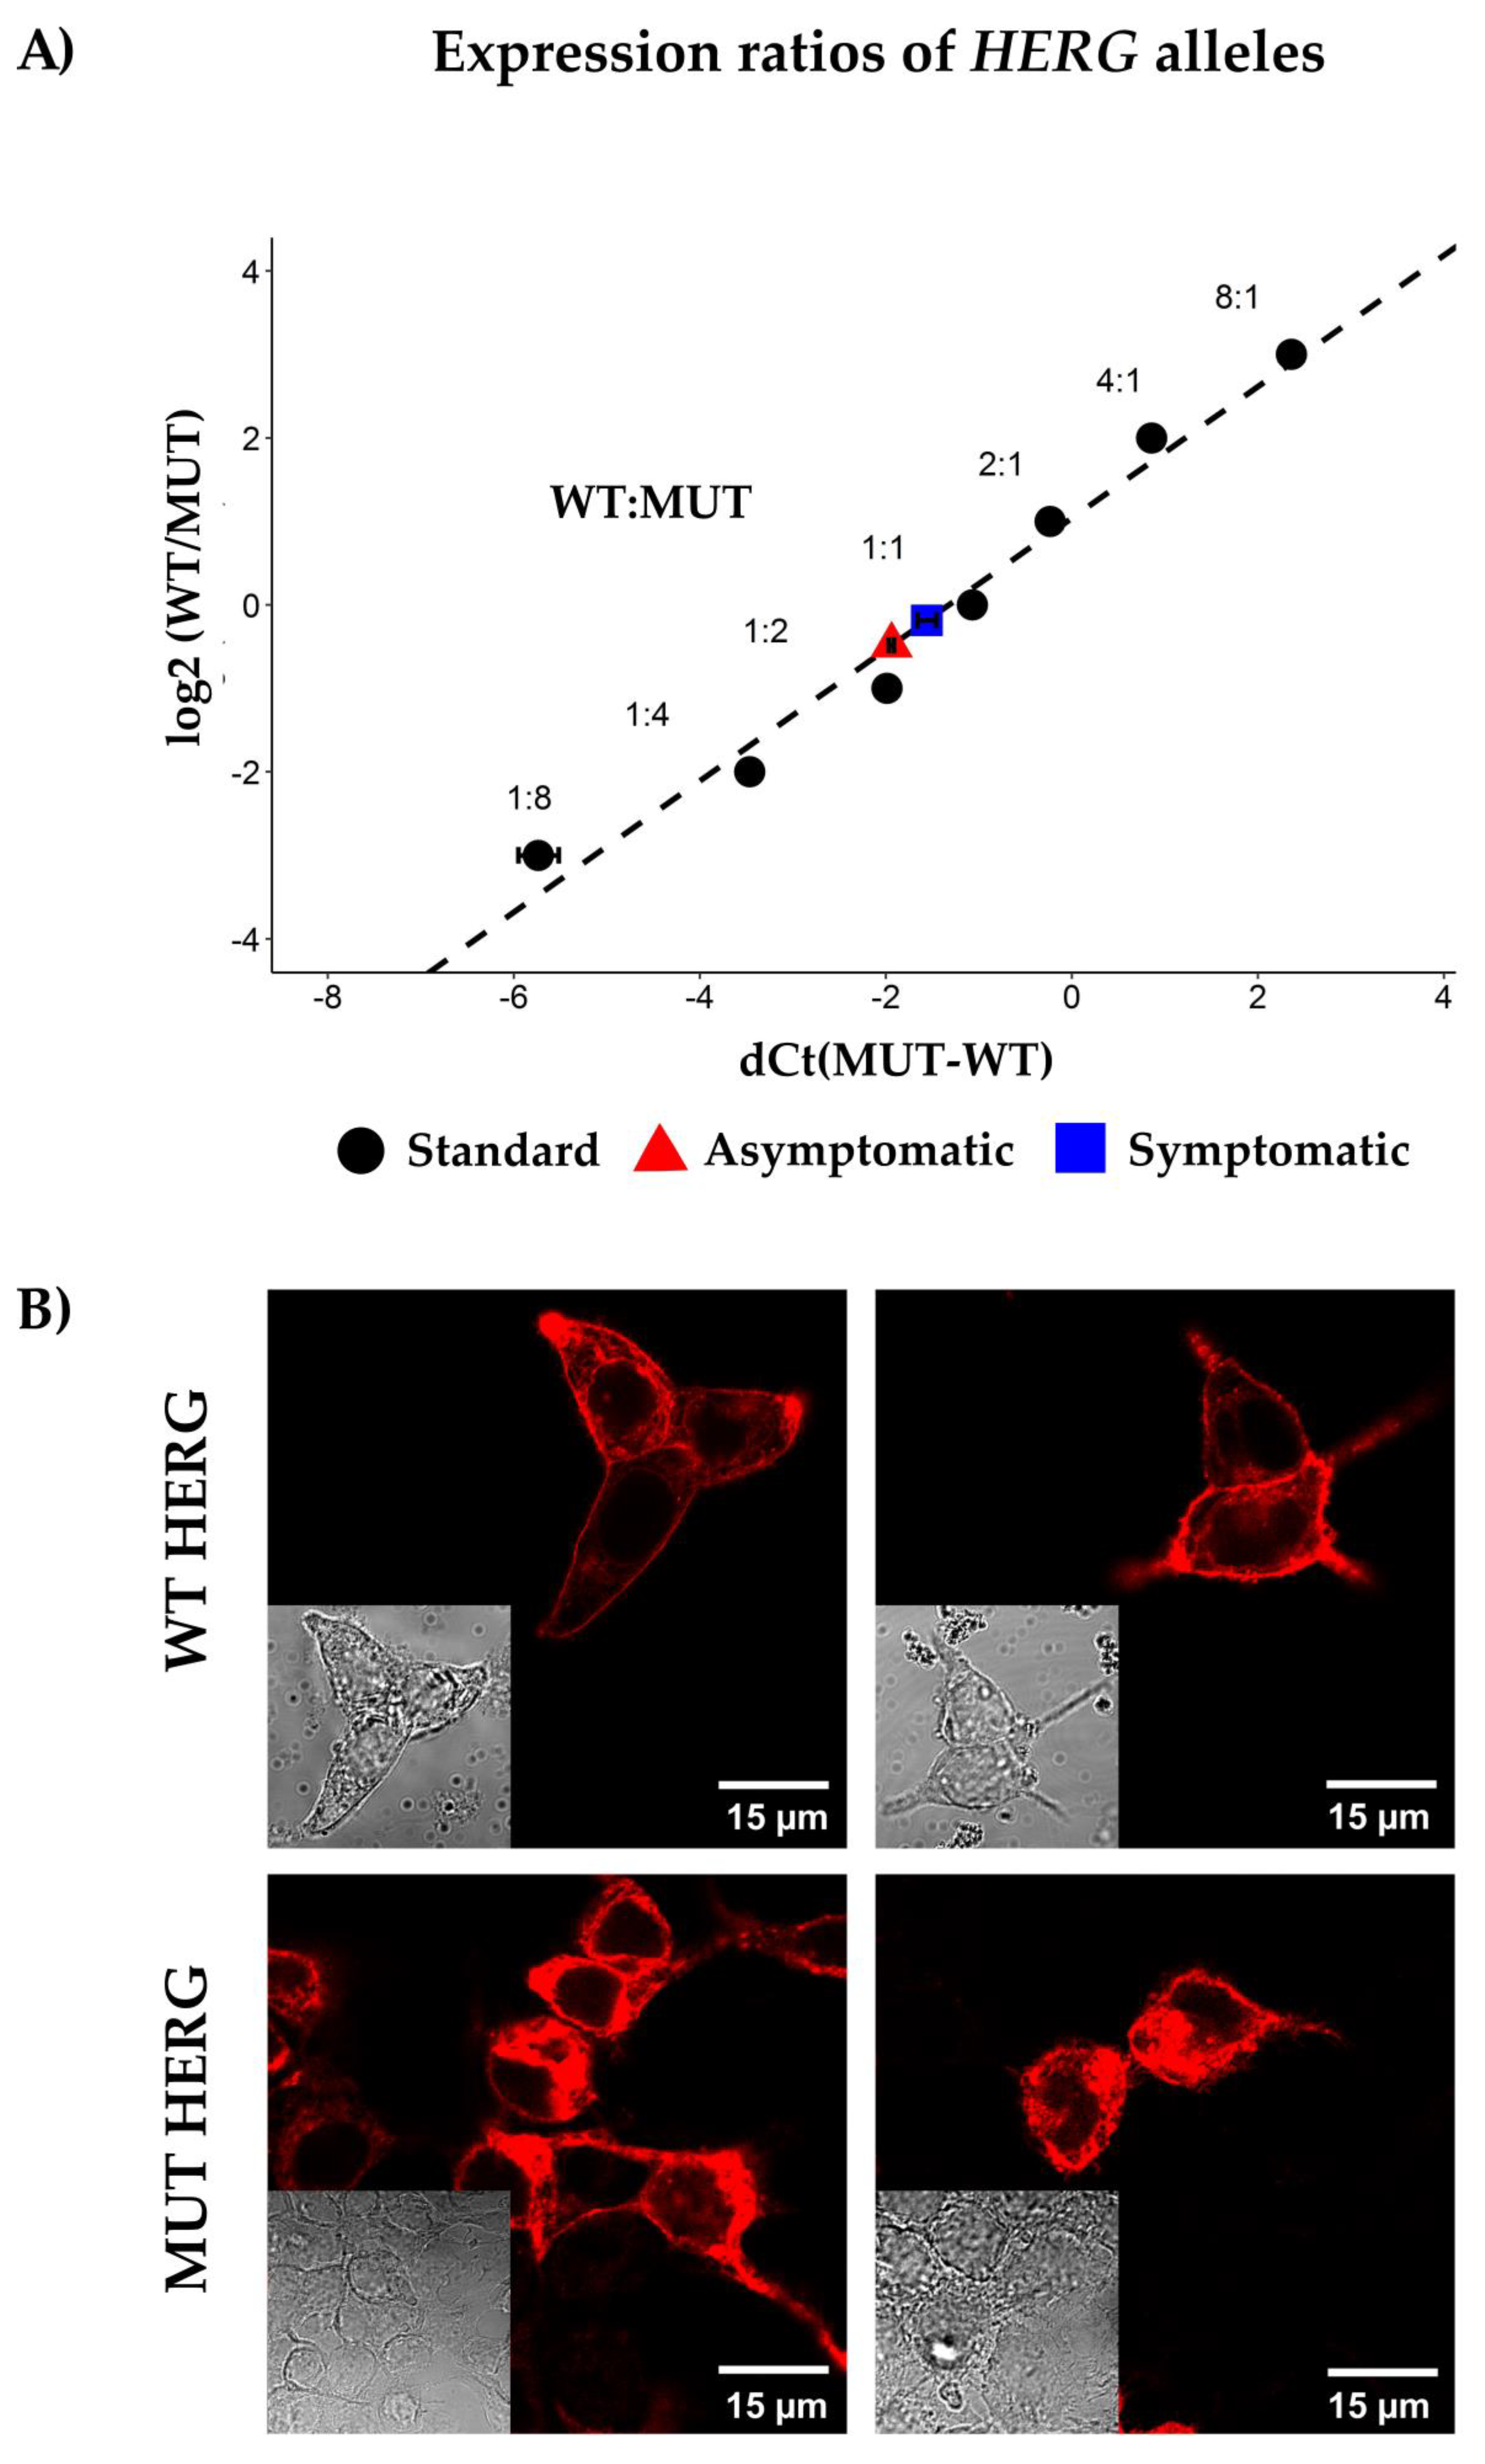
2.5. Allelic Imbalance
2.6. HERG Channel Expression in HEK-293 Expression System
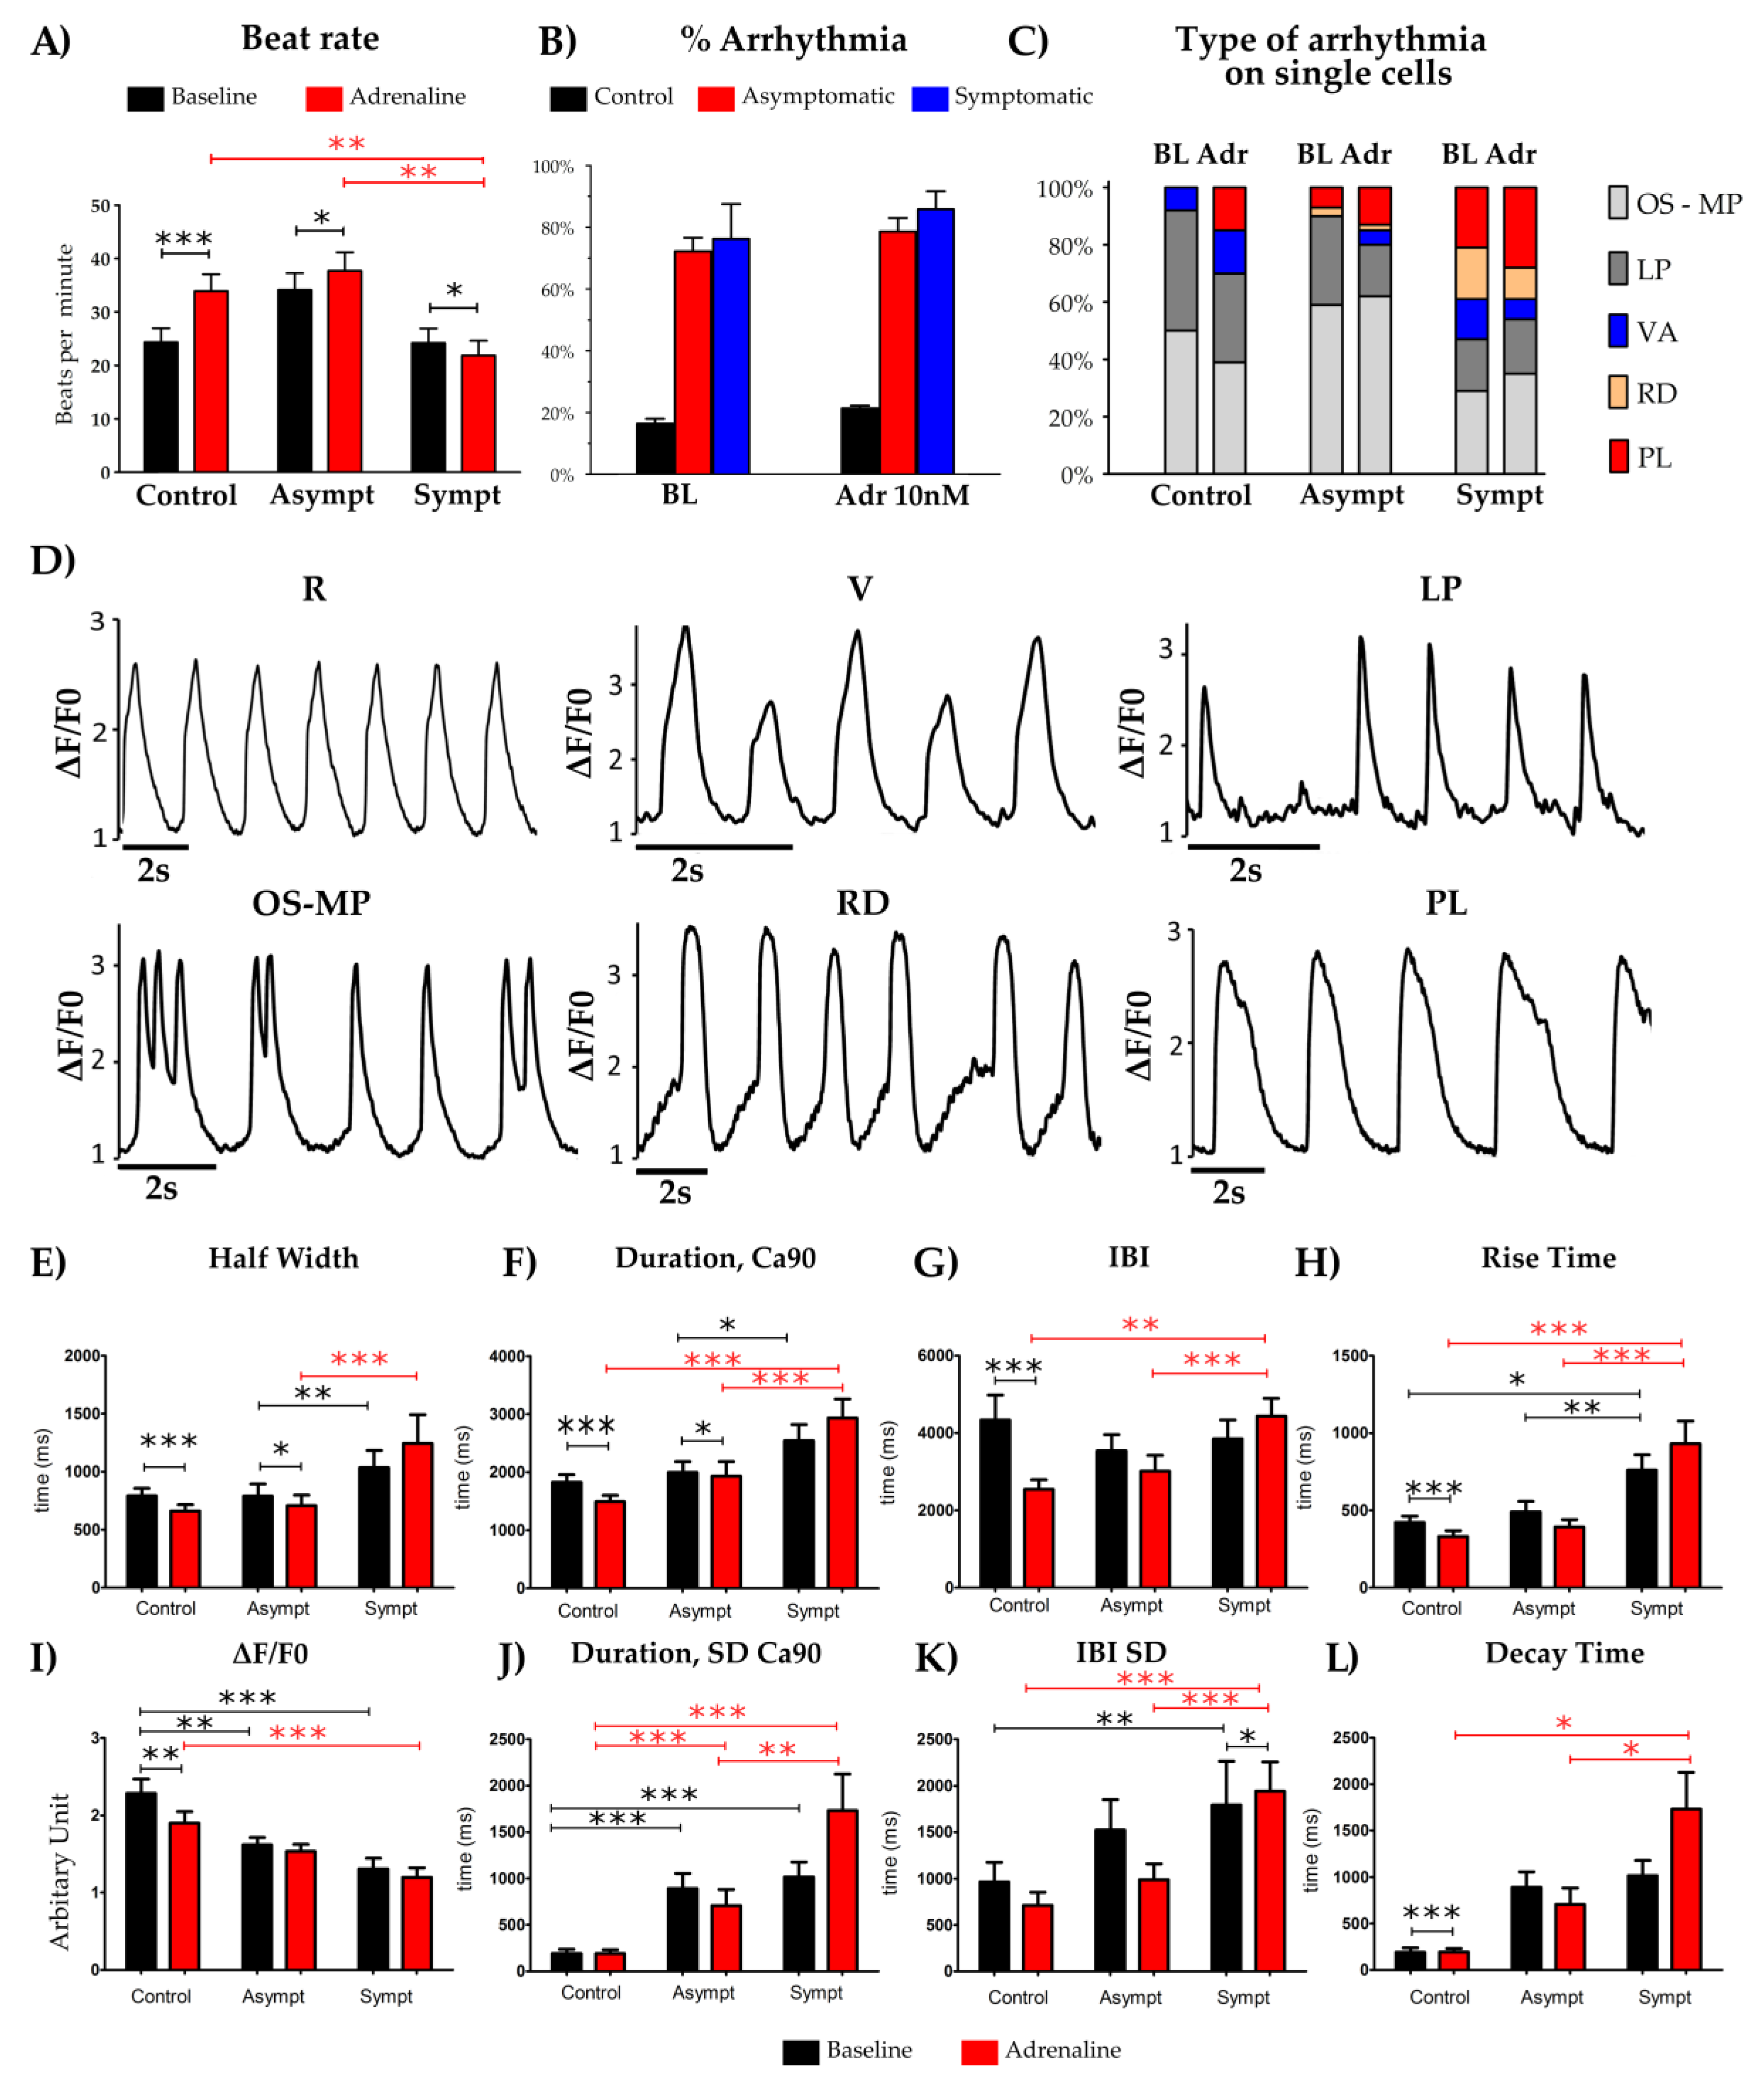
2.7. Ca2+ Imaging
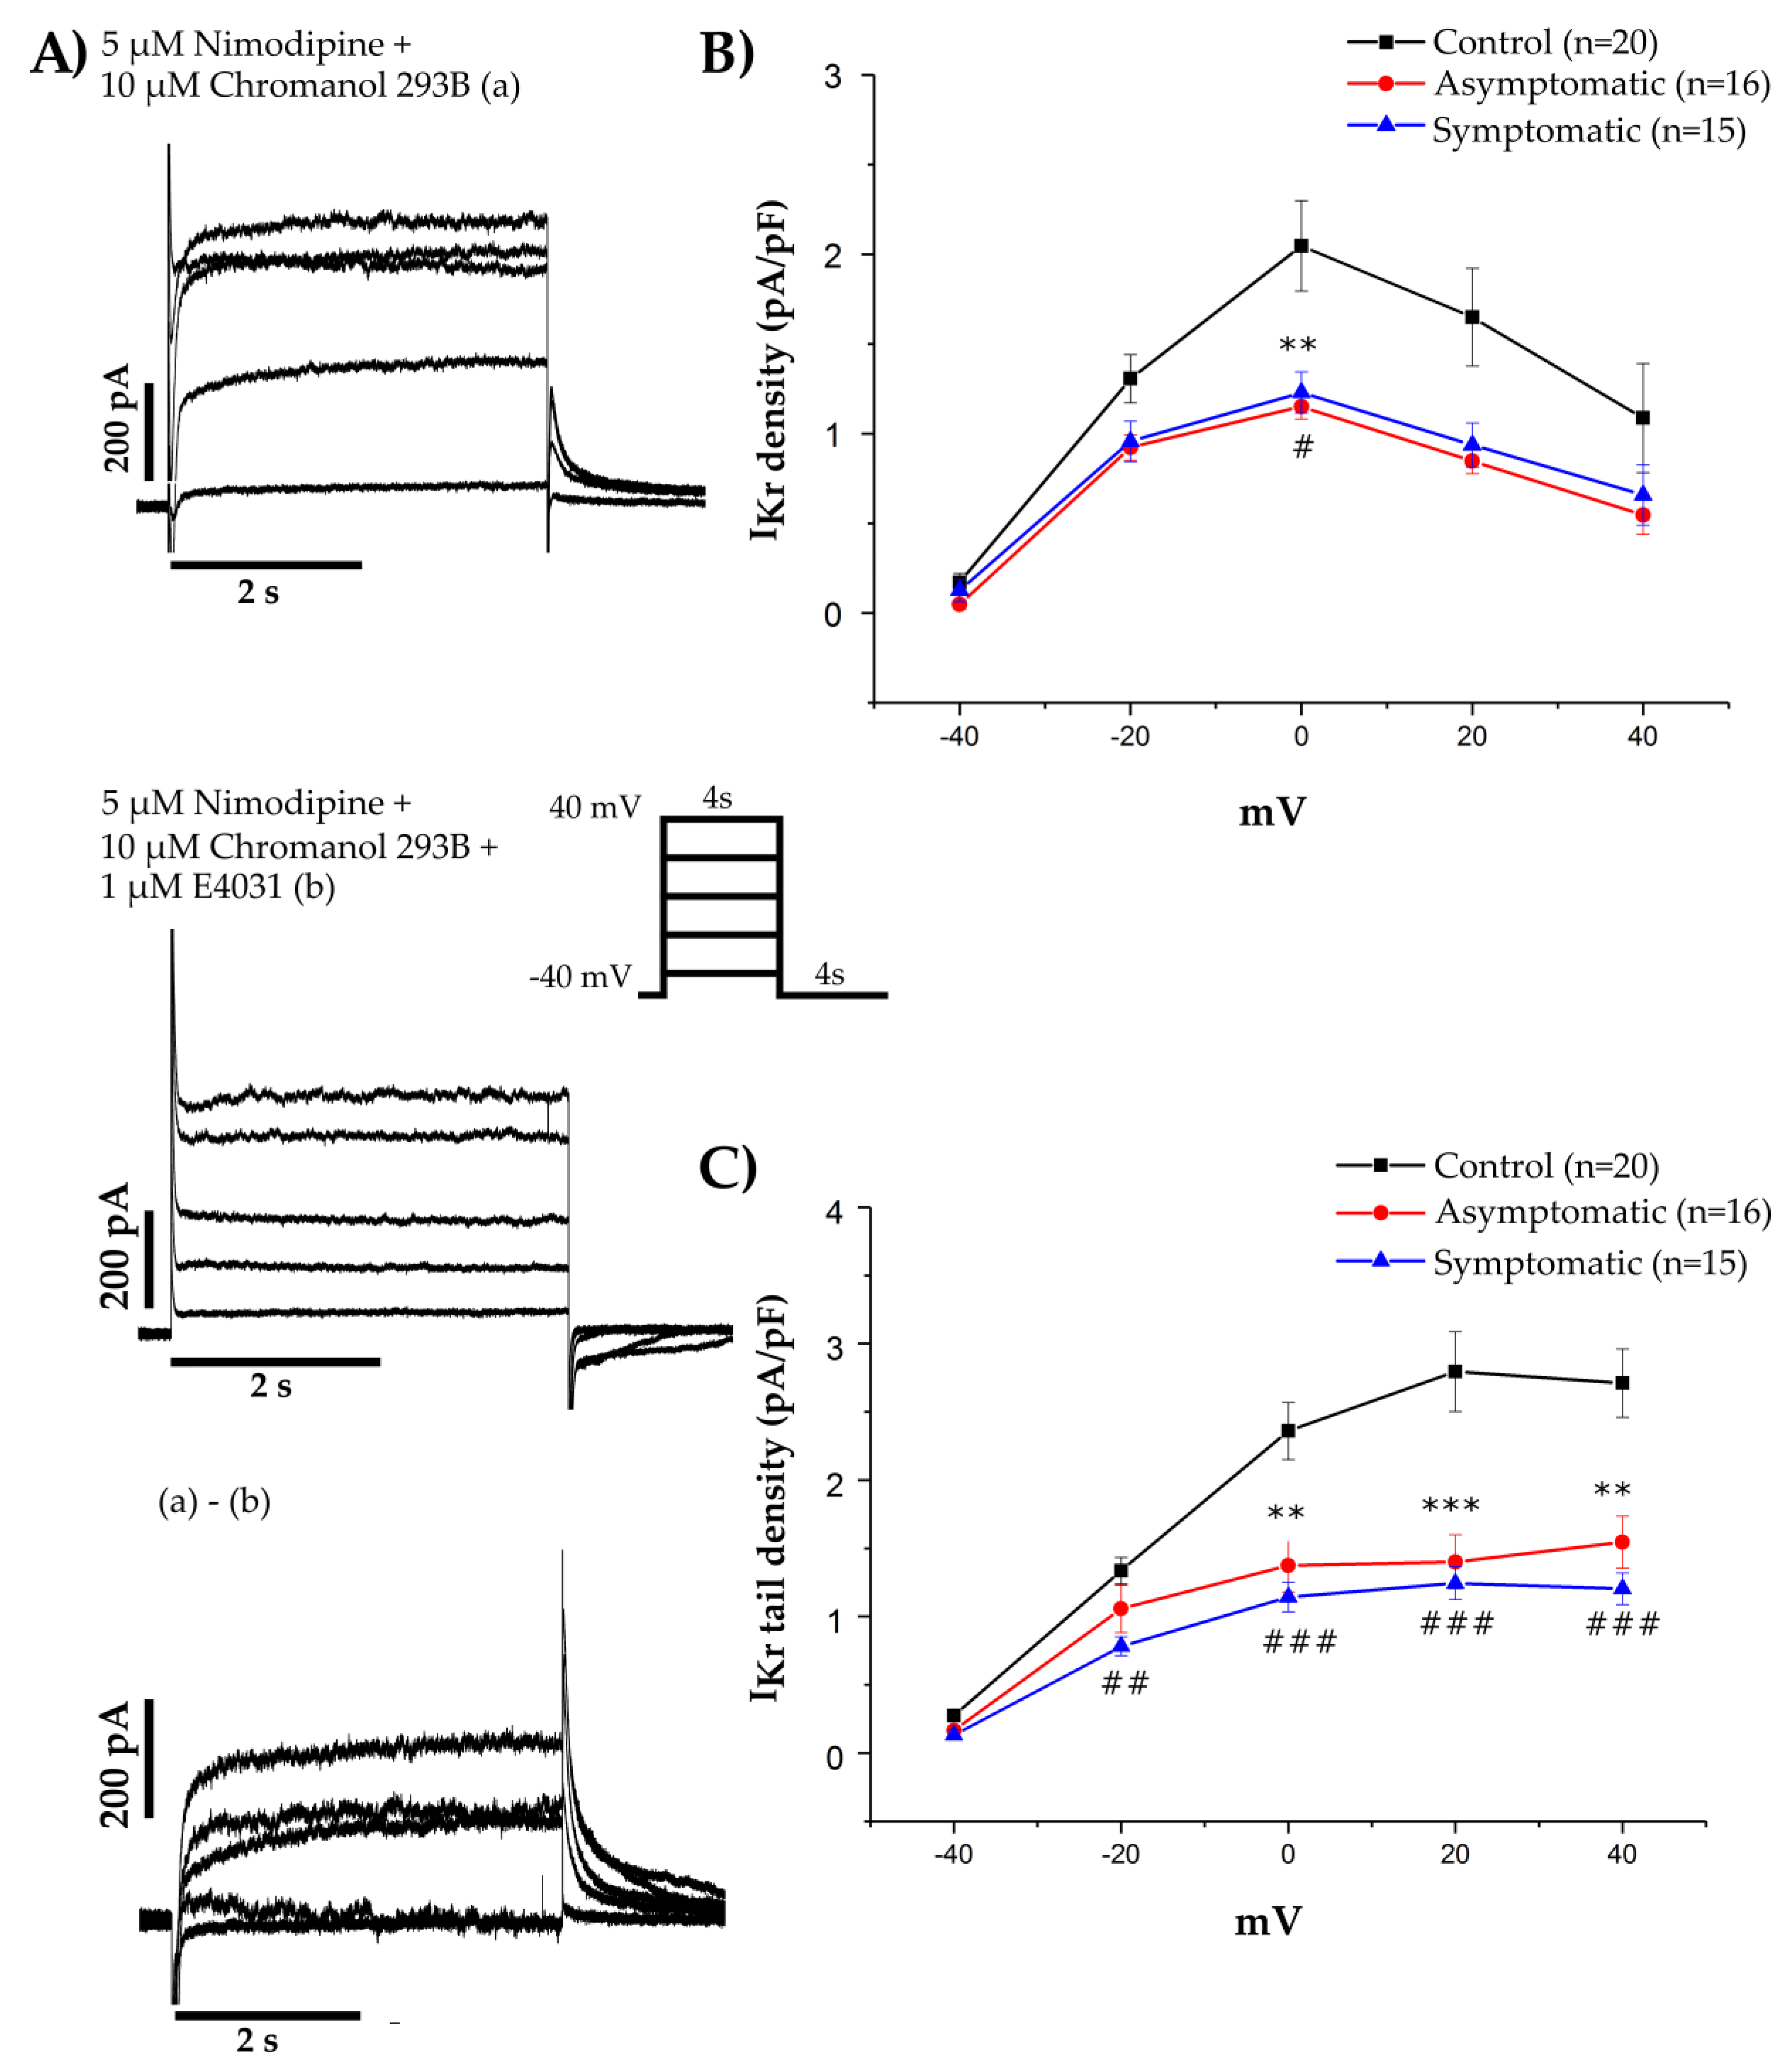
2.8. Voltage Clamp
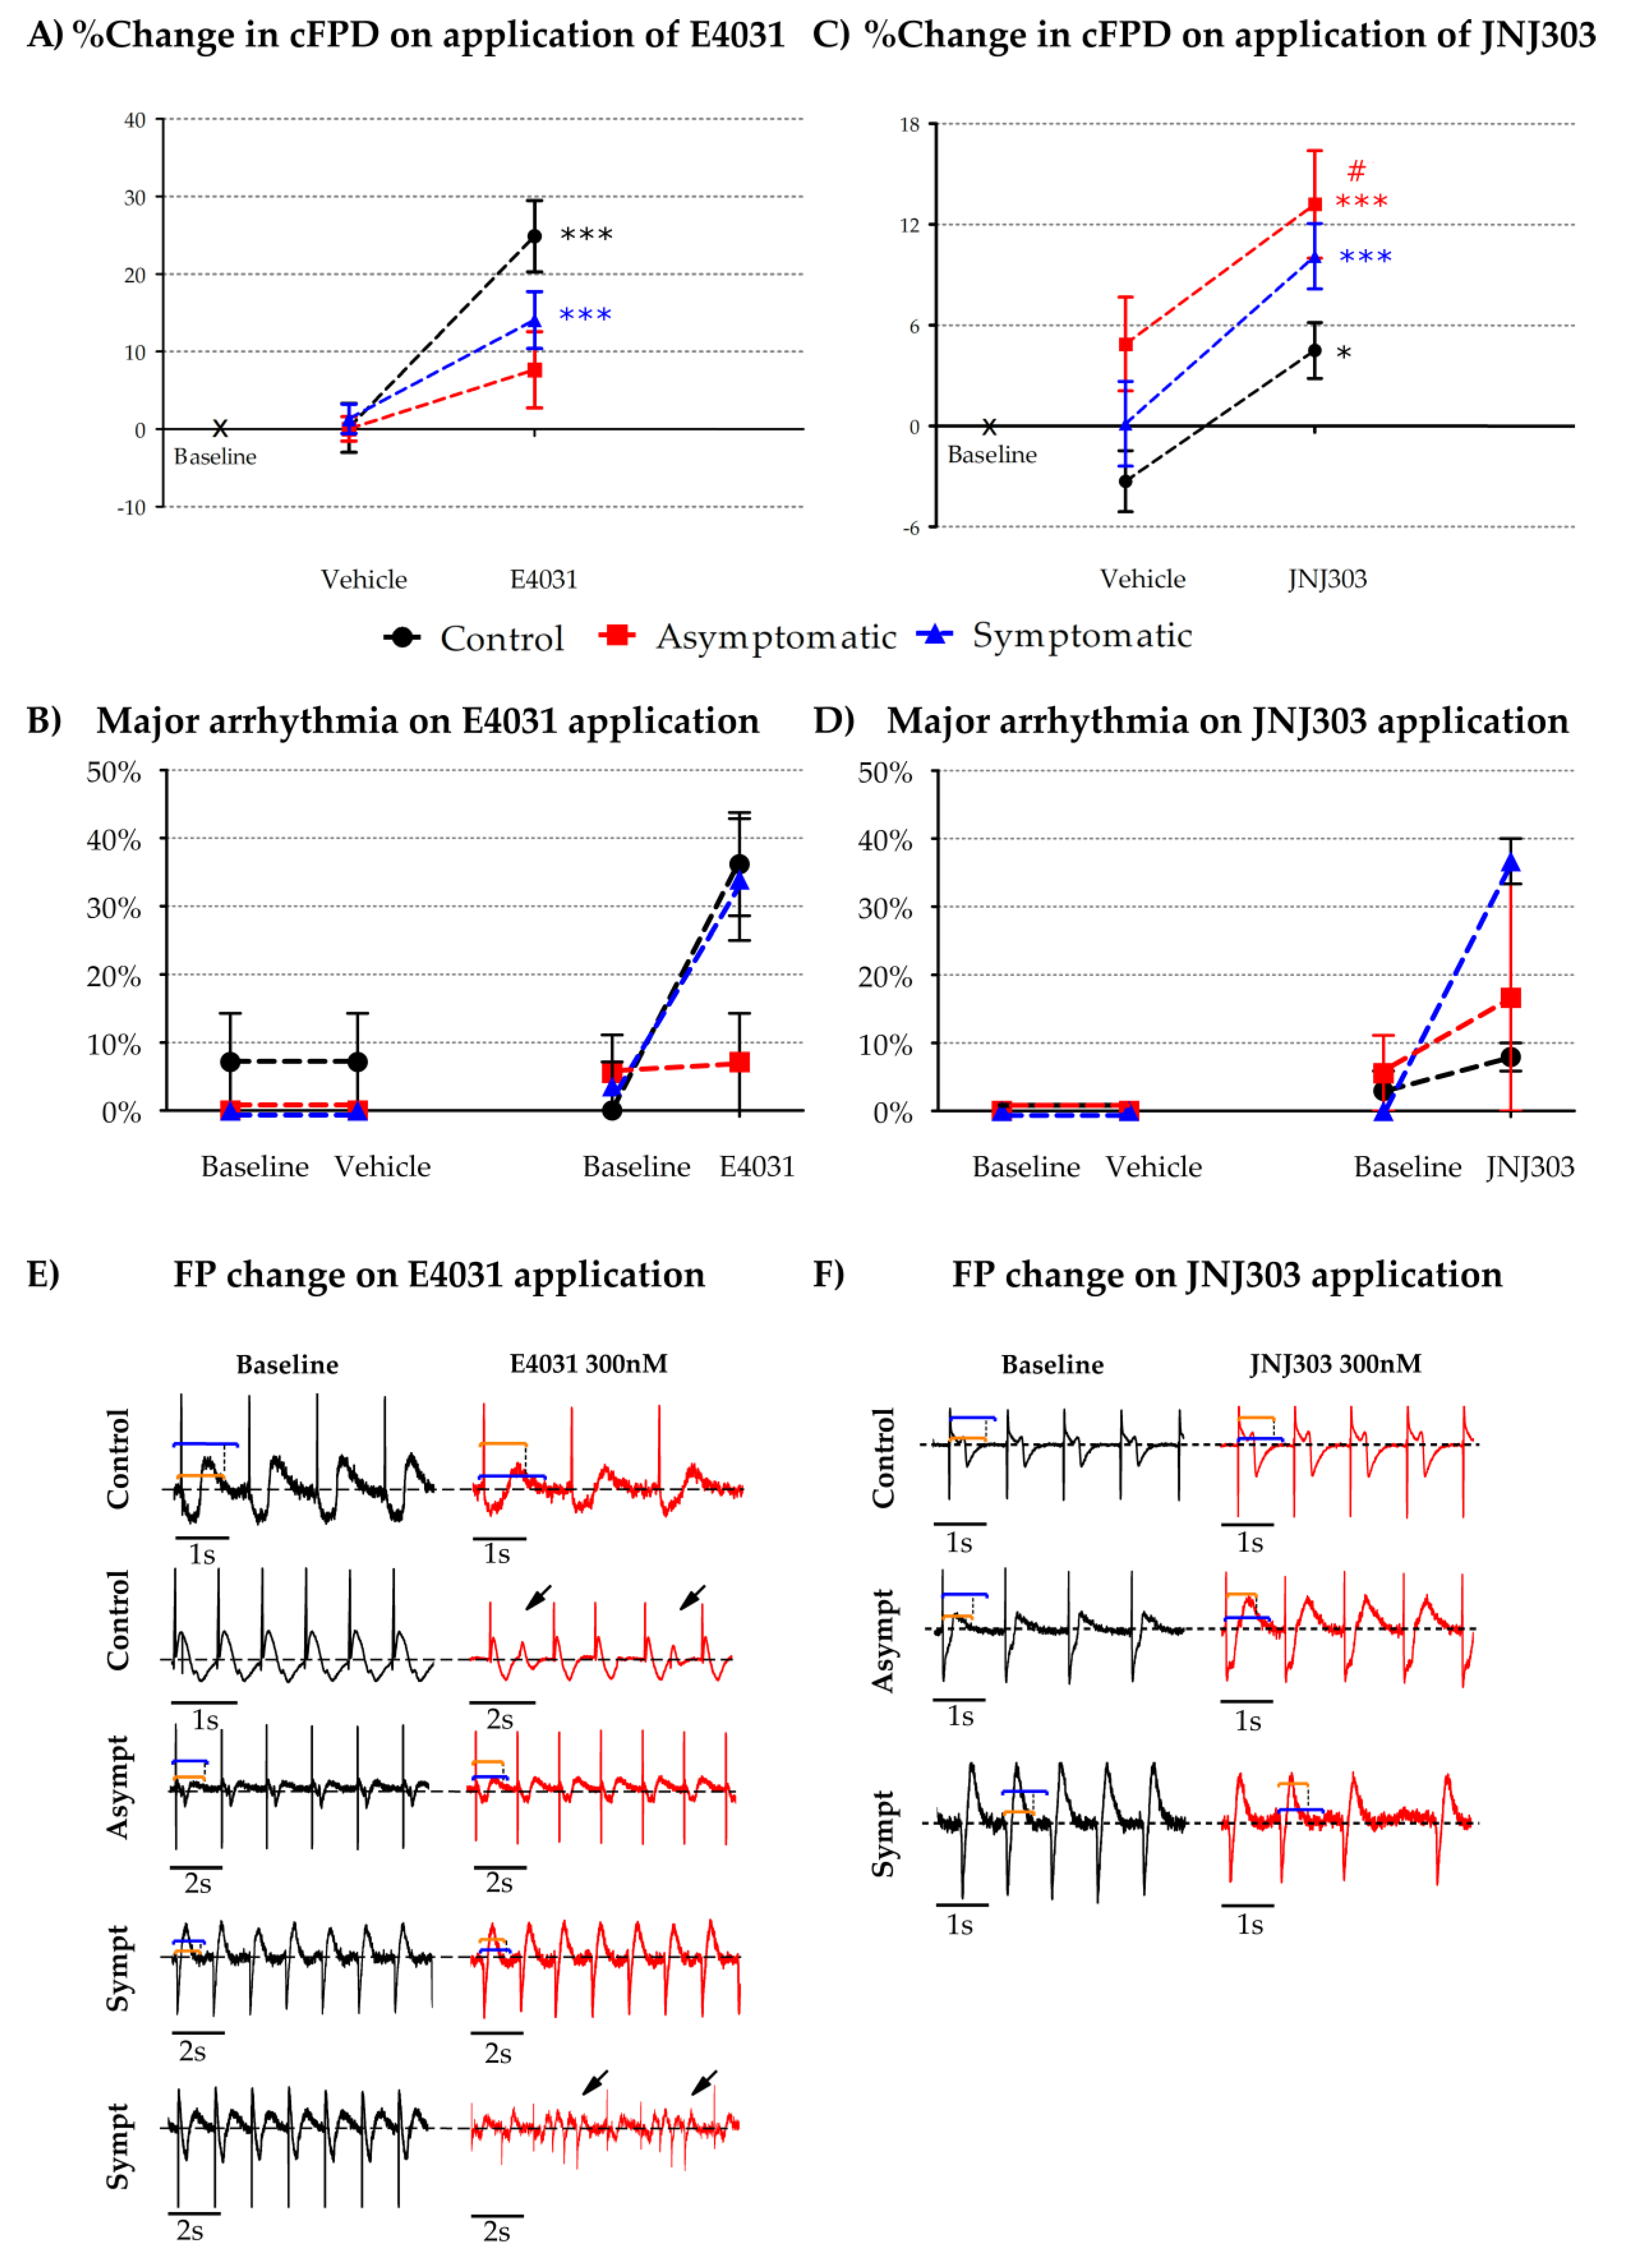
2.9. Micro Electrode Array (MEA) Electrophysiology
2.10. Mathematical Modeling and Computer Simulations of CM Function
2.11. Statistics
3. Results
4. Discussion
4.1. What Is the Mechanism for Reduced HERG Channel Function?
4.2. What Is Causing Arrhythmogenic Events in LQT2?
4.3. Limitations of the Study
5. Conclusions
Supplementary Materials
Author Contributions
Funding
Acknowledgments
Conflicts of Interest
References
- Marjamaa, A.; Salomaa, V.; Newton-Cheh, C.; Porthan, K.; Reunanen, A.; Karanko, H.; Jula, A.; Lahermo, P.; Väänänen, H.; Toivonen, L.; et al. High prevalence of four long QT syndrome founder mutations in the Finnish population. Ann. Med. 2009, 41, 234–240. [Google Scholar] [CrossRef] [PubMed] [Green Version]
- Schwartz, P.J.; Stramba-Badiale, M.; Lia, C.; Matteo, P.; Alessandra, B.; Giuliano, B.; Fulvio, G.; Karine, G.; Roberto, I.; Savina, M.; et al. Prevalence of the Congenital Long-QT Syndrome. Circulation 2009, 120, 1761–1767. [Google Scholar] [CrossRef] [PubMed]
- Fodstad, H.; Swan, H.; Laitinen, P.; Piippo, K.; Paavonen, K.; Viitasalo, M.; Toivonen, L.; Kontula, K. Four potassium channel mutations account for 73% of the genetic spectrum underlying long-QT syndrome (LQTS) and provide evidence for a strong founder effect in Finland. Ann. Med. 2004, 36, 53–63. [Google Scholar] [CrossRef] [PubMed]
- Shimizu, W.; Moss, A.J.; Wilde, A.A.M.; Towbin, J.A.; Ackerman, M.J.; January, C.T.; Tester, D.J.; Zareba, W.; Robinson, J.L.; Qi, M.; et al. Genotype-Phenotype Aspects of Type 2 Long QT Syndrome. J. Am. Coll. Cardiol. 2009, 54, 2052–2062. [Google Scholar] [CrossRef] [PubMed] [Green Version]
- Igor, S.; Jiaxiang, S.; Timothy, K.W.; Lehmann, M.H.; Silvia, P.; Robinson, J.L.; Moss, A.J.; Schwartz, P.J.; Towbin, J.A.; Michael, V.G.; et al. Spectrum of Mutations in Long-QT Syndrome Genes. Circulation 2000, 102, 1178–1185. [Google Scholar]
- Baskar, S.; Aziz, P.F. Genotype-phenotype correlation in long QT syndrome. Glob. Cardiol. Sci. Pract. 2015, 2015, 26. [Google Scholar] [CrossRef]
- Schwartz, P.J.; Priori, S.G.; Carla, S.; Moss, A.J.; Michael, V.G.; Carlo, N.; Isabelle, D.; Pascale, G.; Breithardt, G.; Keating, M.T.; et al. Genotype-Phenotype Correlation in the Long-QT Syndrome. Circulation 2001, 103, 89–95. [Google Scholar] [CrossRef] [Green Version]
- Kotoe, T.; Tomohiko, A.; Wataru, S.; Atsushi, K.; Tomonori, N.; Hideo, O.; Tomoyuki, K.; Hiroshi, T.; Shiro, K.; Minoru, H. Exercise Stress Test Amplifies Genotype-Phenotype Correlation in the LQT1 and LQT2 Forms of the Long-QT Syndrome. Circulation 2003, 107, 838–844. [Google Scholar]
- Curran, M.E.; Splawski, I.; Timothy, K.W.; Vincen, G.M.; Green, E.D.; Keating, M.T. A molecular basis for cardiac arrhythmia: HERG mutations cause long QT syndrome. Cell 1995, 80, 795–803. [Google Scholar] [CrossRef] [Green Version]
- Sanguinetti, M.C.; Curran, M.E.; Spector, P.S.; Keating, M.T. Spectrum of HERG K+-channel dysfunction in an inherited cardiac arrhythmia. Proc. Natl. Acad. Sci. USA 1996, 93, 2208. [Google Scholar] [CrossRef] [Green Version]
- Kim, J.A.; Lopes, C.M.; Moss, A.J.; McNitt, S.; Barsheshet, A.; Robinson, J.L.; Zareba, W.; Ackerman, M.J.; Kaufman, E.S.; Towbin, J.A.; et al. Trigger-specific risk factors and response to therapy in long QT syndrome type 2. Heart Rhythm 2010, 7, 1797–1805. [Google Scholar] [CrossRef] [Green Version]
- Hedley, P.L.; Jørgensen, P.; Schlamowitz, S.; Wangari, R.; Moolman-Smook, J.; Brink, P.A.; Kanters, J.; Corfield, V.A.; Christiansen, M. The genetic basis of long QT and short QT syndromes: A mutation update. Hum. Mutat. 2009, 30, 1486–1511. [Google Scholar] [CrossRef] [PubMed]
- Earle, N.; Yeo Han, D.; Pilbrow, A.; Crawford, J.; Smith, W.; Shelling, A.N.; Cameron, V.; Love, D.R.; Skinner, J.R. Single nucleotide polymorphisms in arrhythmia genes modify the risk of cardiac events and sudden death in long QT syndrome. Heart Rhythm 2014, 11, 76–82. [Google Scholar] [CrossRef] [PubMed]
- Chai, S.; Wan, X.; Ramirez-Navarro, A.; Tesar, P.J.; Kaufman, E.S.; Ficker, E.; George, A.L., Jr.; Deschenes, I. Physiological genomics identifies genetic modifiers of long QT syndrome type 2 severity. J. Clin. Investig. 2018, 128, 1043–1056. [Google Scholar] [CrossRef] [PubMed] [Green Version]
- Anderson, C.L.; Kuzmicki, C.E.; Childs, R.R.; Hintz, C.J.; Delisle, B.P.; January, C.T. Large-scale mutational analysis of Kv11.1 reveals molecular insights into type 2 long QT syndrome. Nat. Commun. 2014, 5, 5535. [Google Scholar] [CrossRef]
- Platonov Pyotr, G.; Scott, M.; Bronislava, P.; Rosero, S.Z.; Valentina, K.; Allison, H.; Moss, A.J.; Wojciech, Z. Risk Stratification of Type 2 Long-QT Syndrome Mutation Carriers With Normal QTc Interval. Circ. Arrhythmia Electrophysiol. 2018, 11, e005918. [Google Scholar] [CrossRef]
- Amin, A.S.; Pinto, Y.M.; Wilde, A.A.M. Long QT syndrome: Beyond the causal mutation. J. Physiol. 2013, 591, 4125–4139. [Google Scholar] [CrossRef] [Green Version]
- Moss, A.J.; Wojciech, Z.; Kaufman, E.S.; Eric, G.; Peterson, D.R.; Jesaia, B.; Towbin, J.A.; Keating, M.T.; Priori, S.G.; Schwartz, P.J.; et al. Increased Risk of Arrhythmic Events in Long-QT Syndrome With Mutations in the Pore Region of the Human Ether-a-go-go-Related Gene Potassium Channel. Circulation 2002, 105, 794–799. [Google Scholar] [CrossRef] [Green Version]
- Lia, C.; Lundquist, A.L.; Roberto, I.; Matteo, P.; Chiara, F.; De Ferrari, G.M.; Alessandro, V.; Ping, Y.; Roden, D.M.; George, A.L.; et al. KCNH2-K897T Is a Genetic Modifier of Latent Congenital Long-QT Syndrome. Circulation 2005, 112, 1251–1258. [Google Scholar]
- Goldenberg, I.; Horr, S.; Moss, A.J.; Lopes, C.M.; Barsheshet, A.; McNitt, S.; Zareba, W.; Andrews, M.L.; Robinson, J.L.; Locati, E.H.; et al. Risk for life-threatening cardiac events in patients with genotype-confirmed long-QT syndrome and normal-range corrected QT intervals. J. Am. Coll. Cardiol. 2011, 57, 51–59. [Google Scholar] [CrossRef] [Green Version]
- Medeiros-Domingo, A.; Iturralde-Torres, P.; Ackerman, M.J. Clinical and Genetic Characteristics of Long QT Syndrome. Rev. Española Cardiol. (Engl. Ed.) 2007, 60, 739–752. [Google Scholar] [CrossRef]
- Al-Khatib, S.M.; Stevenson, W.G.; Ackerman, M.J.; Bryant, W.J.; Callans, D.J.; Curtis, A.B.; Deal, B.J.; Timm, D.; Field, M.E.; Fonarow, G.C.; et al. 2017 AHA/ACC/HRS Guideline for Management of Patients With Ventricular Arrhythmias and the Prevention of Sudden Cardiac Death. Circulation 2018, 138, e272–e391. [Google Scholar] [PubMed] [Green Version]
- Li, Y.; Sallam, K.; Schwartz, P.J.; Wu, J.C. Patient-Specific Induced Pluripotent Stem Cell-Based Disease Model for Pathogenesis Studies and Clinical Pharmacotherapy. Circ. Arrhythmia Electrophysiol. 2017, 10, e005398. [Google Scholar] [CrossRef]
- Itzhaki, I.; Maizels, L.; Huber, I.; Zwi-Dantsis, L.; Caspi, O.; Winterstern, A.; Feldman, O.; Gepstein, A.; Arbel, G.; Hammerman, H.; et al. Modelling the long QT syndrome with induced pluripotent stem cells. Nature 2011, 471, 225–229. [Google Scholar] [CrossRef] [PubMed]
- Moretti, A.; Bellin, M.; Welling, A.; Jung, C.B.; Lam, J.T.; Bott-Flügel, L.; Dorn, T.; Goedel, A.; Höhnke, C.; Hofmann, F.; et al. Patient-Specific Induced Pluripotent Stem-Cell Models for Long-QT Syndrome. N. Engl. J. Med. 2010, 363, 1397–1409. [Google Scholar] [CrossRef] [PubMed] [Green Version]
- Malan, D.; Zhang, M.; Stallmeyer, B.; Muller, J.; Fleischmann, B.K.; Schulze-Bahr, E.; Sasse, P.; Greber, B. Human iPS cell model of type 3 long QT syndrome recapitulates drug-based phenotype correction. Basic Res. Cardiol. 2016, 111, 14. [Google Scholar] [CrossRef] [Green Version]
- Liang, P.; Sallam, K.; Wu, H.; Li, Y.; Itzhaki, I.; Garg, P.; Zhang, Y.; Vermglinchan, V.; Lan, F.; Gu, M.; et al. Patient-Specific and Genome-Edited Induced Pluripotent Stem Cell-Derived Cardiomyocytes Elucidate Single-Cell Phenotype of Brugada Syndrome. J. Am. Coll. Cardiol. 2016, 68, 2086–2096. [Google Scholar] [CrossRef]
- Lahti, A.L.; Kujala, V.J.; Chapman, H.; Koivisto, A.; Pekkanen-Mattila, M.; Kerkela, E.; Hyttinen, J.; Kontula, K.; Swan, H.; Conklin, B.R.; et al. Model for long QT syndrome type 2 using human iPS cells demonstrates arrhythmogenic characteristics in cell culture. Dis. Models Mech. 2011, 5, 220–230. [Google Scholar] [CrossRef] [Green Version]
- Mehta, A.; Ramachandra, C.J.A.; Singh, P.; Chitre, A.; Lua, C.H.; Mura, M.; Crotti, L.; Wong, P.; Schwartz, P.J.; Gnecchi, M.; et al. Identification of a targeted and testable antiarrhythmic therapy for long-QT syndrome type 2 using a patient-specific cellular model. Eur. Heart J. 2017, 39, 1446–1455. [Google Scholar] [CrossRef]
- Piippo, K.; Laitinen, P.; Swan, H.; Toivonen, L.; Viitasalo, M.; Pasternack, M.; Paavonen, K.; Chapman, H.; Wann, K.T.; Hirvelä, E.; et al. Homozygosity for a HERG potassium channel mutation causes a severe form of long QT syndrome: Identification of an apparent founder mutation in the Finns. J. Am. Coll. Cardiol. 2000, 35, 1919–1925. [Google Scholar] [CrossRef] [Green Version]
- Ahola, A.; Kiviaho, A.L.; Larsson, K.; Honkanen, M.; Aalto-Setala, K.; Hyttinen, J. Video image-based analysis of single human induced pluripotent stem cell derived cardiomyocyte beating dynamics using digital image correlation. Biomed. Eng. Online 2014, 13, 39. [Google Scholar] [CrossRef] [PubMed] [Green Version]
- Mummery, C.L.; Zhang, J.; Ng, E.S.; Elliott, D.A.; Elefanty, A.G.; Kamp, T.J. Differentiation of human embryonic stem cells and induced pluripotent stem cells to cardiomyocytes: A methods overview. Circ. Res. 2012, 111, 344–358. [Google Scholar] [CrossRef] [PubMed]
- Shah, D.; Virtanen, L.; Prajapati, C.; Kiamehr, M.; Gullmets, J.; West, G.; Kreutzer, J.; Pekkanen-Mattila, M.; Helio, T.; Kallio, P.; et al. Modeling of LMNA-Related Dilated Cardiomyopathy Using Human Induced Pluripotent Stem Cells. Cells 2019, 8, 594. [Google Scholar] [CrossRef] [PubMed] [Green Version]
- Asahi, Y.; Hamada, T.; Hattori, A.; Matsuura, K.; Odaka, M.; Nomura, F.; Kaneko, T.; Abe, Y.; Takasuna, K.; Sanbuissho, A.; et al. On-chip spatiotemporal electrophysiological analysis of human stem cell derived cardiomyocytes enables quantitative assessment of proarrhythmia in drug development. Sci. Rep. 2018, 8, 14536. [Google Scholar] [CrossRef] [PubMed]
- Koivumäki, J.T.; Naumenko, N.; Tuomainen, T.; Takalo, J.; Oksanen, M.; Puttonen, K.A.; Lehtonen, S.; Kuusisto, J.; Laakso, M.; Koistinaho, J.; et al. Structural Immaturity of Human iPSC-Derived Cardiomyocytes: In Silico Investigation of Effects on Function and Disease Modeling. Front. Physiol. 2018, 9, 80. [Google Scholar]
- Penttinen, K.; Siirtola, H.; Avalos-Salguero, J.; Vainio, T.; Juhola, M.; Aalto-Setala, K. Novel Analysis Software for Detecting and Classifying Ca2+ Transient Abnormalities in Stem Cell-Derived Cardiomyocytes. PLoS ONE 2015, 10, e0135806. [Google Scholar] [CrossRef]
- Pölönen, R.P.; Penttinen, K.; Swan, H.; Aalto-Setälä, K. Antiarrhythmic Effects of Carvedilol and Flecainide in Cardiomyocytes Derived from Catecholaminergic Polymorphic Ventricular Tachycardia Patients. Stem Cells Int. 2018, 2018, 11. [Google Scholar] [CrossRef]
- Chen, X.; Weaver, J.; Bove, B.A.; Vanderveer, L.A.; Weil, S.C.; Miron, A.; Daly, M.B.; Godwin, A.K. Allelic imbalance in BRCA1 and BRCA2 gene expression is associated with an increased breast cancer risk. Hum. Mol. Genet. 2008, 17, 1336–1348. [Google Scholar] [CrossRef]
- Amin, A.S.; Giudicessi, J.R.; Tijsen, A.J.; Spanjaart, A.M.; Reckman, Y.J.; Klemens, C.A.; Tanck, M.W.; Kapplinger, J.D.; Hofman, N.; Sinner, M.F.; et al. Variants in the 3′ untranslated region of the KCNQ1-encoded Kv7.1 potassium channel modify disease severity in patients with type 1 long QT syndrome in an allele-specific manner. Eur. Heart. J. 2011, 33, 714–723. [Google Scholar] [CrossRef] [PubMed] [Green Version]
- Wang, W.; MacKinnon, R. Cryo-EM Structure of the Open Human Ether-a-go-go-Related K(+) Channel hERG. Cell 2017, 169, 422–430.e10. [Google Scholar] [CrossRef] [PubMed] [Green Version]
- Jones, D.K.; Liu, F.; Vaidyanathan, R.; Eckhardt, L.L.; Trudeau, M.C.; Robertson, G.A. hERG 1b is critical for human cardiac repolarization. Proc. Natl. Acad. Sci. USA 2014, 111, 18073. [Google Scholar] [CrossRef] [PubMed] [Green Version]
- Johnson, D.M.; Heijman, J.; Bode, E.F.; Greensmith, D.J.; van der Linde, H.; Abi-Gerges, N.; Eisner, D.; Trafford, A.W.; Volders, P.G.A. Diastolic Spontaneous Calcium Release from the Sarcoplasmic Reticulum Increases Beat-to-Beat Variability of Repolarization in Canine Ventricular Myocytes after β-Adrenergic Stimulation. Circ. Res. 2013, 112, 246–256. [Google Scholar] [CrossRef] [PubMed] [Green Version]
- Thomsen, M.B.; Volders, P.G.A.; Beekman, J.D.M.; Matz, J.; Vos, M.A. Beat-to-Beat Variability of Repolarization Determines Proarrhythmic Outcome in Dogs Susceptible to Drug-Induced Torsades de Pointes. J. Am. Coll. Cardiol. 2006, 48, 1268–1276. [Google Scholar] [CrossRef] [PubMed]
- Kujala, K.; Paavola, J.; Lahti, A.; Larsson, K.; Pekkanen-Mattila, M.; Viitasalo, M.; Lahtinen, A.M.; Toivonen, L.; Kontula, K.; Swan, H.; et al. Cell model of catecholaminergic polymorphic ventricular tachycardia reveals early and delayed afterdepolarizations. PloS ONE 2012, 7, e44660. [Google Scholar] [CrossRef] [PubMed]
- Wu, H.; Lee, J.; Vincent, L.G.; Wang, Q.; Gu, M.; Lan, F.; Churko, J.M.; Sallam, K.I.; Matsa, E.; Sharma, A.; et al. Epigenetic Regulation of Phosphodiesterases 2A and 3A Underlies Compromised β-Adrenergic Signaling in an iPSC Model of Dilated Cardiomyopathy. Cell Stem Cell 2015, 17, 89–100. [Google Scholar] [CrossRef] [Green Version]
- Wenjian, L.; Lyon, Q.; Nataliya, P.; Wenjun, L.; Owens, A.T.; McDermott-Roe, C.; Kiran, M. Functional Annotation of TNNT2 Variants of Uncertain Significance with Genome-Edited Cardiomyocytes. Circulation 2018, 138, 2852–2854. [Google Scholar]
- Matsa, E.; Rajamohan, D.; Dick, E.; Young, L.; Mellor, I.; Staniforth, A.; Denning, C. Drug evaluation in cardiomyocytes derived from human induced pluripotent stem cells carrying a long QT syndrome type 2 mutation. Eur. Heart J. 2011, 32, 952–962. [Google Scholar] [CrossRef] [Green Version]
- Tan, H.L.; Abdennasser, B.; Wataru, S.; Moss, A.J.; Schulze-Bahr, E.; Takashi, N.; Wilde, A.A. Genotype-Specific Onset of Arrhythmias in Congenital Long-QT Syndrome. Circulation 2006, 114, 2096–2103. [Google Scholar] [CrossRef]
- Nemec, J.; Kim, J.J.; Gabris, B.; Salama, G. Calcium oscillations and T-wave lability precede ventricular arrhythmias in acquired long QT type 2. Heart Rhythm 2010, 7, 1686–1694. [Google Scholar] [CrossRef] [Green Version]
- Liu, W.; Kim, T.Y.; Huang, X.; Liu, M.B.; Koren, G.; Choi, B.; Qu, Z. Mechanisms linking T-wave alternans to spontaneous initiation of ventricular arrhythmias in rabbit models of long QT syndrome. J. Physiol. 2018, 596, 1341–1355. [Google Scholar] [CrossRef]
- Poelzing, S.; Rosenbaum, D.S. Cellular Mechanisms of Torsade de Pointes. Novartis Found. Symp. 2005, 266, 204–224. [Google Scholar] [PubMed]
- Antzelevitch, C.; Yan, G.; Shimizu, W. Transmural dispersion of repolarization and arrhythmogenicity: The brugada syndrome versus the long QT syndrome. J. Electrocardiol. 1999, 32, 158–165. [Google Scholar] [CrossRef]
- Quan, X.; Bai, R.; Lu, J.; Patel, C.; Liu, N.; Ruan, Y.; Chen, B.; Ruan, L.; Zhang, C. Pharmacological Enhancement of Cardiac Gap Junction Coupling Prevents Arrhythmias in Canine LQT2 Model. Cell Commun. Adhes. 2009, 16, 29–38. [Google Scholar] [CrossRef] [PubMed]
- Braam, S.R.; Tertoolen, L.; Casini, S.; Matsa, E.; Lu, H.R.; Teisman, A.; Passier, R.; Denning, C.; Gallacher, D.J.; Towart, R.; et al. Repolarization reserve determines drug responses in human pluripotent stem cell derived cardiomyocytes. Stem Cell Res. 2013, 10, 48–56. [Google Scholar] [CrossRef] [Green Version]
- Kuusela, J.; Kim, J.; Rasanen, E.; Aalto-Setala, K. The Effects of Pharmacological Compounds on Beat Rate Variations in Human Long QT-Syndrome Cardiomyocytes. Stem Cell Rev. Rep. 2016, 12, 698–707. [Google Scholar] [CrossRef] [PubMed]


© 2020 by the authors. Licensee MDPI, Basel, Switzerland. This article is an open access article distributed under the terms and conditions of the Creative Commons Attribution (CC BY) license (http://creativecommons.org/licenses/by/4.0/).
Share and Cite
Shah, D.; Prajapati, C.; Penttinen, K.; Cherian, R.M.; Koivumäki, J.T.; Alexanova, A.; Hyttinen, J.; Aalto-Setälä, K. hiPSC-Derived Cardiomyocyte Model of LQT2 Syndrome Derived from Asymptomatic and Symptomatic Mutation Carriers Reproduces Clinical Differences in Aggregates but Not in Single Cells. Cells 2020, 9, 1153. https://0-doi-org.brum.beds.ac.uk/10.3390/cells9051153
Shah D, Prajapati C, Penttinen K, Cherian RM, Koivumäki JT, Alexanova A, Hyttinen J, Aalto-Setälä K. hiPSC-Derived Cardiomyocyte Model of LQT2 Syndrome Derived from Asymptomatic and Symptomatic Mutation Carriers Reproduces Clinical Differences in Aggregates but Not in Single Cells. Cells. 2020; 9(5):1153. https://0-doi-org.brum.beds.ac.uk/10.3390/cells9051153
Chicago/Turabian StyleShah, Disheet, Chandra Prajapati, Kirsi Penttinen, Reeja Maria Cherian, Jussi T. Koivumäki, Anna Alexanova, Jari Hyttinen, and Katriina Aalto-Setälä. 2020. "hiPSC-Derived Cardiomyocyte Model of LQT2 Syndrome Derived from Asymptomatic and Symptomatic Mutation Carriers Reproduces Clinical Differences in Aggregates but Not in Single Cells" Cells 9, no. 5: 1153. https://0-doi-org.brum.beds.ac.uk/10.3390/cells9051153