Data Descriptor

The LAB-Net Soil Moisture Network: Application to Thermal Remote Sensing and Surface Energy Balance

by
Cristian Mattar
1,*,
Andrés Santamaría-Artigas
1,2,
Claudio Durán-Alarcón
1,
Luis Olivera-Guerra
1,
Rodrigo Fuster
3 and
Dager Borvarán
1
1
Laboratory for Analysis of the Biosphere (LAB), University of Chile, Santiago 8820808, Chile
2
Department of Geographical Sciences, University of Maryland, College Park, MD 20742, USA
3
Laboratory of Territorial Analysis (LAT), University of Chile, Santiago 8820808, Chile
*
Author to whom correspondence should be addressed.
Submission received: 23 February 2016 / Revised: 19 May 2016 / Accepted: 19 May 2016 / Published: 7 June 2016
(This article belongs to the Special Issue Temperature of the Earth)

Abstract

:
A set of Essential Climate Variables (ECV) have been defined to be monitored by current and new remote sensing missions. The ECV retrieved at global scale need to be validated in order to provide reliable products to be used in remote sensing applications. For this, test sites are required to use in calibration and validation of the remote sensing approaches in order to improve the ECV retrievals at global scale. The southern hemisphere presents scarce test sites for calibration and validation field campaigns that focus on soil moisture and land surface temperature retrievals. In Chile, remote sensing applications related to soil moisture estimates have increased during the last decades because of the drought and water use conflicts that generate a strong interest on improved water demand estimates. This work describes the Laboratory for Analysis of the Biosphere (LAB)—NETwork, called herein after ‘LAB-net’, which was designed to be the first network in Chile for remote sensing applications. The test sites were placed in four sites with different cover types: vineyards and olive orchards located in the semi-arid region of Atacama, an irrigated raspberry crop in the Mediterranean climate zone of Chimbarongo, and a rainfed pasture in the south of Chile. Over each site, well implemented meteorological and radiative flux instrumentation was installed and continuously recorded the following parameters: soil moisture and temperature at two ground levels (10 and 20 cm), air temperature and relative humidity, net radiation, global radiation, radiometric temperature (8–14 µm), rainfall and soil heat flux. The LAB-net data base post-processing procedure is also described here. As an application, surface remote sensing products such as soil moisture data derived from the Soil Moisture Ocean Salinity (SMOS) and Land Surface Temperature (LST) extracted from the MODIS-MOD11A1 and GOES LST from Copernicus products were compared to in situ data in Oromo LAB-net site. Moreover, land surface energy flux estimation is also shown as an application of LAB-net data base. These applications revealed a good performance between in situ and remote sensing data. LAB-net data base also contributes to provide suitable information for land surface energy budget and therefore water resources management at cultivars scale. The data based generated by LAB-net is freely available for any research or scientific purpose related to current and future remote sensing applications.
Data Set License: The LAB-net data set is made available under a CC-BY-NC license

1. Introduction

Soil moisture (SM) is one of the most essential climate variables, as it affects the hydrological and meteorological response of land’s surface, playing a main role in land–atmosphere interactions due to its control on evapotranspiration [1]. Global scale maps of SM are crucial for the initialization of Numerical Weather Prediction (NWP) models, climate change studies, surface-atmosphere interactions, and agricultural applications.
In order to provide SM maps at global scale, several dedicated remote sensing missions have been designed and launched during the last decades such as the Advanced Microwave Scanning Radiometer—EOS (AMSR-E), the Advanced Scatterometer (ASCAT), the Soil Moisture Ocean Salinity (SMOS), and the Soil Moisture Active Passive (SMAP) recently launched to provide new sources of soil moisture maps [2,3,4,5,6]. These missions use different remote sensing techniques in order to provide soil moisture products at a global scale in different temporal and spatial resolutions. Previous works have compared the information delivered by these missions in order to generate a comprehensive satellite intercomparison study to analyze their discrepancies and possible sources of error in addition to new blended soil moisture products at global scale [7,8,9,10,11,12,13,14].
In order to obtain ground-truth for the comparison of soil moisture products, regularly collected in situ measurements are a valuable source of information. Indeed, it has long been recognized that reliable, robust, and automated techniques for the measurement of soil moisture content can be extremely useful, if not essential, in hydrologic, environmental, and agricultural applications [15]. Nevertheless, to produce reliable large-scale SM measurements derived from in situ measurements, local or regional network needs to be created. This network should be able to maintain the availability of well-calibrated soil moisture measurements, provide a good representativeness of the instrumented zone, and to represent a wide range of landscapes or biomes provided by local sites distributed throughout the world [16,17,18].
There have been significant efforts to create a global network of in situ soil moisture measurements for the comparison with global SM products derived from remote sensing. For instance, the International Soil Moisture Network (ISMN) has provided daily values of soil moisture in different region of the world [17,19]. Nevertheless, ISMN still counts with a small number of stations in the southern hemisphere. Some of the most important soil moisture calibration and validation networks created in the southern hemisphere have been developed over Australia. These networks are described in several works based on experimental and calibration/validation field campaigns such as the OzNet networks [20], the National Airborne Field Experiment (NAFE) carried out during 2005 and 2006 [21,22], and the Australian Airborne Cal/Val Experiments for SMOS (AACES) [23]. These experiments combined in situ, airborne, and remote sensing data in order to compare and validate soil moisture retrievals generating a unique wide and comprehensive experiment in the terms of soil moisture monitoring campaigns.
Other efforts to provide soil moisture measurements in the southern hemisphere were carried out over Africa and South America in the so-called COsmic-ray Soil Moisture Observing System (COSMOS) [24]. In South America, COSMOS network contains three stations, all of them located in Brazil. Despite the fact that several meteorological stations may be currently measuring the soil moisture in different countries of South America, these stations are not well-known, and data are usually restricted to the owners, generating a lack of information. Thus, aiming for the enhancement of the soil moisture network in South America, the objective of this work is to present and describe “LAB-net”, the first Chilean soil moisture network which might be used to evaluate soil moisture products derived from remote sensing data over different land cover types. This manuscript is structured as follows: Section 2 shows the main description of LAB-net, the study sites, and instrumentation. Section 3 describes the instrument calibration methods, and data processing. Section 4 presents the applications of LAB-net data base to soil moisture and land surface temperature comparison to remote sensing products and land surface energy budget estimation. Finally, Section 5 shows the discussion and conclusions of this work.

2. LAB-Net Description

LAB-net was made possible by the contribution of two Chilean national research projects. One focused on soil moisture estimations at regional scale (Fondecyt-Iniciación), and the second one on irrigation efficiency in semi-arid regions (Fondef-IDeA). The main objective of these projects is to quantify the availability of water resources in a given basin by analyzing the consumption of water for crops, industry, mining, and population. Three catchments were selected to install the monitoring stations: “Copiapó”, “Tinguiririca”, and “Bueno”, which are located in the northern, center, and southern region of Chile, respectively. Four stations were installed over the catchments (two in “Copiapó”, one in “Tinguiririca” and one in “Bueno”) in order to represent different soil and land cover types. Implementation of the sites began October 2013 and the four stations were ready for monitoring in July 2014. Figure 1 shows the location of the LAB-net sites.

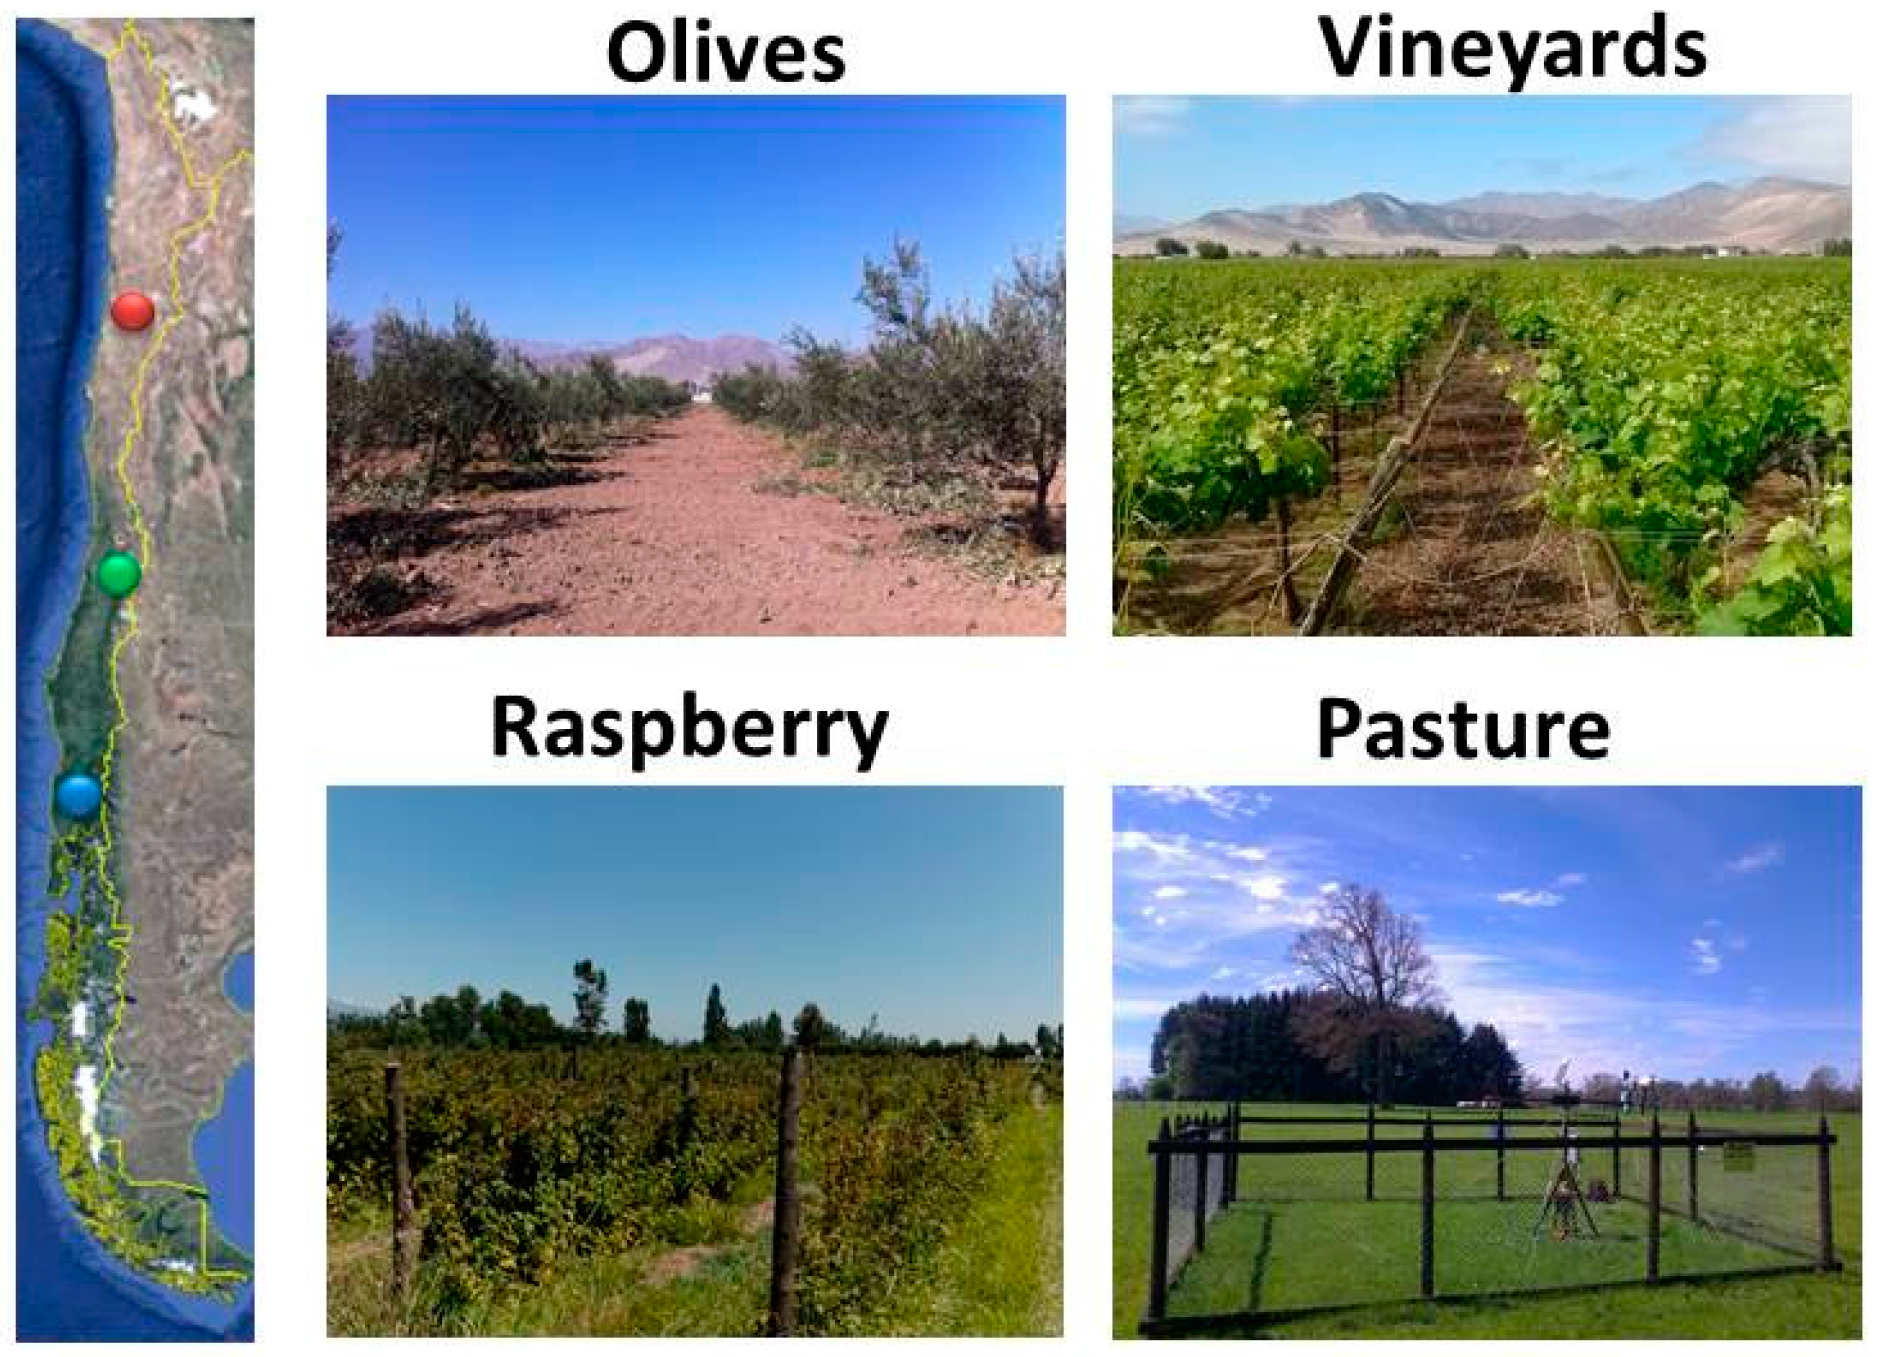
2.1. Ground Instrumentation

The LAB-net sites are configured to provide meteorological variables and radiative fluxes measurements for energy balance estimation. Measurements are made every minute, and the average value of 5 min is recorded. A maintenance plan is performed in each test site to preserve the optimal conditions and avoid any disturbance on the site being measured by the stations, which are only affected by crop management and harvest activities. The soil characteristics of each site are shown in Table 1, the high clay % and electrical conductivity observed in the Copiapó sites (not shown in Chimbarongo and Oromo) deserved more analysis because of their influence in the soil moisture measurements. The LAB-net sites are detailed in the following sections.

2.2. Copiapó

Copiapó is located in the “Atacama” region. It has a desert climate type, with an annual rainfall of 12 mm, a mean annual solar irradiance of 250 W·m−2, and a maximum, mean, and minimum annual air temperature, in average, of 23.9 °C, 15.2 °C, and 9.3 °C, respectively. The Copiapó valley can be divided in three main areas: the lower area, characterized by flat areas where olive and vineyards account for 76% of the agriculture zone; the middle area, where mining activities and vineyards are located; and the high mountain area of the valley, which is mainly used for mining activities, pastures, and tourism. In the last years, the Copiapó river has suffered from a strong water demand, which affected the groundwater storage [25]. This situation generates a sensible scenario concerning the future water scarcity and local efforts need to be focused into the development of new technologies that target water use efficiency. In Copiapó, two LAB-net stations were installed. One station was installed over olive orchards (27°19′13.46” S; 70°32′22.56” W), and other over a vineyard (27°17′41.69” S; 70°27′7.49” W) site. The soils in both sites are of the Aridisol order with moderate depth (20–100 cm) and show high salinity content. The soil was classified as “sodic salinity” type by the Chilean Irrigation Commission (CNR) for olives and vineyards. Irrigation is achieved using drip systems and pumps to extract groundwater. The irrigation period for olives starts on August until the harvest in April. In the case of vineyards, the irrigation period starts on October until the last days of April. The rest of the year, olives and vineyards are not irrigated and the soil moisture is only affected by rainfall. Each of the LAB-net stations in this sites are configured to store 5 min averages of the following variables: Soil moisture at 0.1 m (CS616, Campbell Scientific, Logan, UT, USA); soil temperature at 0.1 m (Campbell Scientific 109 for olives and 107 for vineyard); soil heat flux at 0.08 m (HFP01SC Huskeflux, Delft, The Netherlands); surface radiometric temperature (SI-111, Apogee, Santa Monica, CA, USA); air temperature and relative humidity at 2 m (HMP60, Vaisala, Vantaa, Finland); solar radiation (LICOR LI-200X for olives and Apogee SP-110 for vineyard) (LICOR, Lincoln, NE, USA); net radiation (NR-Lite2, Kipp&Zonen, Delft, The Netherlands); precipitation (TE525MM, Texas Electronics, Dallas, TX, USA); and wind speed and direction (R.M. Young 3002, Traverse City, MI, USA).

2.3. Chimbarongo

Chimbarongo is located on the “O’Higgins” region, 160 km north from the capital city of Santiago. It has a Mediterranean with dry season climate type, with an annual rainfall of 701 mm, a mean solar irradiance close to 206 W·m−2, and a maximum, mean, and minimum annual temperature, in average, of 20.8 °C, 6.6 °C, and 13.1 °C, respectively. This area is mainly used for to agriculture, and the most predominant crops are maize, tobacco, raspberry, beans, fruit orchards (plums and apples), and vineyards. The high agriculture heterogeneity makes it interesting as a test site, and several studies have been conducted in relation to the evaluation of actual evapotranspiration estimation methods [26,27], evapotranspiration partitioning [28] or validation of Sentinel satellite derived land vegetation products [29], among others. In Chimbarongo, a LAB-net station was installed over a raspberry crop site (34°43′39.67” S; 70°58′46.16” W). The soils in this site belong to the inceptisol order, they have a predominantly fine sandy loam texture (sand = 55.0%; silt = 30.0%; clay = 10.6%), a soil depth of ~85 cm, and have been classified as part of the “Limanque” soil series [30], which commonly shows a high content of organic matter, gravels, and clasts. The LAB-net station in this site is configured to store 5 min averages of the following variables: soil moisture at 0.07 m and 0.2 m (Campbell Scientific CS650 and CS616); soil temperature at 0.07 m and 0.2 m (Campbell Scientific CS650 and 109); soil heat flux at 0.08 m (Huskeflux HFP01SC); surface radiometric temperature (Apogee SI-111); air temperature and relative humidity at 2 m (Vaisala HMP60); solar radiation (LICOR LI-200x); net radiation (Kipp&Zonen NR-Lite2); precipitation (Texas Electronics TE525MM); and wind speed and direction (R.M. Young 3002).

2.4. Oromo

Oromo is located in “Los Lagos” region, 16 km north-western from the Llanquihue Lake in the Bueno river Basin. This region presents an oceanic rainy climate with an annual rainfall of 1331 mm, the mean annual solar radiation is approximately 148 W·m−2 and the maximum, mean, and minimum annual air temperatures are, in average,16.6 °C, 11.0 °C, and 5.4 °C respectively. The main land cover type of this region is pastures, potatoes, alfalfa, and evergreen forest. The land cover of this region is characterized by its “greenness” and wet soils during the whole year. The dry season is short and during summer time (December and January). During the whole year, water resources can be found in abundance. In Oromo, a LAB-net station installed over a pasture grass field (40°53′06.07” S; 73°06′31.41” W). The soils of Oromo belong to the Andisol order, they have a loam texture (sand = 49.2; silt = 31.9; clay = 19.0), with a soil depth of 120 cm, and have been classified as part of the “Corte Alto” soil series [30], which is characterized by its volcanic ash origins, low slopes, an effective depth between 20–190 cm, being very well drained, and commonly used for pastures and annual crops (e.g., maize, potatoes). The LAB-net station in this site is configured to store 5 min averages of the following variables: Soil moisture at 0.07 m and 0.2 m (Campbell Scientific CS650 and CS616); soil temperature at 0.07 m (Campbell Scientific CS650); soil heat flux at 0.08 m (Huskeflux HFP01SC); surface radiometric temperature (Apogee SI-111); air temperature and relative humidity at 2 m (HC2S3, Rotronic, Bassersdorf, Switzerland); incoming and outgoing short-wave and long-wave radiation (Kipp&Zonen CNR4); precipitation (Texas Electronics TE525MM); and wind speed and direction (R.M. Young 3002).

3. Calibration and Post-Processing

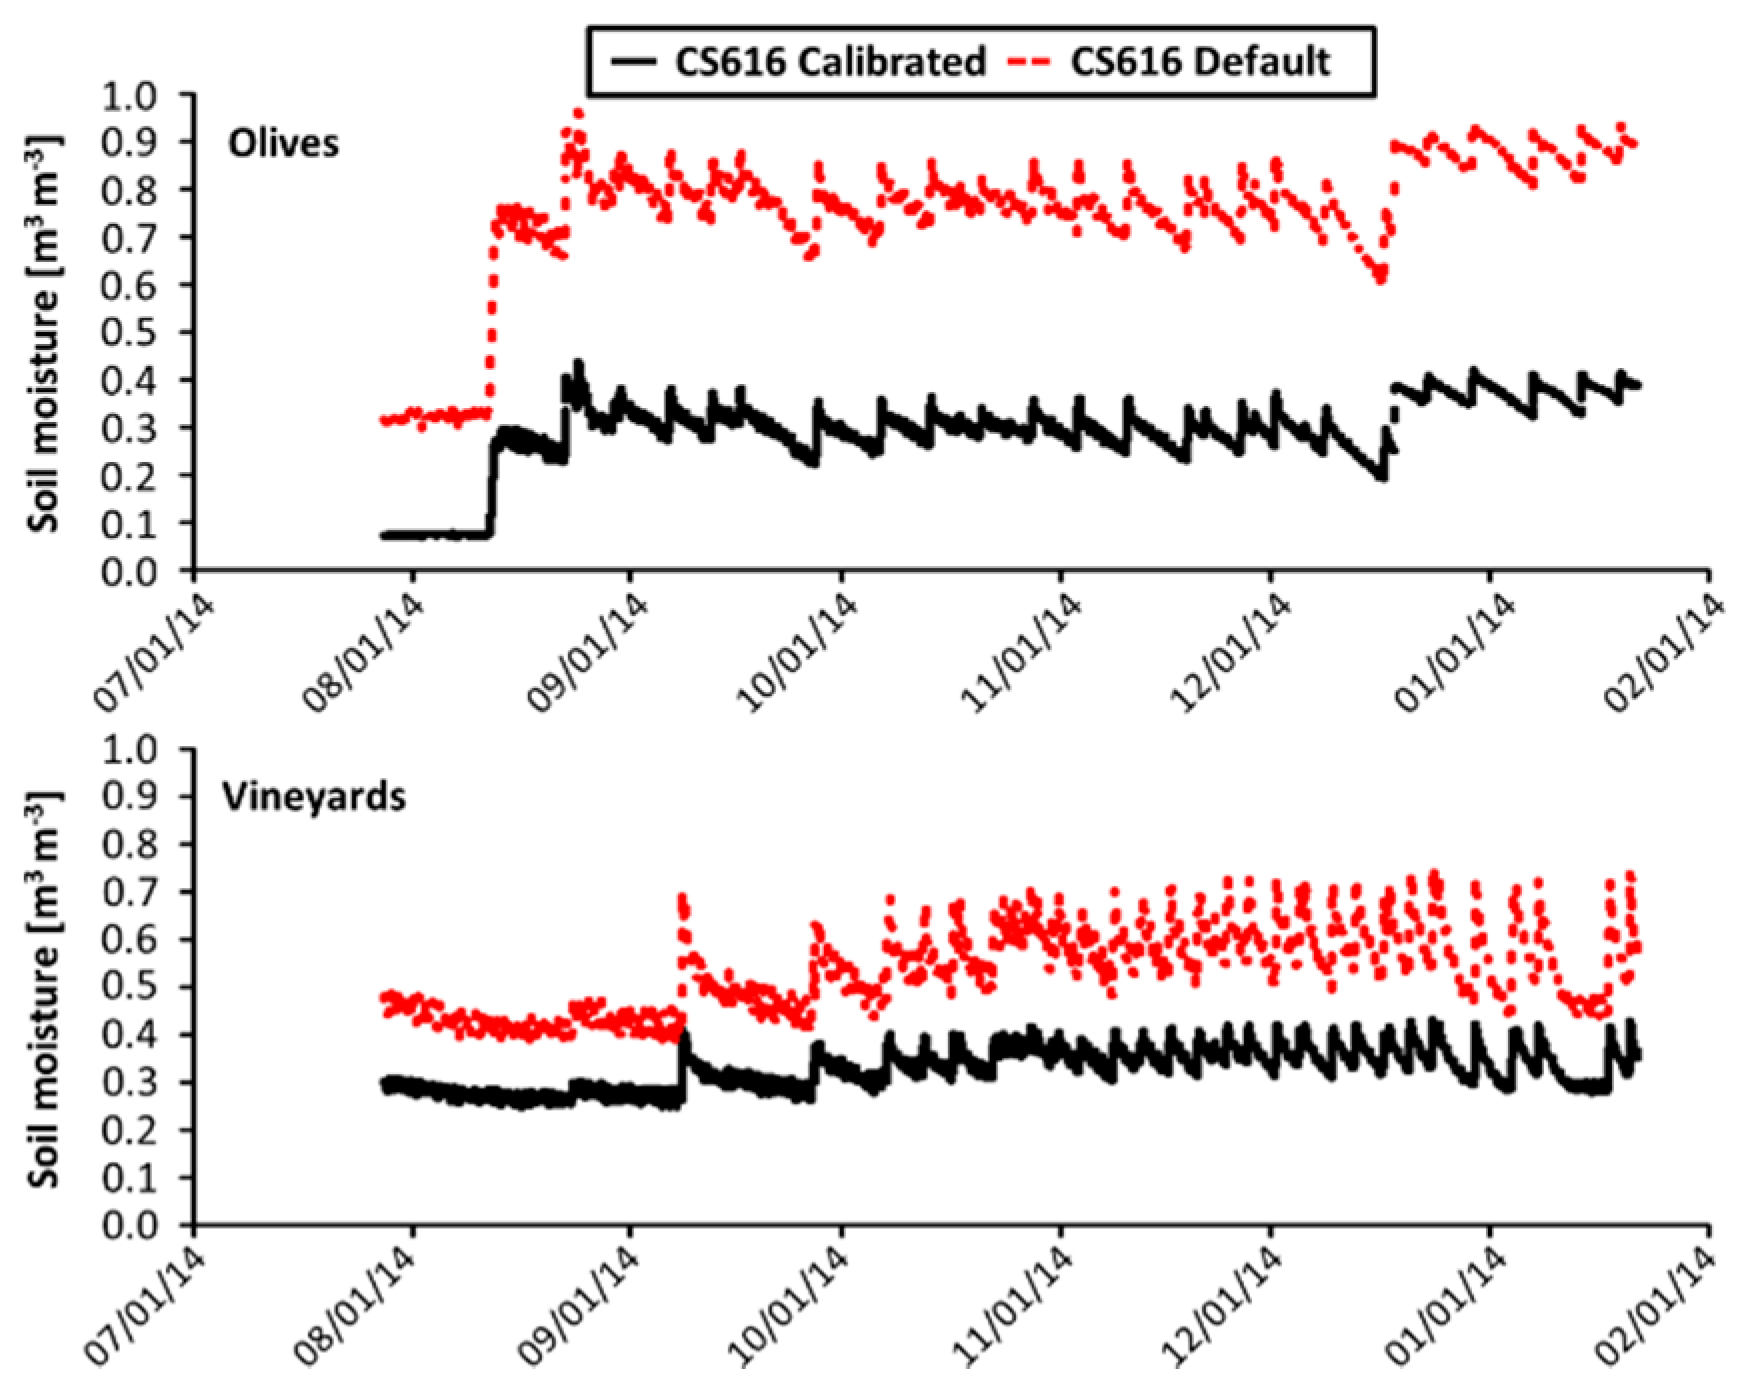
3.1. Time Domain Reflectometers Calibration

Despite the wide range of soil types where Time Domain Reflectometry (TDR) can operate, the soil texture and high salinity content of Copiapó valley deserved an appropriate calibration based on laboratory and in situ measurements. The main equation which relates the dielectric constant (K) with weave round trip time (t) is:
K = ( t c 2 L ) 2
where L is the length of the wire and c is the light speed in the vacuum (~3 × 10⁸ m·seg−1). The TDRs were recalibrated by obtaining new coefficients of time period (sigma) based on the length (L) of the TDR. This method was previously published by [31] using only in-laboratory conditions. Here, a combined field and laboratory experiment was developed to obtain a confident and reliable calibration equation. To obtain the calibration equation for the Copiapó test fields (e.g., vineyards and olives), the period was related to the soil moisture content obtained for the in situ soil moisture derived by Campbell Scientific Hydrosense II probe, the ML3 ThetraProbe, and soil moisture retrieval made in the laboratory using gravimetric methods. To estimate the gravimetric soil moisture content in laboratory conditions, a copper cylinder of known dimensions was introduced into the first soil layer (i.e., close to the TDR installation) to extract a soil sample. This procedure was repeated four times in several points around the TDR installation. After then, the soil samples were dried in an oven for 48 h to estimate the rate between wet and dried samples. The bulk density was also derived since the dimensions of the copper cylinder are known. Based on all these data, the derived calibration equation was obtained following the manufacturer technical report (Campbell Scientific, CS616 and CS625 Water Content Reflectometers, revision 2/14). The derived calibration equation was based on the period which was used to estimate the corrected soil moisture content as shown in Equation (2).
S M = i = 0 N a i K i
where SM is the volumetric soil moisture (m3·m−3) and ai is the coefficient which can be recalibrated for each soil type. The relationship between time period and soil moisture was represented by three different equations: linear, quadratic, and exponential. The model suggested by the manufacturer was linear or quadratic depending of the number of points obtained for the calibration. Nevertheless, the exponential equation has also been used by other studies in TDR soil moisture calibration [32]. Table 2 shows the different soil moisture content derived by in situ and laboratory conditions.
The different models (linear, quadratic, and exponential) were applied in order to obtain the calibrated coefficient for both sites. Although the quadratic model showed a better fit to in situ measurements for both of the crops, this model did not obtain a good fit for the whole range of periods, overestimating the extreme values. The linear model obtained good results for vineyards, but for olives the model did not represent well the temporal variability of the soil moisture content. The exponential model, although showing a good fit to the in situ measurements for both of the crops, in vineyards it presented overestimated soil moisture values, and also presented some bias for low values. In olive orchards the exponential model presented the best fit for the temporal variability of the retrieved values. TDR recalibrated coefficients that showed the best fit are presented in the following Equations for olives (3) and vineyards (4), respectively:
S M o l i v e = 0.5995 e x p 0.0982 t
S M v i n e y a r d = 2.0143 t 37.565
Figure 2 shows the comparison between the temporal series of soil moisture content obtained by the CS616 TDRs using the coefficients from the manufacturer (Campbell Scientific, CS616 and CS625 Water Content Reflectometers, revision 2/14), and using the coefficient recalibrated by Equations (3) and (4) for the olives and vineyards respectively. It seems that irrigation influences were detected, additionally dry/wet season denoted by the irrigation is also presented.

3.2. In Situ Land Surface Temperature

The thermal radiometer mounted on each station is aimed towards a well-defined footprint using the method proposed by the manufacturer. To estimate the Land Surface Temperature (LST) for each station, additional information needs to be used in order to characterize the downwelling irradiance. For instance, the LST is estimated in the Oromo site using a four-band net to estimate the up and downwelling thermal infrared irradiance. LST was estimated using the Equation (5).
B ( LST ) = L r a d ( 1 ε ) L d o w n ε
where Lrad is the land leaving radiance (W·m−2·µm−1·sr−1) measured by the thermal radiometer, ε is the land surface emissivity, Ldown is the longwave downwelling irradiance (W·m−2·µm−1·sr−1), and B(LST) is Planck’s law for a given surface temperature (W·m−2·µm−1·sr−1). The Equation (5) was applied in the thermal infrared spectral range (TIR) of 8.0 and 14.0 µm which is the same interval for the spectral response function of the thermal radiometer. The land surface emissivity of the target is computed by the convolution between the “green grass” spectra from the Aster Spectral Library [33] and the relative spectral response of the thermal infrared radiometer using the RSR calculator software [34]. However, due to the decrease in vegetation greenness during summer, increasing of the soil proportion, and decreasing of the emissivity values. Other emissivity values computed in previous works related to remote sensing experiences were used [35,36,37,38]. To estimate the downwelling atmospheric irradiance, the Ldown is measured in the 3.0–120.0 µm by the four-band net radiometer, although it is necessary to adapt it to the 8.0–14.0 µm thermal window to match with the thermal radiometer. To this end, the algorithm proposed by the [39] was used, in addition to the air temperature and relative humidity provided by the station. Finally, the LST is therefore estimated by using the inverse of the Planck’s law.

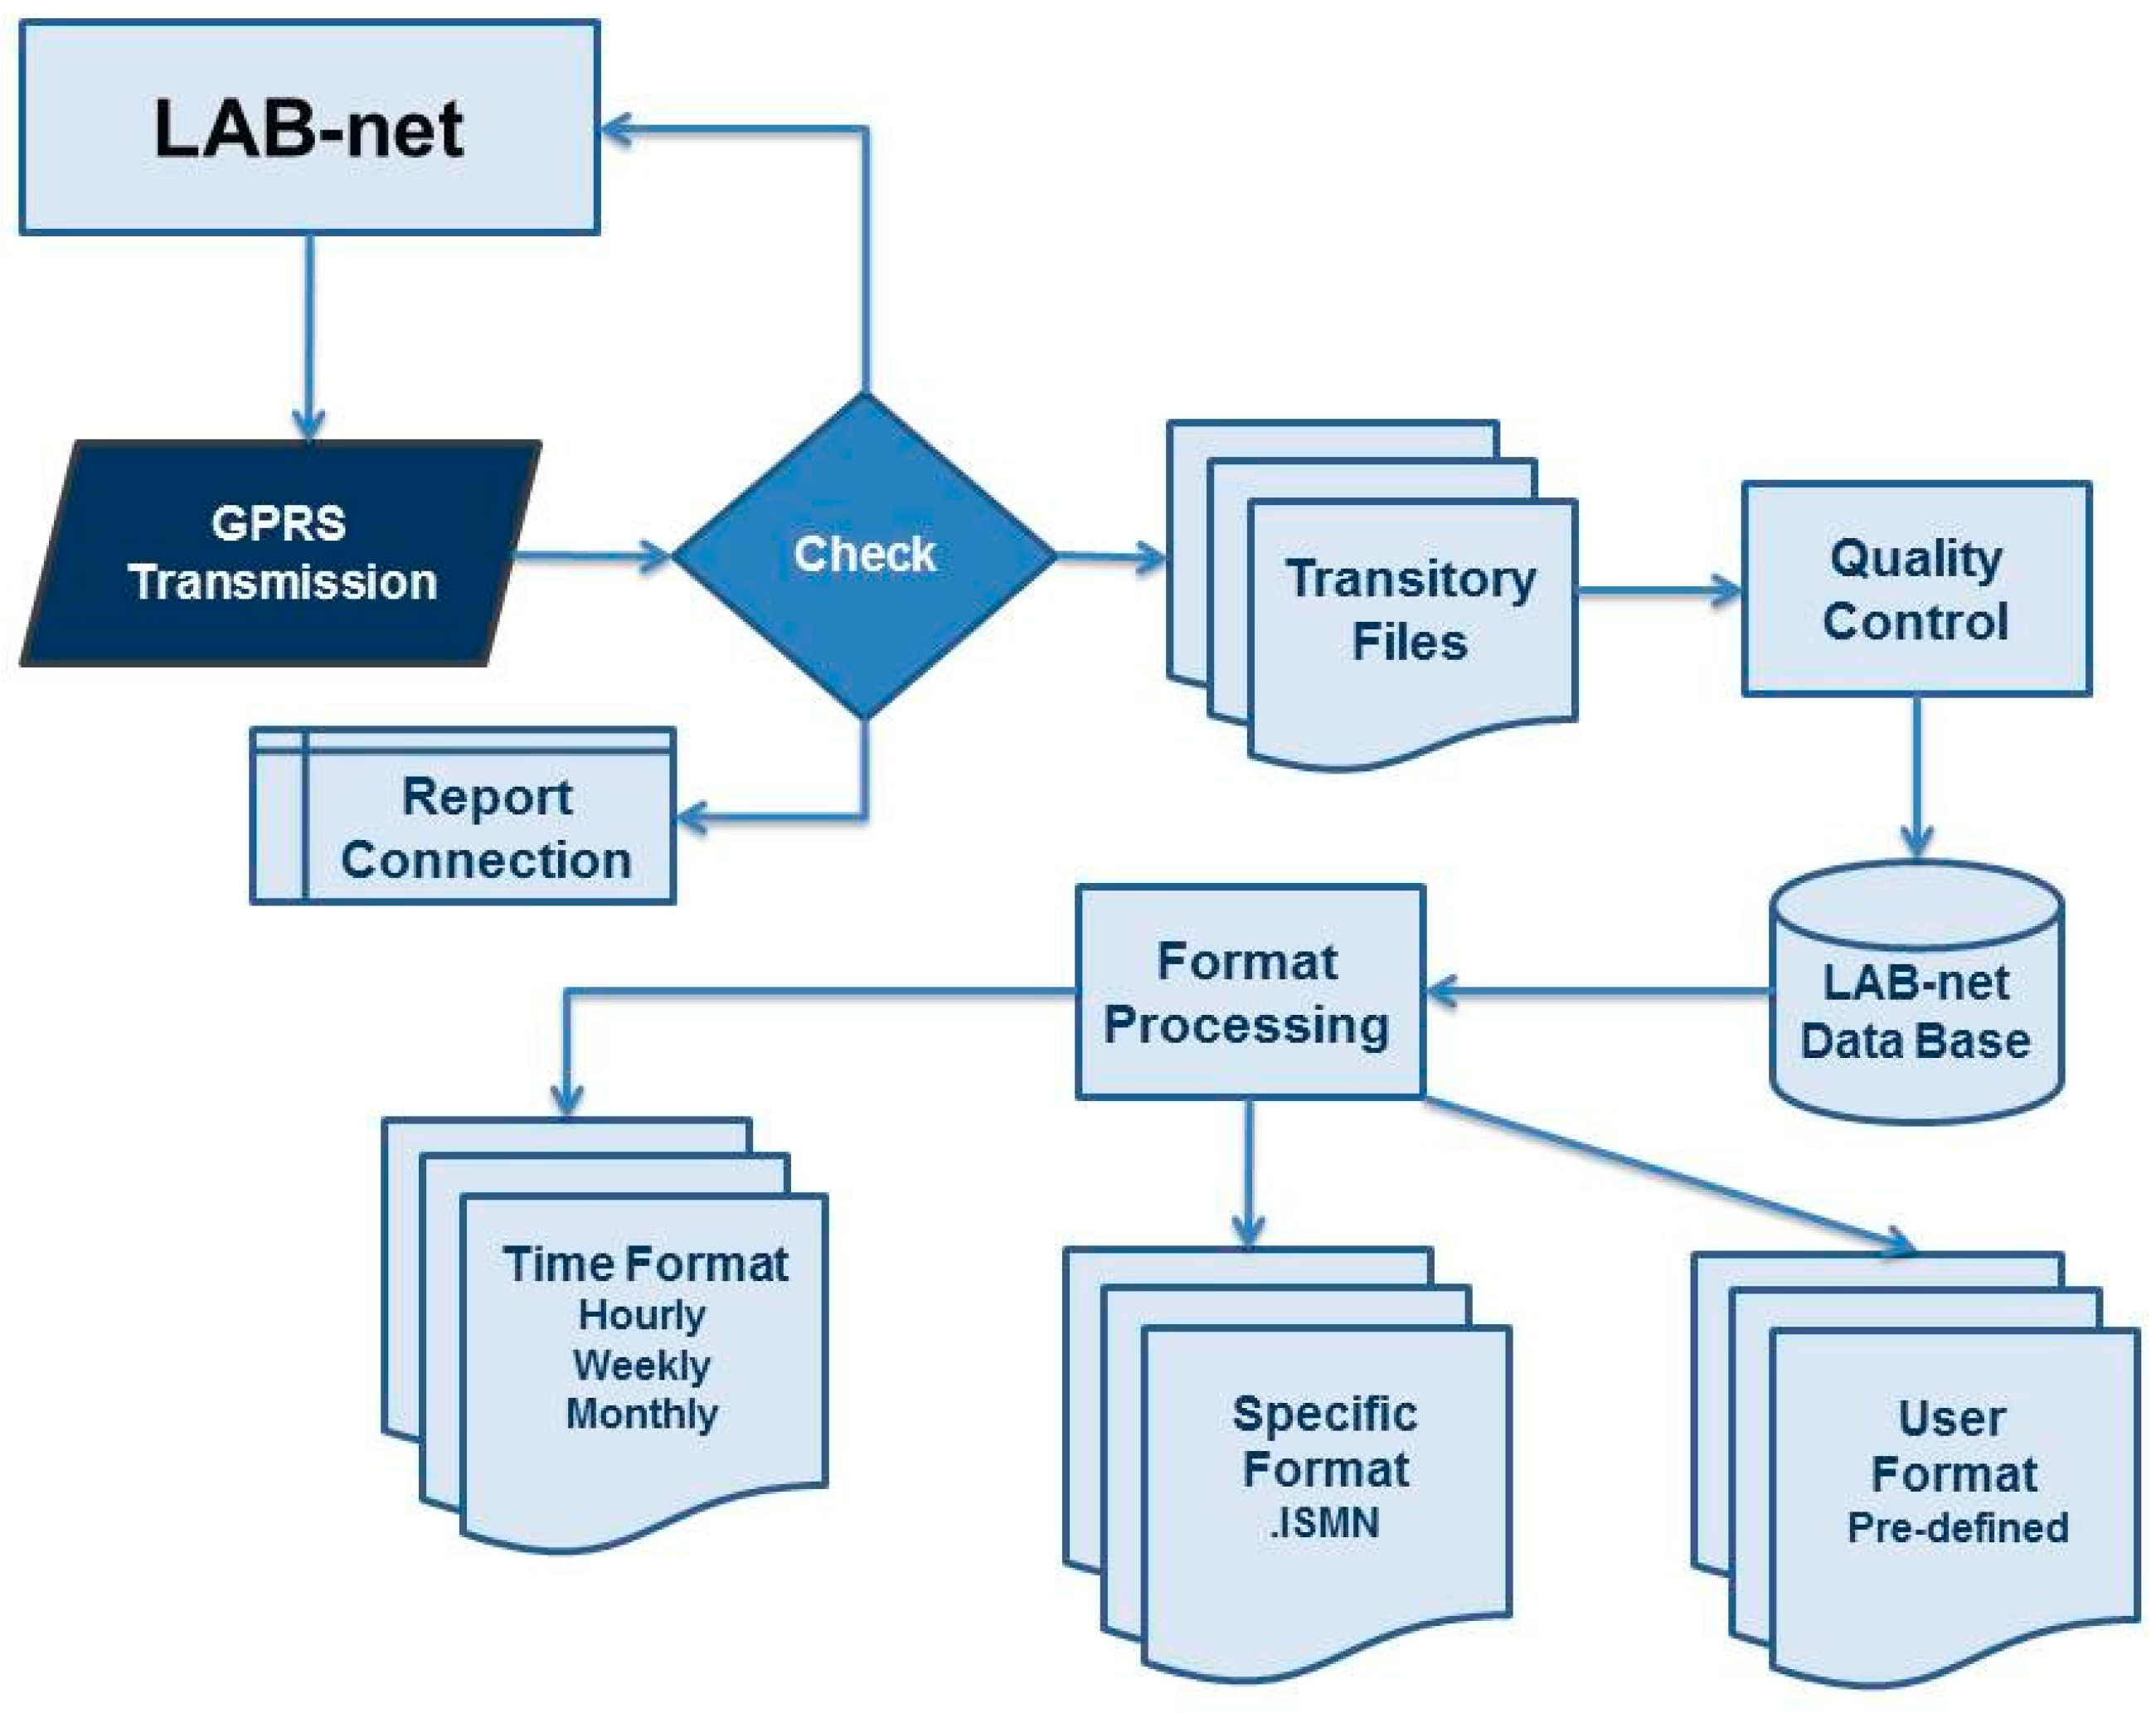
3.3. Status Check and Data Availability

The status check is one of the most important processes related to automatized environmental monitoring because, in this step, the quality control is carried out. Based on the wide range of LAB-net database applications, an automatized protocol to provide reliable data needs to be operational and to present quality checks. The quality checks consist on the filtering of anomalous values or values that exceed the range where the instrumentation is able to provide accurate information. The records are operationally compared with the physical range of each sensor mounted in the stations and any wrong or anomalous data is deleted in order to be consistent with the time series generated for each parameter. The out-of-range values are further analyzed in order to check the status of the instrumentation and to generate a report about possible source of error. This procedure can allow provision of reliable time series which can be used in a number of studies, such as the calibration of remote sensing retrieval algorithms, validation of land surface products derived from remote sensing imagery, the evaluation of in situ data for soil-atmosphere-vegetation transfer (SVAT) modelling, or surface energy balance retrievals. In order to fulfill the data requirements, the LAB-net data base are automatically processed thorough several steps to generate different formats, temporal aggregation schemes, and other user defined options. Figure 3 shows the flowchart of LAB-net data base.
LAB-net data is automatically obtained on a daily basis from the stations by using a GPRS communication system. After the data transfer, transitory files are generated to and filtered to remove anomalous and non-physical values. Then, an operational algorithm generates a list of files that summarizes the values, including hourly, daily mean, and monthly mean values for all of the measured variables of each station. In parallel, the data are converted to a predefined format (e.g., ISMN) in order to be easily used in further experiments and applications.

4. Applications of the LAB-Net Data Base

Several applications have been performed using data from the LAB-net sites. In this work, some of the applications for Copiapó and Oromo sites are presented. For Chimbarongo site, the applications can be seen in [28,29].

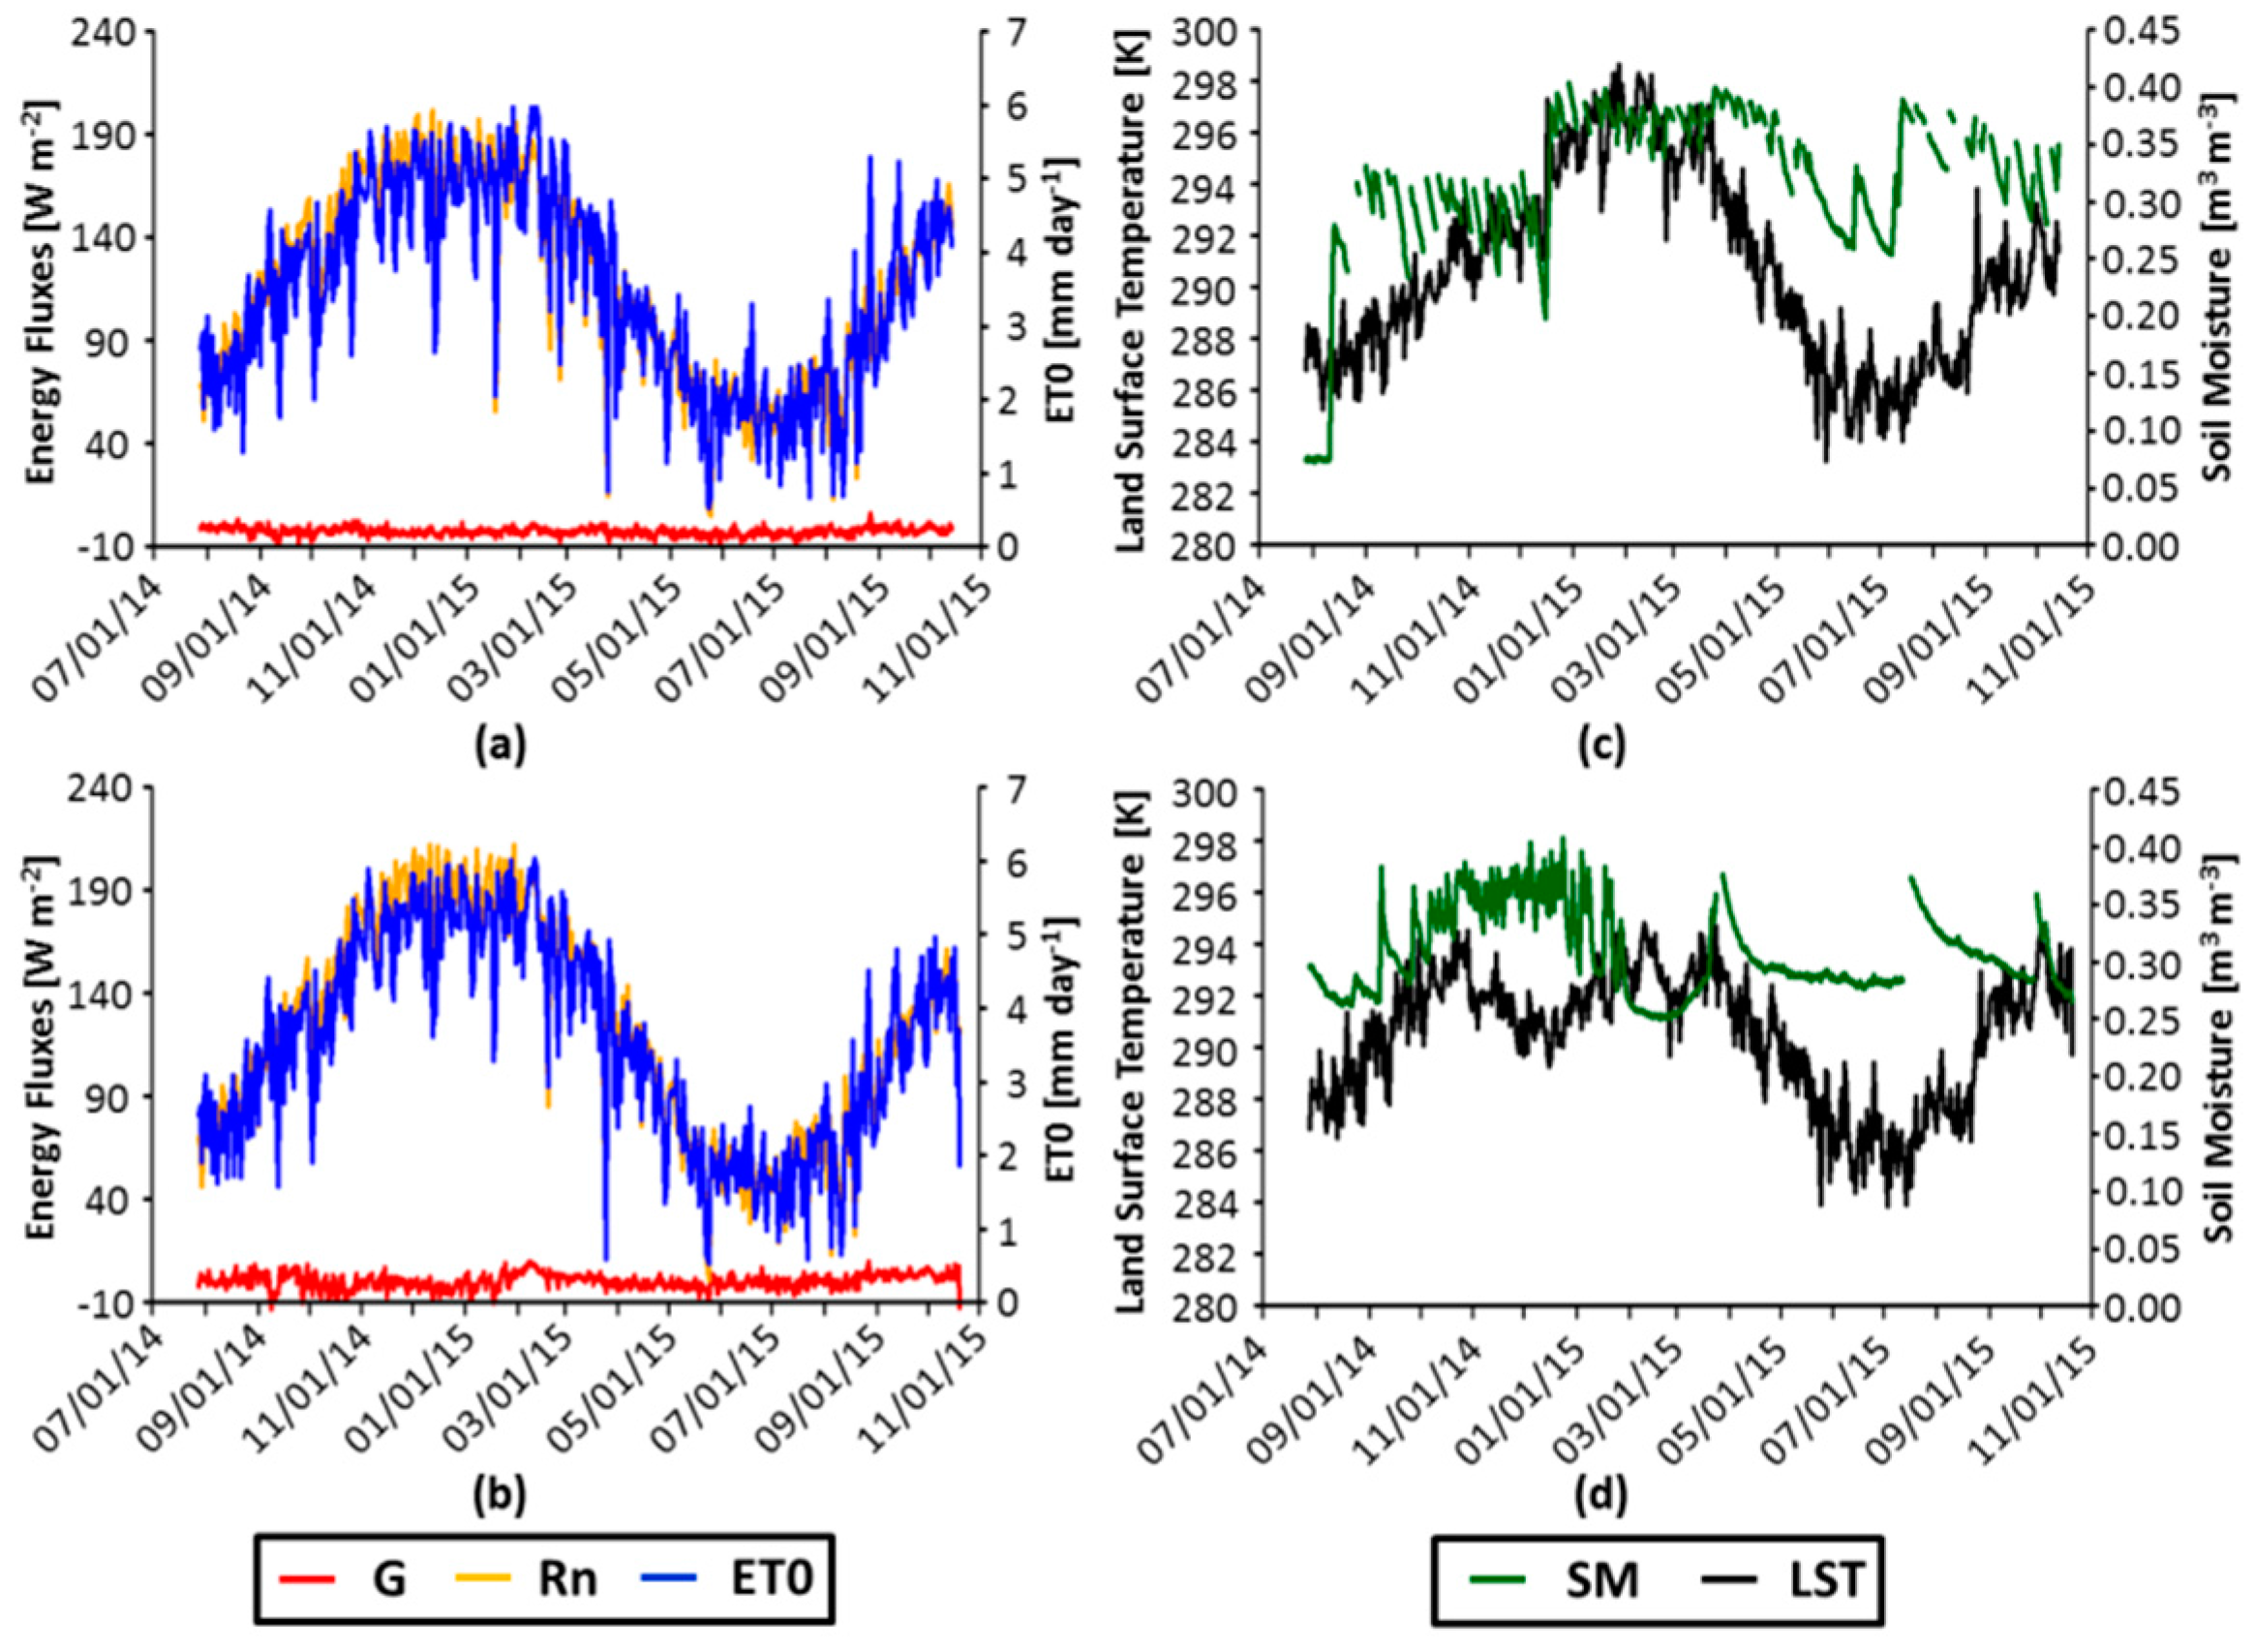
4.1. Surface Energy Balance in Copiapó

One of the applications of LAB-net sites is the surface energy balance which can be estimated from the combined meteorological and radiative flux instrumentation. As an example, Figure 4 presents the ground flux (G), net radiation (Rn), and reference evapotranspiration (ET0) derive from [40] using LAB-net data from the sites located in Copiapó valley. Additionally, the relation between land surface temperature and soil moisture (0.1 m) is also presented in this figure. These results show a maximum evapotranspiration period during summer (December–January and February) where crops highly demand irrigation due to high air temperatures and global radiation. This seasonal behavior is denoted for both olives and vineyard crops. Moreover, Rn and ET0 present some minimum values during the year, which are mainly attributed to the cloud cover that often generate cloudy skies until midday, affecting the incoming solar radiation and therefore the evapotranspiration. During the first days of March in the vineyards site, a maximum is evidenced for G which can be related to the last phenological stage. In the case of olives, soil moisture is driven by drip irrigation which is evidenced during almost the whole year. Additionally, irrigation is applied more often between December and March for the dry and hot season. For the case of vineyards, the irrigation presents a noticeable period between September and March. Furthermore, the LST increases after the harvest period since the canopy-to-soil proportion decreases. A rise in soil moisture values up to 0.35 m3·m−3 is evidenced during the final days of March, which is due to a strong flood that occurred in Copiapó and affected the vineyards.

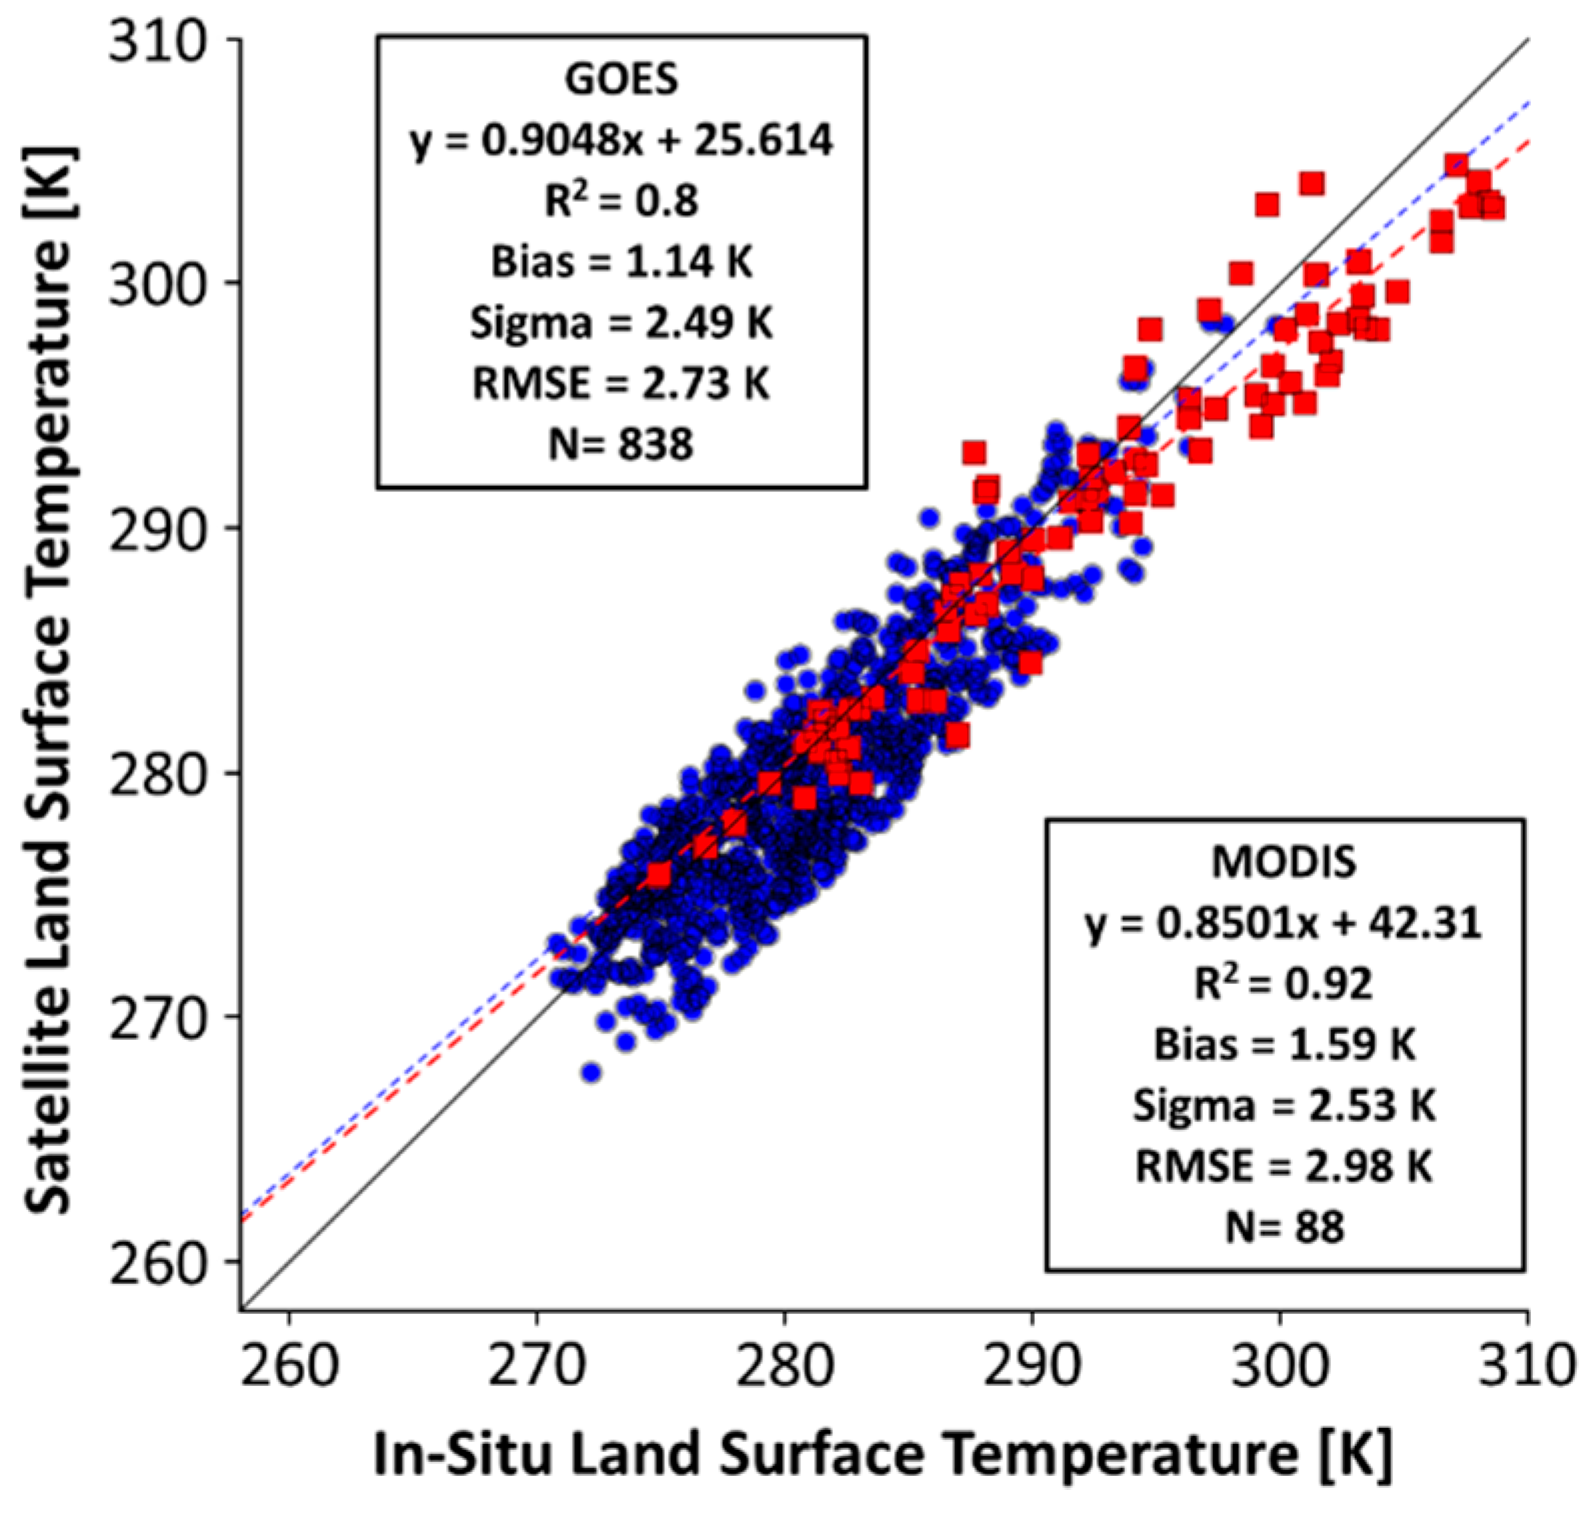
4.2. LST and Remote Sensing Products

For LST comparison, two surface products derived from MODIS and GOES were used. In the case of MODIS [41], the MOD11A1 was generated with the algorithm proposed by [42] was used. As for the LST derived from GOES, the Copernicus LST products were downloaded from [43]. Figure 5 shows the comparison between Oromo in situ LST and the LST derived from MODIS and GOES. The scatterplot between satellite and in situ data presents a reasonable linear behavior showing a coefficient of determination (r2) and RMSE equivalent to 86% and 2.76 K, respectively. On average, the bias is close to 1 K and the standard deviation is slightly higher than 2.4 K. The possible impact of surface emissivity might affect the obtained RMSE, since it can change according to the rainfall intensity during summer. For instance, the Austral summer of 2015 was dry and hot, generating a dramatic change in the vegetation cover which can impact the surface emissivity values and therefore the LST retrievals. However, during wet season in 2015 such as winter (June, July and August), the RMSE decrease to 1.8 K because of the surface emissivity values are close to 0.98, which is used to estimate LST. Furthermore, the size of the LST pixel present differences which affect the comparison due to the number of data and also the possible land cover variation located inside the pixel used for the comparison to in situ measurements.

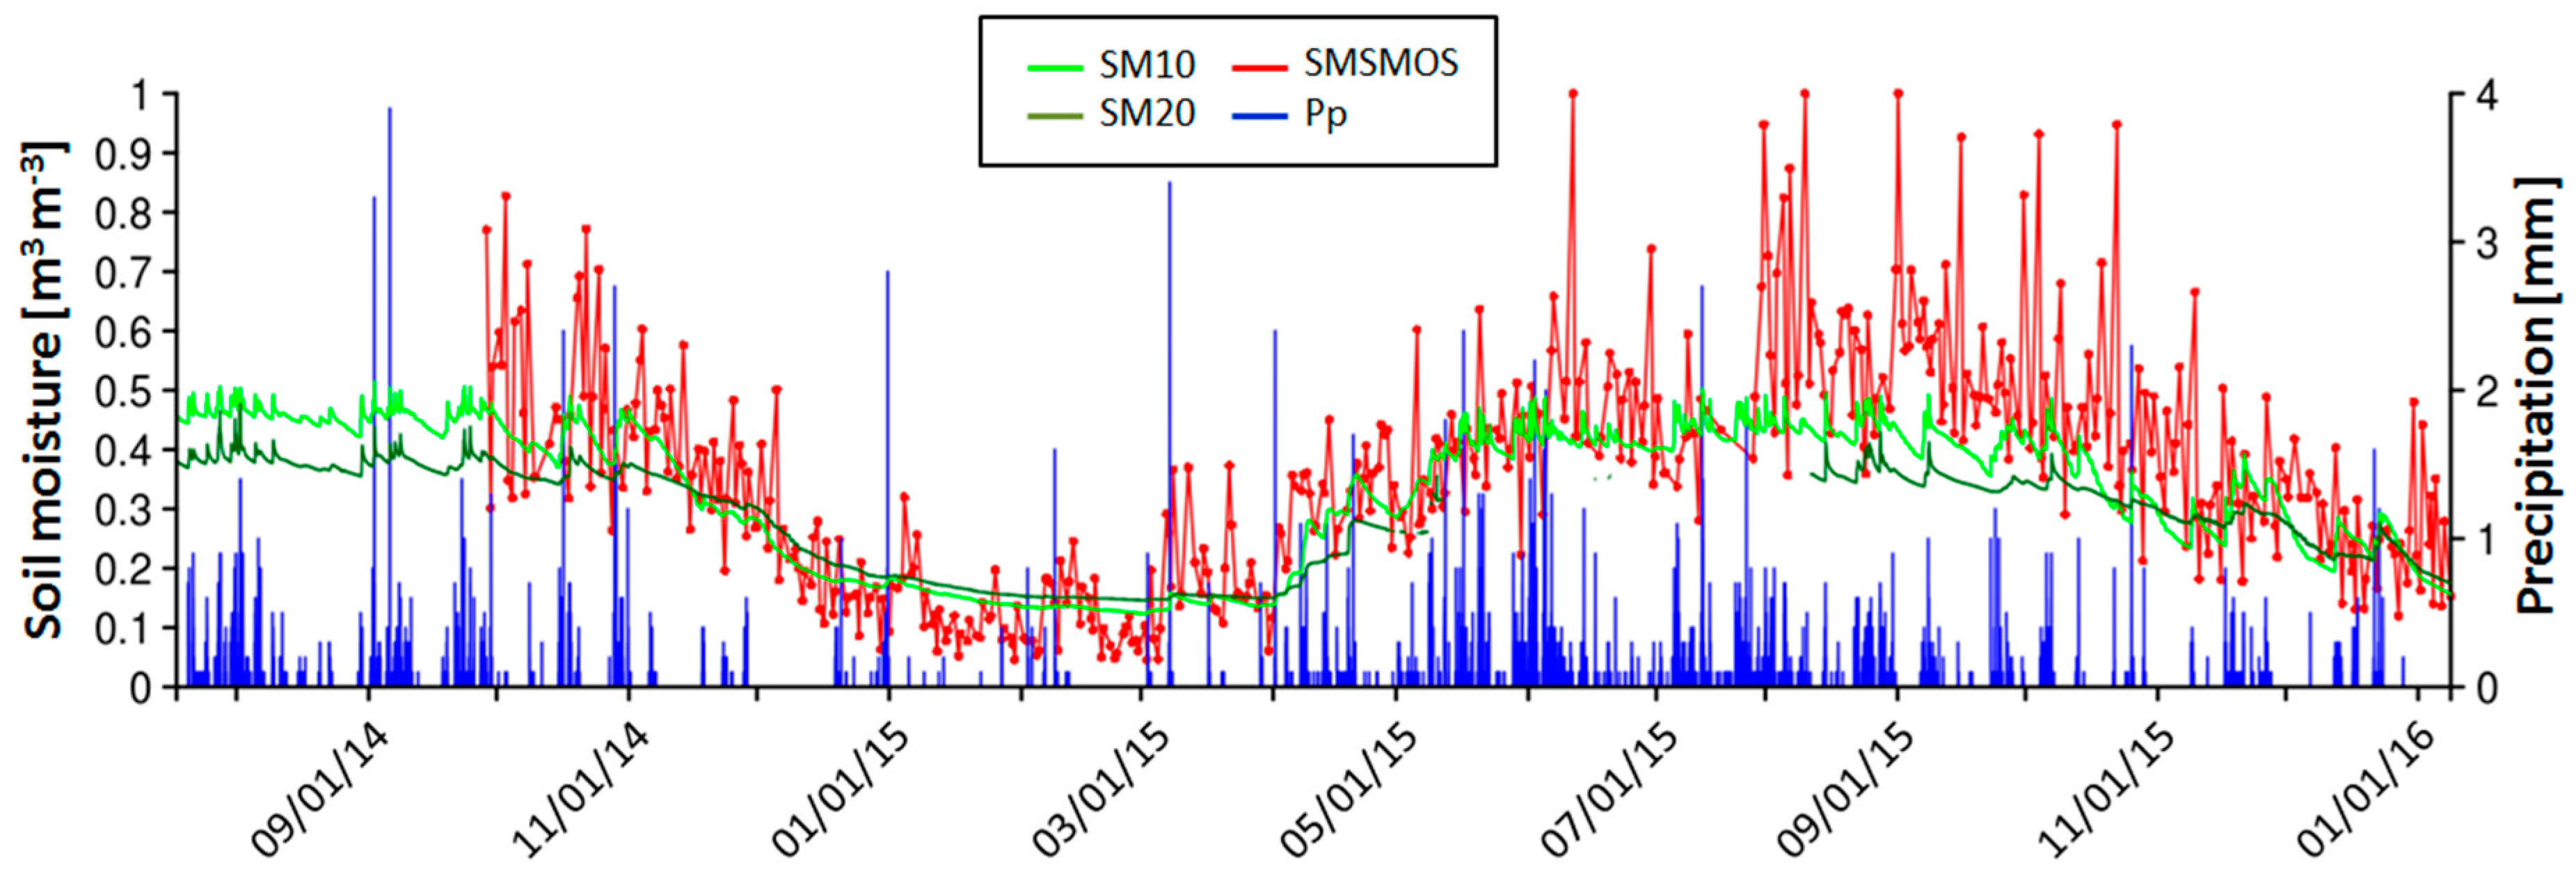
4.3. Soil Moisture from LAB-Net and SMOS L2 Product

The SMOS Level-3 (CLF31) soil moisture daily products are described in [4] and downloaded from [44]. This product was previously used in Chile in order to calibrate and evaluate an optical-passive microwave approach to retrieve soil moisture [45]. For this work, the daily global soil moisture data was processed in order the extract the corresponding values in the EASE grid (25 × 25 km) for the coordinates matched to the Oromo site. Figure 6 shows the time series of in situ volumetric water content (m3/m3) at 10 and 20 cm, rainfall (mm) and the SMOS soil moisture (SMOS SM) (m3/m3) for Oromo site. The SMOS data was obtained for the nearest EASE pixel to the LAB-net stations. It seems that the soil moisture retrieved by SMOS agrees with the in situ data and rainfall events, despite some maximum values which seem to be an outlier (VWC higher than 80%). Regarding this maximum of SM values in the Oromo site, it could be attributed in part to ponding zones widely present in the southern part of Chile where agricultural soils have a slow drainage. Some details of the Oromo soil characterization which reflects this effect are described in [46]. Nevertheless, some outliers are also noticed in the winter period. For the rest of the seasons, the SMOS SM values follow the soil moisture measured at in situ level. Additionally, the SMOS SM also evidence the rainfall occurred in the summer season. The variability of SMOS SM is quite similar to the variability of the in situ for the period October to December where low amounts of rainfall are evidenced. The discrepancies between the retrieved SMOS SM (0–4 cm) and the first TDR (installed at 10 cm depth) can be attributed to the soil depth where TDR is installed and the spatial resolution of SMOS. Despite this feature, it is important to remark that both data sets show the dry and wet periods and in situ observations agree well with SMOS SM retrievals, although further statistical validation needs to be performed in order to estimate errors and the impact of orbits (ascending and descending) in the retrieved soil moisture values.

5. Conclusions and Discussion

LAB-net stations are installed in four heterogeneous landscapes throughout Chile, which have different meteorological conditions and land cover characteristics that might be used to calibrate or validate remote sensing approaches and products. For instance, in terms of LST, data from the Oromo site showed good agreement with Copernicus (GOES) and MODIS LST products. To improve these results, forthcoming works may be performed in order to obtain a better characterization of the surface emissivity, since the emissivity of green grass might decrease during the dry season. Soil moisture from SMOS follows the in situ measurements behavior despite the fact the in some cases the Level-3 product did not show an accurate magnitude on maximum soil moisture values. These results contribute to generating future soil moisture and land surface temperature monitoring in different climate regions of Chile and to performing further validation of satellite derived products. The Chimbarongo site has been also used for several comparisons of water and mass balance [28,29] and also can be used for testing new evapotranspiration methods over heterogeneous agricultural sites. In the case of Copiapó valley sites, those measurements were used to develop and validate a disaggregation method for LST that was applied to an operational evapotranspiration estimation method for arid and semi-arid regions [47]. Several other applications in soil moisture, thermal remote sensing and surface energy balance can be performed by using LAB-net. Indeed, further works relating to the validation of new algorithms that perform soil moisture retrievals in Chile [45,48] and new derived surface products from the Chilean Satellite [49] will be validated with LAB-net data base. LAB-net is an open data base and it can be ordered from the following web site: http://www.biosfera.uchile.cl/lab-net.html.

Acknowledgments

This work was partially funded by the projects Fondecyt-Iniciación (CONICYT/ref-11130359) and Fondef IDeA CA13I10102. The authors also wish to thank ECWMF, the Copernicus program, NASA/MODIS, and SMOS-CATDS teams especially to Arnaud Mialon for the data used in this work. The authors also like to acknowledge the GOES—Land surface temperature product which was generated by the Land service of Copernicus and distributed by IPMA and VITO. Finally, the author would like to recognize the support of Karina Palacios and Valecita for their key role in this work.

Author Contributions

Cristian Mattar, Andrés Santamaría-Artigas, Claudio Durán-Alarcón, and Luis Olivera-Guerra conceived, designed, and performed the installation of LAB-net sites. Rodrigo Fuster contributed to materials, logistics, and discussion. Dager Borvarán contributed to the discussion; and Cristian Mattar wrote the paper.

Conflicts of Interest

The authors declare no conflict of interest. The founding sponsors had no role in the design of the study; in the collection, analyses, or interpretation of data; in the writing of the manuscript, and in the decision to publish the results.

References

  1. Cheruy, F.; Campoy, A.; Dupont, J.-C.; Ducharne, A.; Hourdin, F.; Haeffelin, M.; Chiriaco, M.; Idelkadi, A. Combined influence of atmospheric physics and soil hydrology on the simulated meteorology at the SIRTA atmospheric observatory. Clim. Dyn. 2013, 40, 2251–2269. [Google Scholar] [CrossRef]
  2. Njoku, E.G. AMSR-E/Aqua L2B Surface Soil Moisture, Ancillary Parms, & QC EASE-Grids; Version 2; NASA DAAC at the National Snow and Ice Data Center: Boulder, CO, USA, 2004.
  3. Kerr, Y.; Waldteufel, P.; Wigneron, J.P.; Martinuzzi, J.M.; Font, J.; Berger, M. Soil moisture retrieval from space. The soil Moisutre and Ocean Salinity (SMOS) mission. IEEE Trans. Geosci. Remote Sens. 2001, 39, 1729–1735. [Google Scholar] [CrossRef]
  4. Kerr, Y.; Waldteufel, P.; Richaume, P.; Wigneron, J.P.; Ferrazzoli, P.; Mahmoodi, A.; al Bitar, A.; Cabot, F.; Gruhier, C.; Juglea, S.E.; et al. The SMOS Soil Moisture Retrieval Algorithm. IEEE Trans. Geosci. Remote Sens. 2012, 50, 1384–1403. [Google Scholar] [CrossRef]
  5. Wagner, W.; Hahn, S.; Kidd, R.; Melzer, T.; Bartalis, Z.; Hasenauer, S. The ASCAT Soil Moisture Product: A Review of its Specifications, Validation Results, and Emerging Applications. Meteorol. Z. 2013, 22, 5–33. [Google Scholar] [CrossRef]
  6. Entekhabi, D.; Njoku, E.G.; O’Neill, P.E.; Kellogg, K.; Crow, W.T.; Edelstein, W.N.; Entin, J.K.; Goodman, S.D.; Jackson, T.J.; Johnson, J.; et al. The Soil Moisture Active Passive (SMAP) Mission. Proc. IEEE 2010, 98, 704–716. [Google Scholar] [CrossRef]
  7. Brocca, L.; Hasenauer, S.; Lacava, T.; Melone, F.; Moramarco, T.; Wagner, W.; Dorigo, W.; Matgen, P.; Martínez-Fernández, J.; Llorens, P.; et al. Soil moisture estimation through ASCAT and AMSR-E sensors: An intercomparison and validation study across Europe. Remote Sens. Environ. 2011, 115, 3390–3408. [Google Scholar] [CrossRef]
  8. Leroux, D.; Kerr, Y.; Richaume, P.; Fieuzal, R. Spatial distribution and possible sources of SMOS errors at the global scale. Remote Sens. Environ. 2013, 133, 240–250. [Google Scholar] [CrossRef] [Green Version]
  9. Al-Yaari, A.; Wigneron, J.-P.; Ducharne, A.; Kerr, Y.; de Rosnay, P.; de Jeu, R.; Govind, A.; al Bitar, A.; Albergel, C.; Muñoz-Sabater, J.; et al. Global-scale evaluation of two satellite-based passive microwave soil moisture datasets (SMOS and AMSR-E) with respect to Land Data Assimilation System estimates. Remote Sens. Environ. 2014, 149, 181–195. [Google Scholar] [CrossRef] [Green Version]
  10. Rötzer, K.; Motzka, C.; Bogena, H.; Wagner, W.; Kerr, Y.; Kidd, R.; Vereecken, H. Catchment scale validation of SMOS and ASCAT soil moisture products using hydrological modeling and temporal stability analysis. J. Hydrol. 2014, 519, 934–946. [Google Scholar] [CrossRef]
  11. Louvet, S.; Pellarin, T.; Al-Bitar, A.; Cappelaere, B.; Galle, S.; Grippa, M.; Gruhier, C.; Kerr, Y.; Lebel, T.; Mialon, A.; et al. SMOS soil moisture product evaluation over West-Africa from local to regional scale. Remote Sens. Environ. 2015, 156, 383–394. [Google Scholar] [CrossRef]
  12. Liu, Y.Y.; Parinussa, R.M.; Dorigo, W.A.; de Jeu, R.A.M.; Wagner, W.; van Dijk, A.I.J.M.; McCabe, M.F.; Evans, J.P. Developing an improved soil moisture dataset by blending passive and active microwave satellite-based retrievals. Hydrol. Earth Syst. Sci. 2011, 15, 425–436. [Google Scholar] [CrossRef] [Green Version]
  13. Yin, J.; Zhan, X.; Zheng, Y.; Liu, J.; Fang, L.; Hain, C.R. Enhancing Model Skill by Assimilating SMOPS Blended Soil Moisture Product into Noah Land Surface Model. J. Hydrometerorol. 2015, 16, 917–931. [Google Scholar] [CrossRef]
  14. Yin, J.; Zhan, X.; Zheng, Y.; Liu, J.; Hain, C.R.; Fang, L. Impact of qualitycontrol of satellite soil moisture data on their assimilation into land surface model. Geophys. Res. Lett. 2014, 41, 7159–7166. [Google Scholar] [CrossRef]
  15. Walker, J.P.; Willgoose, G.R.; Kalma, J.D. In situ measurement of soil moisture: A comparison of techniques. J. Hydrol. 2004, 293, 85–99. [Google Scholar] [CrossRef]
  16. Liu, Q.; Reichle, R.H.; Bindlish, R.; Cosh, M.H.; Crow, W.T.; de Jeu, R.; de Lannoy, G.J.M.; Huffman, G.J.; Jackson, T.J. The contributions of precipitation and soil moisture observations to the skill of soil moisture estimates in a land data assimilation system. J. Hydrometerorol. 2011, 12, 750–765. [Google Scholar] [CrossRef]
  17. Dorigo, W.; Wagner, W.; Hohensinn, R.; Hahn, S.; Paulik, C.; Xaver, A.; Drusch, M. The International Soil Moisture Network: A data hosting facility for global in situ soil moisture measurements. Hydrol. Earth Syst. Sci. 2011, 5, 1675–1698. [Google Scholar] [CrossRef]
  18. Vivoni, E.R.; Gebremichaela, M.; Watts, C.J.; Bindlish, R.; Jackson, T.J. Comparison of ground-based and remotely-sensed surface soil moisture estimates over complex terrain during SMEX04. Remote Sens. Environ. 2008, 112, 314–325. [Google Scholar] [CrossRef]
  19. Dorigo, W.A.; Xaver, A.; Vreugdenhil, M.; Gruber, A.; Hegyiová, A.; Sanchis-Dufau, A.D.; Zamojski, D.; Cordes, C.; Wagner, W.; Drusch, M. Global automated quality control of in situ soil moisture data from the International Soil Moisture Network. Vadose Zone J. 2013, 12. [Google Scholar] [CrossRef]
  20. Smith, A.; Walker, J.P.; Western, A.W.; Young, R.I.; Ellet, K.M.; Pipunic, R.C. The Murrumbidgee soil moisture monitoring network data set. Water Resour. Res. 2012, 48, W07701. [Google Scholar] [CrossRef]
  21. Panciera, R.; Walker, J.P.; Kalma, J.; Kim, E.; Hacker, J.; Merlin, O.; Berger, M.; Skou, N. The NAFE’05/CoSMOS Data Set: Toward SMOS Soil Moisture Retrieval, Downscaling, and Assimilation. IEEE Trans. Geosci. Remote Sens. 2008, 46, 736–745. [Google Scholar] [CrossRef] [Green Version]
  22. Merlin, O.; Walker, J.P.; Panciera, R.; Escorihuela, M.J.; Jackson, T. Assessing the SMOS soil moisture retrieval parameters with high-resolution NAFE’06 data. IEEE Geosci. Remote Sens. Lett. 2009, 6, 635–639. [Google Scholar] [CrossRef]
  23. Peischl, S.; Walker, J.P.; Rüdiger, C.; Ye, N.; Kerr, Y.H.; Kim, E.; Bandara, R.; Allahmoradi, M. The AACES field experiments: SMOS calibration and validation across the Murrumbidgee River catchment. Hydrol. Earth Syst. Sci. 2011, 16, 1697–1708. [Google Scholar] [CrossRef]
  24. Zreda, M.; Shuttleworth, W.; Xeng, X.; Zweck, C.; Desilets, D.; Franz, T.E.; Rosolem, R. COSMOS: The COsmic-ray Soil Moisture Observing System. Hydrol. Earth Syst. Sci. 2012, 16, 4079–4099. [Google Scholar] [CrossRef]
  25. Valdés-Pineda, R.; Pizarro, R.; García-Chevesich, P.; Valdés, J.; Olivares, C.; Vera, M.; Balocchi, F.; Pérez, F.; Vallejos, C.; Fuentes, R.; et al. Water governance in Chile: Availability, management and climate change. J. Hydrol. 2014, 519, 2538–2567. [Google Scholar] [CrossRef]
  26. Mattar, C.; Franch, B.; Sobrino, J.A.; Corbari, C.; Jiménez-Muñoz, J.C.; Olivera-Guerra, L.; Skokovic, D.; Sòria, G.; Oltra-Carrió, R.; Julien, Y.; et al. Impacts of the broad-band albedo on actual evapotranspiration estimated by S-SEBI model over an agricultural. Remote Sens. Environ. 2014, 147, 23–42. [Google Scholar] [CrossRef]
  27. Olivera-Guerra, L.; Mattar, C.; Galleguillos, M. Estimation of the Real Evapotranspiration and its variation in Mediterranean landscapes of central-southern Chile. Int. J. Appl. Earth Obs. Geoinform. 2014, 28, 160–169. [Google Scholar] [CrossRef]
  28. Olivera-Guerra, L.; Merlin, O.; Mattar, C.; Durán-Alarcón, C.; Santamaría-Artigas, A.; Stefan, V. Combining meteorological and lysimeter data to evaluate energy and water fluxes over a row crop for remote sensing applications. In Proceedings of the International Geoscience and Remote Sensing Symposium (IGARSS), Milan, Italy, 26–31 July 2015.
  29. Latorre, C.; Camacho, F.; Mattar, C.; Santamaría-Artigas, A.; Leiva-Büchi, N.; Lacaze, R. Obtención de mapas de alta resolución de LAI, FAPAR y fracción de cobertura vegetal derivados de imágenes del satélite chileno FASat-C y adquisiciones in situ en la zona agrícola de Chimbarongo, Chile. In Proceedings of the XVI Congreso de la Asociación Española de Teledetección (AET), Sevilla, España, 21–23 de Octubre 2015.
  30. CIREN; Estudio Agrológico X Región. Descripciones de suelos: Materiales y símbolos; CIREN: Santiago, Chile, 2002; 360p. N° 122. [Google Scholar]
  31. Quinones, H.; Ruelle, P.; Nemeth, I. Comparison of three calibration procedures for TDR soil moisture sensors. Irrig. Drain. 2003, 52, 203–217. [Google Scholar] [CrossRef]
  32. Mittelbach, H.; Casini, F.; Lehner, I.; Teuling, A.; Seneviratne, S. Soil moisture monitoring for climate research: Evaluation of a low-cost sensor in the framework of the Swiss Soil Moisture Experiment (SwissSMEX) campaign. J. Geophys. Res. 2011, 116, D05111. [Google Scholar] [CrossRef]
  33. Baldridge, A.; Hook, S.J.; Grove, C.I.; Rivera, G. The ASTER spectral library version 2.0. Remote Sens. Environ. 2009, 113, 711–715. [Google Scholar] [CrossRef]
  34. Durán-Alarcón, C.; Santamaría-Artigas, A.; Valenzuela, N.; Mattar, C. RSR Calculator, una herramienta para el proceso de Calibración/Validación. Revista Española de Teledetección 2014, 42, 111–117. [Google Scholar] [CrossRef]
  35. Sobrino, J.A.; Mattar, C.; Gastellu-Etchegorry, J.P.; Jiménez-Muñoz, J.C.; Grau, E. Evaluation of DART 3D model in the thermal domain using satellite/airborne imagery and ground-based measurements. Int. J. Remote Sens. 2011, 32, 7453–7477. [Google Scholar] [CrossRef] [Green Version]
  36. Sobrino, J.A.; Mattar, C.; Pardo, P.; Jiménez-Muñoz, J.C.; Hook, S.J.; Baldridge, A.; Ibáñez, R. Soil emissivity and reflectance spectra measurements. Appl. Opt. 2009, 48, 3664–3670. [Google Scholar] [CrossRef] [PubMed]
  37. Sobrino, J.A.; Jiménez-Muñoz, J.C.; Zarco-Tejada, P.J.; Sepulcre-Cantó, G.; de Miguel, E.; Sória, G.; Romaguera, M.; Julien, Y.; Cuenca, J.; Hidalgo, V.; et al. Thermal remote sensing from airborne hyperspectral scanner data in the framework of the sparc and sen2flex projects: An overview. Hydrol. Earth Syst. Sci. 2009, 13, 2031–2037. [Google Scholar] [CrossRef]
  38. Sobrino, J.A.; Jimenez-Muñoz, J.C.; Soria, G.; Gomez, M.; Barella Ortiz, A.; Romaguera, M.; Zaragoza, M.; Julien, Y.; Cuenca, J.; Atitar, M. Thermal remote sensing in the framework of the sen2flex project: Field measurements, airborne data and application. Int. J. Remote Sens. 2008, 29, 4961–4991. [Google Scholar] [CrossRef]
  39. Prata, A.J. A new long-wave formula estimating downward clear sky radiation at the surface. Q. J. R. Meteorol. Soc. 1996, 122, 1127–1151. [Google Scholar] [CrossRef]
  40. Allen, R.G.; Pereira, L.S.; Raes, D.; Smith, M. Crop evapotranspiration guidelines for computing crop water requirements. In FAO Irrigation and Drainage Paper 56; Food and Agriculture Organization: Italy, Rome, 1998. [Google Scholar]
  41. MODIS Data Products. Available online: http://modis.gsfc.nasa.gov/data/dataprod/ (accessed on 22 November 2015).
  42. Wan, W.; Dozier, J. A generalized split-window algorithm for retrieving land-surface temperature from space. IEEE Trans. Geosci. Remote Sens. 1996, 46, 736–745. [Google Scholar]
  43. Freitas, S.; Trigo, I.; Macedo, J.; Barroso, C.; Silva, R.; Perdigao, R. Land surface temperature from multiple geostationary satellite. Int. J. Remote Sens. 2013, 34, 3051–3068. [Google Scholar] [CrossRef]
  44. Centre Aval de Traitement des Données SMOS (CATDS). Available products from CPDC. Available online: http://www.catds.fr/Products/Available-products-from-CPDC (accessed on 15 January 2016).
  45. Santamaría-Artigas, A.; Mattar, C.; Wigneron, J.-P. Application of a Combined Optical–Passive Microwave Method to Retrieve Soil Moisture at Regional Scale Over Chile. IEEE J. Sel. Top. Appl. Earth Obs. Remote Sens. 2016, 9, 1493–1504. [Google Scholar] [CrossRef]
  46. Casanova, M.; Salazar, O.; Seguel, O.; Luzio, W. The Soils of Chile; Springer: Dordrecht, The Netherlands, 2013; p. 185. ISBN 978-94-007-5948-0. [Google Scholar]
  47. Olivera-Guerra, L.; Mattar, C.; Merlin, O.; Durán-Alarcón, C.; Santamaría-Artigas, A.; Fuster, R. An operational method for the disaggregation of land surface temperature to estimate actual evapotranspiration in the semi-arid region of Chile. Int. J. Appl. Earth Obs. Geoinform. 2016, in press. [Google Scholar]
  48. Mattar, C.; Wigneron, J.; Sobrino, J.A.; Novello, N.; Calvet, J.C.; Albergel, C.; Richaume, P.; Mialon, A.; Guyon, D.; Jimenez-Munoz, J.C. A combined optical-microwave method to retrieve soil moisture over vegetated areas. IEEE Trans. Geosci. Remote Sens. 2012, 50, 1404–1413. [Google Scholar] [CrossRef] [Green Version]
  49. Mattar, C.; Hernández, J.; Santamaría-Artigas, A.; Durán-Alarcón, C.; Olivera, L.; Inzunza, M.; Tapia, E.; Escobar-Lavín, E. A first in-flight absolute calibration of the Chilean Earth Observation Satellite. ISPRS J. Photogramm. Remote Sens. 2014, 92, 16–25. [Google Scholar] [CrossRef]
Figure 1. LAB-net sites over four different land cover types. The circles indicate the location along Chile (yellow boundary) in red for Olives and Vineyards, green for Raspbery and blue for Pasture, respectivelly.
Data 01 00006 g001
Figure 2. Soil Moisture obtained with default coefficients (CS616_default) and calibrated coefficients (CS616_calibrated) according to the Equations (3) and (4) to olives (top) and vineyards (bottom), respectively.
Data 01 00006 g002
Figure 3. Flowchart of the LAB-net operational data assimilation.
Data 01 00006 g003
Figure 4. Net Radiation, Ground flux and ET0 for olives (a) and vineyards (b) in addition to Soil moisture and land surface temperature for olives (c) and vineyards (d).
Data 01 00006 g004
Figure 5. Linear relationship between surface temperature of Oromo site and the surface temperature derived from MODIS (squares) and GOES (circles). R2, Bias, sigma, RMSE, and N is also shown for each comparison.
Data 01 00006 g005
Figure 6. Time series of soil moisture at 10 cm (SM10), soil moisture at 20 cm (SM20), rainfall (Pp) and soil moisture derived from SMOS (SMSMOS) between July 2014 and January 2016 A gap in SM at 20 cm is presented between June and August.
Data 01 00006 g006
Table 1. Soil characterization at laboratory for LAB-net test sites.
ParametersUnitsCopiapó OlivesCopiapó VineyardsChimbarongoOromo
Sand (2–0.05 mm)%9.3040.2051.8074.10
Silt (0.05–0.002 mm)%49.4040.6035.3020.30
Clay (<0.002 mm)%41.3019.2012.905.60
Ca2+mmol+/L34.5352.705.301.19
Mg2+42.27106.210.990.34
Na+106.616.621.320.67
K+3.536.850.720.20
SO4−2mmol−/L287.38287.380.030.07
ClNDND0.940.51
HCO−30.016.400.51.3
pHunitless7.927.96.497.98
Electrical Conductivity (E.C.)dS/m12.7421.5750.250.88
Sodium Absorption Ratio (SAR)unitless17.201.100.770.93
Percentage of Interchangeable Sodium (ESP)%25.201.621.131.34
Water Saturation68.727.992.5321.01
ND = Not Detected.
Table 2. Soil moisture content derived from Hydrosense II (0.12 m wire length), ML3 (0.07 m wire length), Laboratory (Gravimetric), and TDR at several wire lengths.
Measurement TechniqueSM Olives (m3·m−3)SM Vineyards (m3·m−3)
Hydrosense II36.836.5
ML335.535.0
Gravimetry38.133.6
TDR wire length
0.05 m5.75.8
0.10 m11.511.6
0.15 m17.217.4
0.20 m24.124.4
0.25 m28.729.1
0.30 m (Full length)34.434.9

