Article

National Open Data Cubes and Their Contribution to Country-Level Development Policies and Practices

1
Geoscience Australia, Canberra GPO Box 378, Australia
2
Institute for Environmental Sciences/GRID-Geneva, University of Geneva, 1205 Geneva, Switzerland
3
Instituto Nacional de Estadística y Geografía (INEGI), 20276 Aguascalientes, Mexico
4
National Aeronautics and Space Administration, Earth Science Division, 300 E St. SW, Washington, DC 20546, USA
5
Booz Allen Hamilton, 8283 Greensboro Dr, McLean, VA 22102, USA
6
National Aeronautics and Space Administration, Hampton, VA 23666, USA
7
GEO Secretariat, 2300 CH-1211 Geneva, Switzerland
*
Author to whom correspondence should be addressed.
Submission received: 15 June 2019 / Revised: 23 October 2019 / Accepted: 25 October 2019 / Published: 5 November 2019
(This article belongs to the Special Issue Earth Observation Data Cubes)

Abstract

:
The emerging global trend of satellite operators producing analysis-ready data combined with open source tools for managing and exploiting these data are leading to more and more countries using Earth observation data to drive progress against key national and international development agendas. This paper provides examples from Australia, Mexico, Switzerland, and Tanzania on how the Open Data Cube technology has been combined with analysis-ready data to provide new insights and support better policy making across issues as diverse as water resource management through to urbanization and environmental–economic accounting.

1. Introduction

Earth observation (EO) data from ground, airborne, and space platforms and associated applications have the potential to, and already, provide insights into global policy frameworks including: the United Nations (UN) 2030 Agenda for Sustainable Development [1], the UN System of Environmental Economic Accounting [2], the Sendai Framework for Disaster Risk Reduction [3] and the Paris Climate Agreement [4]. EO data can support, validate, and augment traditional data inputs, including national statistics, administrative data, household survey data and census information. In addition, EO data contribute as a direct indicator to inform relevant goals and targets; help optimize surveys and other traditional data collection efforts; and support disaggregation of targets and indicators, where relevant, to ensure that no one is left behind. Today, petabytes of EO data and geospatial information, coupled with analytical methods and innovation in technology, and enabled by free and open data policies, are applied widely around the world to derive useful information about the drivers, pace, and associated impacts of change on Earth, as well as to inform policies and support decision making.
Significant work is still needed, however, to ensure that different types of end-users are harnessing the full potential of EO to address local challenges and assist with the monitoring and implementation of global agendas, such as the UN 2030 Agenda for Sustainable Development. Improvements are needed to overcome challenges such as: EO data accessibility and handling; EO data validity and fitness for purpose; integration of information from different data streams; and data continuity [5]. Organizations such as the Group on Earth Observations (GEO) and the Committee on Earth Observation Satellites (CEOS) are working to reduce the barriers that are faced by end-users across multiple sectors and regions in accessing, analyzing, and integrating satellite-based and other sources of EO data into national processes and decision support systems. More and more, there is a recognized need for new ways of managing and providing easy access to the vast amounts of EO that is increasingly available, as well as for raising awareness about the value of the data and translating science into policy.
In recent years, there has been a global move towards satellite operators producing analysis-ready data, to reduce the work needed by users prior to exploiting and analyzing satellite data. For example, CEOS has led the creation of the CEOS Analysis Ready Data for Land (CARD4L) framework. This framework defines CARD4L data as “… satellite data that have been processed to a minimum set of requirements and organized into a form that allows immediate analysis with a minimum of additional user effort and interoperability both through time and with other datasets” [6].
The CARD4L framework has provided a set of product family specifications (PFS) for surface reflectance [7], surface temperature [8], and radar backscatter [9]. These specifications, while not prescriptive, provide both minimum and target thresholds for general metadata, per-pixel metadata, radiometric and atmospheric corrections, and geometric corrections.
Satellite operators such as the United States Geological Survey (USGS) are now in the process of using these PFS to produce global collections of CARD4L compliant EO data. This transition to easily accessible CARD4L compliant data provides an incredible opportunity for EO data to be more impactful across a wide range of global challenges. However, the sheer amount of data that is now, or will soon be, available for use demands that we move away from the historical approach of users downloading data and local processing toward “processing into high performance computing data centers (e.g., Google Earth Engine, planet-API, National Computing Infrastructure in Australia, DigitalGlobe DGBX platform) using Big Data processing tools…along the lines of moving the algorithms to the data not the data to the algorithms” [10]. Bringing together data, analytical methods, infrastructure, and application insights is essential to promote and accelerate social, economic, and environmental sustainability.
A range of software (open source and proprietary), tools, and analysis platforms exist for accessing, storing, processing, and facilitating the use of EO to derive insights and for societal applications. Cloud computing has had a tremendous effect on the emergence of computational infrastructure designed to provide EO analysis capabilities such as Google Earth Engine [11], the Copernicus Data and Information Access Services [12] and a range of other platforms provided via Amazon Web Services, Microsoft Azure (Layerscape), etc. Before choosing a software product, tool or analysis platform, end-users—including national statistical agencies, line ministries, and national mapping agencies, among other stakeholders—need to take into account their local needs including governance requirements, institutional capacity, geospatial analytics expertise, associated costs, and sustainability of the respective tool(s) or EO analysis platforms.
Countries such as Australia, Mexico, Switzerland, and Tanzania either have adopted or are in the process of adopting an open source solution, the Open Data Cube (ODC) [13,14], to enable them to integrate insights from Earth observation data into their national policy and information systems. The ODC builds on the work of the Australian Geoscience Data Cube [15] and seeks to increase the value and impact of global EO data by providing an open and freely accessible exploitation architecture, while fostering a community of cooperation that promotes open EO data, reuse of algorithms, and related information usage and sharing for the benefit of society.
The open source nature of the ODC was an important factor in this tool being selected by Australia, Mexico, Switzerland, and Tanzania. However, the other critical factor is the ODC’s ability to be implemented on diverse computational infrastructures ranging from national supercomputing facilities such as Australia’s National Computational Infrastructure, through to numerous commercial cloud infrastructures. Together, this combination of open source software and infrastructure flexibility has enabled the establishment of sovereign, operational capabilities that can be controlled and managed in-country. This is critical in order to build trust that the information products being generated can be both sustained and relied upon for use in a wide variety of policy problems.

2. Open Data Cube Examples

This paper provides examples of how the provision of CARD4L compliant EO data together with operational ODC implementations is enabling countries to better tackle challenges ranging from water resource management through to urbanization. The examples vary in terms of the maturity of their implementation and their success to date in influencing national development agendas. However, all of these deployments have the common aim of trying to ensure that there is a better connection from global EO data to national level development practices.

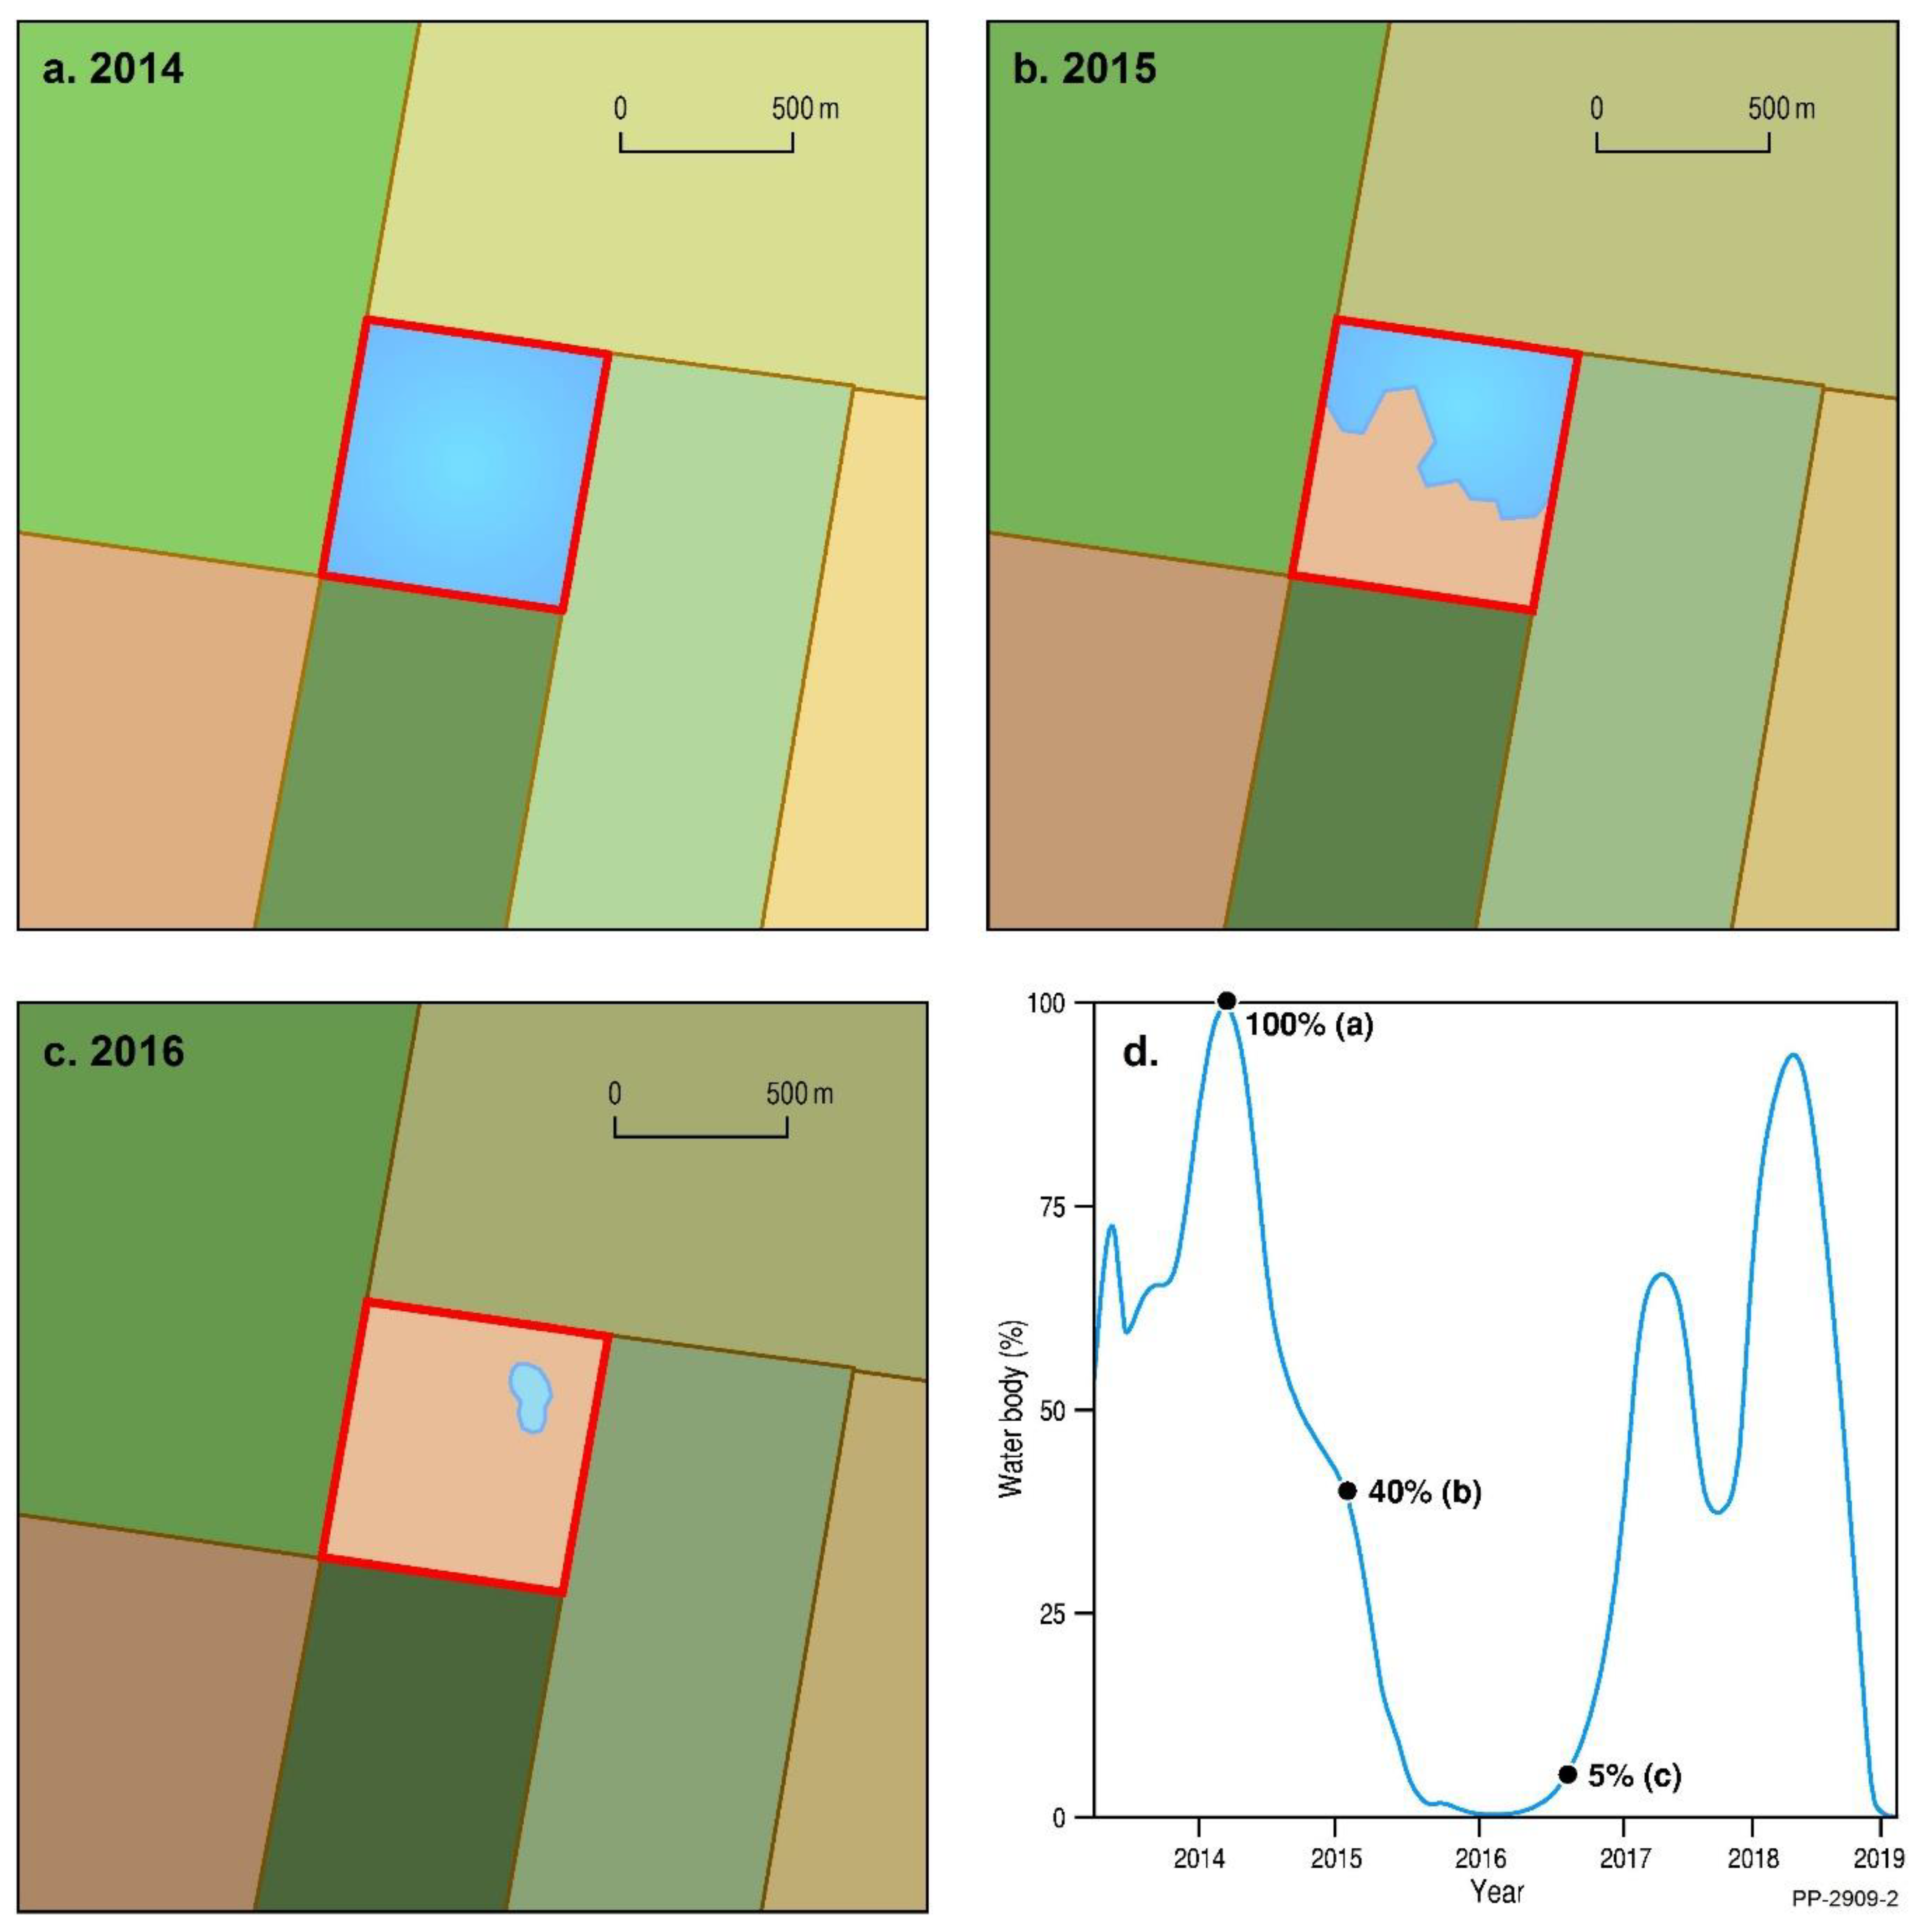
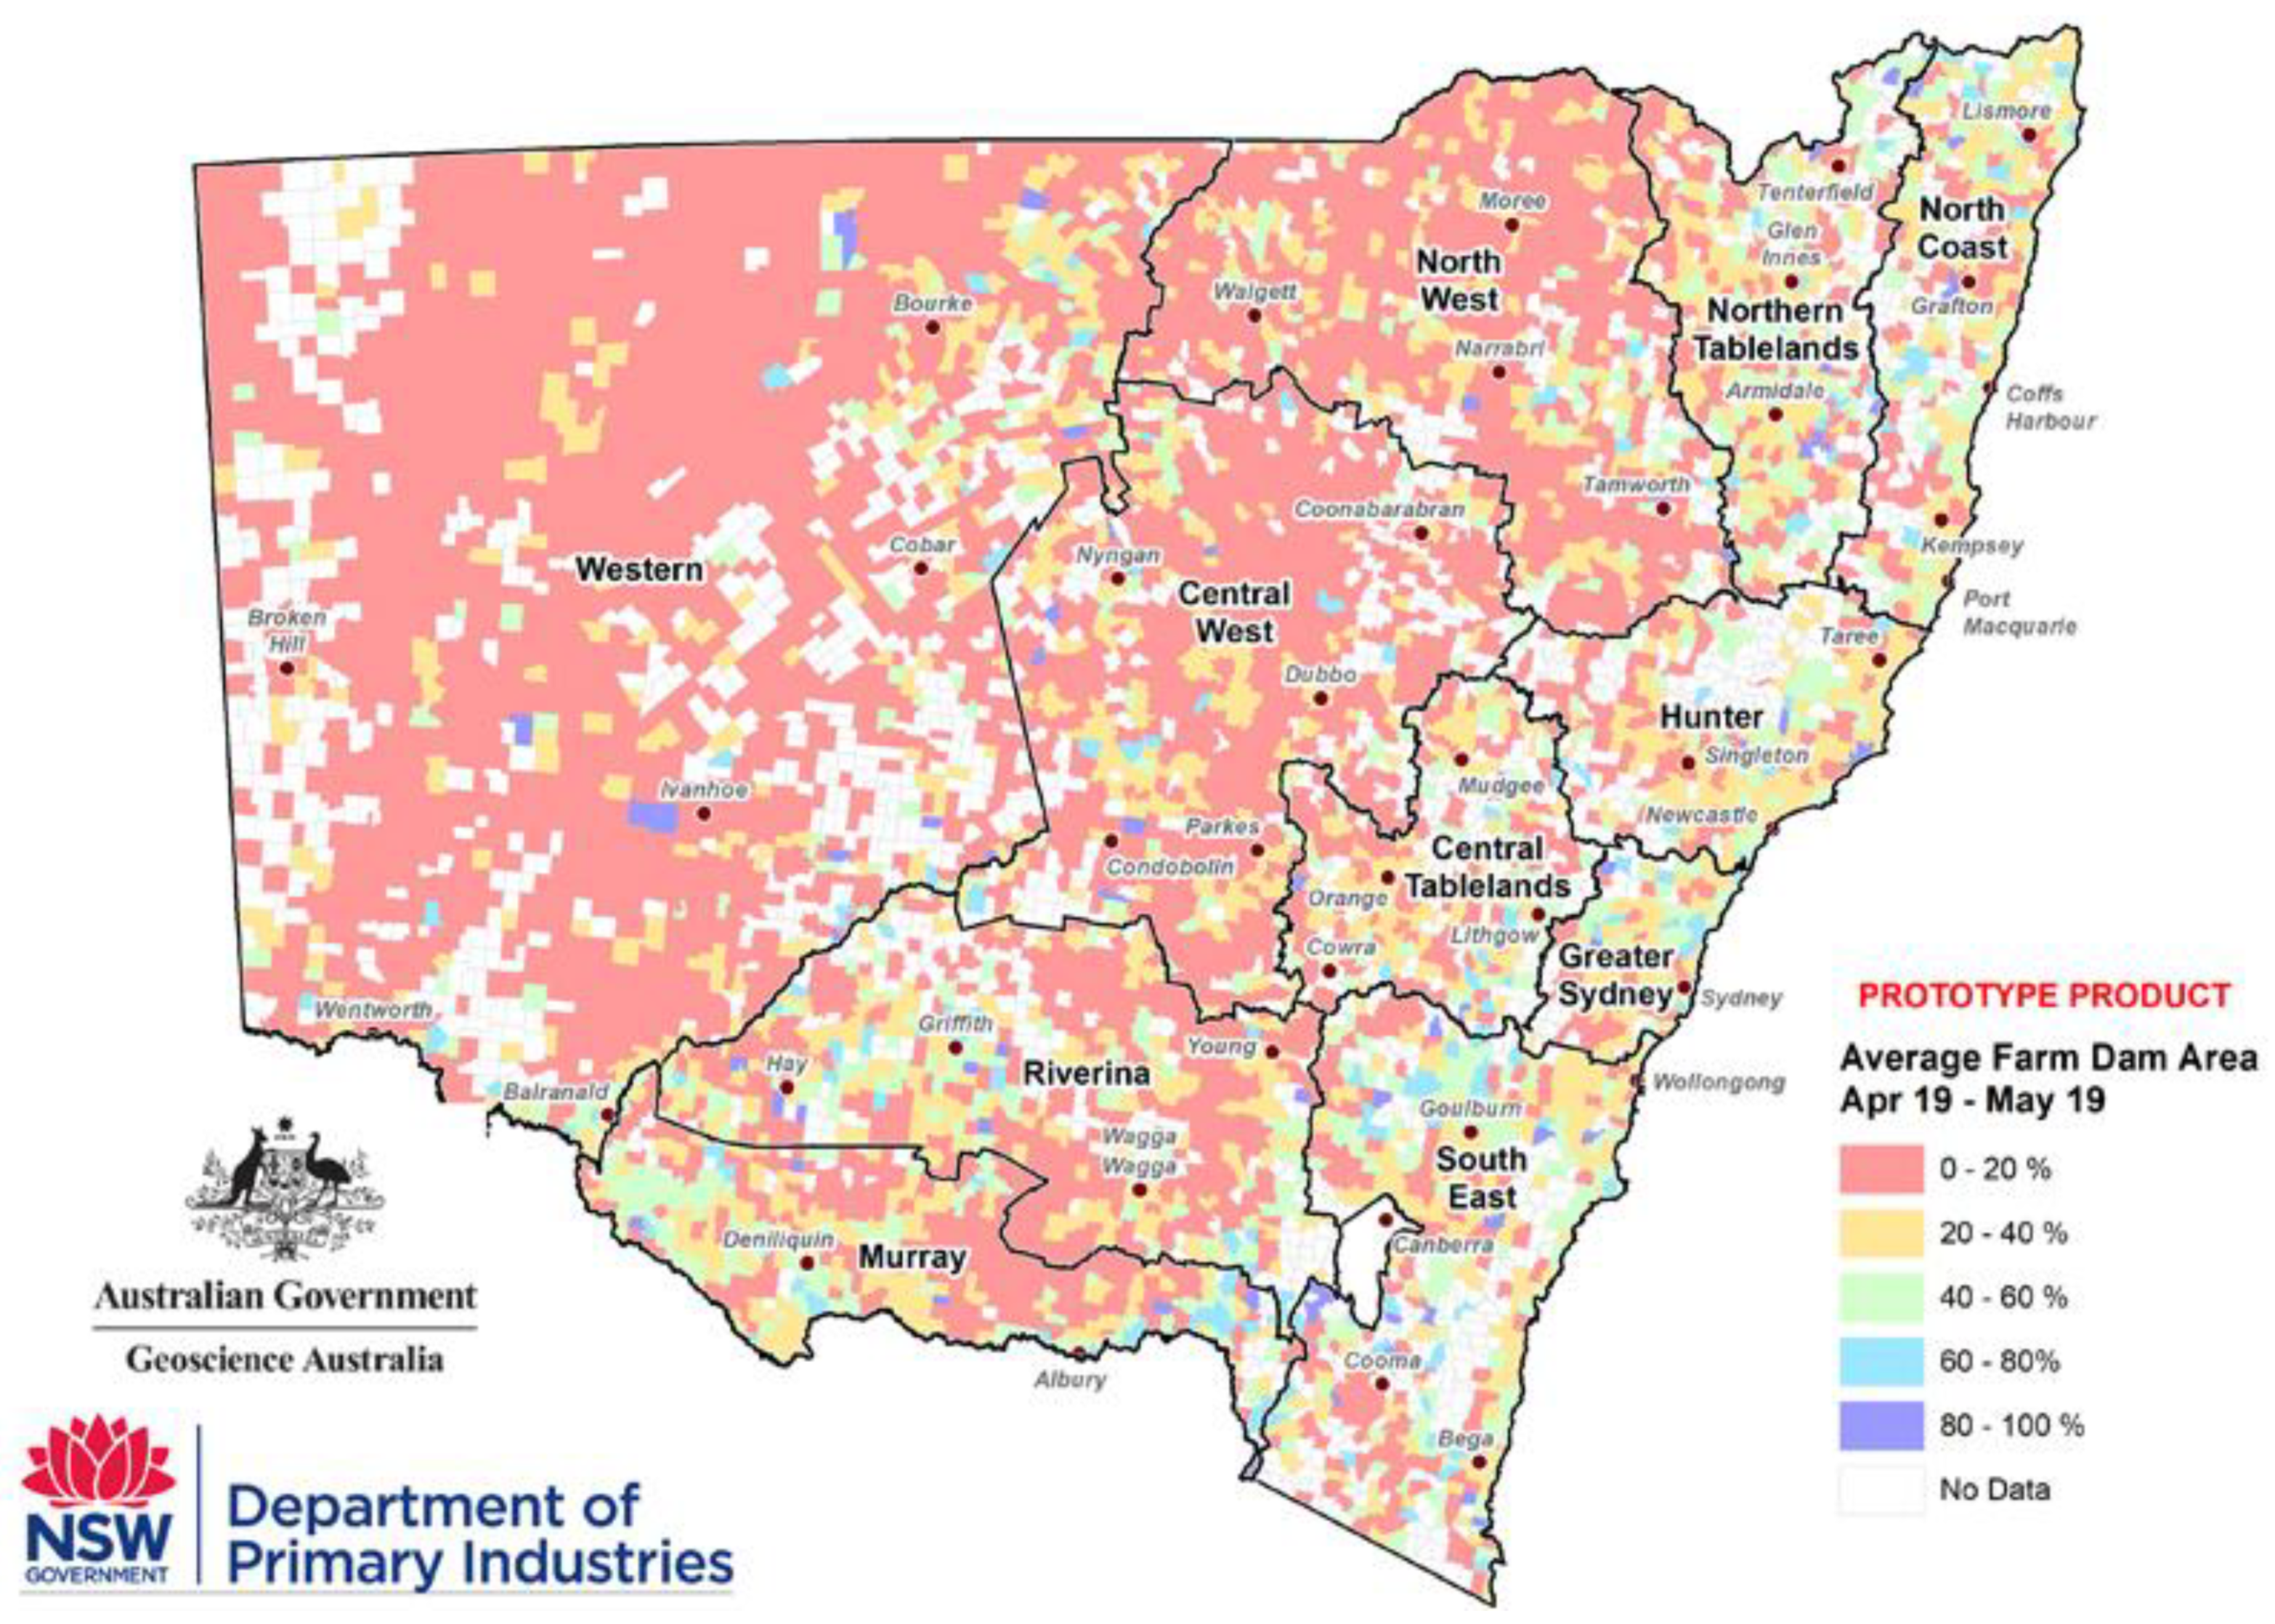
2.1. Water Resource Management in the Murray-Darling Basin, Australia

2.1.1. Overview of Digital Earth Australia

In May 2018, the Australian Government announced an ongoing investment of approximately 9.1 M USD per year in Digital Earth Australia (DE Australia) to deliver new and innovative satellite-based applications and services to the Australian Government and businesses. DE Australia is the world’s first operational, continental scale implementation of the ODC technology. The technical details of DE Australia are outlined in [15,16].
DE Australia currently produces its own analysis-ready data for the Landsat and Sentinel-2 satellites, which include corrections for position, terrain, radiometry, atmosphere, and sun-sensor geometry [17,18]. This approach is currently being reviewed by CEOS to ensure that it is compliant with the CARD4L standards.
DE Australia is helping the Australian Government to understand environmental changes such as water availability, crop growth and urban expansion, supporting improved decision making and planning. DE Australia is also driving Australia’s economic growth by enabling small businesses and industry to more readily access satellite data to innovate and create new products. This will present new opportunities and increase the profitability and productivity of businesses in sectors such as land planning, construction, agriculture, and mineral exploration [19,20]. For example, information drawn from satellites is vital to help grazers increase the capacity of paddocks and make their farms more viable and sustainable [21].

2.1.2. Managing Water in the Murray-Darling Basin, Australia

The Murray-Darling Basin (the Basin) is one of Australia’s most important agricultural regions. It covers 14% of Australia’s land mass, produces more than one-third of the nation’s food and $22 billion in agriculture on average each year [22]. The Basin is also home to more than 30,000 wetlands, 16 of international importance under the Convention on Wetlands of International Importance (Ramsar Convention), which are fundamental to the health and viability of the whole basin [22].
Managing water across an area as large as the Basin with as many different competing uses for the water presents numerous challenges that must be addressed to ensure that Australia achieves progress against a wide range of Sustainable Development Goals (e.g., SDG 2 and 6). In 2012, the Murray-Darling Basin Plan passed into law in Australia as a major step forward in managing this complex system. This Murray-Darling Basin Plan was developed “… to bring the Basin back to a healthier and sustainable level, while continuing to support farming and other industries for the benefit of the Australian community” [23].
These challenges are further compounded given that Australia is currently in the midst of a drought that is covering vast tracks of the Basin. In order to help manage the current drought, Geoscience Australia and the New South Wales government are exploiting one of DE Australia’s first decision-ready products, Water Observations from Space (WOfS). DE Australia’s current implementation of WOfS detects water on the land surface from Landsat imagery [24]. WOfS provides an understanding of where water is usually present, where it is seldom observed, and where inundation of the surface has been occasionally observed by satellite.
DE Australia has used the WoFS algorithm, updated for every Landsat pass, and a map of the locations and spatial extent of over 60,000 water storages, referred to as farm dams, to estimate how full these farm dams are on a monthly basis. The product does not provide an estimate of the volume of water available, but rather an estimate of how full the dam is as a percentage of the maximum of the horizontal extent of the farm dam (Figure 1).
The farm dam fullness estimated by this method is not a precise estimate and is meant to be a qualitative indicator of water availability. For example, this method does not work well for steep sided farm dams nor for farm dams with a spatial extent smaller than ~2500 m2. Nonetheless, initial qualitative attempts to validate this data have demonstrated its utility in providing governments with a broad-scale understanding of the availability of water. The New South Wales (NSW) government is taking DE Australia’s monthly estimates of dam fullness, aggregating it spatially across local regions called parishes, to produce and publish a map of Farm Dam Water Status on a monthly basis (Figure 2). This is the first ever comprehensive audit of farm dam levels across NSW and it is providing the NSW government with new insights into how much water is available on farms and where the current drought is posing the largest risks to water supply for agriculture. This insight is, in turn, informing the prioritization of a wide range of drought management and response programs of the NSW Government.
The NSW Farm Dam Assessment forms part of the NSW Government’s State Seasonal Update that is used by the NSW Regional Assistance Advisory Committee in making recommendations on potential support for farm businesses, families, and communities. The Farm Dam Assessment is now an integral part of the data used by this committee in making recommendations to the NSW Minister for Primary Industries and NSW Government on relative priority and timing of introducing and withdrawing drought response programs and initiatives identified in the NSW Drought Framework.
At the same time, given the scarcity of water in the Basin and the various competing uses, it is critical that the Australian Government is able to ensure that when water has been embargoed for the environment, that it is not illegally used for other purposes such as irrigation. The Australian Government is now using Digital Earth Australia (DEA) to ensure compliance with the Murray-Darling Basin Plan and to help make sure that no one is stealing water that has been earmarked for environmental purposes.
The Murray-Darling Basin Authority (MDBA) is the Australian government agency responsible for developing and implementing a plan to ensure the sustainable use of the Basin’s water resources. In 2018, the MDBA undertook the “… first large-scale use of satellite imagery for tracking the progress of an environmental flow event covering a large fraction of the Basin …” [26]. This pilot study was undertaken with the explicit intent of using satellite data to help prevent and detect water theft. The MDBA demonstrated that the imagery from DE Australia is able to detect water in irrigation channels and on-farm storages as well as detect changes to crops [26]. It is also capable of detecting water in the wetlands and river reaches that are being targeted with a specific water release. The MDBA has identified that DE Australia is providing them with “ … a valuable new tool to ensure water is delivered to where it is needed and is not diverted for unauthorised use” [27].
DE Australia was subsequently used to provide the MDBA with EO data that they are using to identify waterbodies that have filled during periods when farmers were not allowed to extract water from the river [28]. EO data on its own is not enough to determine whether or not these waterbodies have been filled legally or illegally. However, this data does offer a tool for prioritizing where more expensive on-ground compliance investigations are undertaken. This approach to using satellite data to protect water is a new capability that has been enabled by DE Australia and will transform Australia’s approach to managing this precious resource into the future.

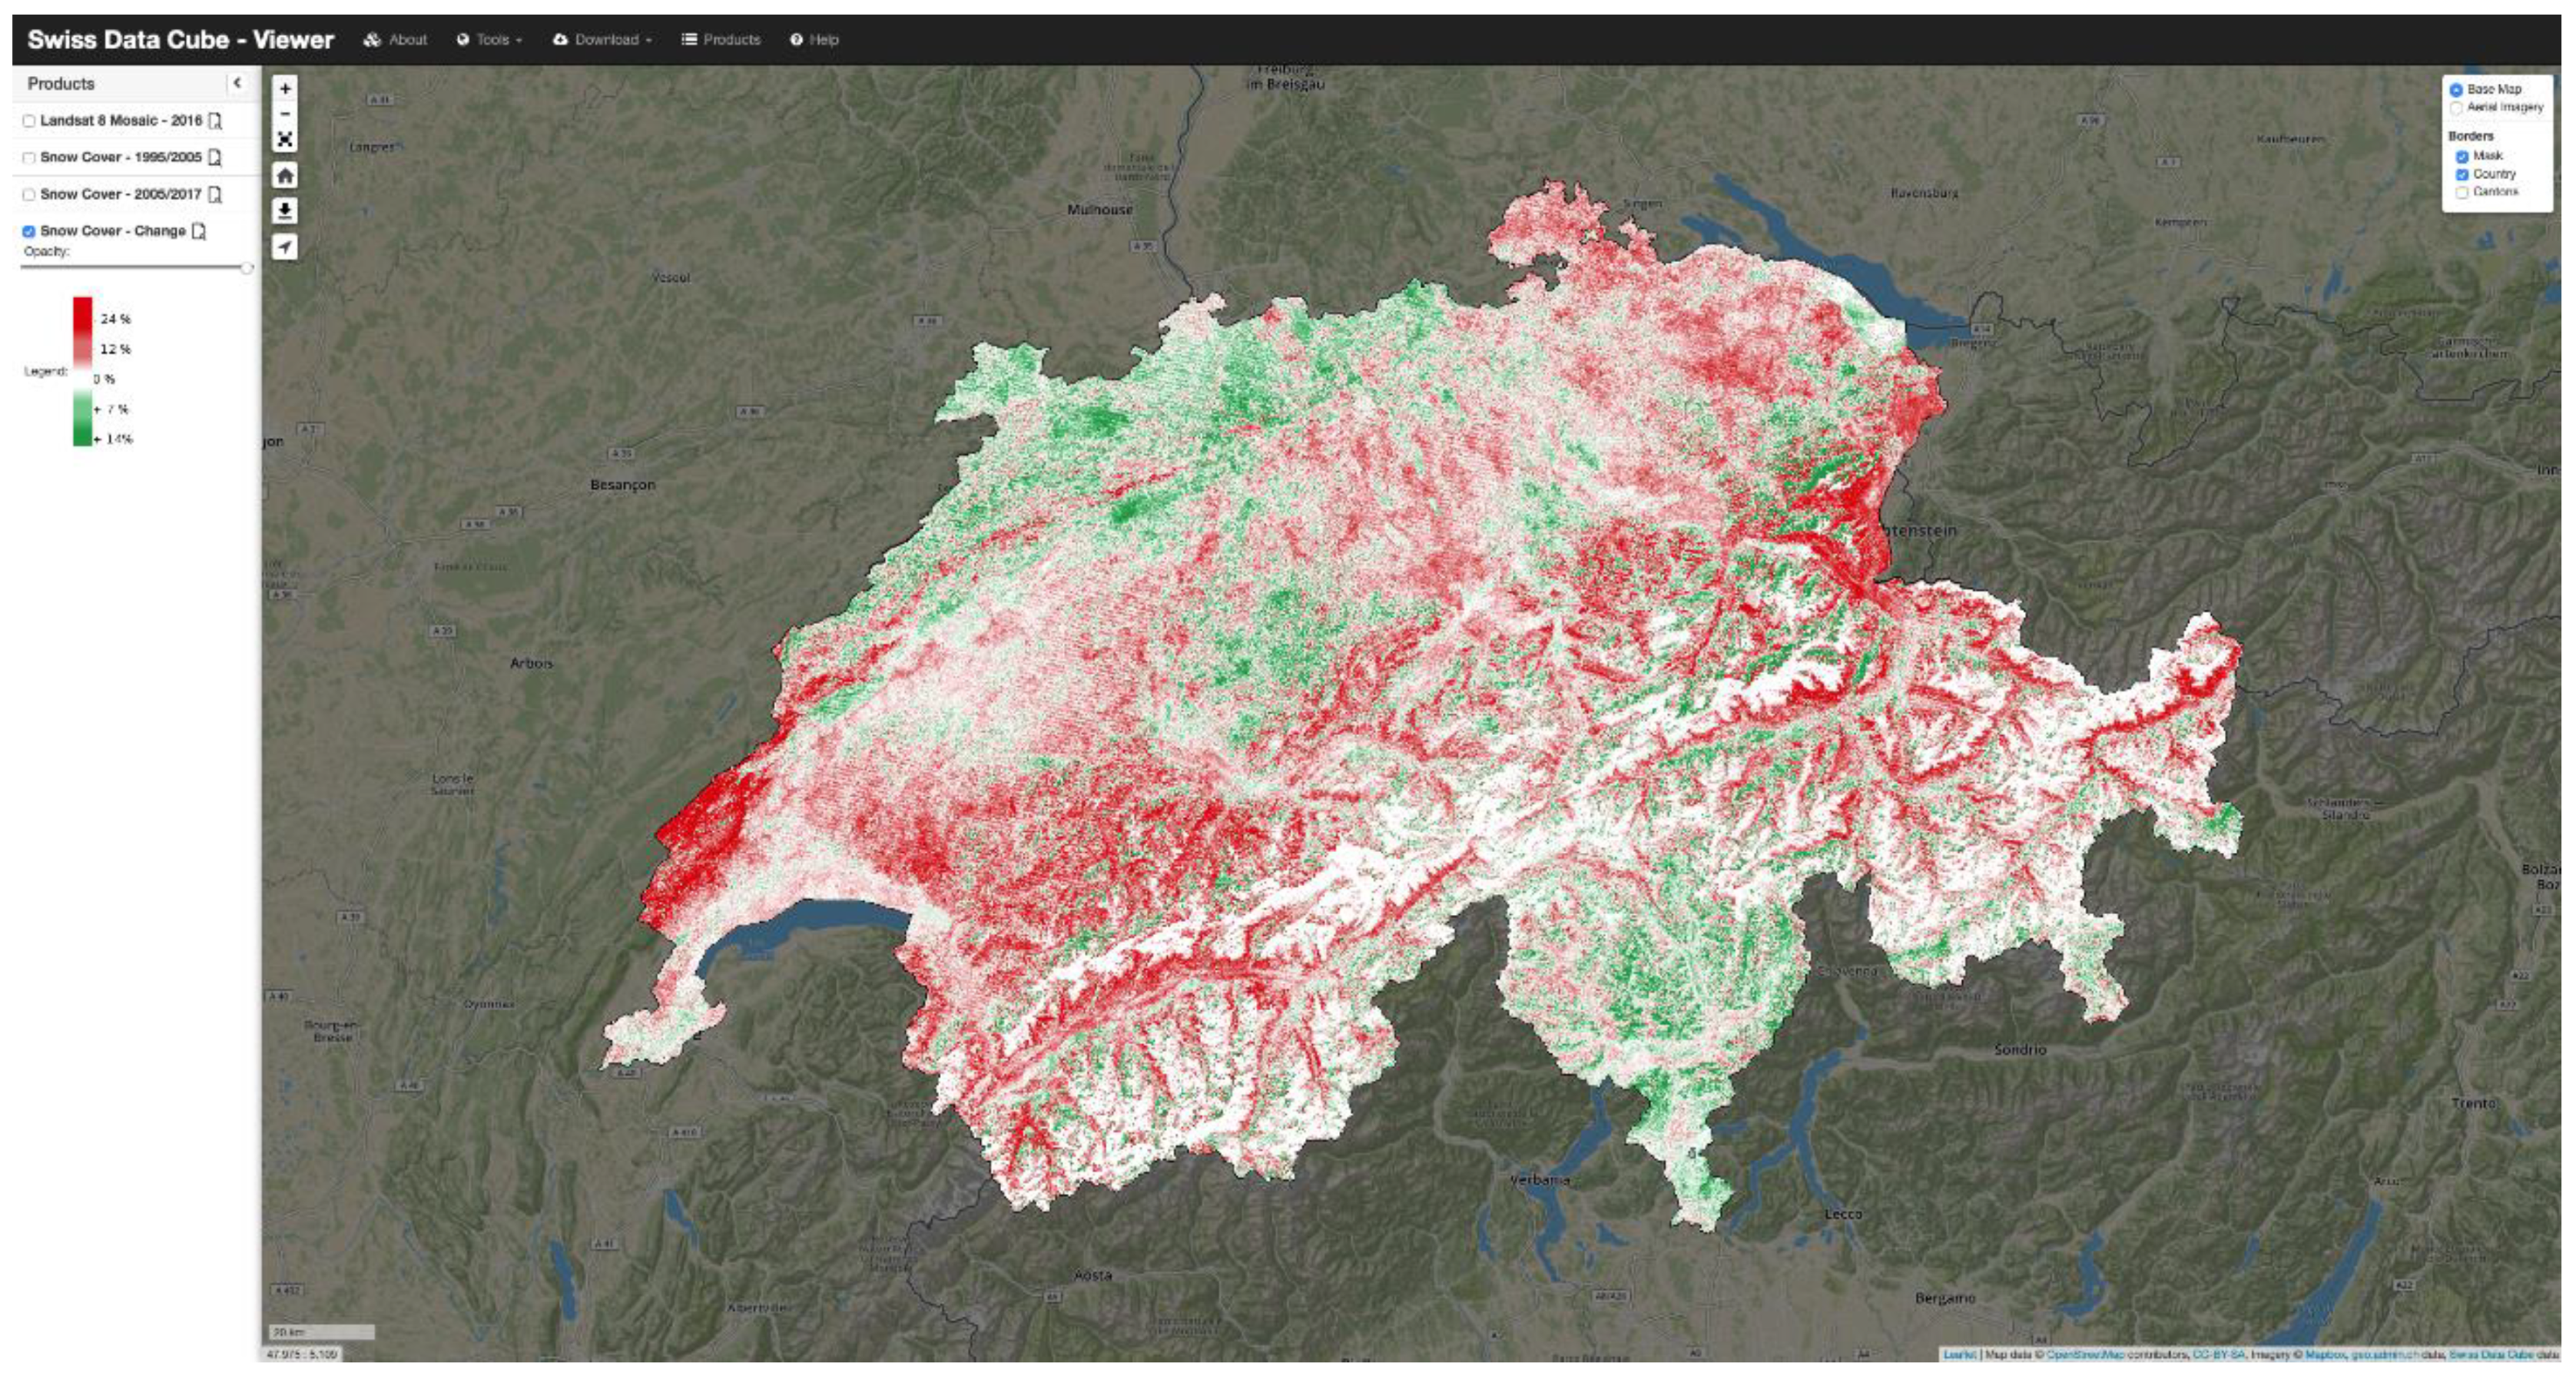
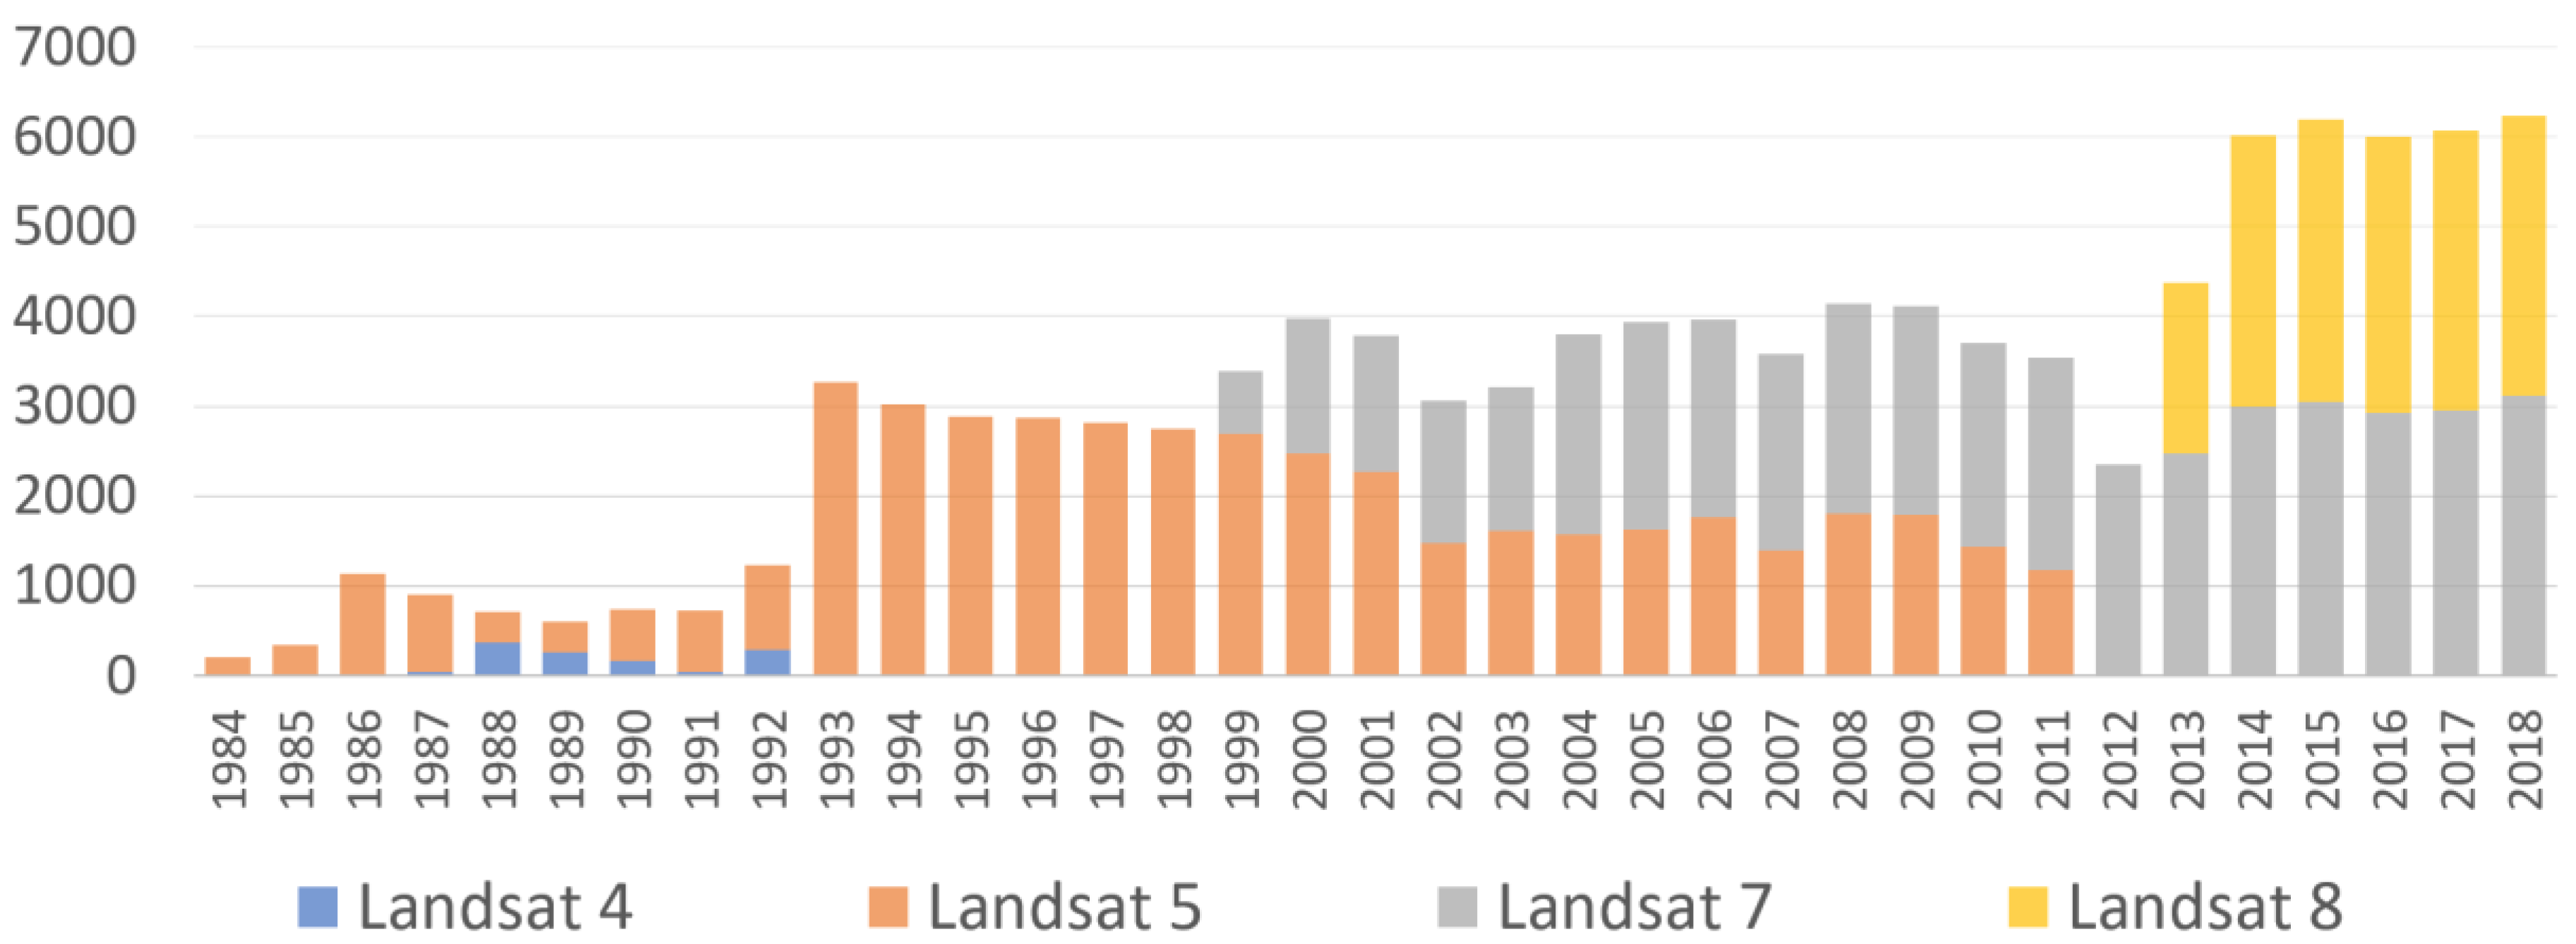
2.2. Snow Cover Monitoring, Switzerland

2.2.1. Overview of the Swiss Data Cube

Following the work done in Australia, the Swiss Data Cube (SDC) [29] is an initiative supported by the Federal Office for the Environment (FOEN) and developed, implemented, and operated by the United Environment Program (UNEP)/GRID-Geneva in partnership with the University of Geneva (UNIGE), the University of Zurich (UZH), and the Swiss Federal Institute for Forest, Snow and Landscape Research (WSL). The objective of the SDC is to support the Swiss government in environmental monitoring and reporting, as well as enable Swiss scientific institutions to fully benefit from EO data for research and innovation.
Currently, the SDC contains 35 years of analysis-ready data of both optical (e.g., Landsat 5, 7, 8; Sentinel-2) and radar (e.g., Sentinel-1) satellite data over the entire country (total volume: 6TB; 200 billion observations) [30]. The SDC is an innovative analytical framework, based on the Open Data Cube software stack [14,31], allowing users to benefit from this new generation of EO data, and in particular minimizing the time and scientific knowledge required to access, prepare, and make it possible to analyze a large volume of data with consistent and spatially-aligned, calibrated observations.
The SDC is aiming at contributing to the national Digital Switzerland strategy by (1) supporting innovation and growth, (2) improving efficiency and effectiveness of government investments, (3) improving management of natural resources, (4) stimulating research, (5) generating decision-ready information products, and (6) improving data access and use and enabling new products/services that can transform everyday life. Ultimately, the SDC will deliver a unique capability to track changes in unprecedented detail using Earth observation satellite data and enable more effective responses to problems of national significance [32].

2.2.2. Monitoring Snow Cover Evolution, Switzerland

Like many other countries in the world, Switzerland faces challenges (e.g., land management, environmental degradation) caused by increasing pressures on its natural resources [33]. These challenges need to be overcome to meet the needs of a growing population. Switzerland is acknowledged as the water reservoir of Europe. While its territory represents four thousandths of the continent’s total area, 6% of Europe’s freshwater reserves are stored in Switzerland [34,35].
Monitoring snow cover and its variability is an indicator of climate change and identification of snowmelt processes is essential for effective water-resource management. Indeed, it is expected that by 2085, the proportion of snow contributing to water bodies will decrease by 25%, strongly affecting the water regime of major European rivers like the Rhône, Rhine, and Danube [36,37,38].
Earth observation (EO) data acquired by satellites are helpful to monitor snow conditions through time. Synthetic-aperture radar (SAR) images are effective and robust measures to identify melting snow, whereas optical data are able to identify snow cover extension [39,40]. Detailed knowledge of snow cover and its evolution in Switzerland is an essential tool for public policies and decision-making. Beyond the economic issues related to tourism, other questions arise such as flood risk management or water supply, given the storage role that snow plays, retaining water in winter to release it in spring and summer.
Consequently, to better understand the spatial distribution and evolution over time of snow cover nationwide, the UN Environment/GRID-Geneva and the University of Geneva have developed a snow detection algorithm benefiting from the analysis-ready data archive and analytical framework offered by the Swiss Data Cube. The Snow Observations from Space (SOfS) algorithm is an integrated and innovative solution for monitoring snow cover and its variability across the entire country and ultimately will allow generation of a decision-ready product that can be readily used as a basis for the design, implementation, and evaluation of policies, programs, and regulation, and for developing policy advice [41]. Preliminary results have shown a clear decrease of snow cover over Switzerland in the last 20 years. The perennial snow zone, where the probability of snowfall varies between 80% and 100%, still covered 27% of the Swiss territory in the decade 1995–2005. Ten years later, it has fallen to 23%, a loss of 2100 km2 equal to seven times the size of the canton of Geneva. While areas with little or no snow covered 36% of the territory during the decade 1995–2005, the area lacking snow cover increased to 44% between 2005 and 2017, corresponding to an increase of approximately 5200 km2 (Figure 3).
SOfS offers interesting potential for environmental monitoring and can serve as a pilot example, which can be of interest for other countries/regions. To test its robustness, SOfS is currently being applied in two protected areas in Italy and France (Gran Paradiso and La Vanoise National Parks) where in-situ measurements will help validate satellite observations [43], as well as in Armenia to provide insights for water management of Lake Sevan, the largest lake in the country that has significant economic, cultural, and recreational value [44].
To turn this algorithm into an integrated and effective mechanism to monitor snow cover and its variability, providing actionable information to decision makers, we are aiming to (1) consolidate the algorithm “Snow Observations from Space” (SOfS) to get the best results possible for monitoring snow cover conditions using both optical and radar imagery allowing the identification of dry and wet snow, and (2) automate the algorithm and transform it into a service that allows measurement of different periods and scales (e.g., a value every month, trimester, year at national, cantonal, and communal levels). Results will be made available through an interface targeted at decision and policy makers (at the national, cantonal, and communal levels) so they can access the latest values and trends on the snow cover indicator. These two activities are currently under development and a first prototype will made available in 2019–2020.
In a broader context, given its small territory and dense population, effective land management has become a national priority, as exemplified by a recent vote on land use (e.g., “Stopper le mitage – pour un développement durable du milieu bâti, initiative contre le mitage/Zersiedelung stoppen – für eine nachhaltige Siedlungsentwicklung, Zersiedelungsinitiative”). The SDC has the potential to support the Swiss government to monitor environmental changes nationwide in near real-time. Currently, land cover and land use data are generated from visual interpretation of aerial photography over a 6-year period to cover the entire surface of Switzerland [45]. Therefore, following the seasonal dynamics of vegetation, water, and snow is almost impossible. The SDC can contribute to overcome this limitation, providing effective monitoring services of snow coverage, drought conditions, water quality, urban development, agricultural activities, or health of vegetation.

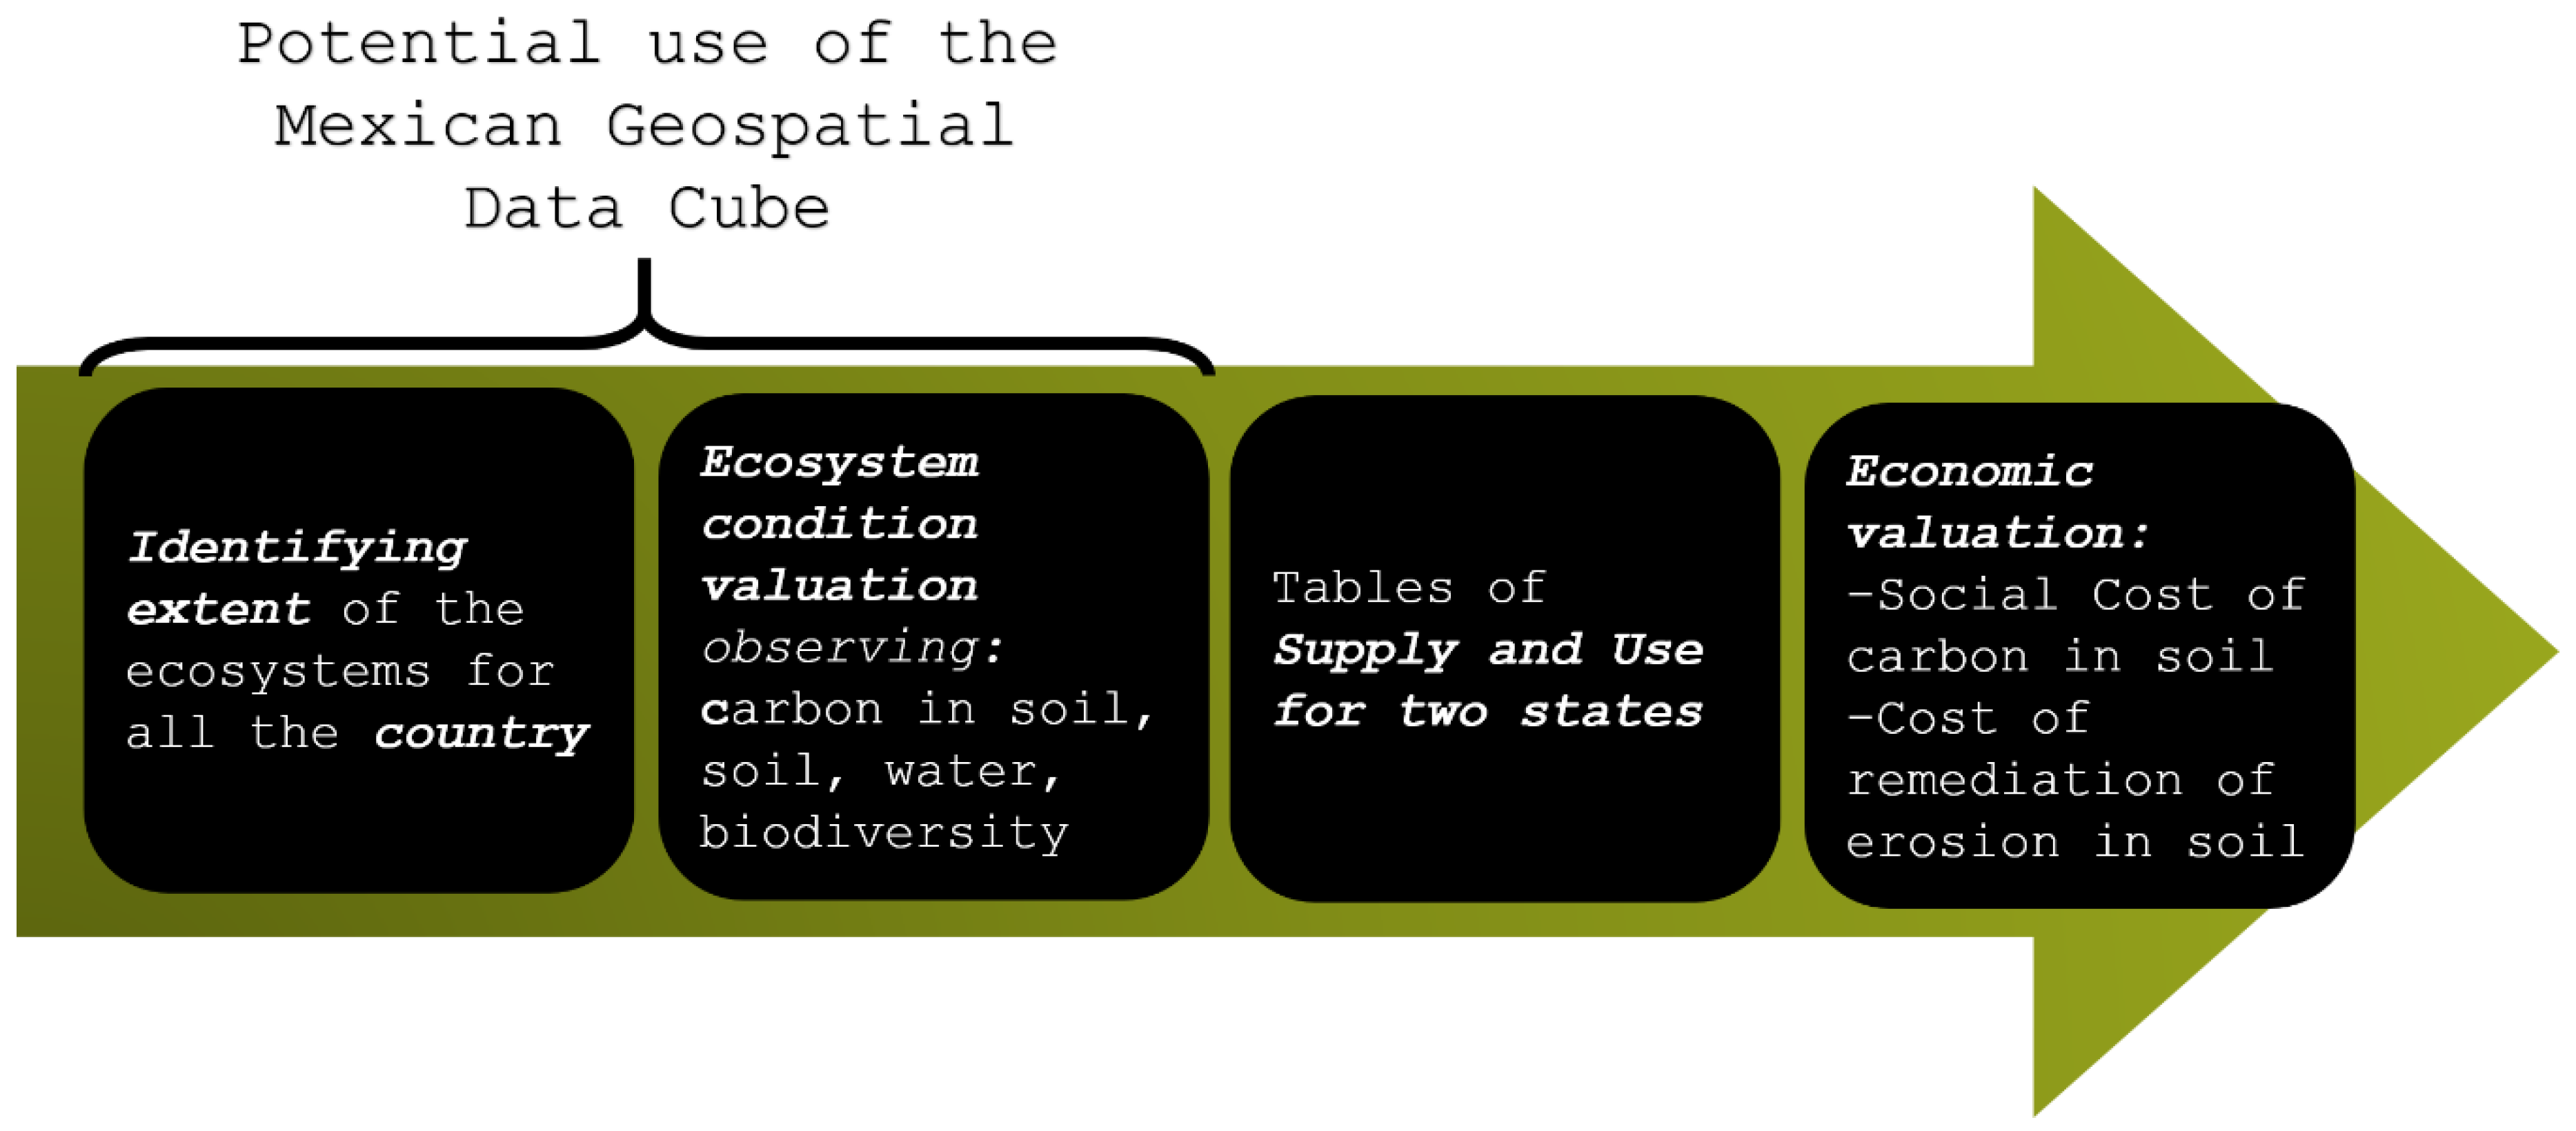
2.3. Testing the UN System for Economic-Environmental Accounting, Mexico

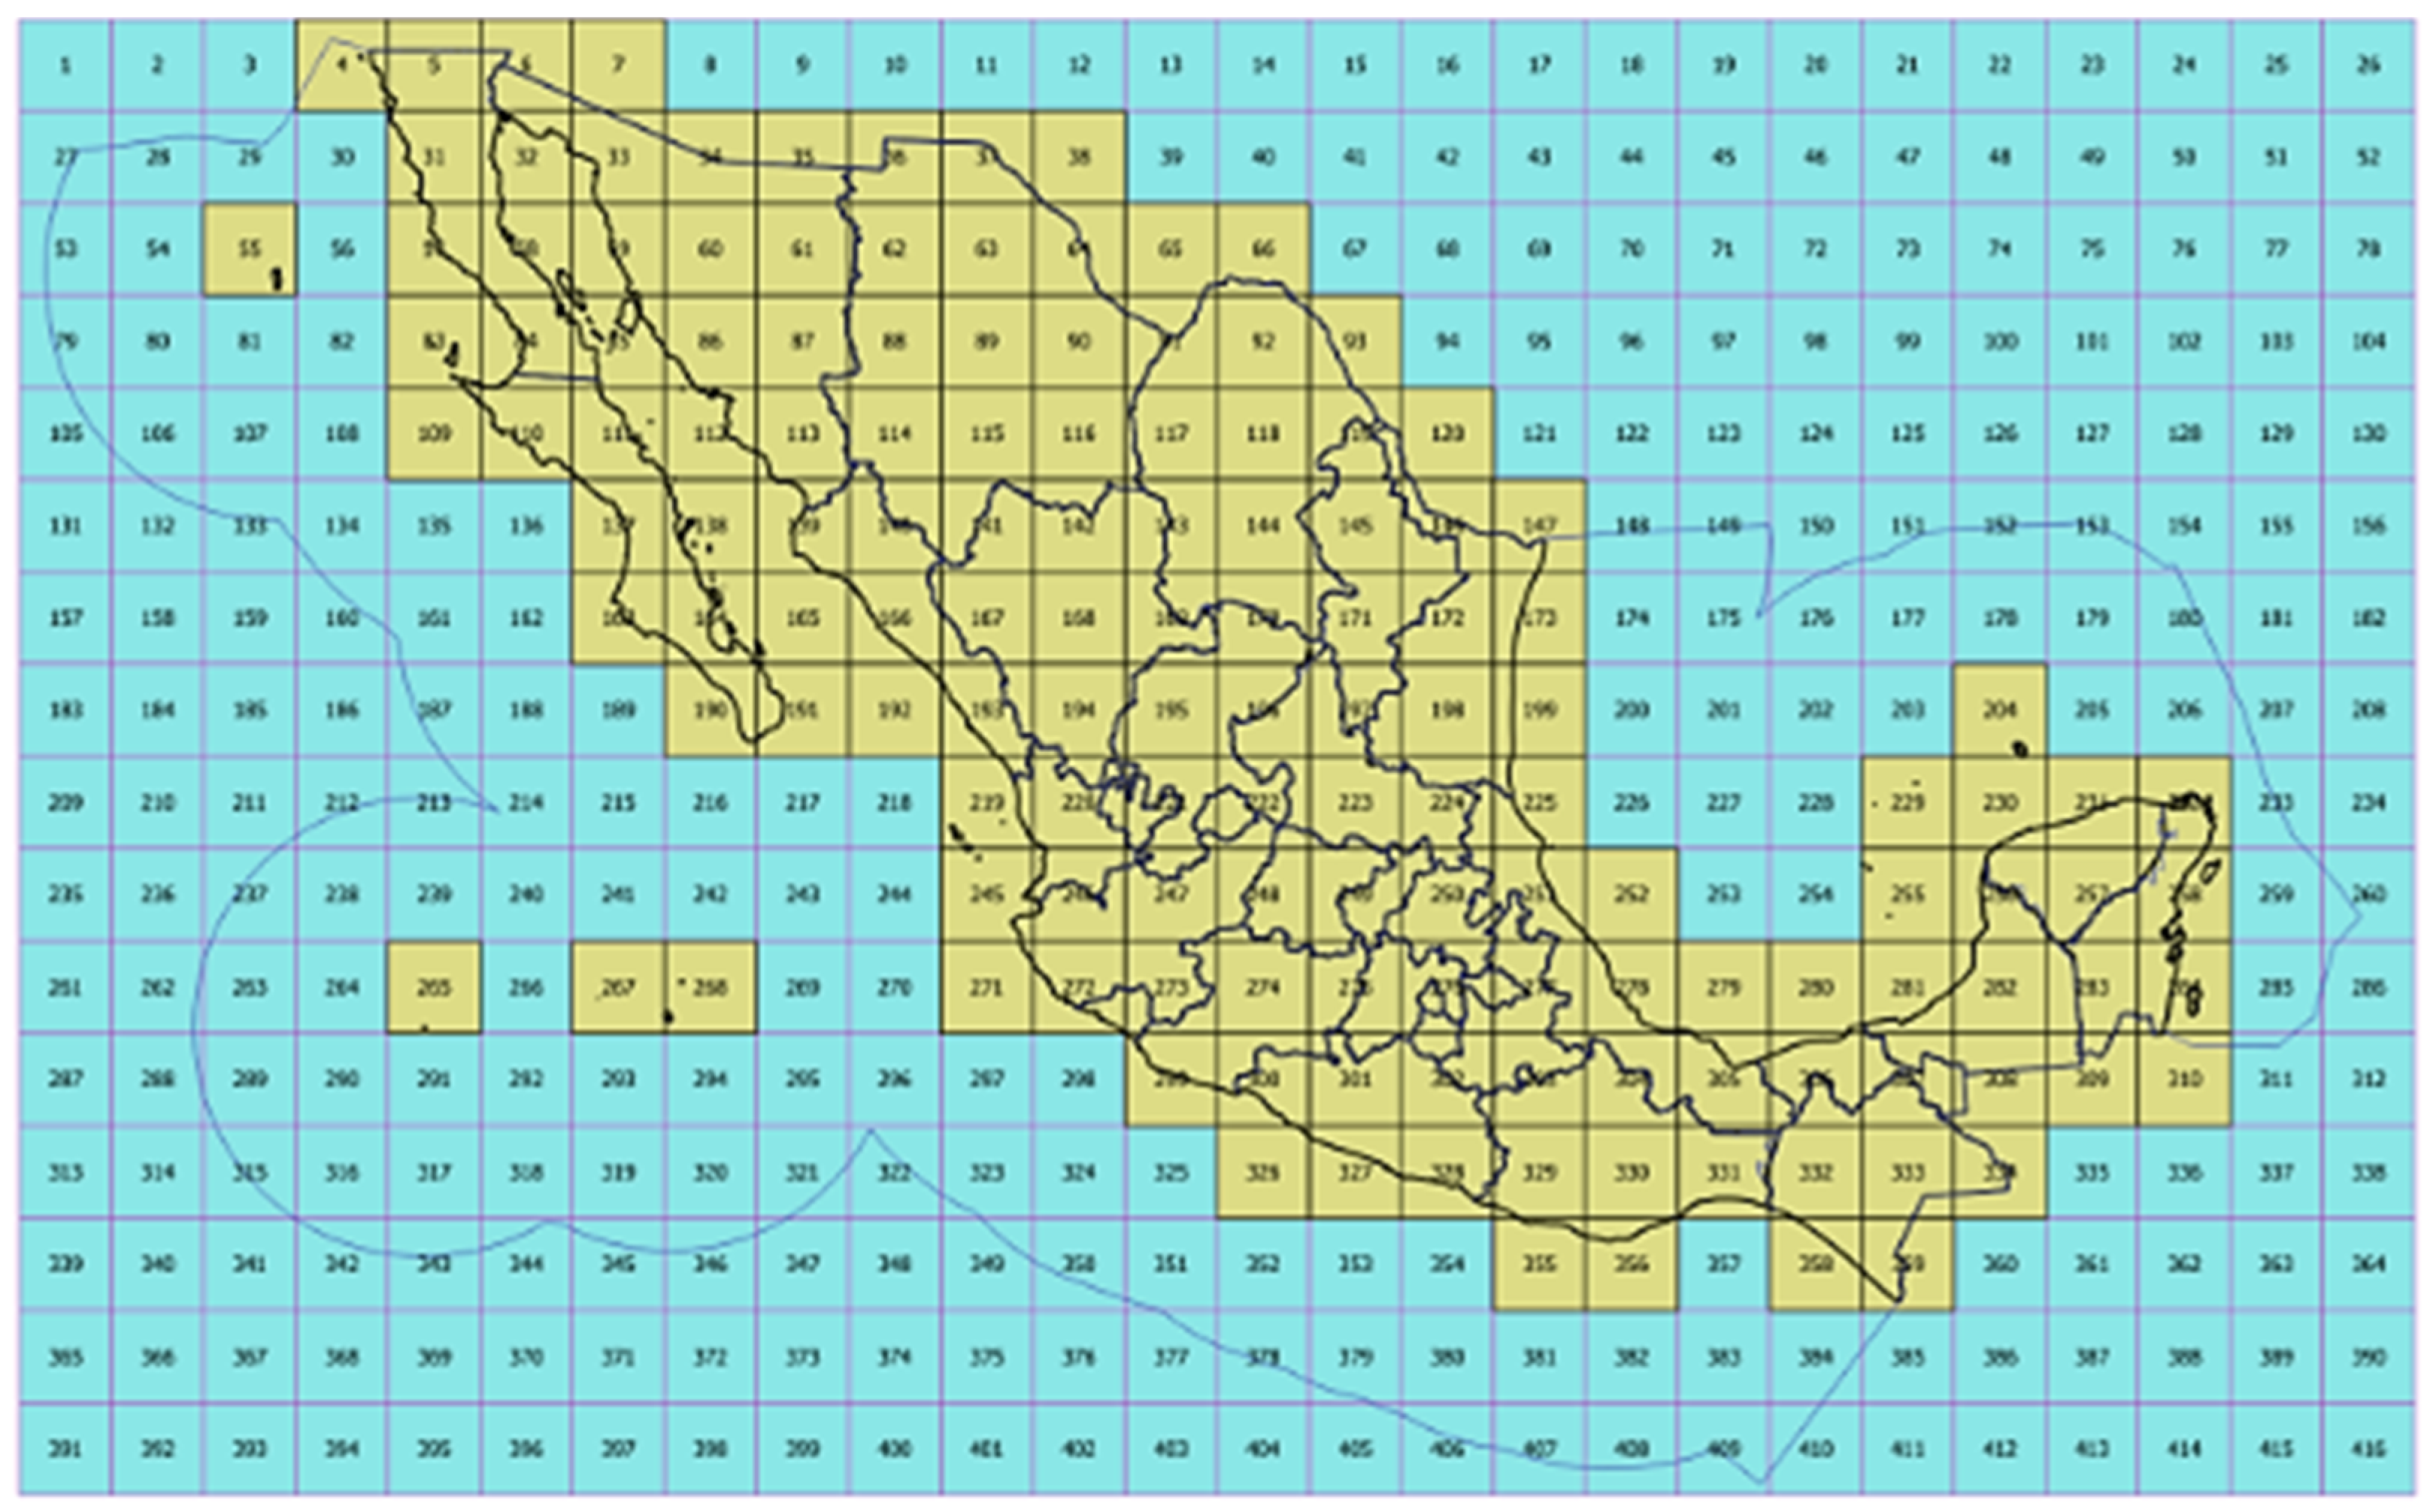
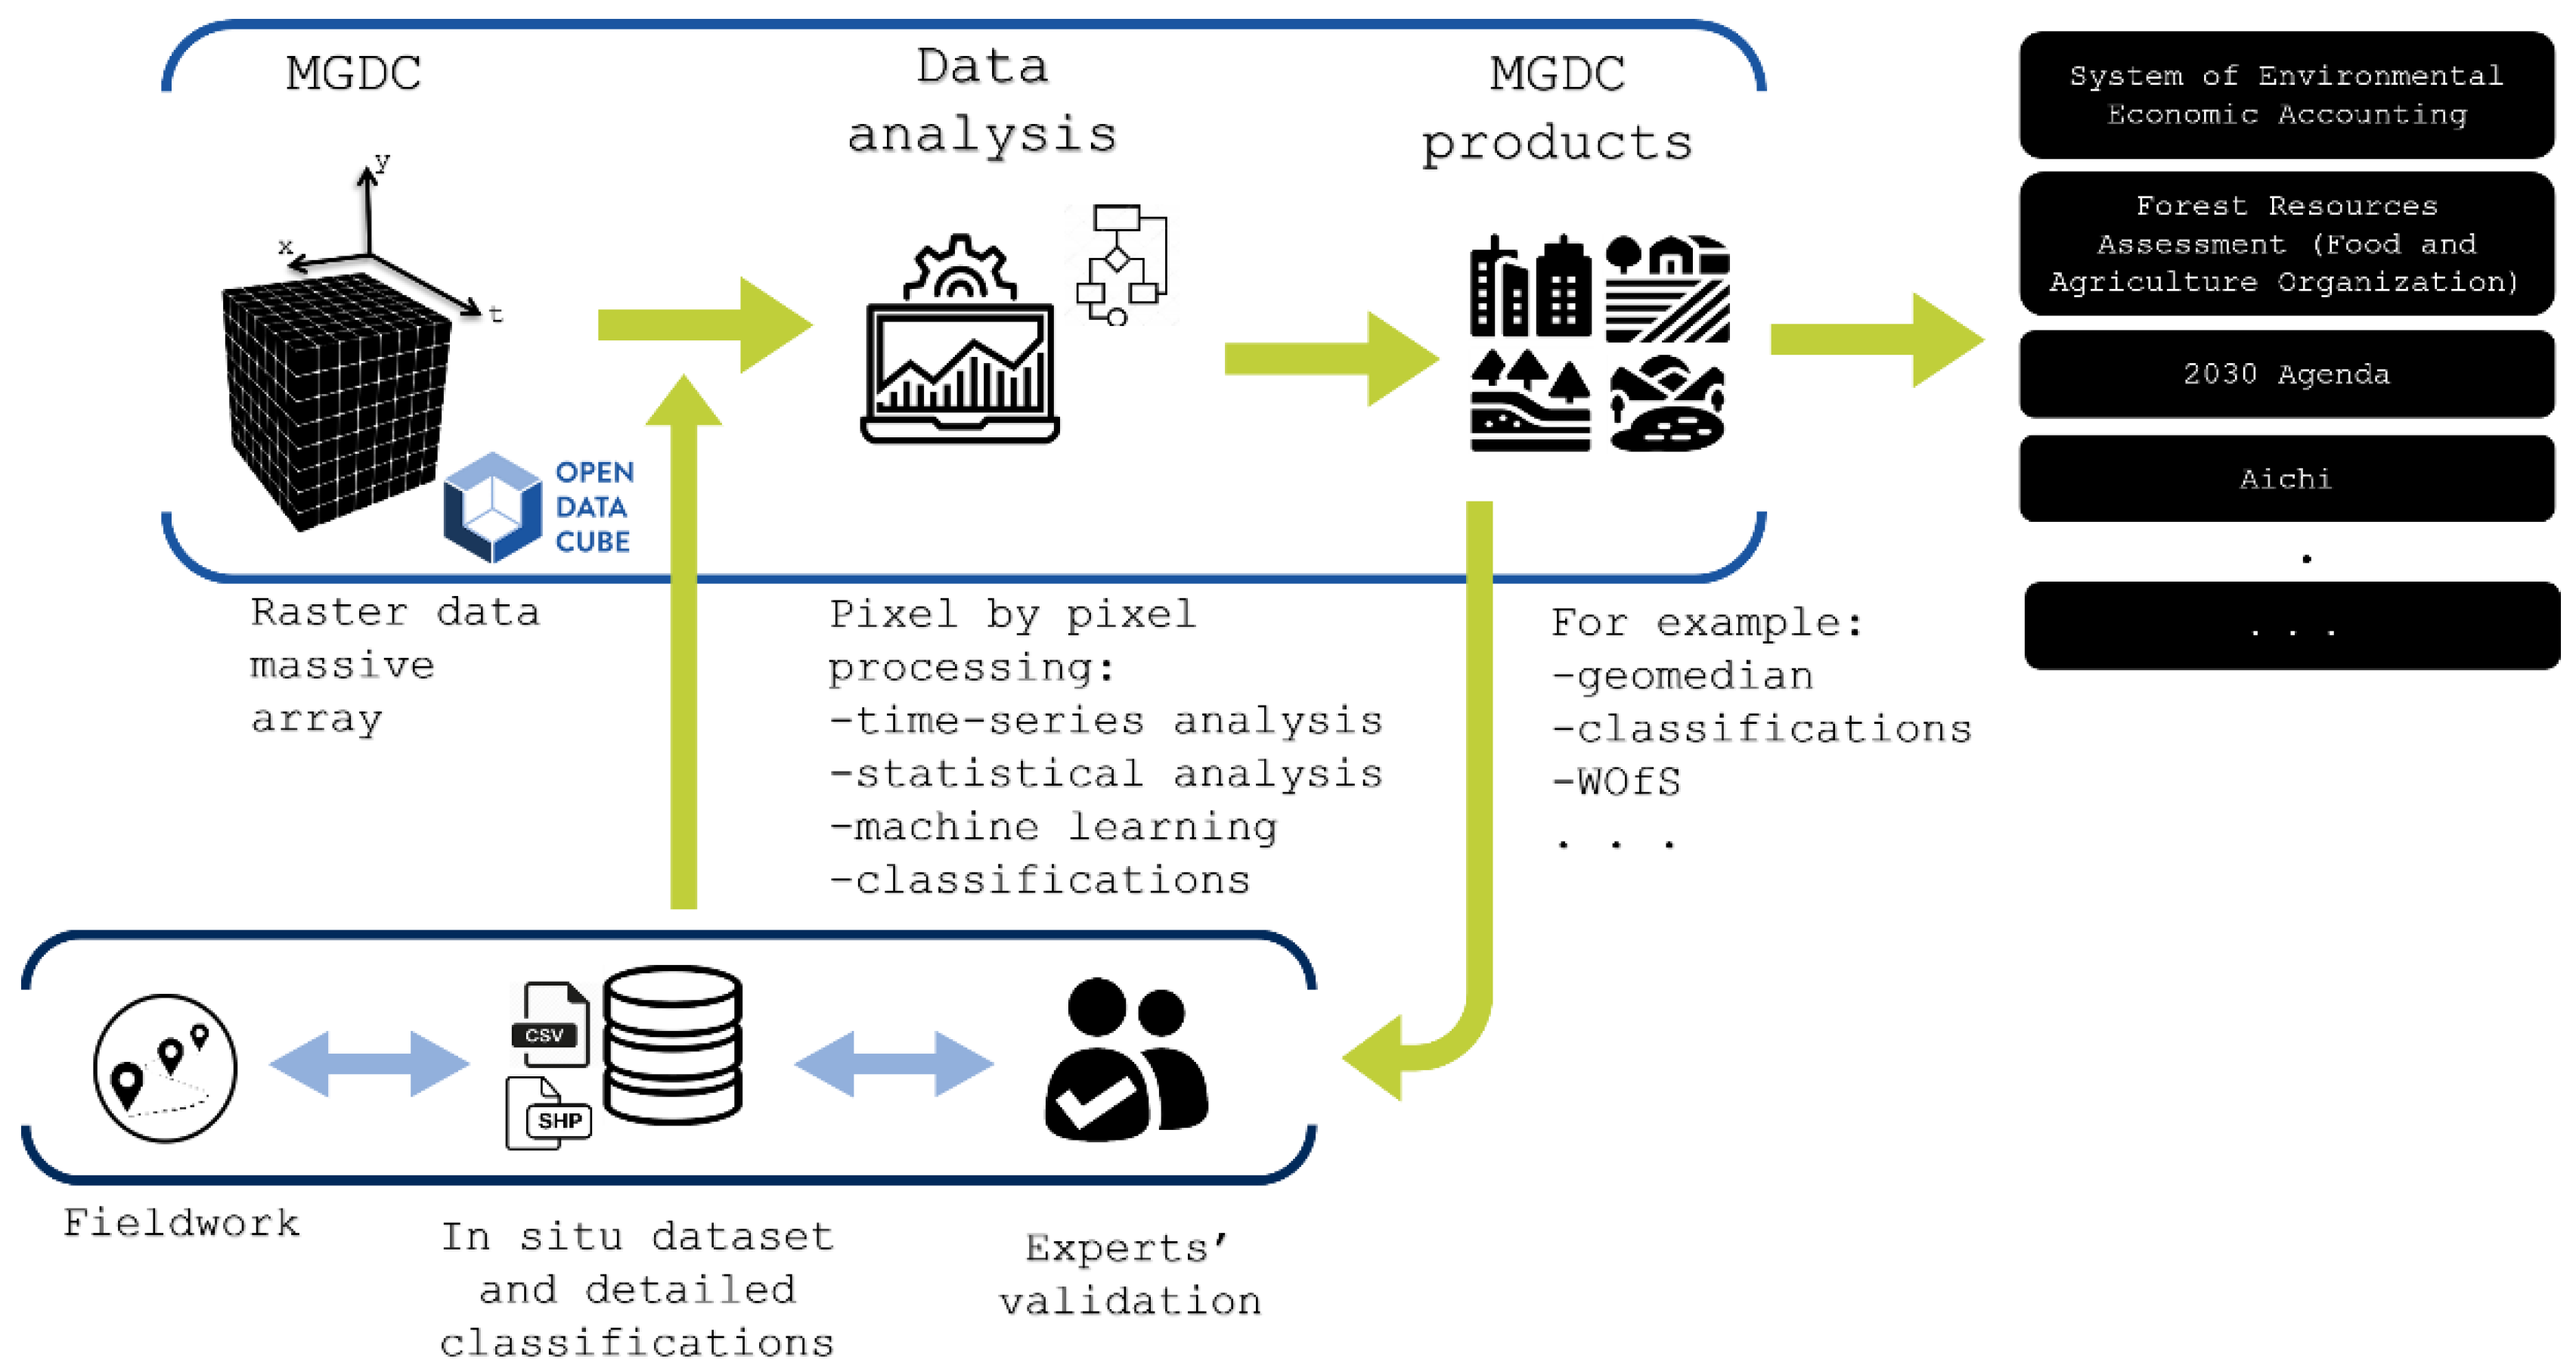
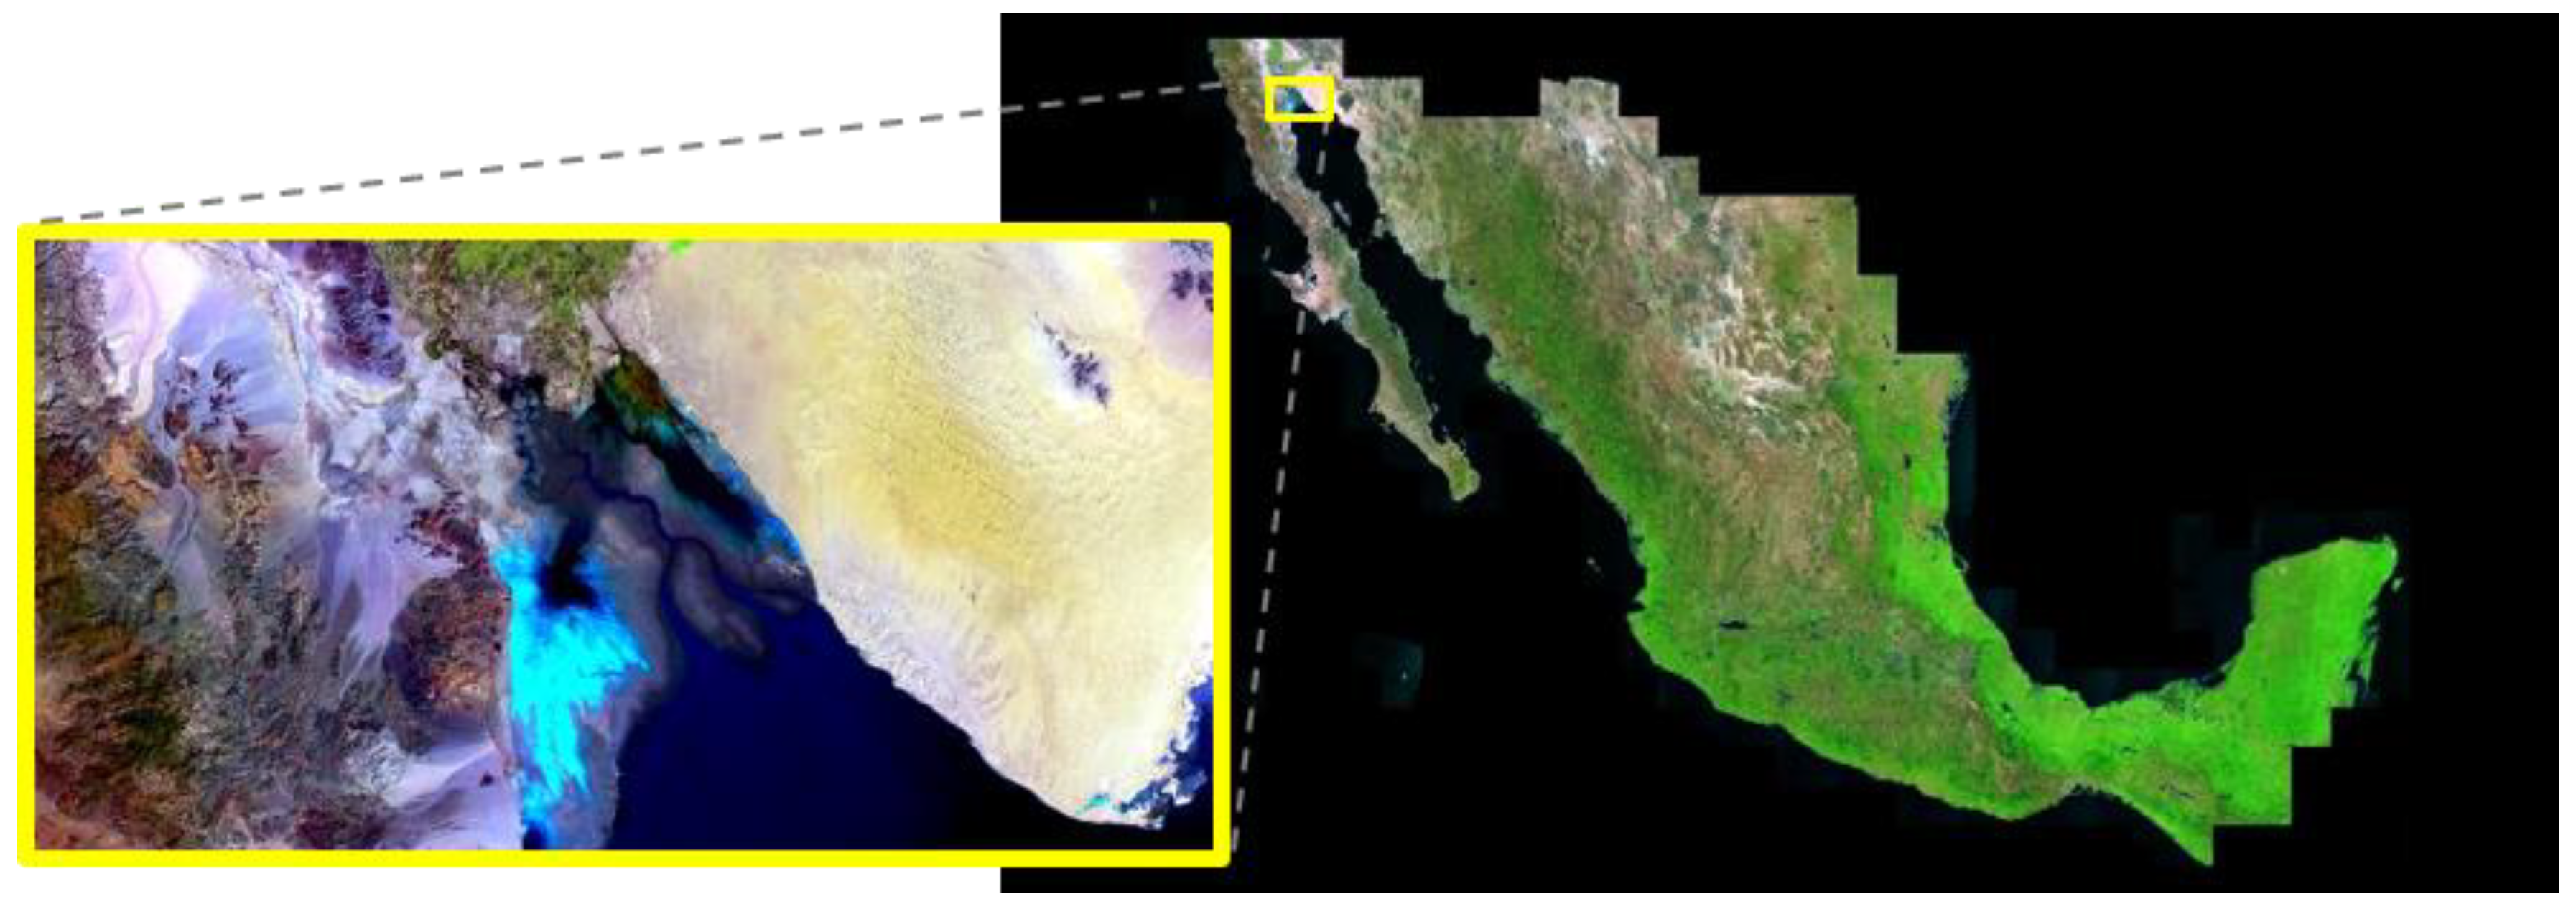
2.3.1. Overview of the Mexican Geospatial Data Cube

Through a collaboration with Geoscience Australia, the Mexican Geospatial Data Cube (MGDC) is being developed at the National Institute of Statistics and Geography of Mexico (INEGI). Initially, the MGDC will contain over 109,000 images of Landsat analysis-ready data provided by the USGS and NASA, including data since 1984. Figure 4 shows the number of images by year that are currently contained within the MGDC. This archive is already loaded into the institutional infrastructure of INEGI and is estimated to increase its volume from 30 TB to 90 TB when decompressed.
In order to facilitate future interoperability between sensors, INEGI has chosen to implement a defined grid onto which all data in the MGDC will be projected. The grid was defined using Albers Equal Area projection, with 150 × 150 km tiles and 30 m resolution (5000 × 5000 pixels); this design will allow future interoperation with 10 m resolution from the data provided by Sentinel-2. This 416 tile grid (144 of which cover the territory) also ensures covering Mexico’s exclusive economic zone (Figure 5).
As with the DE Australia infrastructure described in Section 2.1, the MGDC is designed to produce an ever expanding range of derived, decision-ready products (Figure 6). INEGI is currently testing a diverse set of products that range from common indexes such as the Normalized Difference Vegetation Index and Modified Normalized Difference Water Index, through to more complex classification tools such as the Water Observations from Space (WOFS) product described in [24]. More important, INEGI is working to ensure that the EO data is supplemented and integrated with a wide range of in-situ validation data to ensure that the derived MGDC products are robust and tangibly improving the design and monitoring of public policies and internationally agreed objectives, such as the 2030 Agenda for Sustainable Development [1] and the System of Environmental-Economic Accounting [2].
The ability to exploit the large amount of time series data contained within the MGDC is allowing the use of high-dimensional statistical methods [46] to generate robust composite images for all of Mexico (e.g., Figure 7). These annual, cloud-free summaries that were generated using the geometric median (or geomedian) algorithm, have already been used to provide insights into matters of national significance in Mexico like Natural Resources and Agriculture Statistics. A series of initial product validations by INEGI’s thematic specialists is being carried out, and it is planned that the MGDC system will be a transversal service platform in INEGI.

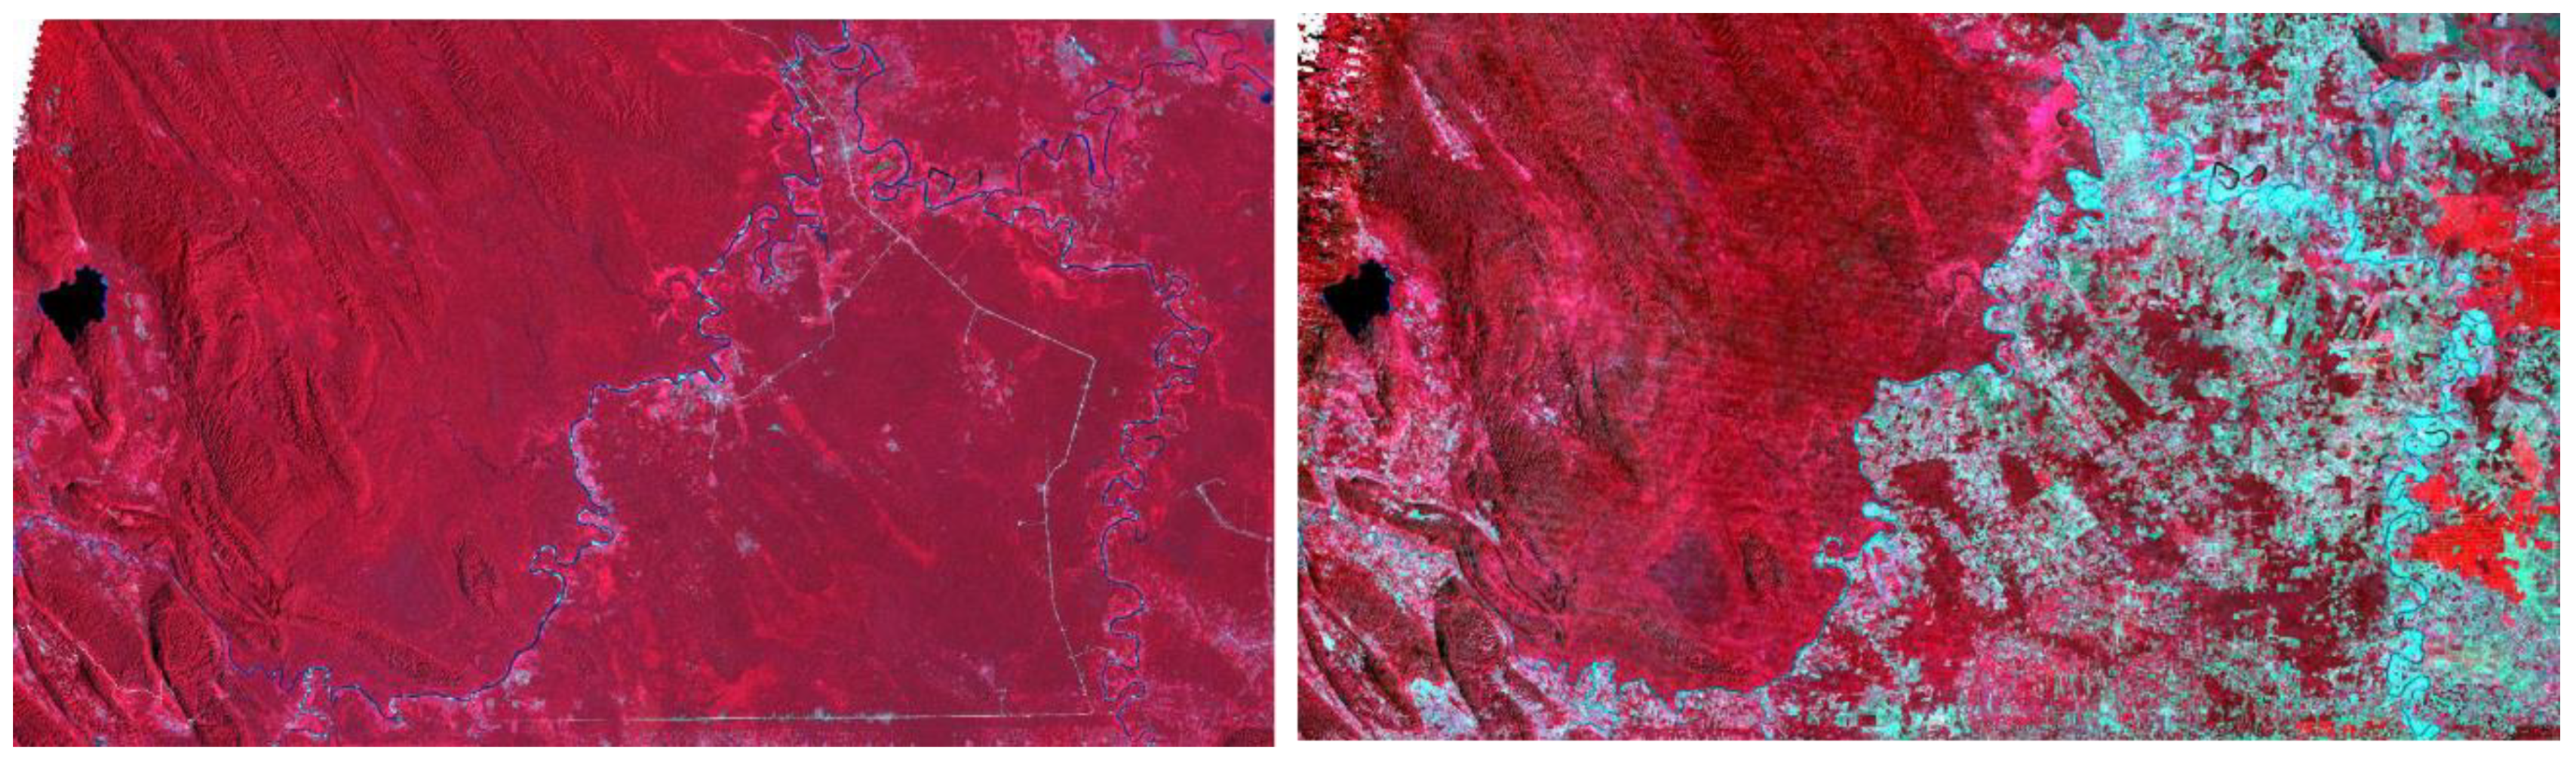
2.3.2. Using the MGDC for Natural Capital Accounting and Valuation of Ecosystem Services

One of the priority uses for the MGDC is to support the Natural Capital Accounting and Valuation of Ecosystem Services (NCAVES) project. This project was launched jointly by the European Union and implemented by the United Nations Statistics Division (UNSD), the United Nations Environment (UN Environment), and the Secretariat of the Convention on Biological Diversity. The objective of the project is to advance the knowledge agenda on environmental–economic accounting, ecosystem accounting, and by initiating pilot testing of the System of Environmental Economic Accounting (SEEA). The results will improve the measurement of ecosystems and their services (both in physical and monetary terms) at the subnational level and develop an internationally agreed methodology.
This project integrates information from the Economic Statistics and the Natural Resources- Environment Departments. As producer of geospatial information, INEGI generates the data for the extent (quantity) and condition (quality) of ecosystems. It is also in charge of the monetary valuation of ecosystem services, also based on the SEEA EEA methodology.
INEGI is currently evaluating the ability of the MGDC to overcome some of the constraints that the NCAVES project faces while routinely and efficiently using EO data. For example, in the initial phase of the project, geospatial data from different themes are used in a pilot study developed for Aguascalientes, a state in the centre of Mexico. This requires the mapping of features of interest such as rivers, other water bodies and elements of infrastructure, such as roads. These maps and geospatial data are currently derived from remote sensing imagery, i.e., satellite images from several sensors and platforms. However, this is based mainly on visual procedures that impose limits to the spatial details included and are time-consuming if we are to keep those details updated.
However, the MGDC’s ability to do rapid, national-scale analyses with the Landsat archive, combined with the ability to undertake time series analysis, offers the potential for new, scalable and, hopefully, automatable image analysis techniques to support these accounts. For example, vegetation evolution in time can be easily monitored. Figure 8 shows visual results of a MGDC test consisting of comparing two false-colour images from the areas of Montes Azules and Marqués de Comillas from 1986 and 2017; to the right of the Lacantún River, the deforestation (Marqués de Comillas) during these 3 decades is observed. This analysis better supports public policy implementation and monitoring, as this river observed in the area acts as the limit for the natural protected area of Montes Azules.
The image from 1986 is a single observation (Landsat 5), while the 2017 image is a pixel-level statistical summary (geomedian) from the 2017 time series, using Landsat 7 and 8 data. With pixel-level time-series analysis, there is also huge potential for the development and application of new machine learning techniques. Collectively, these advances have the potential to dramatically reduce the time it takes to identify the required features and to improve the accuracy and spatial scale at which they can be identified.
Based on the observed results, current testing of the MGDC is focused on two stages of the ecosystem accounting process (Figure 9). The MGDC is demonstrating potential to improve our ability to determine the ecosystems extent across all of Mexico and to provide insights into the condition of some of those ecosystems.
The MGDC has the potential to support the identification of ecosystems, which can be improved by classification algorithms applied to an already segmented image. Furthermore, the classification process can be improved by using new products such as the geomedian images discussed in Section 2.3.1 and shown in Figure 7. These images may be used to generate the input for the current classification processes in Land Use Land Cover maps.
Similarly, the MGDC has implemented the same water classification algorithm (WOfS) used in Australia to support the detection and analysis of water bodies as described in Section 2.1.2. INEGI is currently testing the accuracy of this product in the Mexican context. However, assuming it has similar levels of accuracy in Mexico as it does in Australia, it will provide a rich source of information on the extent of these critical ecosystems in Mexico.
At this stage, the time-series analysis enabled by the MGDC represents the main advantage of having a massive analysis-ready raster data array. In particular, addressing the ecosystem condition can be eased with certain algorithms for detecting change over time. For example, results of the ecosystem extension accounts for the state of Aguascalientes show continuous expansion of urban areas (particularly in private and communal lands) and no change in the extension of coniferous forest from 2007 to 2015.
Results from ecosystem services valuation studies will be useful to inform and strengthen key public policies such as land-use planning, land-use changes, and nature conservation measures. Over time, it is expected that, with the MGDC, data access and use will become easier and faster, enhancing the timeliness of valuation procedures. The MGDC will improve the implementation of policy instruments such as payment for ecosystem service schemes, environmental responsibility and liability and environmental impact assessment.

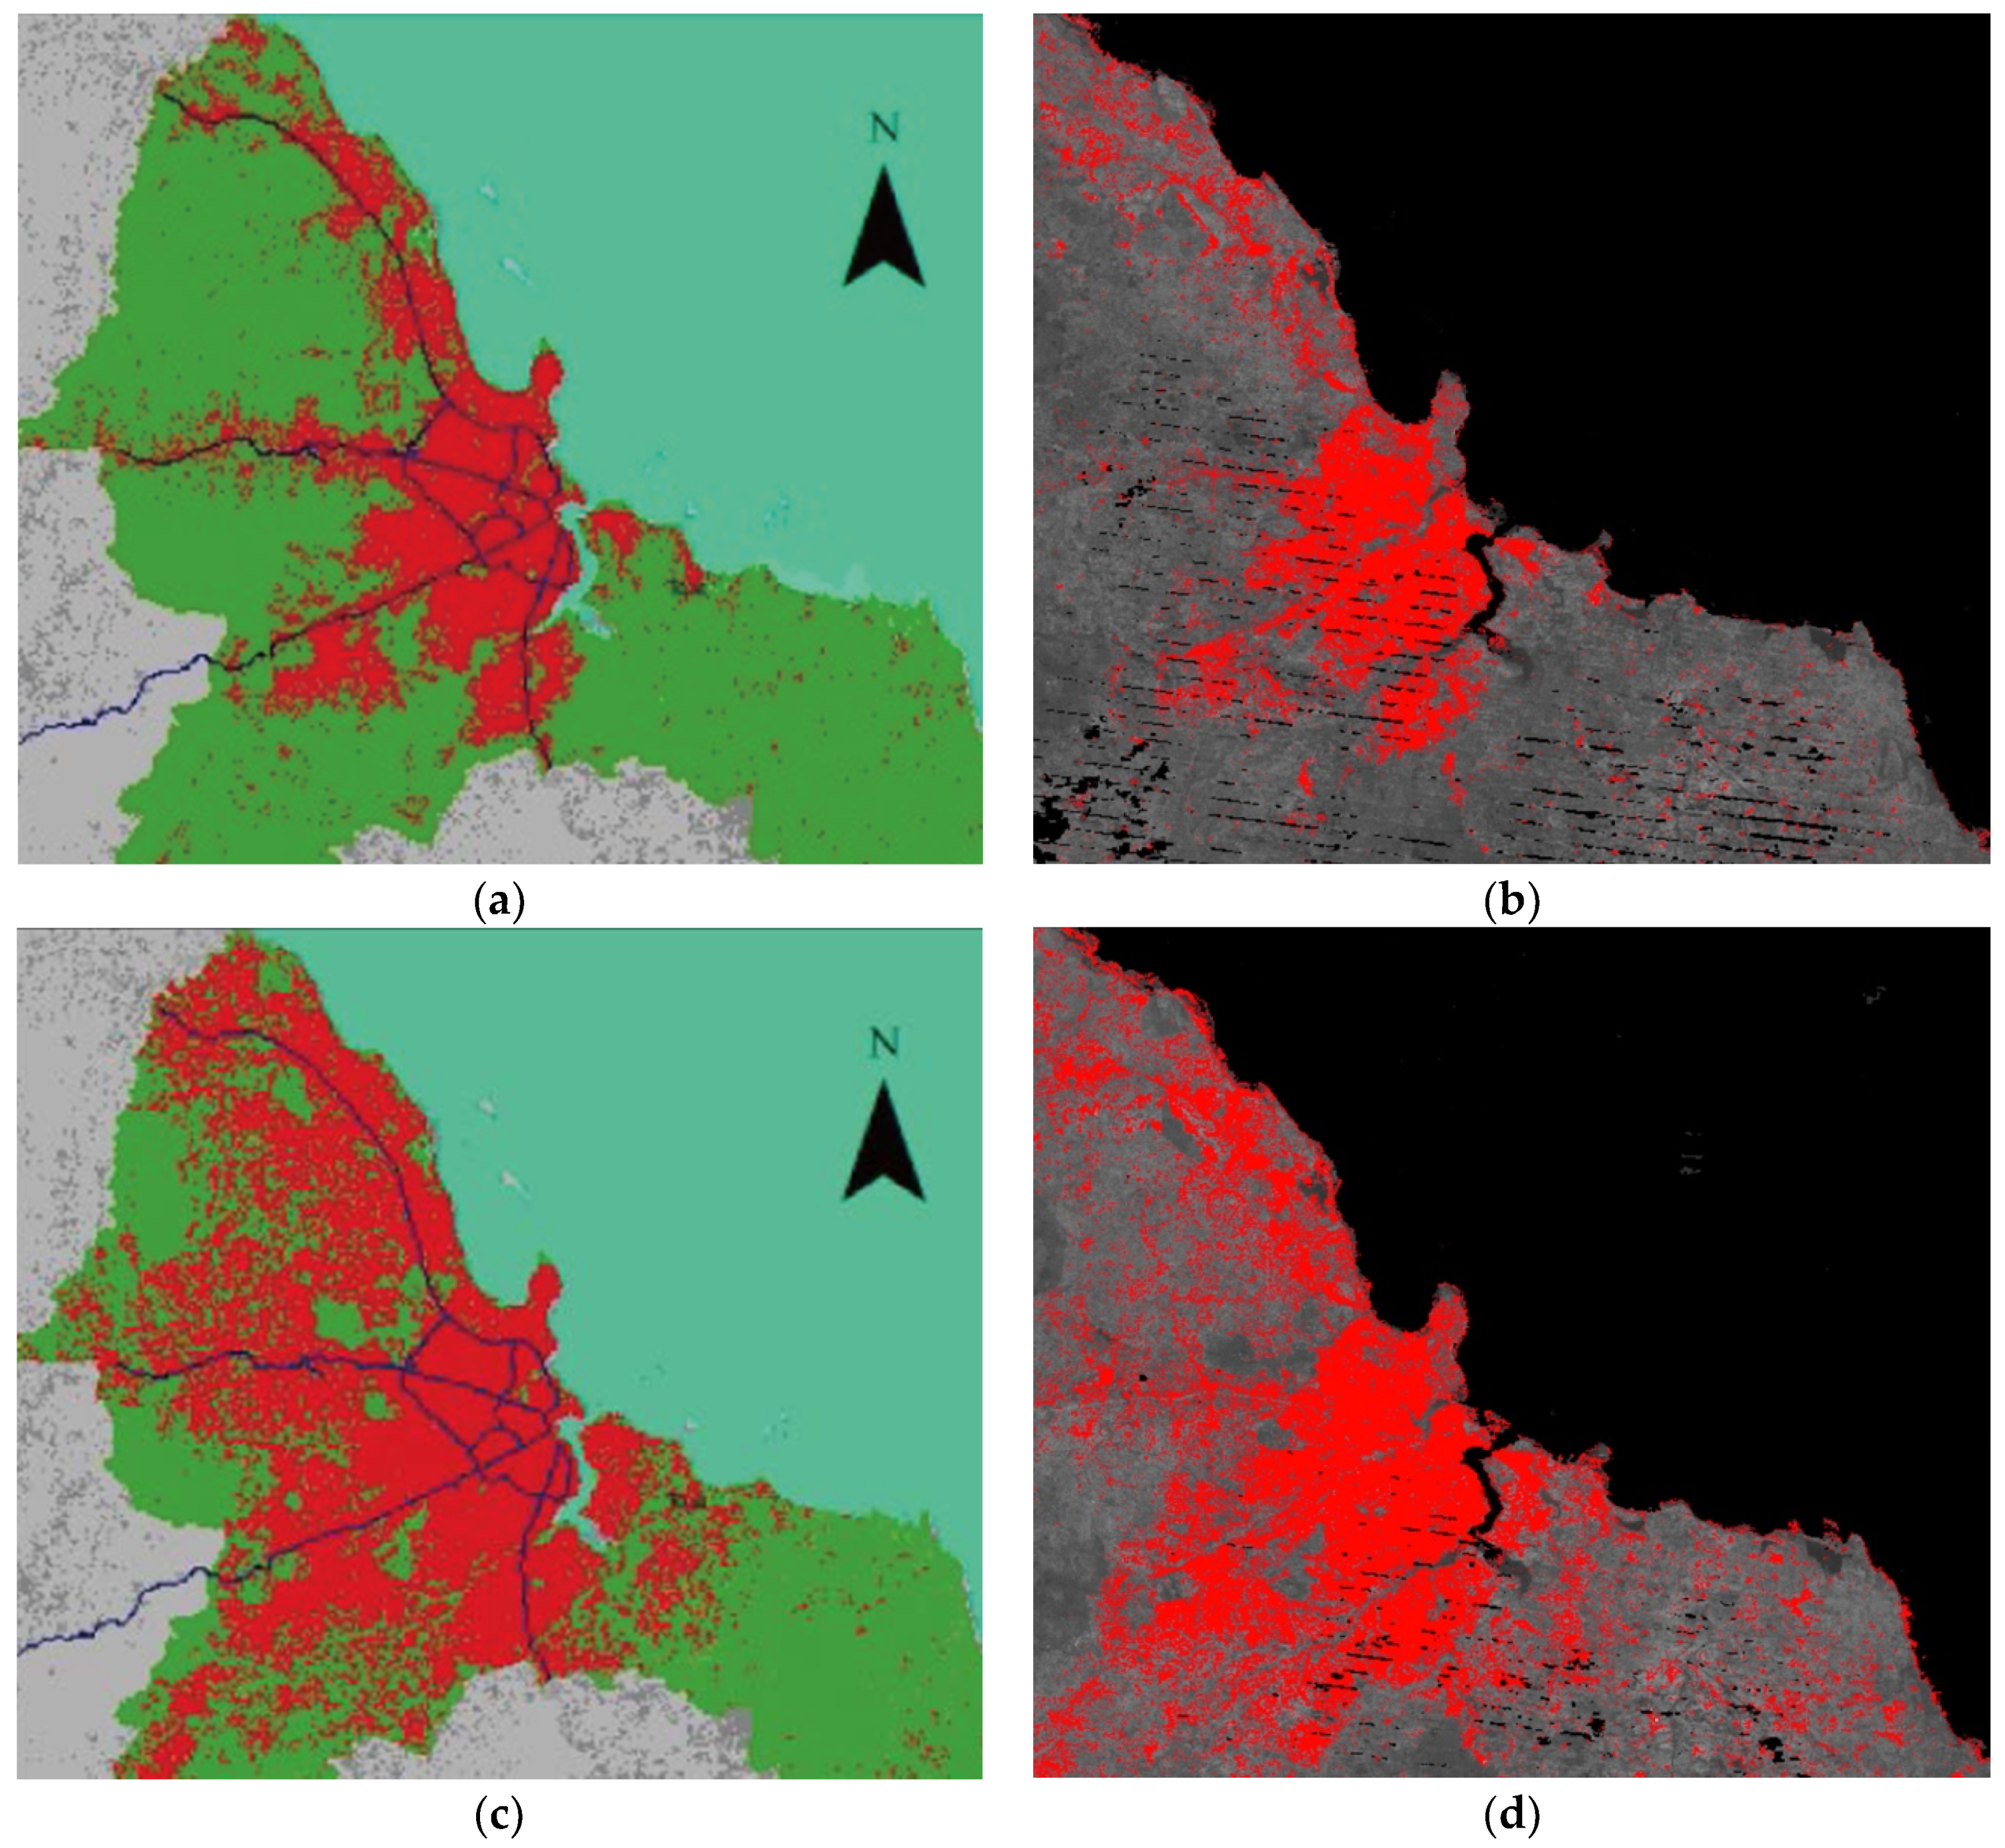
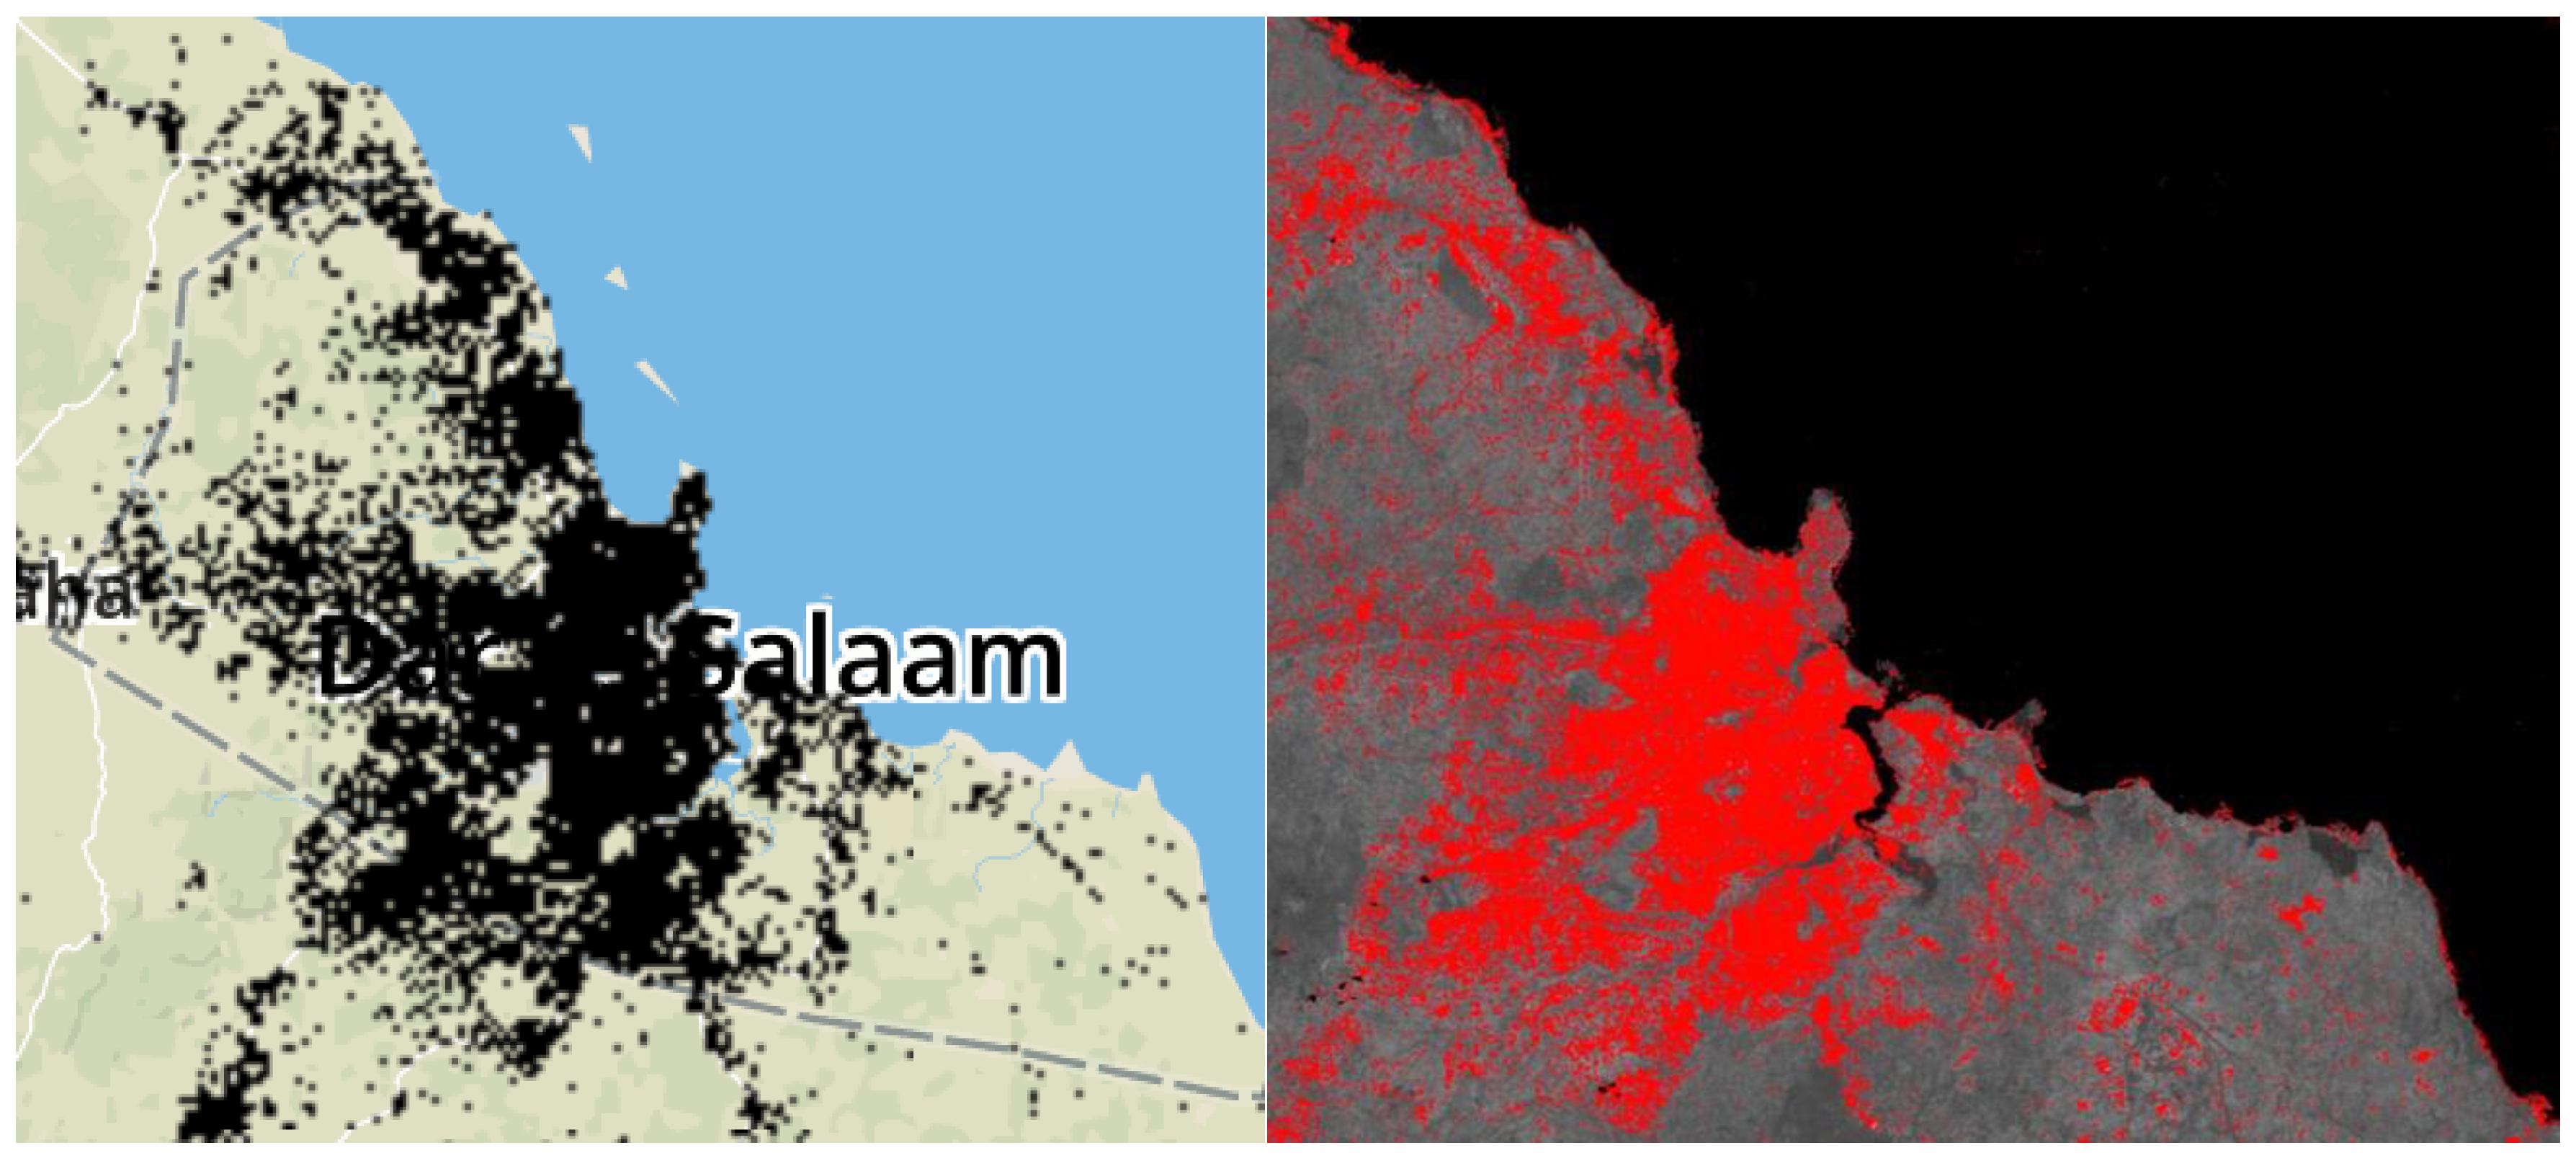
2.4. Using the African Regional Data Cube to Manage Urbanization in Tanzania

2.4.1. Overview of the African Regional Data Cube

The Africa Regional Data Cube (ARDC) was launched in May 2018 by the Global Partnership for Sustainable Development Data (GPSDD), the Committee on Earth Observation Satellite (CEOS), and Amazon, to support five countries: Kenya, Senegal, Sierra Leone, Ghana, and Tanzania. The ARDC is focused on building the capacity of users in this region to apply EO satellite data to address local and national needs, as well as the objectives of the Group on Earth Observations (GEO) and the 2030 Agenda for Sustainable Development [1]. The ARDC will support a number of key users, including government ministries, national statistical agencies, geographic institutes, and research scientists.
The satellite data in the ARDC (approximately 11 TB volume) is considered analysis-ready data in that it is processed to a minimum set of requirements and organized into a form that allows immediate analysis through time and is interoperable with other datasets. To date, the ARDC only includes Landsat analysis-ready data since the year 2000, but the ARDC is working to add Copernicus data from the Sentinel-1 and Sentinel-2 missions. These pre-processed analysis-ready datasets were compiled in time series stacks to allow valuable assessments of changing land and water resources, a task that would be very time consuming and quite difficult using traditional, scene-based analysis methods.

2.4.2. Urbanization in Tanzania

Many governments, such as Tanzania, are interested in tracking urbanization to understand the changes in land resources and corresponding population growth rates. These government agencies include national statistical offices, urban planning managers, and the ministries of agriculture and environment. It is known that increases in urbanization have an impact on the environment and the health of a population. With urbanization products from the ARDC, government decision-makers can measure the extent and location of urban growth to help planning of water and land use. In addition, these data and information products can be used to directly address Sustainable Development Goal (SDG) 11.3.1 (ratio of land consumption rate to population growth rate).
An urbanization analysis was conducted over the city of Dar es Salaam, Tanzania using the ARDC. The results of this study were compared to a report from [47] and the European Space Agency (ESA) Urban Thematic Exploration Platform [48].The analysis used a fractional cover [49] threshold approach (bare soil fraction > 25%) to identify urban regions. This threshold range was selected using visual interpretation with an attempt to match the results of [47] (Figure 10) and [48] (Figure 11). Though this is not a complex scientific method, it is a good first-order approximation for urban extent and can be used to assess long-term urban change. As suggested in [47], a random forest classification approach should be used to obtain more accurate results in order to validate the measured urban extent.
According to [47], the urban growth was 100% (or 8% per year) from 2007 to 2016. The analysis results from the ARDC showed an urban growth of 123% (or 9% per year). This urban growth rate can be compared with the population growth rate (~5% according to several online sources) for the same time period. Using the equation from the SDG 11.3.1 guidelines, the ratio of land consumption rate (urban growth) to population growth rate is 1.8. This suggests that the population is rapidly moving out of the city and expanding its urban footprint at a rate significantly faster than the population is growing. Though these ARDC results are promising, a more accurate supervised land classification analysis is needed in the future to validate the results with ground-based data and to remove false-positive urban areas.

3. Conclusions

Satellite missions will continue to provide increasingly larger volumes of free and open analysis-ready data for global users. With recent advances in the global provision of analysis-ready data and proven and innovative open source data technology solutions such as the Open Data Cube (ODC), global users now have the unprecedented ability to routinely utilize satellite data for national policy and decision-making needs.
The examples shown in this paper have demonstrated that governments have the need and desire to use satellite data to tangibly improve their management of natural resources and policies that support sustainable development. One of the reasons that ODC has been successful at enabling this is that it is an open source and scalable architecture; it allows countries to establish and operate their own sovereign analysis capability. Countries are able to control the quality and timeliness of their analyses and rely upon their own operational capability to underpin regulatory and official reporting processes.
However, great effort is needed for deploying an operational ODC at a national level. The vast amounts of data that need to be integrated and managed means that operational deployments need to have access to a wide range of system engineering skills and high-performance computational infrastructure. Consequently, there is an emerging trend to move from sovereign ODC deployments to larger scale regional centres that support sovereign ODCs. For example, by the end of 2019, the ARDC will merge into a larger regional cube including data from an ever growing range of satellites, including Landsat and Sentinel-2, which will cover the entire continent of Africa. This initiative is called Digital Earth Africa and serves as an example of a vision to create many regional data cubes using the ODC infrastructure.
Regional-scale data cubes are more manageable in terms governance and institutional arrangements, whereas a full global data cube would be impractical to implement and manage effectively. In addition, these regional cubes allow users to address transboundary topics that otherwise would not be possible with individual country-level data cubes. In this matter, standardization is key; it is essential that data and processes are consistent and measurements regard similar criteria. In the future, a set of regional data cubes could share technical approaches and application algorithms, while maintaining local management of data and products relevant to regional decision-making needs.
With a vision toward a global set of regional data cubes, it will be possible to take advantage of consistent time series satellite data and different, yet interoperable, datasets. Such data cubes and their corresponding open source application algorithms can be enhanced and shared across the world to address national and transboundary issues while maintaining data sovereignty and political separation through a regional implementation. In addition, to realise the full potential of the ODC products to address local and regional decision-making and policies, it is important to increase research and gather in-situ ground data for proper algorithm and product validation. Over time, it is expected that open data products will increase, their accuracy will improve, and data access and use will become easier and faster for everyone.

Author Contributions

Conceptualization, all authors.; methodology, T.D., J.J., P.M., B.K., G.G., and A.K.; writing—original draft preparation, T.D., J.J., P.M., B.K., G.G., and A.K.; writing—review and editing, All Authors.

Funding

This research received no external funding.

Acknowledgments

Results of this publication partly or fully rely on the Swiss Data Cube (http://www.swissdatacube.org), operated and maintained by UN Environment/GRID-Geneva, the University of Geneva, the University of Zurich and the Swiss Federal Institute for Forest, Snow and Landscape Research WSL. This paper is published with the permission of the CEO, Geoscience Australia.

Conflicts of Interest

The authors declare no conflict of interest.

References

  1. United Nations. Transforming Our World: The 2030 Agenda for Sustainable Development. Available online: https://www.un.org/ga/search/view_doc.asp?symbol=A/RES/70/1&Lang=E (accessed on 15 June 2019).
  2. United Nations. System of Environmental-Economic Accounting. Available online: https://seea.un.org/ (accessed on 15 June 2019).
  3. United Nations Office for Disaster Risk Reduction. Sendai Framework for Disaster Risk Reduction 2015–2030. Available online: https://www.unisdr.org/files/43291_sendaiframeworkfordrren.pdf (accessed on 15 June 2019).
  4. United Nations. Paris Agreement. Available online: https://unfccc.int/sites/default/files/english_paris_agreement.pdf (accessed on 15 June 2019).
  5. Committee on Earth Observation Satellites. Satellite Earth Observations in Support of the Sustainable Development Goals. Available online: http://eohandbook.com/sdg/files/CEOS_EOHB_2018_SDG.pdf (accessed on 15 June 2019).
  6. Committee on Earth Observation Satellites. CEOS Analysis Ready Data. Available online: http://ceos.org/ard/ (accessed on 15 June 2019).
  7. Committee on Earth Observation Satellites. Product Family Specification, Optical Surface Reflectance (CARD4L-OSR). Available online: http://ceos.org/ard/files/CARD4L_Product_Specification_Surface_Reflectance_v4.0.pdf (accessed on 15 June 2019).
  8. Committee on Earth Observation Satellites. Product Family Specification, Land Surface Temperature. Available online: http://ceos.org/ard/files/CARD4L_Product_Specification_Land_Surface_Temperature_v4.0.pdf (accessed on 15 June 2019).
  9. Committee on Earth Observation Satellites. Product Family Specification, Normalised Radar Backscatter. Available online: http://ceos.org/ard/files/CARD4L_Product_Specification_Backscatter_v4.0.pdf (accessed on 15 June 2019).
  10. United Nations Statistical Division. Earth Observations for Official Statistics Satellite Imagery and Geospatial Data Task Team Report. Available online: https://unstats.un.org/bigdata/taskteams/satellite/UNGWG_Satellite_Task_Team_Report_WhiteCover.pdf (accessed on 15 June 2019).
  11. Gorelick, N.; Hancher, M.; Dixon, M.; Ilyushchenko, S.; Thau, D.; Moore, R. Google Earth Engine: Planetary-scale geospatial analysis for everyone. Remote Sens. Environ. 2017, 202, 18–27. [Google Scholar] [CrossRef]
  12. Copernicus. DIAS. Available online: https://www.copernicus.eu/en/access-data/dias (accessed on 15 June 2019).
  13. Open Data Cube. Available online: https://www.opendatacube.org (accessed on 15 June 2019).
  14. Killough, B. Overview of the Open Data Cube Initiative. In Proceedings of the IGARSS 2018 - 2018 IEEE International Geoscience and Remote Sensing Symposium, Valencia, Spain, 22–27 July 2018; pp. 8629–8632. [Google Scholar]
  15. Lewis, A.; Oliver, S.; Lymburner, L.; Evans, B.; Wyborn, L.; Mueller, N.; Raevksi, G.; Hooke, J.; Woodcock, R.; Sixsmith, J.; et al. The Australian Geoscience Data Cube—Foundations and lessons learned. Remote Sens. Environ. 2017, 202, 276–292. [Google Scholar] [CrossRef]
  16. Dhu, T.; Dunn, B.; Lewis, B.; Lymburner, L.; Mueller, N.; Telfer, E.; Lewis, A.; McIntyre, A.; Minchin, S.; Phillips, C. Digital earth Australia—unlocking new value from earth observation data. Big Earth Data 2017, 1, 64–74. [Google Scholar] [CrossRef]
  17. Li, F.; Jupp, D.L.B.; Reddy, S.; Lymburner, L.; Mueller, N.; Tan, P.; Islam, A. An Evaluation of the Use of Atmospheric and BRDF Correction to Standardize Landsat Data. IEEE J. Sel. Top. Appl. Earth Obs. Remote Sens. 2010, 3, 257–270. [Google Scholar] [CrossRef]
  18. Li, F.; Jupp, D.L.B.; Thankappan, M.; Lymburner, L.; Mueller, N.; Lewis, A.; Held, A. A physics-based atmospheric and BRDF correction for Landsat data over mountainous terrain. Remote Sens. Environ. 2012, 124, 756–770. [Google Scholar] [CrossRef]
  19. Frontier SI. Digital Earth Australia Industry Strategy. Available online: https://frontiersi.com.au/wp-content/uploads/2019/04/FrontierSI_Digital_Earth_Industry_Strategy_March_2019-v2.pdf (accessed on 20 October 2019).
  20. Frontier SI. Community Focus Key to APSEA Award Success. Available online: https://frontiersi.com.au/community-focus-key-to-apsea-award-success/ (accessed on 20 October 2019).
  21. Salleh, A. How Satellites and Machine Learning Algorithms Are Helping Farmers to Be More Sustainable. Available online: https://www.abc.net.au/news/science/2019-09-27/machine-learning-and-satellites-help-farms-sustainability/11500214 (accessed on 20 October 2019).
  22. Murray-Darling Basin Authority. Murray-Darling Basin Authority Annual Report 2017–2018. Available online: https://www.mdba.gov.au/sites/default/files/pubs/MDBA-Annual-Report-2017-18.pdf (accessed on 15 June 2019).
  23. Murray-Darling Basin Authority. A Plan for the Murray-Darling Basin. Available online: https://www.mdba.gov.au/basin-plan/plan-murray-darling-basin (accessed on 15 June 2019).
  24. Mueller, N.; Lewis, A.; Roberts, D.; Ring, S.; Melrose, R.; Sixsmith, J.; Lymburner, L.; McIntyre, A.; Tan, P.; Curnow, S.; et al. Water observations from space: Mapping surface water from 25years of Landsat imagery across Australia. Remote Sens. Environ. 2016, 174, 341–352. [Google Scholar] [CrossRef]
  25. New South Wales Department of Primary Industries. NSW State Seasonal Update—May 2019. Available online: https://www.dpi.nsw.gov.au/climate-and-emergencies/droughthub/information-and-resources/seasonal-conditions/ssu/may-2019 (accessed on 15 June 2019).
  26. Murray-Darling Basin Authority. A Case Study for Compliance Monitoring Using Satellite Imagery. Available online: https://www.mdba.gov.au/sites/default/files/pubs/Compliance-monitoring-using-remote-sensing.pdf (accessed on 15 June 2019).
  27. Murray-Darling Basin Authority. Satellites helping to guard against water theft. Available online: https://www.mdba.gov.au/media/mr/satellites-helping-guard-against-basin-water-theft (accessed on 15 June 2019).
  28. Murray-Darling Basin Authority. Monitoring ‘First Flush’ Flows in the Namoi, Macquarie and Warrego Rivers—Remote Sensing for Compliance and Ecohydrology; Murray-Darling Basin Authority: Canberra, Australia, 2019.
  29. Swiss Data Cube (SDC) - EO for monitoring the environment of Switzerland in space and time. Available online: https://www.swissdatacube.org (accessed on 15 June 2019).
  30. Giuliani, G.; Chatenoux, B.; De Bono, A.; Rodila, D.; Richard, J.-P.; Allenbach, K.; Dao, H.; Peduzzi, P. Building an Earth Observations Data Cube: Lessons learned from the Swiss Data Cube (SDC) on generating Analysis Ready Data (ARD). Big Earth Data 2017, 1, 100–117. [Google Scholar] [CrossRef]
  31. Rizvi, S.R.; Killough, B.; Cherry, A.; Gowda, S. The Ceos Data Cube Portal: A User-Friendly, Open Source Software Solution for the Distribution, Exploration, Analysis, and Visualization of Analysis Ready Data. In Proceedings of the IGARSS 2018–2018 IEEE International Geoscience and Remote Sensing Symposium, Valencia, Spain, 22–27 July 2018; pp. 8639–8642. [Google Scholar]
  32. Giuliani, G.; Chatenoux, B.; Honeck, E.; Richard, J. Towards Sentinel-2 Analysis Ready Data: A Swiss Data Cube Perspective. In Proceedings of the IGARSS 2018–2018 IEEE International Geoscience and Remote Sensing Symposium, Valencia, Spain, 22–27 July 2018; pp. 8659–8662. [Google Scholar]
  33. Giuliani, G.; Dao, H.; De Bono, A.; Chatenoux, B.; Allenbach, K.; De Laborie, P.; Rodila, D.; Alexandris, N.; Peduzzi, P. Live Monitoring of Earth Surface (LiMES): A framework for monitoring environmental changes from Earth Observations. Remote Sens. Environ. 2017, 202, 222–233. [Google Scholar] [CrossRef]
  34. Beniston, M.; Farinotti, D.; Stoffel, M.; Andreassen, L.M.; Coppola, E.; Eckert, N.; Fantini, A.; Giacona, F.; Hauck, C.; Huss, M.; et al. The European mountain cryosphere: A review of its current state, trends, and future challenges. Cryosphere 2018, 12, 759–794. [Google Scholar] [CrossRef]
  35. Beniston, M.; Stoffel, M. Assessing the impacts of climatic change on mountain water resources. Sci. Total Environ. 2014, 493, 1129–1137. [Google Scholar] [CrossRef] [PubMed]
  36. Changement climatique et hydrologie. Available online: https://sciencesnaturelles.ch/topics/water/climate_change_and_hydrology (accessed on 1 April 2019).
  37. Beniston, M.; Uhlmann, B.; Goyette, S.; Lopez-Moreno, J.I. Will snow-abundant winters still exist in the Swiss Alps in an enhanced greenhouse climate? Int. J. Climatol. 2011, 31, 1257–1263. [Google Scholar] [CrossRef]
  38. Lehmann, A.; Guigoz, Y.; Ray, N.; Mancosu, E.; Abbaspour, K.C.; Rouholahnejad Freund, E.; Allenbach, K.; De Bono, A.; Fasel, M.; Gago-Silva, A.; et al. A web platform for landuse, climate, demography, hydrology and beach erosion in the Black Sea catchment. Sci. Data 2017, 4, 170087. [Google Scholar] [CrossRef] [PubMed] [Green Version]
  39. Small, D. Flattening Gamma: Radiometric Terrain Correction for SAR Imagery. IEEE Trans. Geosci. Remote Sens. 2011, 49, 3081–3093. [Google Scholar] [CrossRef]
  40. Small, D.; Miranda, N.; Ewen, T.; Jonas, T. Reliably flattened radar backscatter for wet snow mapping from wide-swath sensors. In Proceedings of the ESA Living Planet Symposium, Edinburgh, Scotland, 9–13 September 2013. [Google Scholar]
  41. Frau, L.; Rizvi, S.R.; Chatenoux, B.; Poussin, C.; Richard, J.; Giuliani, G. Snow Observations from Space: An Approach to Map Snow Cover from Three Decades of Landsat Imagery Across Switzerland. In Proceedings of the IGARSS 2018–2018 IEEE International Geoscience and Remote Sensing Symposium, Valencia, Spain, 22–27 July 2018; pp. 8663–8666. [Google Scholar]
  42. Swiss Data Cube Viewer. Available online: http://www.swissdatacube.org/viewer (accessed on 15 June 2019).
  43. Guigoz, Y.; Palazzi, E.; Terzago, S.; Chatenoux, B.; Poussin, C.; Giuliani, G. Snow cover evolution in Gran Paradiso and Vanoise protected areas using Earth Observation Data Cube. Data 2019, 4, 138. [Google Scholar]
  44. Asmaryan, S.; Asastryan, H.; Guigoz, Y.; Giuliani, G. Paving the way towards an Aremnian Data Cube. Data 2019, 4, 117. [Google Scholar] [CrossRef]
  45. Land Use in Switzerland–Results of the Swiss Land Use Statistics; Swiss Federal Statistical Office (FSO): Neuchâtel, Switzerland, 2013.
  46. Roberts, D.; Mueller, N.; Mcintyre, A. High-Dimensional Pixel Composites From Earth Observation Time Series. IEEE Trans. Geosci. Remote Sens. 2017, 55, 6254–6264. [Google Scholar] [CrossRef]
  47. Gombe, K.E.; Asanuma, I.; Park, J.-G. Quantification of Annual Urban Growth of Dar es Salaam Tanzania from Landsat Time Series Data. Adv. Remote Sens. 2017, 6, 175–191. [Google Scholar] [CrossRef] [Green Version]
  48. Thematic Exploration Product, Urban Footprint. Available online: https://urban-tep.eu (accessed on 1 May 2019).
  49. Guerschman, J.P.; Scarth, P.F.; McVicar, T.R.; Renzullo, L.J.; Malthus, T.J.; Stewart, J.B.; Rickards, J.E.; Trevithick, R. Assessing the effects of site heterogeneity and soil properties when unmixing photosynthetic vegetation, non-photosynthetic vegetation and bare soil fractions from Landsat and MODIS data. Remote Sens. Environ. 2015, 161, 12–26. [Google Scholar] [CrossRef]
Figure 1. Idealized example demonstrating how DE Australia describes the relative ‘fullness’ of a farm dam. (a) In this panel the dam (identified by the red square) is 100% full as there is water across the entire spatial extent of the dam; (b) Here the dam is classified as 40% full as the water covers 40% of the spatial extent of the dam; (c). Here the dam is classified as being 5% full as the water only covers 5% of the spatial extent of the dam; (d) A time history of the ‘fullness’ of the dam with the fullness of the dam from panels a, b and c plotted.
Data 04 00144 g001
Figure 2. Farm Dam Water Status for New South Wales showing how full farm dams are across New South Wales for the period of 19 April–19 May, 2019 [25].
Data 04 00144 g002
Figure 3. Snow cover change between periods 1995–2005 and 2005–2017 visualized in the Swiss Data Cube Viewer [42]. Red areas show a decline in snow cover over the two decades while green areas show an increase.
Data 04 00144 g003
Figure 4. Overview of the number of images contained within the MGDC broken down by year and Landsat mission.
Data 04 00144 g004
Figure 5. Overview of the standardized grid that is used for the MGDC (each tile represents a 150 × 150 km region).
Data 04 00144 g005
Figure 6. Notional workflow demonstrating how the MGDC intends to combine in-situ data with EO data to produce products that can drive better decision making and drive progress against a range of national and international policy priorities.
Data 04 00144 g006
Figure 7. Example of an annual cloud free image for Mexico, using the available Landsat data from 2015 (January to December) in the MGDC. The image was produced using some 6074 Landsat images in MGDC and the high-dimensional statistic methods of [46]. The inset shows the Colorado River Delta region.
Data 04 00144 g007
Figure 8. MGDC images from the areas of Montes Azules and Marqués de Comillas from 1986 (left) and 2017 (right). Rendering (RGB): Red (near infrared band), Green (red band), Blue (green band).
Data 04 00144 g008
Figure 9. Notional workflow demonstrating the sequence of accounts and the components where the MGDC has the most potential to offer improvements.
Data 04 00144 g009
Figure 10. Urbanization results are compared for two time periods, 2007 (a,b) and 2016 (c,d), and two analysis methods, [47] (a,c) and ARDC (b,d), over Dar es Salaam, Tanzania. Though these results are quite similar, the ARDC results show more urban pixels that are likely associated with non-urban rural areas that lack vegetation and are classified as urban using the threshold approach. In addition, there are some common Landsat-7 "banding" issues visible on the background greyscale image and in the urban results. These artifacts could be removed with further compositing and post-processing.
Data 04 00144 g010
Figure 11. Urbanization results are compared for 2015 from [44] (left) and the ARDC (right) to gain confidence that the urban footprint results were reasonably accurate. The [44] results (left) are based on proprietary X-band radar and the ARDC results (right) are based on Landsat-8 optical data. Overall, the primary urbanization results are quite similar and suggest the fractional cover threshold approach yields sufficiently accurate results to apply to other years in the time series.
Data 04 00144 g011

