Refinement of Temperature Sensing Yarns †


1
Advanced Textiles Research Group, School of Art & Design, Nottingham Trent University, Bonington Building, Dryden Street, Nottingham NG1 4GG, UK
2
School of Science and Technology, Nottingham Trent University, Clifton Lane, Nottingham NG11 8NS, UK
*
Author to whom correspondence should be addressed.
†
Presented at the 4th International Electronic Conference on Sensors and Applications, 15–30 November 2017; Available online: http://sciforum.net/conference/ecsa-4.
Proceedings 2018, 2(3), 123; https://0-doi-org.brum.beds.ac.uk/10.3390/ecsa-4-04933
Published: 14 November 2017
(This article belongs to the Proceedings of The 4th International Electronic Conference on Sensors and Applications)
Abstract
:Body temperature is an important parameter to measure in a number of fields such as medicine and sport. In medicine temperature changes can indicate underlying pathologies such as wound infections, while in sport temperature can be associated to a change in performance. In both cases a wearable temperature monitoring solution is preferable. In earlier work a temperature sensing yarn has been developed and characterized. The yarns were constructed by embedding an off-the-shelf thermistor into a polymer resin micro-pod and then into the fibers of a yarn. This process created a temperature sensing yarn that was conformal, drapeable, mechanically resilient, and washable. This work builds on this early study with the purposes of identifying the steady state error bought about on the temperature measurements as a result of the polymer resin and yarn fibers. Here a wider range of temperatures than previously explored were investigated. Additionally two types of polymer resin with different thermal properties have been tested, with varying thicknesses, for the encapsulation of the thermistor. This provides useful additional information for optimizing the temperature sensing yarn design.
1. Introduction
Wearable temperature sensors are important as the temperature of the human body is considered as one of the main vital signs that are measured and monitored in hospital patients [1], with temperature being a useful method to detect various pathologies, including infection in wounds [2,3,4].
This work builds on previous studies that have created a wearable temperature sensing yarns [5,6]. Further to earlier work, this study focuses on absolute temperature measurements as well as temperatures outside of those that would normally be physiologically relevant. New knowledge has been created to better understand the engineering considerations necessary to refine the temperature sensing yarn design.
The creation of the temperature sensing yarns is based on the patented electronically functional yarns technology [7], which has been employed for a number of sensing applications [8]. For this work a commercially available thermistor was attached to fine copper wires, coated in a polymer resin (around with supporting fibers), and then covered in a knit-braided sheath and packing yarns. This created a yarn that retained its textile properties, much as drape and shear, that also protected the internal electronics from mechanical and physical stresses.
Temperature measurement is affected by many factors such as calibration against the absolute temperature scale, thermal disturbance due to the method of installation and instability effects [9]. The effect of ambient temperature and installation type is often overlooked when measuring surface temperature. There have only been few papers in which this has been taken into account [10,11]. This paper looks into the effects on the absolute temperature readings from thermistors when they are encapsulated in resin and embedded within fibers of yarn.
2. Materials and Methods
To study the influence of the protective micro-pod and the yarn filaments on the steady state error of the temperature sensing yarn, tests were carried out on a precision electronic hot plate from Echotherm Chilling/Heating Dry Bath (Torrey Pines Scientific Inc., Carlsbad, CA, USA). In order to estimate exactly when the steady state occurred the temperature of the hot plate was increased in steps of 2 °C every 5 min and the corresponding temperatures were recorded once the samples reached a steady state.
Murata 10 kΩ 100 mW 0402 SMD NTC thermistors (part number NCP15XH103F03RC, Murata, Kyoto, Japan) were used in this study. In all cases the thermistors were soldered to copper interconnects (fine copper wires). When testing samples two thermistors were placed on either side of the samples on the hotplate in order to obtain the plate temperature. A climate controlled room was not used for these experiments, so room temperature was recorded using a k-type thermocouple (Pico Technology, St Neots, UK).
To understand the effects of the volume and thermal conductivity of encapsulation, the thermistor and copper wire interconnects were encapsulated with different volumes of thermally conductive resin (Dymax Multi-Cure® 9-20801, Dymax Corporation, Torrington, CT, USA; thermal conductivity: 0.9 Wm−1K−1). This was achieved by varying the diameter of the cylindrical encapsulation to 0.87 mm or 1.53 mm. The effects of the thermal conductivity of the resin were investigated by using a thermally non-conductive multi-cure-resin (Dymax Multi-Cure® 9001-E-V-3.5, Dymax Corporation, Torrington, CT, USA; thermal conductivity: 0.2 Wm−1K−1) to form the cylindrical encapsulation with different diameters (0.87 mm or 1.53 mm). Previous work has used the 9001-E-V-3.5, non-thermally conductive, resin.
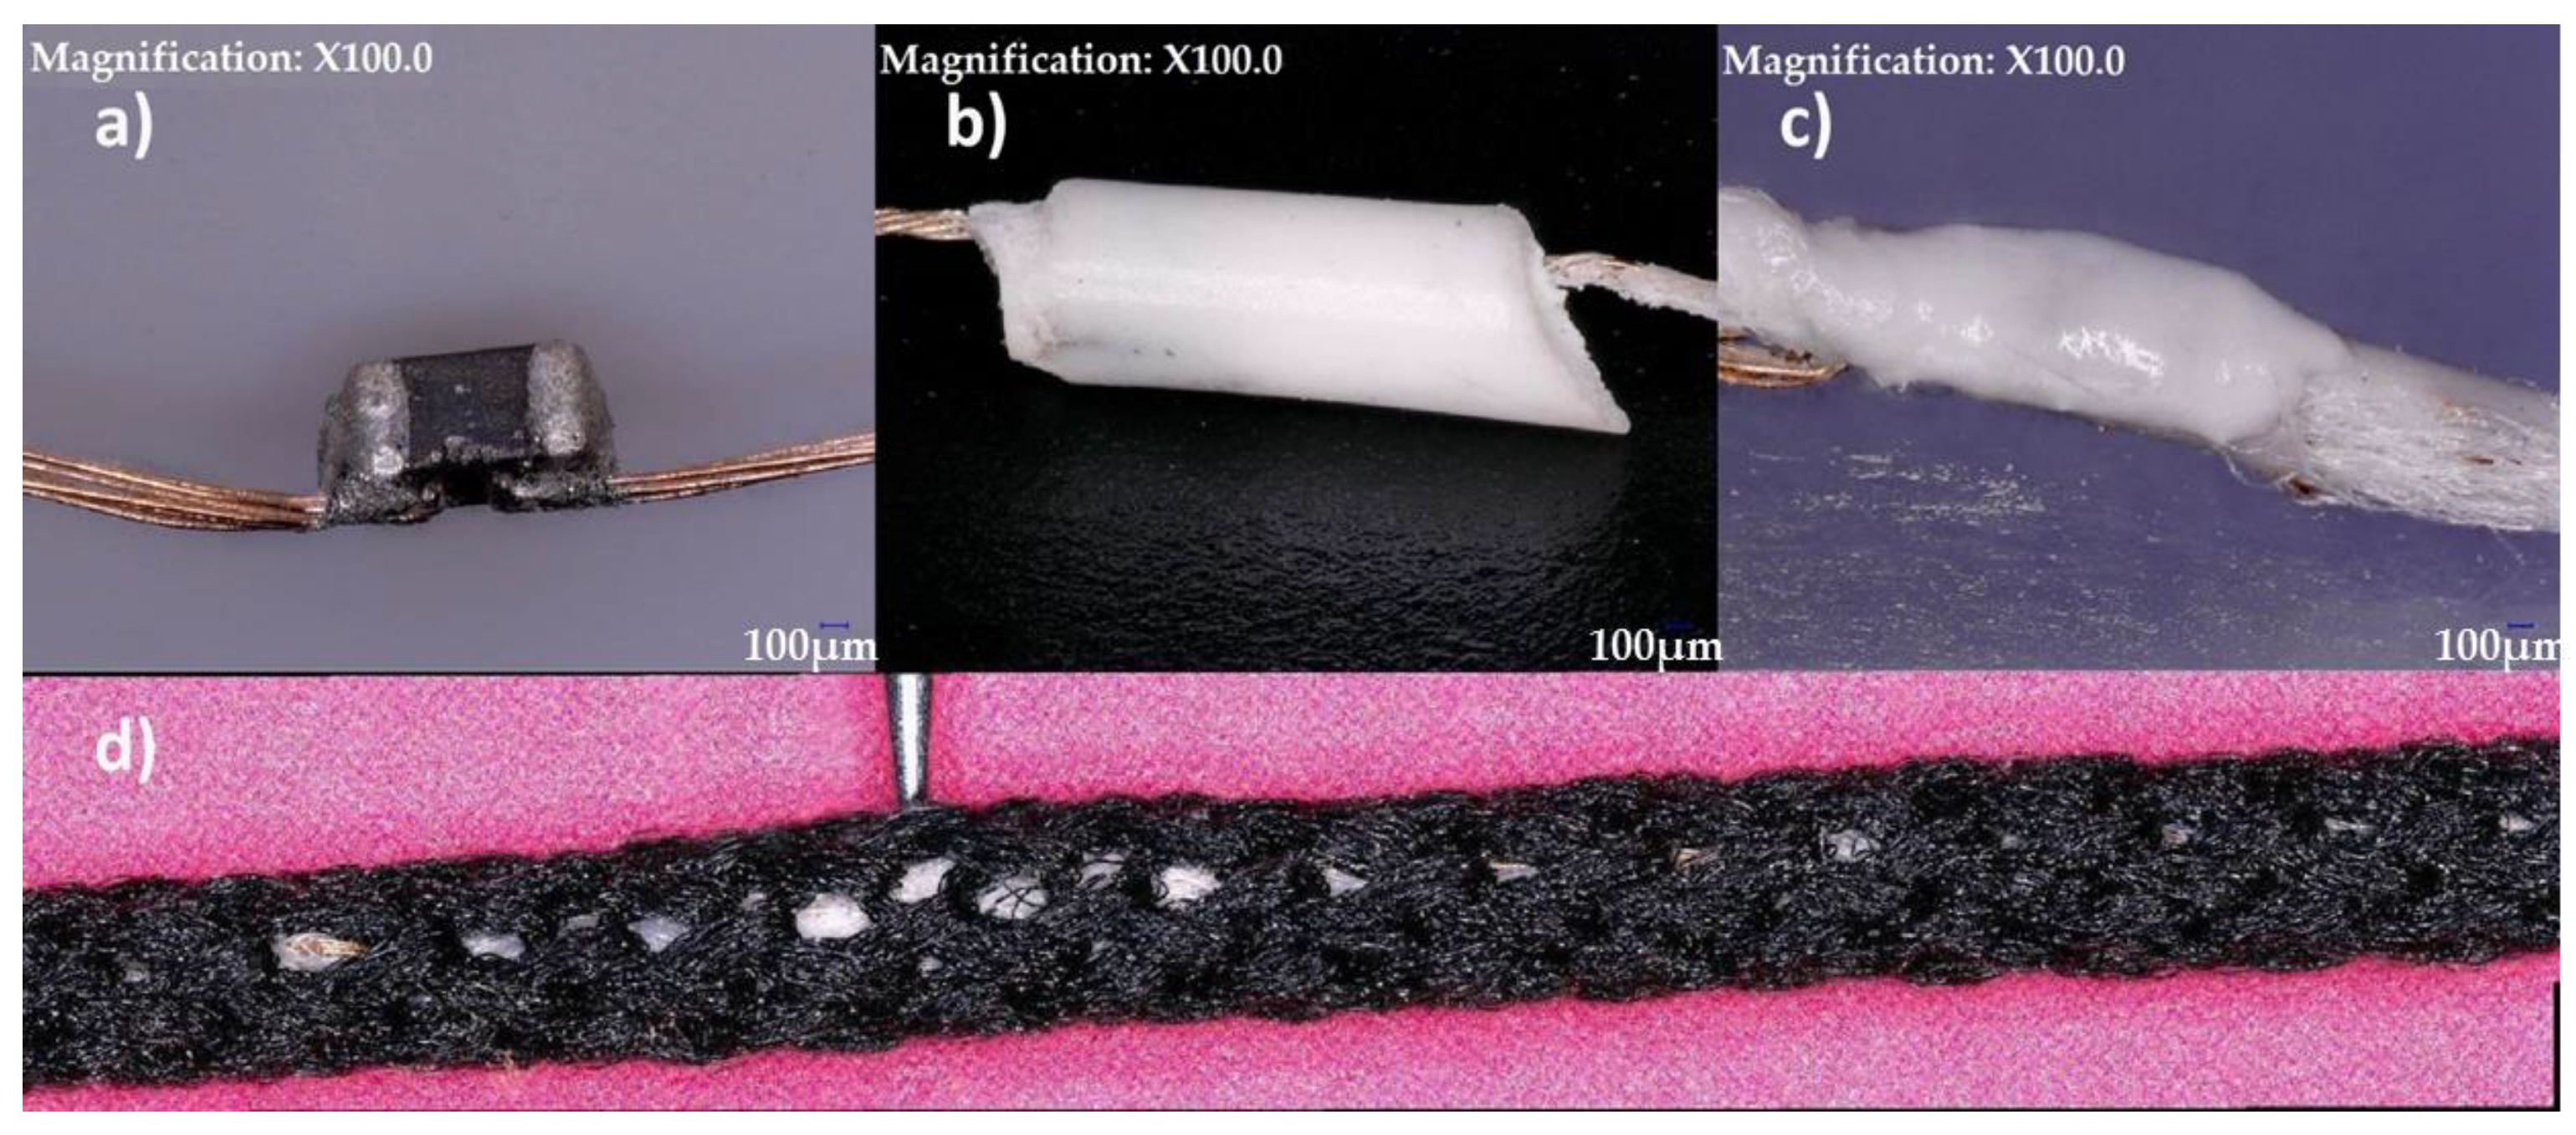
For the temperature sensing yarns two Polyester yarns (167 dtex/48 filaments) were used as carrier fibres to provide mechanical strength to the copper wire interconnects and they were included within the encapsulation. Then the Multi-Cure® 9-20801 (Dymax, Torrington, CT, USA) was used to form a cylindrical micro-pod with a 0.87 mm diameter. Thereafter the carrier fibres, interconnects and the micro-pod were surrounded with six (167 dtex/48 filaments) polyester yarns (packing fibres in Figure 1) and a circular warp knitted structure (knit braid), which was produced with six additional polyester yarns (167 dtex/48 filament) to craft the temperature yarn. The various stages of a temperature sensing yarn construction are shown in Figure 1 below.
3. Results and Discussion
3.1. Diameter of Resin Micro-Pod
Initally samples using a non-termally conductive resin were investigated. Two sizes of resin micro-pod were investigated with the temperatures varied 20 and 40 °C. Results are shown in Figure 2.
It can be observed from the results in Figure 2b that the thermal non-conductive 9001-E-V-3.5 resin had a negligible impact on the recorded temperature when a diameter of the encapsulation of 0.87 mm was used within the reasonably large experimental error. In spite of lacking statistical significance, there is a general trend of deviation, where the recorded temperature shows a greater difference to the temperature of the bare thermistor at higher temperature. Assuming a linear trend at higher and lower temperatures (for the thermistor temperature–sample temperature deviation) at 0 °C there would be a predicted −0.70 °C difference in the absolute temperature, while at 100 °C the difference would be +2.29 °C. Increasing the diameter of the encapsulation made the sample measurements further deviate from the thermistor measurements as expected (the trend for the thermistor temperature–sample temperature would give −2.00 °C deviation at 0 °C and a +4.75 °C at 100 °C). Previously the absolute temperature recorded when different resin micro-pod sizes were used, at a fixed hotplate temperature of 38 °C, was investigated. A range of average temperature of 36.592–38.497 °C were reported for micro-pods of up to 1.9 mm diameter. The data in Figure 2 is in agreement with these results. To reduce deviations in the absolute temperature measurements a thermally conductive polymer resin was investigated.
3.2. Thermally Conductive Resin
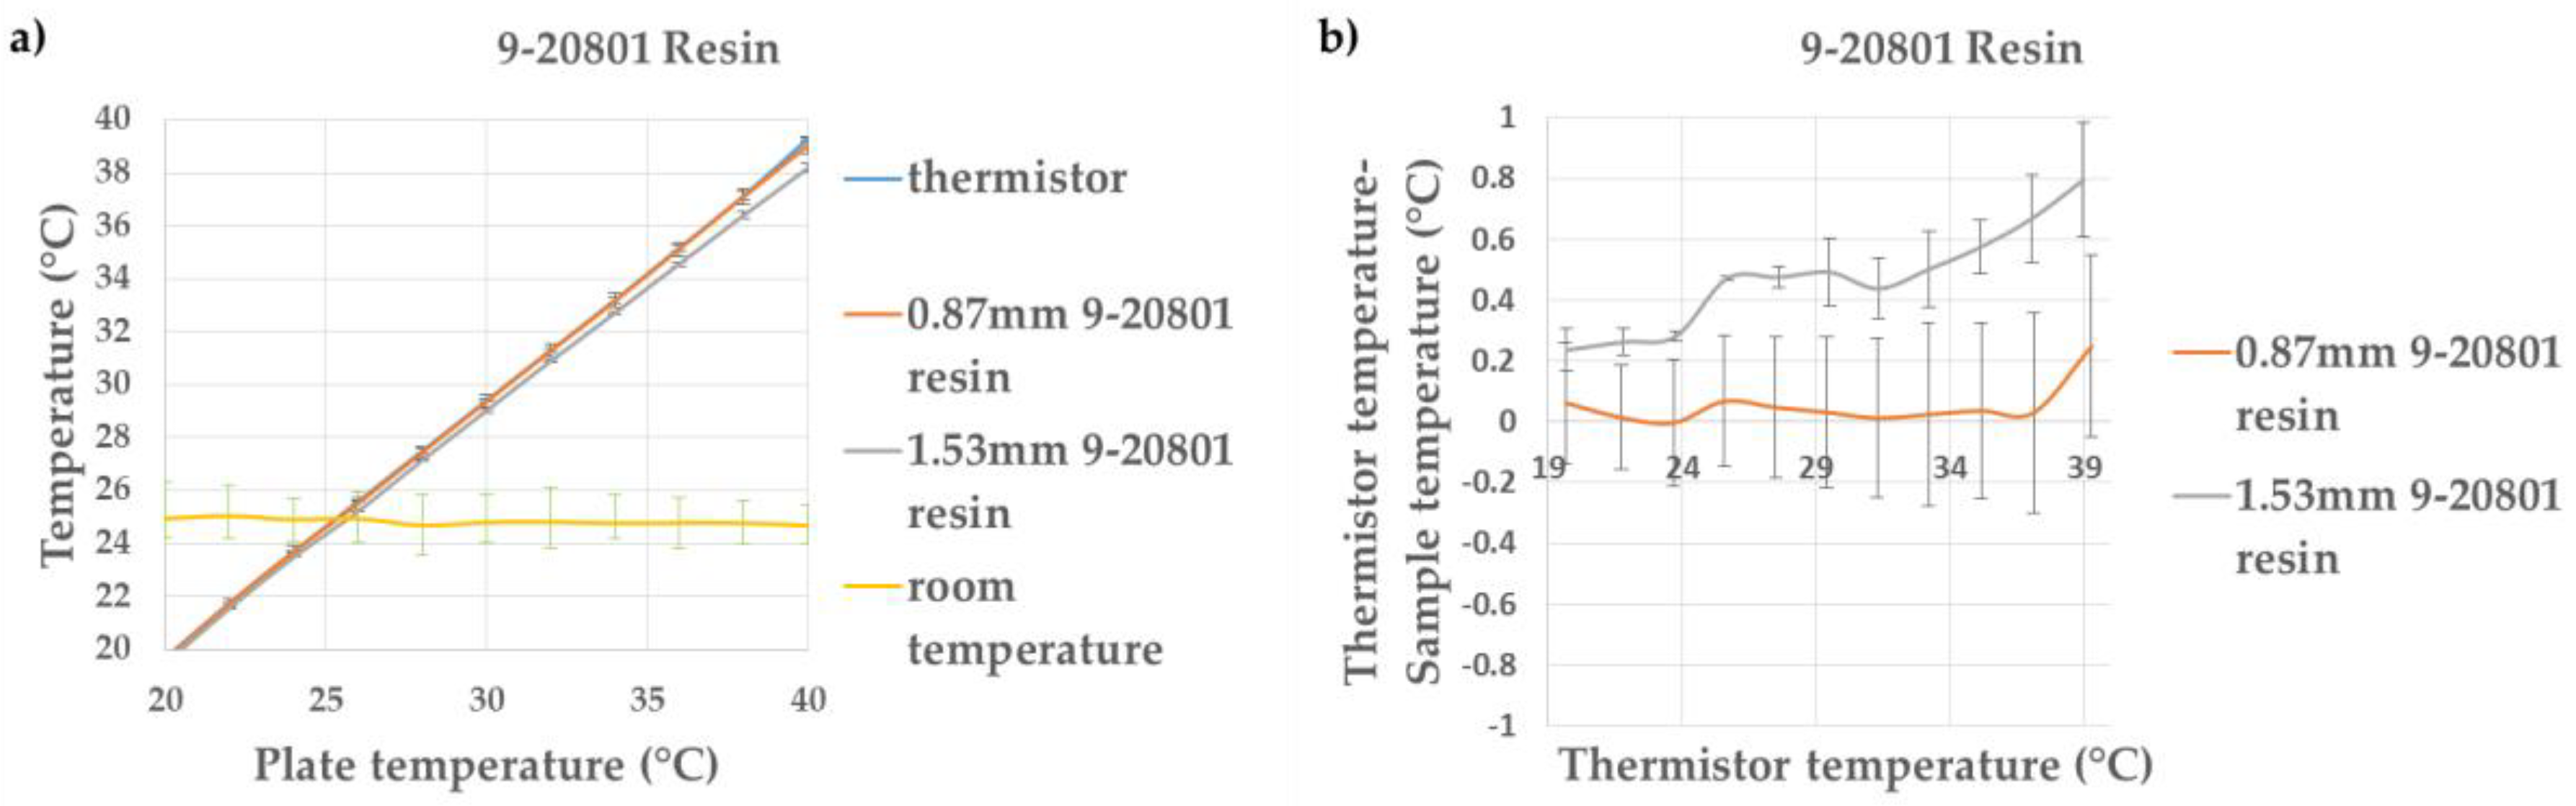
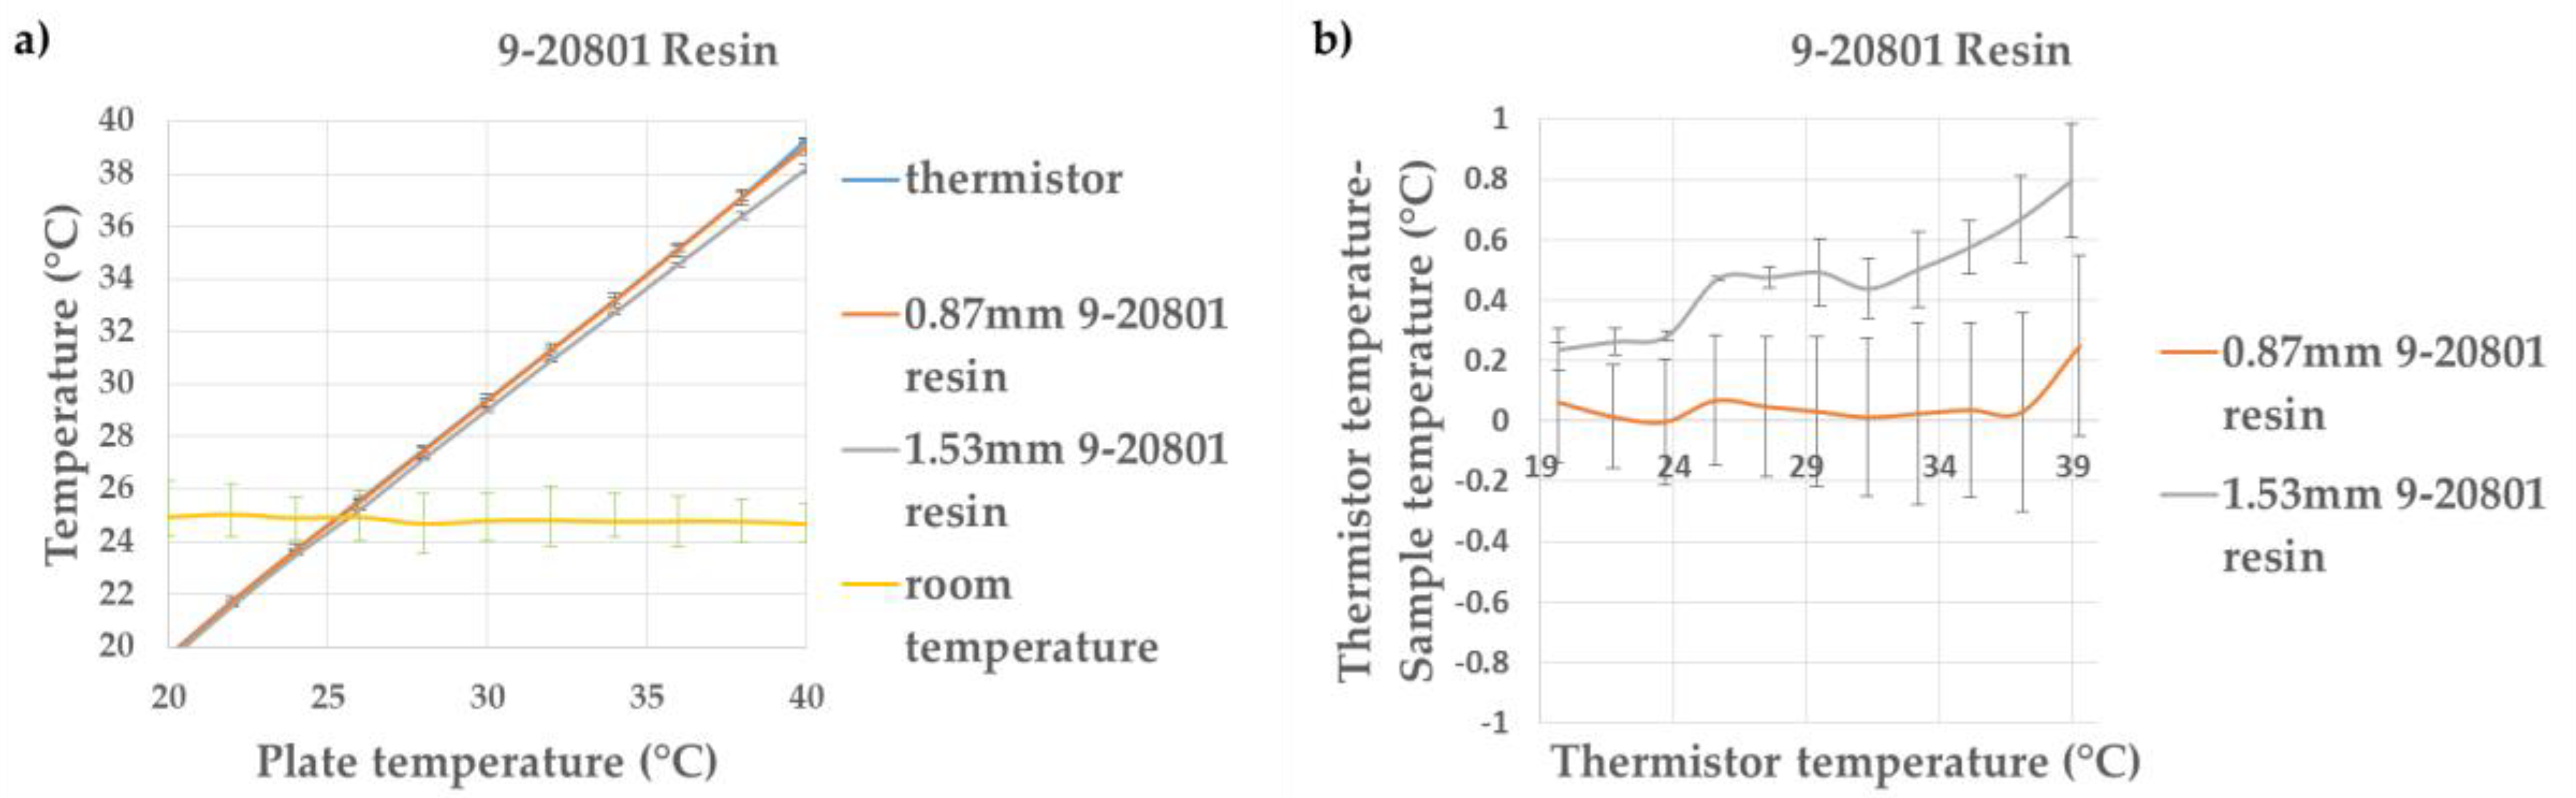
The experiments outlined in Section 3.1 were repeated with a thermally conductive resin, with the results shown in Figure 3.
When using the 9-20801 polymer resin, when using the 0.87 mm diameter cylindrical encapsulation, very little deviation was seen from the bare thermistor measurements (the trend for the thermistor temperature–sample temperature would give −0.09 °C deviation at 0 °C and a +0.39 °C at 100 °C). When the chip was encapsulated with a 1.53 mm diameter of encapsulation a clear trend (the trend for the thermistor temperature – sample temperature would give −0.27 °C deviation at 0 °C and a +2.27 °C at 100 °C) could be observed between the temperature recorded by the thermistors on the hot plate and the sample measurements. This was due to the increase in the thermal resistance of the resin at the greater volume used for the 1.53 mm diameter micro-pod. As the 0.87 mm 9-20801 resin micro-pod gave the least variation in absolute temperature, this micro-pod design was used to produce a set of temperature sensing yarns.
Figure 3.
Thermistor samples encapsulated within resin micro-pods created with 9-20801 resin. (a) The effect of increasing the plate temperature on the temperature recorded by the thermistor and the samples (0.87 mm 9-20801 resin and 1.53 mm 9-20801 resin); (b) The difference between the temperature recorded by the samples compared to the thermistor temperature, showing the deviations from the expected values.

3.3. Final Temperature Sensing Yarn
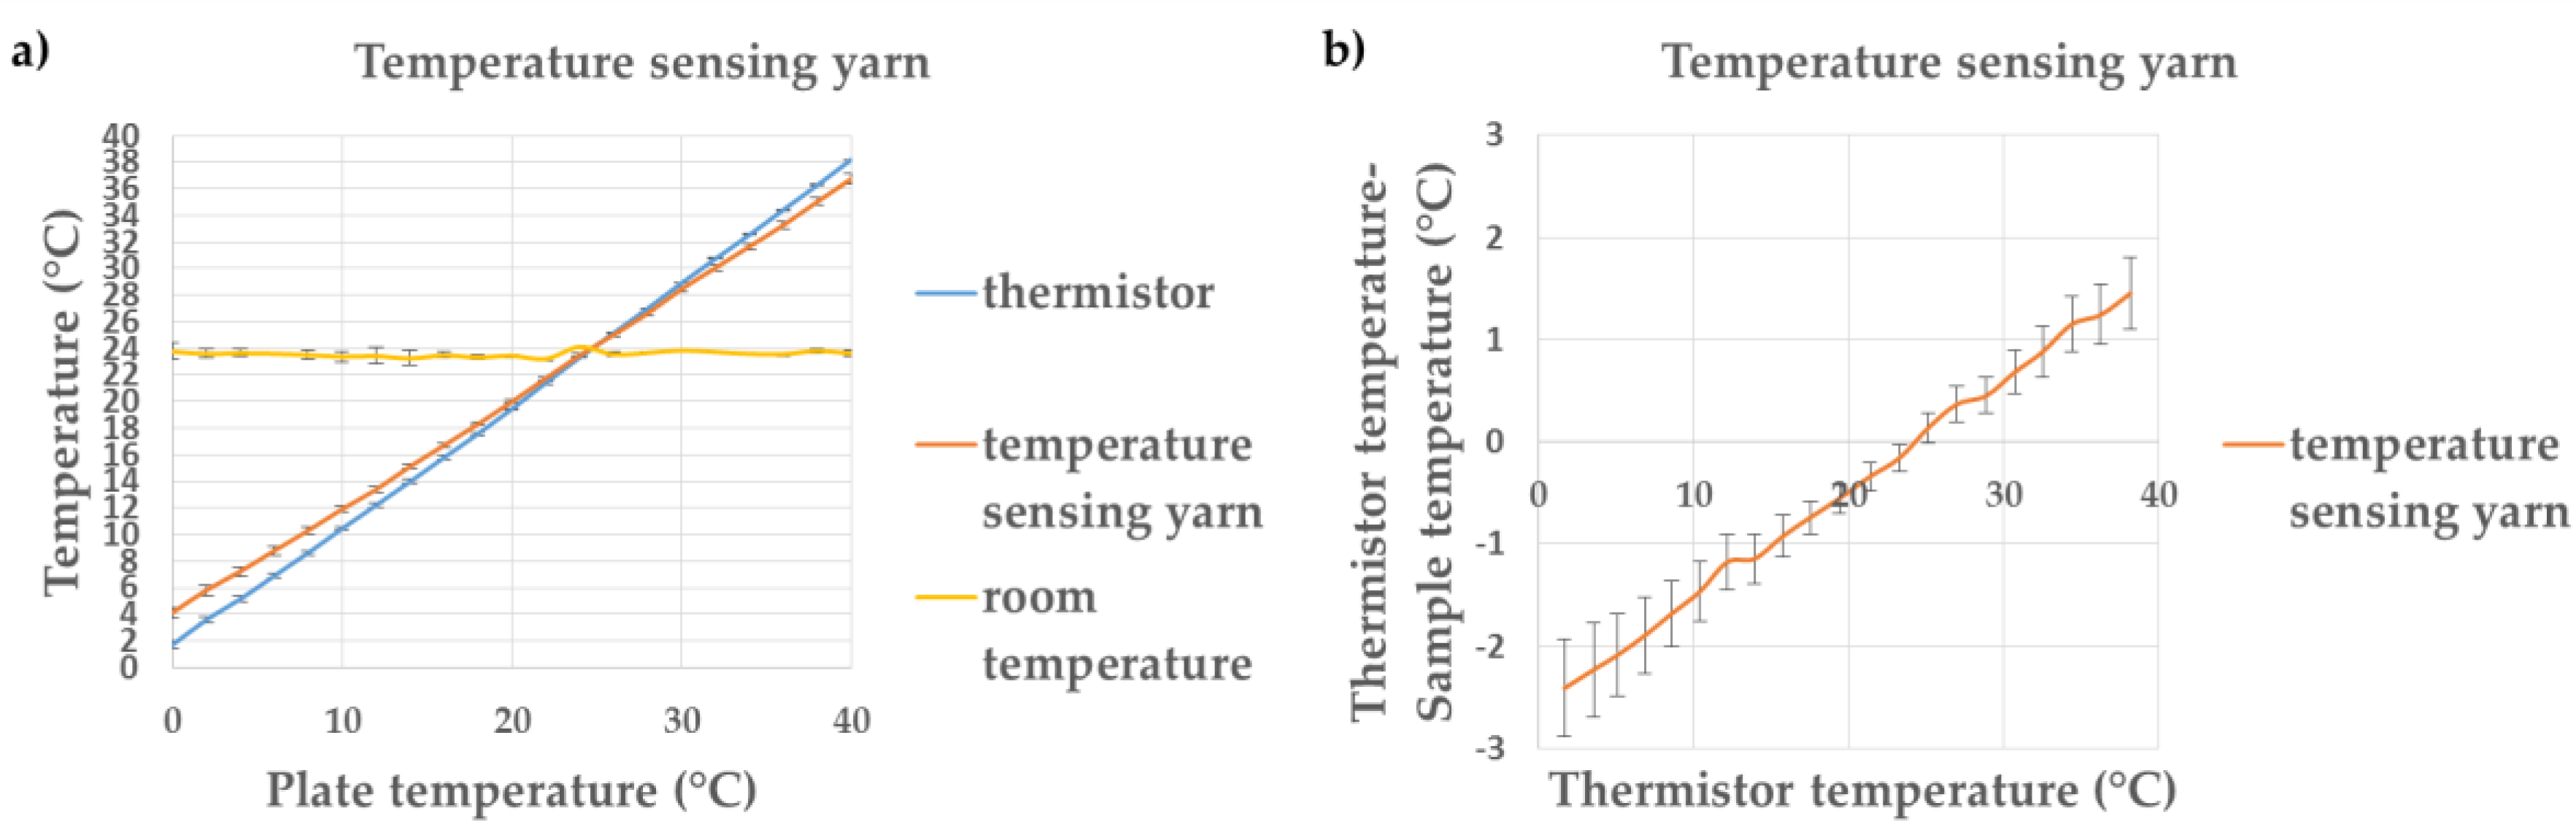
The temperature sensing yarns, created using 0.87 mm 9-20801 resin micro-pods, were tested over a temperature range of 0–40 °C. The results are shown in Figure 4.
Figure 4b shows that the packing fibres and the braided yarn layer impact the temperature measurements, with a significant differences recorded in the absolute temperature compared to temperature recorded with bare thermistor (the trend for the thermistor temperature–sample temperature would give −2.60 °C deviation at 0 °C and a +8.09 °C at 100 °C). The difference between the temperature of the thermistor and the temperature sensing yarn is almost zero at room temperature; it is interesting to note that the difference at physiologically relevant temperatures are still fairly minimal (~1 °C).
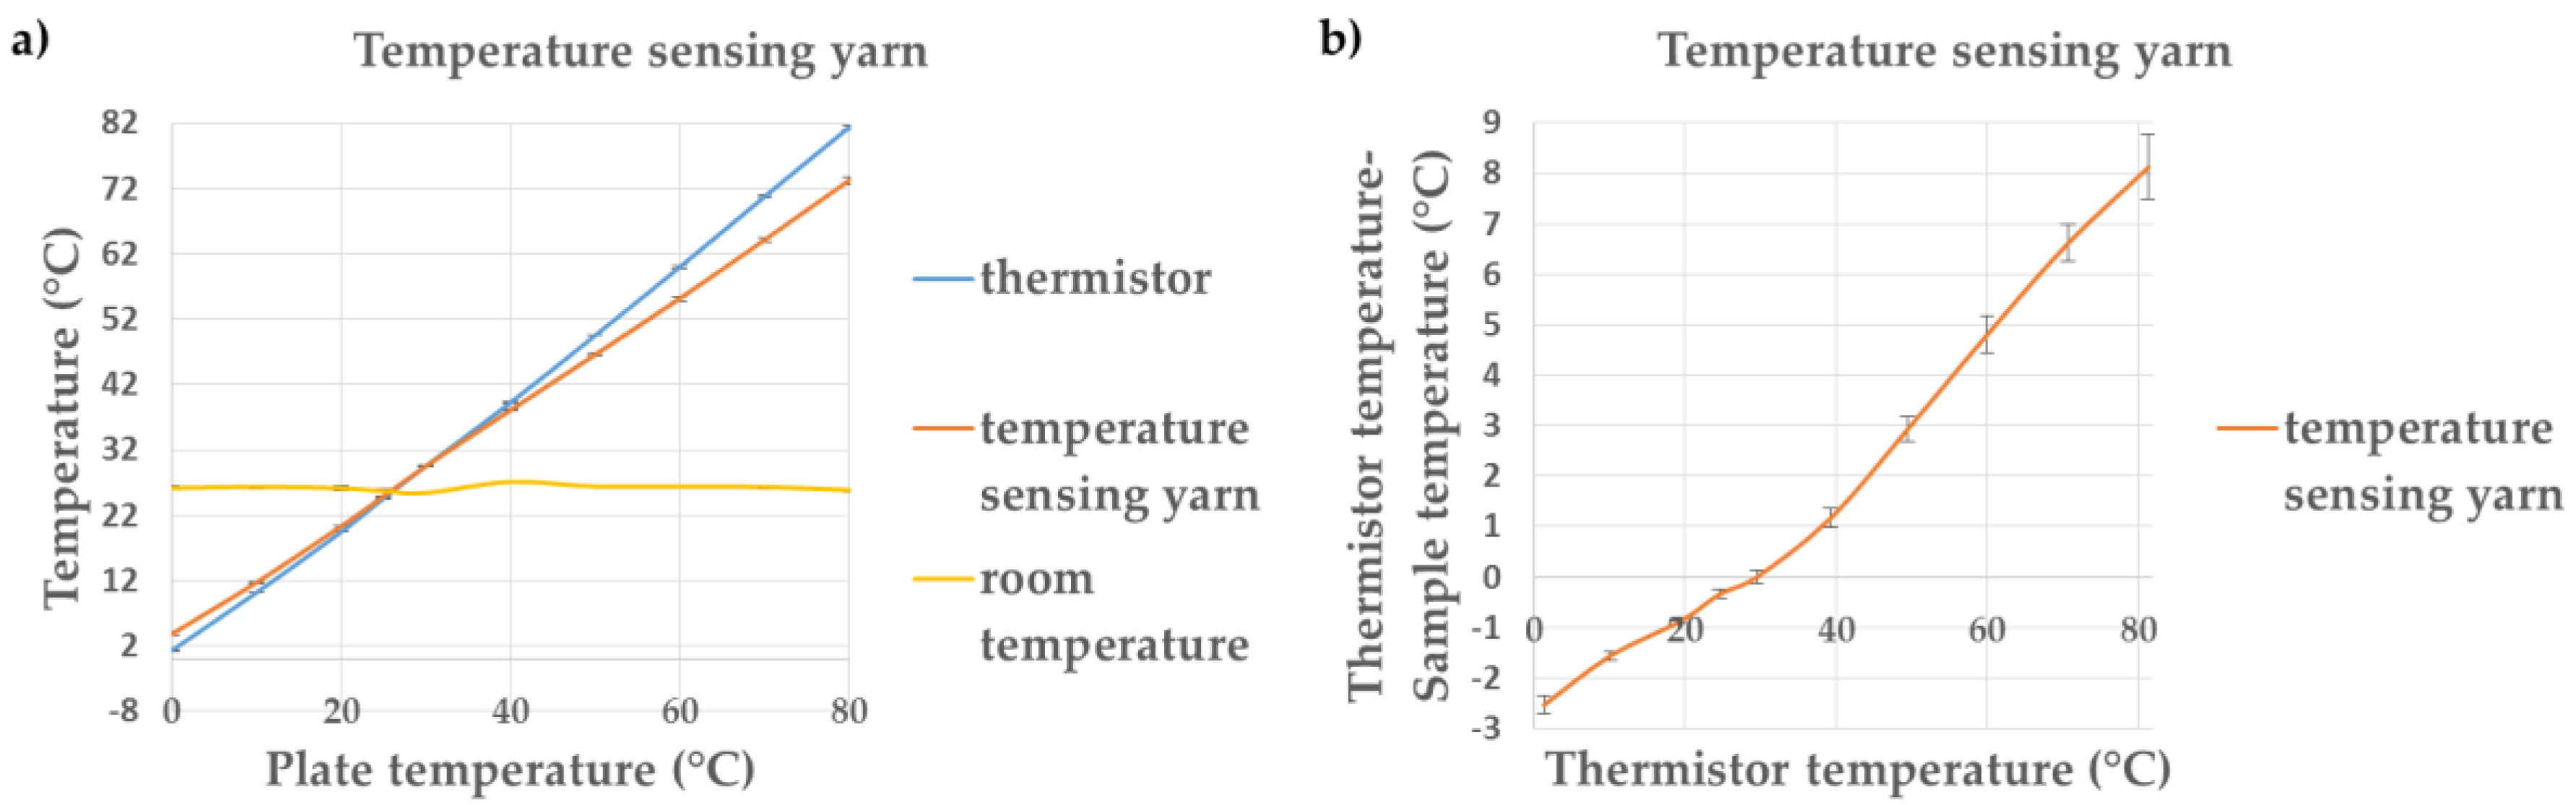
It was important to see the difference between the recorded temperature and actual temperature over a large temperature difference so a final set of experiments were carried out on a single yarn where the temperature of the plate was increased up to 80 °C from 0 °C (Figure 5).
Figure 5b showed that the temperature variation increased with plate temperature, which would be expected given other observations. However the trend (the trend for the thermistor temperature–sample temperature would give −3.41 °C deviation at 0 °C and a +10.20 °C at 100 °C) was not correctly predicted by the previous experiments trend results. This could be as a result of a number of factors including experimental error or fabrication defects in the yarn used to generate Figure 5. It is also possible that the trend in the deviation is no longer linear at higher or lower temperatures. Ultimately these experiments shows that a correction would need to be applied to data if the temperature sensing yarns were used in high or low temperature conditions.
4. Conclusions
This work successfully explores the accuracy of the absolute temperature measurements provided by temperature sensing yarns. Steps have been taken to minimize differences in the temperatures recorded by the yarn and the actual temperature of its surrounds. The work shows that obtaining highly accurate absolute temperature readings using the temperature sensing yarn can be difficult at temperatures that are lower or higher than ambient. It should however be noted that around physiologically relevant temperatures, the temperature difference between the recorded temperature and the actual temperature was minimal (around 1 °C).
This work has demonstrated that the use of a thermally conductive encapsulation resin 9-20801 has no significant difference when compared to the thermally non-conductive 9001-E-V-3.5 for a 0.87 mm encapsulation at physiologically relevant temperatures. If the yarn is used for high or low temperatures would be advisable to use the thermally conductive resin.
Author Contributions
P.L., T.D. and T.H.R. conceived and designed the experiments; P.L. performed the experiments; P.L. and T.H.R. analyzed the data; R.H.M. contributed specialist expertise in measurement science and interfacing; P.L. and T.H.R. wrote the paper.
Acknowledgments
Pasindu Lugoda gratefully acknowledges Nottingham Trent University for funding under the Vice Chancellors Bursary Award. This research received funding from the Defence Science and Technology Laboratory through the Centre for Defence Enterprise.
Conflicts of Interest
The authors declare no conflict of interest.
References
- McCallum, L.; Higgins, D. Body temperature is a vital sign and it is important to measure it accurately. Nurs. Times 2012, 108, 20–22. [Google Scholar] [PubMed]
- Nakagami, G.; Sanada, H.; Iizaka, S.; Kadono, T.; Higashino, T.; Koyanagi, H.; Haga, N. Predicting delayed pressure ulcer healing using thermography: A prospective cohort study. J. Wound Care 2010, 19, 465–472. [Google Scholar] [CrossRef] [PubMed]
- Mufti, A.; Coutts, P.; Sibbald, R.G. Validation of commercially available infrared thermometers for measuring skin surface temperature associated with deep and surrounding wound infection. Adv. Skin Wound Care 2015, 28, 11–16. [Google Scholar] [CrossRef] [PubMed]
- Chaves, M.E.A.; Silva, F.S.; Soares, V.P.C.; Ferreira, R.A.M.; Gomes, F.S.L.; Andrade, R.M.; Pinotti, M. Evaluation of healing of pressure ulcers through thermography: A preliminary study. Res. Biomed. Eng. 2015, 31, 3–9. [Google Scholar] [CrossRef]
- Hughes-Riley, T.; Lugoda, P.; Dias, T.; Trabi, C.L.; Morris, R.H. A Study of thermistor performance within a textile structure. Sensors 2017, 17, 1804. [Google Scholar] [CrossRef] [PubMed]
- Lugoda, P.; Dias, T.; Morris, R. Electronic temperature sensing yarn. J. Multidiscip. Eng. Sci. Stud. 2015, 1, 100–103. [Google Scholar]
- Dias, T.K.; Rathnayake, A. Electronically Functional Yarns. Patent WO2016/038342 A1, 17 March 2016. [Google Scholar]
- Dias, T.; Hughes-Riley, T. Electronically Functional Yarns Transform Wearable Device Industry; Reading for the Research and Development Community, Nottingham Trent University: Nottingham, UK, 2017; Volume 59, pp. 19–21. [Google Scholar]
- Childs, P.R.N.; Greenwood, J.R.; Long, C.A. Review of temperature measurement. Rev. Sci. Instrum. 2000, 71, 2959–2978. [Google Scholar] [CrossRef]
- Kuznetsov, G.V.; Mukhammadeev, K.M. Numerical estimation of errors of temperature measurements by thermocouples using special glues and pastes. J. Eng. Thermophys. 2010, 19, 17–22. [Google Scholar] [CrossRef]
- Deng, Z.S.; Liu, J. Effect of fixing material on skin-contact temperature measurement by wearable sensor. In Proceedings of the 5th International Summer School and Symposium on Medical Devices and Biosensors, Hong Kong, China, 1–3 June 2008; IEEE: Hong Kong, China, 2008; pp. 137–140. [Google Scholar]
Figure 1.
Photographs of prototype ETS yarn manufacturing process. (a) An eight-strand braided copper wire was soldered onto the thermistor; (b) The thermistor and copper wire were encapsulated with 9-20801 resin with 0.87 mm thickness; (c) The encapsulated thermistor and copper wire was incorporated with carrier fibres within the encapsulation; (d) The final yarn with the position of the thermistor indicated by a needle.

Figure 2.
Thermistor samples encapsulated within resin micro-pods created with 9001-E-V-3.5. (a) The effect of increasing the plate temperature on the temperature recorded by the thermistor and the samples (0.87 mm 9001-E-V-3.5 resin and 1.53 mm 9001-E-V-3.5 resin); (b) The difference between the temperature recorded by the samples compared to the thermistor temperature, showing the deviations from the expected values.

Figure 4.
Temperature sensing yarns created using 9-20801 resin micro-pods. (a) The effects of increasing the plate temperature on the temperature recorded by the thermistor and the temperature sensing yarns; (b) The difference between the temperature recorded by the samples compared to the thermistor temperature.

Figure 5.
Temperature sensing yarns over a temperature range of 0 °C to 80 °C (a) The effects of increasing the plate temperature on the temperature recorded by the thermistor and the temperature sensing yarns; (b) The difference between the temperature recorded by the samples compared to the thermistor temperature.

Publisher’s Note: MDPI stays neutral with regard to jurisdictional claims in published maps and institutional affiliations. |
© 2018 by the authors. Licensee MDPI, Basel, Switzerland. This article is an open access article distributed under the terms and conditions of the Creative Commons Attribution (CC BY) license (https://creativecommons.org/licenses/by/4.0/).
Share and Cite
MDPI and ACS Style
Lugoda, P.; Dias, T.; Hughes-Riley, T.; Morris, R. Refinement of Temperature Sensing Yarns. Proceedings 2018, 2, 123. https://0-doi-org.brum.beds.ac.uk/10.3390/ecsa-4-04933
AMA Style
Lugoda P, Dias T, Hughes-Riley T, Morris R. Refinement of Temperature Sensing Yarns. Proceedings. 2018; 2(3):123. https://0-doi-org.brum.beds.ac.uk/10.3390/ecsa-4-04933
Chicago/Turabian StyleLugoda, Pasindu, Tilak Dias, Theodore Hughes-Riley, and Rob Morris. 2018. "Refinement of Temperature Sensing Yarns" Proceedings 2, no. 3: 123. https://0-doi-org.brum.beds.ac.uk/10.3390/ecsa-4-04933