Selected Rolling Bearing Fault Diagnostic Methods in Wheel Embedded Permanent Magnet Brushless Direct Current Motors


Department of Electrical Machines, Drives and Measurements, Wrocław University of Science and Technology, 50-370 Wroclaw, Poland
*
Author to whom correspondence should be addressed.
Energies 2019, 12(21), 4212; https://0-doi-org.brum.beds.ac.uk/10.3390/en12214212
Submission received: 25 September 2019
/
Revised: 31 October 2019
/
Accepted: 4 November 2019
/
Published: 5 November 2019
(This article belongs to the Special Issue Condition Monitoring and Diagnosis of Electrical Machines)
Abstract
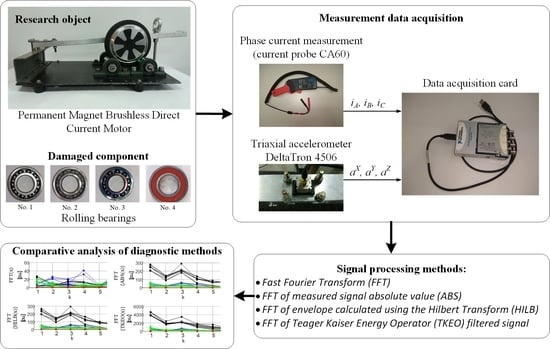
:In recent years, the number of outer rotor permanent magnet brushless direct current (PM BLDC) motor drives has been intensively growing. Due to the specifics of drive operation, bearing faults are especially common, which results in motor stoppage. In a number of these types of motor applications, the monitoring and diagnostics of bearing conditions is relatively rare. This article presents the results of research aimed at searching for simple and simultaneously effective methods for assessing the condition of bearings that can be built into the drive control system. In the experimental research, four vibration signal processing methods were analysed with regards to the identification accuracy of fault symptoms in the geometric elements of bearings (characteristic frequencies). The results are presented for three cases of bearing faults and compared with a new bearing, they were obtained based on a vibration signal analysis using the classical fast Fourier transform (FFT), Fourier transform of signal absolute values, Fourier transform of an envelope signal obtained using the Hilbert transform, and the Fourier transform of a signal filtered with the Teager–Kaiser energy operator (TKEO).
1. Introduction
The permanent magnet brushless direct current motor (PM BLDC), due to its advantages (high efficiency, high power factor, very good power to volume ratio, low maintenance requirements), is increasingly used in various industrial drives and a large number of electrically-propelled or electrically supported vehicles. This extensive range of applications is influenced by the values of exploitation parameters, such as multi-fold torque overload capacity, low moment of inertia, increased general efficiency, and a wide range of rotational speed regulation [1,2]. However, despite these considerable advantages, during exploitation, PM BLDC motors are fault-prone due to the occurrence of various damages [3,4,5]:
- Stator winding (winding short circuit),
- Rotor (magnetic field asymmetry, permanent magnet demagnetisation),
- Inverter (transistor bridge fault in a supply system, shaft position sensor fault),
- Mechanical faults (bearings, rotor eccentricity or unbalance).
Electric vehicles with PM BLDC motors are currently being intensively developed in a wide power range: from about 100 W (e.g., in wheelchair gearless drives), through constructions with continuous power of 250 W (motor-supported bicycles, electric scooters), to motors with a power in the order of a few kilowatts (electric scooters, small vehicles) [1]. Complete drive systems with PM BLDC motors with an electronic commutator are a relatively new solution on a highly dispersed and differentiated market. As a result, there are no statistics on their reliability and the frequency of the occurrence of the above-mentioned faults in vehicle drives with PM BLDC motors. The available fault statistics for electric machines are prepared only for induction motors (IM) [6,7]. There is no reliable data on damage statistics for permanent magnet motors yet, because there is a lack of data from the industrial operation of these motors. However, it can be expected that, due to the similarity of construction, problems related to exploitation faults in PM BLDC motors used in vehicles will be similar. According to [7], in the low-voltage IM of low and medium power bearing damages are dominant (75–95%), while their share decreases with the increasing motor power. On the other hand, along with the increase in rotational speed, the frequency of bearing damages increases significantly [6]. Therefore, also for low power drives with BLDC motors, monitoring of rolling bearing damage seems to be very important.
Publications related to PM BLDC motor faults focus mainly on the faults of stator windings and permanent magnets in a rotor and also an inverter (power and control elements) [5,6,8,9,10,11,12,13]. By contrast, there are very few publications devoted to bearing faults, especially in wheel embedded motors. The variety of surfaces on which vehicles move, resulting in the generation of pulse impact, high rotational speeds and changing atmospheric conditions, have a significant influence on the time of reliable operation of used rolling bearings. This is why it becomes necessary to monitor bearing conditions on-line so as to be able to detect faults at their initial stage and plan service actions. This will limit the occurrence of sudden, uncontrolled drive faults. As a result, it is necessary to develop simple fault identification methods for bearing construction elements.
Due to the high occurrence frequency of rolling bearing faults in rotating electrical machines, continuous efforts are devoted to research the improvement of existing, and the development of new, fault detection methods. Issues related to bearing fault detection are in the interest of renowned diagnostic companies, such as Bruel & Kjaer, Schenck, IRD Mechanalysis Limited (IRD), SPM Instrument (SPM), TEC Bearing (TEC), SKF Group (SKF), Bently Nevada and numerous science and research centres. Diagnostic companies propose instruments for the initial assessment of vibration levels or diagnostic systems (analyzers) that perform digital analysis of the vibration signal according to specific methods. As a rule, these are methods covered by patents and related to the appropriate hardware and software. Due to the high cost, the use of these solutions is justified in the case of diagnostics of stationary industrial drives of higher power.
On the other hand, researchers are looking for and testing new methods of analyzing vibration signals, in particular the vibrations of electric machines. Among others, spectral kurtosis (SK) [14], short-time Fourier transform (STFT) [15], higher order transforms such as bispectrum [16] and bicoherence [17], wavelet analysis [18,19] and methods of artificial intelligence [19,20] are used for quick and effective detection of bearing damage.
Issues related to rolling bearing faults in PM BLDC motors are not extensively discussed in the literature, as is the case with induction motors. Various processing methods are used in vibration signal analysis, they employ complex algorithms, e.g., trace ratio linear discriminant analysis [21], stochastic-resonance-based adaptive filter [22] and methods combining a few transformations (wavelet transform and time-frequency ridge), synchronous demodulation and smoothing [23]. In the case when the rotational speed of a motor varies in time, the order analysis is used to detect rolling bearing faults [4]. In bearing fault detection, the envelope analysis and the Hilbert transform of the stator current or vibration acceleration are frequently used [22,24]. In order to automate the decision-making process, neural networks [24,25] or adaptive neuro-fuzzy inference systems [26] are used. However, the above mentioned methods require complex numerical calculations, which involves the use of advanced microprocessor systems. Such solutions, as well as the use of high-class accelerometers, is economically justified only in the case of higher power drives.
In the application considered in the article, concerning low power PMBLDC motors, one should look for measuring–diagnostic system solutions that meet the following requirements: low cost of the diagnostic system, and solutions limited in size. It follows from the above that the hardware solutions of the analyzed system should be based on cheap accelerometers, with small dimensions (e.g., microelectromechanical system (MEMS) solutions) and cheap processors with limited computational capabilities. In addition, in low power drives there is a problem of correctly isolating the characteristic damage frequencies due to the low energy level of interference from the damage. Therefore, the considered applications should use more sensitive methods than the classic fast Fourier transform (FFT), but equally computationally simple.
The goal of this work is the comparison of four known and simple methods of vibration signal analysis in terms of assessing their suitability for detecting the symptoms of damages to rolling bearings of low-power PM BLDC motor embedded in a wheel. There is very little information in the literature about the diagnostic tests of such drives, taking into account the specifics of the drive and how to mount the bearings. In the opinion of the authors only the experimental comparison of the effectiveness of the analyzed methods in the considered application allows to assess the suitability of individual methods for detecting damage to the structural elements of bearings of the PM BLDC motor embedded in the wheel. Therefore, a special laboratory setup enabling experimental tests of the analyzed drive was developed and described in this paper.
In this research, a PM BLDC motor, used in small electric vehicle drives, such as skateboards and scooters, was investigated. It was a complete wheel-embedded drive with an outer rotating rotor covered with a rubber tyre with a tread. The results presented in the paper were obtained for a rotor working without a load, at a constant angular speed. The research was conducted for three different rolling bearings damaged in various ways and the results were compared with those obtained for a new bearing. The vibration acceleration signals measured with a three-axial sensor were analysed using the classical fast Fourier transform (FFT), Fourier transform of signal absolute values, Fourier transform of an envelope signal obtained using the Hilbert transform and the Fourier transform of a signal filtered with Teager–Kaiser energy operator (TKEO).
This paper is organized as follows: the basic rolling bearing faults and their symptoms are described in Section 2, in the next section the analyzed signal processing methods are shortly described, while the laboratory setup, data acquisition and signal processing system and methodology of the research are presented in Section 4. The analysis of measurement data using selected signal processing methods is shown in Section 5, followed by a short summary.
2. Rolling Bearing Faults
Bearings are a basic element responsible for the force transfer from the rotating to immobile parts of the machine and the other way around. Moreover, they decrease motion resistance between these parts. The incorrect choice of a bearing, its improper maintenance or intensive exploitation may contribute to its premature wear and consequently a fault.
Rolling bearing faults can have a dispersed or local character [7,21,27]. The former is usually the consequence of an insufficient amount of a lubricant or oil and possible contaminants in these substances. Basic faults of this type encompass inequality, deformations or roughness occurring on the whole bearing surface. These types of faults can hardly be described by any characteristic frequency and, hence their detection requires the observation of vibration acceleration spectrum in a wide frequency band and usually they result in the increased effective value of vibration acceleration. Faults of local nature most frequently are single-point defects, such as indentations, material losses in bearing construction elements or small holes. With regards to the damaged construction element in a bearing, they can be divided into: cage, ball spin, inner and outer ring faults. Each local bearing damage can be specified by a characteristic fault frequency fbf. Frequencies (1) result from bearing geometry (constant Cbf) and rotor rotational frequency fr [19,20,22,23,25,27]:
where:
[Hz]—rotor rotational frequency,
Cbf [–]—constant related to bearing geometry and a damaged element type (C(FTF)—cage fault and slackness, C(BPFI)—inner ring fault, C(BPFO)—outer ring fault, C(BSF)—ball spin fault; constants for 6003 type rolling bearing, according to company calculator, are: C(BPFI) = 5.916 [-], C(BPFO) = 4.0842 [-], C(BSF) = 2.6382 [-]), respectively,
n—rotating speed [rev/min],
d—rolling element diameter,
D—pitch diameter,
ϑ—bearing operating angle (0o for an ordinary ball bearing),
Nk—number of ball spins.
The basic source of information on the technical condition of rolling bearings is the vibration level and FFT spectrum analysis, vibration acceleration in X, Y, Z axes. In the research, the amplitudes of characteristic fault frequencies are taken into account as symptoms characteristic for: ball pass frequency of inner ring (BPFI), ball pass frequency of outer ring (BPFO) and ball spin frequency (BSF). Additionally, frequencies related to the amplitude modulation of rotation frequency fr may occur in the amplitude spectrum. This is why frequency faf is usually searched for in the vibration spectrum in accordance with Formula (6).
where is the multiplicity of fault frequency fbf, and coefficient allows to take into account any components coming from the modulation of damage symptoms by rotational frequency fr in the spectrum of vibrations. The value of m is usually equal to 0 or ± 1.
In the diagnostics of PM BLDC motors, similarly to other electric machines, various algorithms and signal processing methods are used to analyse mechanical vibration signals or phase currents. The detection of the construction elements faults of rolling bearings in low power electrical machines, using the fast Fourier transform, is hindered by the low level of characteristic frequency amplitudes. This is the reason why new methods, which would be equally simple in implementation yet able to better detect fault symptoms, are searched for. It is particularly important in on-line bearing condition monitoring systems. This paper focuses on the comparison of the efficiency of four PM BLDC motor vibration signal processing methods: basic Fourier transform, Fourier transform of signal absolute value, Fourier transform of envelope signal obtained using the Hilbert transform and Fourier transform from the TKEO generated signal.
3. Description of Selected Signal Processing Methods
3.1. Fast Fourier Transform (FFT)
The fast Fourier transform (FFT) is the basic method used in rotating machines diagnostics. FFT transforms a signal from the time domain to frequency domain [28,29]. The signal is disintegrated into a number of sinusoidal signals of particular frequency which compose it, which facilitates the analysis. Unfortunately, during this transformation time information is lost, i.e., it is not possible to determine when the event interesting for a user took place. As a result, FFT is used for stationary signals (characterised by time constant frequency) periodical signals.
In the case of real discrete signals x[n] of finite length N, generated during continuous signal sampling, discrete Fourier transform X[k] (k = 0,…,N/2) takes the form [28,29]:
The basic form used to present results after the discrete Fourier transform (DFT) is the frequency spectrum of a signal which is calculated according to the dependence [29]:
For the purpose of scaling the spectrum in frequency units, each |X[k]| sample is attributed frequency f[k] calculated according to the dependence [29]:
where: fp is the signal sampling frequency and N the number of all signal samples.
3.2. Fast Fourier Transform of Measured Signal Absolute Value (ABS)
The FFT processing method of the signal absolute value is based on an original idea using a signal straightening process similarly to an envelope analysis. The operation can be presented according to (10).
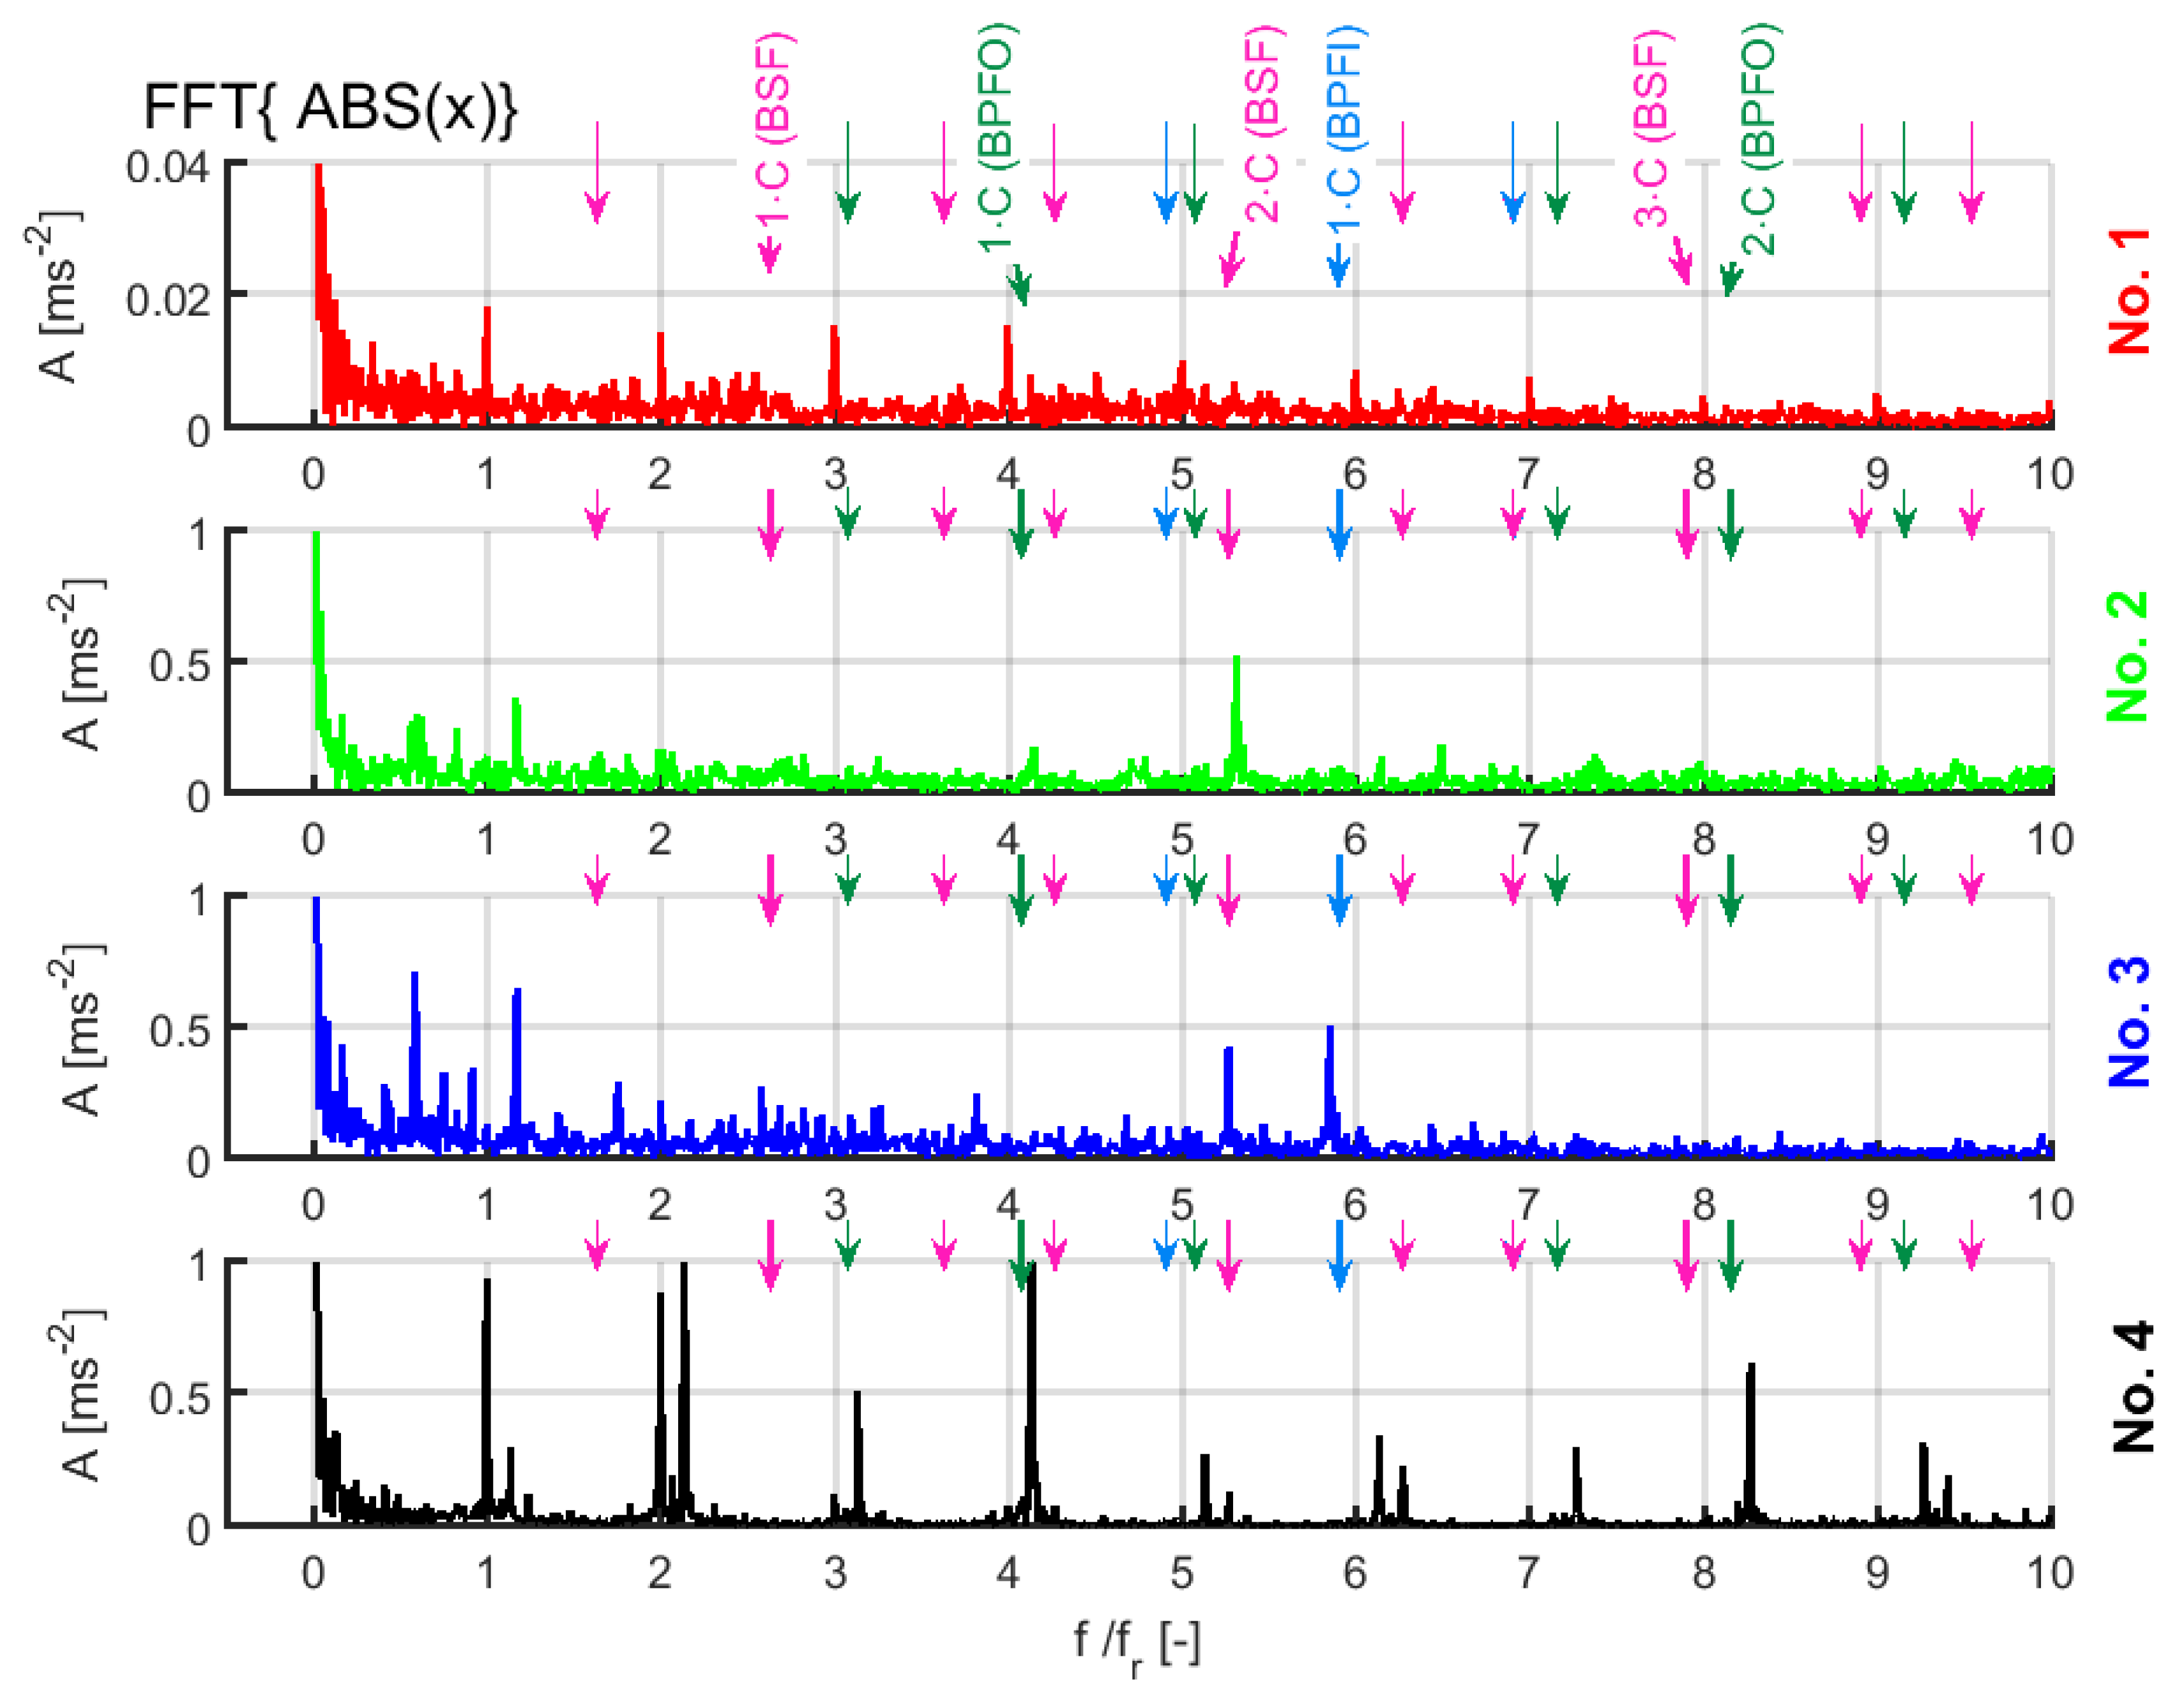
After using a module operation, a constant component appears in the modified signal. The values of all frequencies occurring in the original signal are doubled in the modified signal (similarly to the oscillations of output voltage in a bridge rectifier contain a variable component with the doubled frequency of a supply network). Moreover, as a result of the modulation, components with sums and differences of the frequencies of the original signal appear in the new signal. Hence, if components which are amplitude modulated with rotational speed (i.e., components fb f ± fr) occur in the original signal, then in the absolute value spectrum according to (10), component fr will be strengthened. Similarly, if components characterised by frequencies fbf and k·fbf (k—natural positive number) occur in the original signal, component fbf will be strengthened in the modified signal. This results in an increase in the amplitudes of basic fault components which, in extreme cases, could be even the imperceptible amplitude of the original signal spectrum due to a very small amplitude. A small disadvantage is the fact that, as a result of modulation, components with significant amplitudes, yet not related to fault frequencies, may appear in the spectrum. This is why in this method only a low frequency range should be taken into consideration.
3.3. Fast Fourier Transform of Envelope Calculated Using the Hilbert Transform (HILB)
The envelope analysis of vibration acceleration signal is frequently used in the detection of rolling bearing faults [3]. This approach requires a number of actions: third octave filtering, straightening and subsequently the envelope of the obtained signal. The envelope of a measured signal can also be obtained from an analytical signal after using the Hilbert transform.
The Hilbert transform can be used to analyse stationary, non-stationary and non-linear signals [24,30]. A considerable advantage of the Hilbert transform is efficient noise elimination [24]. The Hilbert transform of signal x(t) is calculated using dependence (11) [24,30]. By contrast, analytical signal a(t) is composed of two elements: the real part, i.e., original signal x(t) and the imaginary part which is the Hilbert transform of original signal H[x(t)] (12) [24].
where: τ—auxiliary variable (subintegral), aenv(t)—instantaneous envelope amplitude and φ(t)—instantaneous phase.
Envelope aenv(t) of original signal x(t) is obtained by calculating the amplitude of signal a(t) (13), while instantaneous phase φ(t) from dependence (14) [24,30]:
3.4. Fast Fourier Transform of TKEO Filtered Signal
The TKEO filter—Teager–Kaiser energy operator, in its original version was used to process speech and estimate transient signal frequency [31,32]. Another application was in electric machine diagnostics [31,33]. The basic version of the filter for continuous signals is expressed as dependence (15) and transforms a sinusoidal signal of a given frequency into a constant value. If an input signal is a sum of many signals, then the signal obtained after the transformation depends also on their mutual effect in accordance with (16) and (17) [32]. Hence, the presence of a non-zero constant component in the resultant signal.
For the purpose of using a TKEO filter in calculations made for a discrete signal, sampled at time interval ∆t, a function derivative must be replaced with its discrete version (18), which will lead to the form compliant with dependence (19). For a constant sampling frequency, the formula can be simplified and ordered to take form (20), which shows the simplicity of the used filtration method: three signal samples are needed, and the additional calculation input is insignificant [31,32].
where x, y— transformed signals, ψ(x)—TKEO transformation result for signal x.
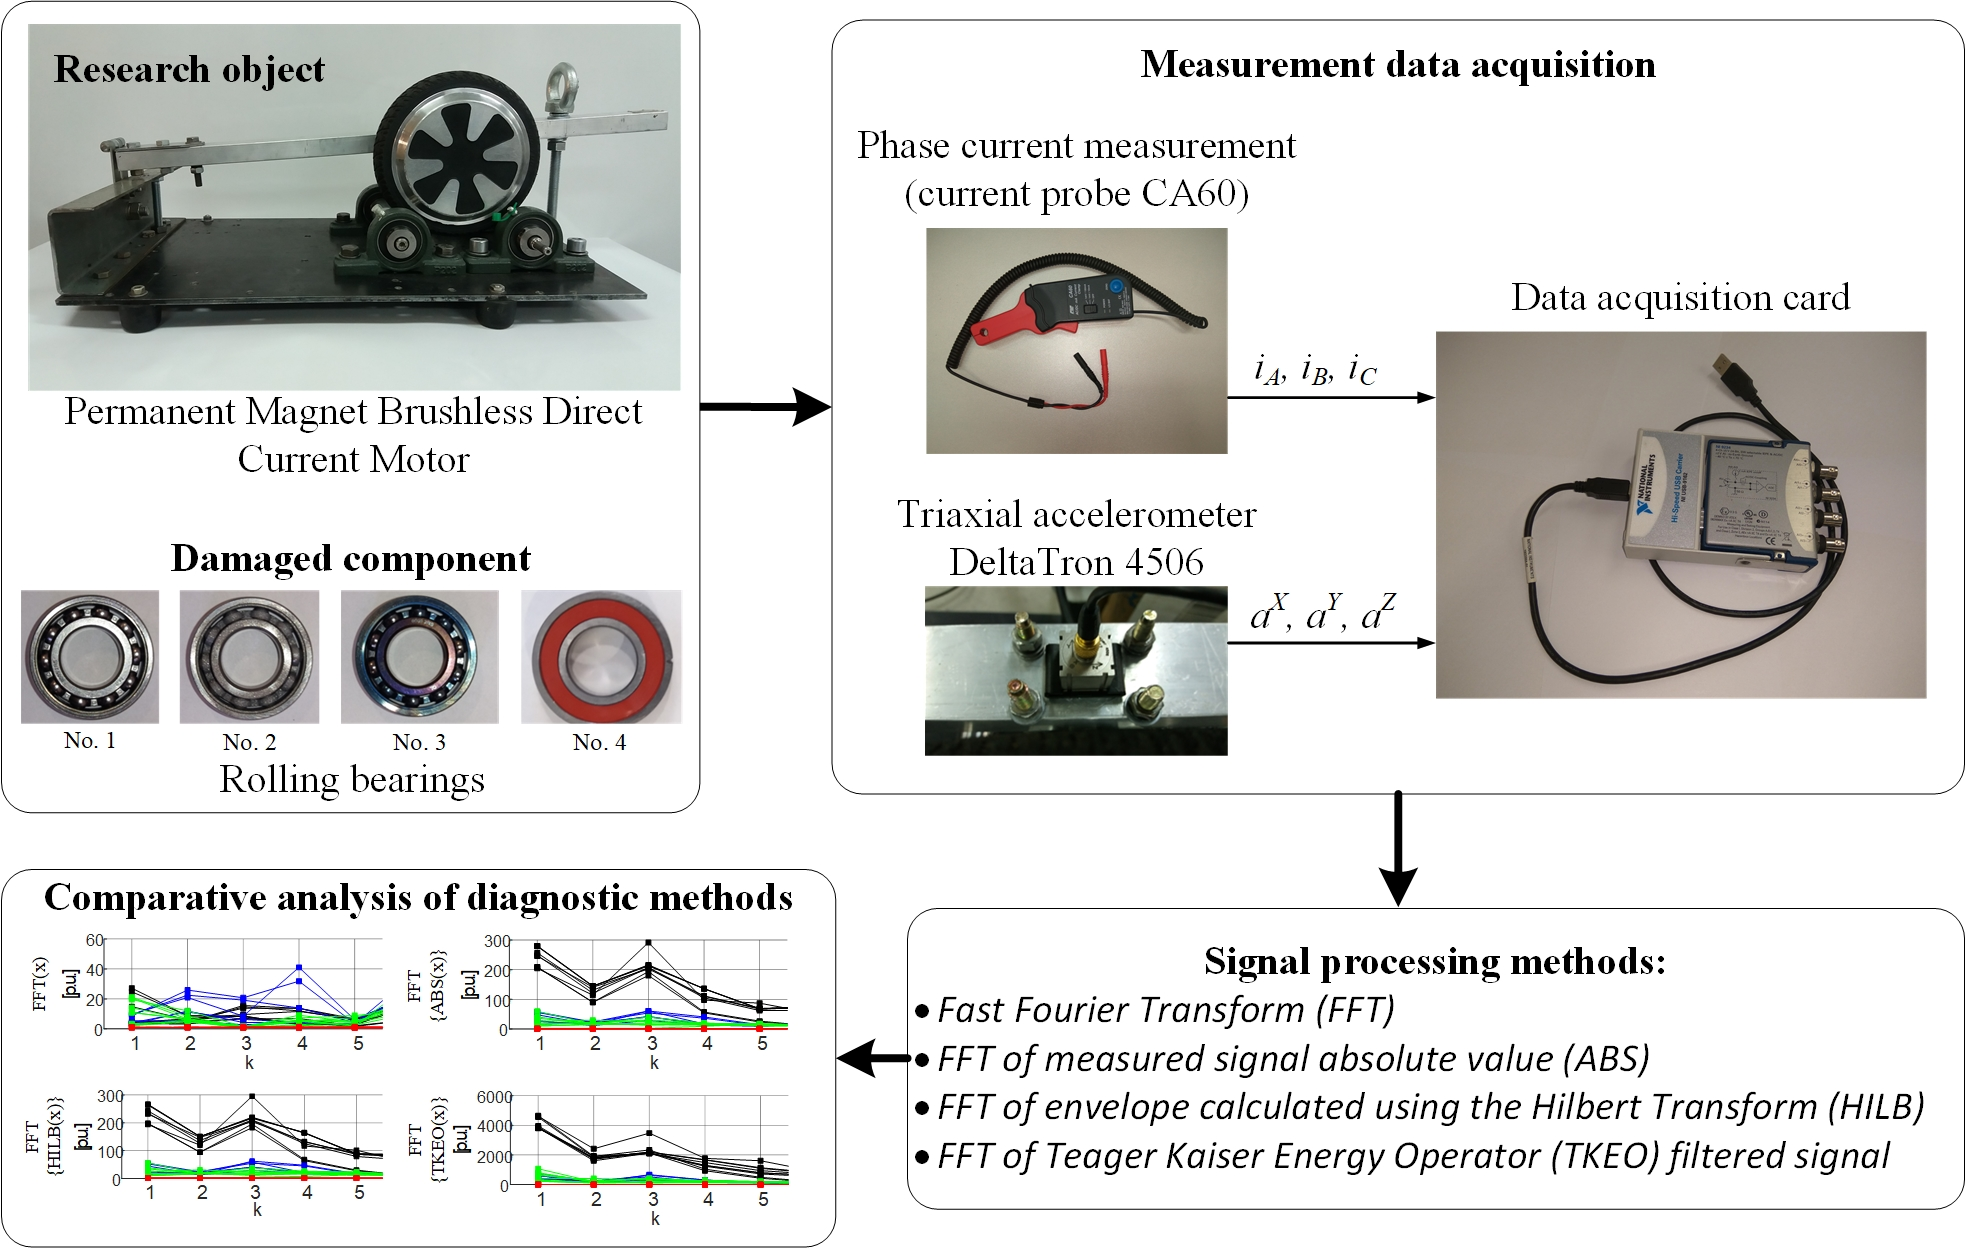
In [32] it was shown that the transformation of a signal including numerous frequency components (f1, f2, f3, …) leads to signal ψ(·) containing components of sums and differences of frequencies f1 ± f2, f1 ± f3, f2 ± f3, … Thus, in the case of faults resulting in amplitude modulation, according to (6) and with consideration for various values of k, m in this dependence, in signal spectrum ψ(·) frequencies fr, 2·fr, fbf, 2·fbf, etc., should be strengthened. For the purpose of illustrating the characteristic features of the above listed signal processing methods, Figure 1 presents the analysis of a sample amplitude modulated signal.
The frequencies were selected in such a way that the whole signal simulated a vibration signal registered for a faulty bearing. In particular frequencies f1 = fr = 10 Hz, f2 = fbf = 60 Hz occurred, and also f2 ± f1, k·f2 and k·f2 ± f1 for kϵ{1, 2, 3, 4}. It can be observed in Figure 1b that the used additional analyses introduced the constant component and that in the spectrum they emphasise frequencies occurring as the components of sums and differences of the original signal frequencies. Hence, the spectrum analysis of signals for which additional calculations were made shows high amplitudes for frequencies 0 Hz, f1, 2 f1, f2, f2 ± f1. Also, a signal module spectrum (marked green in Figure 1) shows components whose frequencies were doubled in comparison with the original signal, especially in the higher range of frequency.
4. Laboratory Setup Description
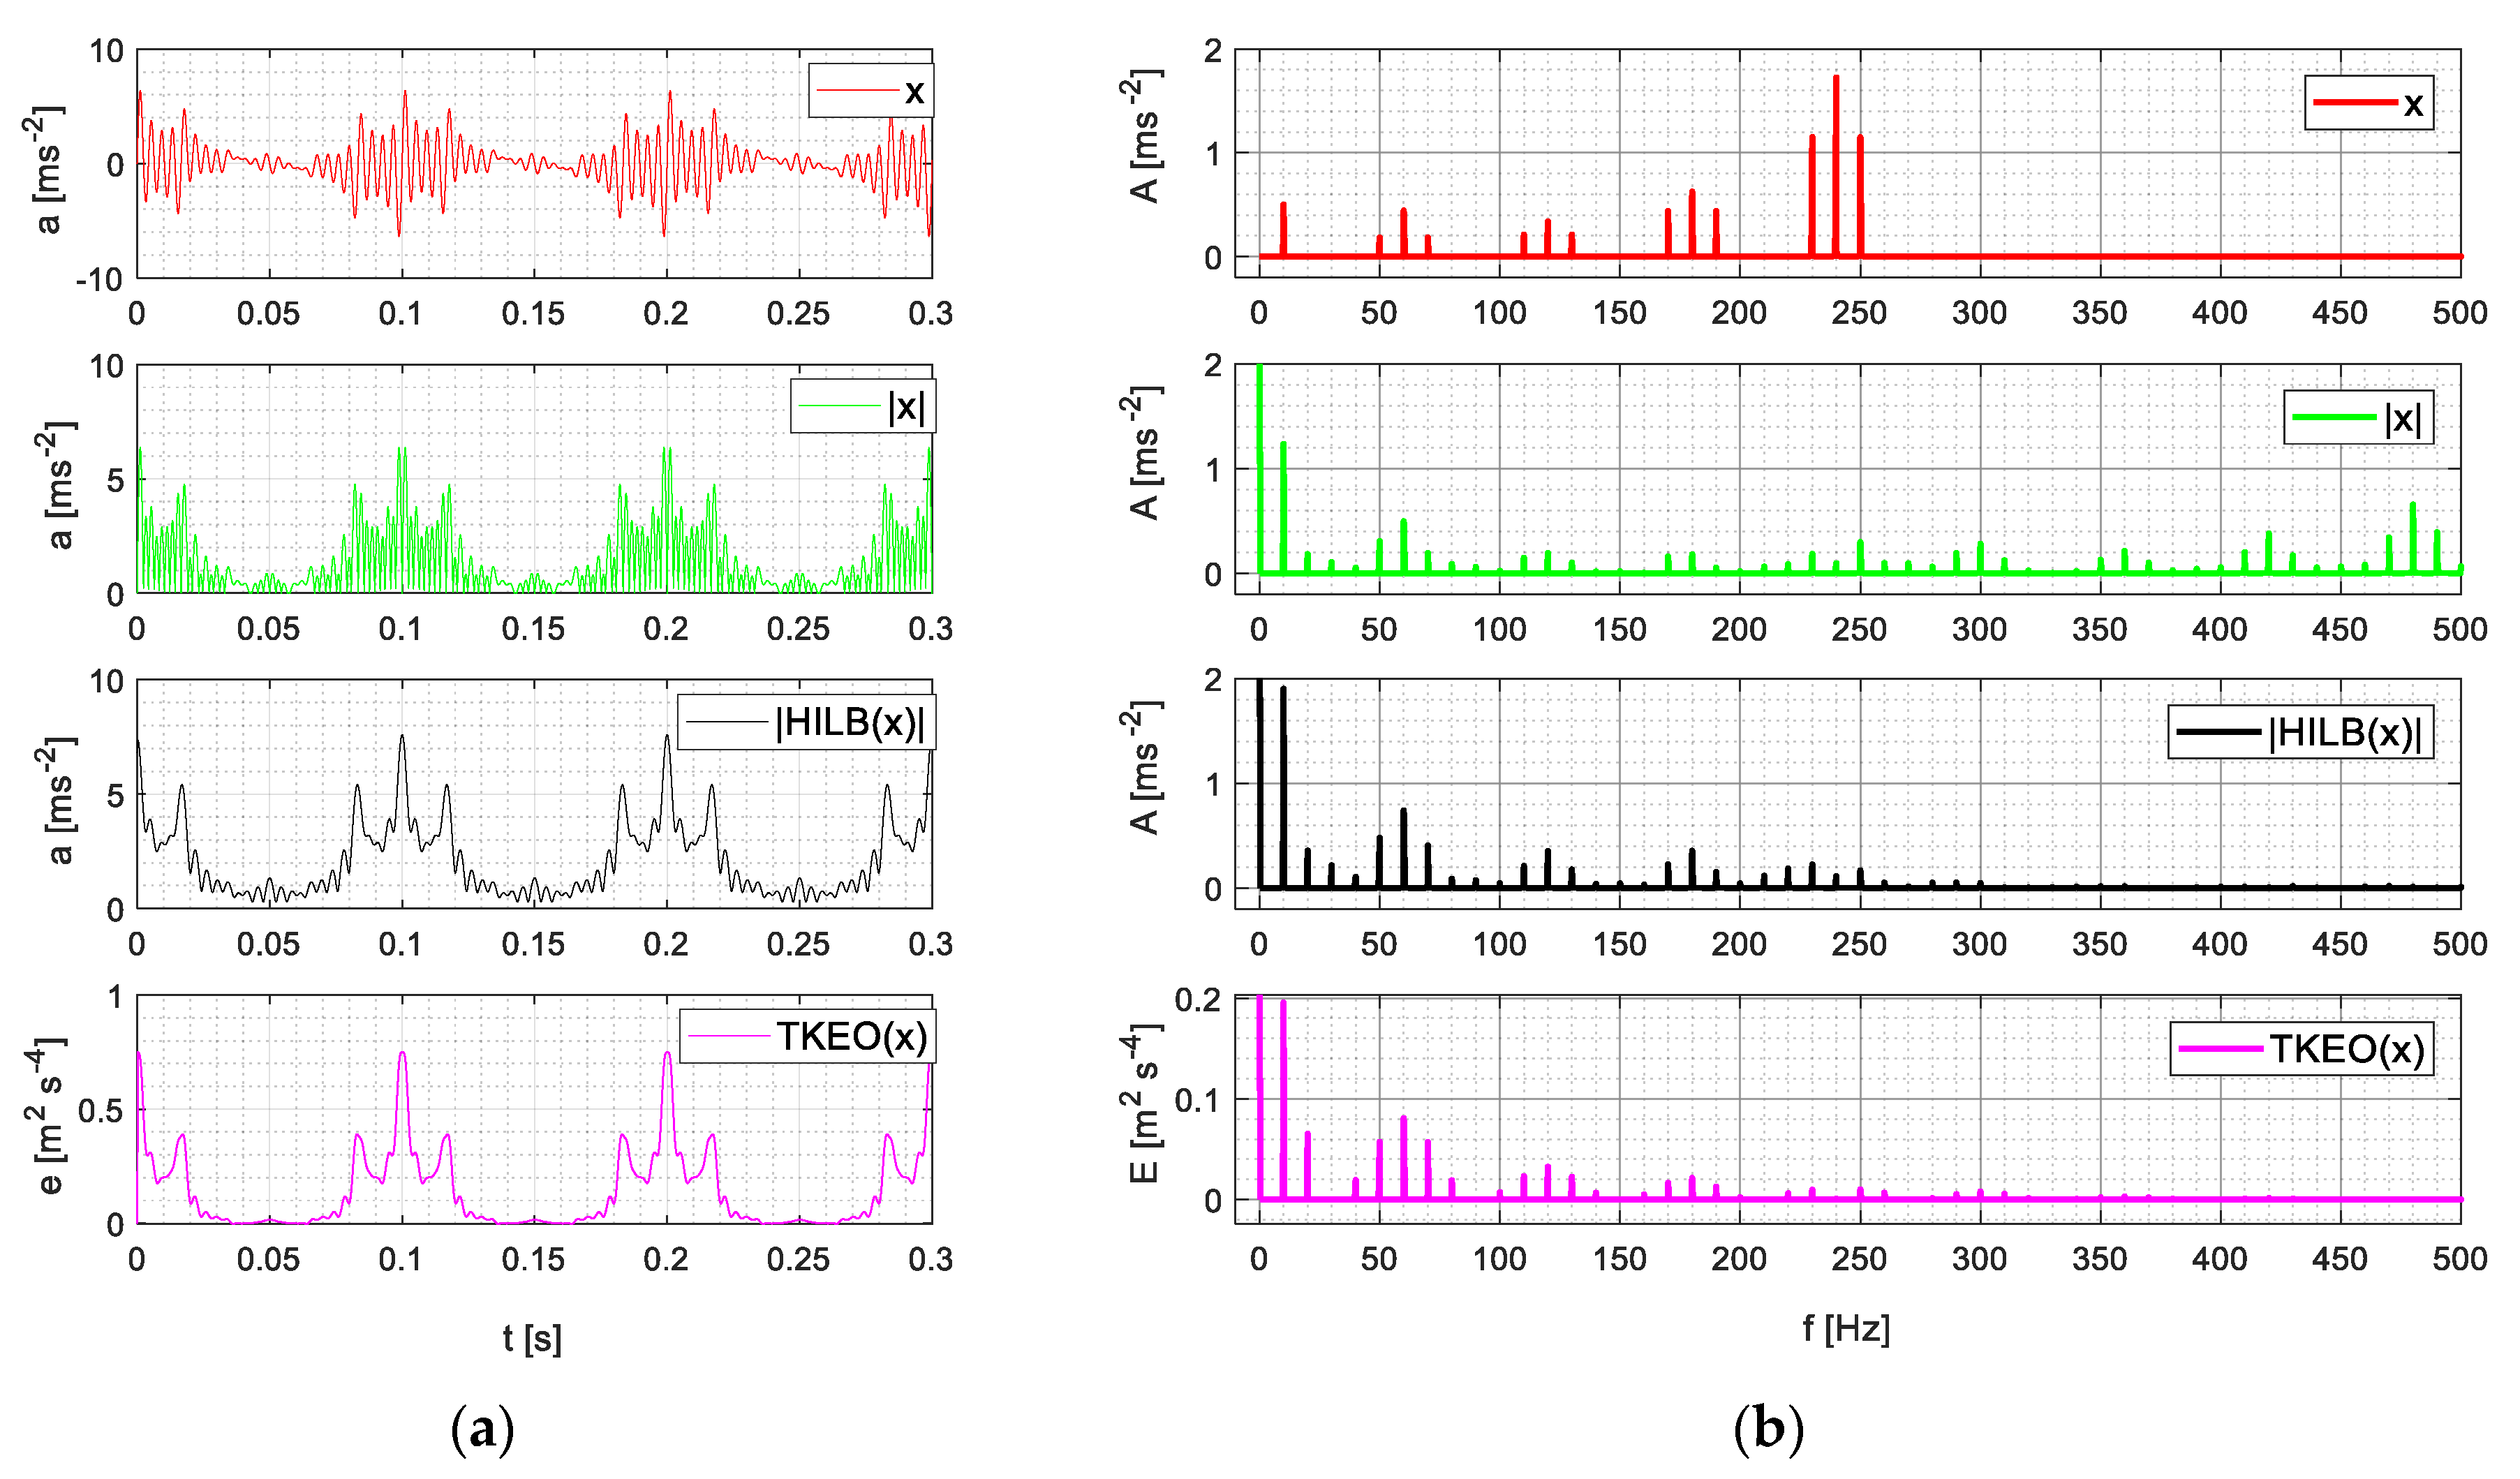
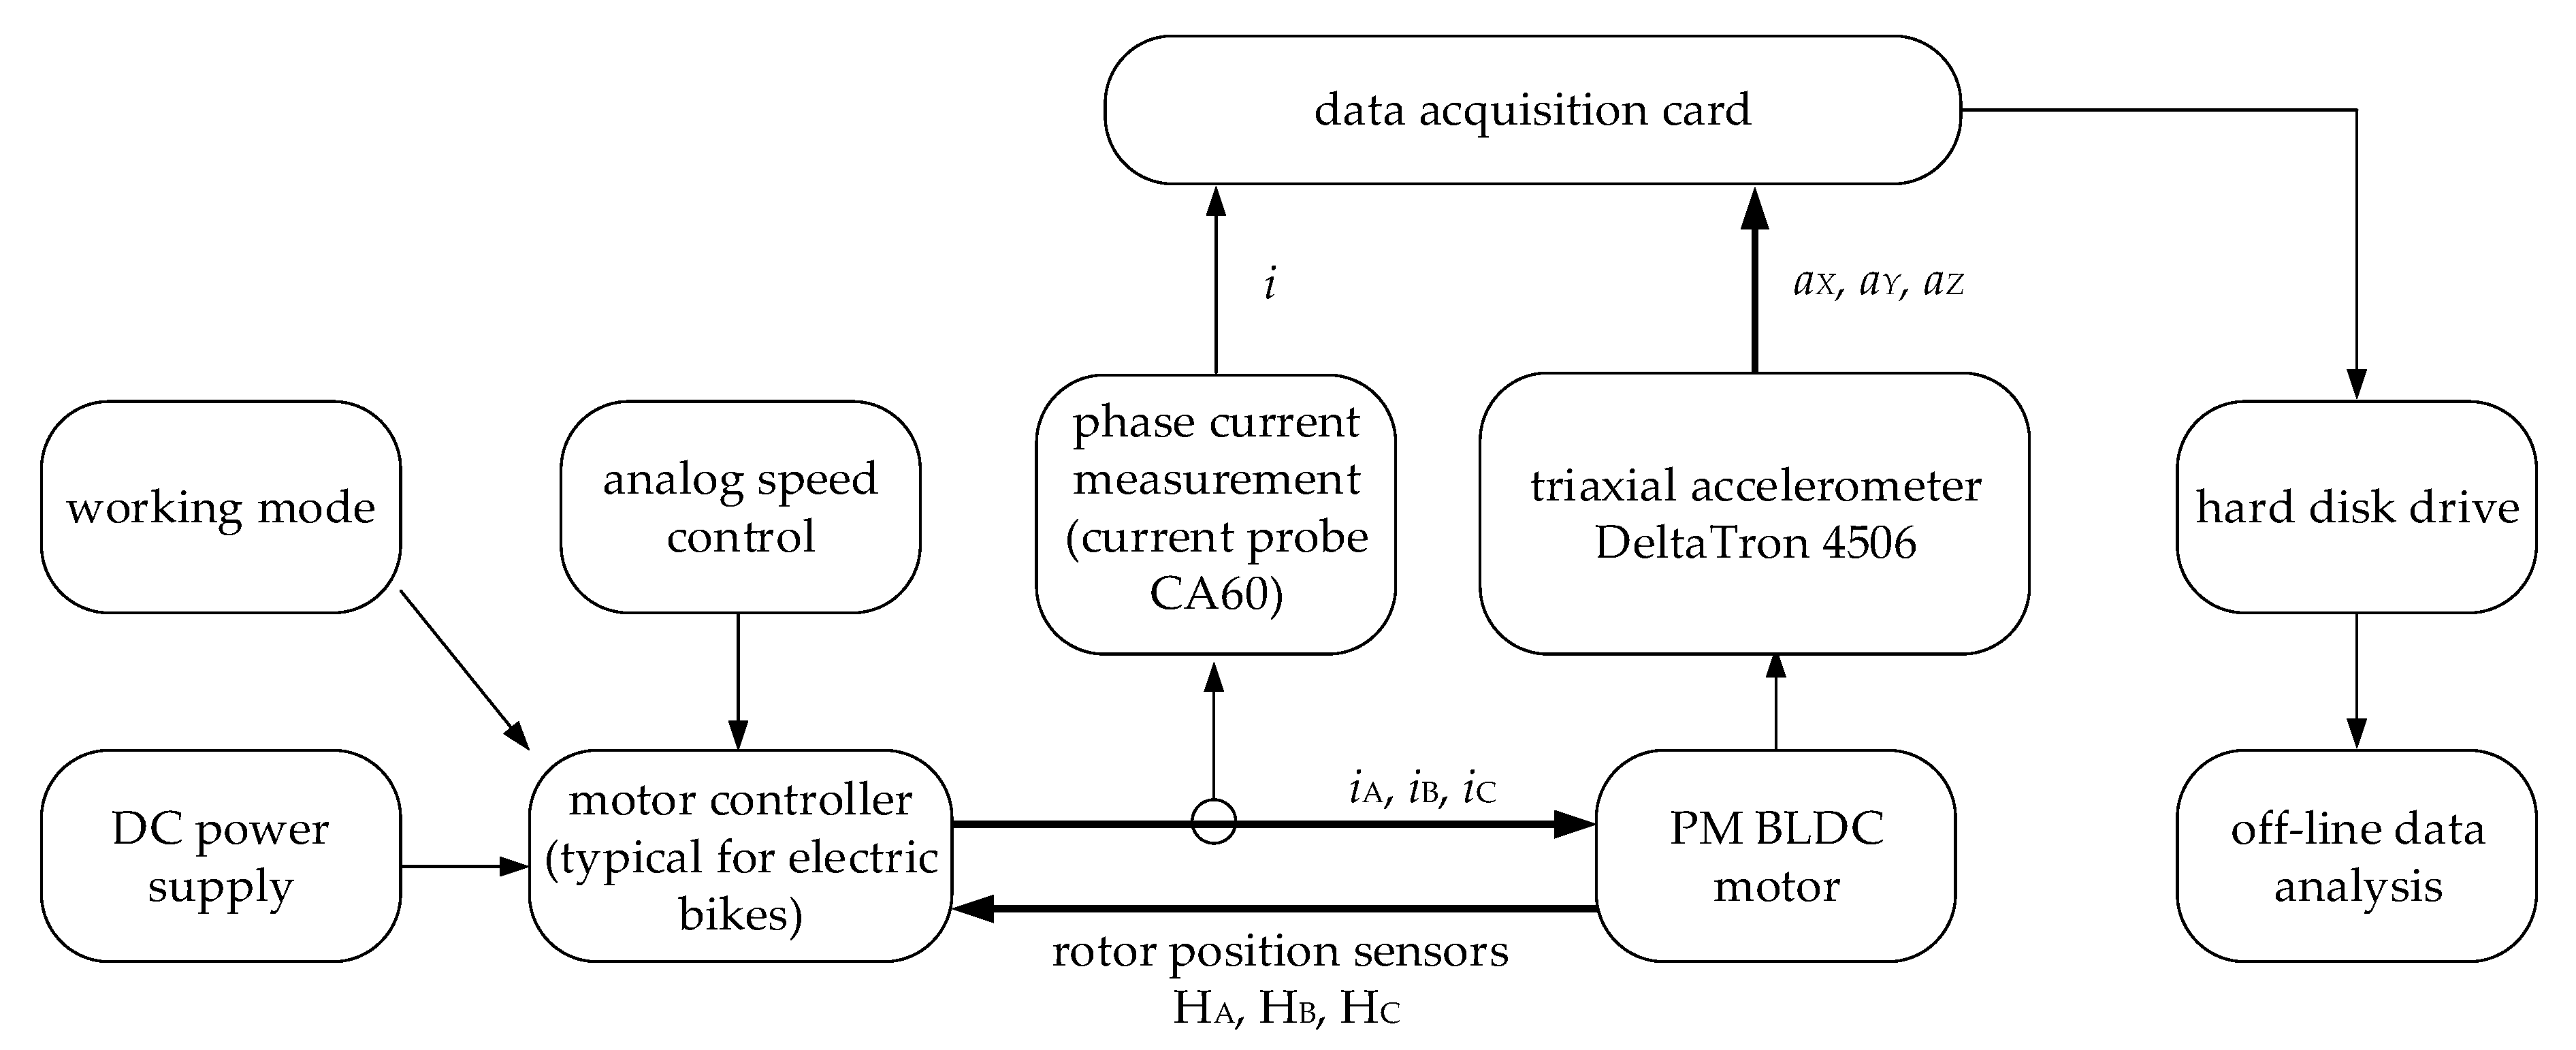
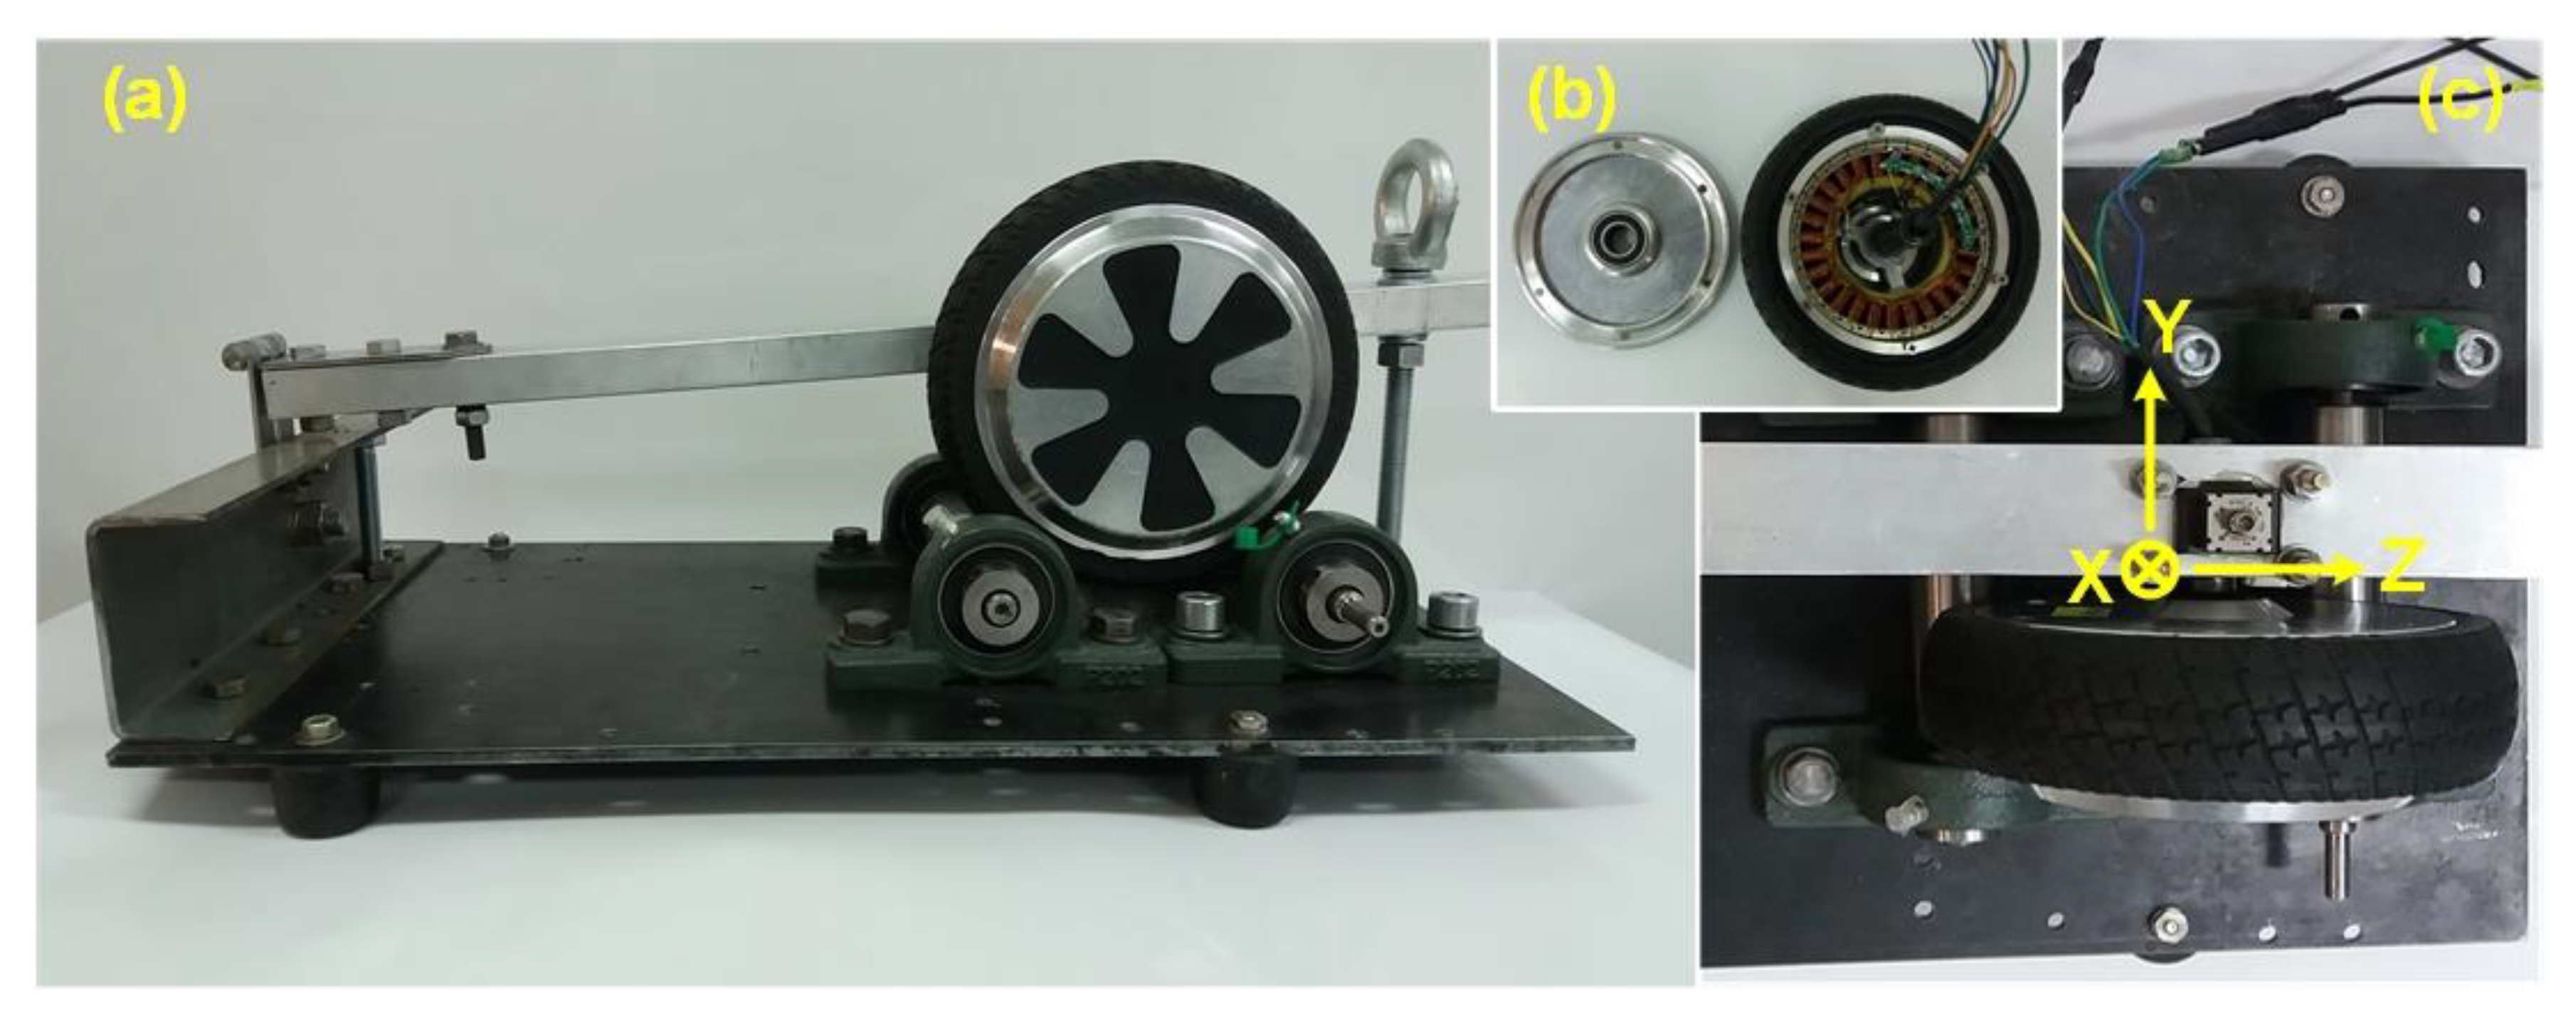
During the tests of the proposed methods a wheel embedded PM BLDC was used. The scheme of the laboratory setup is presented in Figure 2 and its general view in Figure 3. A slow-speed PM BLDC type motor, 350 W, 36 V supply voltage was used in the tests. Its characteristic features encompass a compact size and the fact that a motor axis is brought out at only one side of the casing. For the purpose of enabling drive tests also with a load, the tested motor was located on a pendulating arm which could press the external rubber tread of a rotor to metal rotating rolls. The pressing power was regulated by the appropriate fixing of a nut on the screw holding the pendulating arm. In the article, the elaboration of the discussed issue was limited only to drive operation without load, with a wheel rotating in the air. The reason why was the elimination of factors originating from the remaining mechanical part of the setup.
The interior of the motor is presented in Figure 3b. At the external rotor of the tested motor there are 15 pairs of permanent magnets and the stator has 27 slots and star-connected three-phase winding. Moreover, the manufacturer milled holes in the stator slots in which three rotor position sensors were placed every 120°, so that they could be optionally used by a controller. This type of a motor was selected for the research due its high popularity in commercial applications. Another reason for the choice of this motor construction was the easy disassembly of a cover at the motor axis side where the tested bearings were located (Figure 3b). The second bearing, located at the other side of the casing, was not changed. The tested PM BLDC motor was fed by a commercial controller used in electrical vehicles.
The motor was equipped with 6003 (2RS) type ball bearings. In the research, bearings with various types of damage were used (Figure 4):
- Bearing No 1—new with no modifications;
- Bearing No 2—new but lubricant was removed and next one side of the bearing was sanded, subsequently the remains of the sand were removed, and machine lubricant was used;
- Bearing No 3—new but lubricant was removed, and the bearing was damaged with a welder to simulate micro-pinholes. Characteristic heat discoloration was observed on the bearing which, after cooling down, was lubricated;
- Bearing No 4—its outer raceway was cut, and the moving bearing balls fell into this opening.
It should also be observed that the defects made were not selective, e.g., sanding encompassed all construction elements of the bearing. Similarly, during welding, the surge current flew from one raceway, through balls to the other raceway. Hence, the way bearings were prepared was different form that frequently presented in the literature (e.g., [34]) where selective faults were made, i.e., only a single bearing element was modified, which usually did not take place during normal operation.
In the detection of rolling bearing faults, the spectral analysis of vibration acceleration was used. For this purpose, a three-axial DeltaTron4506 type sensor, Brüel & Kjær, was used, it was located over a motor axis near a tested bearing. The distribution of the direction of measured vibration is presented in Figure 3c. In order to determine basic frequency fs of supply voltage of the motor and its rotational frequency fr also, the phase current of the motor was analysed. Measurement signals were recorded every 10 s, which allowed it to determine the vibration acceleration spectrum with 0.1 Hz resolution. Sampling frequency was 10.24 kHz, which resulted from the specifics of the used measurement card. For each damage case a few measurement series were conducted.
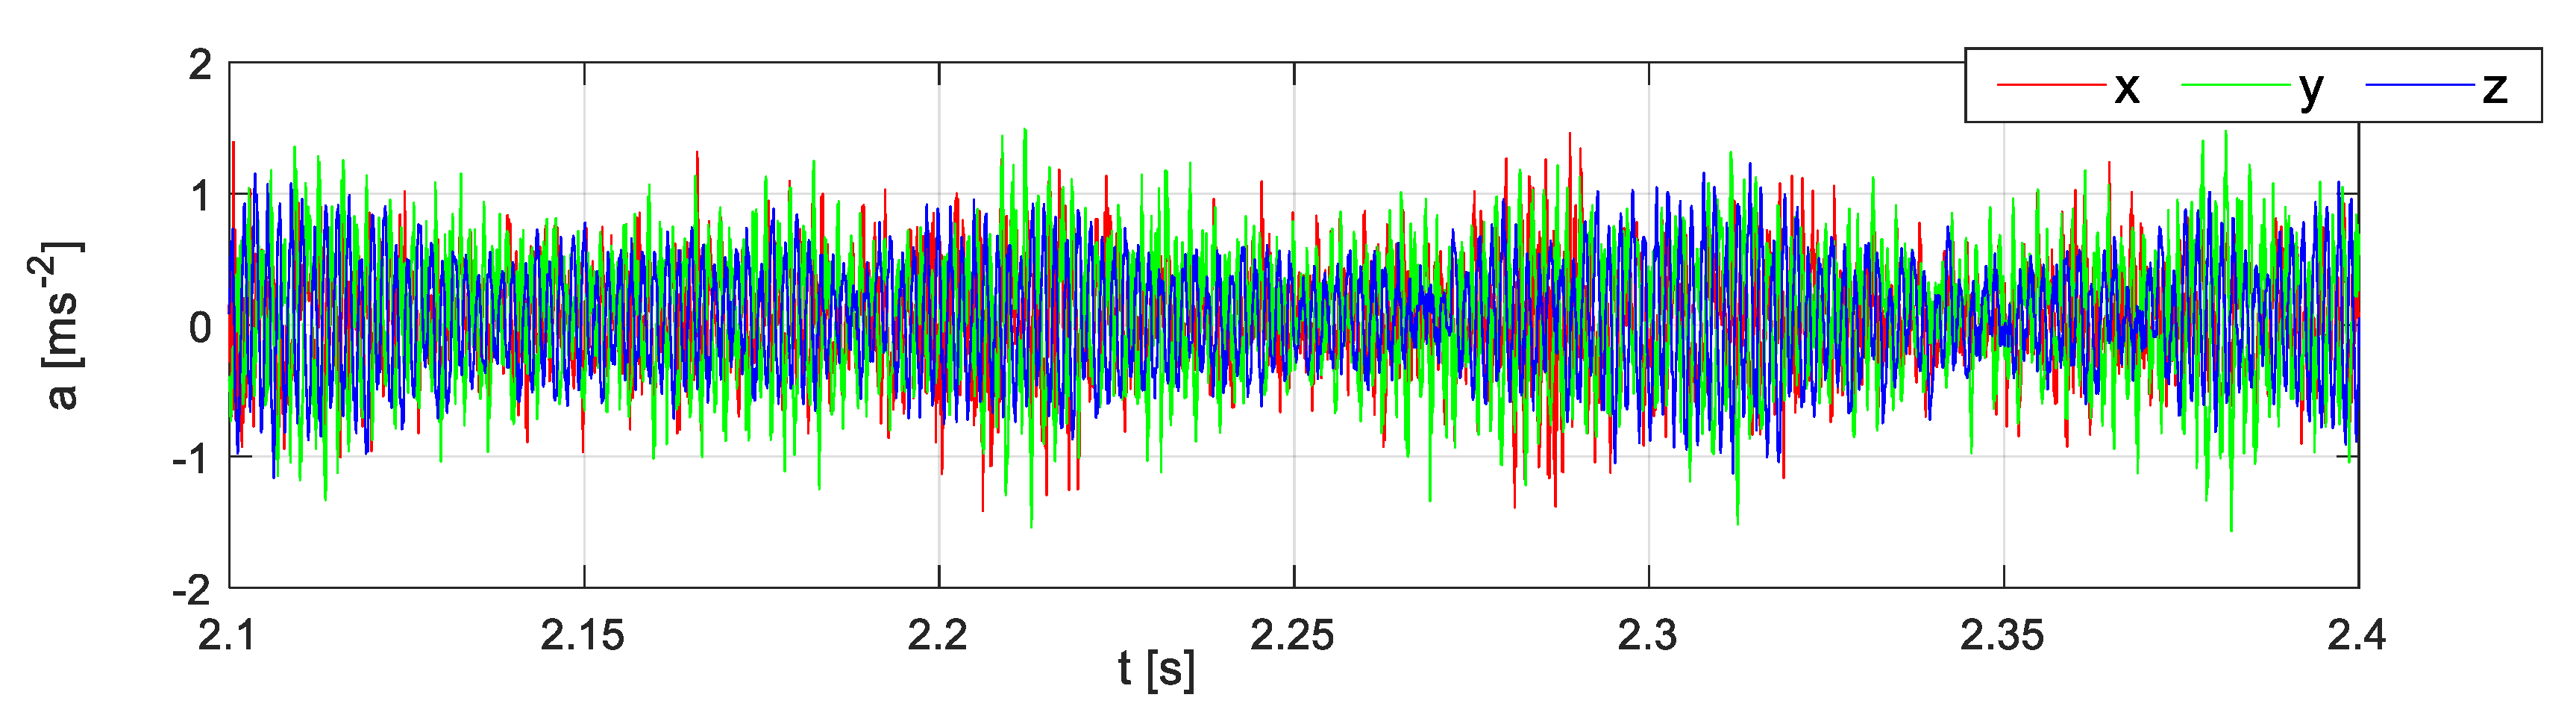
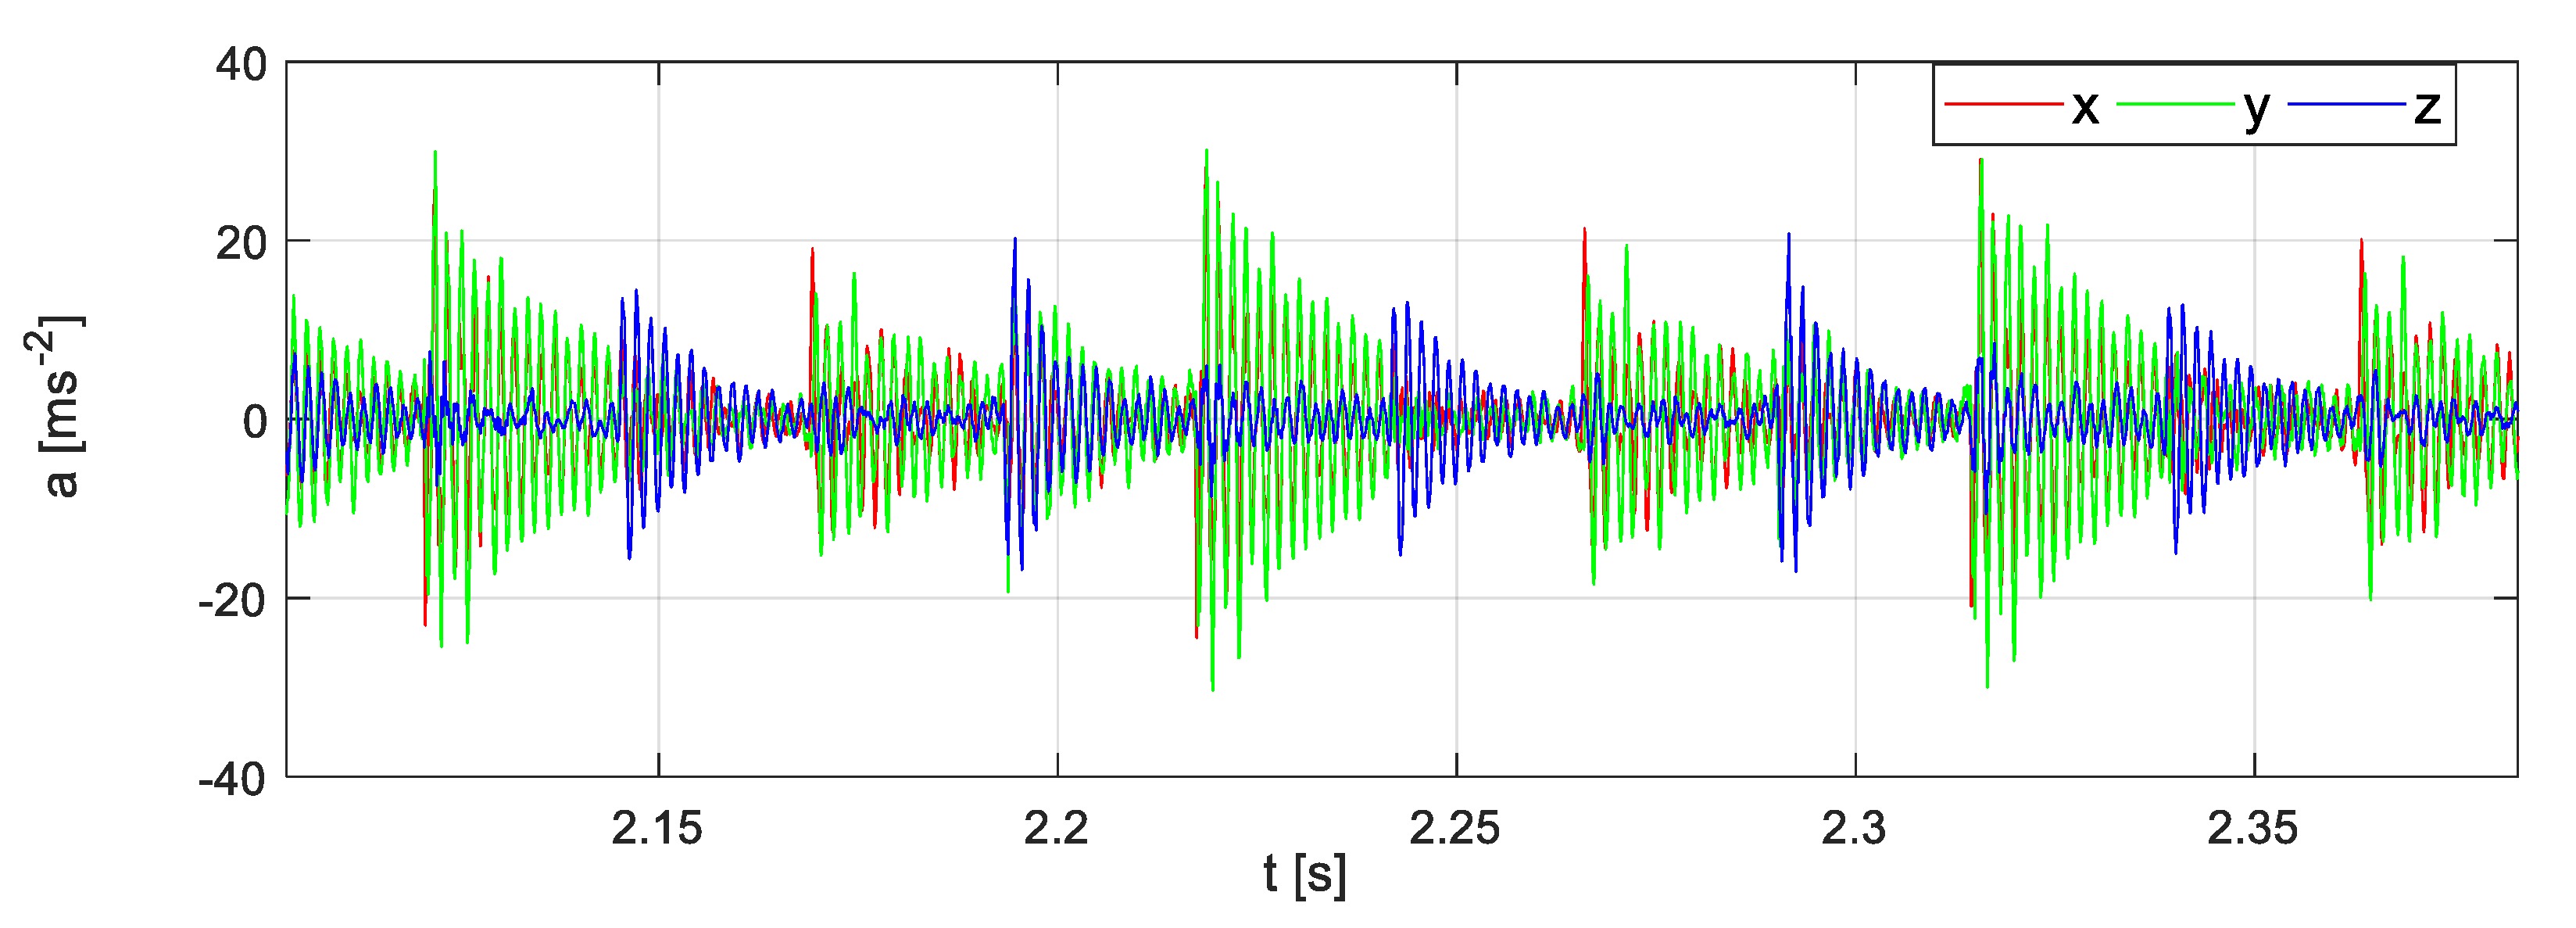
Figure 5 and Figure 6 present vibration acceleration waveforms recorded for an unloaded motor rotating at its maximum rotational speed for two different bearings—a new one (Figure 5) and the one with a cut outer raceway (Figure 6). In the latter case, even the time waveform clearly shows that periodical excitations occurred in the form of decaying vibration with relatively different amplitudes.
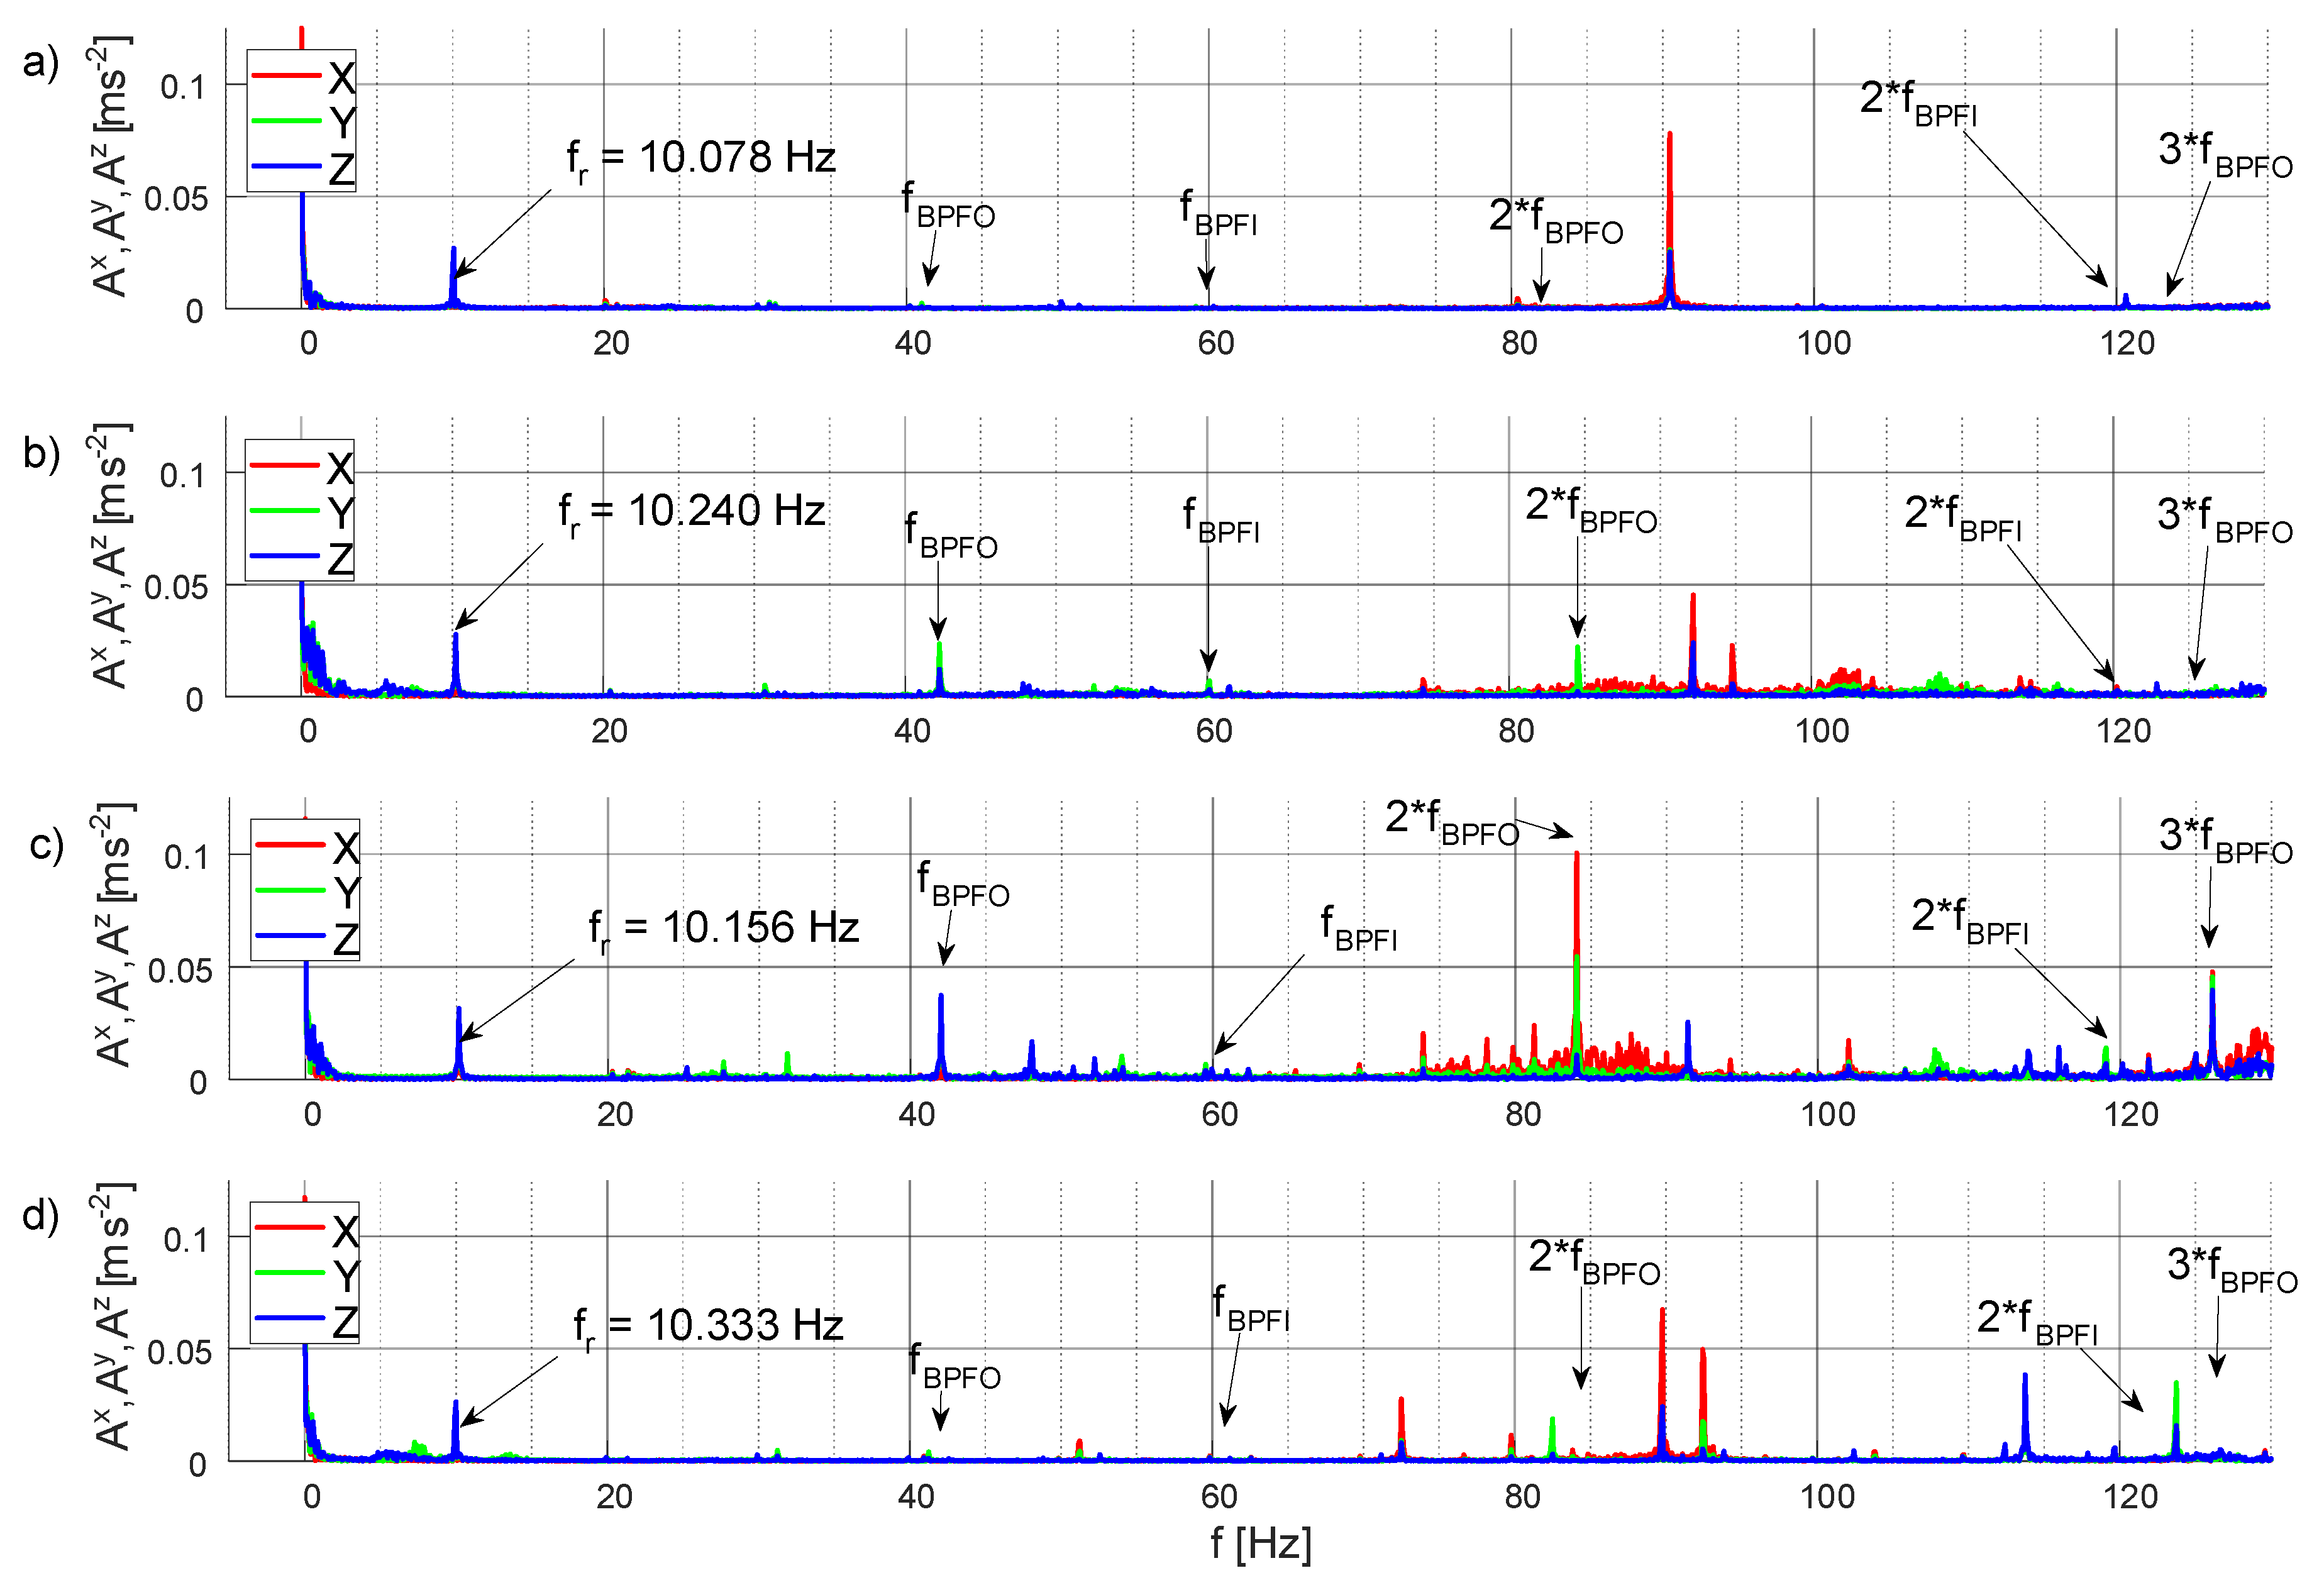
Figure 7 presents the amplitude spectra of vibration acceleration for four different bearings, obtained using the classical FFT analysis. In the cases presented in Figure 7, rotational frequency was similar, and it was about 10 Hz. For the tested bearing (according to dependence 1) it corresponds with basic fault frequencies approximately equal to 26.5 Hz (fBSF), 41 Hz (fBPFO) and 59 Hz (fBPFI). In Figure 7b,c, one can observe an increase in the amplitude for 42 Hz and 84 Hz frequencies (BPFO fault frequencies). In Figure 7d, it can be seen that despite a clear bearing fault (cut outer raceway), the basic amplitudes of fault frequencies did not increase. The results obtained show that the classic FFT analysis has limited capabilities in detecting bearing failures in the drive under consideration, even in the case of selective failures (Figure 7d).
Special software was developed for the analysis of the measurement data so as to automatically determine characteristic fault frequencies and their corresponding amplitudes. It consists of a module for measuring data acquisition operating in on-line mode and a calculation module for data analysis operating in off-line mode.
The calculation module enables the reading of measurement data and performing calculations using the selected signal processing method as well as the visualization of the obtained results of the frequency analysis with indication of frequencies related to damage symptoms. In addition to graphically comparing various calculation variants, the program module enables the automatic determination of faf failure frequencies associated with a given type of bearing failure. The operation of this part of the program consists in determining the theoretical value of the frequency faf according to (6), and then searching the spectrum in the surroundings of this frequency and detecting the frequency associated with the largest amplitude. The above analysis was carried out for three directions of vibration, the considered types of damage, various methods of signal processing, modulation coefficients m and values of the coefficient k. This resulted in a multidimensional set of results that can be analyzed in many ways.
5. Analysis of Measurement Data Using Selected Signal Processing Methods
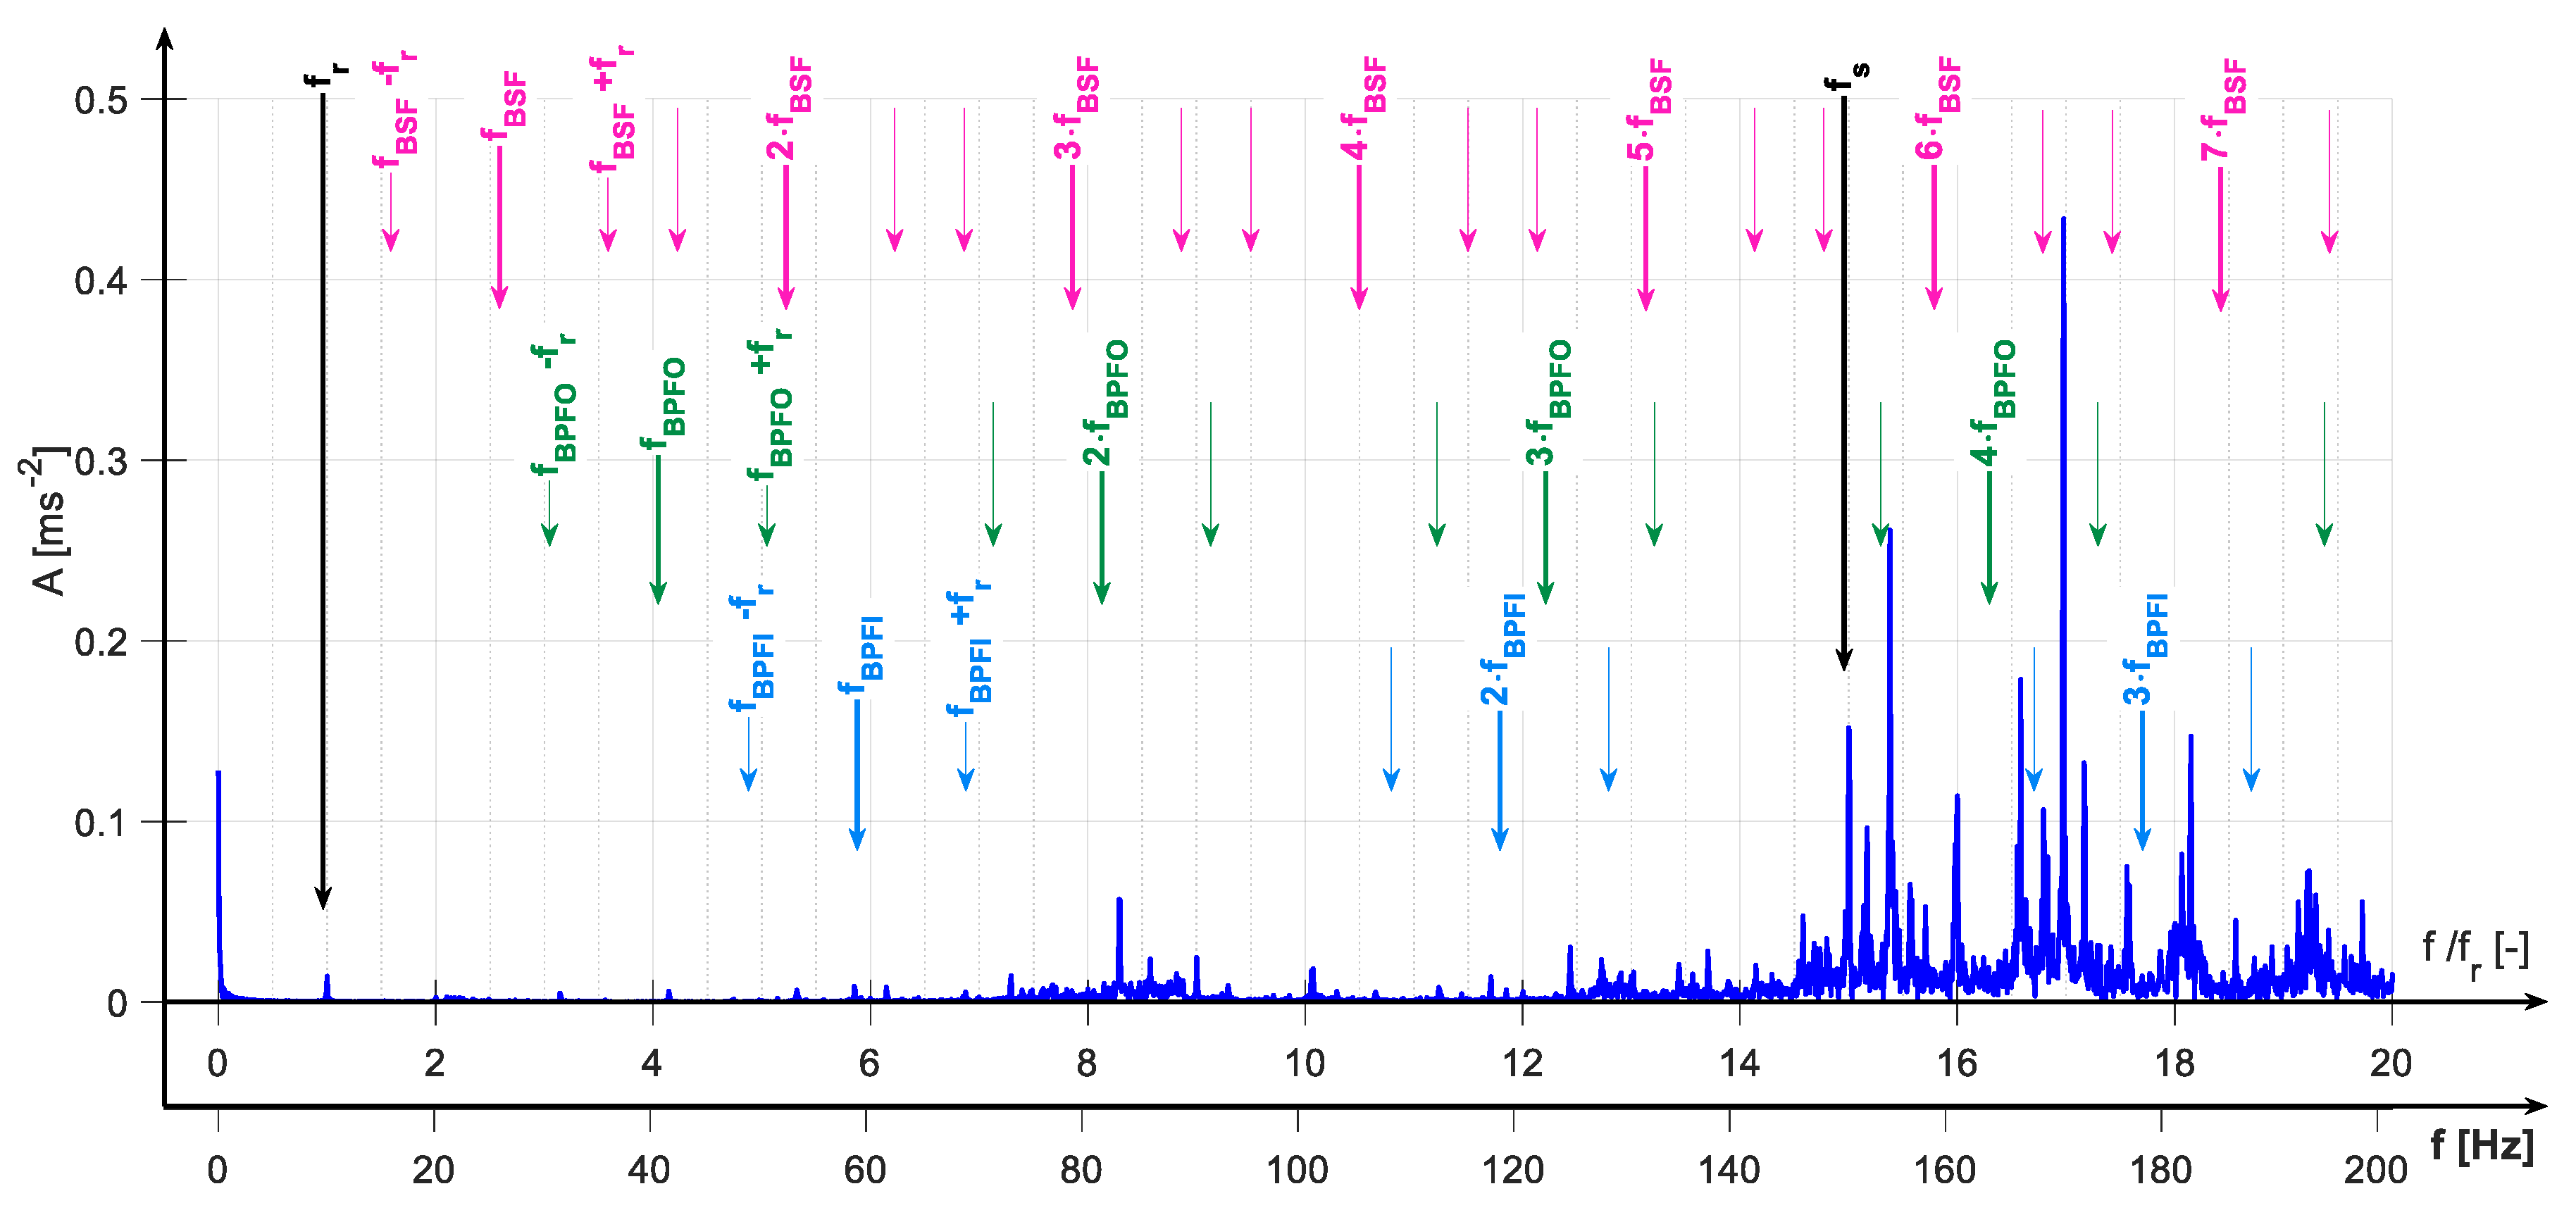
The use of additional vibration signal processing methods, apart from the frequency analysis (FFT), was to improve (facilitate) the extraction of fault frequencies fbf and their basic multiplicities which in diagnostics are more significant than frequencies with amplitudes strengthened by the resonance phenomenon. Figure 8 presents the idea of searching for fault symptoms in bearing construction elements. With the aim of facilitating the analysis, apart from the axis scaled in Hz, a relative frequency axis was introduced, it was standardised with regards to rotor rotational frequency fr. This allows us to analyse cases in which supply frequency changes took place and, in consequence, the rotational frequency (motor controller operated without speed controller).
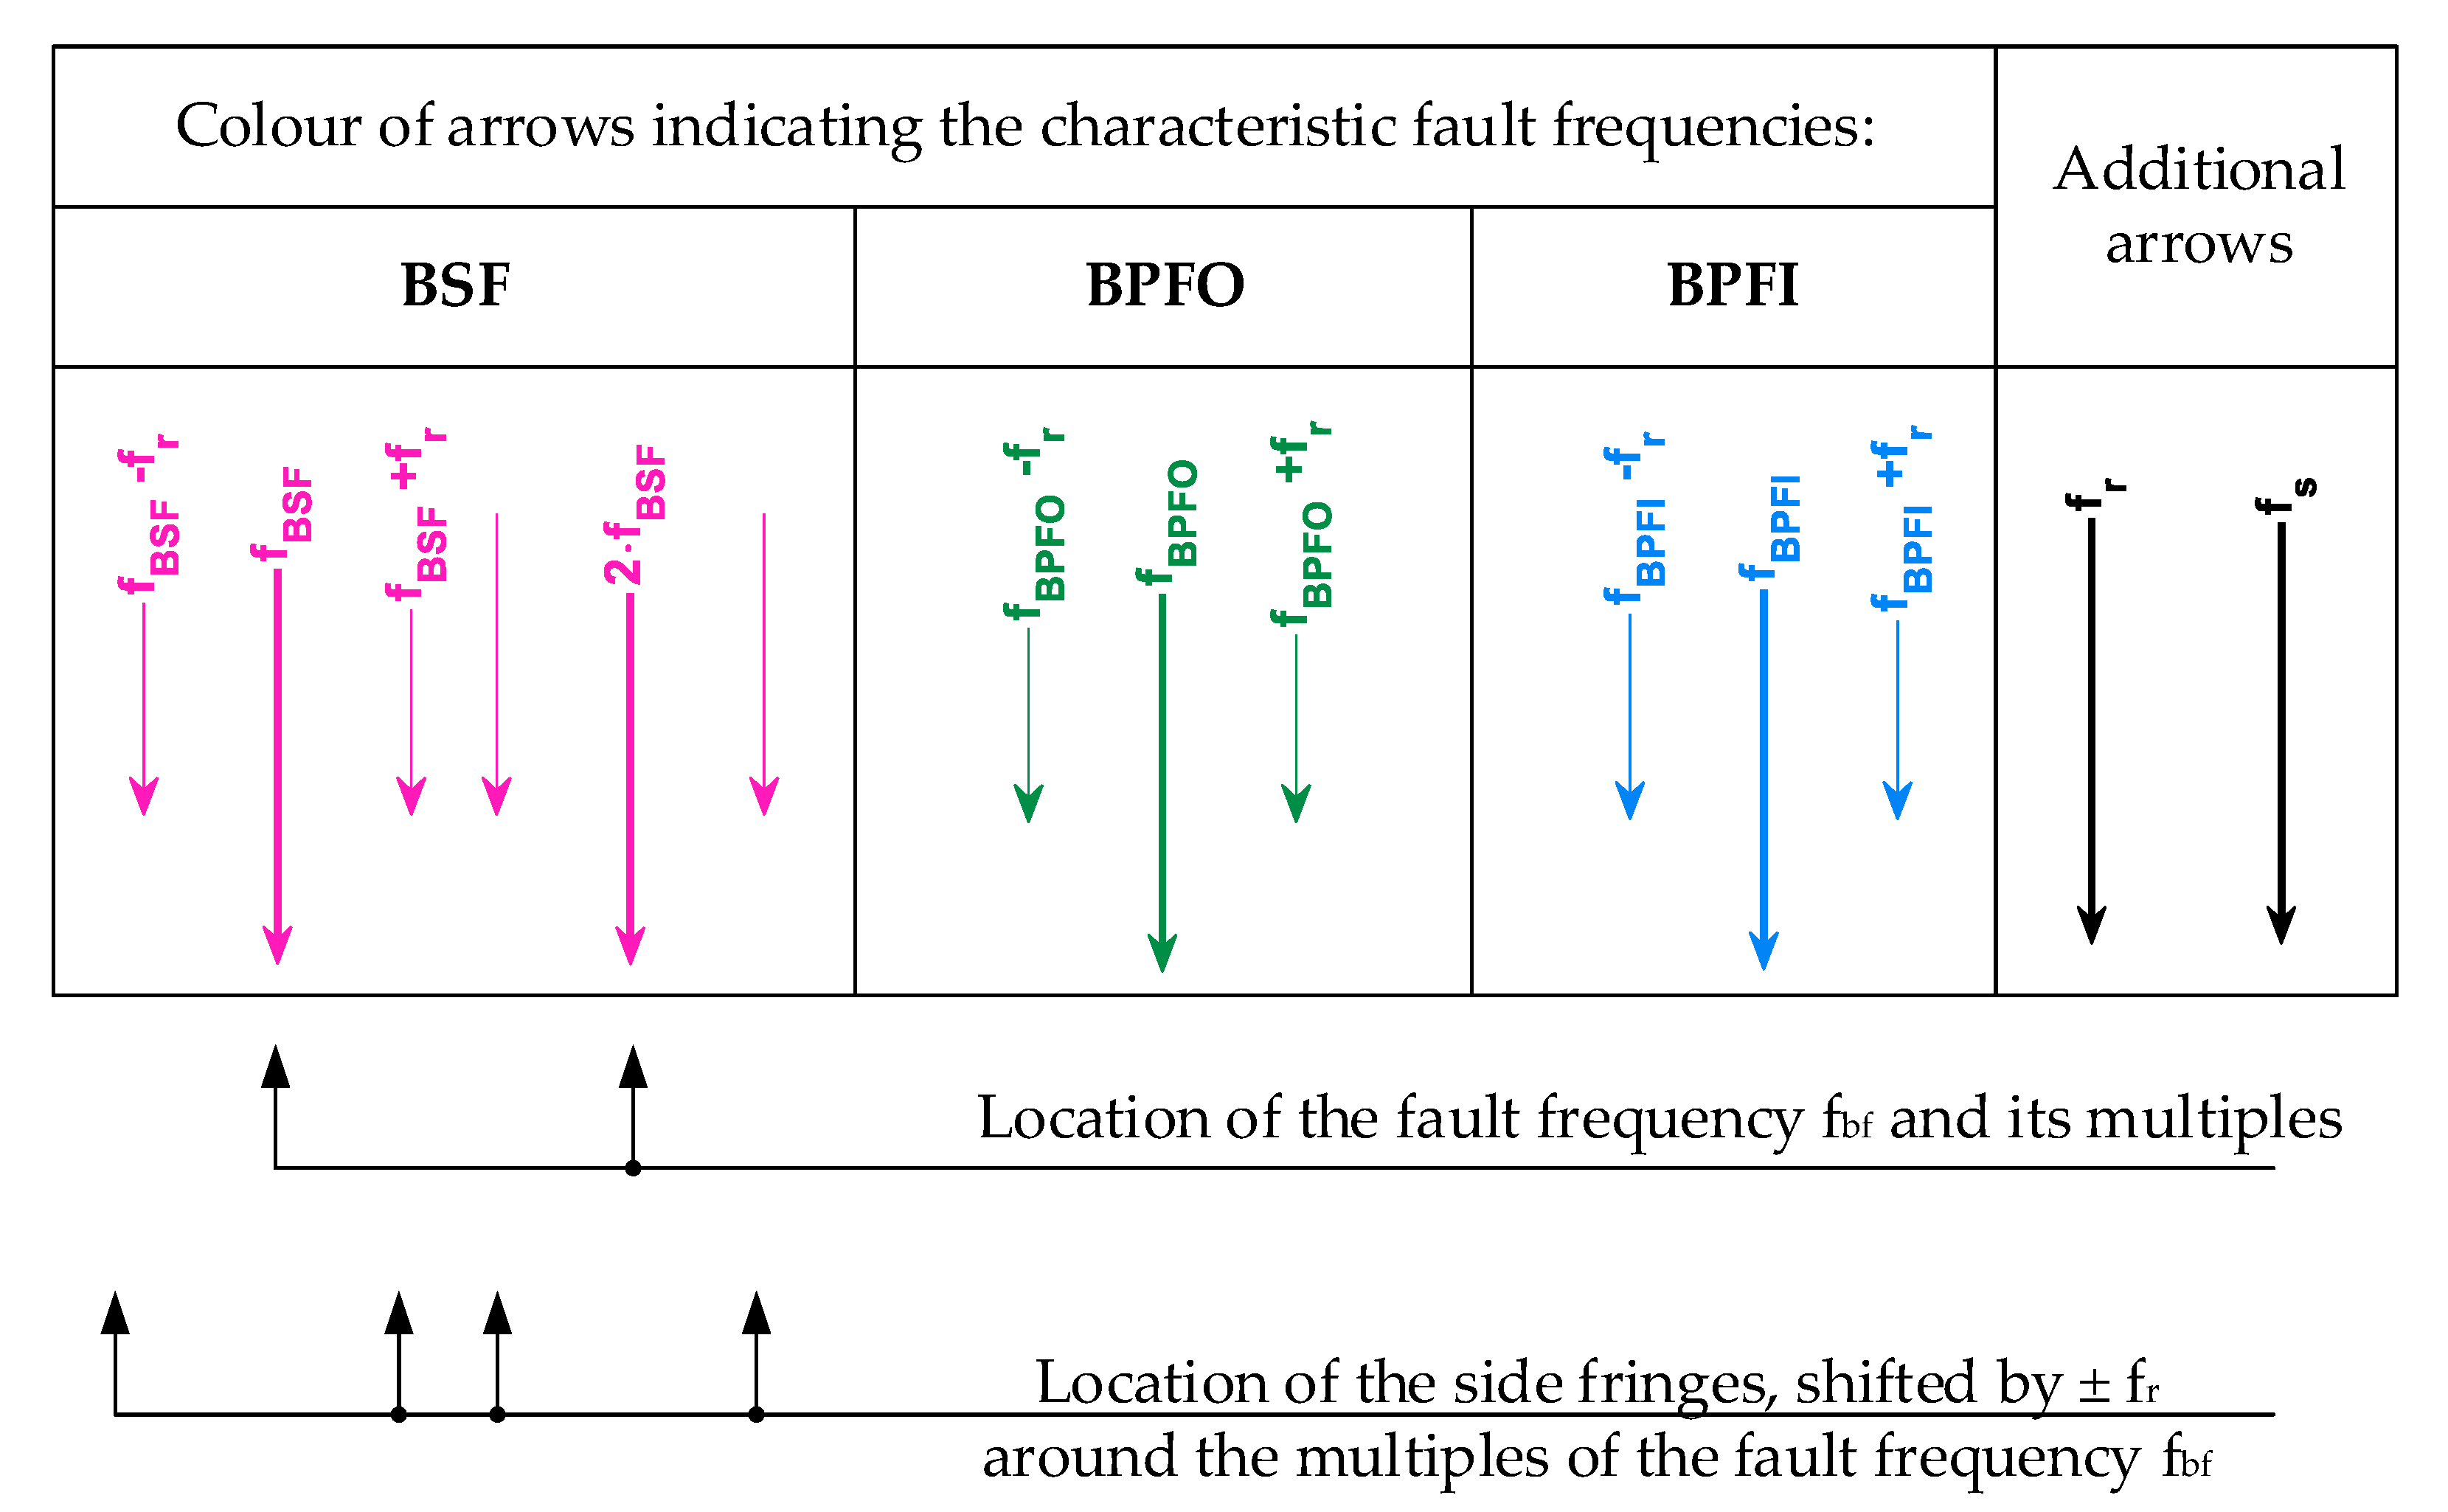
The arrows visible in Figure 8, mark frequencies determined as per dependencies (2–5), (1). According to the Figure 9 legend, colourful arrows mark frequencies which are the fault symptoms of particular elements.
In particular, pink arrows refer to the fault frequencies of the rolling element, dark green—outer raceway, blue—inner raceway. The arrows differ in length and thickness. The more evident ones (longer and thicker) refer to fault frequencies and their multiplicities, while the shorter ones—rotational frequency modulated components. Moreover, in Figure 8, black arrows mark the position of the basic harmonic (fs) of the current supply to the motor and rotational frequency (fr).
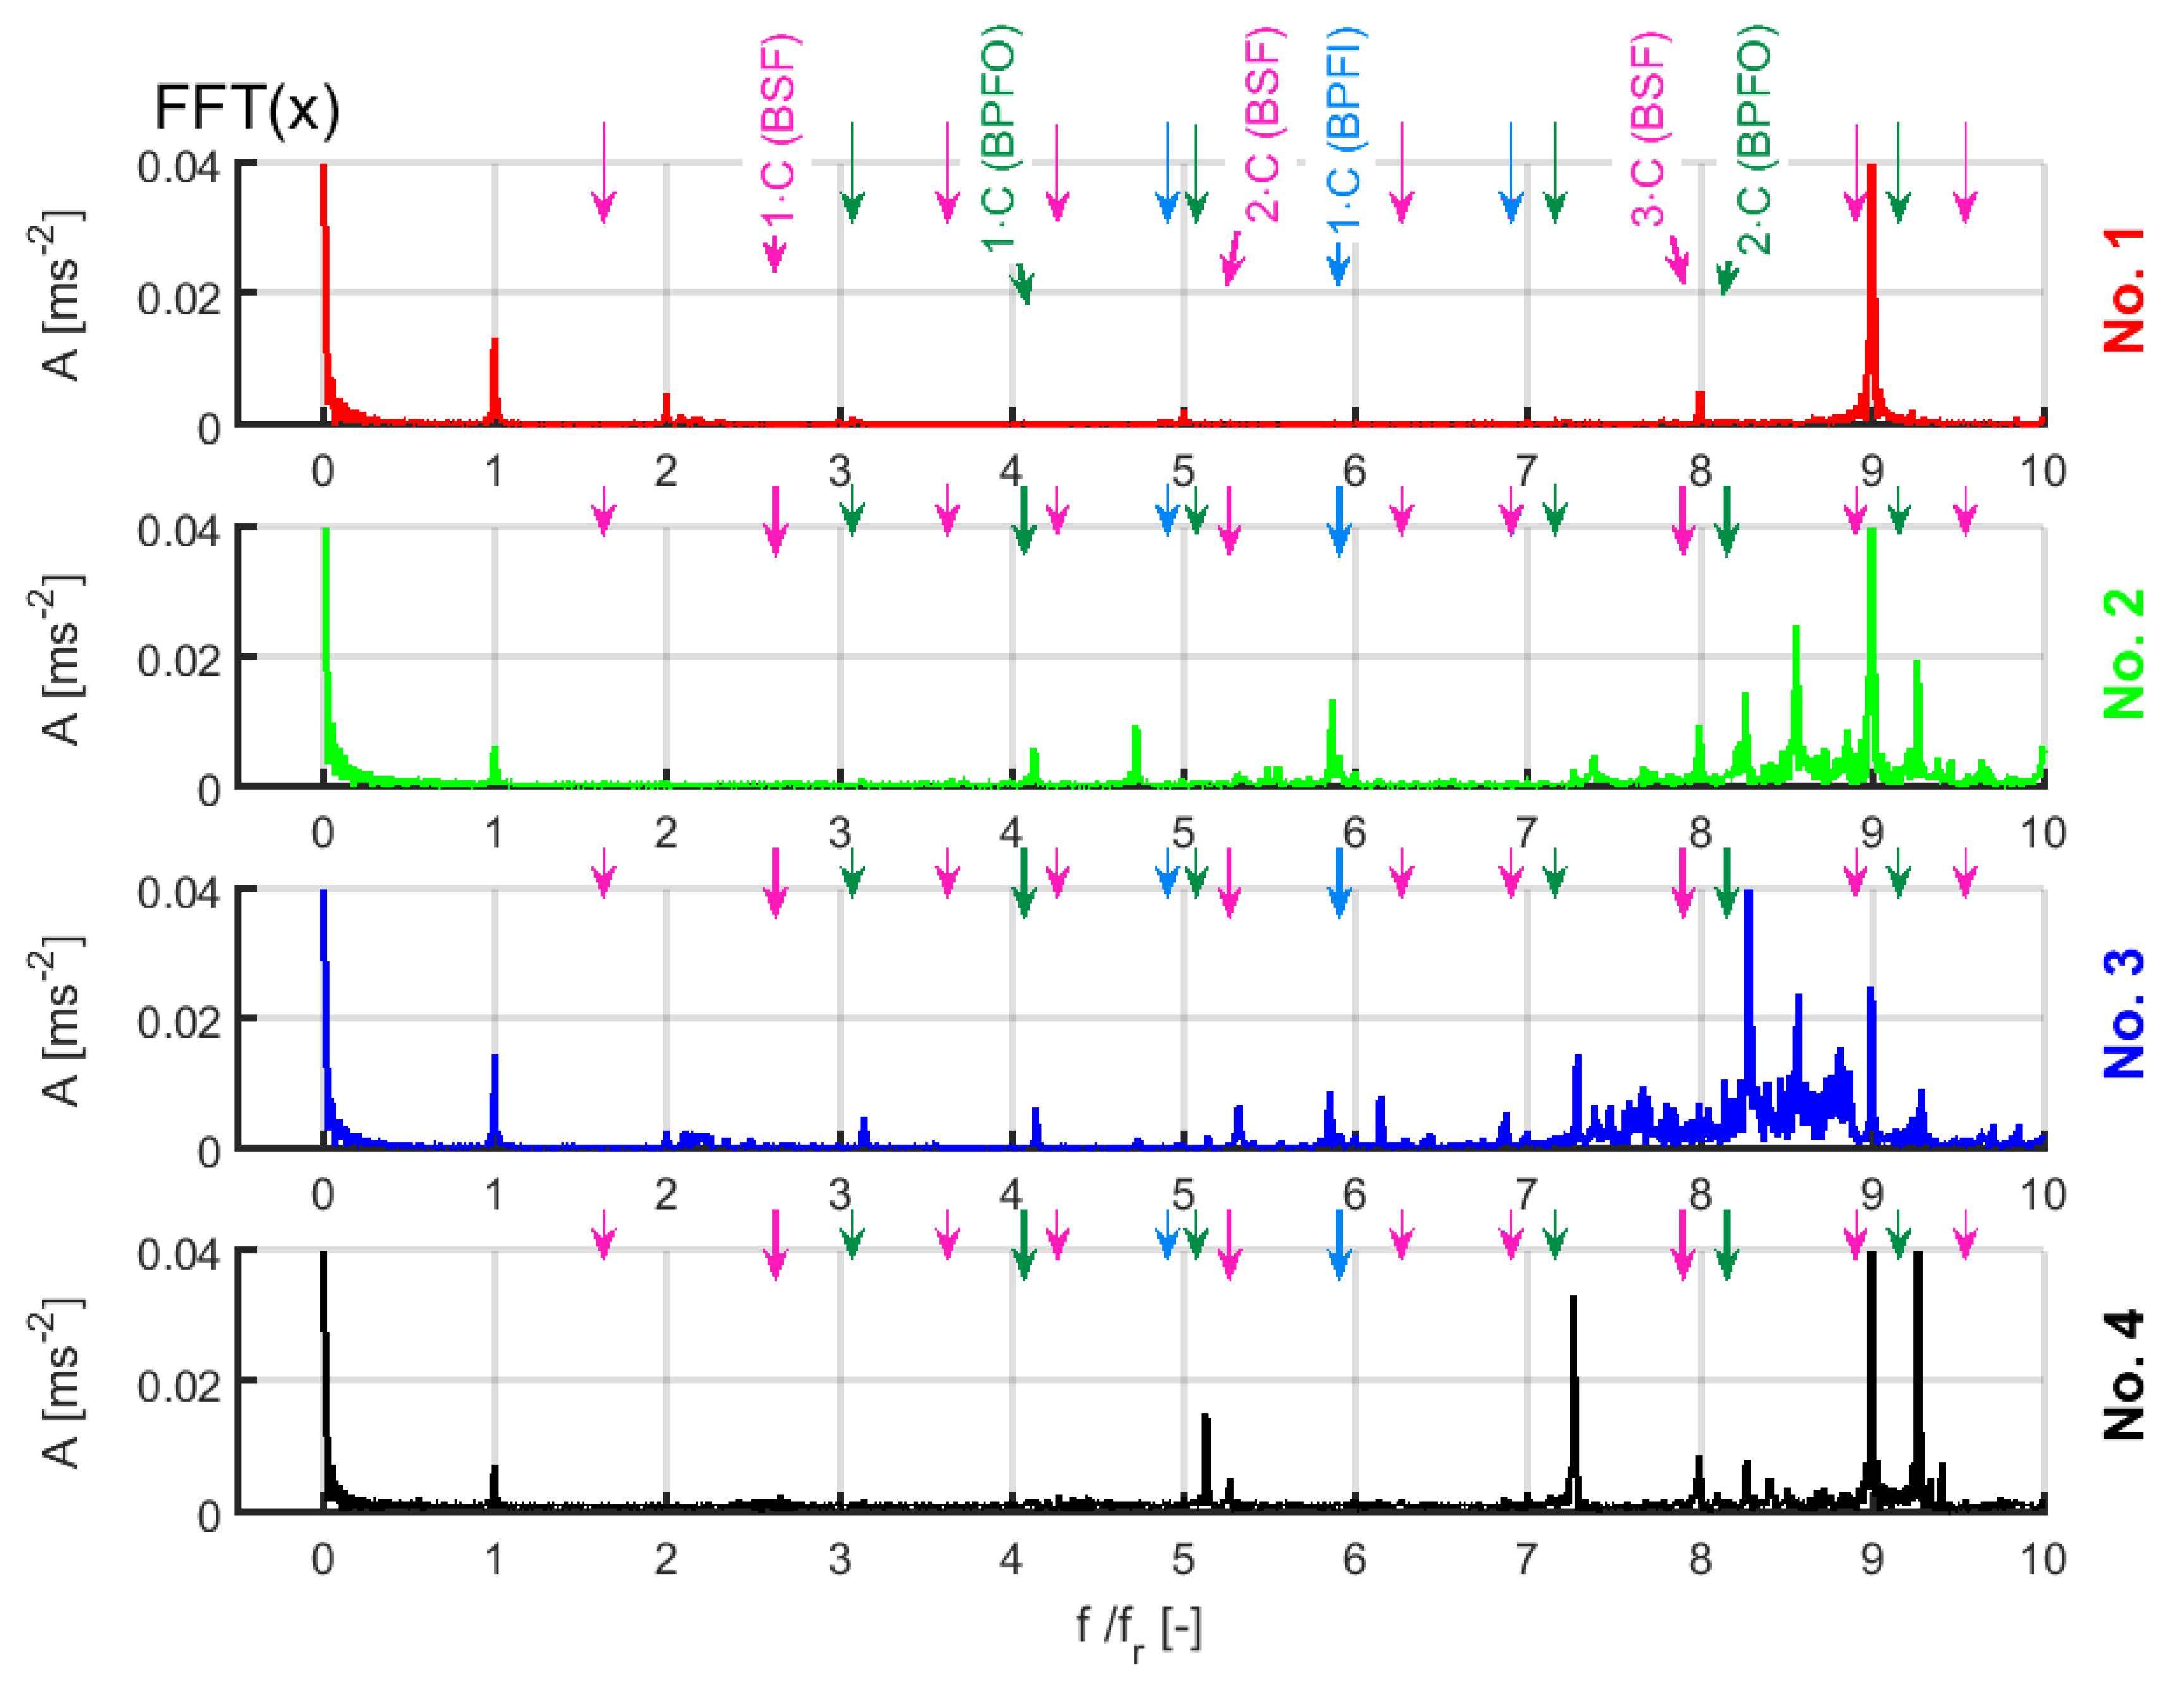
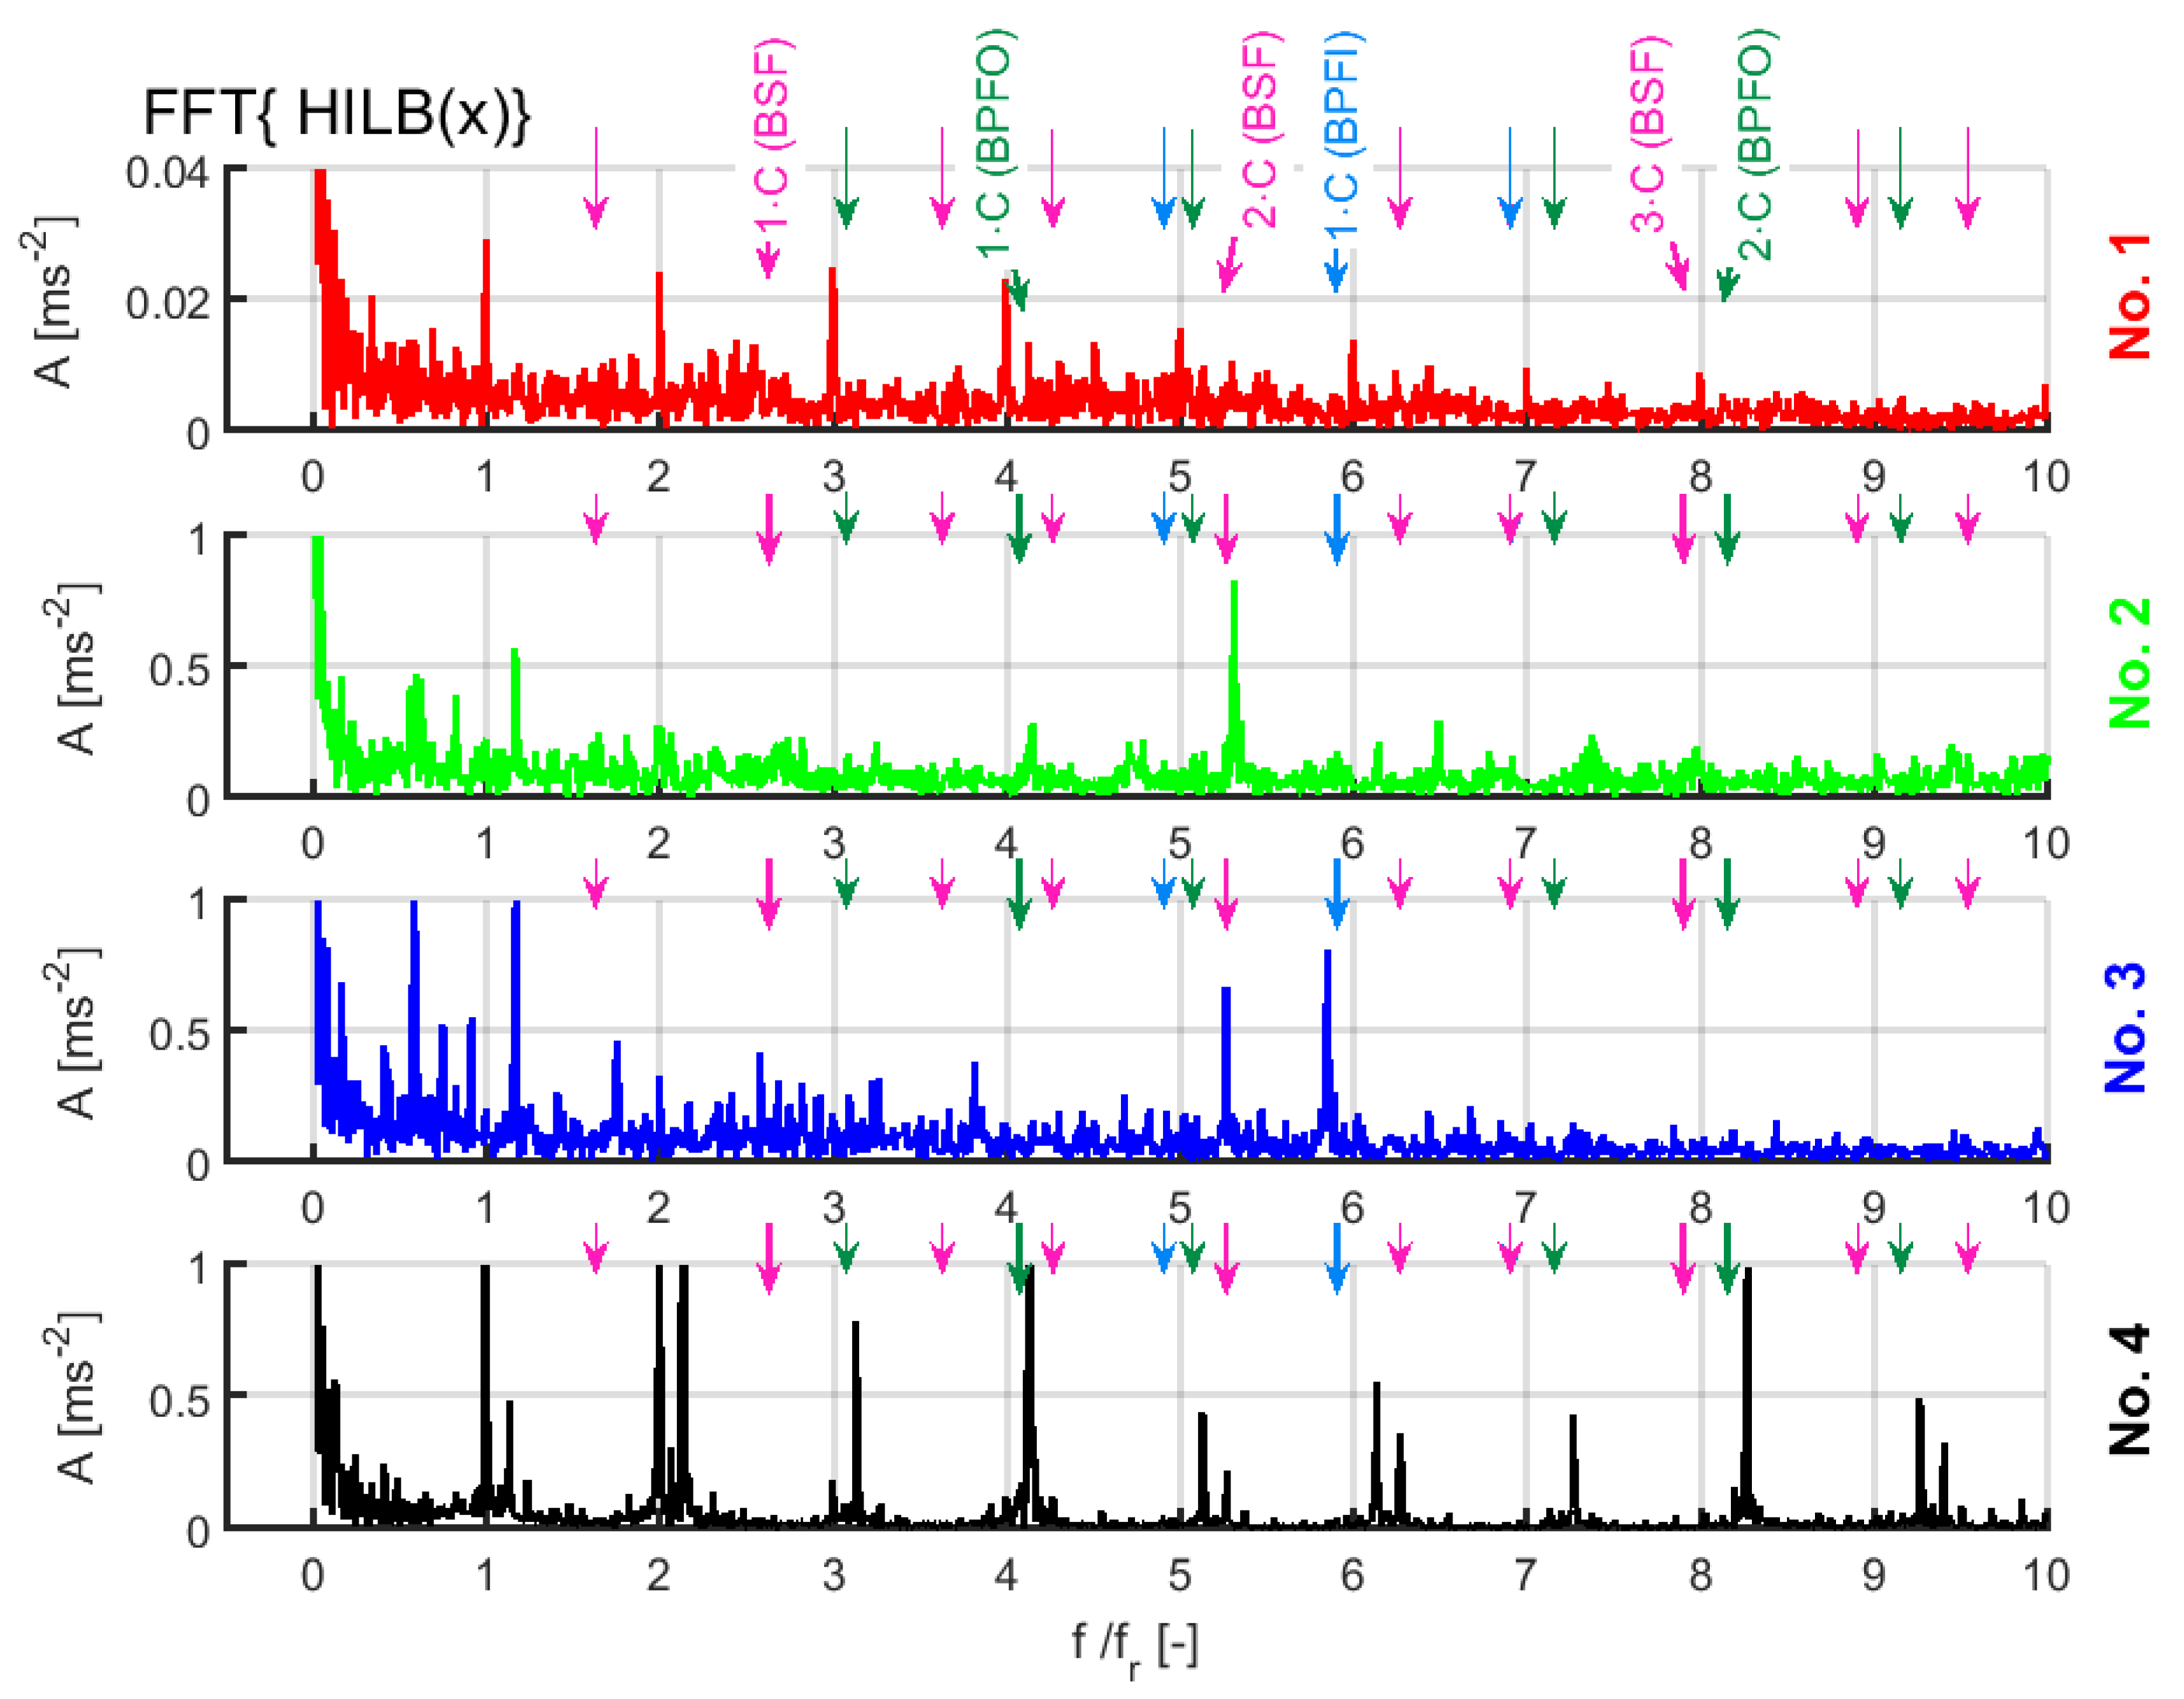
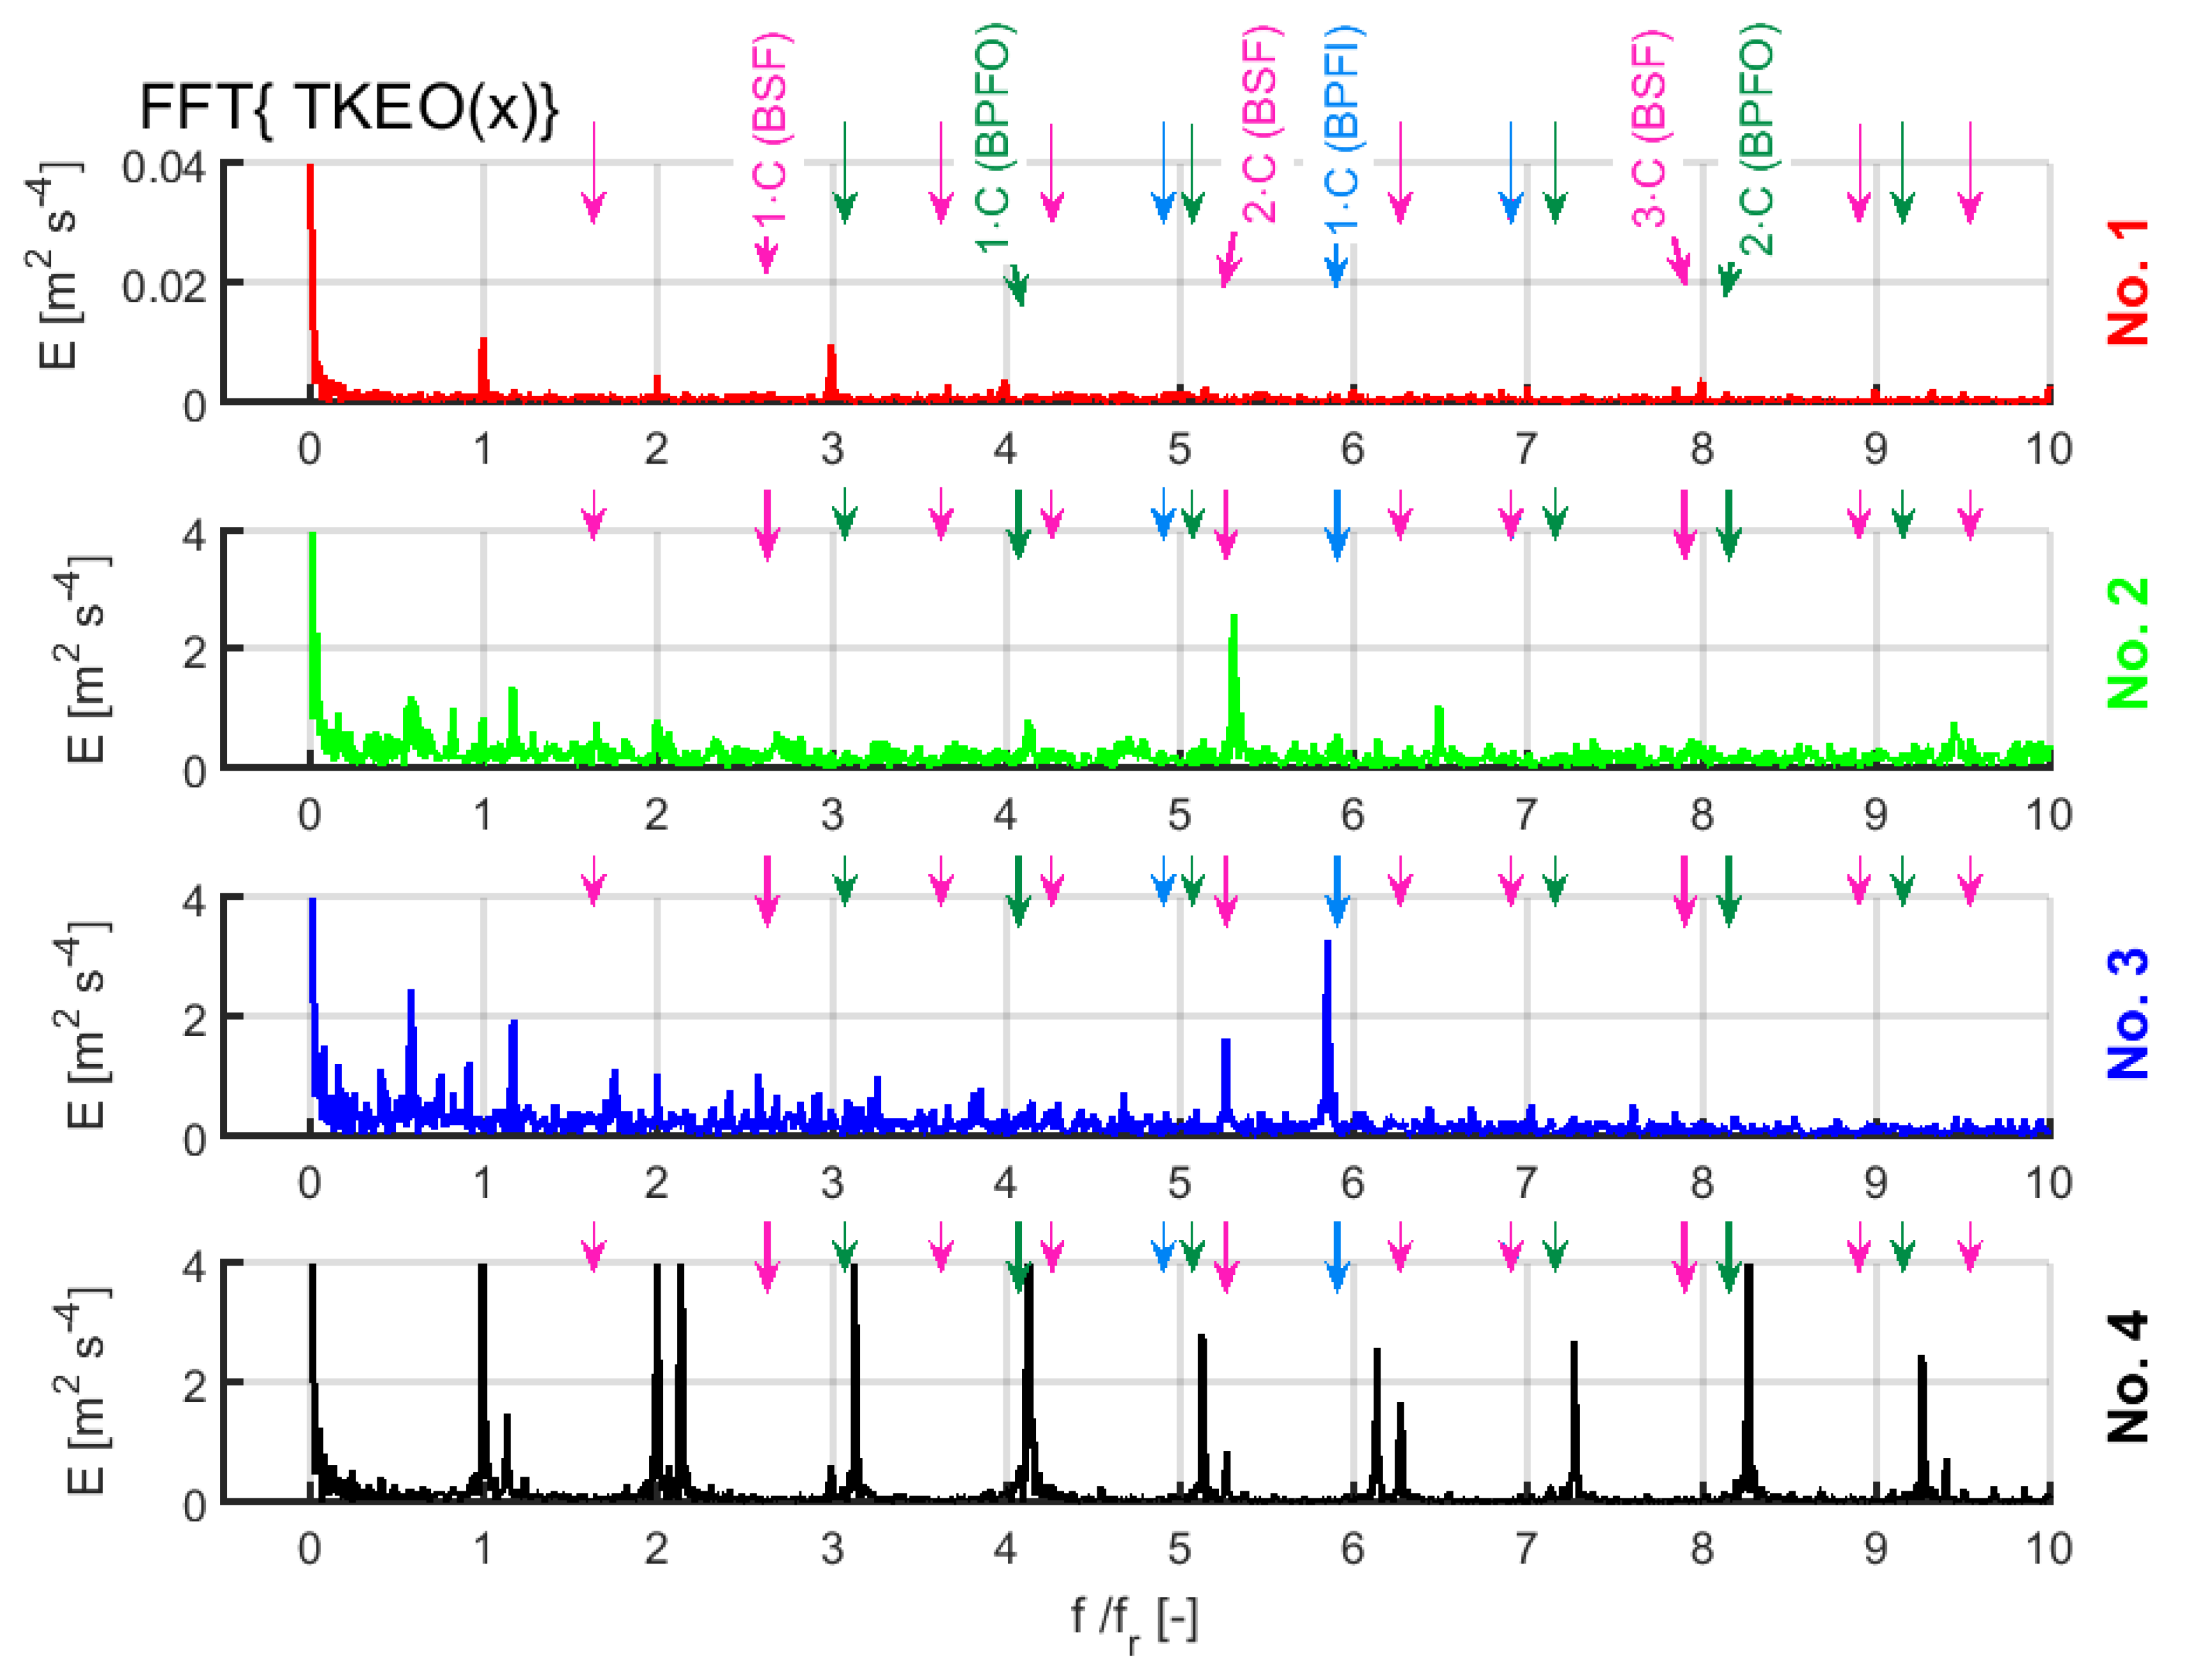
Figure 10, Figure 11, Figure 12 and Figure 13 present the results of analyses conducted for the considered methods:
- Figure 10—signal frequency analysis of vibration acceleration at axis X (FFT(x)),
- Figure 11—frequency analysis of module signal vibration acceleration at axis X (FFT{ABS(x)}),
- Figure 12—frequency analysis of module signal after transformation (Hilbert transform) of vibration acceleration at axis X (FFT{HILB(x)}),
- Figure 13—frequency analysis of signal vibration acceleration at axis X, TKEO filtered (FFT{TKEO(x)}), according to the relationship (20).
Due to the used standardized frequency axis, in the description only the values which were the multiplicities of factors Cbf, resulting from fbf/fr (1) division were marked. For the new bearing (No. 1), a different vertical axis scale was used do as to show the low level of fault components.
Additional signal processing methods emphasize an increase in the amplitudes of characteristic fault frequencies in modified bearings in comparison with the classical spectrum analysis (FFT). The most important changes can be observed for basic fault frequencies and a few of their subsequent multiplicities. In the case of the bearing with cut outer raceway, one can observe a strong influence of the amplitude modulation of rotational frequency. In the remaining cases the said rotational frequency modulation effect is not so clear, hence Figure 14 presents a summary collation of data taking into consideration only fault frequency changes from the basic to the fifth multiplicity.
The collation shows the vibration amplitudes of axis X determined using the four considered methods for three tested faults of bearing construction elements (BPFO, BSF, BPFI). The spectra were analysed to find amplitudes near frequencies (m = 0 acc. (6)), additionally, the initial search area had a width of 1 Hz and at the place of the expected band it was successively widened. The curves referring to each of the four tested bearings were marked with different colours, according to descriptions in Figure 10, Figure 11, Figure 12 and Figure 13. The laboratory research was conducted a number of times for a given fault type, this is why in the figure, there are many curves in the same colour. The collation presents the results in relative units where the base value was the average value of characteristic fault frequencies for an unfaulty bearing. The analysis of the summary collation (Figure 14) confirms the conclusion formulated on the basis of Figure 10, Figure 11, Figure 12 and Figure 13, namely, that the use of additional vibration signal processing strengthens the amplitudes of initial fault frequency multiplicities, which decisively facilitates fault detection and bearing condition assessment. In the case of selective faults (bearing No. 4—cut outer raceway), the largest amplitude changes were observed for frequencies k·fr·C(BPFO). Non-selective faults (bearings No. 2 and No. 3) were characterised by an increase in the amplitudes of all fault frequencies. It was related to the way of damaging a bearing because all of its construction elements underwent degradation during sanding or surge current flow. The largest amplitude changes were observed for the TKEO method in this case. The comparison shows that the smallest changes in the amplitudes of the characteristic fault frequencies were observed for the classic FFT analysis of vibration acceleration signals. In the presented case, a 10 ÷ 30-fold increase in the amplitudes of characteristic frequencies was observed. The use of additional proposed signal processing methods caused an approximately 200-fold increase in the amplitudes of characteristic fault frequencies for the damage to the outer race (FFT {ABS (x)}, FFT {HILB (x)}). The largest changes in the amplitudes of characteristic frequencies were observed for the TKEO method. In this case, the largest amplitudes were even approx. 4000 times greater than for an intact motor. In the case of rolling element faults, the most significant vibration acceleration amplitude increases occurred for the even multiplicities of fault frequencies (k = 2, k = 4 column BSF) in the three analysed methods. This is in accordance with the results of other research, among others, is presented in [20].
Summarizing, the comparative studies of the methods discussed in this article show that the use of additional processing methods allows us to obtain a large amplification of the characteristic frequencies amplitudes in comparison to the amplitudes obtained with the classic FFT, which is especially important when analyzing damage to bearings in this class and power motors. Therefore, bearing condition assessment is more efficient.
6. Summary
This paper presents the results of research on vibration in a PM BLDC motor embedded in a wheel directed to finding a simple method allowing to detect the faults in bearing construction elements. The analysis was conducted on a vibration acceleration signal measured with a three-axial sensor. Additionally, for the purpose of determining the supply frequency and motor rotational frequency, one of the phase currents was registered and analysed. In the research, four bearings were used, including one new and three modified ones. The cases recorded during motor operation without load at high rotational speed indicate that for each of the considered faults the characteristic fault frequencies related to bearing geometry occurred. The assessment of the amplitudes of these frequencies with the use of the classical FFT spectrum analysis was limited even in the case of large faults (a few or more than ten-fold relative amplitude changes). This is why the focus was on searching for other simpler methods of vibration signal analysis, which would better distinguish characteristic frequencies and facilitate the assessment of their amplitudes. It was shown that the use of an additional signal processing method, based on the Hilbert transform, TKEO filter or the absolute value transform, allows to better monitor bearing condition. The relative amplitude increased during the observations conducted using these methods, the changes were at the level of several dozen and several hundred times, and sometimes, in the case of TKEO—several thousands. The proposed methods were not demanding in terms of calculations (with the exception of the Hilbert transform which requires additional integration) and in the microprocessor implementation they can be used as bearing fault detectors operating in the online mode. Thus, the authors believe that the comparison and assessment of the effectiveness of the known methods of processing the vibration signal generated by bearings built into the wheel (inverted treadmill motion) driven by a low-power PM BLDC motor, presented in this paper, can be regarded as a novelty in this field of research.
The research results presented in this article concerned the case of an unloaded motor operating at a constant rotational speed. The impact of load torque, variable speed and track condition will be taken into account in subsequent tests. The development of a simple autonomous diagnostic system, in which the assessment of bearing condition, based on vibration and other signal analysis, will constitute an important part, is also planned. These activities can include, among others, experience in condition monitoring of railway tracks systems [35].
Author Contributions
Investigation, M.S. and P.E.; methodology, M.S. and P.E.; validation, M.S. and P.E.; visualization, M.S. and P.E.; writing—original draft, M.S., P.E. and C.T.K.; validated the obtained results, C.T.K.; supervision, C.T.K.
Funding
This research was supported by statutory funds of the Faculty of Electrical Engineering of the Wroclaw University of Science and Technology (2019).
Conflicts of Interest
The authors declare no conflicts of interest.
References
- Florez, D.; Carrillo, H.; Gonzalez, R.; Herrera, M.; Hurtado-Velasco, R.; Cano, M.; Roa, S.; Manrique, T. Development of a Bike-Sharing System Based on Pedal-Assisted Electric Bicycles for Bogota City. Electronics 2018, 7, 337. [Google Scholar] [CrossRef]
- Yedamale, P. Brushless DC (BLDC) Motor Fundamentals; Microchip Technology Application Note-AN885; Microchip Technology, Inc.: Chandler, AZ, USA, 2003; pp. 1–20. Available online: http://ww1.microchip.com/downloads/en/Appnotes/00885a.pdf (accessed on 4 November 2019).
- Boškoski, P.; Musizza, B.; Petrovčič, J.; Juričić, Đ. Bearing fault detection in brushless DC motors: A sensitivity study. In Proceedings of the 10th International PhD Workshop on Systems and Control, Hluboká and Vitavou, Czech Republic, 22–26 September 2009. [Google Scholar]
- Lu, S.; Wang, X. A New Methodology to Estimate the Rotating Phase of a BLDC Motor with Its Application in Variable-Speed Bearing Fault Diagnosis. IEEE Trans. Power Electron. 2018, 33, 3399–3410. [Google Scholar] [CrossRef]
- Fico, V.M.; Vázquez, A.L.R.; Prats, M.Á.M.; Bernelli-Zazzera, F. Failure Detection by Signal Similarity Measurement of Brushless DC Motors. Energies 2019, 12, 1364. [Google Scholar] [CrossRef]
- Tavner, P.; Ran, L.; Penman, J.; Sedding, H. Condition Monitoring of Rotating Electrical Machines, 2nd ed.; IET Power and Energy Series; Institution of Engineering and Technology: London, UK, 2008; Volume 56. [Google Scholar] [CrossRef]
- Kammermann, J.; Bolvashenkov, I.; Schwimmbeck, S.; Herzog, H.-G. Reliability of induction machines: Statistics, tendencies, and perspectives. In Proceedings of the IEEE 26th International Symposium on Industrial Electronics (ISIE), Edinburgh, UK, 19–21 June 2017; pp. 1843–1847. [Google Scholar] [CrossRef]
- Rajagopalan, S.; Restrepo, J.A.; Aller, J.M.; Habetler, T.G.; Harley, R.G. Selecting time-frequency representations for detecting rotor faults in BLDC motors operating under rapidly varying operating conditions. In Proceedings of the 31st Annual Conference of IEEE Industrial Electronics Society (IECON’2005), Raleigh, NC, USA, 6–10 November 2005; pp. 2585–2590. [Google Scholar] [CrossRef]
- Lee, S.; Hur, J. Detection technique for stator inter-turn faults in BLDC motors based on third-harmonic components of line currents. IEEE Trans. Ind. Appl. 2017, 53, 143–150. [Google Scholar] [CrossRef]
- Lee, S.; Kim, K.; Hur, J. Diagnosis technique for stator winding inter-turn fault in BLDC motor using detection coil. In Proceedings of the 9th International Conference on Power Electronics and ECCE Asia (ICPE-ECCE Asia), Seoul, Korea, 1–5 June 2015; pp. 2925–2931. [Google Scholar] [CrossRef]
- Dong, L.; Jatskevich, J.; Huang, Y.; Chapariha, M.; Liu, J. Fault Diagnosis and Signal Reconstruction of Hall Sensors in Brushless Permanent Magnet Motor Drives. IEEE Trans. Energy Convers. 2016, 31, 118–131. [Google Scholar] [CrossRef]
- Fang, J.; Li, W.; Li, H.; Xu, X. Online Inverter Fault Diagnosis of Buck-Converter BLDC Motor Combinations. IEEE Trans. Power Electron. 2015, 30, 2674–2688. [Google Scholar] [CrossRef]
- Rajagopalan, S.; Roux, W.; Habetler, T.G.; Harley, R.G. Dynamic Eccentricity and Demagnetized Rotor Magnet Detection in Trapezoidal Flux (Brushless DC) Motors Operating Under Different Load Conditions. IEEE Trans. Power Electron. 2007, 22, 2061–2069. [Google Scholar] [CrossRef]
- Leite, V.C.M.N.; Borges da Silva, J.G.; Veloso, G.F.C.; Borges da Silva, L.E.; Lambert-Torres, G.; Bonaldi, E.L.; de Oliveira, L.E.d.L. Detection of Localized Bearing Faults in Induction Machines by Spectral Kurtosis and Envelope Analysis of Stator Current. IEEE Trans. Ind. Electron. 2015, 62, 1855–1865. [Google Scholar] [CrossRef]
- Du, Y.; Chen, Y.; Meng, G.; Ding, J.; Xiao, Y. Fault Severity Monitoring of Rolling Bearings Based on Texture Feature Extraction of Sparse Time–Frequency Images. Appl. Sci. 2018, 8, 1538. [Google Scholar] [CrossRef]
- Wang, G.; Gu, F.; Rehab, I.; Ball, A.; Li, L. A Sparse Modulation Signal Bispectrum Analysis Method for Rolling Element Bearing Diagnosis. Math. Probl. Eng. 2018, 2018, 2954094. [Google Scholar] [CrossRef]
- Gelman, L.; Patel, T.; Murray, B.; Thomson, A. Rolling Bearing Diagnosis Based on the Higher Order Spectra. Int. J. Progn. Health Manag. 2013, 4, 2153–2648. [Google Scholar]
- Lou, X.; Loparo, K.A. Bearing fault diagnosis based on wavelet transform and fuzzy inference. Mech. Syst. Signal Process. 2004, 18, 1077–1095. [Google Scholar] [CrossRef]
- Eren, L.; Karahoca, A.; Devaney, M.J. Neural Network Based Motor Bearing Fault Detection. In Proceedings of the Instrumentation and Measurement Technology Conference (IMTC), Camo, Italy, 18–20 May 2004; pp. 1657–1660. [Google Scholar] [CrossRef]
- Li, B.; Chow, M.-Y.; Tipsuwan, Y.; Hung, J.C. Neural-Network-Based Motor Rolling Bearing Fault Diagnosis. IEEE Trans. Ind. Electron. 2000, 47, 1060–1069. [Google Scholar] [CrossRef]
- Jin, X.; Zhao, M.; Chow, T.W.S.; Pecht, M. Motor Bearing Fault Diagnosis Using Trace Ratio Linear Discriminant Analysis. IEEE Trans. Ind. Electron. 2014, 61, 2441–2451. [Google Scholar] [CrossRef]
- Lu, S.; He, Q.; Yuan, T.; Kong, F. Online Fault Diagnosis of Motor Bearing via Stochastic-Resonance-Based Adaptive Filter in an Embedded System. IEEE Trans. Syst. Man Cybern. Syst. 2017, 47, 1111–1122. [Google Scholar] [CrossRef]
- Lu, S.; Qin, Y.; Hang, J.; Zhang, B.; Wang, Q. Adaptively Estimating Rotation Speed from DC Motor Current Ripple for Order Tracking and Fault Diagnosis. IEEE Trans Instrum. Meas. 2019, 68, 741–753. [Google Scholar] [CrossRef]
- Lee, C.-Y.; Hsieh, Y.-H. Bearing damage detection of BLDC motors based on current envelope analysis. Meas. Sci. Rev. 2012, 12, 290–295. [Google Scholar] [CrossRef]
- Abed, W.; Sharma, S.; Sutton, R. Diagnosis of bearing fault of brushless DC motor based on dynamic neural network and orthogonal fuzzy neighborhood discriminant analysis. In Proceedings of the 2014 UKACC International Conference on Control (CONTROL), Loughborough, UK, 9–11 July 2014; pp. 378–383. [Google Scholar] [CrossRef]
- Abu-Rub, H.; Ahmed, S.M.; Iqbal, A.; Toliyat, H.A.; Rahimian, M.M. Incipient bearing fault detection for three-phase Brushless DC motor drive using ANFIS. In Proceedings of the 8th IEEE Symposium on Diagnostics for Electrical Machines, Power Electronics & Drives, Bologna, Italy, 5–8 September 2011; pp. 620–625. [Google Scholar] [CrossRef]
- Zandi, O.; Poshtan, J. Brushless DC motor bearing fault detection using Hall effect sensors and a two-stage wavelet transform. In Proceedings of the 26th Iranian Conference on Electrical Engineering (ICEE2018), Mashhad, Iran, 8–10 May 2018; pp. 827–833. [Google Scholar] [CrossRef]
- Thakur, A.K.; Kundu, P.K.; Das, A. Comparative Study of Induction Motor Fault Analysis Using Feature Extraction. In Proceedings of the 2017 IEEE Calcutta Conference (CALCON), Kolkata, India, 2–3 December 2017; pp. 150–154. [Google Scholar] [CrossRef]
- Smith, S.W. Digital Signal Processing: A Practical Guide for Engineers and Scientists; Elsevier Science: Burlington, VT, USA, 2002. [Google Scholar] [CrossRef]
- Espinosa, A.G.; Rosero, J.A.; Cusid’o, J.; Romeral, L.; Ortega, J.A. Fault Detection by Means of Hilbert–Huang Transform of the Stator Current in a PMSM With Demagnetization. IEEE Trans. Energy Convers. 2010, 25, 312–318. [Google Scholar] [CrossRef]
- Pineda-Sanchez, M.; Puche-Panadero, R.; Riera-Guasp, M.; Perez-Cruz, J.; Roger-Folch, J.; Pons-Llinares, J.; Climente-Alarcon, V.; Antonino-Daviu, J.A. Application of the Teager–Kaiser Energy Operator to the fault diagnosis of induction motors. IEEE Trans. Energy Convers. 2013, 28, 1036–1044. [Google Scholar] [CrossRef]
- Boudraa, A.-O.; Salzenstein, F. Teager–Kaiser energy methods for signal and image analysis: A review. ELSEVIER Digit. Signal Process. 2018, 78, 338–375. [Google Scholar] [CrossRef]
- Rodríguez, P.H.; Alonso, J.B.; Ferrer, M.A.; Travieso, C.M. Application of the Teager–Kaiser energy operator in bearing fault diagnosis. ISA Trans. 2013, 52, 278–284. [Google Scholar] [CrossRef] [PubMed]
- Akar, M.; Hekim, M.; Orhan, U. Mechanical fault detection in permanent magnet synchronous motors using equal width discretization-based probability distribution and a neural network model. Turk. J. Electr. Eng. Comput. Sci. 2015, 23, 813–823. [Google Scholar] [CrossRef]
- Chudzikiewicz, A.; Bogacz, R.; Kostrzewski, M.; Konowrocki, R. Condition monitoring of railway track systems by using acceleration signals on wheelset axle-boxes. Transport 2018, 33, 555–566. [Google Scholar] [CrossRef]
Figure 1.
Analysis results for sample signal x for various additional processing methods: (a) time waveforms, (b) signal spectra after selected processing methods.
Figure 1.
Analysis results for sample signal x for various additional processing methods: (a) time waveforms, (b) signal spectra after selected processing methods.

Figure 2.
Block scheme of the laboratory setup.

Figure 3.
View of the setup used in tests: (a) general view, (b) tested motor interior with the disc on which tested bearings were placed, (c) aerial view with marked accelerometer measurements axes directions.
Figure 3.
View of the setup used in tests: (a) general view, (b) tested motor interior with the disc on which tested bearings were placed, (c) aerial view with marked accelerometer measurements axes directions.

Figure 4.
Photos of rolling bearings used in the research.

Figure 5.
Vibration acceleration waveform registered for an unloaded motor with a new bearing.

Figure 6.
Vibration acceleration waveform registered for unloaded motor with the bearing with cut outer raceway.
Figure 6.
Vibration acceleration waveform registered for unloaded motor with the bearing with cut outer raceway.

Figure 7.
Vibration acceleration amplitude spectrum (fast Fourier transform (FFT) analysis) for low frequency band recorded for unloaded motor with various bearings: (a) new bearing (No. 1), (b) bearing damaged by sandblasting (No. 2), (c) bearing damaged with welder surge current (No. 3), (d) bearing with cut outer raceway (No. 4).

Figure 8.
Amplitude spectrum of vibration acceleration for axis X for bearing No. 3 during operation without additional load at maximum speed with marked characteristic fault frequencies.
Figure 8.
Amplitude spectrum of vibration acceleration for axis X for bearing No. 3 during operation without additional load at maximum speed with marked characteristic fault frequencies.


Figure 10.
Amplitude spectrum of vibration acceleration for axis X–FFT method, bearing No. 1–No. 4.

Figure 11.
Amplitude spectrum of vibration acceleration for axis X—FFT{ABS(x)} method, bearings No. 1–No. 4.
Figure 11.
Amplitude spectrum of vibration acceleration for axis X—FFT{ABS(x)} method, bearings No. 1–No. 4.

Figure 12.
Amplitude spectrum of vibration acceleration for axis X—FFT{HILB(x)} method, bearings No. 1–No. 4.
Figure 12.
Amplitude spectrum of vibration acceleration for axis X—FFT{HILB(x)} method, bearings No. 1–No. 4.

Figure 13.
Amplitude spectrum of vibration acceleration for axis X—FFT{TKEO(x)} method, bearings No. 1–No. 4.
Figure 13.
Amplitude spectrum of vibration acceleration for axis X—FFT{TKEO(x)} method, bearings No. 1–No. 4.

Figure 14.
Summary collation of multiplicity amplitudes of fault frequencies obtained using various signal processing methods in ball pass frequency of inner ring (BPFI), ball pass frequency of outer ring (BPFO) and ball spin frequency (BSF) faults (vibration acceleration analysis at axis X).
Figure 14.
Summary collation of multiplicity amplitudes of fault frequencies obtained using various signal processing methods in ball pass frequency of inner ring (BPFI), ball pass frequency of outer ring (BPFO) and ball spin frequency (BSF) faults (vibration acceleration analysis at axis X).

© 2019 by the authors. Licensee MDPI, Basel, Switzerland. This article is an open access article distributed under the terms and conditions of the Creative Commons Attribution (CC BY) license (http://creativecommons.org/licenses/by/4.0/).
Share and Cite
MDPI and ACS Style
Skora, M.; Ewert, P.; Kowalski, C.T. Selected Rolling Bearing Fault Diagnostic Methods in Wheel Embedded Permanent Magnet Brushless Direct Current Motors. Energies 2019, 12, 4212. https://0-doi-org.brum.beds.ac.uk/10.3390/en12214212
AMA Style
Skora M, Ewert P, Kowalski CT. Selected Rolling Bearing Fault Diagnostic Methods in Wheel Embedded Permanent Magnet Brushless Direct Current Motors. Energies. 2019; 12(21):4212. https://0-doi-org.brum.beds.ac.uk/10.3390/en12214212
Chicago/Turabian StyleSkora, Marcin, Pawel Ewert, and Czeslaw T. Kowalski. 2019. "Selected Rolling Bearing Fault Diagnostic Methods in Wheel Embedded Permanent Magnet Brushless Direct Current Motors" Energies 12, no. 21: 4212. https://0-doi-org.brum.beds.ac.uk/10.3390/en12214212
Note that from the first issue of 2016, this journal uses article numbers instead of page numbers. See further details here.