The Capacity of the Road Network: Data Collection and Statistical Analysis of Traffic Characteristics


1
Institute of Engineering and Technology, South Ural State University, 454080 Chelyabinsk, Russia
2
Department of Architecture, South Ural State University, 454080 Chelyabinsk, Russia
*
Author to whom correspondence should be addressed.
Energies 2020, 13(7), 1765; https://0-doi-org.brum.beds.ac.uk/10.3390/en13071765
Submission received: 17 January 2020
/
Revised: 20 February 2020
/
Accepted: 24 February 2020
/
Published: 7 April 2020
(This article belongs to the Special Issue Intelligent Transportation Systems)
Abstract
:The possibilities of collecting the necessary information using multi-touch cameras and ways to improve road traffic data collection are considered. An increase in the number of vehicles leads to traffic jams, which in turn leads to an increase in travel time, additional fuel consumption and other negative consequences. To solve this problem, it is necessary to have a reliable information collection system and apply modern effective methods of processing the collected information. The technology considered in the article allows taking into account pedestrians crossing the intersection. The purpose of this article is to determine the most important traffic characteristics that affect the traffic capacity of the intersection, in other words, the actual number of passing cars. Throughput is taken as a dependent variable. Based on the results of the regression analysis, a model was developed to predict the intersection throughput taking into account the most important traffic characteristics. Besides, this model is based on the fuzzy logic method and using the Fuzzy TECH 5.81d Professional Edition computer program.
1. Introduction
Urban transport systems under infrastructural constraints cannot cope with a continuous increase in road traffic. Uncontrolled growth in the number of road vehicles leads to negative consequences, such as an increase in accidents, harmful emissions, congestion, speed violations, etc. One of the popular tools in the control and monitoring of traffic flows is video surveillance [1]. Basically, road video cameras are used to record violations of traffic rules.
It should not be forgotten that the data obtained using video surveillance systems can be successfully and effectively used to improve road and transport infrastructure [2]. This is especially true for intersections, since it is on these sections of the road that the greatest number of problems arise. Of great interest is the analysis of traffic jams. In the absence of congestion, the movement of vehicles is carried out in normal mode. However, the presence of congestion requires intervention in the organization of the road process. The search for the causes of congestion and ways to eliminate them contributes to the efficient organization of traffic. An invaluable service in solving such a problem can be the analysis of information received from multi-touch cameras [3]. It is necessary to develop a methodology that allows using the information obtained from video cameras to analyze the traffic situation and to identify the main features of the road infrastructure that most affect the causes of traffic congestion. The solution of such a problem requires the widespread use of statistical and computer methods. These and other issues are considered in this paper.
Given the infrastructure limitations of cities and the continuous growth of automobile traffic, one of the main practices for maintaining the mobility of the population is to optimize the operation of traffic light regulation through the use of artificial intelligence. Most intersections contain traffic signals for pedestrians and vehicles. And the places of marking, the geometry of intersections, and the structure and intensity of traffic and pedestrian flows should also be taken into account when making decisions for the algorithms of adaptive traffic lights. Street surveillance cameras were used in tasks of recognizing dynamic objects based on neural networks, both for quantitative assessment of pedestrians and drivers of vehicles at the intersection, and their patterns.
The main aim of the paper is, based on the collected data and with the help of statistical methods of analysis, to define the most important characteristics of traffic systems that influence traffic capacity of crossroads. This paper focuses on the development of a mathematical model of traffic at intersections based on fuzzy logical analysis methods. The developed model allows you to make forecasts of the throughput of intersections, depending on their characteristics.
The algorithm of the proposed methodology based on fuzzy mathematical analysis can be expressed in the form of the following logical scheme: (1) identification of independent and dependent variables that affect traffic; (2) collecting data on identified variables using road cameras; (3) multivariate regression analysis of the collected information; (4) on the basis of the regression analysis to find the independent variables that most affect the dependent variable; (5) the creation of a fuzzy logical model according to the results of the study; (6) determination of ways to improve traffic characteristics.
The generally accepted methods for tracking objects are based solely on obtaining parameters of the movement of objects with the subsequent use of optimization methods [4]. These methods solve the problem of combining on a frame-by-frame basis, but their combinatorial complexity exponentially depends on the number of objects being tracked, which makes them unsuitable for real-time tracking. The developed technology allows you to calculate and classify vehicles in the directions of movement with an average percentage error of less than 10% [5]. Our solution allows to increase the capacity and safety of intersection c given the nature and parameters cross the roadway in groups of pedestrians and drivers behavior to ensure minimal inconvenience to pedestrians.
The methods of statistical analysis in our article, in particular the multiple regression analysis [6], allowed us to identify independent variables that most affect the dependent variable, which is the actual number of passing cars. These independent variables are: Duration of the resolving signal of a traffic light; The curvature of the carriageway when turning right and some others. By identifying the most significant reasons that affect the capacity of intersections, the traffic can be optimized. In addition, with help of the cluster analysis [7], it was divided the set of the studied intersections, characterized by a set of features (variables), into groups (clusters) that are homogeneous in the corresponding understanding. In other words, it was solved the problem of classifying the intersections under consideration and identifying the corresponding structure in it. It was used the multidimensional scaling [8] as a tool for visual presentation (visualization) of the source data. It allows presenting complex data in a visual form, which facilitates their perception and interpretation in comparison with a tabular form. The conducted factor analysis [9] allowed us to compress twenty-one initial variables to five factors (principle components), which creates prerequisites for simplifying further statistical analysis and interpretation of the results of the study.
Our paper is structured as follows. In Section 2, it is briefly discussed the relevant works of video recording of road users and analysis of the collected data. In Section 3 there is the focus on the aim and scope of our paper. Section 4 describes the traffic analysis technique developed on the basis of fuzzy mathematics. The developed methodology allows predicting the possible formation of traffic jams and the capacity of intersections by the initial values of road characteristics and parameters. In Section 5, it has been described the results obtained in the investigation. Section 6 presents the brief conclusions on the work.
2. Literature Review
Currently the calculation and categorization of road transport is an important task, as evidenced by many publications on this subject. Collision avoidance is an important feature of modern systems to ensure timely and reliable warning measures before an imminent collision. In [10], a set of measures was developed and implemented with the interaction of SCANeR and Matlab / Simulink computer programs. The self-tuning methodology of the LiDAR sensor network and its implementation are presented in [11]. Reliability of sensors is one of the most important problems for using IoT data in the automotive and manufacturing sectors [12,13].
Yiren Zhou et al. in their paper [14] use the Deconvolutional Neural Network. The average recognition accuracy was 86%. However, the authors used only cameras removing the car from the rear view. Debojit Biswas et al. developed and implemented two algorithms BSM and OverFeat Framework for automatic counting of cars based on the Convolution Neural Network (CNN) [15]. Accuracy is assessed by comparison with manual counting. The average recognition accuracy was 96.55%. The system was trained on 3698 images in which 6 classes were allocated. Authors used available dataset from Stanford Image-net library [Image Net Library. Available online: http://imagenet.stanford.edu/].
The paper [16] written by Fukai Zhang, Ce Li and Feng Yang took a different approach. The authors did not attempt to develop their own system. They took trained networks and made an application for counting road transport based on the Convolutional Neural Networks. The studies showed a good result. However, as can be seen from the examples given in the paper, if the camera was taken for tests from a different angle, then the recognition percentage fell. Despite the availability of ready-made datasets, as well as a variety of ready-made solutions, a number of unsolved problems remain. For example, the quality of the images from the cameras differ from each other, and this leads to the fact that the neural network learn on the existing dataset, but it does not recognize the image from the necessary cameras other than those on which the dataset was going. Another problem is the location of the camera. If the camera hangs from a different angle, the same problem arises as with the image quality. Therefore, until a universal algorithm has been developed for detecting and classifying automobile transport, it is necessary to select your own tools for each task and create your own datasets.
Vehicle detection methods in the deep CNN region first create candidate regions in the image and then classify each one. Region-based convolutional neural network (R-CNN) [17] uses a selective search algorithm [18] to increase the accuracy of observations. The vehicle detection and classification are important parts of intelligent transport systems. In this case, various types of information are used to detect and classify vehicles, for example, an acoustic signature [19], a radar signal [4], a frequency signal [20] and an image representation [21].
Tianyu Tang et al. in their article [22] they propose using a convolutional neural network for the direct generation of randomly oriented detection results. Their approach, called Oriented_SSD (Single Shot MultiBox Detector, SSD), uses a set of default blocks with different scales at each location on the object map to create bounding detection blocks. Jianming Zhang et al. introduced the Chinese traffic sign detection algorithm [23], based on a deep convolution network. To detect Chinese road signs in real time, the authors proposed an end-to-end convolutional network based on YOLOv2. The highest detection rate was 0.017 seconds per image. You can note the methods of object detection based on regression. For example, the YOLO regression method [24] splits the input image into several grids and predicts a bounding box and reliability directly in each grid. The improved YOLOv2 model [25] uses an anchor cell to provide a compromise between speed and accuracy.
To ensure good performance in vehicle detection, an algorithm based on sensors has been proposed [26]. This algorithm provides significant improvements in accuracy over existing methods. The paper [27] proposed the associated R-CNN method, which combines a network of exact vehicle offers and a network of vehicle attribute studies in order to detect vehicles quickly and accurately. A vehicle detection algorithm is also proposed that uses convolutional neural networks based on a spatial pyramidal pool [28].
Buch et al. presented a brief overview of intelligent traffic monitoring systems using road cameras [29]. Daigavane and Bajaj [30] developed a background recording and segmentation method using a morphological operator. In this study, a system was developed for the dynamic detection and counting of objects on highways. Chen et al. in their work [31] consider problems associated with uncontrolled image segmentation and object modeling using multimedia inputs to describe the spatial and temporal behavior of an object to monitor traffic. Gupte et al. in their work [32] suggested some algorithms for detecting and classifying vehicles based on monocular images of motion scenes are presented.
A new method for detecting a single RefineDet object is presented in [33]. This method simultaneously optimizes the modules for updating the anchor and object detection, which allows you to effectively detect the object. The article [34] describes the structural logical network (SIN) and proposes to consider the detection of objects as a problem of displaying the graph structure and obtaining the desired result. To solve the problem of scaling when detecting an object, the article [35] presents a scalable network for detecting an object based on a dense convolutional network.
Suichan Li in [36] proposed processing several adjacent frames to better cope with blur and short-term occlusions. Xiaoliang Wang et al. [37] investigated the use of focal loss. Tsung-Yi Lin et al. in [38] they controlled vehicles and showed that loss of focus provides a significant improvement in performance. Xiaowei Hu et al. [39] focused on increasing the reliability of scaling.
Article [40] is devoted to statistical university network traffic using self-similarity methods and chaos analysis. In this case, the measurement results are processed by calculating the Hurst index. Assessment of the reliability of the analysis results is given on the basis of statistical methods. Note that reliable results based on chaos methods are difficult to obtain.
In [41], a network traffic model is proposed, in which it is suggested to substantiate the normal operation of the network using the asymptotic distribution of the difference between successive estimates of the model parameters. Experimental results showed that the system is able to detect unusual changes in the characteristics of network traffic. In [42] it is presented a method for detecting anomalies through a neural network with controlled long-term memory (LSTM). The mean, median and M-score are often used in statistical tests for the detection of anomalies [43]. The aim of the study [44] was to model the structure and functioning of a complex information system that takes into account operators and users [45].
3. Methods
3.1. Objective and Scope
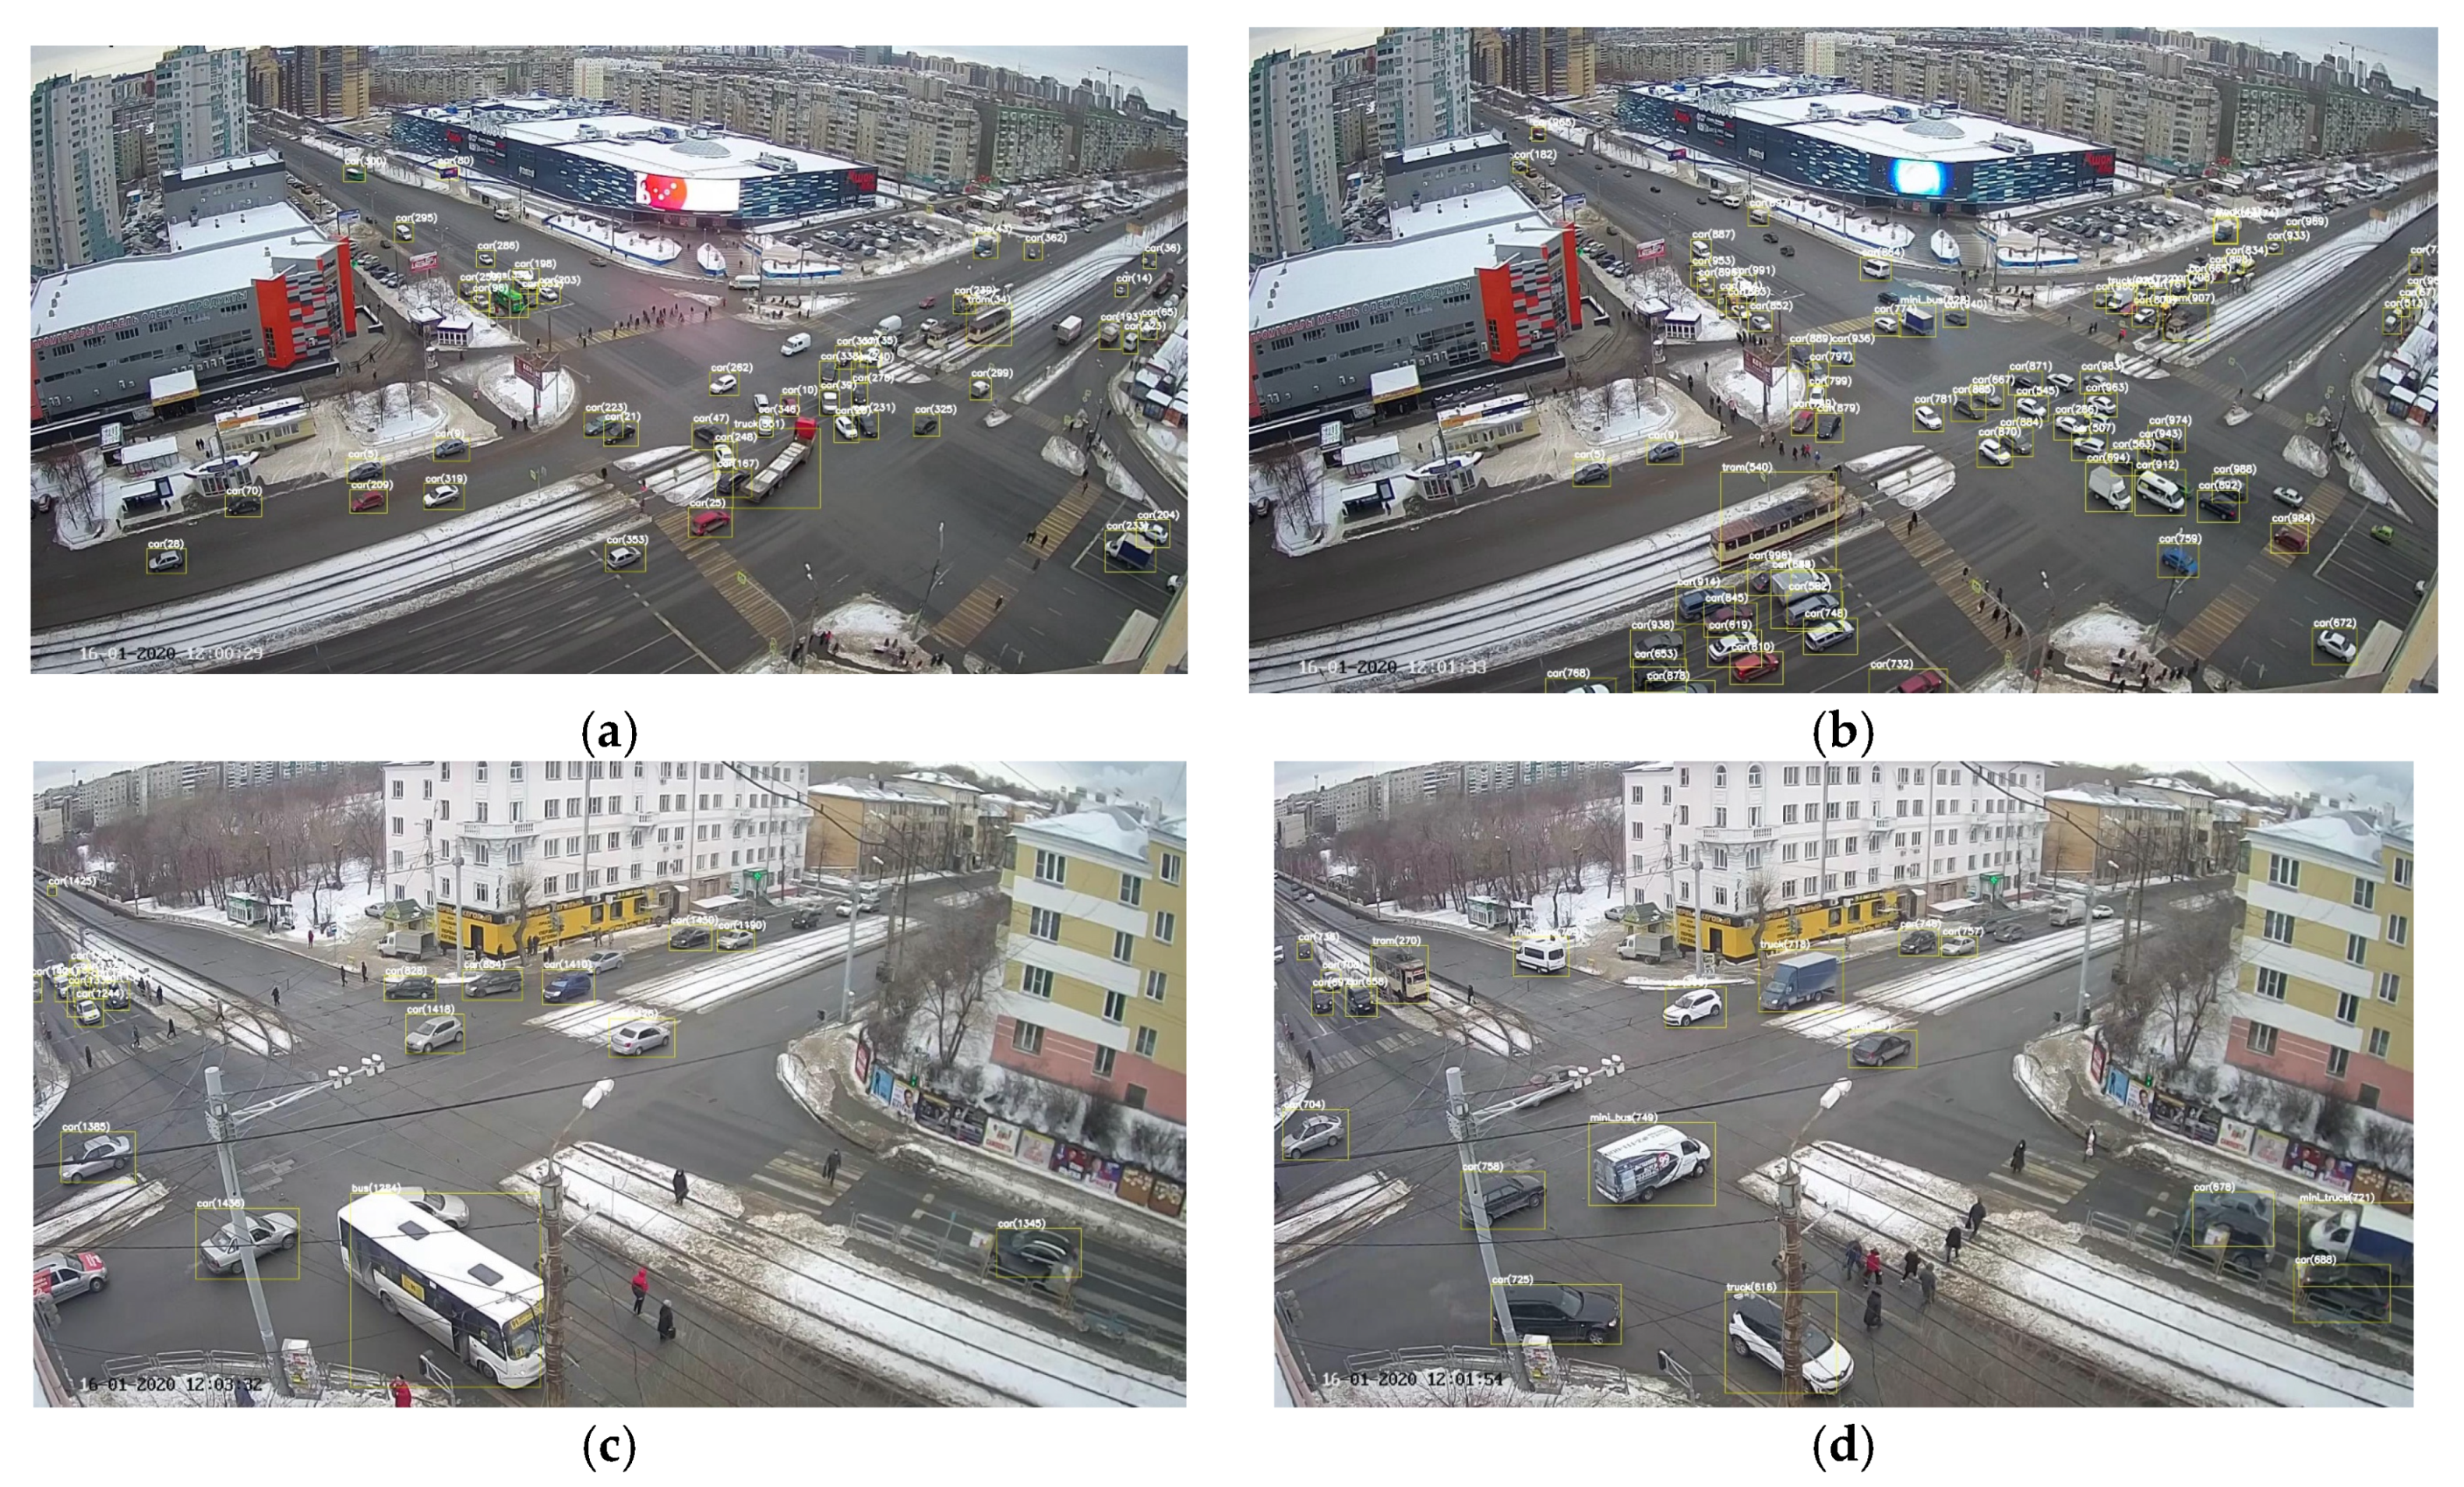
The parameters of pedestrian flows and regulated intersections to varying degrees affect the bandwidth when turning right. Existing methods do not take into account the number of pedestrians, the length of the intersection arc, or the place for marking-stop-line and the crosswalk in the adaptive traffic light settings. All these factors, to one degree or another, affect the bandwidth of the lane at an adjustable intersection with movement only to the right. The most common way to solve the increase in throughput is to limit the allowance for pedestrian traffic to the time required to cross the road. This solution is uncomfortable for pedestrians, due to the increase in the waiting time for the enabling signal. Interpretation of big data obtained on the basis of a computer vision of the patterns of drivers and pedestrians, taking into account the geometry of the intersection and the location of the marking lines, allows one to determine the most effective solutions to the problems of increasing the intersection throughput (Figure 1).
The novelty of the approach presented is the presentation of a correlation between the behavior of pedestrians and drivers of vehicles on the basis of the task of using fuzzy controllers, in order to reduce time losses when crossing intersections.
This study is aimed at collecting, processing and analyzing information about the traffic situation and the movement of vehicles at congested street intersections. The proposed system can calculate and classify vehicles by driving directions with an average percentage error that is less than 10%. A distinctive feature is the consideration of pedestrians crossing the intersections in different directions. Information processing is performed using the SPSS computer program. When processing the information, the characteristic of the traffic flow is as follows: “The actual number of passing cars.” This variable is the dependent one (the last one in Table 1). The independent variables are all the others indicated in Table 1. The purpose of this study in this article is to develop a methodology that allows us to identify the main factors affecting the throughput of intersections in a congested environment.
Analysis of the results of information processing allows us to do this. In addition, clustering intersections provides a visual representation of the source data. Achieving this goal will allow taking the right steps to improve road and transport logistics. It is important to note that the results obtained make it possible to make predictions about throughput of an intersection under given conditions. Examples of such predictions are given in this work.
3.2. Research Methodology
The developed system based on trained neural networks uses video images to calculate the speed and orientation of objects that appear on the road scene. The work is focused on the use of a fuzzy logic controller for receiving and processing information for making decisions about the operation of a pedestrian traffic light. In turn, the quantitative and qualitative characteristics of the movement of vehicles has a place of marking the “stop line” of the intersected pedestrian crossing and the length of the rounded turn. The system detects the presence of vehicles by means of object recognition and determines dynamic windows in the pedestrian flow sufficient for the passage of transport. The accumulation of such data makes it possible to obtain a powerful tool for adapting the work of traffic lights to meet the interests of pedestrian and automobile traffic.
The proposed approach is a more comfortable and safer way to organize pedestrian traffic while maintaining the capacity of the regulated intersection.
The research methodology in this article includes the selection of variables for which data is collected, the method of data collection, the use of statistical methods for processing the collected information, and the interpretation of the results obtained.
In this study, the data were collected for various intersections in Chelyabinsk (Russia). At each intersection, lanes were selected that meet the following requirements: turn right and conflict with pedestrians in a jam state. Twenty-five such bands were selected. The data was collected over a certain period of time from “date” to “date”. The data was collected using software developed in South Ural State University (Chelyabinsk). The set of the variables from the video stream used in the study is presented in Table 1.
A free window means the time sufficient for the passage of transport when pedestrians are not present at the pedestrian crossing and do not interfere with traffic on the lane with permitted traffic only to the right. The first free window-when transport begins to move on the allowing signal of the traffic light at turn to the right, pedestrians are absent. The second open window is when pedestrians leave the intersected lane, with the permitted traffic only to the right, at the pedestrian crossing on the allowing signal of the traffic light and release it for the passage of transport.
A crossroad is the place of intersection, junction, or fork of roads at the same level, limited by imaginary lines connecting the opposite, farthest from the center of the intersection, the beginning of curvature of the carriageway. The geometry of the intersection, especially the length of the arc when turning right and the place of marking (stop lines, crosswalks), largely determines its throughput. Pedestrian exit times and the start of vehicles at regulated intersections are usually the same. This does not take into account the time during which the vehicle travels from the stop line to the pedestrian crossing and the parameters of pedestrian traffic. Studies have shown that pedestrian and car traffic are heterogeneous at different intersections. In our investigation it was tried to establish the effect of the length of the arc, the location of the marking and the parameters of pedestrian traffic on the traffic capacity of the intersection. L1 is the distance from the stop line to the border of the intersection with the conflicting direction, m; L2 is the curvature of the carriageway when turning right, m; and L3 is the distance from the end point of the curvature of the carriageway (intersection border) to the pedestrian crossing when turning right, m.
Data, such as the duration of the permissive signal of the traffic light, are open data of the work of traffic lights. These data were compared with a video timer. Data L1, L2, L3 are static characteristics of the intersection.
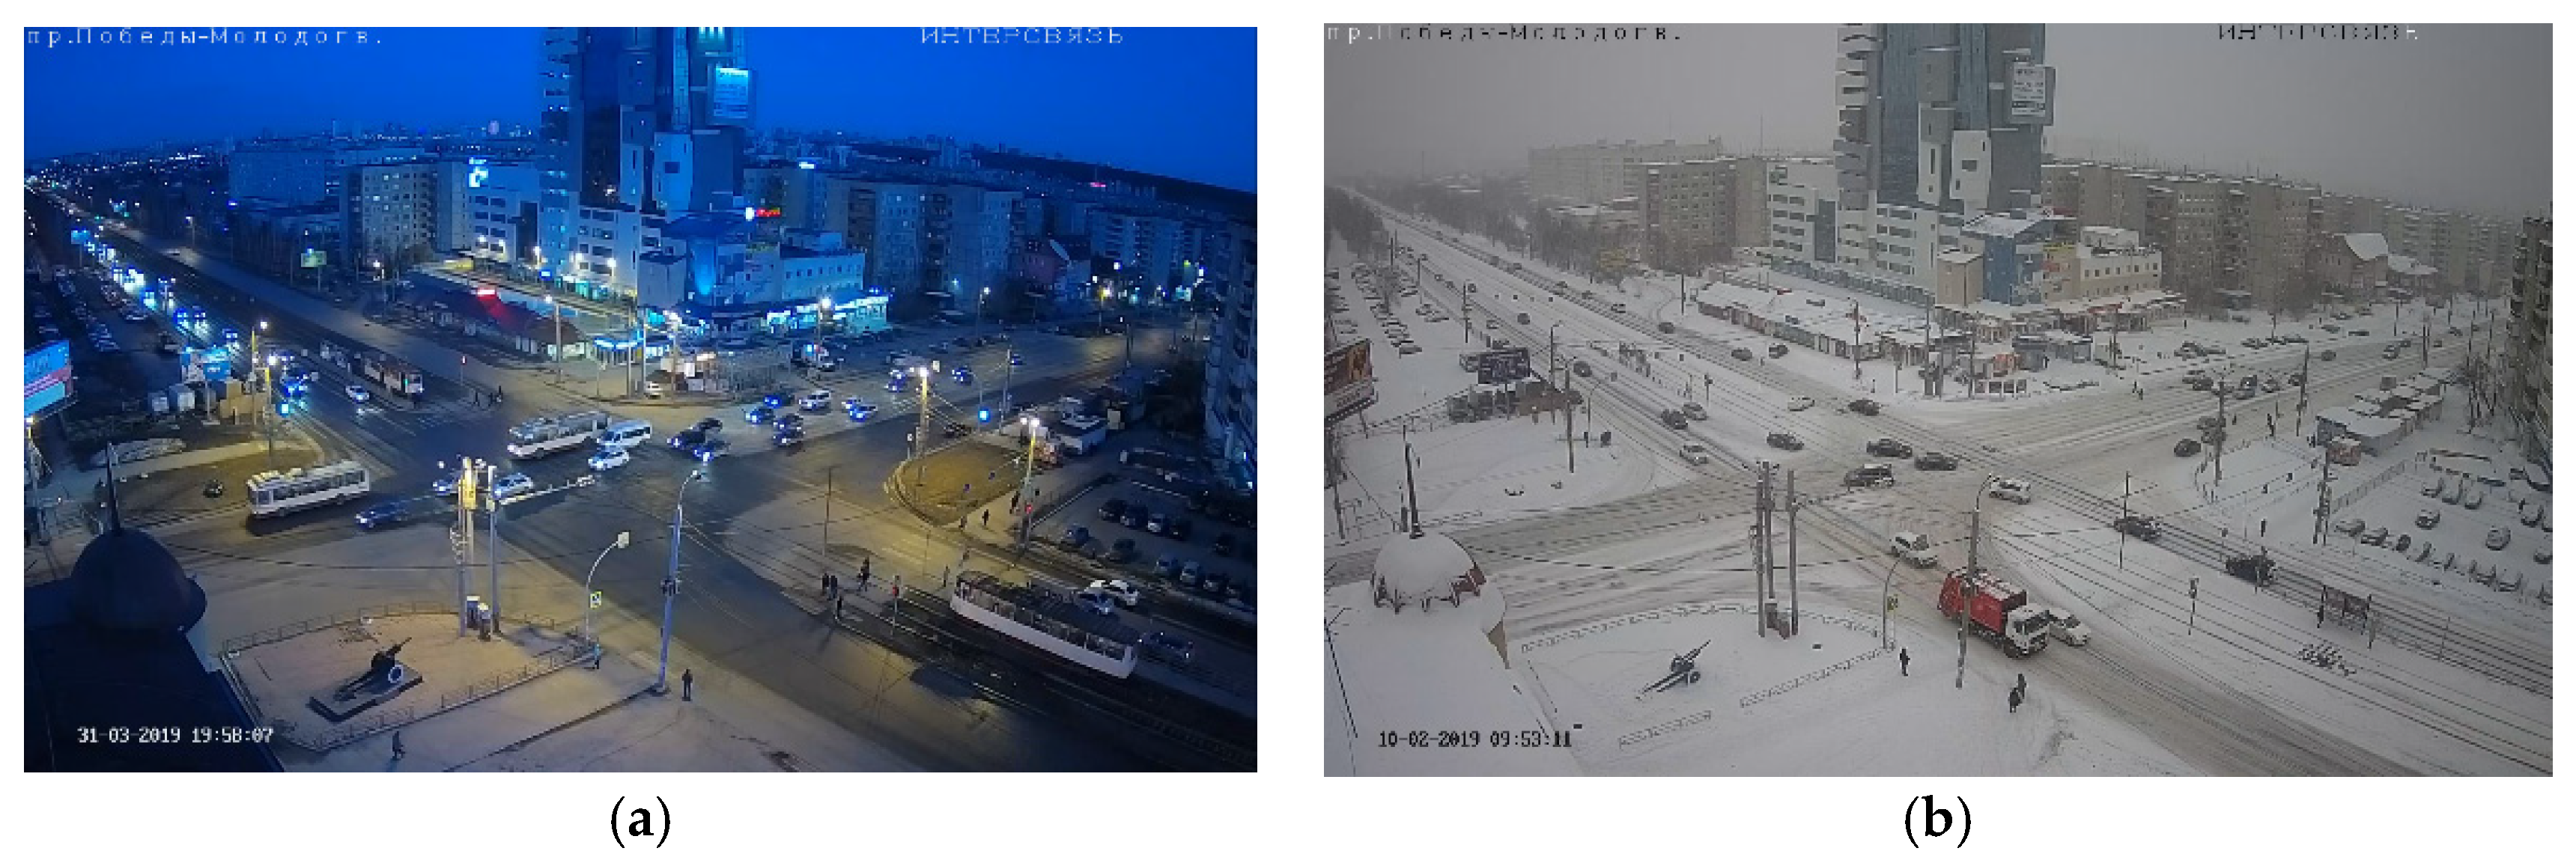
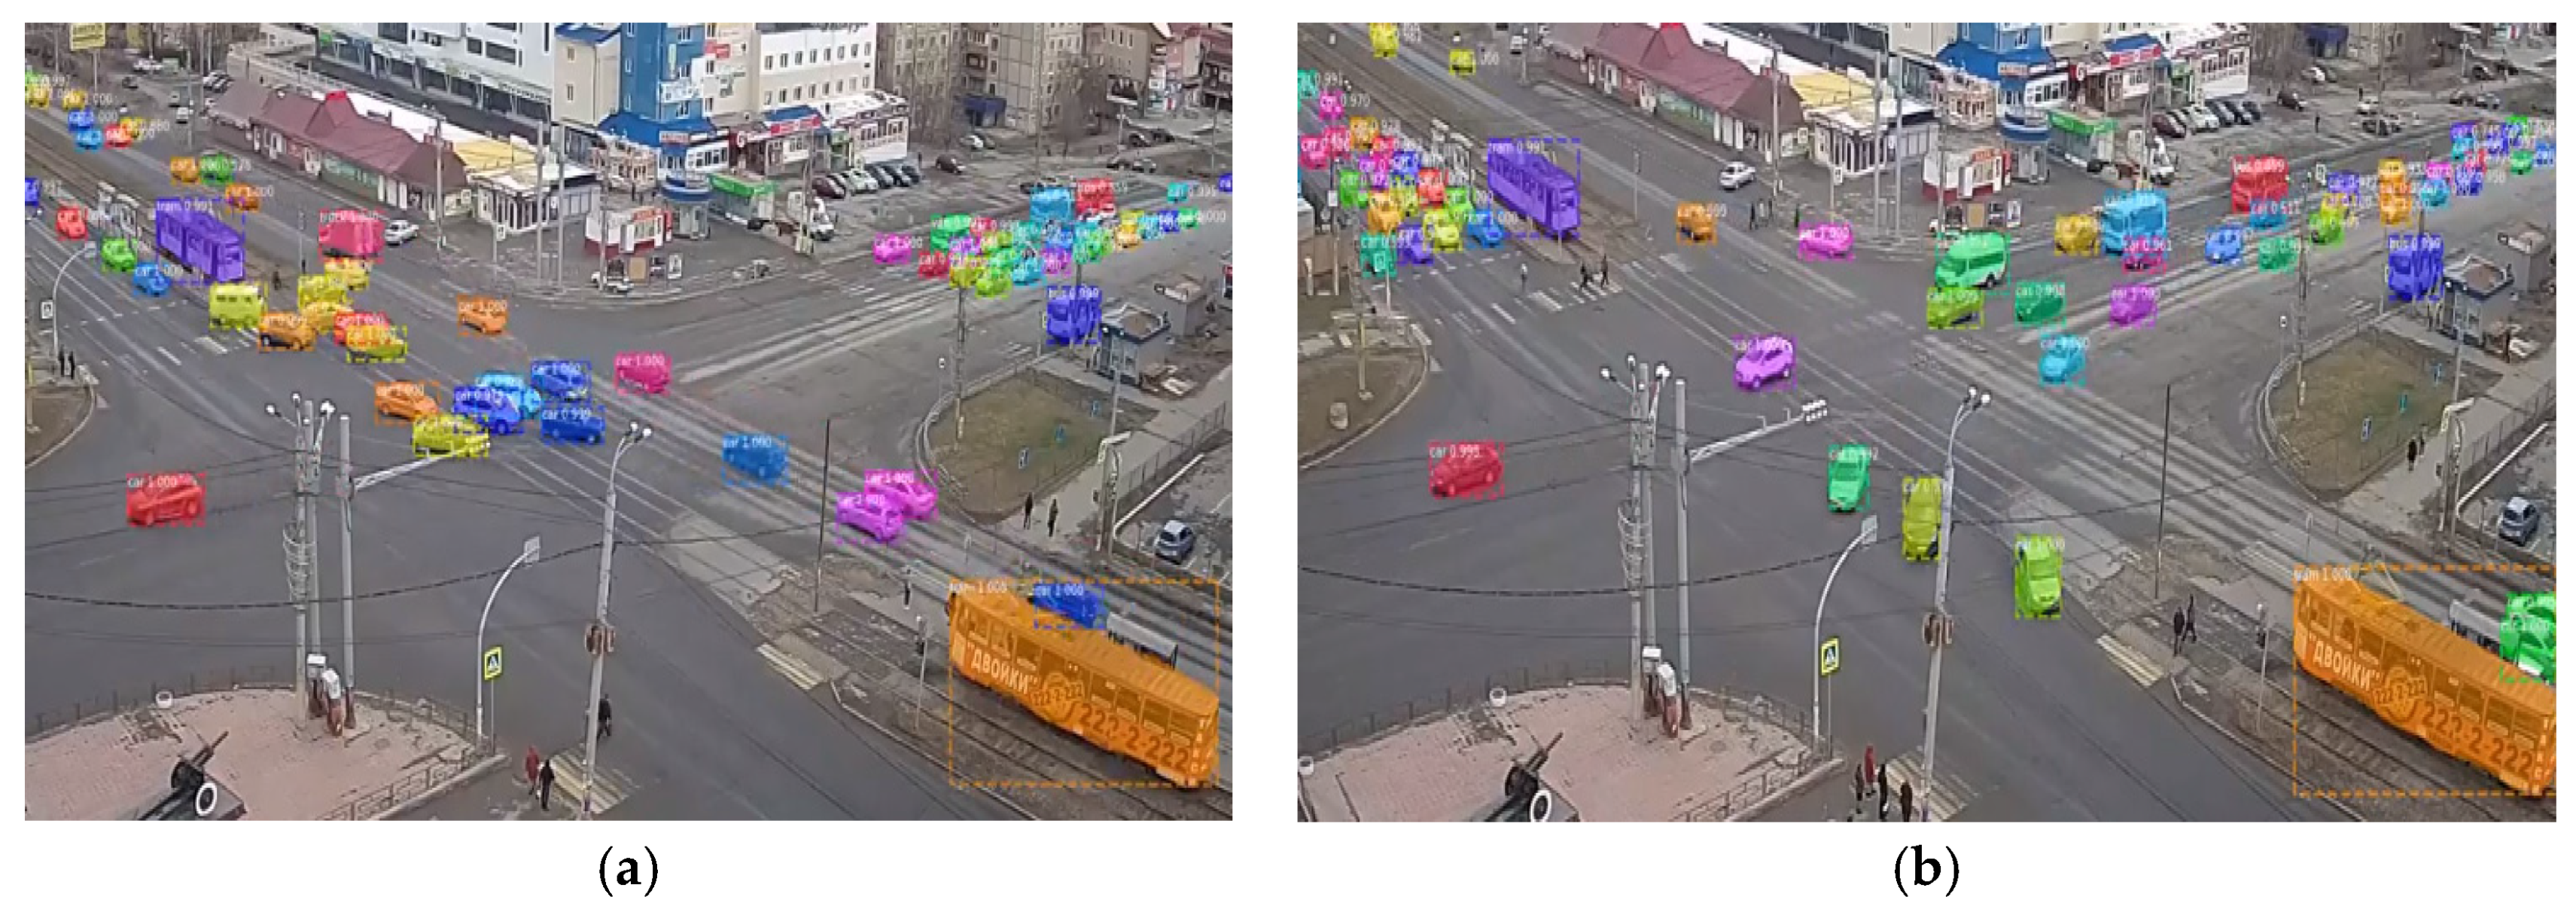
A feature of the data acquisition system is that it is designed specifically for stationary multi-sensor outdoor cameras. The study was conducted in Chelyabinsk city, Russia. The system works with Intersvyaz company’s outdoor cameras (http://intersvyaz.ru/). The system uses software that works on the basis of neural networks. For recognition of road transport and pedestrians the system uses the Mask R-CNN or its variation Faster R-CNN. Some examples of the images from the road cameras with markup can be seen in Figure 2 and Figure 3.
Examples of images with observation marks are given in Figure 3. These images provided data for the studies conducted in this paper [29]. A feature of our information gathering system is that the tags of observations (Figure 3) are placed on the images obtained from video cameras directly, and not from photographs from video surveillance as is done in the vast majority of similar studies.
The formation of many training data is of fundamental importance for the successful operation of neural networks. Because of their active development, the problem of forming a training sample is very relevant, since in many tasks deep neural networks demonstrate a quality that significantly exceeds other machine learning algorithms. In total, the training and test samples contain 982 images.
To implement the application, we used the Simple Online and Real-time Tracking (Sort) video tracking algorithm, since it has a good compromise between speed and accuracy. This is an algorithm designed to track multiple objects based on elementary data association and state estimation methods. Sort provides the necessary functionality for tracking the consistency of detection objects in several frames and is suitable for online tracking applications in which only past and current frames are available, and the method creates identification of objects on the fly.
The approach chosen provides accuracy comparable to more sophisticated online trackers. In addition, due to the simplicity of this tracking method, the tracker is updated with a frequency of 260 Hz, which is more than 20 times faster than other modern trackers.
3.3. Statistical Methods
In our paper, they were widely used the statistical methods for processing and analyzing information obtained from road sensory surveillance cameras for road situations at intersections. These methods characterize the quantitative laws of transport flows in close connection with their qualitative content.
The problems of statistics in our study are most closely related to real life and are associated with the detection of trend characteristics of road traffic at intersections under traffic congestion conditions. In this paper they were used such modern statistical analysis methods as: multiple regression analysis and methods of multidimensional scaling, and others.
The use of statistical methods in our work is due to our desire to show that in the study of traffic flows it is important not only to collect data from video cameras quickly and accurately, but also to be able to process the collected information using appropriate statistical methods. Today, given the wide distribution of high-performance sensor systems, the collection of information does not present significant difficulties. The foreground is the ability to process the received information properly. It was processed the information using the SPSS (Statistical Package for Social Sciences) computer program. The use of statistical data contributes to familiarization of specialists in transport logistics with the situation on the roads, provides adaptation to changing conditions and making the right management decisions.
3.4. Data Post-Processing
In this section, it will be carried out statistical processing of the data obtained from the multi-touch video surveillance systems in conditions of traffic congestion. The processing is carried out using the computer program SPSS. The applied statistical methods include multidimensional regression. For a visual representation of the results of the study it is used the method of multidimensional scaling.
3.4.1. Multiple Linear Regression
Multiple regression analysis allows us to select from the totality of the initial variables those that have the most significant impact on the throughput of intersections under traffic congestion conditions. In addition, this analysis makes it possible to rank the selected variables according to the degree of their influence on the throughput of intersections and to quantify the degree of this influence. The multiple regression, constructed as a result of the analysis, makes it possible to predict the throughput of the intersection in terms of specific values of its initial characteristics. It is very important from a practical point of view.
As the dependent variable, it is taken “The actual number of passing cars”, since this variable is the criterion of the intersection capacity. The remaining variables from Table 1 are taken as independent ones. For the analysis in the package of statistical computer programs SPSS, it is chosen the option “Multiple linear regression analysis”.
The coefficient of multiple correlation R (Table 2) reflects the connection of the dependent variable “The actual number of passing cars” with a set of the independent variables and is equal to 0.958. It is found that the adjusted R² of our model is 0.409 with the coefficient of multiple determination R² =0.902. This means that the linear regression explains 90.2% of the variance in the data, which is a very good result. The Durbin-Watson d = 1.533, which is between the two critical values of 1.5 < d < 2.5. It can be assumed that there is no first order linear autocorrelation in our multiple linear regression data.
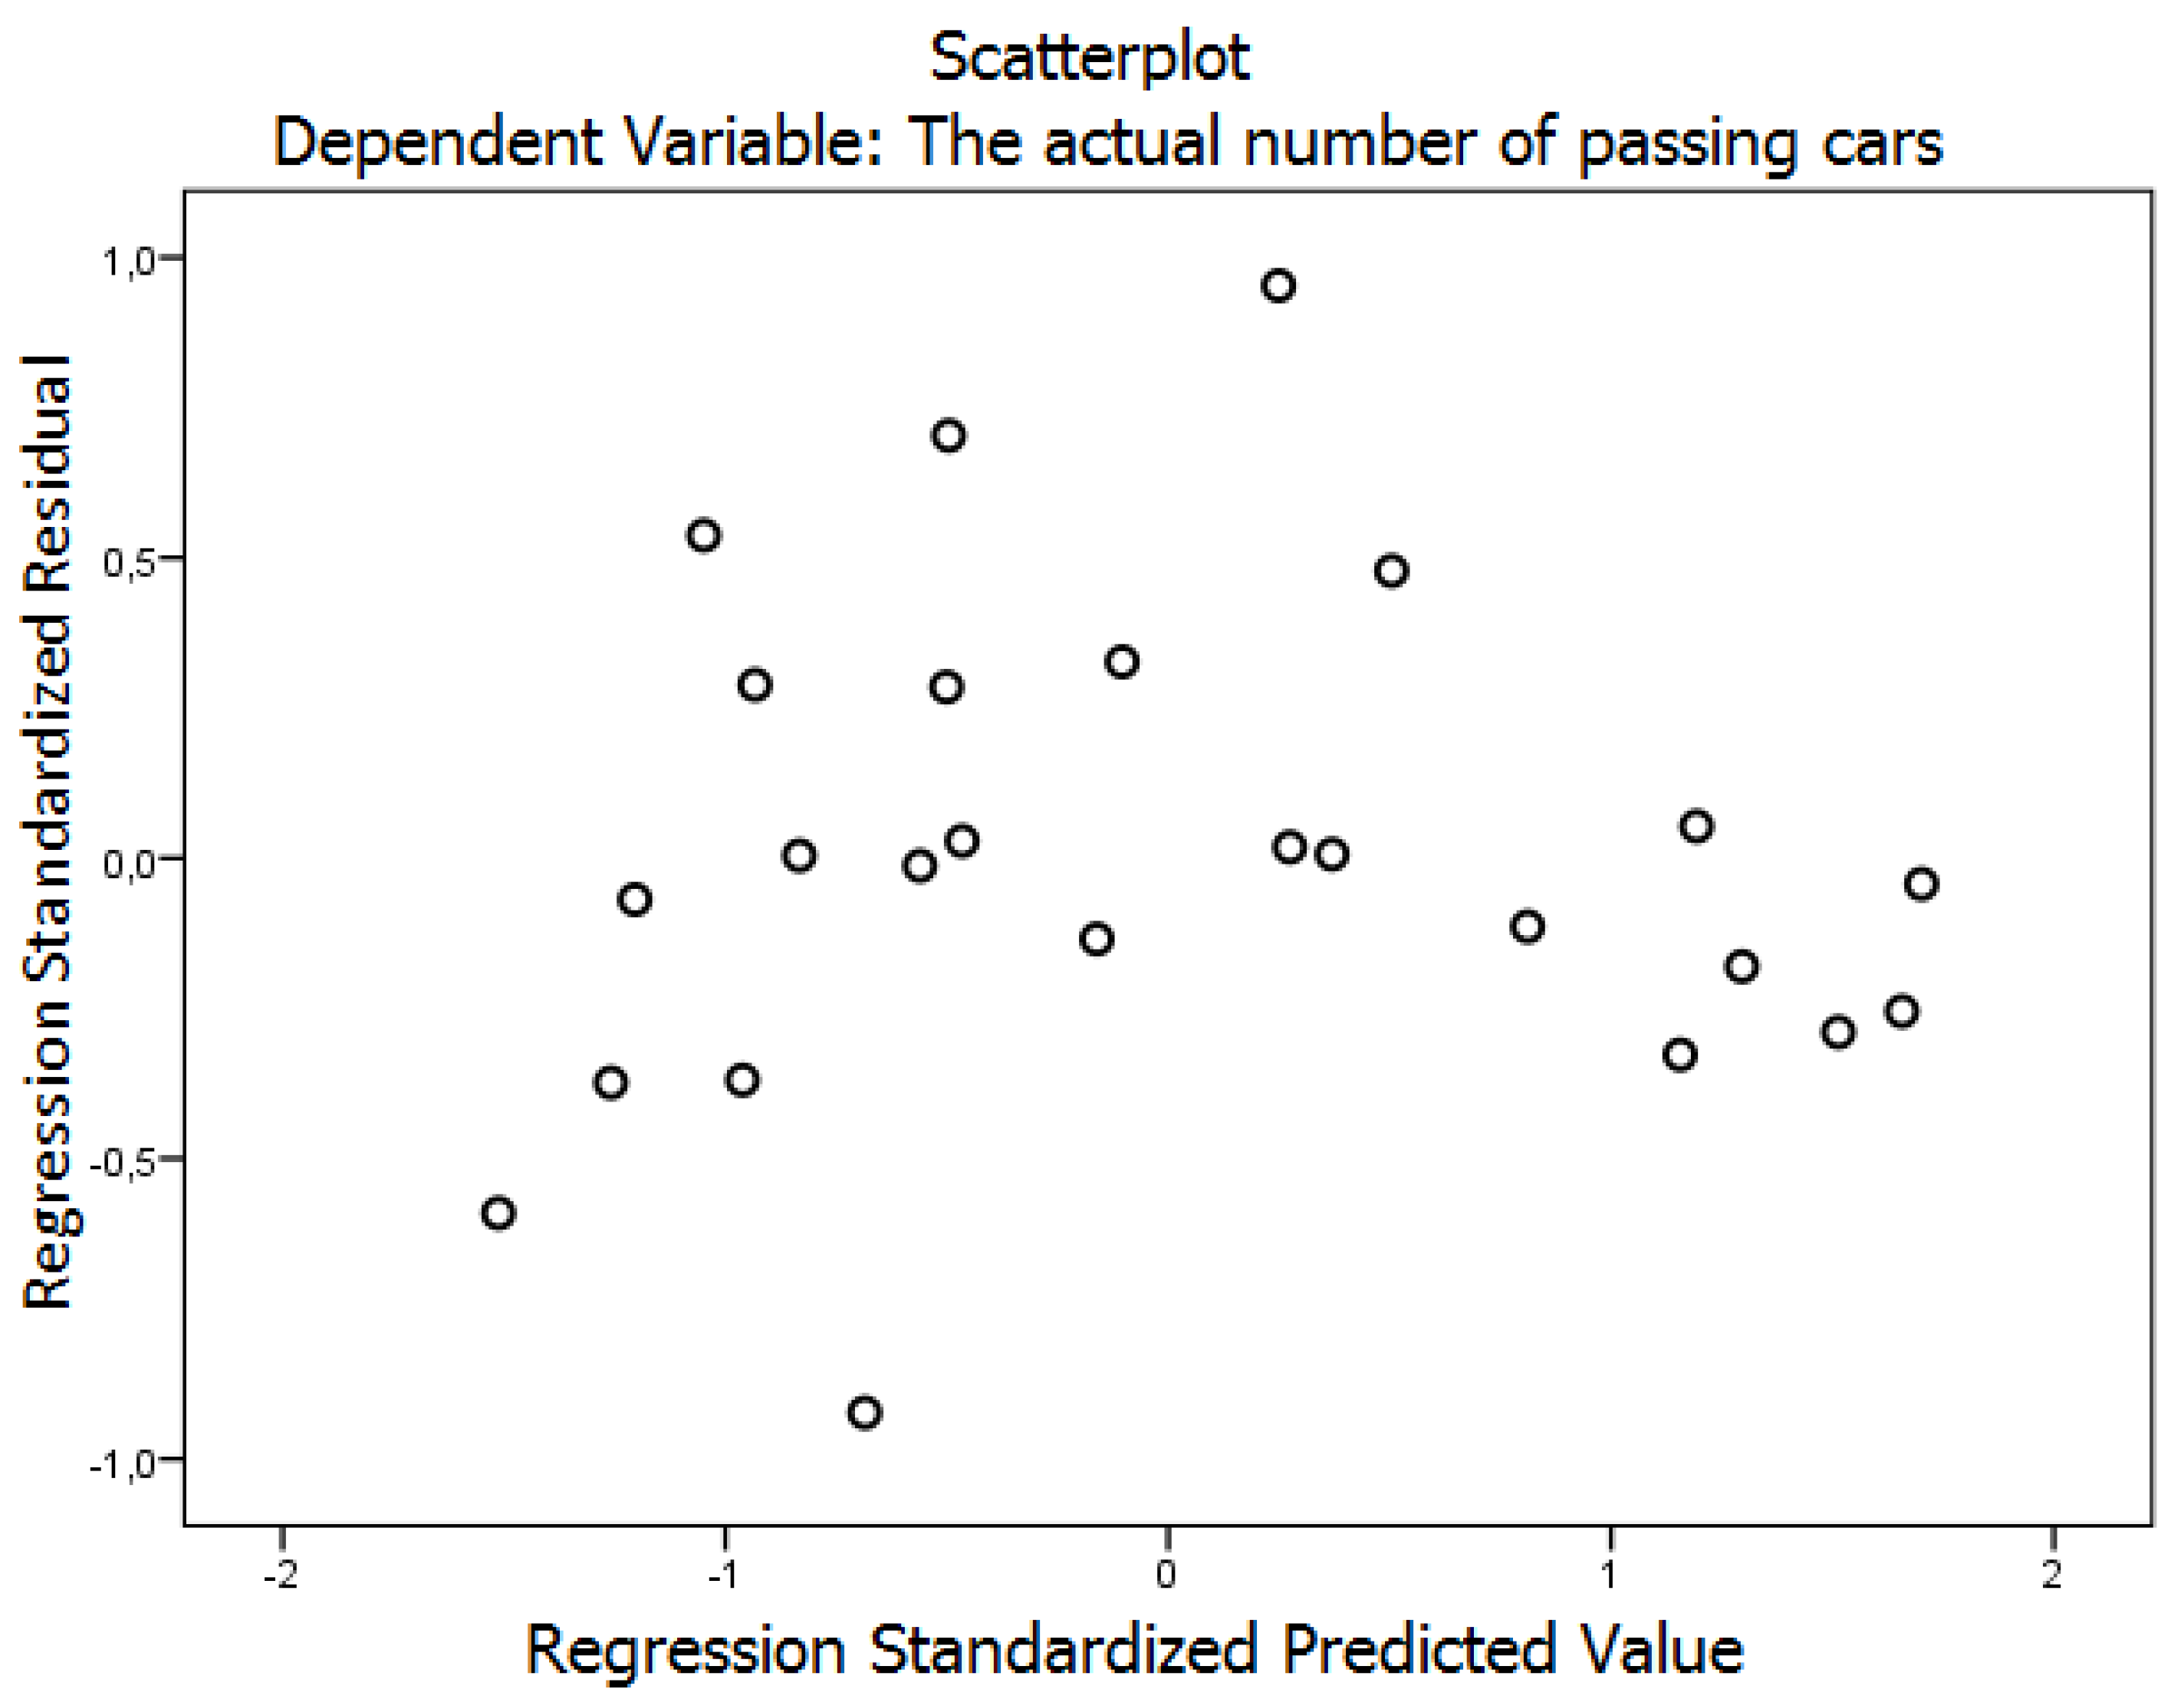
The absence of a negative phenomenon of heteroscedasticity is confirmed by the residual diagram (Figure 4).
There is no pattern in the scatter. From the scatterplot it can be seen no clear relationship between the residuals and the predicted values which is consistent with the assumption of linearity. The dispersion of residuals over the predicted value range between −1 and 1 looks constant. The assumption of homoscedasticity has been met.
In Table 3 we present the results of the multidimensional regression.
The standardized regression coefficients (Table 3) allow us to identify the most significant independent variables (factors) that affect the actual number of passing cars. From the table it follows that the variable Duration of the resolving signal of a traffic light has the greatest effect on the dependent variable. Further, in a descending order, the variables follow such as: Sampling for the maximum possible number of vehicles driving without pedestrians, L2-the curvature of the carriageway when turning right, t4-time of leaving the 1st vehicle of the pedestrian crossing, taking into account the distance of 1 meter to the pedestrian crossing and its release, Number of vehicles driven in the 2nd window, etc. By the ratio of the corresponding standardized coefficients, one can judge the strength of this influence of one variable compared to another.
In addition, the constructed regression allows us to make predictions for the dependent variable. For example, suppose that there is the following set of values for the independent variables: Duration of the resolving signal of a traffic light = 49 s; L1 = 12; L2 = 15; L3 = 4; the number of pedestrians in the direction of the vehicle (right) = 7; the number of pedestrians in the direction of the vehicle (left) = 8; the duration of the 1st free window in the pedestrian stream for driving = 10 s; number of vehicles driven in the 1st window = 3; the duration of the 2nd free window in the pedestrian flow for driving = 5 s; number of vehicles driven in the 2nd window = 1; the duration of the 3rd free window in the pedestrian stream for driving = 2 s; number of vehicles driving in the 3rd window = 1; driving time through the free window in the pedestrian flow, taking into account the distance of 1 meter to the pedestrian crossing and its release = 7 s; number of vehicles in the queue due to waiting for pedestrians to pass = 4; t1—time of movement of the 1st vehicle from the stop line to the beginning of rounding = 5 s; t2—time of movement of the 1st vehicle in an arc (until the exit from the turn) = 6 s; t3—the time of movement of the 1st vehicle on the segment of approach to the pedestrian crossing after exiting from the turn = 2 s; t4-time of leaving the 1st vehicle of the pedestrian crossing, taking into account the distance of 1 meter to the pedestrian crossing and its release = 12 s; number of vehicles completing the passage to the red signal of the traffic light = 8; and sampling for the maximum possible number of vehicles driving without pedestrians = 22. Then the value of the dependent variable (the actual number of passing cars) will be 13.
3.4.2. Multidimensional Scaling
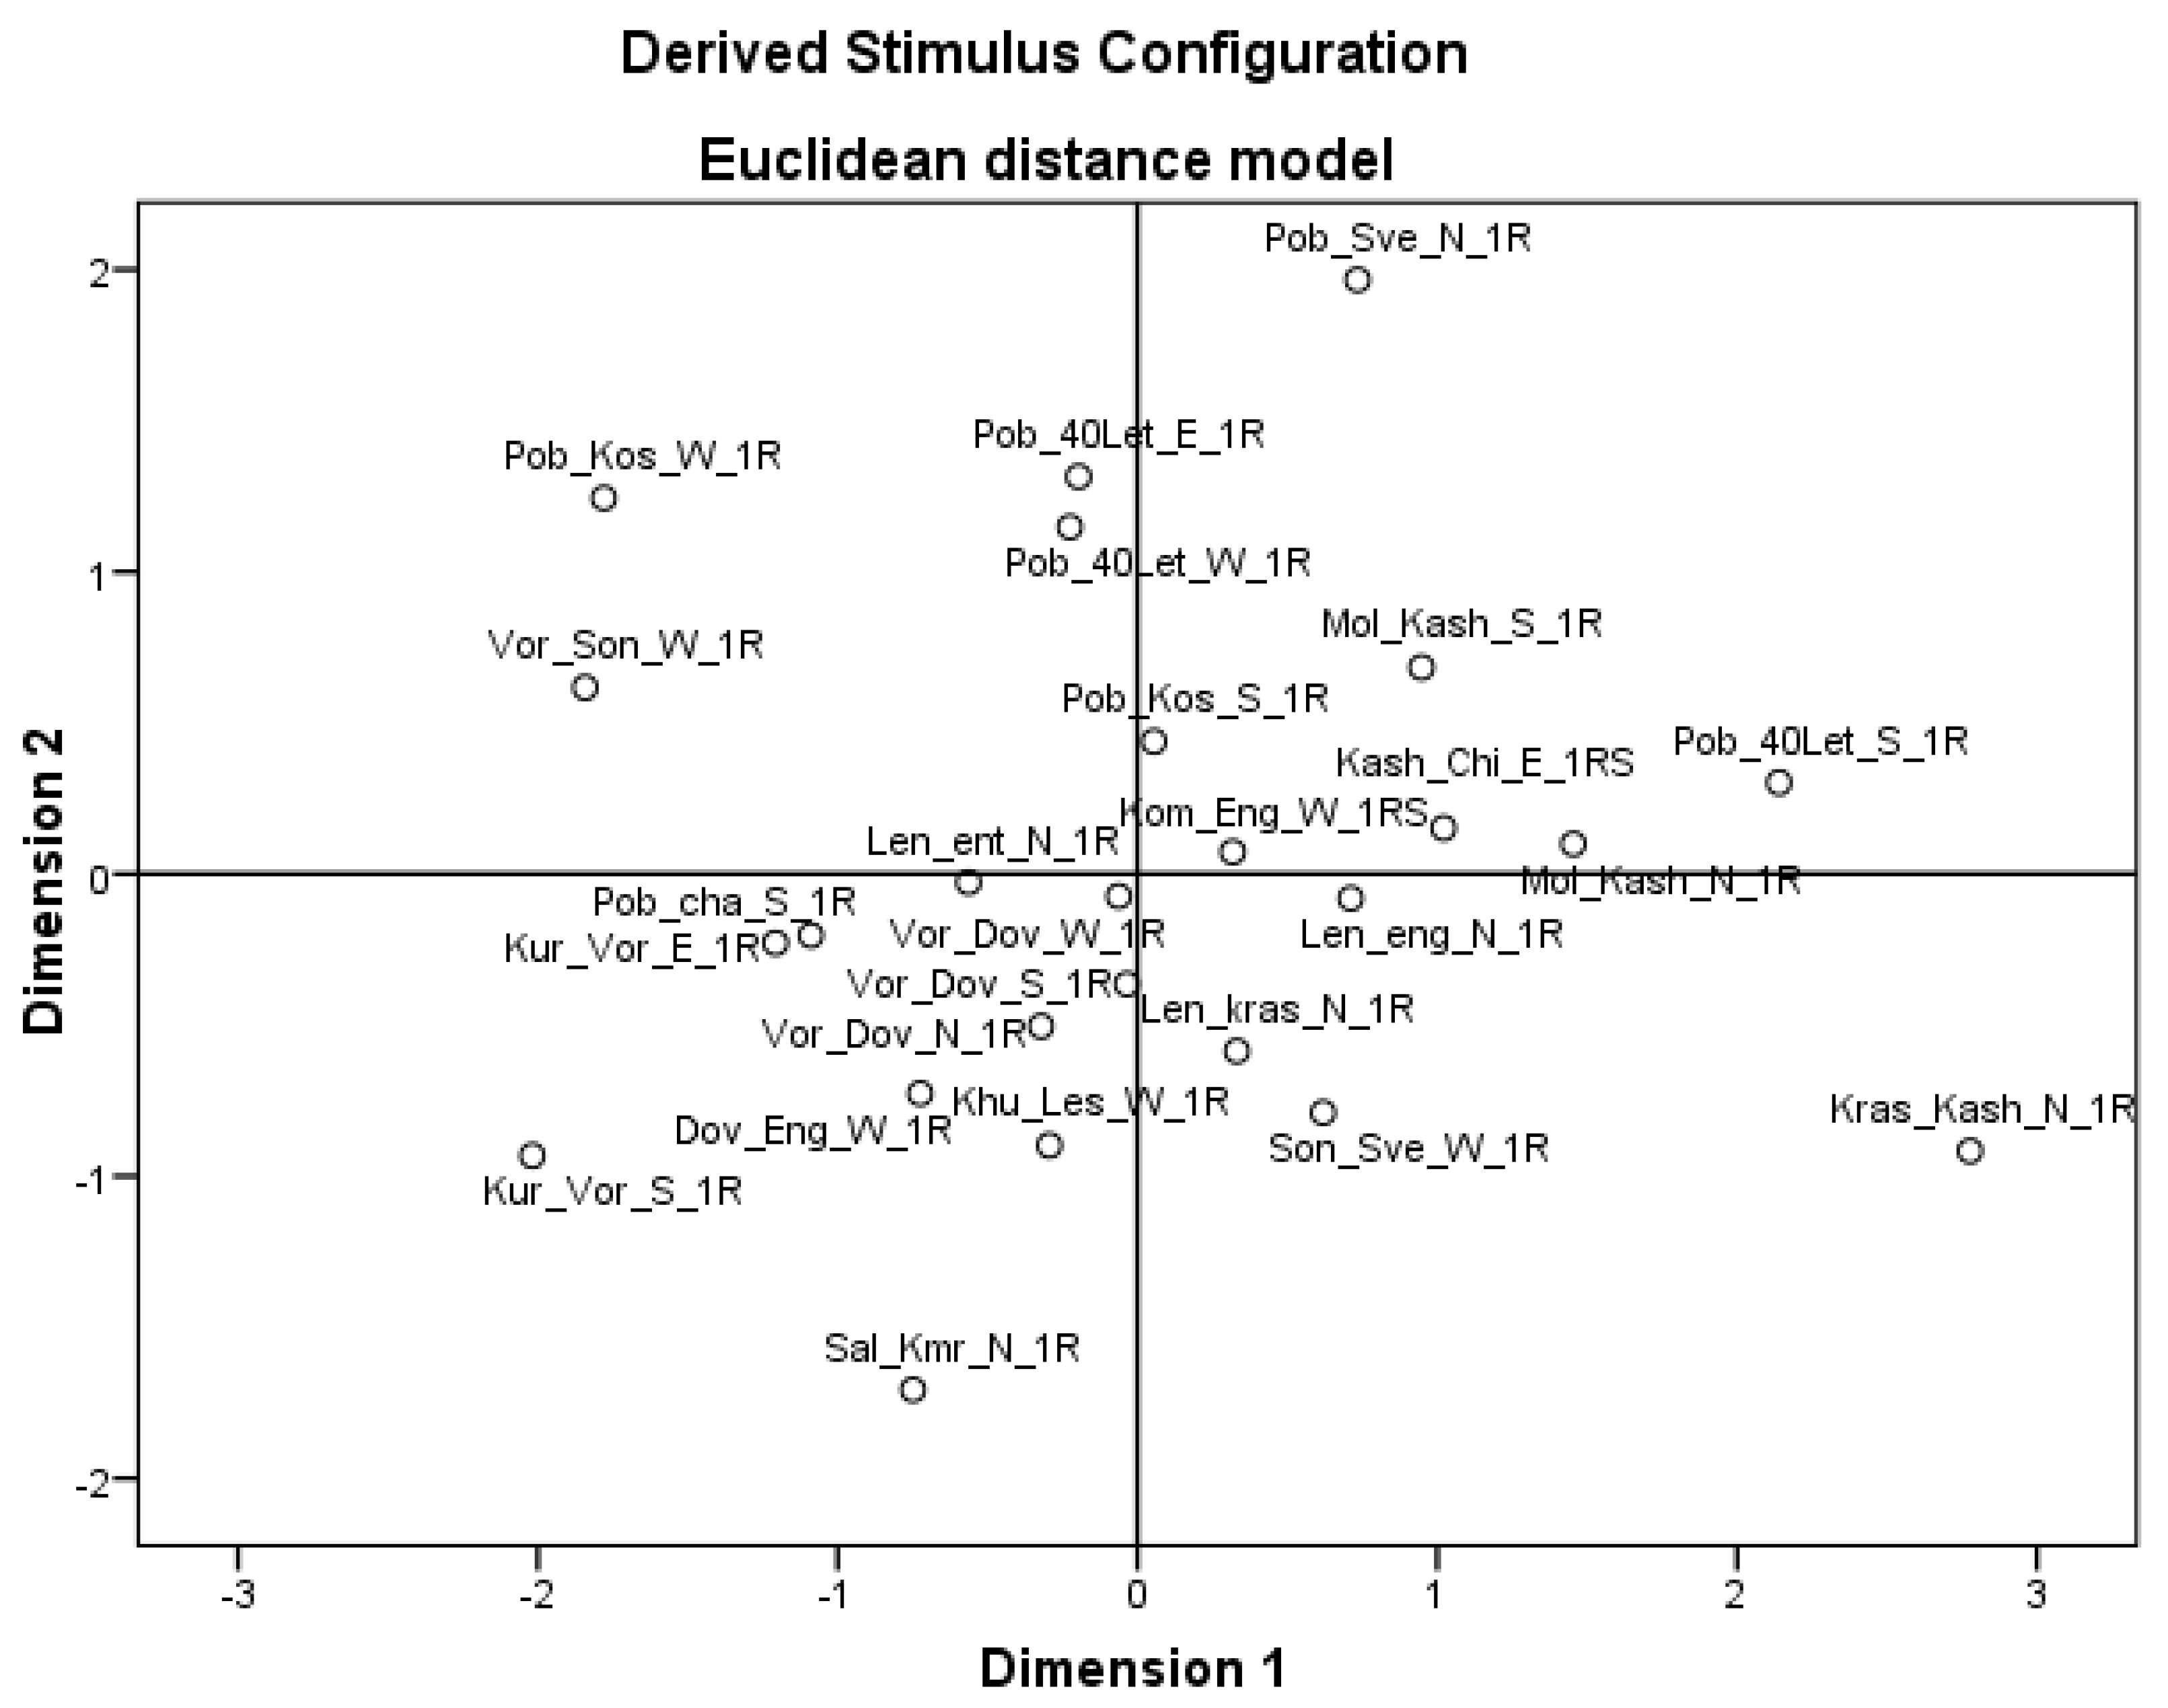
Multidimensional scaling is used as a tool for visual presentation (visualization) of source data. It allows presenting complex data in a visual form, which facilitates their perception and interpretation in comparison with a tabular form. In our case, the intersections under study are described by twenty-one variables. However, using the ALSCAL (Alternating Least-squares SCALing) multidimensional scaling procedure, it is possible to compress the dimension of the original space to two and present the totality of the intersections being studied as points on a plane. In this case, there is some distortion of information, but the methods of multidimensional scaling are designed so that these distortions are minimal. The results of the multidimensional scaling are shown in Figure 5.
Proximity of the points in Figure 6 indicates the degree of similarity of the corresponding intersections across the entire set of source variables. For example, the intersections of Pob_40Let_E_1R and Pob_40Let_W_1R, Son_Sve_W_1R and Len_kras_N_1R are quite close in their characteristics. However, Pob_Sve_N_1R, Sal_Kmr_N_1R and Kras_Kash_N_1R intersections are very different from the other ones. Besides, one can see that these intersections are very different from each other. A detailed analysis of the results will allow us to make the right management decisions to improve the transport and logistics infrastructure.
4. Fuzzy Method
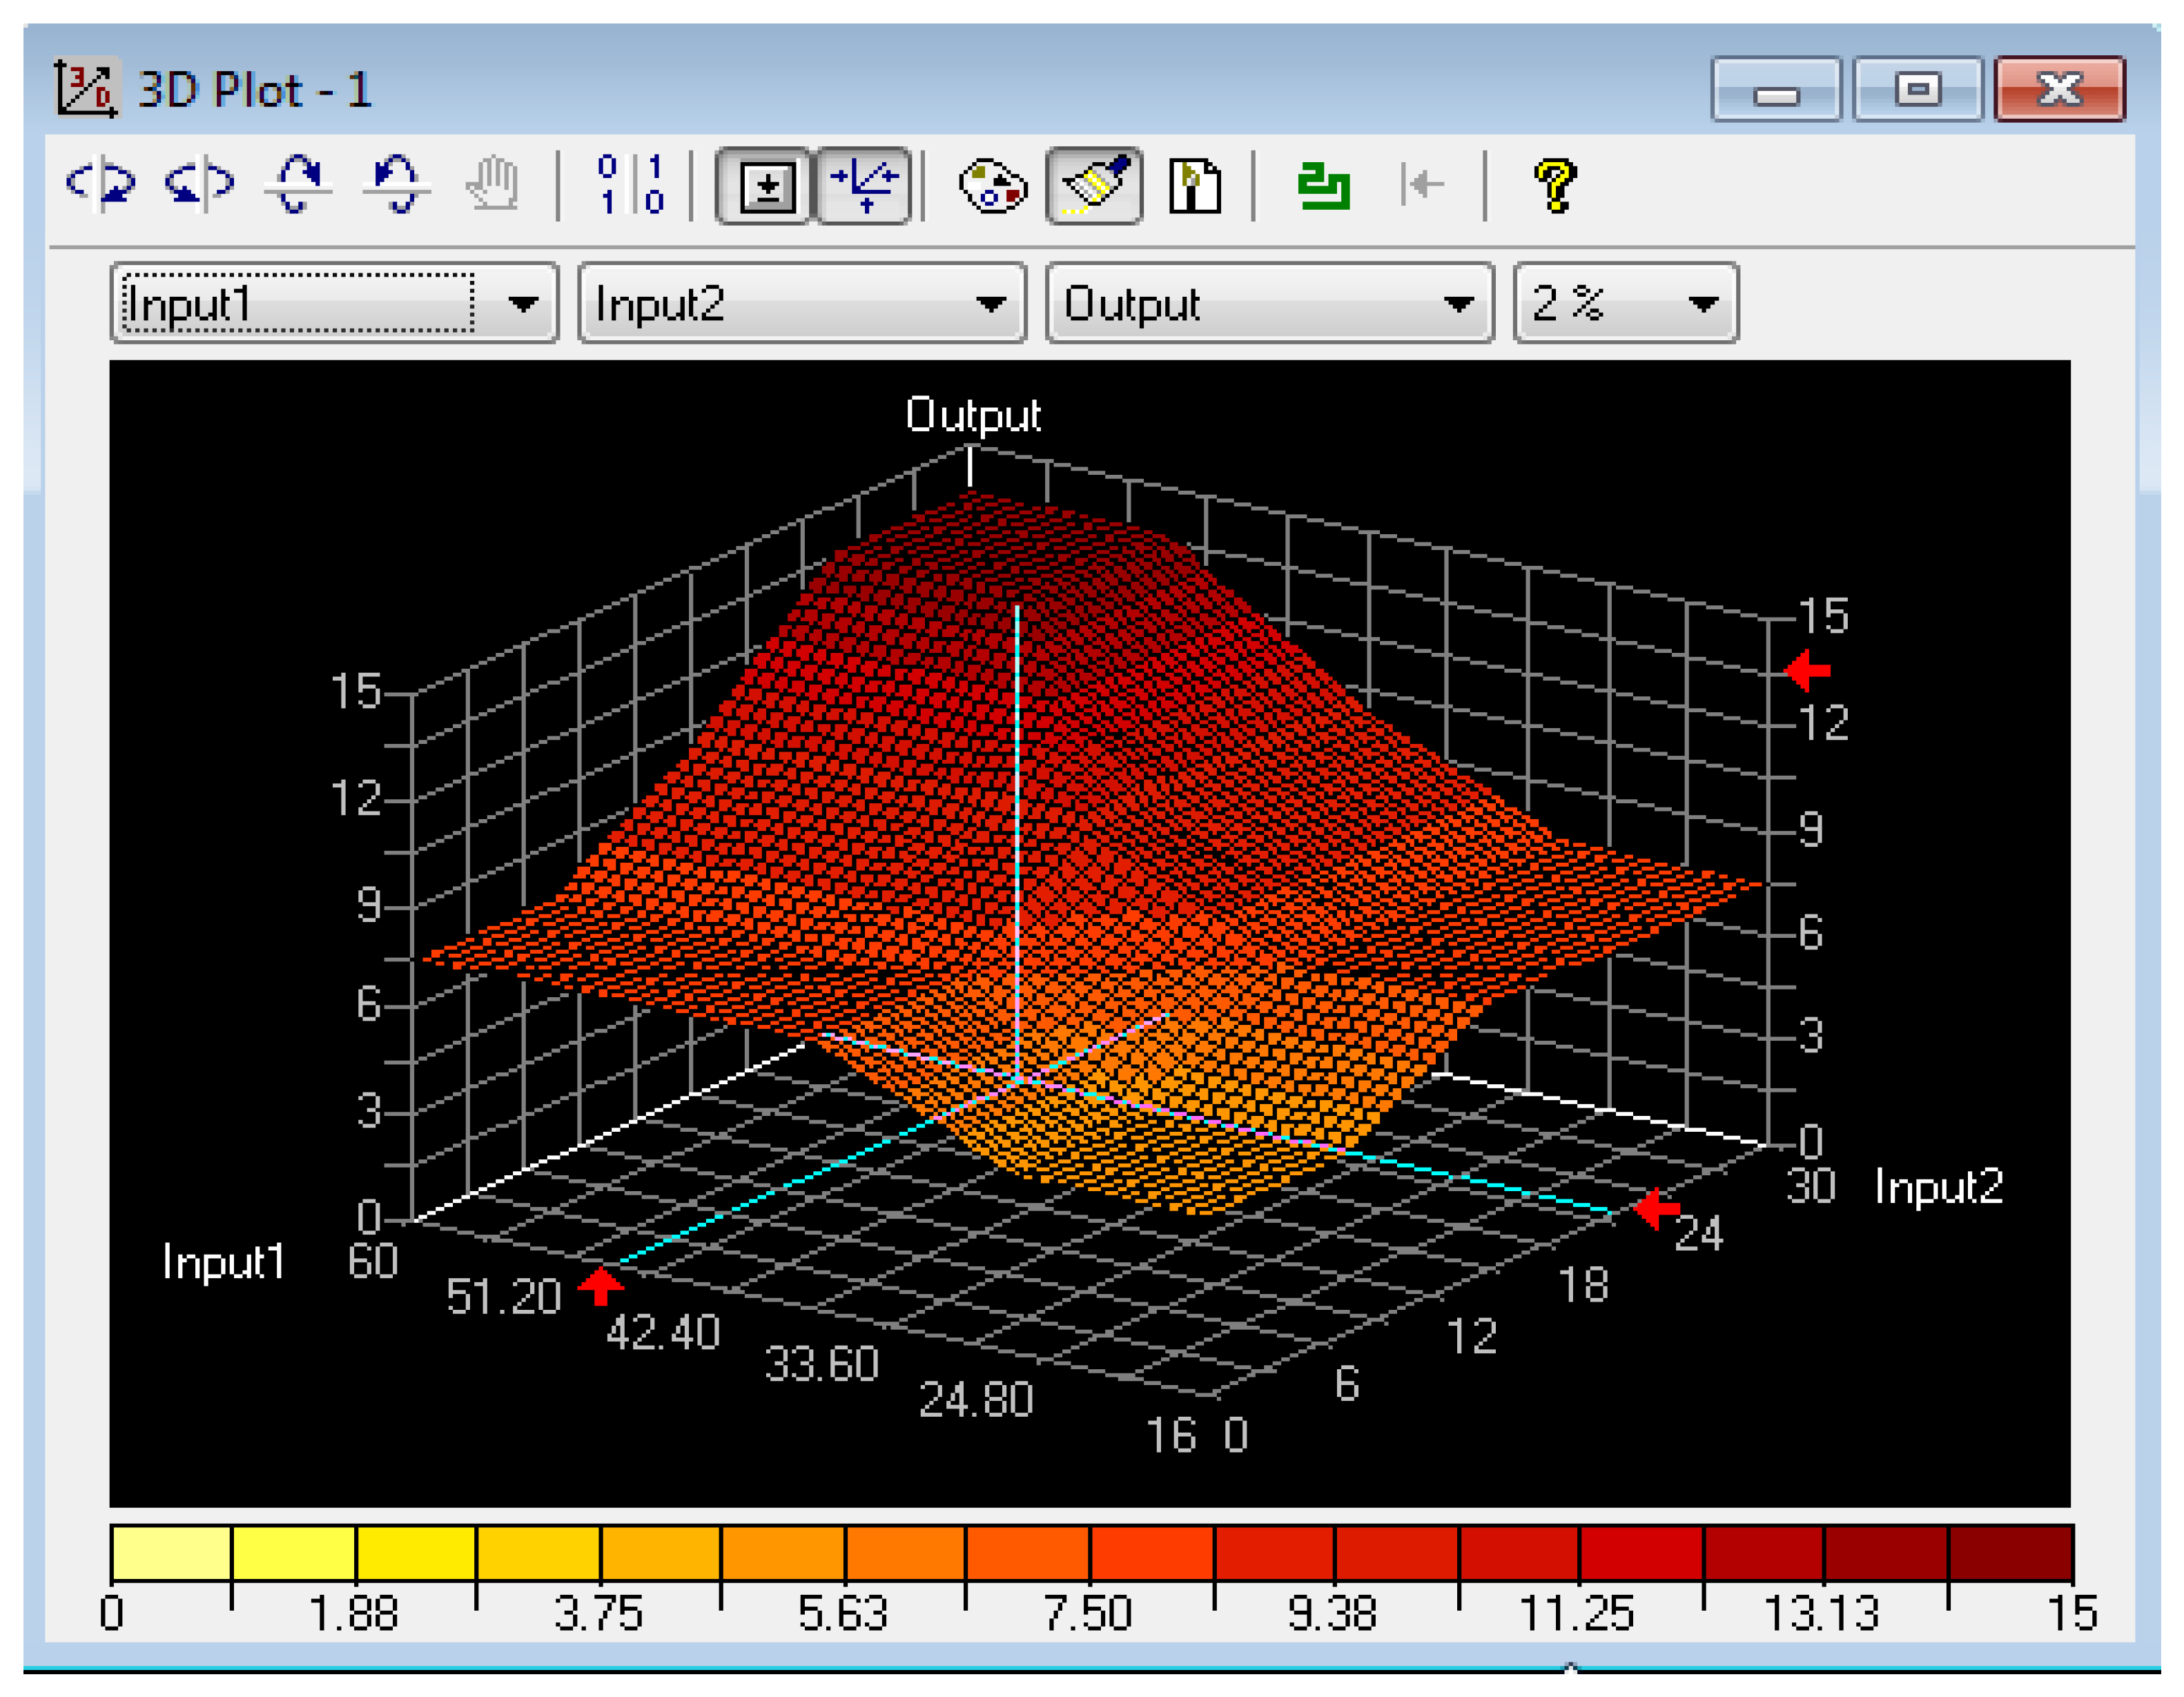
In the previous sections it was noted that The actual number of passing cars (Output) is taken as the dependent variable. In our studies, it varies from 0 to 20. As shown by multiple regression analysis, the dependent variable is most affected by the independent variable Duration of the resolving signal of a traffic light (Input1), which varies from 16 to 60. Then the independent variables go Sampling for the maximum possible number of vehicles driving without pedestrians (Input2) ranging from 0 to 30 and L2-the curvature of the carriageway when turning right (Input3) ranging from 7 to 40.
The obtained results make it possible to construct a model based on fuzzy mathematical method and fuzzy TECH computer program for predicting the values of the dependent variable Output depending on the values of the independent variables Input1, Input2, Input3. The block diagram of the constructed model is shown in Figure 6.
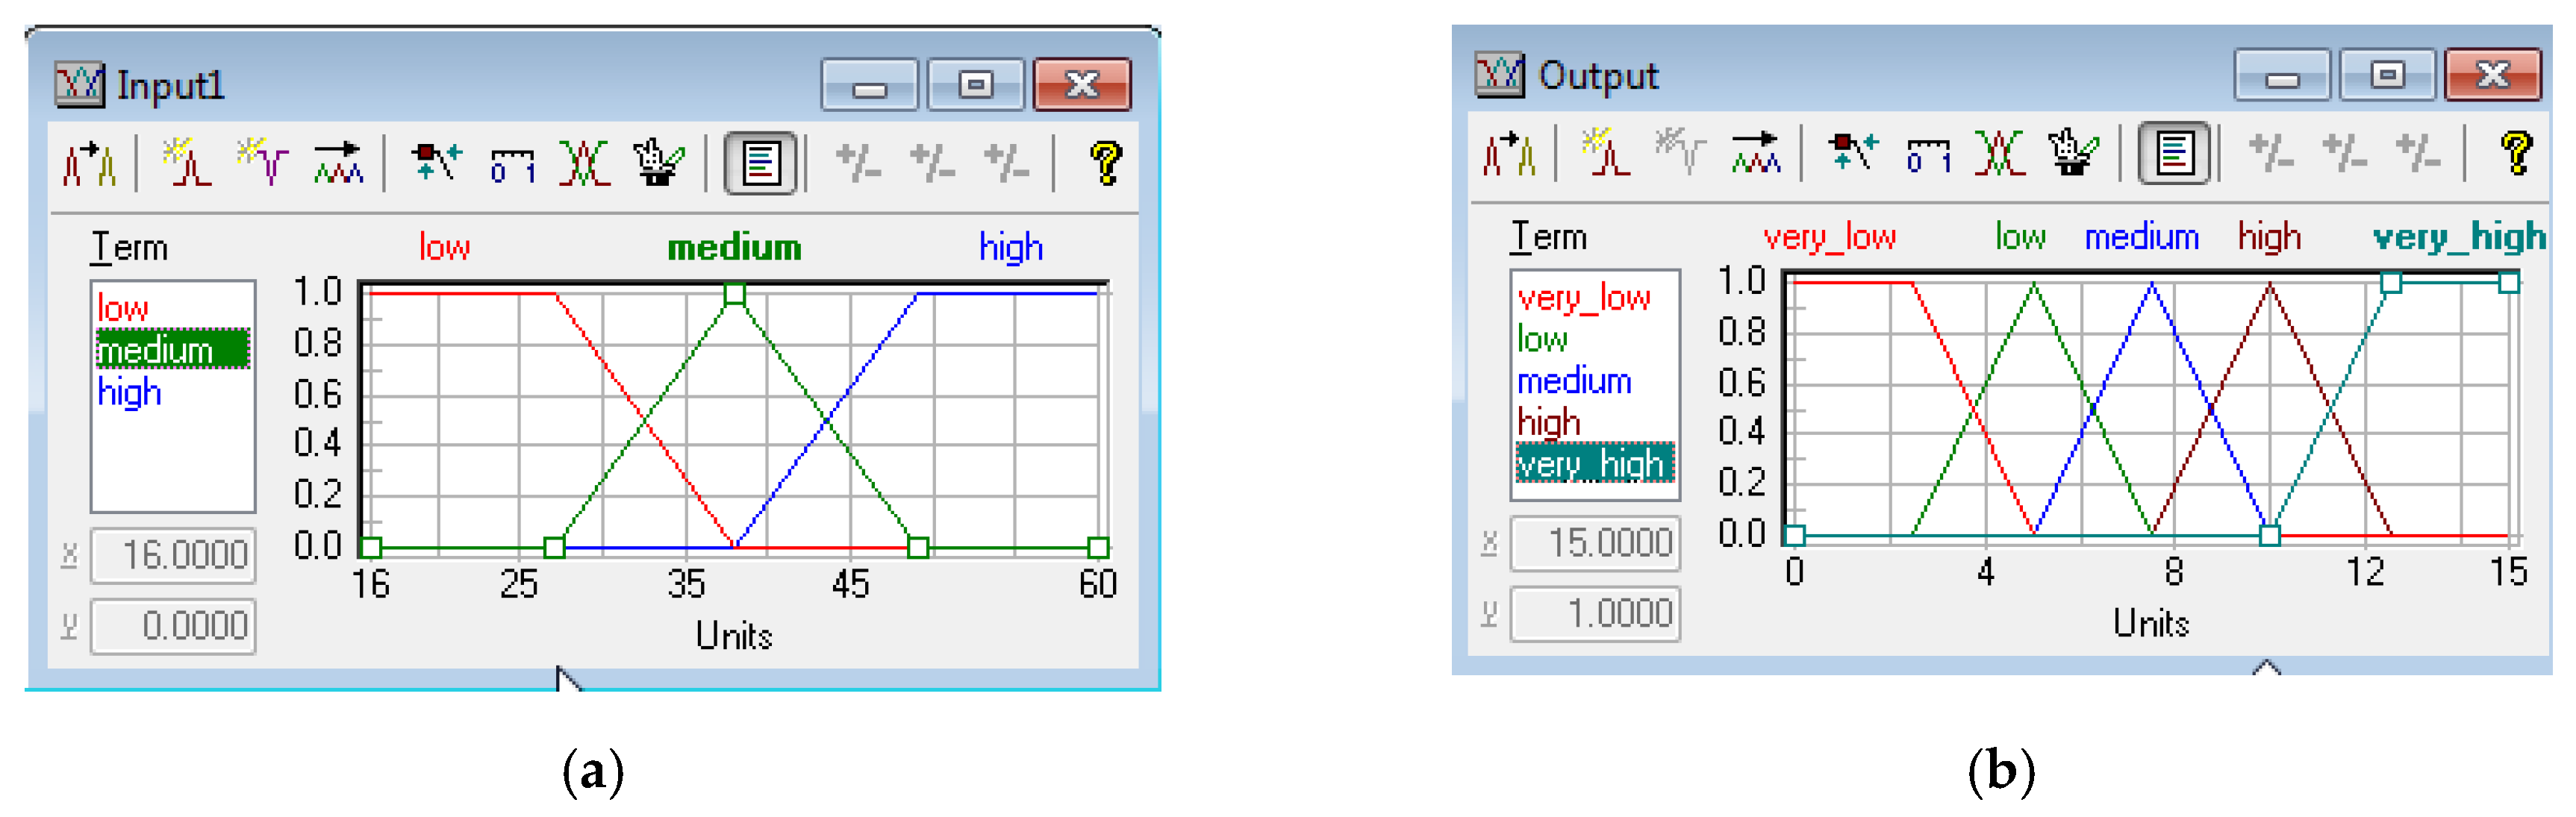
For the independent variables Input1, Input2, Input3 number of terms is taken equal to 3 (low, medium, high). For the dependent variable, Output number of terms is set to 5 (very low, low, medium, high, very high). The distribution of the values of the independent variable Input1 is shown in Figure 7a. Similar distribution of values takes place for the independent variables Input2 and Input3. For the dependent variable Output, the distribution of values is shown in Figure 7b.
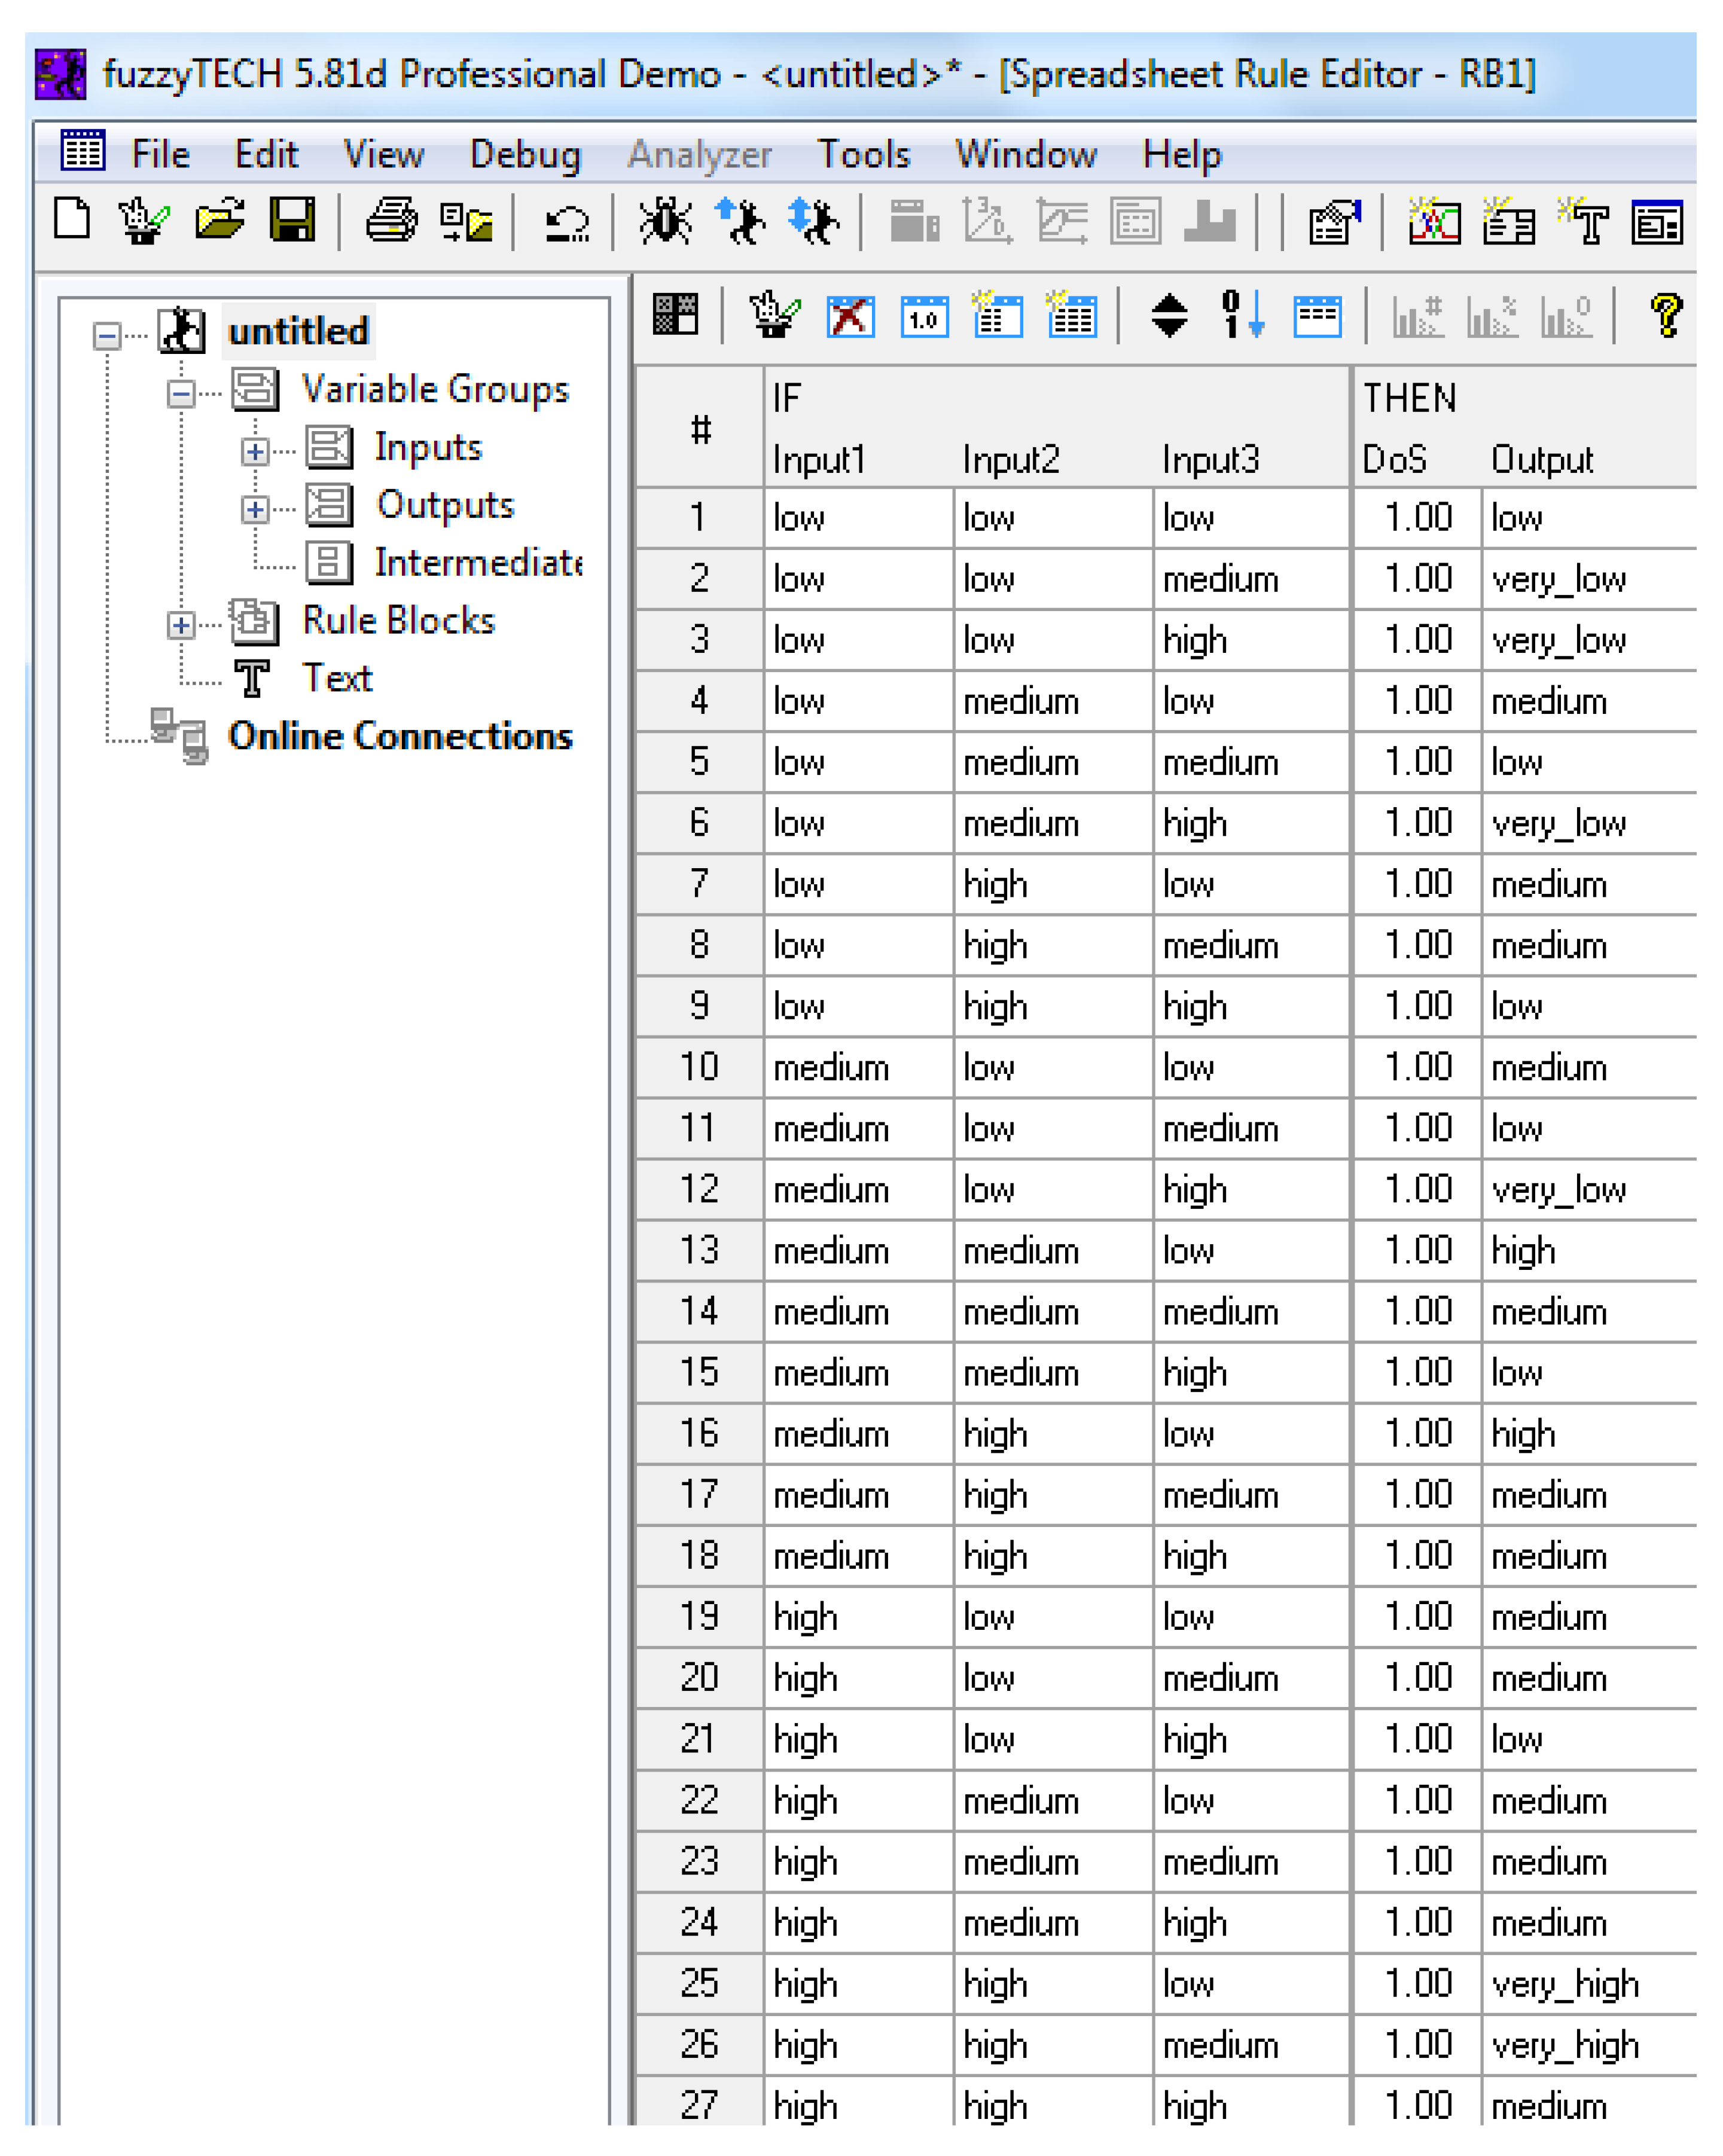
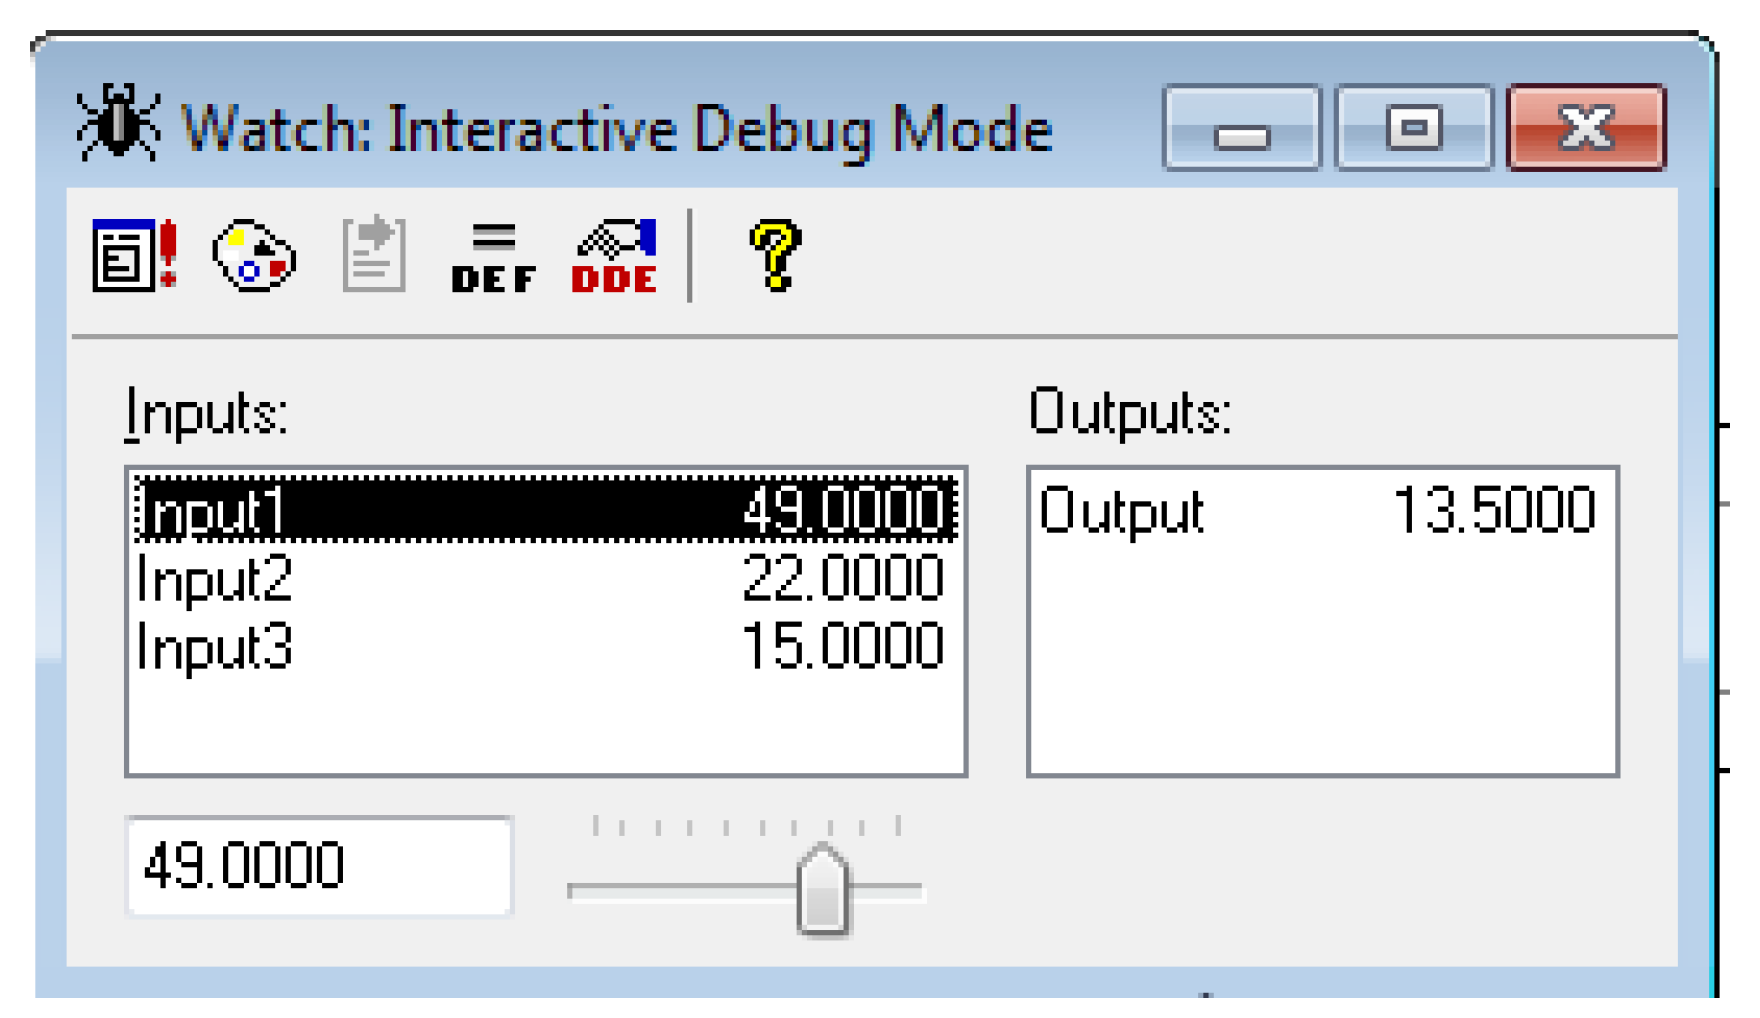
By setting the relationship among the dependent and independent variables using the Speadsheet rule editor block (Figure 8), the fuzzy logic model for predicting the values of the dependent variable was developed. For example, if there are the values Input1 = 49, Input2 = 22, Input3 = 15, then the value of the dependent variable will be Output = 13.5. (Figure 9). Note that when we performed multiple regression analysis with the same values of independent variables Duration of the resolving signal of a traffic light (Input1), Sampling for the maximum possible number of vehicles driving without pedestrians (Input2) and L2-the curvature of the carriageway when turning right (Input3), we got that The actual number of passing cars (Output) was equal to 13. As you can see, the results are very close and the difference in the results does not exceed 5 percent.
Figure 10 shows a three-dimensional graph of the function Output (Input1, Input2).
5. Results and Discussion
This paper describes a data collection system for detecting vehicles in urban traffic monitoring. The system works with Intersvyaz street cameras and is a software based on neural networks. For recognition of vehicles and pedestrians, the system uses the R-CNN mask.
Based on the data obtained, a multiple regression analysis was carried out, which made it possible to identify the characteristics of intersections that most influenced their traffic capacity. Based on the identified characteristics, a model was developed based on fuzzy logic methods and the Fuzzy TECH 5.81d Professional Edition computer program. The developed model allows you to make forecasts for the throughput of intersections, depending on the characteristics of the transport system.
Comparison of the results obtained using multivariate regression analysis and fuzzy modeling methods showed good convergence. The error of the results is in the range of 5–10 percent. As the experimental results showed, the proposed system can calculate vehicles and classify their direction of movement during peak hours on weekdays with an average absolute percentage error of less than 10%. The proposed method provides more accurate detection of small vehicles. It is important to note that the proposed method tracks not only vehicles, but also pedestrians.
6. Conclusions
The statistical analysis of the collected information made it possible to identify the most important characteristics of the intersections that affect their throughput under traffic congestion conditions. They are the following:
- Duration of the resolving signal of a traffic light has the greatest effect on the dependent variable.
- Sampling for the maximum possible number of vehicles driving without pedestrians.
- The curvature of the carriageway when turning right.
- Time of leaving the 1st vehicle of the pedestrian crossing, taking into account the distance of 1 meter to the pedestrian crossing and its release.
- Number of vehicles driven in the 2nd window.
An analysis of the results of the regression analysis made it possible to develop a model of vehicle traffic at intersections based on the methods of fuzzy mathematical logic and the corresponding computer program. The developed model allows you to make forecasts of the throughput of intersections, depending on their initial parameters. Besides, this analysis allows you to provide the implementation of segmentation of the intersections by initial characteristics and visualization of the results obtained. Studies have shown that by obtaining data on the patterns of drivers and pedestrians at a particular intersection, it is possible to reduce the waiting time for a traffic light signal for pedestrians by up to 30% compared to conventional adaptive systems.
Author Contributions
Conceptualization, V.S. and S.A.; Methodology, V.S. and S.S.; Validation, V.S. and S.A.; Formal Analysis, S.A., K.N. and S.S.; Investigation, V.S., S.A. and K.N.; Resources, V.S. and K.N.; Data Collection, V.S. and K.N.; Writing—Original Draft Preparation, S.A.; Writing—Review & Editing, V.S.; Visualization, V.S., S.A. and S.S.; Supervision, V.S.; Project Administration, S.A. All of the authors contributed significantly to the completion of this manuscript, conceiving and designing the research, writing and improving the paper. All authors have read and approved the manuscript.
Funding
The work was supported by the Government of the Russian Federation (Resolution No. 211 of 16 March 2013), contract No. 02.A03.21.0011.
Acknowledgments
The authors thank South Ural State University (SUSU) for support of the research.
Conflicts of Interest
The authors declare no conflicts of interest.
References
- Buch, N.; Velastin, S.A.; Orwell, J. A review of computer vision techniques for the analysis of urban traffic. IEEE Trans. Intell. Transp. Syst. 2011, 12, 920–939. [Google Scholar] [CrossRef]
- Husain, A.A.; Maity, T.; Yadav, R.K. Vehicle detection in intelligent transport system under a hazy environment: A survey. IET Image Process. 2020, 14, 1–10. [Google Scholar] [CrossRef]
- Stetsenko, I.V.; Stelmakh, O. Traffic Lane Congestion Ratio Evaluation by Video Data. Available online: https://0-link-springer-com.brum.beds.ac.uk/chapter/10.1007%2F978-3-030-25741-5_18 (accessed on 2 February 2019).
- Kim., H.; Song, B. Vehicle recognition based on radar and vision sensor fusion for automatic emergency braking. In Proceedings of the 2013 13th International Conference on Control, Automation and Systems (ICCAS), Gwangju, Korea, 13 October 2013; pp. 1342–1346. [Google Scholar] [CrossRef]
- Fedorov, A.; Nikolskaia, K.; Ivanov, S.; Shepelev, V.; Minbaleev, A. Traffic flow estimation with data from a video surveillance camera. J. Big Data 2019, 6, 1–15. [Google Scholar] [CrossRef]
- Harrell, F. Regression Modeling Strategies: With Applications to Linear Models, Logistic Regression, and Survival Analysis. Available online: http://0-dx-doi-org.brum.beds.ac.uk/10.1007/978-1-4757-3462-1 (accessed on 12 November 2019).
- King, R. Cluster Analysis and Data Mining. Available online: http://www.merclearning.com/titles/Cluster_Analysis_and_Data_Mining.htmlm (accessed on 15 February 2019).
- Borg, I.; Groenen, P. Modern Multidimensional Scaling: Theory and Applications, 2nd ed.; Springer: New York, NY, USA, 2005; pp. 207–212. ISBN 978-0-387-94845-4. [Google Scholar]
- Child, D. The Essentials of Factor Analysis, 3rd ed.; Continuum International Publishing Group: New York, NY, USA, 2006; ISBN 978-0-8264. Available online: https://www.isbns.co.tt/author/Dennis_A_Child (accessed on 22 March 2018).
- Castano, F.; Beruvides, G.; Haber, R.; Artunedo, A. Obstacle Recognition Based on Machine Learning for On-Chip LiDAR Sensors in a Cyber-Physical System. Sensors 2017, 17, 2109. [Google Scholar] [CrossRef] [PubMed] [Green Version]
- Castano, F.; Beruvides, G.; Villalonga, A.; Haber, R. Self-Tuning Method for Increased Obstacle Detection Reliability Based on Internet of Things LiDAR Sensor Models. Sensors 2018, 18, 1508. [Google Scholar] [CrossRef] [PubMed] [Green Version]
- Castano, F.; Strzelczak, S.; Villalonga, A.; Haber, R.; Kossakowska, J. Sensor Reliability in Cyber-Physical Systems Using Internet-of-Things Data: A Review and Case Study. Remote Sens. 2019, 11, 2252. [Google Scholar] [CrossRef] [Green Version]
- Kaklauskas, L.; Sakalauskas, L. On network traffic statistical analysis. Lith. Math. J. 2008, 314–319. [Google Scholar]
- Zhou, Y.; Nejati, H.; Do, T.; Cheung, N.; Cheah, L. Image-based vehicle analysis using deep neural network: A systematic study. In Proceedings of the 2016 IEEE International Conference on Digital Signal Processing (DSP), Beijing, China, 16–18 October 2016; pp. 276–280. Available online: https://0-ieeexplore-ieee-org.brum.beds.ac.uk/document/7868561 (accessed on 27 December 2018). [CrossRef] [Green Version]
- Biswas, D.; Su, H.; Wang, C.; Blankenship, J.; Stevanovic, A. An automatic car counting system using over-feat framework. Sensors 2017, 17, 1535. [Google Scholar] [CrossRef] [Green Version]
- Zhang, F.; Li, C.; Yang, F. Vehicle detection in urban traffic surveillance images based on convolutional neural networks with feature concatenation. Sensors 2019, 19, 594. [Google Scholar] [CrossRef] [Green Version]
- Girshick, R.; Donahue, J.; Darrell, T.; Malik, J. Rich feature hierarchies for accurate object detection and semantic segmentation. In Proceedings of the IEEE Conference on Computer Vision and Pattern Recognition (CVPR), Columbus, OH, USA, 23–28 June 2014; pp. 580–587. Available online: https://arxiv.org/abs/1311.2524 (accessed on 7 December 2014). [CrossRef] [Green Version]
- Uijlings, J.R.R.; Sande, K.E.A.; Gevers, T.; Smeulders, A.W.M. Selective search for object recognition. Int. J. Comput. Vis. 2013, 104, 154–171. [Google Scholar] [CrossRef] [Green Version]
- Wang, K.; Wang, R.; Feng, Y.; Zhang, H.; Huang, Q.; Jin, Y.; Zhang, Y. Vehicle recognition in acoustic sensor networks via sparse representation. In Proceedings of the IEEE International Conference on Multimedia and Expo Workshops (ICMEW), Chengdu, China, 14–18 July 2014; pp. 1–4. Available online: https://0-journals-sagepub-com.brum.beds.ac.uk/doi/10.1177/1550147717701435 (accessed on 7 December 2014). [CrossRef]
- McKay, T.; Salvaggio, C.; Faulring, J.; Salvaggio, F.; McKeown, D.; Garrett, A.; Coleman, D.; Koffman, L. Passive detection of vehicle loading. In Proceedings of the SPIE—The International Society for Optical Engineering, Burlingame, CA, USA, 15 February 2012; Available online: https://www.spiedigitallibrary.org/conference-proceedings-of-spie/8305/830511/Passive-detection-of-vehicle-loading/10.1117/12.912100.short?SSO=1 (accessed on 17 December 2014). [CrossRef]
- Mishra, P.; Banerjee, B. Multiple kernel based KNN classifiers for vehicle classification. Int. J. Comput. Appl. 2013, 71, 1–7. [Google Scholar] [CrossRef] [Green Version]
- Tang, T.; Thou, S.; Dag, Z.; Lei, L.; Zou, H. Arbitrary-oriented vehicle detection in aerial imagery with single convolutional neural networks. Remote Sens. 2017, 9, 1170. [Google Scholar] [CrossRef] [Green Version]
- Zhang, J.; Huang, M.; Jin, X.; Li, X. A real-time chinese traffic sign detection algorithm based on modified YOLOv2. Algorithms 2017, 10, 127. [Google Scholar] [CrossRef] [Green Version]
- Redmon, J.; Divvala, S.; Girshick, R.; Farhadi, A. You only look once: Unified. 2016, real-time object detection. In Proceedings of the 2016 IEEE Conference on Computer Vision and Pattern Recognition, Las Vegas, NV, USA, 27–30 June 2016; pp. 779–788. [Google Scholar] [CrossRef] [Green Version]
- Redmon, J.; Farhadi, A. You Only Look Once 9000: Better, Faster, Stronger. Available online: https://pjreddie.com/darknet/yolo/ (accessed on 27 November 2017).
- Tang, T.; Zhou, S.; Deng, Z.; Zou, H.; Lei, L. Vehicle detection in aerial images based on region convolutional neural networks and hard negative example mining. Sensors 2017, 17, 336. [Google Scholar] [CrossRef] [PubMed] [Green Version]
- Deng, Z.; Sun, H.; Zhou, S.; Zhao, J.; Zou, H. Toward fast and accurate vehicle detection in aerial images using coupled region-based convolutional neural networks. IEEE J. Sel. Top. Appl. Earth Obs. Remote Sens. 2017, 10, 3652–3664. [Google Scholar] [CrossRef]
- Qu, T.; Zhang, Q.; Sun, S. Vehicle detection from high-resolution aerial images using spatial pyramid pooling-based deep convolutional neural networks. Multimed. Tools Appl. 2017, 76, 21651–21663. [Google Scholar] [CrossRef]
- Buch, N.; Velastin, S.A.; Orwell, J. Urban road user detection and classification using 3D wire frame models. IET Comput. Vis. 2010, 4, 105–116. [Google Scholar] [CrossRef]
- Daigavane, P.M.; Bajaj, P.R. Real time vehicle detection and counting method for unsupervised traffic video on highways. Int. J. Comput. Sci. Netw. Secur. 2010, 10, 112–117. [Google Scholar]
- Chen, S.C.; Shyu, M.L.; Zhang, C. An intelligent framework for spatio-temporal vehicle tracking. In Proceedings of the 2001 IEEE Intelligent Transportation Systems Proceedings, Oakland, CA, USA, 25–29 August 2001; pp. 213–218. Available online: https://0-ieeexplore-ieee-org.brum.beds.ac.uk/document/948658 (accessed on 2 September 2007).
- Gupte, S.; Masoud, O.; Martin, R.F.; Papanikolopoulos, N.P. Detection and classification of vehicles. IEEE Trans. Intell. Transp. Syst. 2002, 3, 37–47. [Google Scholar] [CrossRef] [Green Version]
- Zhang, S.; Wen, L.; Bian, X.; Lei, Z.; Li, S.Z. Single-shot refinement neural network for object detection. In Proceedings of the IEEE Computer Society Conference on Computer Vision and Pattern Recognition, Salt Lake City, UT, USA, 18–23 June 2018; pp. 4203–4212. Available online: https://arxiv.org/abs/1711.06897 (accessed on 22 October 2018).
- Liu, Y.; Wang, R.; Shan, S.; Chen, X. Structure inference net: Object detection using scene-level context and instance-level relationships. In Proceedings of the IEEE Conference on Computer Vision and Pattern Recognition (CVPR), Salt Lake City, UT, USA, 13 June 2018; Volume 8578828, pp. 6985–6994. [Google Scholar]
- Zhou, P.; Ni, B.; Geng, C.; Hu, J.; Xu, Y. Scale-transferrable object detection. In Proceedings of the IEEE Conference on Computer Vision and Pattern Recognition (CVPR), Salt Lake City, UT, USA, 18–23 June 2018; Volume 8578160, pp. 528–537. [Google Scholar]
- Li, S. 3D-DETNet: A single stage video-based vehicle detector. In Proceedings of the Third International Workshop on Pattern Recognition, International Society for Optics and Photonics, Jinan, China, 26 July 2018; Volume 10828, p. 108280A. Available online: https://arxiv.org/abs/1801.01769 (accessed on 13 September 2018).
- Wang, X.; Cheng, P.; Liu, X.; Uzochukwu, B. Focal loss dense detector for vehicle surveillance. In Proceedings of the 2018 International Conference on Intelligent Systems and Computer Vision (ISCV), Fez, Morocco, 2–4 April 2018; Available online: https://arxiv.org/abs/1708.02002 (accessed on 7 September 2018).
- Lin, T.Y.; Goyal, P.; Girshick, R.; He, K.; Dollar, P. Focal loss for dense object detection. IEEE Trans. Pattern Anal. Mach. Intell. 2018, 42, 318–327. [Google Scholar] [CrossRef] [Green Version]
- Hu, X.; Xu, X.; Xiao, Y.; Chen, H.; He, S.; Qin, J.; Heng, P. A scale-insensitive convolutional neural network for fast vehicle detection. IEEE Trans. Intell. Transp. Syst. 2019, 20, 1010–1019. [Google Scholar] [CrossRef] [Green Version]
- Gandhi, R. R-CNN, Fast R-CNN, Faster R-CNN, YOLO—Object Detection Algorithms. Available online: https://towardsdatascience.com/r-cnn-fast-r-cnn-faster-r-cnn-yolo-object-detectionalgorithms-36d53571365e (accessed on 12 June 2018).
- Hajji, H. Statistical Analysis of Network Traffic for Adaptive Faults Detection. IEEE Trans. Neural Netw. 2005, 16, 1053–1063. [Google Scholar] [CrossRef] [PubMed]
- Jia, W.; Shukla, R.; Sengupta, S. Anomaly Detection using Supervised Learning and Multiple Statistical Methods. In Proceedings of the 2019 18th IEEE International Conference On Machine Learning and Applications (ICMLA), Boca Raton, FL, USA, 16–19 December 2019; Available online: https://www.researchgate.net/publication/336902630 (accessed on 18 November 2019).
- Rousseeuw, P.; Hubert, M. Anomaly detection by robust statistics. Wiley Interdiscip. Rev. Data Min. Knowl. Discov. 2018, 8, e1236. [Google Scholar] [CrossRef] [Green Version]
- Csiszar, C.; Földes, D. Analysis and Modelling Methods of Urban Integrated Information System of Transportation. In Proceedings of the 2015 Smart Cities Symposium Prague (SCSP), Prague, Czech Republic, 24–25 June 2015; pp. 24–25, ISBN 978-1-4673-6727-1. Available online: https://0-ieeexplore-ieee-org.brum.beds.ac.uk/document/7181574 (accessed on 14 September 2016). [CrossRef] [Green Version]
- Szigeti, S.; Csiszar, C.; Földes, D. Information Management of Demand-responsive Mobility Service Based on Autonomous Vehicles. Procedia Eng. 2017, 187, 483–491. [Google Scholar] [CrossRef] [Green Version]
Figure 1.
Examples of intersections where cars pass through a green traffic light and pass pedestrians at a pedestrian crossing: (a) 11.03.2019; (b) 11.04.2019; (c) 12.17.2019; (d) 12.18.2019. (Source: Authors).
Figure 1.
Examples of intersections where cars pass through a green traffic light and pass pedestrians at a pedestrian crossing: (a) 11.03.2019; (b) 11.04.2019; (c) 12.17.2019; (d) 12.18.2019. (Source: Authors).

Figure 2.
Examples of images obtained from road cameras in different seasons: (a) summer time, (b) winter time. (Source: Authors).
Figure 2.
Examples of images obtained from road cameras in different seasons: (a) summer time, (b) winter time. (Source: Authors).

Figure 3.
Images from road video cameras with observation marks in different moments of time: (a) 03.03.2019; (b) 03.04.2019. (Source: Authors).
Figure 3.
Images from road video cameras with observation marks in different moments of time: (a) 03.03.2019; (b) 03.04.2019. (Source: Authors).

Figure 4.
Scatterplot of standardized residuals against predicted values. (Source: Authors).

Figure 5.
Final configuration of the compared intersections. (Source: Authors).

Figure 6.
Block diagram. (Source: Authors).

Figure 7.
Distributions of values: (a) for Input1; (b) for Output. (Source: Authors).

Figure 8.
Example of relationship rules. (Source: Authors).

Figure 9.
Example of prediction. (Source: Authors).

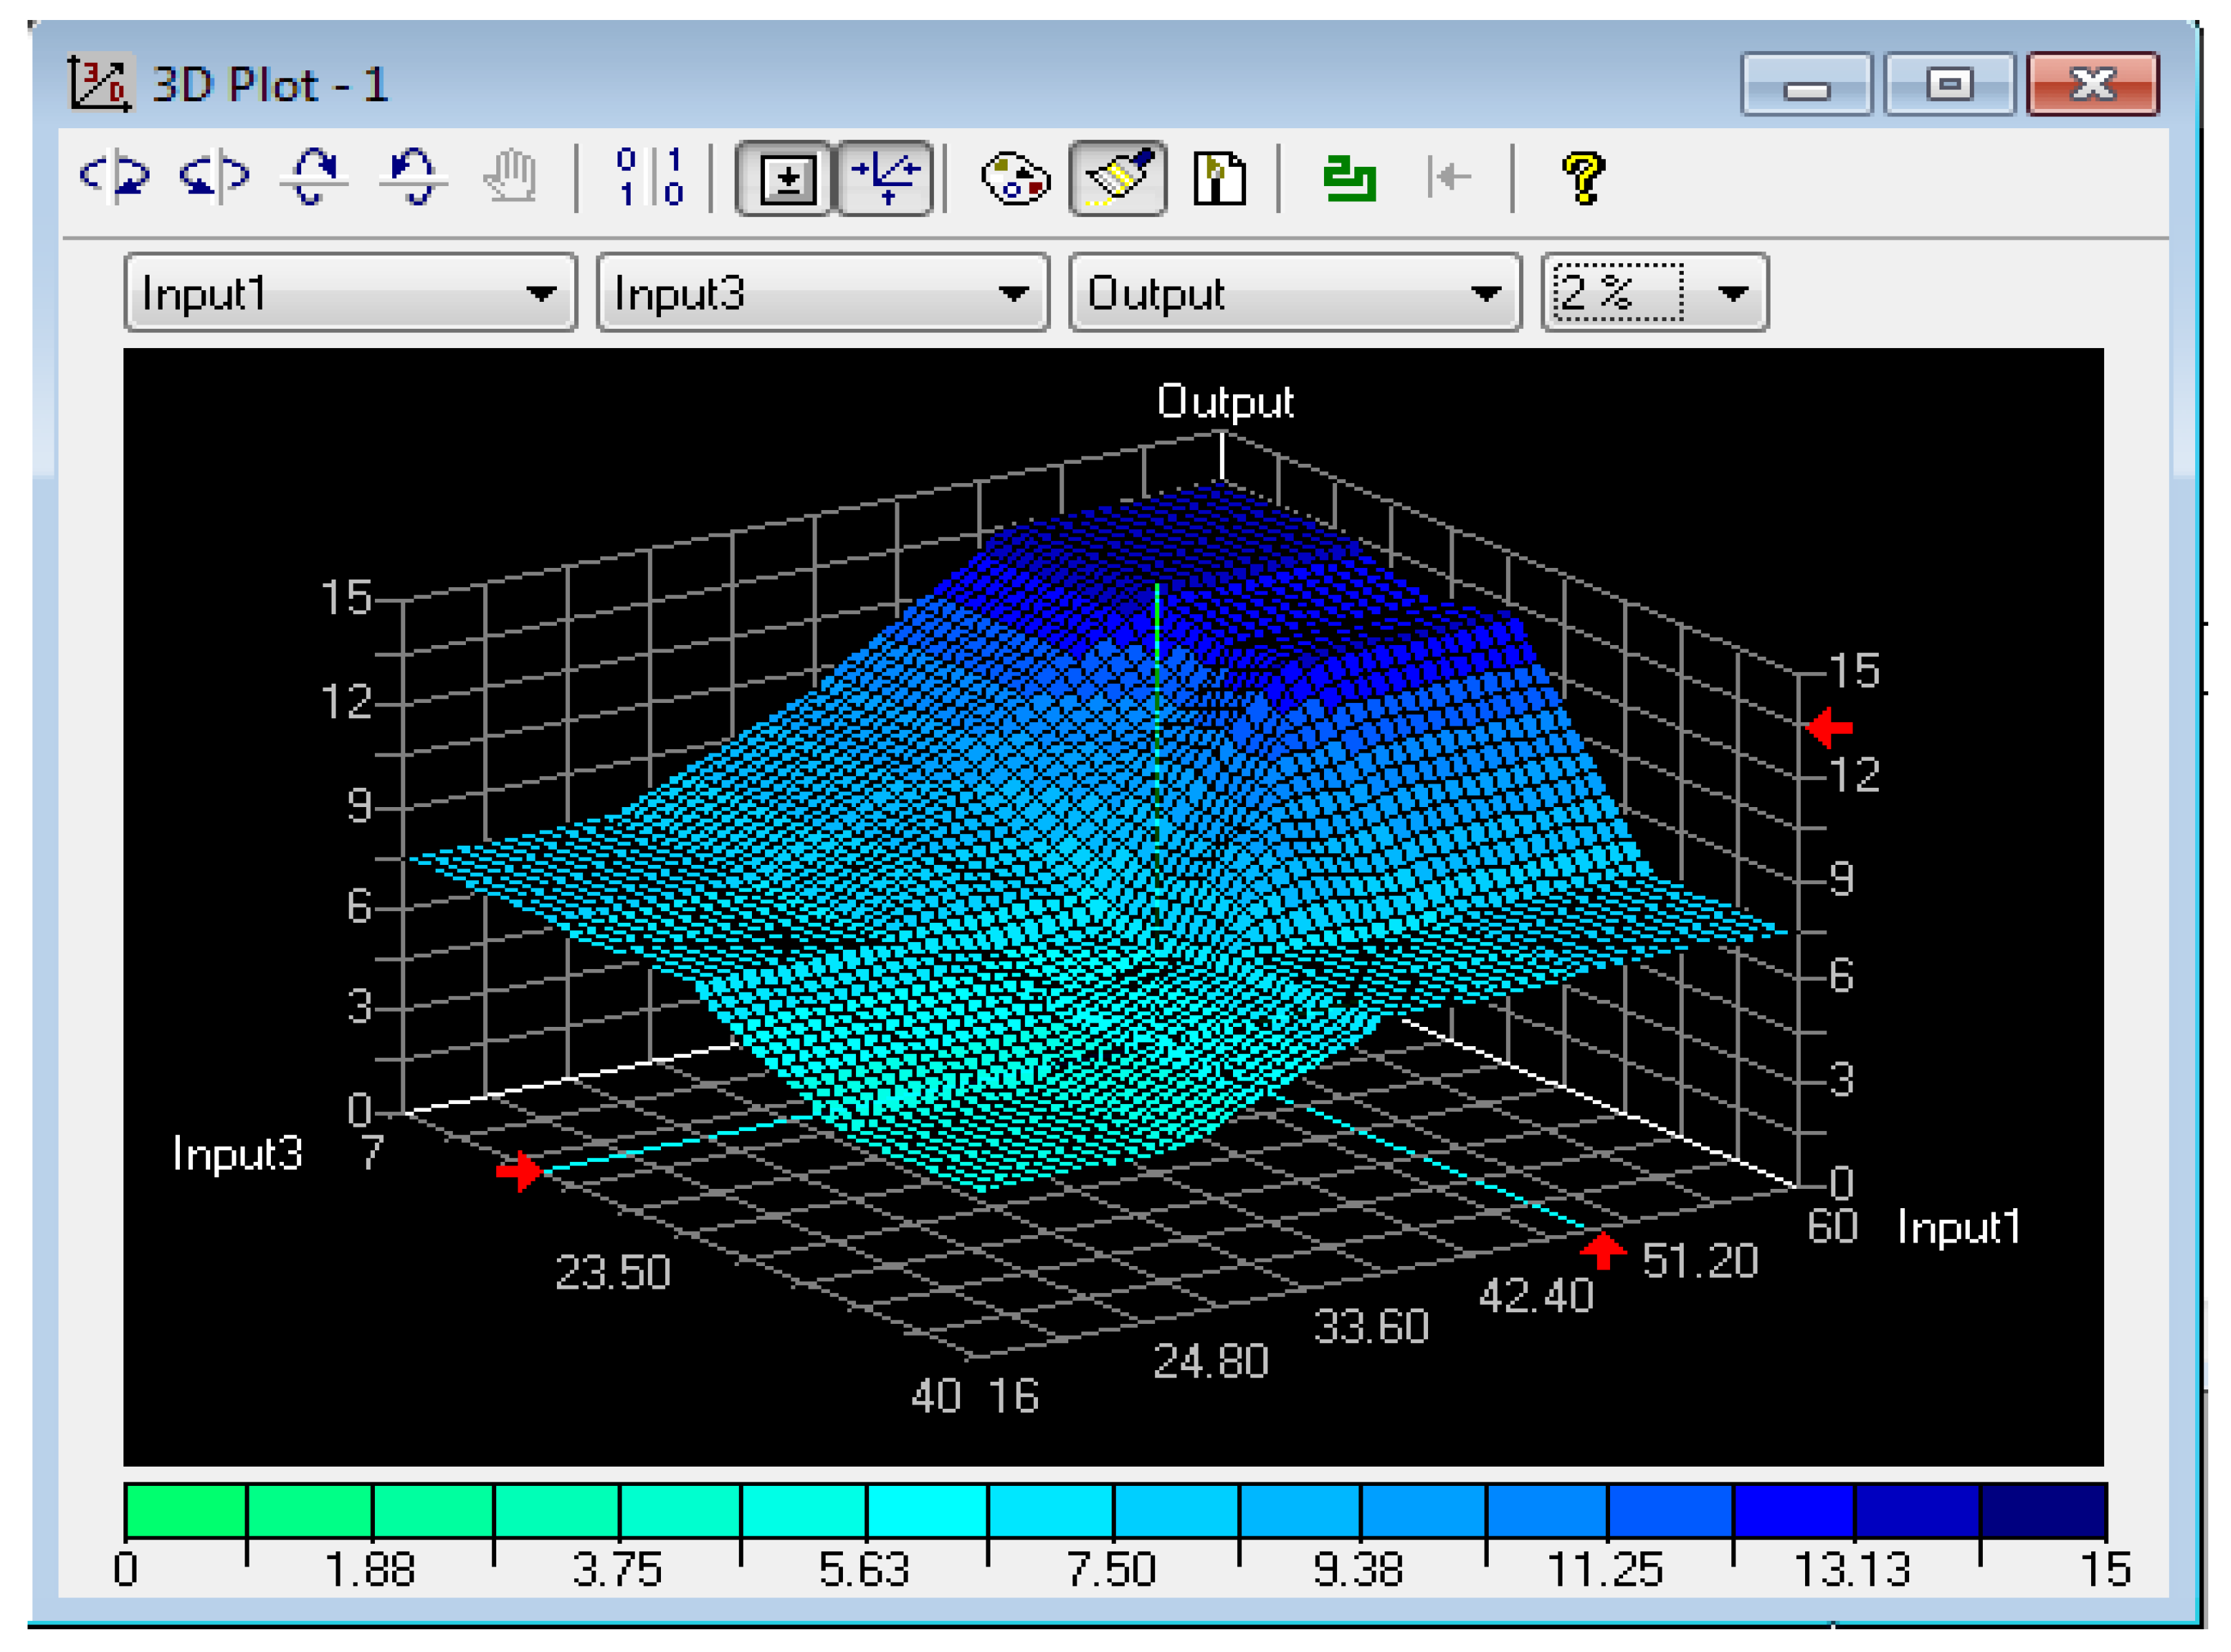
Figure 10.
Graph of function Output (Input1, Input3). (Source: Authors).

Figure 11.
Graph of function Output (Input1, Input3). (Source: Authors).

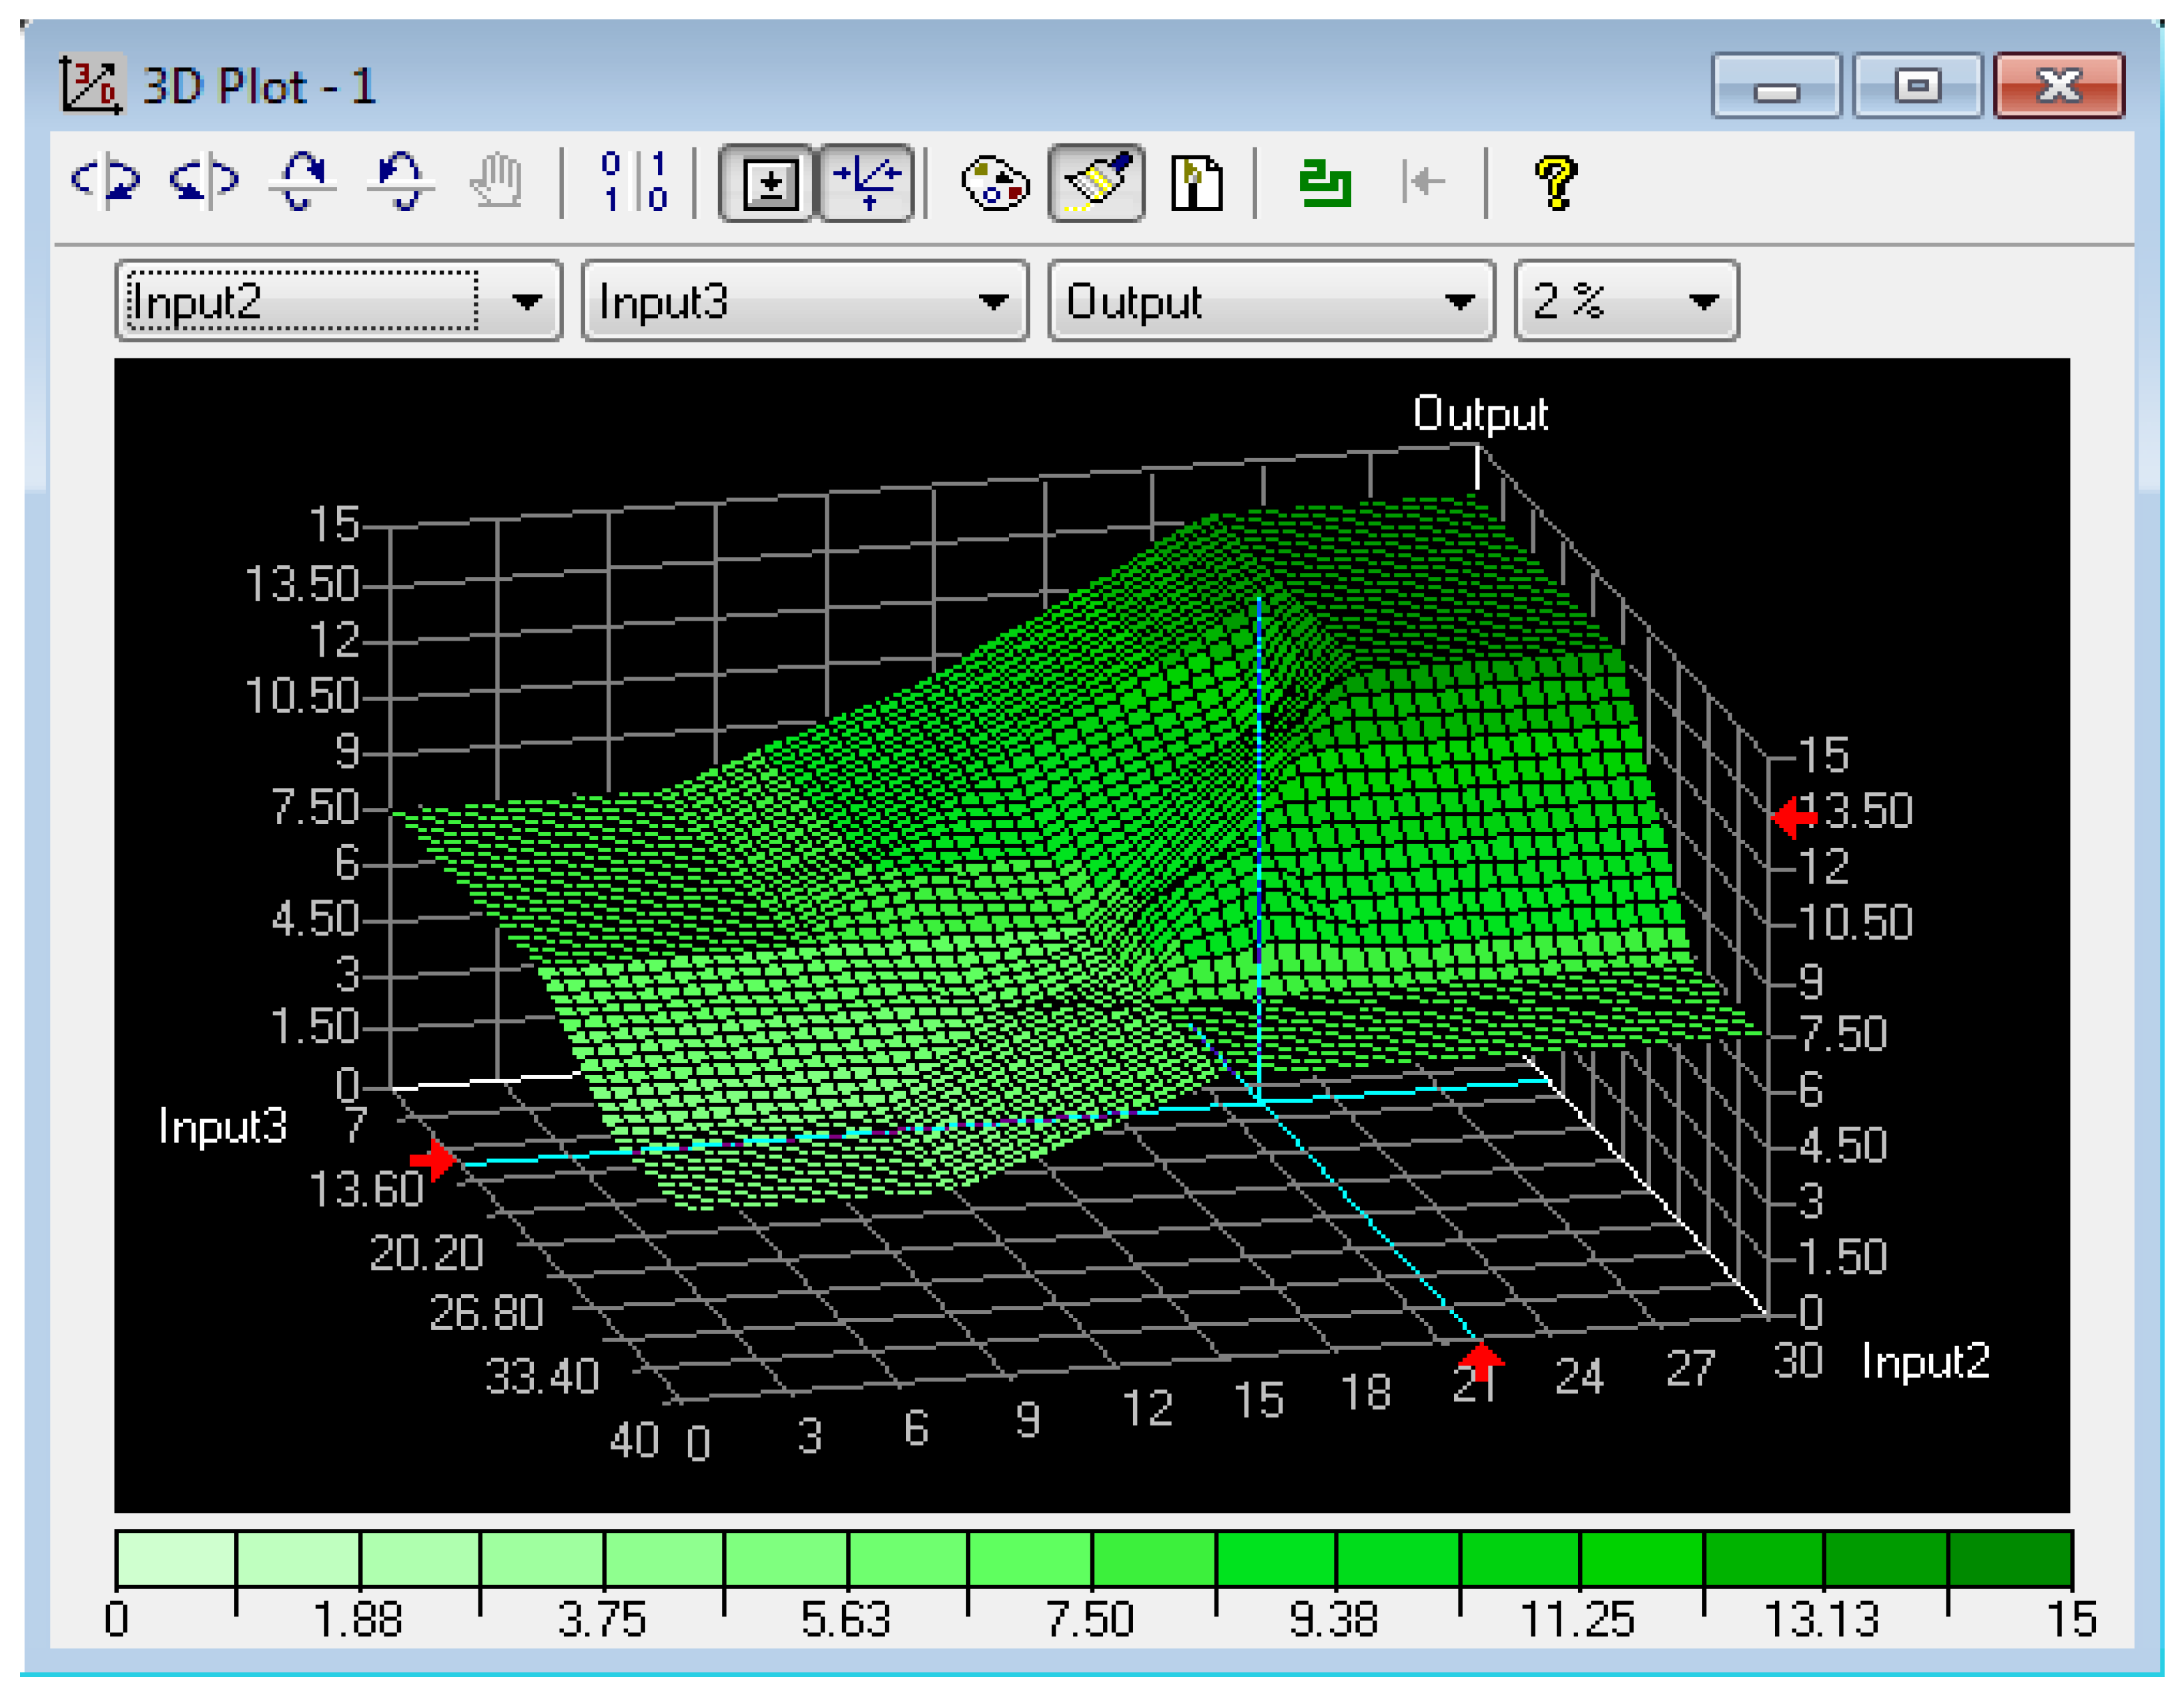
Figure 12.
Graph of function Output (Input2, Input3). (Source: Authors).


Table 1.
Variable description.
| Variable | Units |
|---|---|
| Duration of the resolving signal of a traffic light | seconds |
| The number of pedestrians in the direction of the vehicle (right) | one unit |
| The number of pedestrians in the direction of the vehicle (left) | one unit |
| The duration of the 1st free window in the pedestrian stream for driving | seconds |
| Number of vehicles driven in the 1st window | one unit |
| The duration of the 2nd free window in the pedestrian flow for driving | seconds |
| Number of vehicles driven in the 2nd window | one unit |
| The duration of the 3rd free window in the pedestrian stream for driving | seconds |
| Number of vehicles driving in the 3rd window | one unit |
| Driving time through the free window in the pedestrian flow, taking into account the distance of 1 m to the pedestrian crossing and its release | seconds |
| Number of vehicles in the queue due to waiting for pedestrians to pass | one unit |
| t1—time of movement of the 1st vehicle from the stop line to the beginning of rounding | seconds |
| t2—time of movement of the 1st vehicle in an arc (until the exit from the turn) | seconds |
| t3—the time of movement of the 1st vehicle on the segment of approach to the pedestrian crossing after exiting from the turn | seconds |
| t4—time of leaving the 1st vehicle of the pedestrian crossing, taking into account the distance of 1 m to the pedestrian crossing and its release | seconds |
| Number of vehicles completing the passage to the red signal of the traffic light | one unit |
| L1—the distance from the stop line to the border of the intersection with the conflicting direction | meters |
| L2—the curvature of the carriageway when turning right | meters |
| L3—the distance from the end point of the curvature of the carriageway (intersection border) to the pedestrian crossing when turning right | meters |
| Sampling for the maximum possible number of vehicles driving without pedestrians | one unit |
| The actual number of passing cars | one unit |
(Source: Authors).
Table 2.
Variable description.
| Model | R | R Square | Adjusted R Square | Std. Error of the Estimate | Durbin-Watson |
|---|---|---|---|---|---|
| 1 | 0.950 | 0.902 | 0.409 | 1.881 | 1.533 |
(Source: Authors).
Table 3.
Values of the coefficients of the multiple regression.
| Coefficients | ||
|---|---|---|
| B | Beta | |
| Unstandardized Coefficients | Standardized Coefficients | |
| (Constant) | 0.614 | |
| Duration of the resolving signal of a traffic light | 0.303 | 1.275 |
| Sampling for the maximum possible number of vehicles driving without pedestrians | −0.360 | −0.752 |
| L2—the curvature of the carriageway when turning right | 0.189 | 0.573 |
| t4—time of leaving the 1st vehicle of the pedestrian crossing, taking into account the distance of 1 m to the pedestrian crossing and its release | 0.358 | 0.522 |
| Number of vehicles driven in the 2nd window | 0.461 | 0.426 |
| The number of pedestrians in the direction of the vehicle (left) | −0.280 | −0.417 |
| L1—the distance from the stop line to the border of the intersection with the conflicting direction | −0.184 | −0.396 |
| The duration of the 1st free window in the pedestrian stream for driving | −0.099 | −0.268 |
| t2—time of movement of the 1st vehicle in an arc (until the exit from the turn) | 0.242 | 0.250 |
| Number of vehicles driven in the 1st window | 0.272 | 0.232 |
| The duration of the 3rd free window in the pedestrian stream for driving | −0.392 | −0.210 |
| The duration of the 2nd free window in the pedestrian flow for driving | 0.102 | 0.166 |
| The number of pedestrians in the direction of the vehicle (right) | −0.117 | −0.159 |
| Number of vehicles driving in the 3rd window | 0.531 | 0.106 |
| Driving time through the free window in the pedestrian flow, taking into account the distance of 1 m to the pedestrian crossing and its release | 0.056 | 0.098 |
| Number of vehicles in the queue due to waiting for pedestrians to pass | 0.099 | 0.098 |
| L3—the distance from the end point of the curvature of the carriageway (intersection border) to the pedestrian crossing when turning right | 0.049 | 0.062 |
| t1—time of movement of the 1st vehicle from the stop line to the beginning of rounding | −0.068 | −0.046 |
| t3—the time of movement of the 1st vehicle on the segment of approach to the pedestrian crossing after exiting from the turn | 0.110 | 0.041 |
| Number of vehicles completing the passage to the red signal of the traffic light | 0.013 | 0.005 |
(Source: Authors).
© 2020 by the authors. Licensee MDPI, Basel, Switzerland. This article is an open access article distributed under the terms and conditions of the Creative Commons Attribution (CC BY) license (http://creativecommons.org/licenses/by/4.0/).
Share and Cite
MDPI and ACS Style
Shepelev, V.; Aliukov, S.; Nikolskaya, K.; Shabiev, S. The Capacity of the Road Network: Data Collection and Statistical Analysis of Traffic Characteristics. Energies 2020, 13, 1765. https://0-doi-org.brum.beds.ac.uk/10.3390/en13071765
AMA Style
Shepelev V, Aliukov S, Nikolskaya K, Shabiev S. The Capacity of the Road Network: Data Collection and Statistical Analysis of Traffic Characteristics. Energies. 2020; 13(7):1765. https://0-doi-org.brum.beds.ac.uk/10.3390/en13071765
Chicago/Turabian StyleShepelev, Vladimir, Sergei Aliukov, Kseniya Nikolskaya, and Salavat Shabiev. 2020. "The Capacity of the Road Network: Data Collection and Statistical Analysis of Traffic Characteristics" Energies 13, no. 7: 1765. https://0-doi-org.brum.beds.ac.uk/10.3390/en13071765
Note that from the first issue of 2016, this journal uses article numbers instead of page numbers. See further details here.