Article

Feasibility Study of a Solar-Powered Electric Vehicle Charging Station Model

1
Research Center on Modern Logistics, Graduate School at Shenzhen, Tsinghua University, Shenzhen 518055, China
2
School of Financial Mathematics and Engineering, South University of Science and Technology of China, Shenzhen 518055, China
3
Environmental Science and Engineering Center, Harbin Institute of Technology Shenzhen Graduate School, Shenzhen 518055, China
4
Energy Analysis and Environmental Impacts Division, Lawrence Berkeley National Laboratory, Berkeley, CA 94720, USA
*
Author to whom correspondence should be addressed.
These authors contributed equally to this work.
Energies 2015, 8(11), 13265-13283; https://0-doi-org.brum.beds.ac.uk/10.3390/en81112368
Submission received: 13 September 2015 / Revised: 8 November 2015 / Accepted: 12 November 2015 / Published: 23 November 2015

Abstract

:
In China, the power sector is currently the largest carbon emitter and the transportation sector is the fastest-growing carbon emitter. This paper proposes a model of solar-powered charging stations for electric vehicles to mitigate problems encountered in China’s renewable energy utilization processes and to cope with the increasing power demand by electric vehicles for the near future. This study applies the proposed model to Shenzhen City to verify its technical and economic feasibility. Modeling results showed that the total net present value of a photovoltaic power charging station that meets the daily electricity demand of 4500 kWh is $3,579,236 and that the cost of energy of the combined energy system is $0.098/kWh. In addition, the photovoltaic powered electric vehicle model has pollutant reduction potentials of 99.8%, 99.7% and 100% for carbon dioxide, sulfur dioxide, and nitrogen oxides, respectively, compared with a traditional gasoline-fueled car. Sensitivity analysis results indicated that interest rate has a relatively strong influence on COE (Cost of Energy). An increase in the interest rate from 0% to 6% increases COE from $0.027/kWh to $0.097/kWh. This analysis also suggests that carbon pricing promotes renewable energy only when the price of carbon is above $20/t.

1. Introduction

China has undergone rapid economic development over the past three decades. In the process, its carbon emissions have surpassed those of the United States. In fact, China took over as the world’s largest carbon emitter in 2009. Such emissions also accounted for 29% of the global energy related carbon emissions in 2013 and 80% of the net increase of carbon emission since 2008 [1].

1.1. Carbon Emission Status of China’s Power Sector

China’s power industry has experienced rapid development over the past decade. Coal-fired power stations output a weekly average of 1 million kW for operations in China during this period [2]. The total installed power capacity increased from 0.36 billion to 1.25 billion kW and the total amount of generated electricity increased from 1.65 trillion to 4.9 trillion kWh from 2002 to 2012. The proportion of the capacity of installed thermal power reached 71.5% of the total capacity. Furthermore, the amount of generated electricity accounted for 78.6% of the total amount in 2012. A total of 99% of the thermal power plants are coal-fired plants, and the total installed capacity of such plants totaled more than 0.9 billion kW as of December 2014 [3].
The power sector is the largest carbon emitter as a result of rapid development during more than a decade. The emissions from this sector account for approximately 42% of the country’s total energy-related carbon emissions [4]. Table 1 presents the carbon emissions of the World’s major economies by sector and shows that the power industry constitutes the highest proportion of carbon emissions among the sectors in the major economies [5].
Table 1. Carbon emission structures of the world’s major countries in 2010.
SectorUSAEUJapanChina
Power33%38%36%42%
Manufacturing20%16%30%37%
Transportation32%25%20%7%
Residential13%20%13%8%
Others2%1%1%6%

1.2. Carbon Emission Status of China’s Transportation Sector

The International Energy Agency reports that the transportation sector accounts for 23% of global energy-related greenhouse gas (GHG) emissions at present [5]. Table 1 indicates that the transportation sector currently accounts for a relatively small proportion of carbon emissions in China; however, it is the fastest-growing sector in this regard. Between 2003 and 2012, China’s annual volume of passenger and freight transportation almost tripled while the cumulative number of vehicles increased from 24.2 million to 137.0 million [6]. The carbon emissions from the transportation sector increased from 436 Million ton to 810 Million ton (Mt) between 2001 and 2010, with a 6.39% average annual growth rate [7]. The transportation sector increasingly becomes a major contributor to the increase in China’s GHG emissions.

1.3. Dilemma in the Reduction of Carbon Emissions from China’s Power and Transportation Sectors

China implemented an economic restructuring strategy with the development of the “The Twelfth Five-Year Plan”. Thus, the growth rate of electricity consumption has decreased [8]. However, this growth rate will remain at a minimum of 4% annually in the next 5 to 10 years. Given that China has begun to promote the large-scale deployment of electric vehicles (EVs), electricity demand is expected to increase rapidly and significantly in the future [9]. Therefore, some researchers have reported that if no active measures are taken, the carbon emissions from the power sector in China will increase to 6 billion tons in 2020 [10]. Coal-fired power generation is an important air pollution-induced factor that causes the notorious nationwide fog and hazy weather in autumn and winter [11]. To improve air quality and to respond to the challenges posed by global climate change, China has invested heavily in renewable energy (i.e., wind and photovoltaic (PV) power generation) and promoted EV use in cities. China has become the world’s largest investor in renewable energy, and the government is planning to invest an additional US $800 billion before 2020 [12]. Large-scale renewable energy development helps reduce China’s dependence on coal, but the limitations of the existing power transmission capability has resulted in hundreds of millions of kWh of idle renewable energy generation capacity annually [13]. Data released by the China Electric Council indicate that 9.1 billion kWh of wind electricity was wasted because of grid transmission limitations. This amount accounts for approximately 10.5% of the total wind electricity produced [14]. This problem also occurs in the PV industry because of power transmission capacity constraints; in some major PV power provinces, the idle power generation capacity of the PV power stations amounts to 13.78% [15]. Nonetheless, China’s coal-based power structure cannot be modified in the short term; therefore, the large-scale promotion of EVs merely increases coal-fired power consumption. It does not significantly improve environmental quality and simply transfers pollution from the city to the outskirts power plants.
In the current study, a PV power station is connected to an EV charging station. This connection not only maximizes the capacity of EV energy storage to absorb intermittent PV electricity but also reduces the pollution from EV energy consumption.

2. Literature Review

With the large-scale, worldwide promotion of renewable energy and EVs, the joint development of the power and transportation sectors is a relatively new and promising research area. This section reviews existing literature on the construction of renewable energy charging facilities according to two aspects, namely, research purpose and methods.
Existing studies can be divided into four categories according to their purposes. The first type of study focuses on the problem of EV power charging in remote areas that are far from a large grid [15]. In this regard, Herman investigated the construction of a renewable energy source-powered charging station in the rural and isolated areas of the Democratic Republic of Congo [16]. The second category of research mainly targets the concerns of overload in grids as a result of EV charging [17]. Goldin et al. [18] argued that solar-powered charging stations may significantly weaken the influence of EV charging on the local grid. Furthermore, lots are suitable locations for the incorporation of solar power into electrical grids because of the beneficial social values of shade and the convenience for vehicle charging. The third type of research mainly follows the viewpoint of PV power plants. Locment et al. [19] presented an evaluation on PV micro-grid power architecture for efficient charging of plug-in EVs from the aspects of theoretical and numerical. Aziz’s [20] studies showed that the application of EVs and used EV batteries in supporting certain small-scale energy management systems is feasible. From this perspective, storage facilities must be provided to reduce the possibility of abandoned electricity given that EVs can provide storage capacity [21]. Tang et al. [22] analyzed the feasibility of PV-powered EVs (PV-EV) by considering their technological and economic aspects. Four models of power supply systems were assessed in this study, and PV-powered EVs were regarded as the most promising model for the near future. The fourth category of research emphasizes vehicle-to-grid (V2G) technology [23], which combines renewable energy and the local grid. However, this power system may place the security and reliability of operation at risk because of the intermittent nature of renewable energy generation and the uncontrolled charging/discharging procedure of EVs. Honarmand et al. [24] proposed a method to solve this problem by considering practical constraints, renewable power forecasting errors, spinning reserve requirements, and EV owner satisfaction. The modeling results indicate that EV owners can profit by either discharging the batteries of their vehicles or providing the reserve capacity during departure time. Alireza et al. [25] proposed a multi-objective operational scheduling method for EV charging in a smart distribution system. V2G capability and actual driver patterns are considered in this method. The findings show that the proposed method can lower both operation cost and air pollutant emissions.
Mathematical modeling and integrated computer-based optimization software are the two main tools from the perspective of research methods. Given the previous types of methods, Nakata et al. [26] used a non-linear programming optimization model to optimize system configuration and operation for the heat and power supply in Japan. Muis et al. [27] applied a mixed integer linear programming model for optimal planning of electricity generation schemes for a nation to meet a specified CO2 emission target. Pelet et al. [28] adopted a multi-objective evolutionary programming technique to rationalize the design of energy systems for remote locations. Liu et al. [29] established multi-objective economic dispatch models of a microgrid with EVs charging under the autonomous charging mode. Kim et al. [30] also proposed a methodology to determine the optimal capacity of renewable distributed generation using a multi-objective optimization model. These models are based on specific targets and can therefore match related research. However, creating new tools for each analysis is time-consuming; hence, much mathematical programming and debugging time can be saved if feasible and accessible tools are available. Connolly et al. [31] reviewed the computer tools utilized to analyze the integration of renewable energy into various energy systems in detail. Tsioliaridou et al. [32] assessed the INVERT energy tool for efficient promotion of renewable energy source technologies in the electricity sector. Mahmoud et al. [33] used a computer-based dynamic economic evaluation model to assess three supply options for a stand-alone energy system.
Renewable energy generation system optimization and EV charging related research are hot topics in the past few years, however, existing research on the topic of combining renewable energy system and EV charging system from the aspect of technology, economy and actual application is relatively rare. Furthermore, as Shenzhen is the city with the largest number of EVs in the world, thus there is a large amount of actual operation data from EVs which can be used in this study, while there is little such practical data appearing in the existing papers. Finally, the previous literatures do not consider systematic planning of PV-EV system. The present paper proposes a technical and economic feasibility study on PV-EV charge station model that can mitigate the problems in renewable energy utilization and can cope with the eventual increase in the power demand of EVs. The contributions of this study are highlighted as follows:
(1)
To develop a novel conceptual model that combines power generation and EVs to reduce pollutant emissions from the power generation and transportation sectors simultaneously;
(2)
To discuss the economic feasibility of this model and its key influence factors based on the case study in Shenzhen city;
(3)
To provide recommendations for the practical application of the conceptual model in a city from the construction, operation, and financial aspects.
The rest of this paper is organized as follows: 
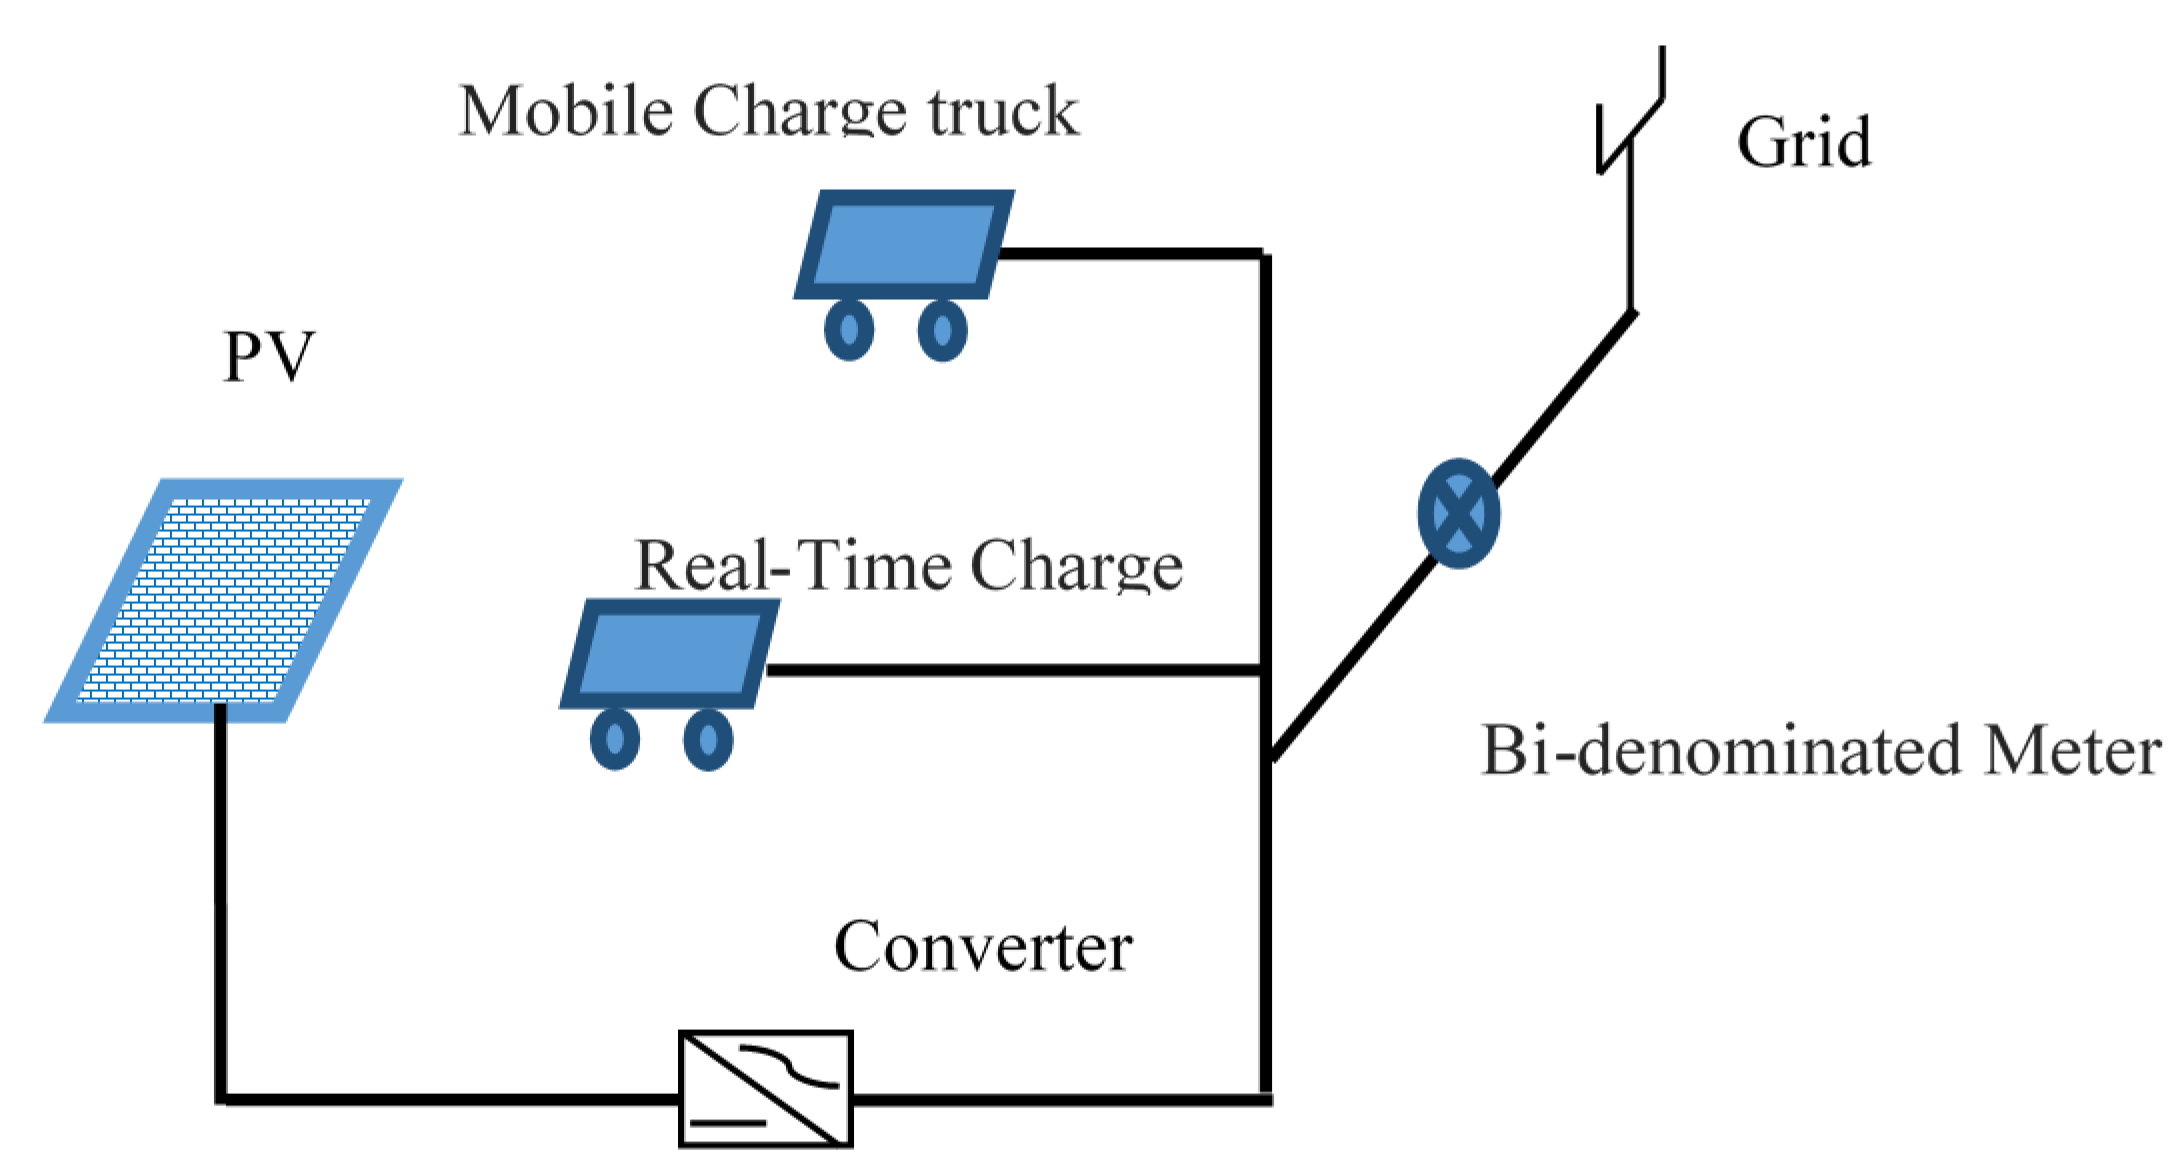
Section 3 describes the proposed solar-powered charging station model. Section 4 applies the model to a city in China that boasts the largest number of EVs. Section 5 presents the model application results and analyzes the case study thoroughly. Section 6 provides the post-modeling analysis results for several practical issues in model application. Section 7 presents the conclusion of this paper.

3. Method

3.1. Model Description

The proposed PV-EV charging model is shown in Figure 1. Solar panels installed on an outdoor parking station are connected to the grid through a bi-denominated meter, along with the EVs. Electricity generated from the PV power plants in daytime can be stored directly in the electric cars. If the electricity generated exceeds the storage capacity of EVs batteries, the surplus energy can be sold to the grid. In nighttime, the EVs can begin charging when the grid electricity price is relatively low.
Figure 1. PV-EV charging station model.
Energies 08 12368 g001
Two types of charging models are considered. One is the real-time charging model, which indicates that EVs can be charged at any time as long as solar power is generated. The other utilizes a mobile charge truck which is equipped with a mobile charging station. The characteristics of the two charging types are of great difference in the system; thus, they are treated disparately in the simulation model. The real-time charge is regarded as the primary load, which is the electricity demand that must be served according to a particular schedule. The mobile charging truck is regarded as the deferrable load, which is the electricity demand that can be served at any time within a certain time span, although the exact timing is flexible.
The HOMER (Hybrid Optimization Model for Multiple Energy Resources) developed by the National Renewable Energy Laboratory of the United States was used to model the physical behavior and economic features of the power system. HOMER enables the modeler to compare many different design options based on their technical, environmental and economic merits. It also assists in understanding and quantifying the effects of uncertainty of changes in parameters.

3.2. Description of the Mathematical Model

3.2.1. Target Function

Cost of energy (COE) is the average cost per kWh of the useful electrical energy produced by a system. To calculate the COE, HOMER divides the annualized cost of electricity production by the total useful electric energy produced, as presented in Equation (1). The battery wear cost (BWC) is the cost of the energy cycling through the battery bank. This study considers V2G technology, which indicates that the EV batteries are charged when the grid electricity price is at a relatively lower rate and discharges to the grid when is higher. Therefore, the cost of this energy cycling is mainly attributed to the loss in the battery charging and discharging cycles. BWC is calculated using Equation (2):
Min: COE = CRF((ino − f)/(1 + f), Rproj) × NPC/(Ep + Ed + Eg) and
Min: BWC = (Crep × 1000 W/kW)/(Nb × Nc × d × (qmax × Vnom) × δ0.5)
where CRF is the function returning the capital recovery factor. NPC is the net present cost of the project ($); ino is nominal interest rate; f is annual inflation rate; Rproj is the project lifetime; TAC is the total annualized cost ($); Ep is primary load served (kWh/year); Ed is deferrable load served (kWh/year); Eg is energy sold to the grid (kWh/year); Crep is the replacement cost of the battery bank ($); Nb is the number of batteries in the battery bank; Nc is the number of cycles to failure; d is the depth of discharge (%); qmax is the maximum capacity of the battery (Ah); Vnom is the nominal voltage of the battery (V); δ is the battery roundtrip efficiency (%).

3.2.2. Main Boundary Conditions

Maximum annual capacity shortage: The maximum annual capacity shortage is the maximum allowable value of the capacity shortage fraction. In this study, the required γmax is set at 5% [34,35]:
γ = Etcs/Ed ≤ γmax
where Etcs is the total amount of capacity shortage in a year (kWh/year); Ed is the total energy demand in a year (kWh/year); γmax is the maximum annual capacity shortage (%).

3.2.3. Power Demand

Urban land resources are relatively scarce; hence, locating a large piece of undeveloped land on which to construct PV power plants is difficult. Therefore, PV power plants can only be decentralized on a small scale in a city. Presumably, a PV power station should meet the energy demand of 100 real-time EVs fully charged, and 1 mobile charge truck. The total energy demand can be calculated according to the equation below:
De = (Dpri + Ddef + Dnet)/(1 − γ)
where De is the total electricity demand of the system; Dpri is the primary load of the system; Ddef is the deferrable load of the system; Dnet is the net electricity sold to the grid. A positive value suggests that the amount of electricity sold to the grid is more than that purchased from the grid.

3.2.4. PV Array Output

HOMER uses the following equation to calculate the PV array output:
P = Y × µ × (Gc/Gs) [1 + β (Tc − Ts)]
where P is the PV array output (kW). Y is the rated capacity of the PV array, thereby indicating that its power output is subject to slandered test conditions (kW). µ is the PV derating factor with a value between 0 and 1, it is a scaling factor that applies to the PV array power output to account for reduced output in real-world operating conditions compared to the conditions under which the PV panel is rated; Gc is the solar radiation on the PV array in the current time step (kW/m2); Gs is the solar radiation on the PV array at standard test conditions (kW/m2); β is the temperature coefficient of power (%/°C); Tc is the PV cell temperature in the current time step (°C); Ts is the PV cell temperature under standard test conditions (°C).

4. Case Study

4.1. Location and Road Transportation Status of Shenzhen

Shenzhen is the first Special Economic Zone in China which was set up in 1978 and had long acted as a pilot city during China’s reform and opening-up process. The total number of motor vehicles registered in Shenzhen has escalated in the past decade and reached 2.72 million as of April 2014, with an average annual growth rate of 16.2% [36]. The vehicle density is approximately 440/km and it is significantly higher than the international warning line of 270/km [36]. Energy consumption is dominated by petroleum fuels. Gasoline and diesel account for 82% of the total energy consumption, whereas the remaining 18% is composed of gas, electricity, and other clean energy sources [37].
As part of the first batch of pilot cities on EV promotion, Shenzhen has reported remarkable achievements related to EV promotion in China [38]. As of the end of October 2014, the total number of new energy vehicles in operation is 8990. This figure included 1771 hybrid transit buses, 1253 pure electric transit buses, 5878 pure electric cars, and 62 fuel cell vehicles. Shenzhen has also constructed more than 1100 fast-charging piles and 3000 slow-charging piles within the city.

4.2. Basic Parameters

4.2.1. Solar Radiation

Shenzhen is located on the southeast coast of China that is adjacent to Hong Kong. It is situated south of the Tropic of Cancer, between longitudes 113°46′ and 114°37′ and latitudes 22°27′ and 22°52′. It covers an area of 1997 km2 and has a resident population of 10.63 million [37].
Solar resource is an important input parameter in the HOMER model. The monthly average solar radiation data are depicted in Figure 2. Shenzhen receives 1850 to 2050 h of sunshine per year on average and 4.10 kWh/m2 of solar radiation daily [22].

4.2.2. Electricity Demand

As mentioned previously, the PV power station should meet the energy demand of 100 fully charged, real-time EVs and 1 mobile charge truck. A fully charged electric car and a mobile charge truck presumably consume 40 and 500 kWh of electricity, respectively. Thus, the total electricity demand for a single PV power station is 4500 kWh/day or 1,642,500 kWh/year.
Figure 2. Monthly average solar radiation data for Shenzhen (NASA Weather Data Base) [39].
Energies 08 12368 g002

4.3. Technology-Related Parameters

4.3.1. PV Module

The number of PV modules manufactured in China increased by approximately 1000-fold, from 3 MW in 2000 to 23 GW in 2012. The price of the PV module has decreased from $6000/kW in 2000 to $800/kW in 2012, and this decrease has contributed considerably to global solar energy utilization [40]. The retail price of a PV panel in the Chinese solar market in 2014 was $900/kW; therefore, this value is regarded as the PV panel cost in the model. This cost accounts for half the total cost of a PV power station. In consideration of the markets of other PV components in China, the installation and replacement costs for a PV power station are set at $1800/kW and $1600/kW respectively. Operation and management (O&M) cost is $20/year. The PV array lifetime is 20 years, and no tracking system is assumed for the PV system [41]. The electrical parameters of the SL6P54-250W (Solar Leading, Shenzhen, China) PV panels which are used in this study are presented in Table 2 [42].
Table 2. Electrical parameters of the SL6P54-250W PV panel.
CharacteristicsValue
Maximum Power (Pmax)250 W
Power Tolerance(0, 5) W
Maximum Power Voltage (Vmp)30.7 V
Maximum Power Current (Imp)8.14 A
Open Circuit Voltage (Voc)37.90 V
Short Circuit Current (Isc)8.72 A
Module Efficiency (ηm)17.03%
Dimension of module1480 mm × 992 mm × 40 mm

4.3.2. Converter

A power converter is required to maintain the energy flow between the direct current (DC) and alternating current (AC) components in a hybrid wind/PV/battery power system. The retail contract price for converters obtained from a converter company in China is $500/kW [22]. Therefore, the capital and replacement costs of a converter are $500/kW and $450/kW, respectively. The converter lifetime is 20 years, and the O&M cost is $10/year. The electrical parameters of the Suntree 30000 TL (Transformer Less) inverters which are used in this study are presented in Table 3 [43].
Table 3. Electrical parameters of the Suntree 30000 TL inverter.
CharacteristicsValue
Max. output power30 kW
Max. output current48 A
MPPT Voltage Range400–800 Vdc
Nominal AC voltage400 V
Harmonic distortion (THDI)<3% (at nominal output power)
Max. efficiency>98.2%
Dimensions (W/L/H)580 mm × 235 mm × 800 mm
Net weight60 kg

4.3.3. Battery

EVs are part of the energy system. In particular, the EV battery is essentially involved in this energy system. This battery is produced by and is selected as the storage device for this hybrid system. Main technical parameters of the BYD E6 battery (BYD, Shenzhen, China) are presented in Table 4 [22,44].
Table 4. Main technical parameters of the BYD E6 battery.
CharacteristicsValue
Battery materialLiFePO4
Single Cell Voltage3.2–3.3 V
Nominal Voltage316.8 V
Nominal Capacity200 Ah
Energy density100 Wh/kg
Total weight600 kg
Efficiency85%

4.3.4. Maximum Capacity of Grid Purchase Power

On account of the effect of a sudden increase in power load on the existing grid around the PV power station, the maximum grid purchase and sell power capacities are limited to 1100 kW.

4.4. Policy-Related Parameters

4.4.1. Time-of-Use (TOU) Tariff

TOU tariff policy is a widely used management measure on the power demand side in China. The TOU tariff of Shenzhen is presented in Figure 3 [45]. TOU is a prerequisite for the implementation of V2G technology in EVs. According to a survey conducted by Xiao et al. 2013, private cars are parked in parking lots more than 90% of the time on a typical day [44]. The energy storage capacity of EVs can be utilized through V2G technology and under TOU pricing policy.
Figure 3. Time-of-use (TOU) tariff of Shenzhen.
Energies 08 12368 g003

4.4.2. Carbon Emission Penalty

To internalize the environmental external costs produced by carbon emissions, the Chinese government has implemented a carbon pricing policy in the form of carbon trading. China has launched several carbon emission trading schemes and is attempting to establish a national carbon emission trading scheme gradually. The Shenzhen emissions trading system is the first urban-level “Cap-and-Trade” carbon emission trading scheme in China [46]. The average carbon allowance price in the Shenzhen carbon market is approximately $10/ton since the market started trading in 2013 [46].
Carbon emissions from the grid-purchased electricity and life cycle carbon emission from the manufacture of PV modules are both considered in this model. According to the data released by the National Development and Reform Commission (NDRC) of China, the carbon emission intensity of the China South Grid is 0.9223 kg CO2-e/kWh [47] . Several scholars have investigated associated GHG emissions based on the life cycle assessment methods. Kannan et al., studied a 2.7 kWp distributed solar PV system in Singapore and noted that most of the GHG emissions were induced by the energy used to manufacture solar PV modules. Their experiments revealed that the amount of GHG emissions from electricity generation for solar PV systems varies in different countries. The average value is approximately 0.217 kg CO2-e/kWh, and this value was selected as the PV electricity carbon intensity in the current models [48].

4.4.3. PV Electricity Feed-in Tariff Policy

In August 2011, the NDRC of China issued the “Notice on Perfecting the Feed-in Tariff Policy of Solar PV Power Generation”. This notice determines the benchmark feed-in tariff of nationwide unified solar PV power generation. This standard was further modified in August 2013. Nationwide power generation was divided into three levels of resource areas based on their solar resource endowments. Thus, another feed-in tariff was implemented as of 1 September 2013, which is presented in Table 5 [40].
According to this feed-in tariff policy, Shenzhen can be categorized as area type III. It’s PV electricity feed-in price is 0.163 $/kWh.
Table 5. Feed-in tariffs of PV power stations in China (Unit: $/kWh).
Resource AreaFeed-in TariffRegions
Area type I0.147Northern and western areas of China in which solar radiation is extremely abundant.
Area type II0.155Northeast, Yellow River Basin, and west of China.
Area type III0.163Other areas excluded from types I and II.

4.4.4. Interest Rate

As per the latest RMB benchmark lending rate published by the People’s Bank of China in 2014, the long-term (more than five years) benchmark lending rate of the commercial bank is 6.15% [49].

5. Results and Discussion

Based on the PV-EV model developed in Section 3 and data collected from varies sources, the HOMER optimization software, which was developed by the National Renewable Energy Laboratory (NREL) of the USA, was used to calculated the optimal configuration of the components proposed in the energy system. HOMER models any energy system configuration through performing an hourly time step simulation of its operation. Following the calculation of the one year duration, any constraints on the system imposed by the user are then assessed. HOMER firstly assesses the technical feasibility of the energy systems and then estimates the NPC and COE of them, the technically feasible and cost minimum option will be presented as the optimal solution.

5.1. PV Installed Capacity and Electricity Production

The components of the PV power station are depicted in Table 6. To meet the designed electricity demand, the installed capacities of the PV array, inverter, and rectifier are 1100, 600 and 600 kW, respectively. The required installed capacities of the inverter and rectifier are less than that of the PV power station, which suggests that most of the electricity demand originates from the local micro grid. The major function of the inverter in this energy system involves changing DC to AC when the price of the grid electricity is high during daytime. By contrast, the rectifier in this energy system mainly changes AC to DC when the price of the grid electricity is lower at night.
Table 6. System architecture of the power station.
ComponentPV ArrayGridInverterRectifier
Capacity (kW)11001100600600
Land requirements are a significant factor for carrying out projects in large cities in China. If an area of 7.5 m2 is used for 1 kW module to meet the daily energy demand of 4500 kWh, then the total land required is 8250 m2 [50].

5.2. Energy Flow

The yearly average electricity flow in the case study is summarized in Figure 4. The total electricity produced is 2,627,953 kWh, of which 55% (1,179,397 kWh) of the energy output comes from PV panels and 45% of it (1,448,556 kWh) is purchased from the grid. In terms of energy consumption, the total electricity consumed is 2,358,809 kWh. The fractions of primary load, deferrable load, and grid sales are 62%, 8% and 30%, respectively. The amount of electricity produced is slightly more than consumed. The surplus is equal to the energy losses in the inverter and rectifier process plus the usefulness of the excess electricity. In this model, the efficiencies of the inverter and the rectifier are assumed to be 90% and 85%. The total energy loss in the converter is 256,357 kWh, which accounts for 9.8% of the total energy produced. The energy losses from the converter can be reduced to 165,638 kWh by transferring half of the DC load to AC load. However, this approach will inevitably increase O&M cost.
Figure 4. Annual energy flow of the system (Unit: kWh).
Energies 08 12368 g004

5.3. Economic Analysis

The total net present cost (NPC) of the energy system is $3,579,236, and the cash flow summaries are depicted in Figure 5. The capital costs mainly originate from the PV modules and converters. The COE of the system is only $0.098/kWh; which is much lower than the current peak electricity price ($0.178/kWh) of Shenzhen City and the PV electricity feed-in price ($0.163/kWh) of China. This low electricity cost can be attributed to the following factors: first, the TOU tariff policy of Shenzhen enables the charging of EVs at off-peak hours, which will reduce the charging cost significantly. COE increases to $0.159/kWh under the same condition if no TOU tariff policy is implemented. Second, the maximum output of PV power overlaps considerably with the highest electricity price under the TOU policy. Hence, the resale of PV output electricity to the grid is profitable. Third, the PV-EV energy system eliminates the transmission and distribution costs that typically account for almost half of the electricity retail price. In addition, the significant decline in PV module price since 2014 contributes significantly to system cost savings.
The annualized system cost of the system ($230,513/year) is presented in Table 7. The PV module accounts for 85.7% of this cost; therefore, it has a significant effect on the system total cost. Subsequently, an in-depth sensitivity analysis is presented.
Figure 5. Cash flow of the energy system.
Energies 08 12368 g005
Table 7. Annualized system costs.
ComponentCapitalReplacementO&MSalvageTotal
PV157,10342,32922,000−23,556197,876
Grid00−43130−4313
Converter23,8048,7526000−160636,949
System180,90751,08023,687−25,162230,513

5.4. Environmental Aspect

Numerous controversies have arisen regarding the potential of these EVs to mitigate GHG emission. The study conducted by the American Council for an Energy Efficient Economy predicts that GHG emissions from EVs are greater than those from conventional gasoline-powered cars in areas wherein more than 80% of grid power originates from coal-burning power plants [51]. As mentioned previously, power production in China is dominated by thermal power which accounted for 78.6% of the total electricity generated in 2012. This condition implies that if the EVs use electricity from the existing power grid in China, the environmental benefits is limited as EVs only transfer the pollutants emission from transportation sector to power generation sector. However, if the electricity utilized by the EV comes from renewable solar energy, the results will be different as air quality in urban environment is improved through the electrification of transportation and the reduced use of coal from the power generation process [52,53].
A comparative analysis was conducted between traditional gasoline-powered cars and the PV-EV system. BYD M6 and BYD E6 are chose in the case study given that both of them are produced by the BYD Company, which is a well-known EV producer in Shenzhen. The two cars share many similar properties, although they are equipped with different motors. Information provides by the BYD Company indicates that the BYD M6 consumes an average of 10.6 L of gasoline per 100 km, whereas the BYD E6 consumes an average of 18.2 kWh electricity per 100 km [22]. The GHG emission coefficient for each fuel is listed in the report of the Intergovernmental Panel on Climate Change. This report states that the coefficient for gasoline is 2.44 kg CO2-e/L [22]. Table 8 presents the results of the comparative analysis. The PV-EV system displays significant benefit by reducing pollutant emissions; specifically, the amounts of carbon dioxide, sulfur dioxide, and nitrogen oxide reduced annually are 232,954, 459,564 and 5,019,833 tons, respectively. The corresponding pollutant reduction percentages are 99.8%, 99.7% and 100% respectively.
Table 8. Comparison of pollutant emissions from the PV-EV system and gasoline-powered cars.
PollutantEmissions (kg/year)
PV-EV SystemGasoline-Powered CarsNet Reduction
Carbon dioxide461,206233,415,494232,954,288
Sulfur dioxide1,266460,830459,564
Nitrogen oxides6195,020,4525,019,833
The PV-EV system can lower pollutant emissions from both the power generation and transport sectors. It also exhibits significant environmental benefits.

5.5. Sensitivity Analysis

A sensitivity analysis was conducted to determine the parameters that having the greatest impact on the results. Four key parameters were analyzed in this study: capital cost of the PV system, carbon pricing, interest rate, and feed-in tariff policy.

5.5.1. Influence of the Capital Cost of the PV System

The influence of the capital cost of the PV system on COE is illustrated in Figure 6. It is shown that the Renewable energy Fraction (RF) decreases with the increase of PV module prices.
This occurrence indicates a decline in the proportion of PV electricity output. The PV power system cost and COE of the energy system are nonlinearly related. A clear inflection curve is generated when the PV price is approximately $1800/kW. The inflection point of the COE curve matches that of the RF curve, which also jumps significantly at around the same area.

5.5.2. Influence of Carbon Pricing

The reduction of carbon emissions plays an important role in China’s environmental policies. At present, the Chinese government has conducted pilot carbon emission trading in seven provinces and cities [54,55,56] since 2013. The next step is to build a nationwide carbon market in 2017. Carbon pricing can improve the competitiveness of low-carbon renewable energy sources and thus promoting national carbon reduction. Figure 7 shows that the proportion of renewable energy may increase significantly as the price of carbon emission allowances increase. Under a feed-in tariff protection policy, the COE of the PV power station declines with the increase in PV power generation. This scenario suggests that new energy development can be promoted by carbon pricing. However, the price of carbon should reach a certain level. Figure 7 also indicates that the carbon price policy is effective only when the price of carbon is above $20/t.
Figure 6. Influence of the capital cost of the PV system on COE.
Energies 08 12368 g006
Figure 7. Influence of carbon prices on COE.
Energies 08 12368 g007

5.5.3. Influence of Interest Rates

Interest rate significantly influences the benefits of long-term projects such as PV power plants. In Figure 8, the interest rate increases from 0% to 6%; accordingly, the COE increases from $0.027/kWh to $0.097/kWh. However, the relationship between COE and interest rate is a non-continuous function; COE increases rapidly at a clear transition range of approximately 6%. Moreover, the economy of a PV power plant investment decreases as interest rate increases; therefore, the amount of PV power generated decreases accordingly. Borrowing costs are relatively high in China right now, and this is a significant obstacle to the promotion of PV power plants in China.
Figure 8. Influence of interest rates on COE.
Energies 08 12368 g008

5.5.4. Feed-in Tariff Policy

The feed-in price policy of renewable energy is commonly used to promote renewable energy investment because it can limit the risks faced by such projects. Figure 9 indicates that the feed-in policy significantly affects PV power promotion. Specifically, a negative linear correlation exists between COE and feed-in price which suggests that COE can be reduced significantly by increasing the feed-in price of PV electricity.
Figure 9. Influence of feed-in price on COE.
Energies 08 12368 g009

6. Post-Model Analysis

6.1. Location and Distribution of Charging Stations

Urban area land is especially valuable in most cities. Therefore, locating an undeveloped blanket region in which to install solar PV panels in cities is unrealistic. Mounting solar panels on building roofs is an option that can be considered, but another problem appears that it is difficult to settle the division of ownership and interest between homeowners and the owners of solar power stations. Therefore, the urban space that can be allotted for solar panel installation is rather limited. Moreover, the location and distribution of solar panels is a key factor in the promotion of solar-powered charging stations in major metropolis, such as Shenzhen.
Like most coastal cities around the world, Shenzhen has abundant sunshine throughout the year and its rainfall is also rich in the spring and summer seasons. Thus, the construction of wind and rain corridors is important in urban planning. According to the “White Paper of Shenzhen Urban Transport” released by the Shenzhen Transportation Commission, the Shenzhen government intends to build a continuous corridor system at the convergence of the storm subway station entrances and the pedestrian flow channels at important attractions [57]. This document suggests that the wind and rain corridor system can be a suitable location for a solar power station. Figure 10 presents a wind and rain corridor system in the Meilin community of Shenzhen [58]. The roof covers an area of 2100 m2. More than a dozen similar corridor systems are also planned for construction throughout the Meilin community.
The wind and rain corridors are generally 2 to 4 m wide, and the length can vary considerably from 50 to 2000 m. A corridor area larger than 2000 m2 is considered a good charging station location. The total installed capacity is 300 kW according to solar panel technology parameters [22] and the amount of electricity generated daily can fully charge 20 EVs. Although the amount of electricity generated from each corridor is limited, it can produce additional income for the corridors. The solar power stations distributed along corridors in the city can positively affect renewable energy utilization and EV promotion in combination with the business model discussed below.
Although solar power stations can be constructed in some crowded areas of the city, land resource bottlenecks are encountered when no area is available for EVs to park and recharge. In such cases, the mobile charging model can be used. In this model, only one car containing battery banks with high capacity can park for charging. The fully charged car can then travel to the cars that need charging all over the city.
Figure 10. Wind and rain corridor system in Meilin, Shenzhen.
Energies 08 12368 g010

6.2. Development of A Commercial Model

A common and prominent problem in the promotion of EVs in most cities in China is the insufficiency of charging poles. The reason is that the commercial mode of construction and operation does not balance the interests of all stakeholders effectively. As a result, few social capitalists are willing to invest in the construction of charging stations. By contrast, some of the charging stations built with government investment are idle because of bad planning and site selection, thus significantly wasting social resources. High initial investment is another important factor that hinders the promotion of EVs. The proposed commercial model of EV timeshare rental (EVTR) can be used to address the two obstacles in EV promotion. The differences between EVTR and the traditional car rental industry are as follows: first, EVTR charges by the hour, so it is suitable only for short-distance travel in the city. Small or micro-EVs are generally rented out as target vehicles to save costs. Second, the rental cost includes electricity consumption, which can save fuel costs for users. Third, the key factor that influences the success of this commercial model is the need to distribute many rental outlets all over the city. These outlets need not be large, but the number of outlets must be sufficient for the convenient pickup and return of EVs by customers. This scenario shares many meeting points with the solar power stations on wind and rain corridors, as described above. With the increasing popularity of EVs, outdoor parking and the roofs of public buildings can gradually be transformed into solar power charging stations in the future. Any location with sunshine and roofs can be a location for micro PV-EV charging stations and can become an EVTR system node.

7. Conclusions

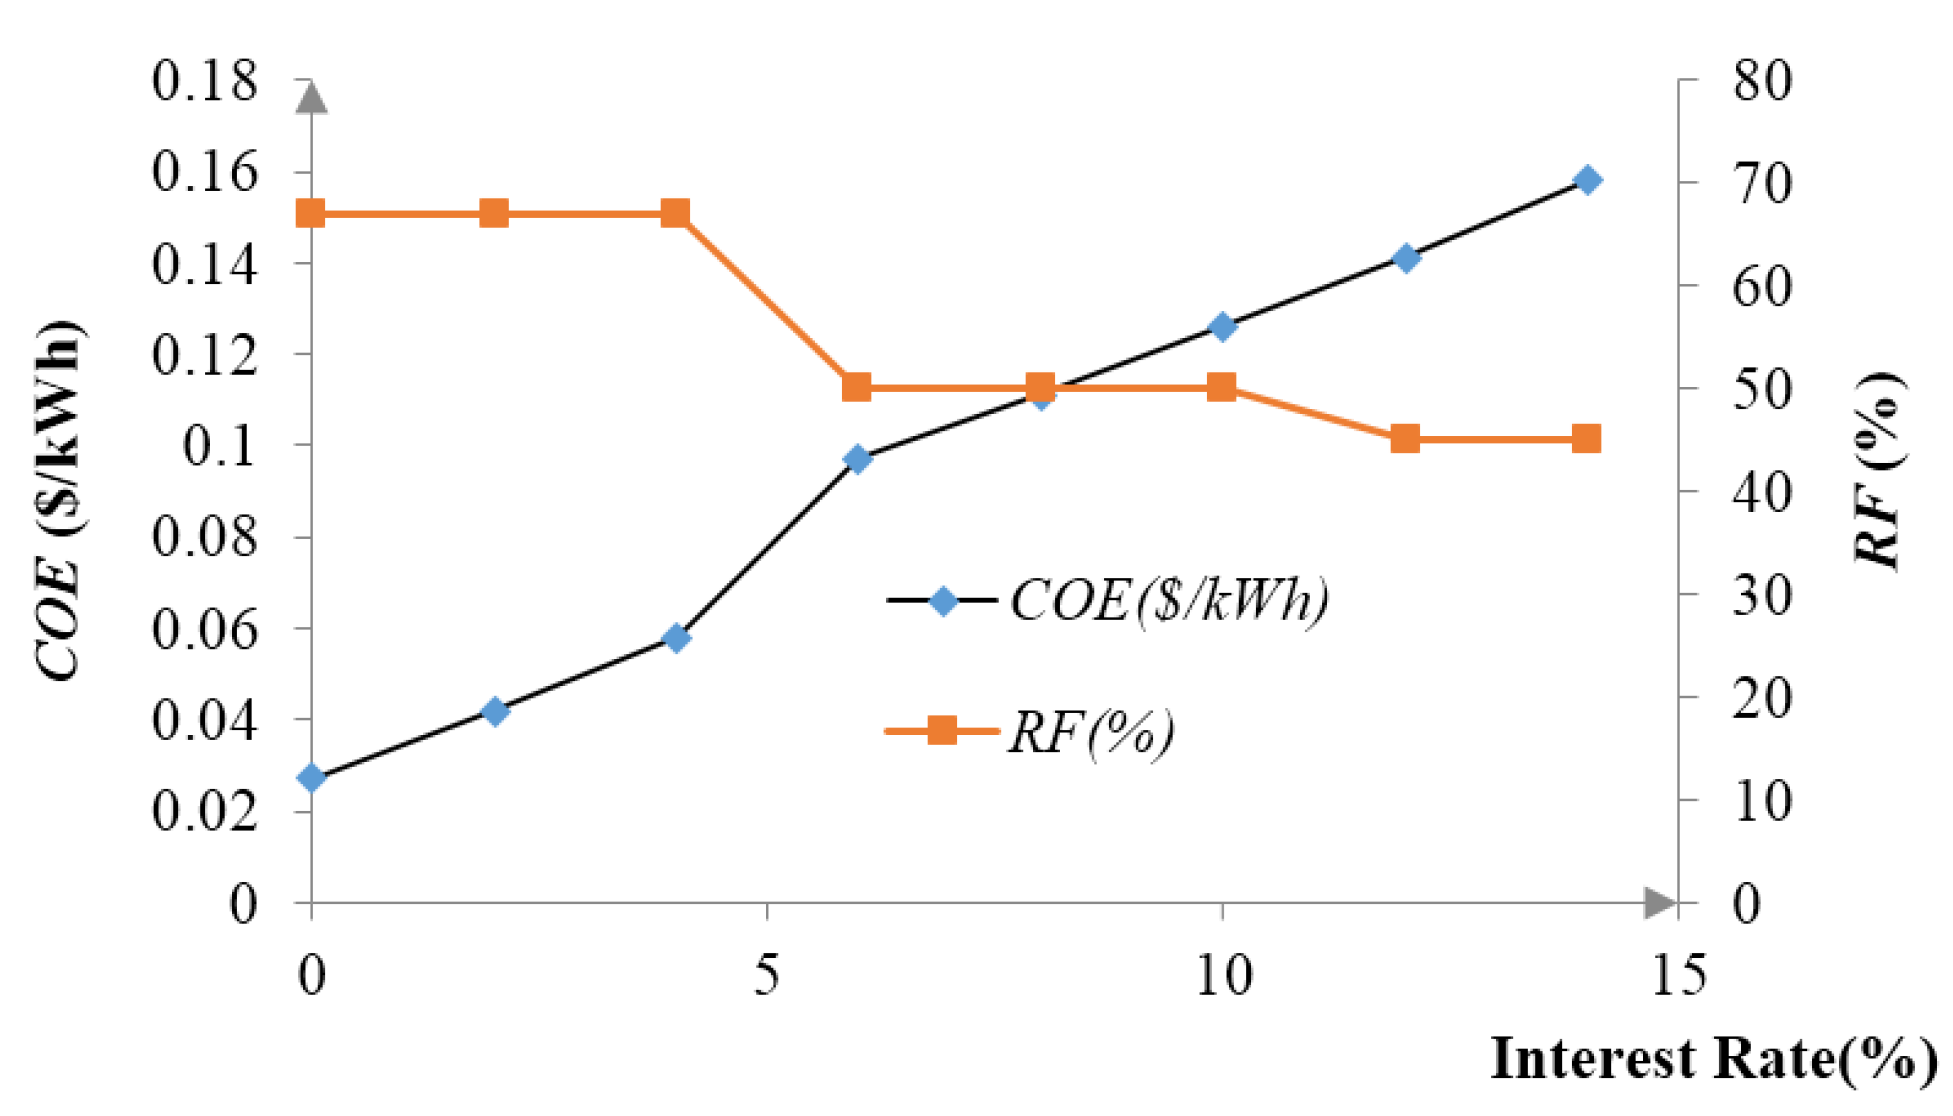
The power sector is currently the greatest carbon emitter in China. Nonetheless, carbon emissions from the transport sector are increasing rapidly as well. The control of carbon emissions from these two sectors is related to the successful achievement of carbon emission control objectives. Thus, this study develops a model that combines solar power stations and EVs to simultaneously reduce pollutant emissions from the power generation and transportation sectors. To verify its technical and economic feasibility, this study applied the model to Shenzhen City, which boasts the largest number of EVs in the world. The modeling results showed that the NPC of a PV power charging station that can meet the electricity demand of 4500 kWh is $3,579,236, whereas the COE of the combined energy system is $0.098/kWh. Therefore, this model is acceptable from an economic point of view. Moreover, this model displays a high pollutant emission reduction potential. According to the results of a comparison analysis with traditional gas-powered cars, the PV-EV model has pollutant reduction potentials of 99.8%, 99.7% and 100% for carbon dioxide, sulfur dioxide, and nitrogen oxide, respectively. The findings from the sensitivity analysis also indicate that the capital cost of PV and interest rate have a relatively strong influence on COE, especially the interest rate. Given that the initial investment for this project is large and that charging facilities are not readily available in most cities, the EVTR commercial model is a suitable choice for the initial stage. Land resources are especially valuable in most cities; thus, the roofs of public buildings such as schools, rain corridor systems, and public parking lots are appropriate locations for PV-EV system construction.

Acknowledgments

This work was supported by the Natural Science Foundation of Guang Dong Province, China (Grant No. 2014A030310404) and Shenzhen city Special Strategic Emerging Industry Development Foundation (Grant No. JCYJ20150331151358130).

Author Contributions

Bin Ye, Jingjing Jiang, Lixin Miao conceived and designed the experiments; Bin Ye and Peng Yang performed the experiments; Ji Li analyzed the data; Bo Shen contributed the language polishing; Bin Ye and Jingjing Jiang wrote the paper.

Conflicts of Interest

The authors declare no conflict of interest.

References

  1. Liu, Z.; Guan, D.; Crawford-Brown, D.; Zhang, Q.; He, K.; Liu, J. A low-carbon road map for China. Nature 2013, 500, 143–145. [Google Scholar] [CrossRef]
  2. Jiang, J.; Ye, B.; Ma, X. The Impact of International Greenhouse Gas Emission Constraints on Coal-fired Power Plant in China-Based on LCA Model. In Proceedings of the 14th International Conference on Digital Manufacturing and Automation (ICDMA), Kagawa, Japan, 4–7 August 2013; pp. 1468–1472.
  3. Council, C.E. China Power Enterprise Statistical Data Analysis 2013; China Statistics Press: Beijing, China, 2014; pp. 35–43. [Google Scholar]
  4. Shen, B.; Jian, W.; Li, M.; Li, J.; Price, L.; Zeng, L. China’s approaches to financing sustainable development: Policies, practices and issues. WIREs Energy Environ. 2013, 2, 178–198. [Google Scholar] [CrossRef]
  5. Greenhouse Gas Emissions: Country Data 2010; International Energy Agency (IEA): New York, NY, USA, 2010; pp. 67–90.
  6. Bureau, C.N.S. China Statistical Yearbook; China Statistics Press: Beijing, China, 2014. (In Chinese) [Google Scholar]
  7. Chi, X.W. The analysis of carbon emissions from China`s transportation sector. J. Energy Strateg. Low Carbon Econ. Res. 2012, 12, 56–62. [Google Scholar]
  8. Bo, S.; Ghatikar, G.; Zeng, L.; Li, J.; Wikler, G.; Martin, P. The role of regulatory reforms, market changes, and technology development to make demand response a viable resource in meeting energy challenges. Appl. Energy 2014, 130, 814–823. [Google Scholar] [CrossRef]
  9. Ye, B.; Tang, J.; Lu, Q. Feasibility analysis of renewable energy powered tourism island-Hainan, China. J. Renew. Sustain. Energy 2012, 4, 63116–63127. [Google Scholar] [CrossRef]
  10. Wang, L.; Watanabe, T.; Xu, Z. Monetization of External Costs Using Lifecycle Analysis-A Comparative Case Study of Coal-Fired and Biomass Power Plants in Northeast China. Energies 2015, 8, 1440–1467. [Google Scholar] [CrossRef]
  11. Yu, S.; Wei, Y.; Guo, H.; Ding, L. Carbon emission coefficient measurement of the coal-to-power energy chain in China. Appl. Energy 2014, 114, 290–300. [Google Scholar] [CrossRef]
  12. Qi, Y. Low-Carbon Development Blue Book; Climate Policy Research Center of Tsinghua University: Beijing China, 2012; p. 338. [Google Scholar]
  13. Lan, S. Chinese PV Power Major Province Continue to Waste Solar Energy; China Energy News: Shanghai, China, 2012. [Google Scholar]
  14. China Electricity Council. Abandoned Wind Power Amount to 9.1 Billion kWh in the First Half of the Year; China Electric Power Press: Beijing, China, 2014; pp. 25–50. [Google Scholar]
  15. Ma, T.; Yang, H.; Lu, L. A feasibility study of a stand-alone hybrid solar-wind-battery system for a remote island. Appl. Energy 2014, 121, 149–158. [Google Scholar] [CrossRef]
  16. Vermaak, H.J.; Kusakana, K. Design of a photovoltaic-wind charging station for small electric Tuk-tuk in DRCongo. Renew. Energy 2014, 67, 40–45. [Google Scholar] [CrossRef]
  17. Tulpule, P.J.; Marano, V.; Yurkovich, S.; Rizzoni, G. Economic and environmental impacts of a PV powered workplace parking garage charging station. Appl. Energy 2013, 108, 323–332. [Google Scholar] [CrossRef]
  18. Goldin, E.; Erickson, L.; Natarajan, B.; Brase, G.; Pahwa, A. Solar powered charge stations for electric vehicles. Environ. Prog. Sustain. 2014, 33, 1298–1308. [Google Scholar] [CrossRef]
  19. Locment, F.; Sechilariu, M. Modeling and Simulation of DC Microgrids for Electric Vehicle Charging Stations. Energies 2015, 8, 4335–4356. [Google Scholar] [CrossRef]
  20. Aziz, M.; Oda, T.; Mitani, T.; Watanabe, Y.; Kashiwagi, T. Utilization of electric vehicles and their used batteries for peak-load shifting. Energies 2015, 8, 3720–3738. [Google Scholar] [CrossRef]
  21. Kuznetsova, E.; Li, Y.; Ruiz, C.; Zio, E. An integrated framework of agent-based modelling and robust optimization for microgrid energy management. Appl. Energy 2014, 129, 70–88. [Google Scholar] [CrossRef]
  22. Tang, J.; Ye, B.; Lu, Q.; Wang, D.; Li, J. Economic analysis of photovoltaic electricity supply for an electric vehicle fleet in Shenzhen, China. Int. J. Sustain. Transp. 2014, 8, 202–224. [Google Scholar] [CrossRef]
  23. Bishop, J.D.K.; Axon, C.J.; Bonilla, D.; Tran, M.; Banister, D.; McCulloch, M.D. Evaluating the impact of V2G services on the degradation of batteries in PHEV and EV. Appl. Energy 2013, 111, 206–218. [Google Scholar] [CrossRef]
  24. Honarmand, M.; Zakariazadeh, A.; Jadid, S. Integrated Scheduling of Renewable Generation and Electric Vehicles Parking Lot in a Smart Microgrid. Available online: http://0-gateway-isiknowledge-com.brum.beds.ac.uk/gateway/ (accessed on 20 September 2015).
  25. Zakariazadeh, A.; Jadid, S.; Siano, P. Multi-objective scheduling of electric vehicles in smart distribution system. Energy Convers. Manag. 2014, 79, 43–53. [Google Scholar] [CrossRef]
  26. Nakata, T.; Kubo, K.; Lamont, A. Design for renewable energy systems with application to rural areas in Japan. Energy Policy 2005, 33, 209–219. [Google Scholar] [CrossRef]
  27. Muis, Z.A.; Hashim, H.; Manan, Z.A.; Taha, F.M.; Douglas, P.L. Optimal planning of renewable energy-integrated electricity generation schemes with CO2 reduction target. Renew. Energy 2010, 35, 2562–2570. [Google Scholar] [CrossRef] [Green Version]
  28. Pelet, X.; Favrat, D.; Leyland, G. Multiobjective optimisation of integrated energy systems for remote communities considering economics and CO2 emissions. Int. J. Therm. Sci. 2005, 44, 1180–1189. [Google Scholar] [CrossRef]
  29. Liu, H.; Ji, Y.; Zhuang, H.; Wu, H. Multi-objective dynamic economic dispatch of microgrid systems including vehicle-to-grid. Energies 2015, 8, 4476–4495. [Google Scholar] [CrossRef]
  30. Kim, S.Y.; Kim, W.W.; Kim, J.O. Determining the optimal capacity of renewable distributed generation using restoration methods. IEEE Trans. Power Syst. 2014, 29, 2001–2013. [Google Scholar] [CrossRef]
  31. Connolly, D.; Lund, H.; Mathiesen, B.V.; Leahy, M. A review of computer tools for analysing the integration of renewable energy into various energy systems. Appl. Energy 2010, 87, 1059–1082. [Google Scholar] [CrossRef]
  32. Tsioloaridou, E.; Bakos, G.C.; Stadler, M. A new energy planning methodology for the penetration of renewable energy technologies in electricity sector—Application for the island of Crete. Energy Policy 2006, 34, 3757–3764. [Google Scholar] [CrossRef]
  33. Mahmoud, M.M.; Ibrik, I.H. Techno-economic feasibility of energy supply of remote villages in Palestine by PV-systems, diesel generators and electric grid. Renew. Sustain. Energy Rev. 2006, 10, 128–138. [Google Scholar] [CrossRef]
  34. Himri, Y.; Stambouli, A.B.; Draoui, B.; Himri, S. Techno-economical study of hybrid power system for a remote village in Algeria. Energy 2008, 33, 1128–1136. [Google Scholar] [CrossRef]
  35. Mondal, A.H.; Denich, M. Hybrid systems for decentralized power generation in Bangladesh. Energy Sustain. Dev. 2010, 14, 48–55. [Google Scholar] [CrossRef]
  36. Jiang, J.J.; Ye, B.; Ma, X.M.; Miao, L.X. Controlling greenhouse gas emissions from the transportation sector through a carbon emissions trading scheme in Shenzhen, China. Clima. Policy 2015, 6, 1–19. [Google Scholar] [CrossRef]
  37. Statistics, S.L.B. Shenzhen Statistical Yearbook 2014; China Statistics Press: Beijing, China, 2014. [Google Scholar]
  38. Ye, B.; Jiang, J.J.; Miao, L.X.; Yang, P. Sustainable energy options for a low carbon demonstration city project in Shenzhen, China. J. Renew. Sustain. Energy 2015, 7, 0231222. [Google Scholar]
  39. NASA (National Aeronautics and Space Administration). Surface Meteorology and Solar Energy. Available online: https://eosweb.larc.nasa.gov/sse/ (accessed on 15 September 2015).
  40. Sun, H.; Zhi, Q.; Wang, Y.; Yao, Q.; Su, J. China’s solar photovoltaic industry development: The status quo, problems and approaches. Appl. Energy 2014, 118, 221–230. [Google Scholar] [CrossRef]
  41. Wu, Y.N.; Geng, S. Multi-criteria decision making on selection of solar-wind hybrid power station location: A case of China. Energy Convers. Manag. 2014, 81, 527–533. [Google Scholar] [CrossRef]
  42. Solar Leading or OEM. 250 W Jamaica Solar Modules PV Panel with Polycrystalline Solar Cells for Commercial Photovoltaic Systems. Available online: http://www.alibaba.com/product-detail/250w-Jamaica-solar-modules-pv-panel _60010198677.html?spm=a2700.7724838.30.1.p3fCR8 (accessed on 12 October 2015).
  43. Suntree-30000TL transformerless suntree 30000TL. Available online: http://www.alibaba.com/product-detail/Suntree-30000TL-transformerless-suntree-30000TL_60047081761.html?spm=a2700.7724838.30.1.JGw1wH (accessed on 12 October 2015).
  44. Xiao, X.Q. A Study of the Motor Vehicle Parking Management in China’s Major Cities; Springer: Berlin, Germany, 2013. [Google Scholar]
  45. National Development and Reform Commission of Shenzhen City Notice of Publication Residents Ladder Pricing and TOU Price List, Shenzhen: 2012; Haitian Press: Shenzhen, China. (In Chinese)
  46. Jiang, J.J.; Ye, B.; Ma, X.M. The construction of Shenzhen’s carbon emission trading scheme. Energy Policy 2014, 75, 17–21. [Google Scholar] [CrossRef]
  47. China Certified Emission Reduction Exchange Info-platform. 2013 China’s Regional Power Grid Baseline Emission Factor. Available online: http://cdm.ccchina.gov.cn/zyDetail.aspx?newsId=46143&TId=161 (accessed on 19 October 2015).
  48. Kannan, R.; Leong, K.C.; Osman, R.; Ho, H.K.; Tso, C.P. Life cycle assessment study of solar PV systems: An example of a 2.7 kW(p) distributed solar PV system in Singapore. Sol. Energy 2006, 80, 555–563. [Google Scholar] [CrossRef]
  49. People’s Bank of China Decided to Cut Financial Institutions RMB Benchmark Lending and Deposit Interest Rates and Expand the Floating Range of Interest Rates on Deposits; People's Bank of China: Beijing, China, 2014.
  50. Dalton, G.J.; Lockington, D.A.; Baldock, T.E. Feasibility analysis of renewable energy supply options for a grid-connected large hotel. Renew. Energy 2009, 34, 955–964. [Google Scholar] [CrossRef]
  51. Kliesch, J.; Langer, T. Economy Plug-in Hybrids: An Environmental and Economic Performance Outlook; American Council for an Energy-Efficient Economy: Washington, DC, USA, 2006. [Google Scholar]
  52. Dong, X.; Li, C.; Li, J.; Wang, J.; Liu, S.; Ye, B. A novel approach for soil contamination assessment from heavy metal pollution: A linkage between discharge and adsorption. J. Hazard. Mater. 2010, 175, 1022–1030. [Google Scholar] [CrossRef] [PubMed]
  53. Ye, B.; Tang, J.; Li, J.; Huang, J.M.; Lv, X.M. Feasibility Study of Renewable Energy Powered Island-Hainan. In Proceedings of the International Conference on Computer Distributed Control and Intelligent Environmental Monitoring (CDCIEM), Changsha, China, 5–6 March 2012; pp. 330–333.
  54. Ye, B.; Tang, J.; Wang, D.; Lv, X.M. Pricing Carbon Allowance Based on Marginal Abatement Cost. In Proceedings of 2nd International Conference on Remote Sensing, Environment and Transportation Engineering (RSETE 2012), Nanjing, China, 1–3 June 2012.
  55. Shen, B.; Dai, F.; Price, L.; Lu, H. California’s cap-and-trade programme and insights for China’s pilot schemes. Energy Environ. 2014, 25, 551–575. [Google Scholar] [CrossRef]
  56. Wang, P.; Dai, H.C.; Ren, S.Y.; Zhao, D.Q.; Masui, T. Achieving Copenhagen target through carbon emission trading: Economic impacts assessment in Guangdong Province of China. Energy 2015, 79, 212–227. [Google Scholar] [CrossRef]
  57. Municipal Government of Shenzhen. Shenzhen Urban Transport White Paper; Transportation Commission of Shenzhen Municipality: Shenzhen, China, 2012. (In Chinese) [Google Scholar]
  58. Qing, S.H. Meilin Wind and Rain Corridor Enabled; Shenzhen Economic Daily: Shenzhen, China, 2011. [Google Scholar]

