Assessing and Mapping Forest Landscape Quality in China

1
College of Tourism, Central South University of Forestry and Technology, Changsha 410004, China
2
Recreation, Parks, & Tourism Resources Program, School of Natural Resources, West Virginia University, Morgantown, WV 26506, USA
*
Author to whom correspondence should be addressed.
Forests 2019, 10(8), 684; https://0-doi-org.brum.beds.ac.uk/10.3390/f10080684
Submission received: 19 July 2019
/
Revised: 7 August 2019
/
Accepted: 9 August 2019
/
Published: 14 August 2019
(This article belongs to the Section Forest Inventory, Modeling and Remote Sensing)
Abstract
:Forest landscape plays a critical role in the resource management and recreational planning of forest destinations. An assessment of forest landscape quality (FLQ) could reflect the distribution of landscape resources, hence identifying the hotpots and areas with high visual quality and protection values. The objective of this study is to propose, for the first time, a methodology for assessing FLQ at the national level. Based on China’s forestry inventory database, the paper identified landform patterns and vegetative patterns as determinants (including 12 indicators) to establish an evaluation index system, and further implemented and mapped FLQ using the ArcGIS Engine platform. Results show high mountain ranges and tropical areas in China often have a high-quality forest landscape, while low FLQ scores are found in low mountains and foothills. The distribution of the four FLQ levels indicates most forest areas are featured with mediocre- or low- quality landscape values, and the differences of FLQ among different forest types are obvious. Furthermore, there is a relatively low correlation between the total forest area and the area of high-quality forest landscape. Overall, this study could contribute to enriching the existing assessment system for FLQ and to guiding the planning, policy development, and decision-making for China’s forestry administration.
1. Introduction
Forest landscape plays a critical role in the resource management and recreational planning of forest destinations [1]. High-quality forest landscape can be understood as an important ecosystem service that positively influences human health and well-being [2]. That is, non-material benefits derived from forest landscape can affect people’s physical and mental wellness [3]. Evidence from substantial studies suggests that an explicit assessment of forest landscape quality (FLQ) could be useful to reflect the distribution of landscape resources, hence identifying the hotpots and areas with high visual quality and protection values [4]. Different from the cultural landscapes featured with relative stability, the physical attributes of forest landscape vary over time, because it is subject to the growth of trees, natural disasters, and human activities [5]. Based on periodic assessment results of FLQ, the forest authorities and operators could not only understand the existing status of forest resources, but also observe the dynamic changes and appraise the effect on a forest management plan, therefore proposing or adjusting appropriate management strategies for the sustainable development of the forest industry.
Over the last half century, numerous studies have assessed FLQ using a variety of qualitative or quantitative evaluation methods, with different evaluation models being developed, including expert approach, self-report approach, and psychophysical approach [6], paralleling a long-standing debate in the philosophy of aesthetics. An underlying assumption of the expert approach is that a forest landscape with features reflective of the principles of formal beauty has high aesthetic quality [7]. Expert approach is easy to apply without the need for a large-scale public survey; therefore, it has been widely adopted by forestry authorities in forest planning, landscape evaluation and management at regional and local levels. Self-report and psychophysical approaches have a high degree of flexibility and adaptability based on the perceptions and judgments of the lay public. However, they are usually used to assess FLQ that is case specific and on a small scale (e.g., forest parks or natural reserves) [4,8,9,10,11,12,13,14]. In general, owing to the lack of appropriate data sources and evaluation criteria, no studies hitherto have assessed FLQ at the national level.
From the perspective of research geographical locations, a large proportion of studies on the assessment of FLQ have been conducted in Europe, North America and Australia, while there is a dearth of related researches in China. In recent years, with the booming economy, rapid urbanization and growing demands of forest recreation, forest tourism has become the most dynamic and promising sector in China. For instance in 2018, the number of tourists to forest parks exceeded 1.6 billion in China, accounting for nearly 30% of the domestic tourist market [15]. This vigorously promotes the development of forest-based tourism destinations and triggers visitors’ pursuit of high-quality forest landscape accordingly. However, only a limited number of studies to date in China have focused on the assessment of FLQ [12,16,17,18,19,20,21]. Theoretically or empirically, the exiting studies lag far behind the development practice of China’s forest tourism [22]. Furthermore, the construction of ecological civilization and “Beautiful China” has been incorporated into national strategy in China, aiming to improve the natural environment and optimize ecological system [23]. Forest landscapes can be conceptualized as social–ecological systems [24], which therefore calls for more attention and deeper insights on conservation and utilization of forest landscape resources.
National forest landscape assessment could not only provide evidence for spatial layout of forest landscape on a large scale and guidance for the environmental impact evaluations of infrastructure and service facilities, but also identify comparable results across different regions. The objective of this study is to propose an assessment approach for FLQ at the national level based on China’s forest inventory database, develop an analysis and visualization application using ArcGIS Engine platform, and subsequently implement and map assessment results. Therefore, this study will enrich the existing assessment system for FLQ, especially on a large scale, and inform plan, policy and decision-making for China’s forest administration. Moreover, findings from this study also provide insights into assessment and resource management of other natural landscapes. Last but not least, it is also aligned with the worldwide trend of mapping and assessing ecosystem services, such as Mapping and Assessment of Ecosystems and their Services (MAES) [25] and Forest Landscape Assessment Tool (FLAT) [26] advocated by the European Union and the United States, respectively. To achieve these objectives, the following research questions are addressed:
How to build up a consistent methodology that is applicable to national forest landscape assessment on the basis of available inventory data?
How to visualize the assessment results in a straightforward way, allowing for comparison across time and regions?
2. Materials and Methods
2.1. Research Design
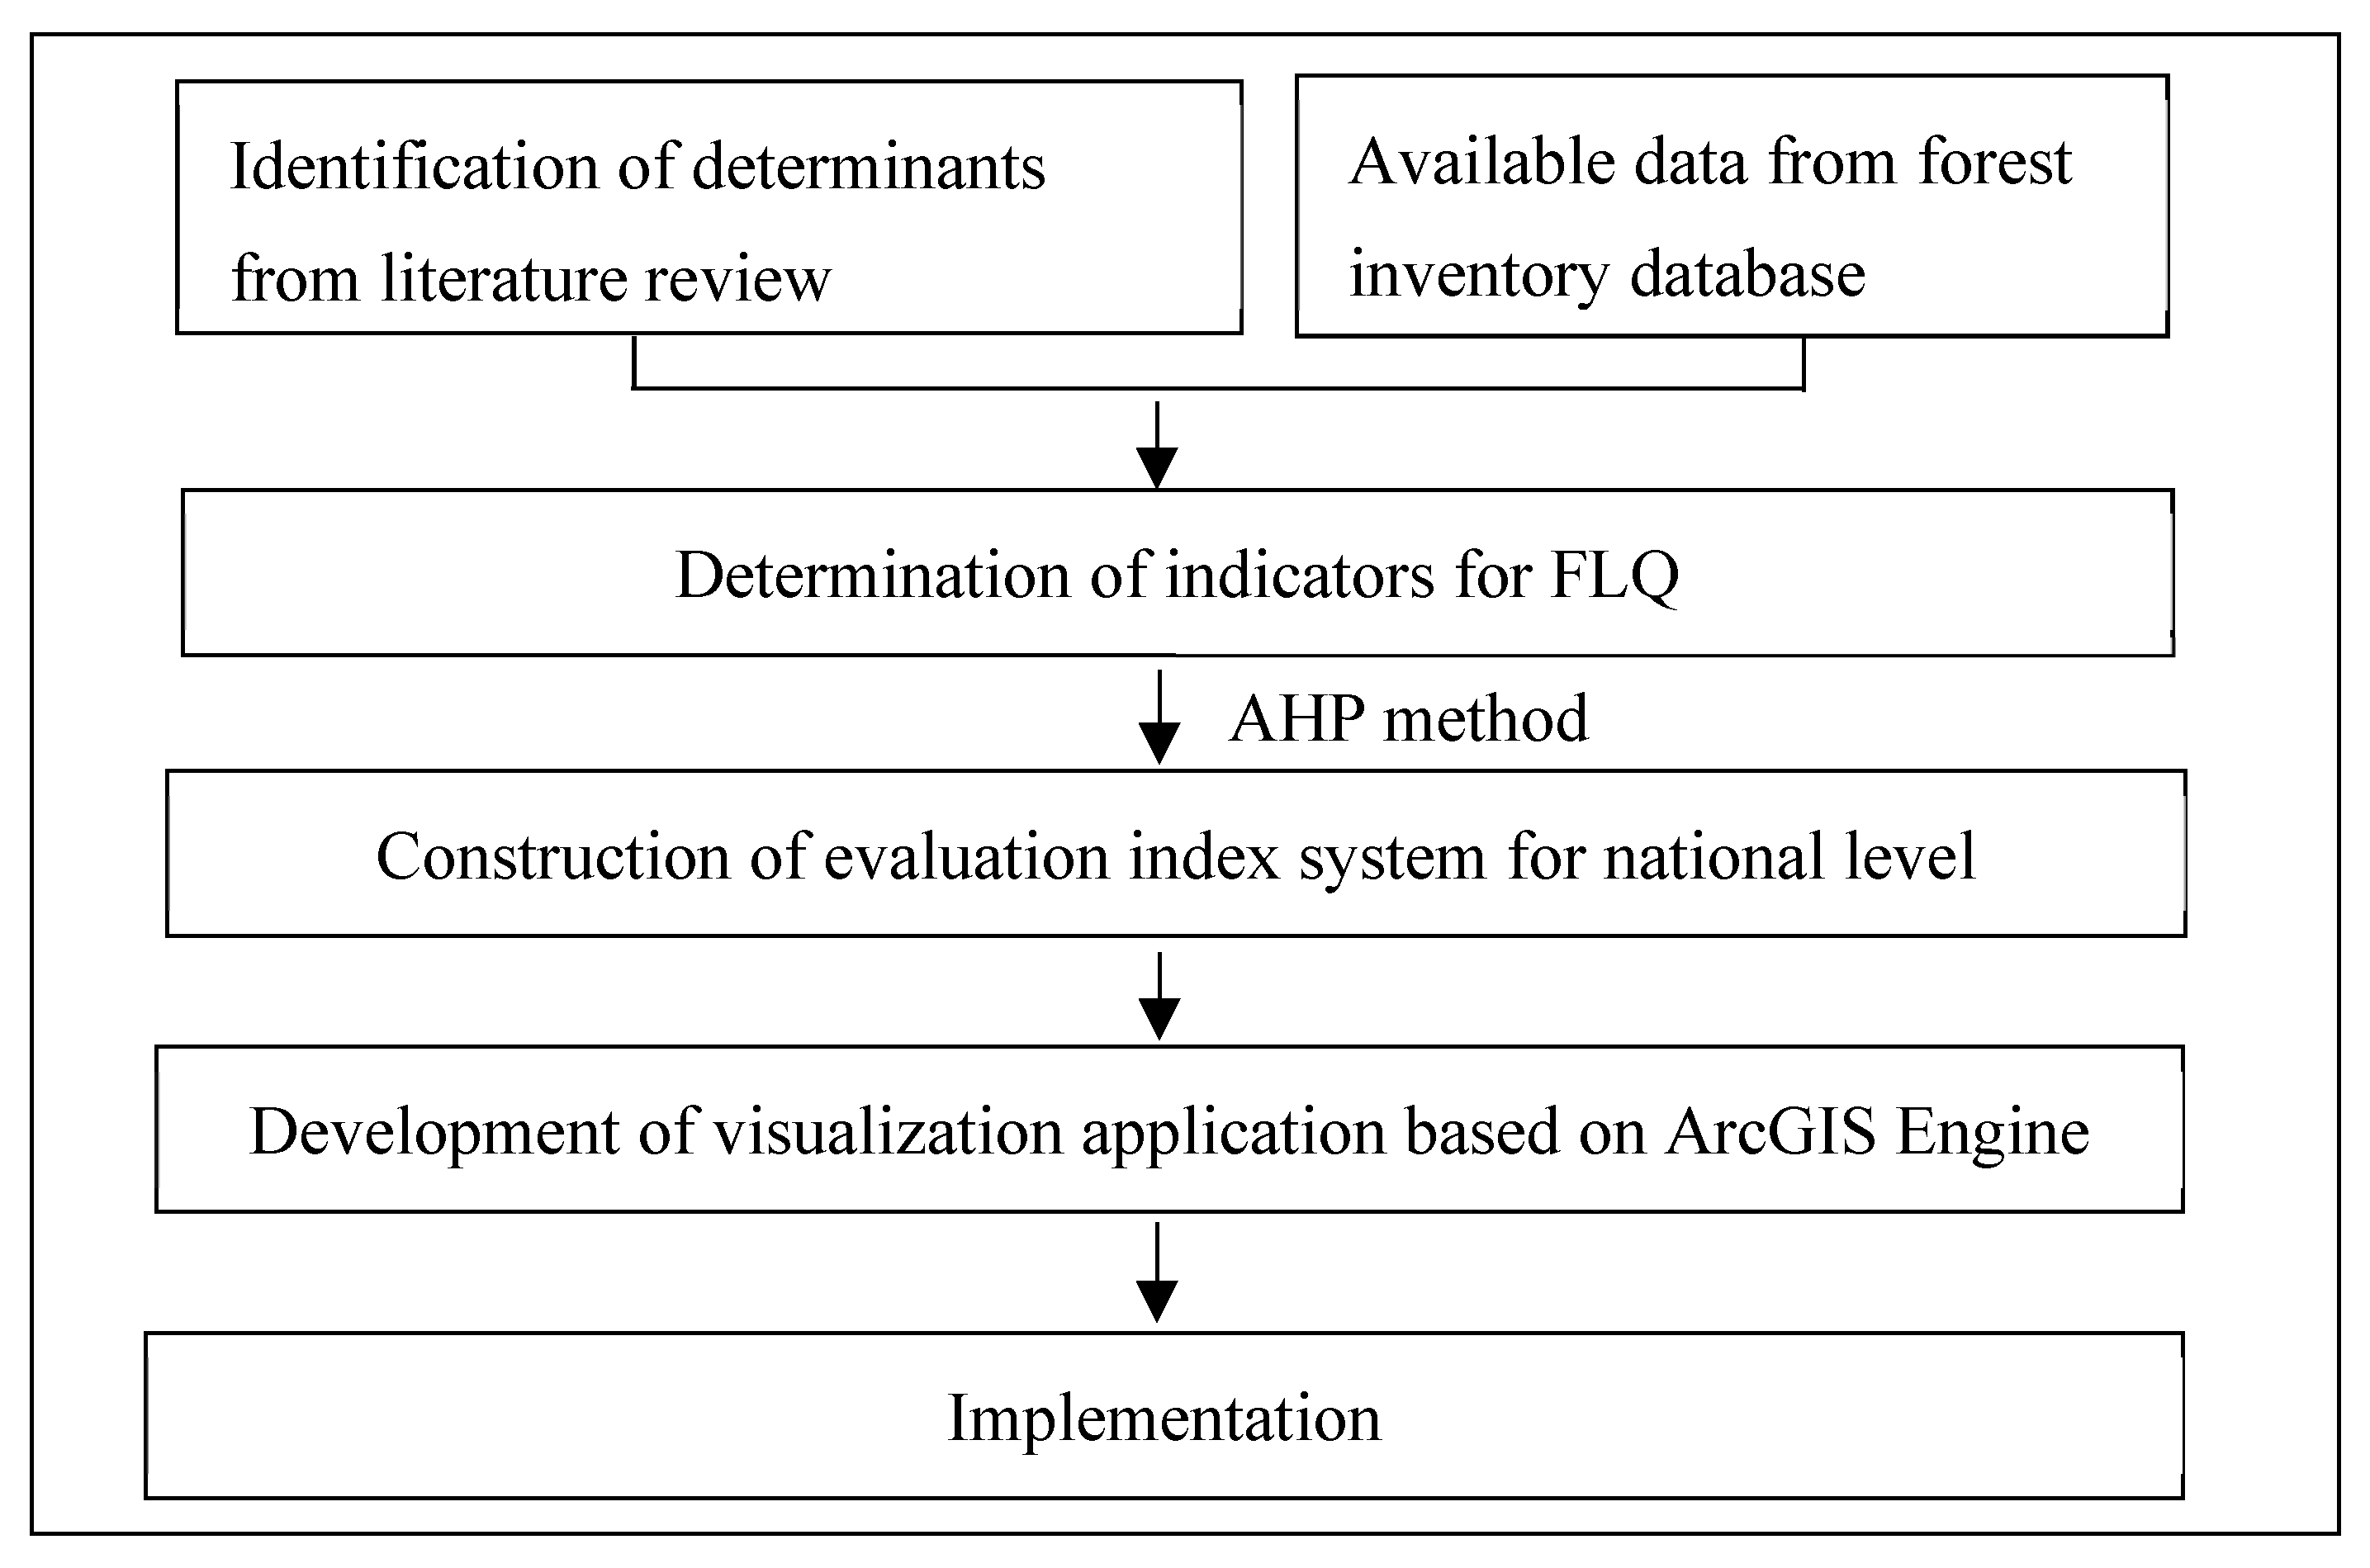
The research process in this paper consists of four steps (Figure 1). Firstly, we proposed an array of determinants and indicators influencing FLQ based on a systematic literature review and available data source. Secondly, a group of experts were invited to determine the weight of indicators using the analytic hierarchy process (AHP) method, and an evaluation index system applicable at the national level was constructed using this process. Thirdly, we developed an application run on ArcGIS Engine platform to calculate the score of each inventory unit and visualize the evaluation results. Finally, we implemented the assessment on China’s forest inventory database.
2.2. Data Sources
Since the 1970s, China has established a three-level forest inventory system to measure and record the status of forest resources and forest functions/benefits. This system mainly includes the National Forest Inventory (NFI, Level I), the Forest Management Planning Inventory (FMPI, Level II), and the Forest Operational Design Inventory (FODI, Level III) [27]. Of the three levels, FMPI provides timely and accurate information on forestland use and cover, spatial and functional patterns throughout China, which is most applicable data source for FLQ at the national level. However, they are property of the then China State Forestry Administration (renamed as China State Forestry and Grassland Administration) and not publicly available. Luckily, with the support of our funding organization (see acknowledgements), we are permitted to use the inventory for this study.
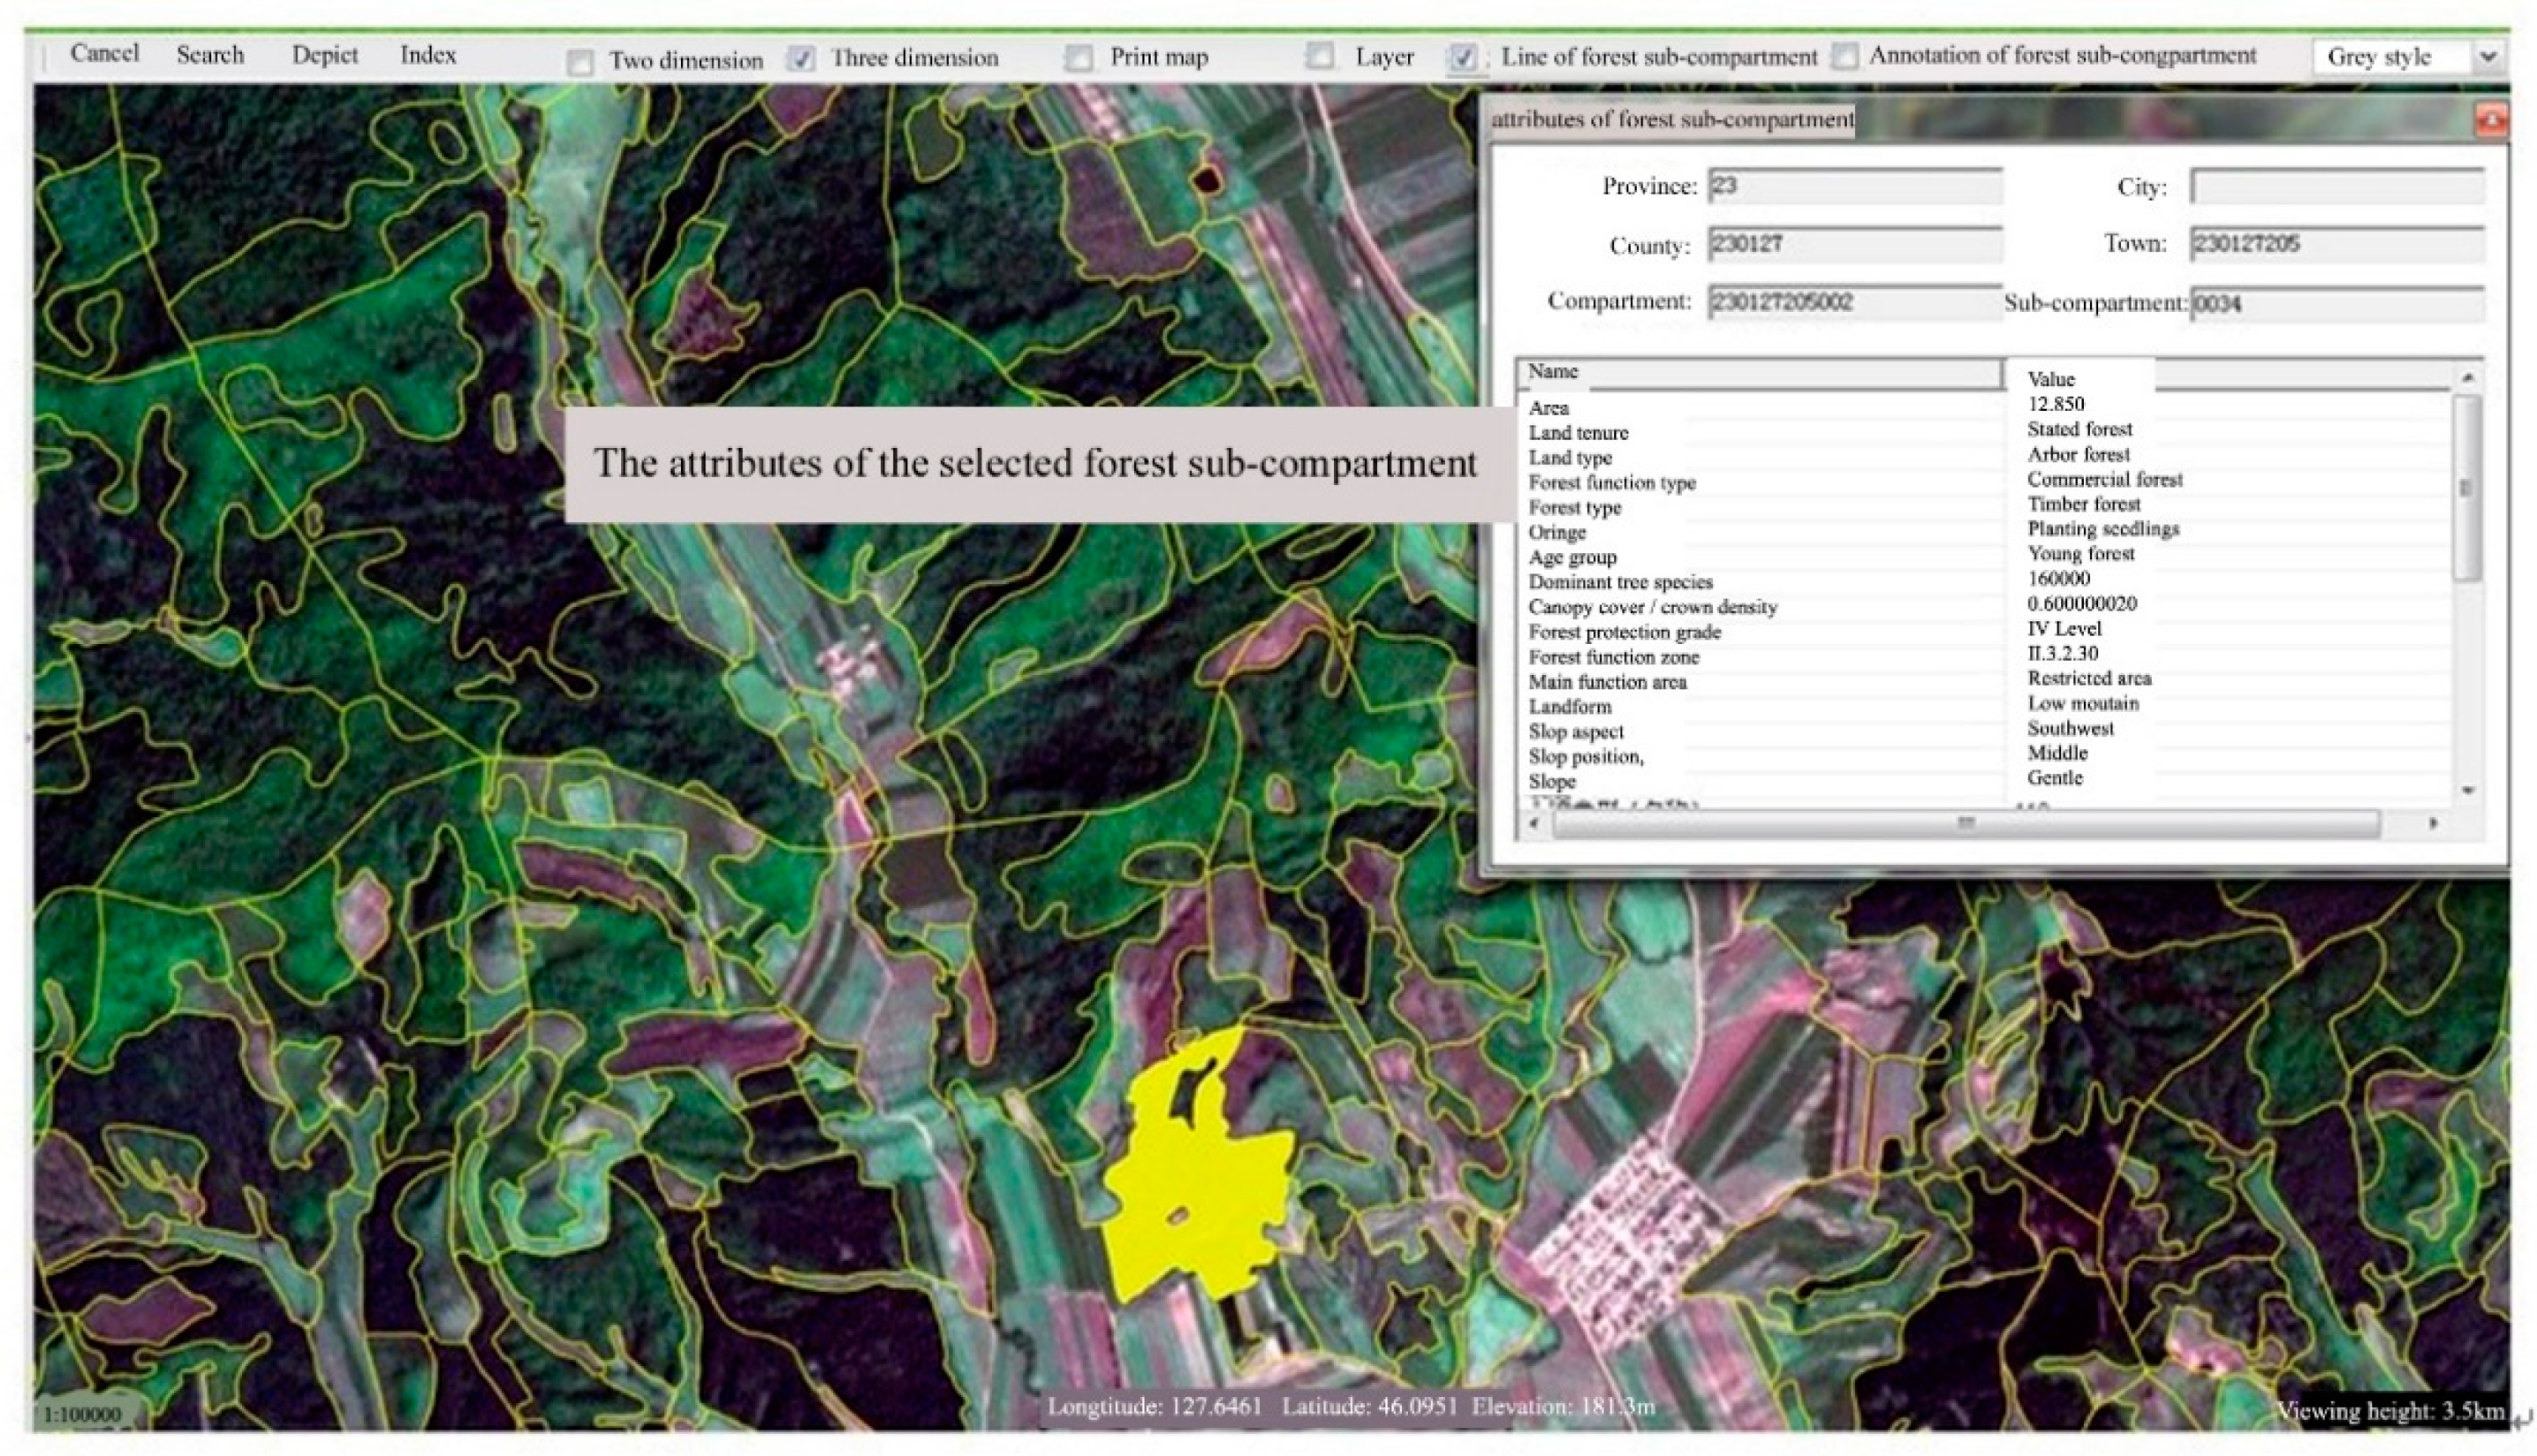
FMPI takes forest sub-compartments as the basic inventory unit. A sub-compartment refers to a fixed forest plot with the maximum area of 25 hectares, which has homogeneous physical attributes inside while differing from the adjacent areas. The key variables that distinguish a forest sub-compartment from another include land tenure, forest type, protection status, forest origin, tree species, age class, canopy cover, and site type. There is a list of 36 primary attributes for each forest sub-compartment, which could be grouped into four categories: land use and cover, stand characteristics, site and soil, and management and planning. A variety of inventory methods such as sample plot observation, visual observation, and remote sensing estimation are used in the survey of FMPI [28]. Furthermore, all FMPI data have been processed digitally and visualized on the GIS platform (Figure 2).
2.3. Determinants and Indicators
At present, only a limited number of studies have conducted natural landscape quality assessment on a large scale, most of which are based on national or regional level GIS database [29,30,31,32]. However, the data sources adopted in such studies are usually provided by different authorities or organizations, with different criteria of statistical units and spatial resolutions. Moreover, the determination of the indicators and weights of evaluation indices proposed in those studies did not reach a consensus.
As stated earlier, expert approach is more applicable to assessing landscape quality on a large scale than other approaches. Therefore, it was employed in this study. Derived from classical analysis or theories of human aesthetic perceptions, the expert approach involves a group of experts systematically inspecting and assessing a landscape on a range of indicators that are considered relevant to formal aesthetics [33]. Therefore, determination of the indicators reflective of landscape quality is a crucial step in the study. Specifically, the selected indicators need to fulfill several requirements, including: (1) Correspond to the widely recognized perception and preferences related to FLQ, particularly in management and planning practice; (2) belong to the biophysical features of landscape per se which could hardly be altered or manipulated by human activities; (3) be applicable to quantitative analysis in order to conduct numerical rating evaluation and map the results; and (4) be available in FMPI.
Based on a systematic review of visual concepts, Tveit et al. (2006) determined nine crucial determinants for landscape quality including stewardship, coherence, disturbance, historicity, visual scale, imageability, complexity, naturalness and ephemera [34]. Ode et al. (2008) proposed a framework for assessing landscape visual characters using theory-based visual indicators [35]. According to the ecological conceptual model, landscape quality is defined by ecological characteristics such as integrity, biodiversity or sustainability, independent of human values, judgements or preferences [36]. In the United Kingdom, Landscape Character Assessment (LCA) is a widely applied practical methodology for analyzing visual qualities through natural and social landscape attributes [37]. Furthermore, many studies shared the notion that naturalness, diversity, and uniqueness are the key determinants for landscape quality assessment [38], which were later employed to assess the aesthetic quality of nationwide landscapes in Germany [30]. From the perspective of forest resource planning and management, the United States Forest Service (USFS) developed the first version of the Visual Management System (VMS) in forestry wherein six indicators (i.e., distance, observer position, form, spatial definition, light, and sequence) are considered to affect the observer as s/he looks at the forest landscape (USFS 1968). Derived from formal aesthetics, USFS translated the biophysical features of forest landscape into formal features (e.g., form, line, texture, color) and relationships among these features (e.g., variety, unity, vividness, harmony). In 1995, USFS updated VMS and proposed the Scenery Management System (SMS), with landform pattern, vegetative pattern, water characteristics, and cultural features as the important indicators for determining the scenic attractiveness of forest landscape [39]. Since USFS’s techniques and methods for FLQ assessment have been widely emulated and applied in other countries, we also used them as a basis for the selection of FLQ indicators in this study.
Due to the data on water bodies and cultural features being not available in the FMPI database, we only used landforms and vegetative patterns as the two determinants to assess FLQ. Considering the correlation between attributes of forest sub-compartments and forest landscape quality, 12 indicators were chosen to form the evaluation index system (Table 1).
According to the forestland classification and statistical system of China, forestland is categorized as forested land (including arbor forest, mangrove forest and bamboo forest), open forestland, shrub forest, unestablished forestland, nursery land, non-stocked forestland, land suitable for forest, and forestland for auxiliary production, while only forested land and shrub forest are included in the statistical scope of forest cover rates. Moreover, the landscape quality of forested land and shrub forest are significantly higher than other types of forestland [40]. Therefore, we developed an evaluation index system of FLQ for the four types of forestland, namely arbor forest, mangrove forest, bamboo forest, and shrub forest.
2.4. Evaluation Index System
The process of developing the evaluation index system is composed of two steps: (1) Determining the weight for each indicator based on the AHP method and (2) obtaining the value assignment in terms of the class criteria of forest sub-compartment attributes in FMPI.
The AHP method provides a way of prioritizing the different elements in the hierarchy, which can enable decision-makers to identify the most important issues [41]. This method was developed in the 1970s, and later was adopted in the domain of landscape aesthetics [42], especially in flora landscape assessment [43,44,45,46]. The AHP method has proved its merits in providing more accurate and informative results than the numeral assignment method [47], which was therefore used as an appropriate approach for this research.
In order to collect pairwise comparison data, an e-mail questionnaire was undertaken by 25 academic scholars in the research field of forestry, ecology, landscape aesthetics and tourism. Considering the reliability and validity of the expert approach and AHP method heavily relying on the knowledges and judgements of the appraisers, all selected experts have around 20 years’ research experience in the field. A total of 16 responses were received, yielding a return rate of 64%.
Based on collecting and summarizing the pairwise comparison data of all indicators regarding the importance of landscape quality, the judgment matrix reflective of relative weight for each indicator is developed consequently. Then, inconsistency ratio is calculated to examine the consistency and reliability for each matrix. Experts need to re-evaluate their judgments in a pairwise matrix until an inconsistency ratio of less than 0.1 is achieved [48]. After three rounds surveys, the final results indicated that all inconsistency ratios are 0.1 or lower with the average of 0.07, which confirms the consistency and reliability of expert judgments. As shown in Table 2, four groups of weights with 42 nodes were developed to reflect relative importance of indicators contributing to FLQ. Each weight is rounded to two decimal places.
Furthermore, all attributes of forest sub-compartments have specific class criteria in the FMPI. For instance, the crown density can be described as being good (70%–100%), moderate (40%–69%), or poor (20%–39%); the slope is divided into six classes including little or none (0%–5% gradient), gentle (6%–15%), moderate (16%–25%), steep (26%–35%), extremely steep (36%–45%) and excessively steep(>46%). The experts were invited to score (0 to 10) each class of each indicator according to their visual quality values. The higher the score, the better quality the landscape. All classes of the indicators were weighted after rounding the average scores.
Finally, in order to intuitively reflect the FLQ at the level of forest sub-compartments, a grading system was developed based on the total scores (Table 3).
2.5. Data Process
In order to visualize the calculation results with map support, we developed a GIS-based application with graphics user interface (GUI) to run on FMPI database. Microsoft. NET Framework 4.0 and C# hybrid programming technology were adopted to appraise the level of FLQ for each forest sub-compartment, and ArcGIS Engine was employed as a platform to visualize the evaluation results. ArcGIS Engine is a collection of GIS components and developer resources that can be embedded, allowing the developers to add dynamic mapping and GIS capabilities to existing applications or build new customized mapping applications [49]. For simplifying the data process, all types of forestland, excepting arbor, mangrove, bamboo and shrub forests, were treated as low-quality landscape and included into L4.
Based on the area size and grading result of each forest sub-compartment, we could calculate the total FLQ score for each county (county is the third level of local government in China, coming under both the provincial level and the prefectural level) using the formula below:
where S is the total score of a county and m is the total number of forest sub-compartments in the county. Ai refers to the FLQ score of the i-th sub-compartment, and Bi represents the size of the i-th sub-compartment. C denotes the total area of forestland in the county.
3. Results
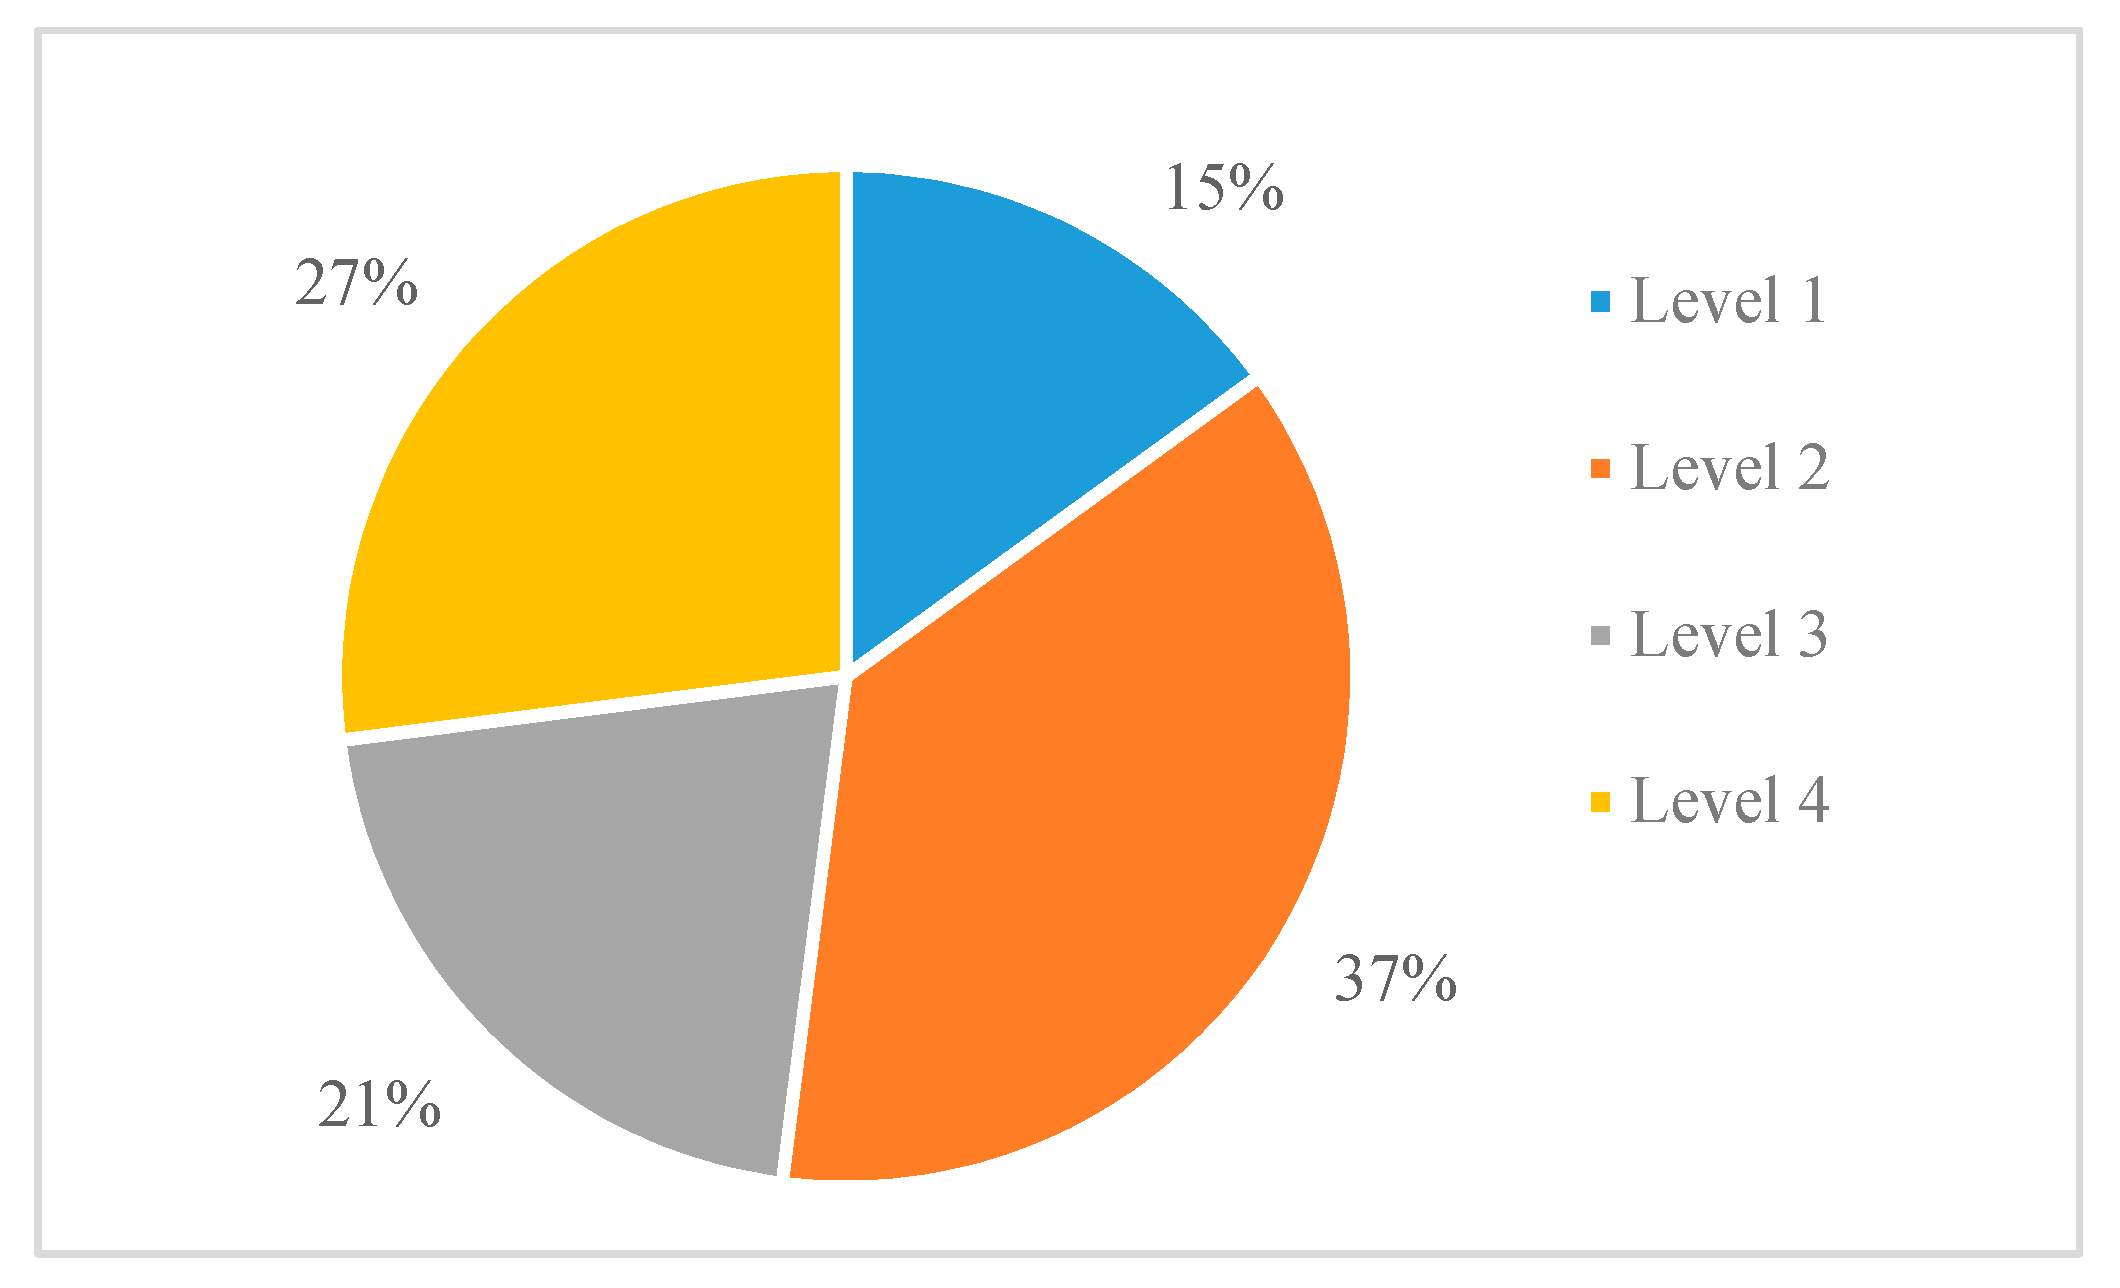
The percentage distribution of the four FLQ levels is shown in Figure 3. As shown, L2 forest landscape accounts for the largest proportion (37%) of the total forest area in China, followed by the L4 and L3 forest landscapes, each occupying 27% and 21% of the total. The results mean that nearly half of the total forest area is covered with mediocre- or low- quality forest landscape. Moreover, L1 forest landscape makes up the smallest percentage of the total (15%), indicating that areas with high-quality forest landscape are scarce.
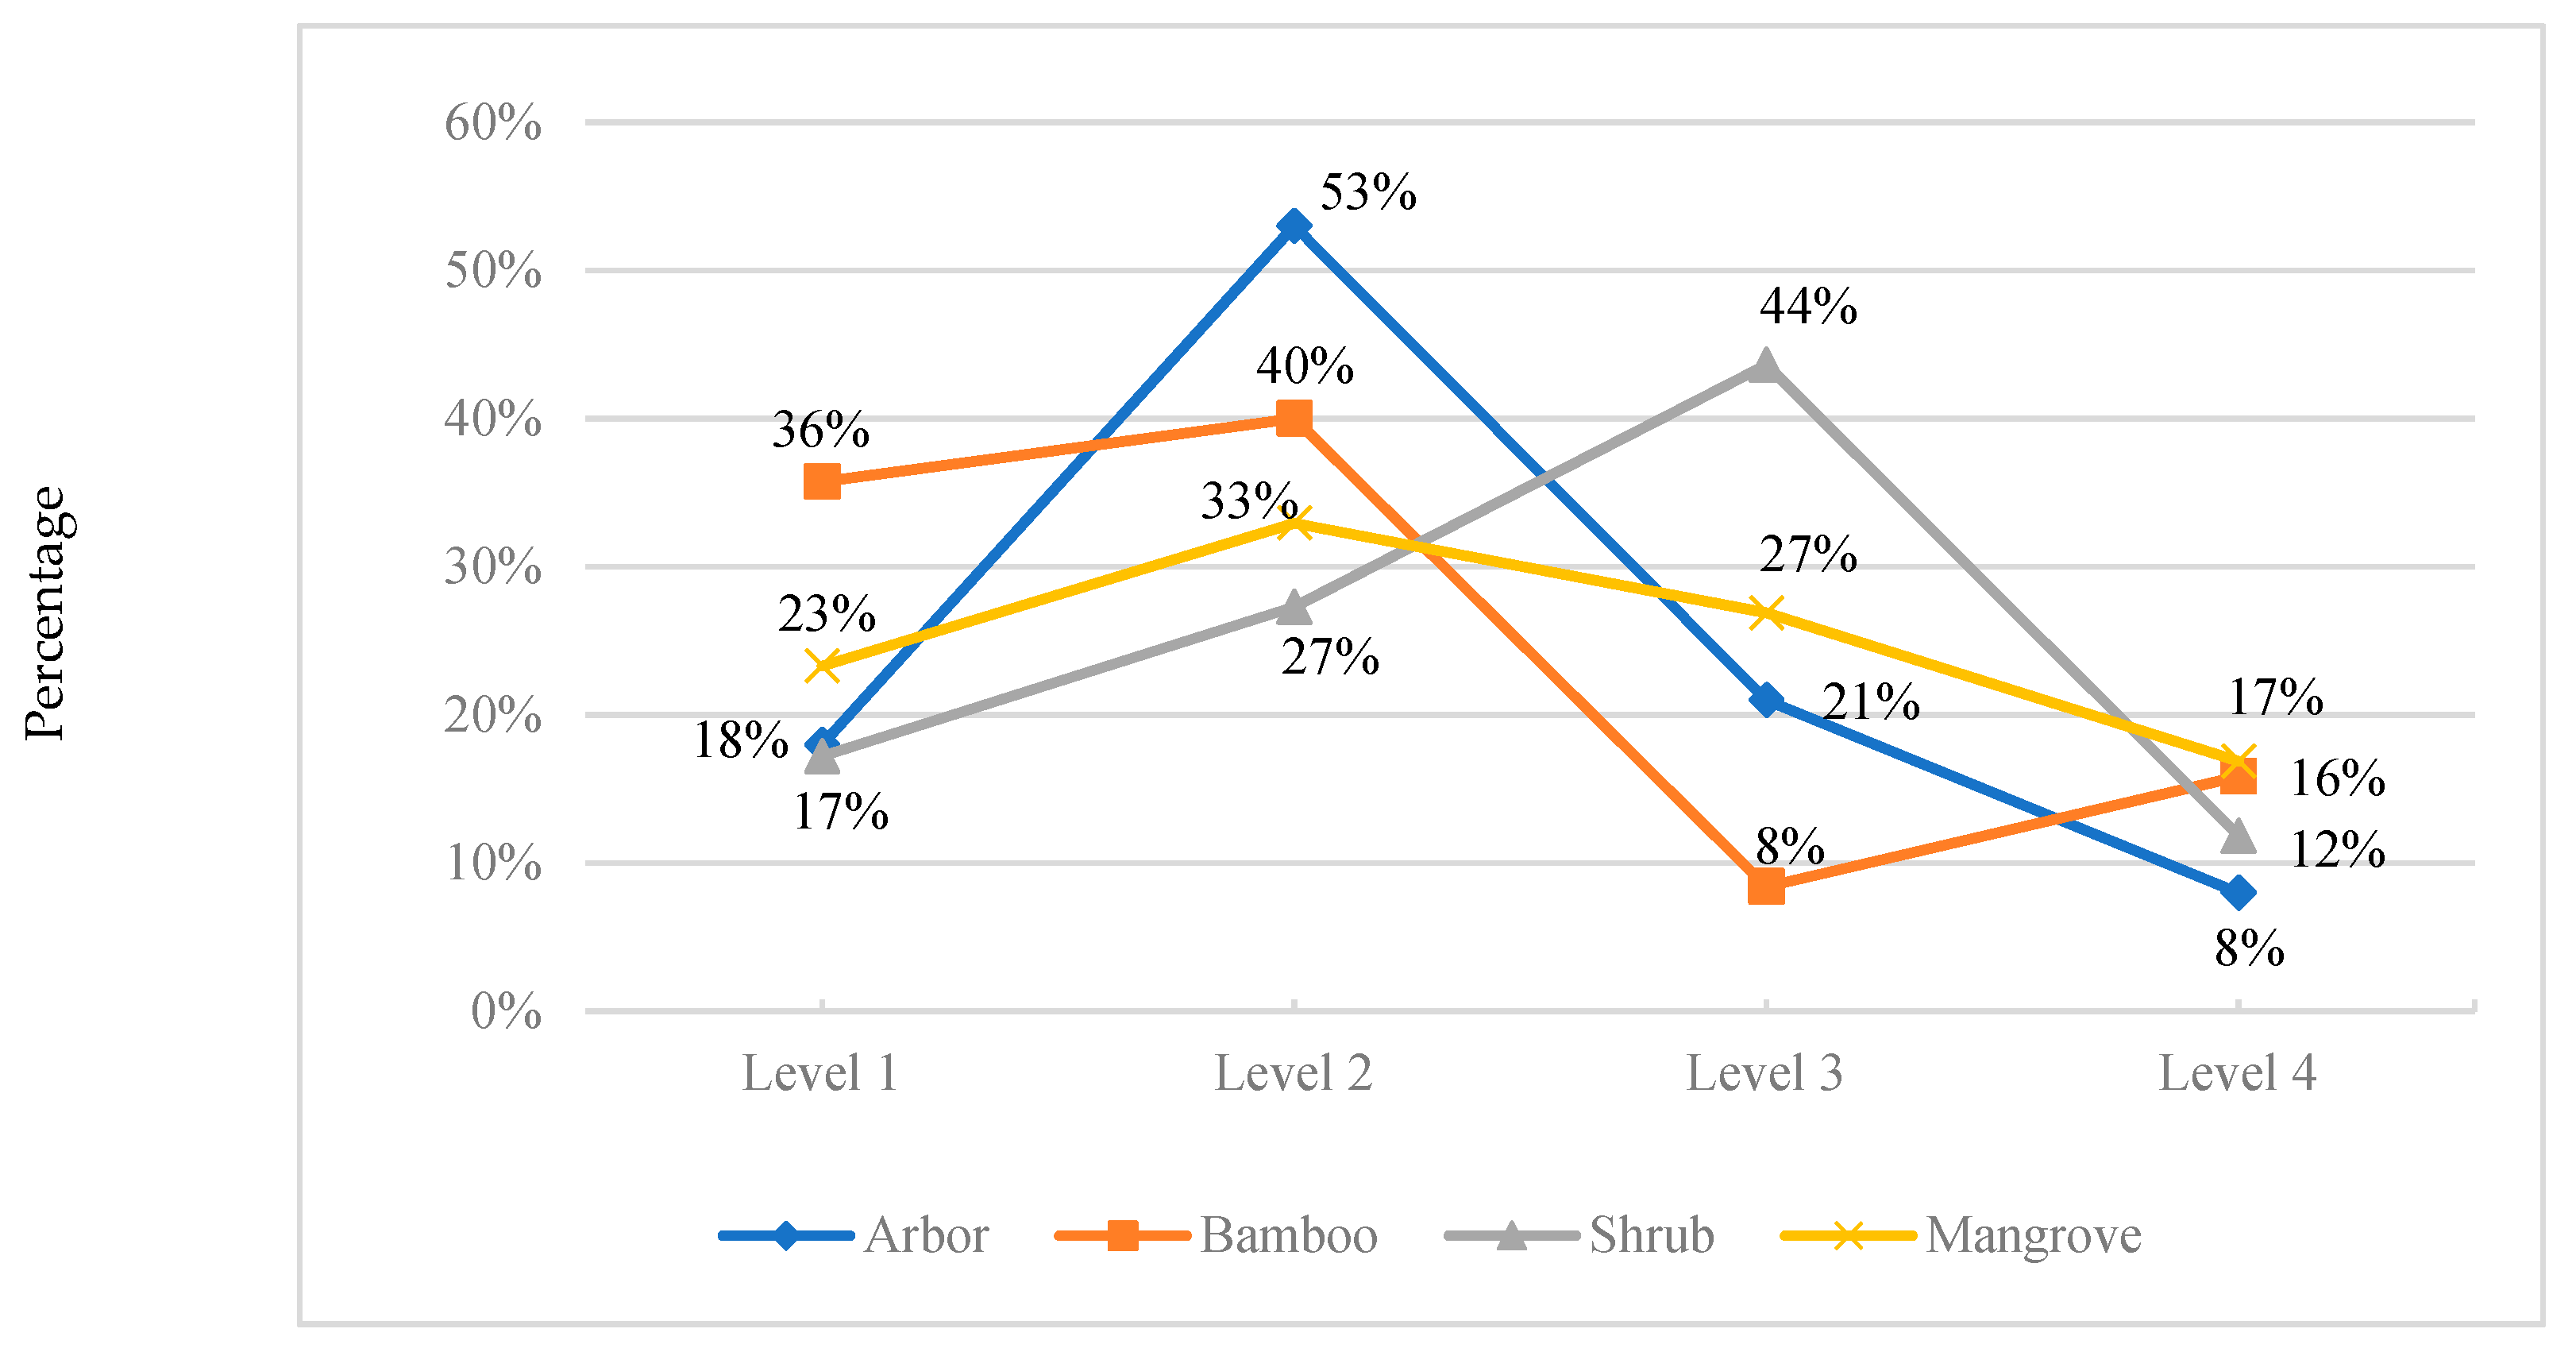
As can be seen from Figure 4, the differences in the percentage distribution of the four FLQ levels are evident. In China, arbor forests make up the largest proportion of the total forest area by forest types, and therefore the landscape quality of arbor forests contributes significantly to the overall assessment of the forest landscape [50]. The results reveal that the percent of L2 arbor forest landscape exceeds half of the total arbor forest area, notably greater than that of other forests. Furthermore, L4 arbor forest landscape only accounts for 8% of the total, demonstrating the lowest share in comparison with the other types of forests. Shrub forests are another type of forest extensively distributed in China, accounting for 18% of the total forest area. However, over half of shrub forests stand out for their mediocre- and low-quality forest landscape. Also, results indicate that a majority of the bamboo forest landscape are characterized by areas with high and relatively high landscape quality. More specifically, L1 forest landscape occupies more than a third of the total bamboo forest area (36%), endorsing previous findings that bamboos are of high aesthetic and recreational values [51]. Additionally, the percentage distribution of the FLQ levels regarding mangrove forest landscape is relatively dispersed, with a peak at 33% and a nadir at 17%.
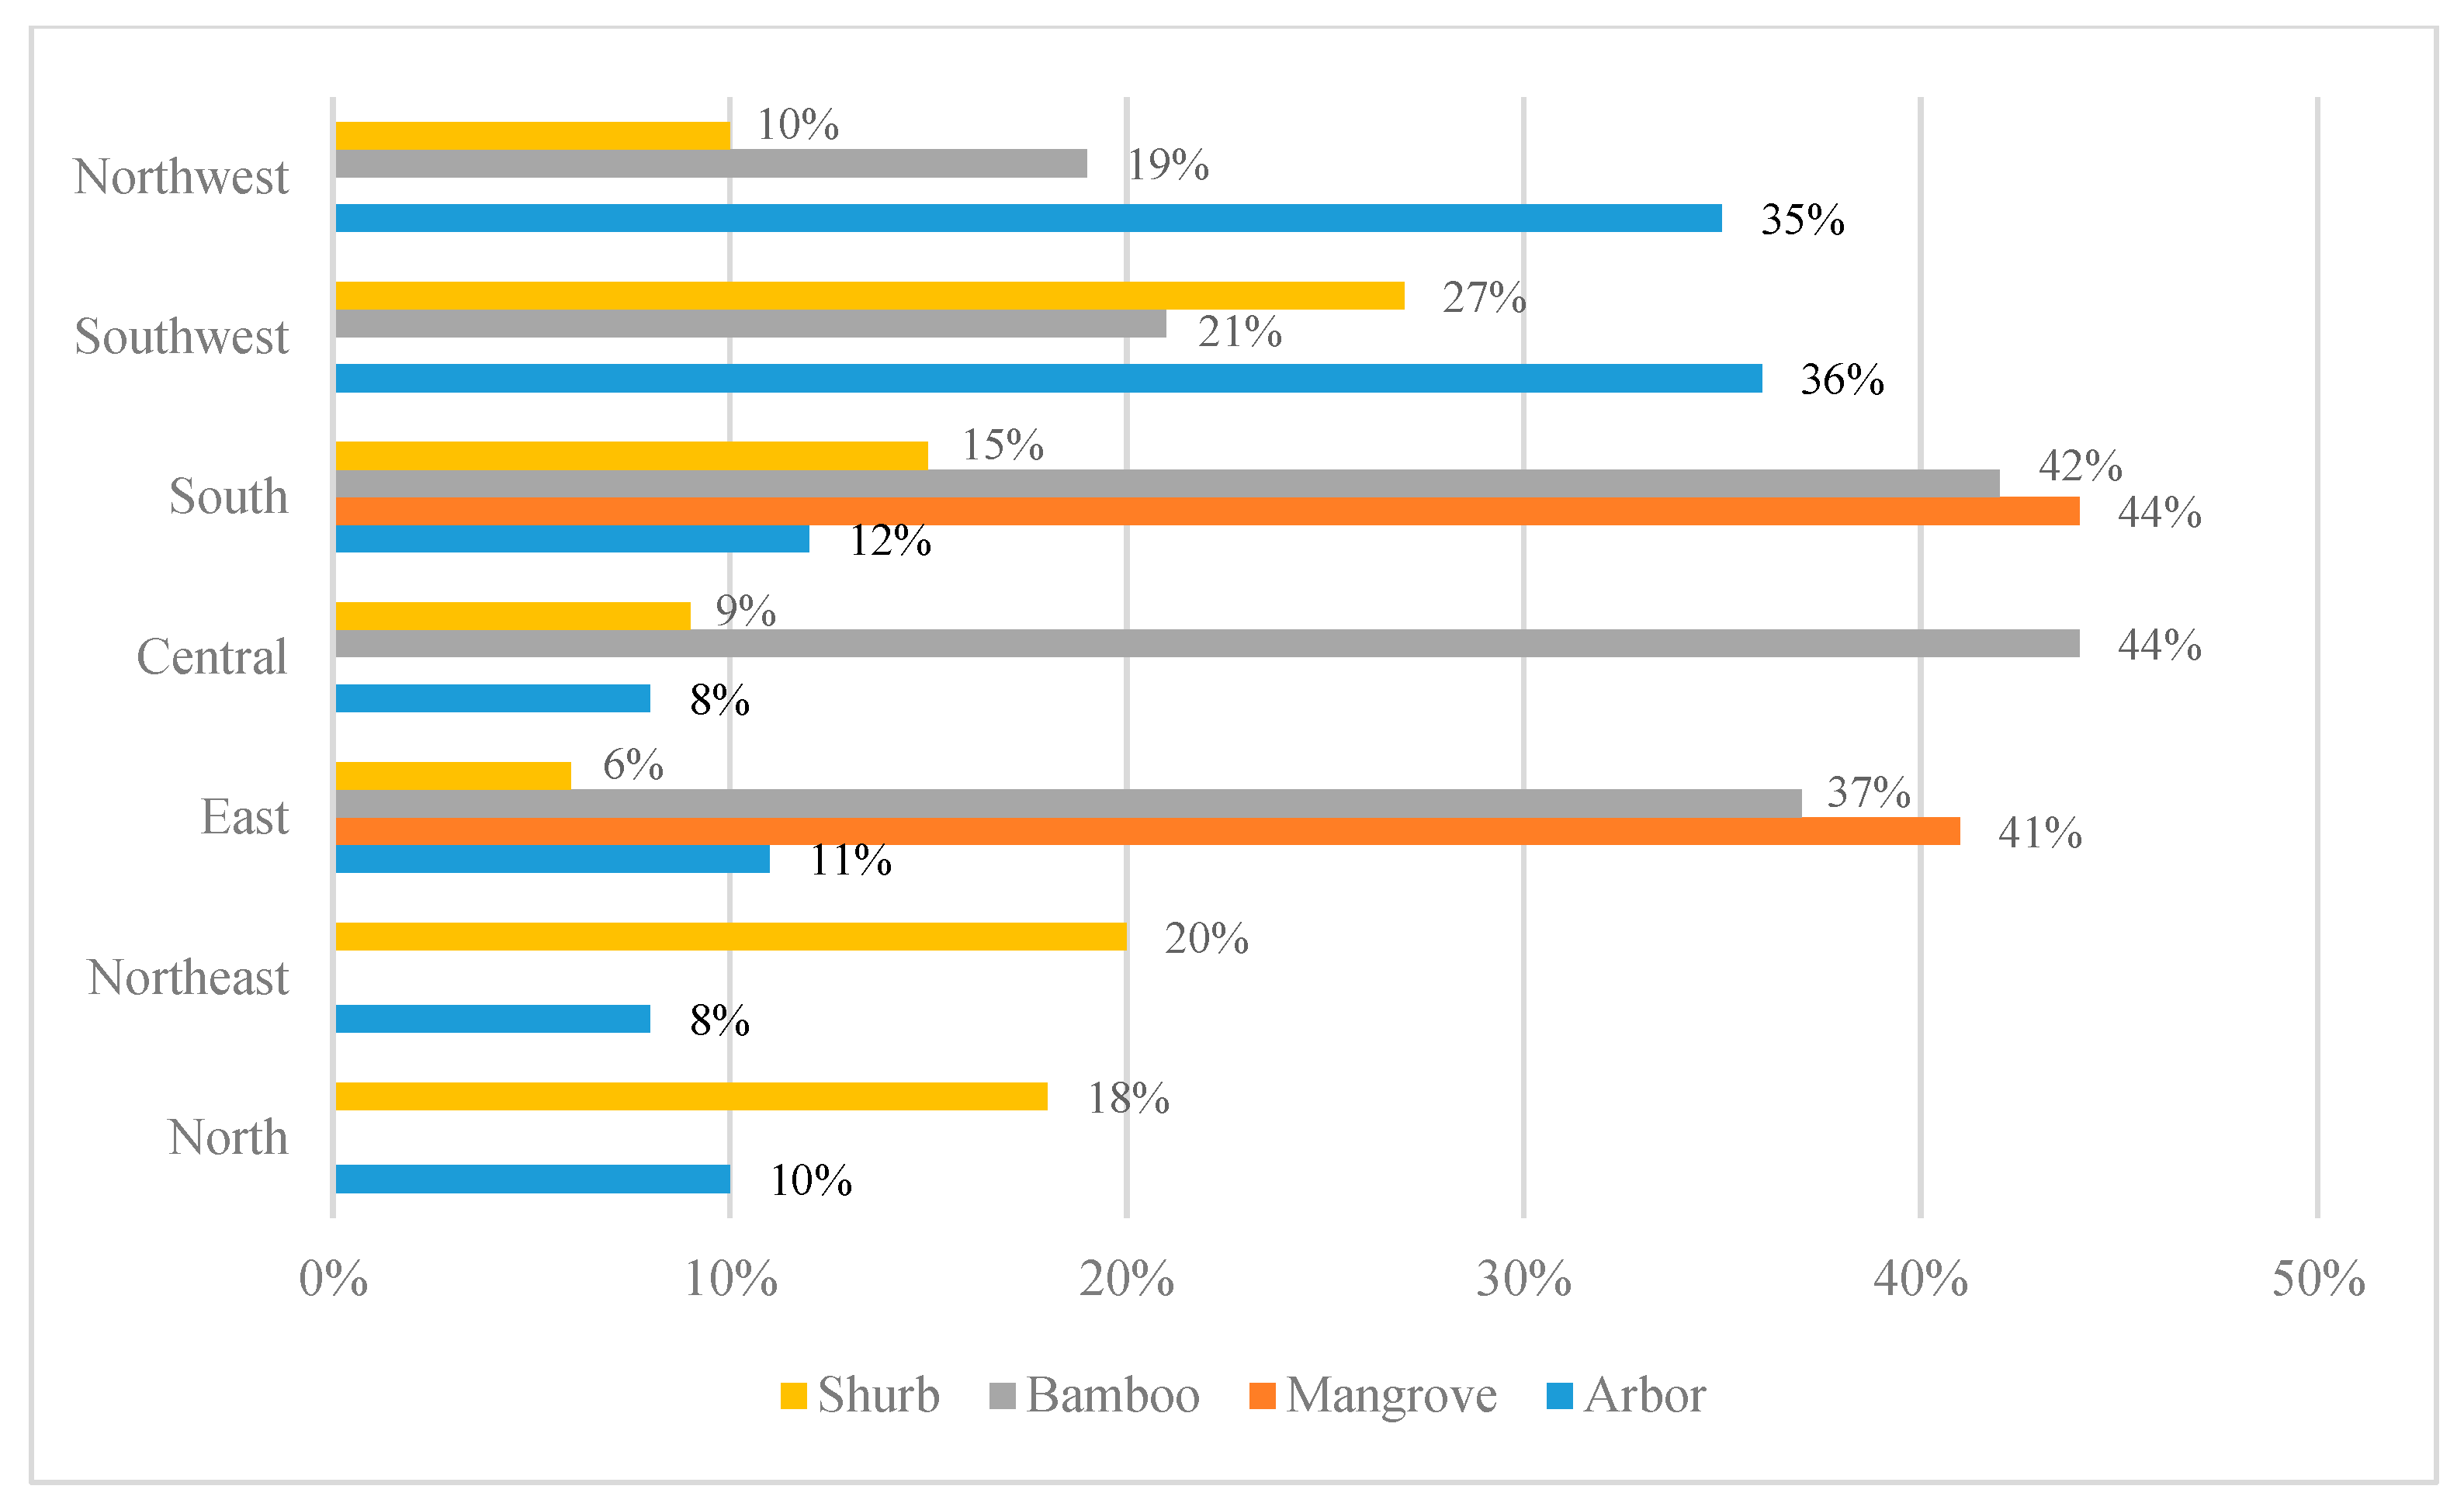
Regionally, there are 31 provincial-level divisions (hereinafter referred to as divisions) in Mainland China which are often grouped into seven regions, according to their geographical proximity and cultural similarity. The percentage comparison of the L1 arbor landscape across the different regions (Figure 5) shows a clear tendency for higher FLQ levels in areas with higher attitudes. Over one third of the total arbors in the west regions, including southwest and northwest of China, are rated higher, more than three times the homogeneous proportion in other regions. However, those areas in the east, central and south of China, which are characterized by hills, low mountains and plains in topography, often have better bamboo forest landscape than the west. Furthermore, nearly one fourth of the shrub forest in the northeast and southwest have high scores, while the smallest percentage of L1 shrub forest landscape can be found in the eastern and central China. Although the mangrove forest is only distributed in the coastal divisions of east and south China, the percentage of L1 forest landscape prevails over other levels.
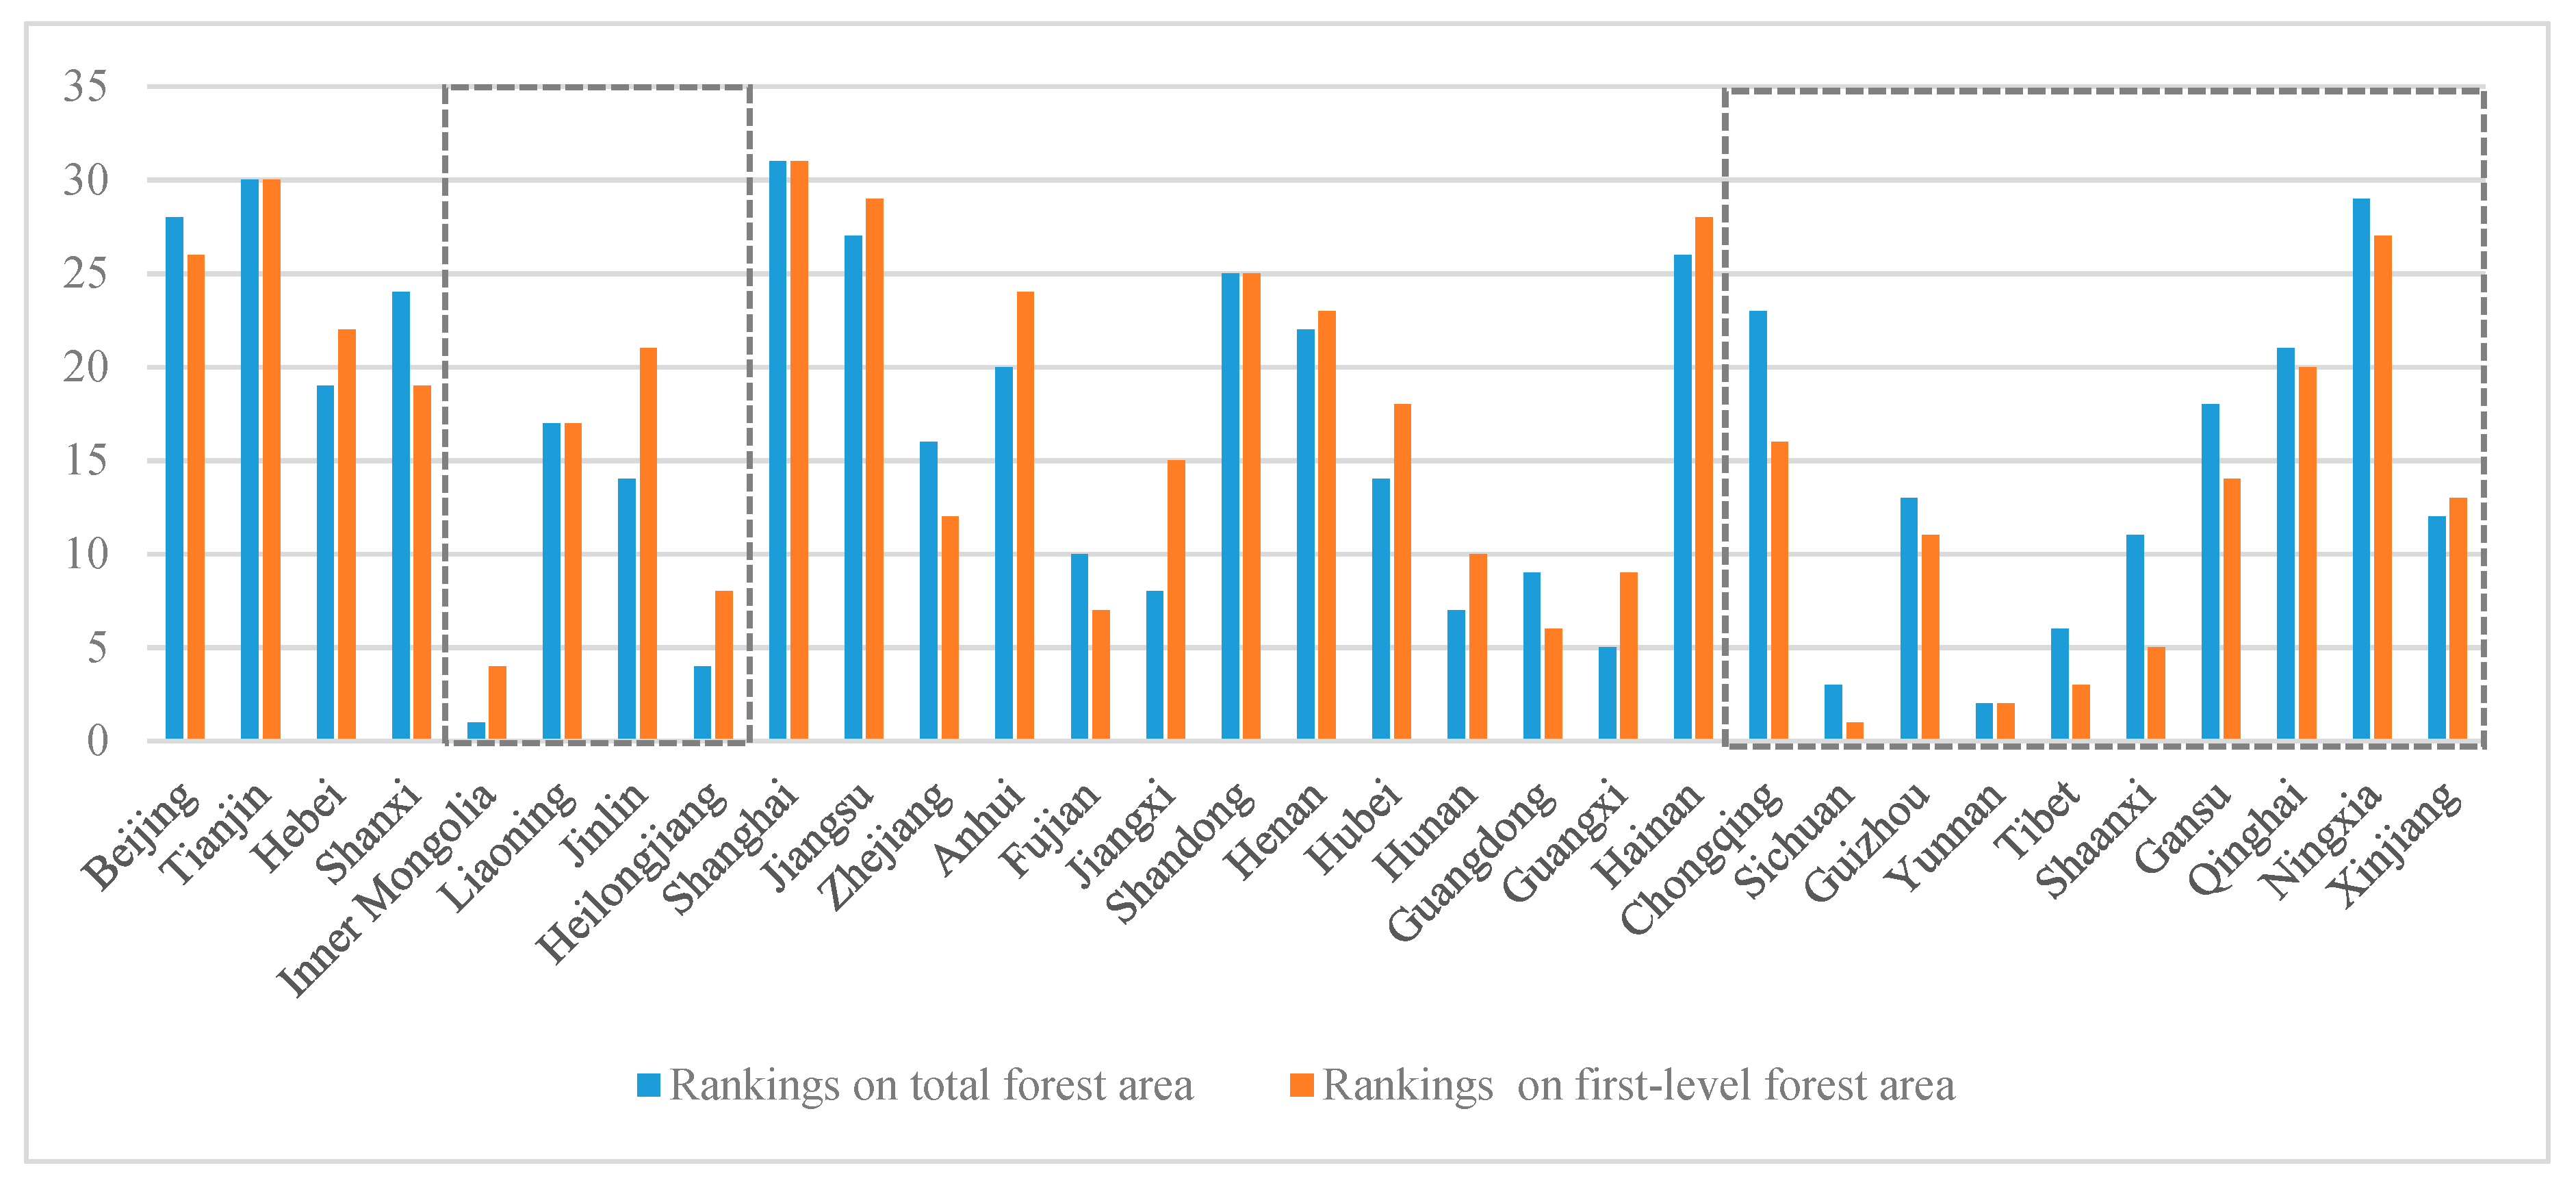
For the purpose of administrative convenience, Figure 6 presents a ranking comparison between the total forest area and the area of L1 forest landscape in 31 divisions. Results show that only five divisions (Tianjin, Liaoning, Shanghai, Shandong, and Yunnan) occupy the same position at two ranking systems, accounting for 16% of the total divisions. Furthermore, most of divisions reveal slight differences in both sets of data, ranging from 1 to 4. However, the variation between the two ranking systems was evident in four divisions (Jilin, Jiangxi, Chongqing, and Shaanxi). A plausible explanation for this difference is that abundant forest sources with high-quality landscape can be found in Chongqing and Shaanxi, while most areas in other two provinces are featured with mediocre-quality forest landscape, despite the vast area of forest lands. Interestingly, rankings of L1 forest landscape areas are higher than those of the total forest area in all divisions of Southwest and Northwest China except Xinjiang and Yunnan, but the opposite is true for northeast regions. Consequently, the low consistency between the two ranking results indicates that the formulation of forest management policy needs to take both the quantity of forest area and the quality of forest landscape into consideration.
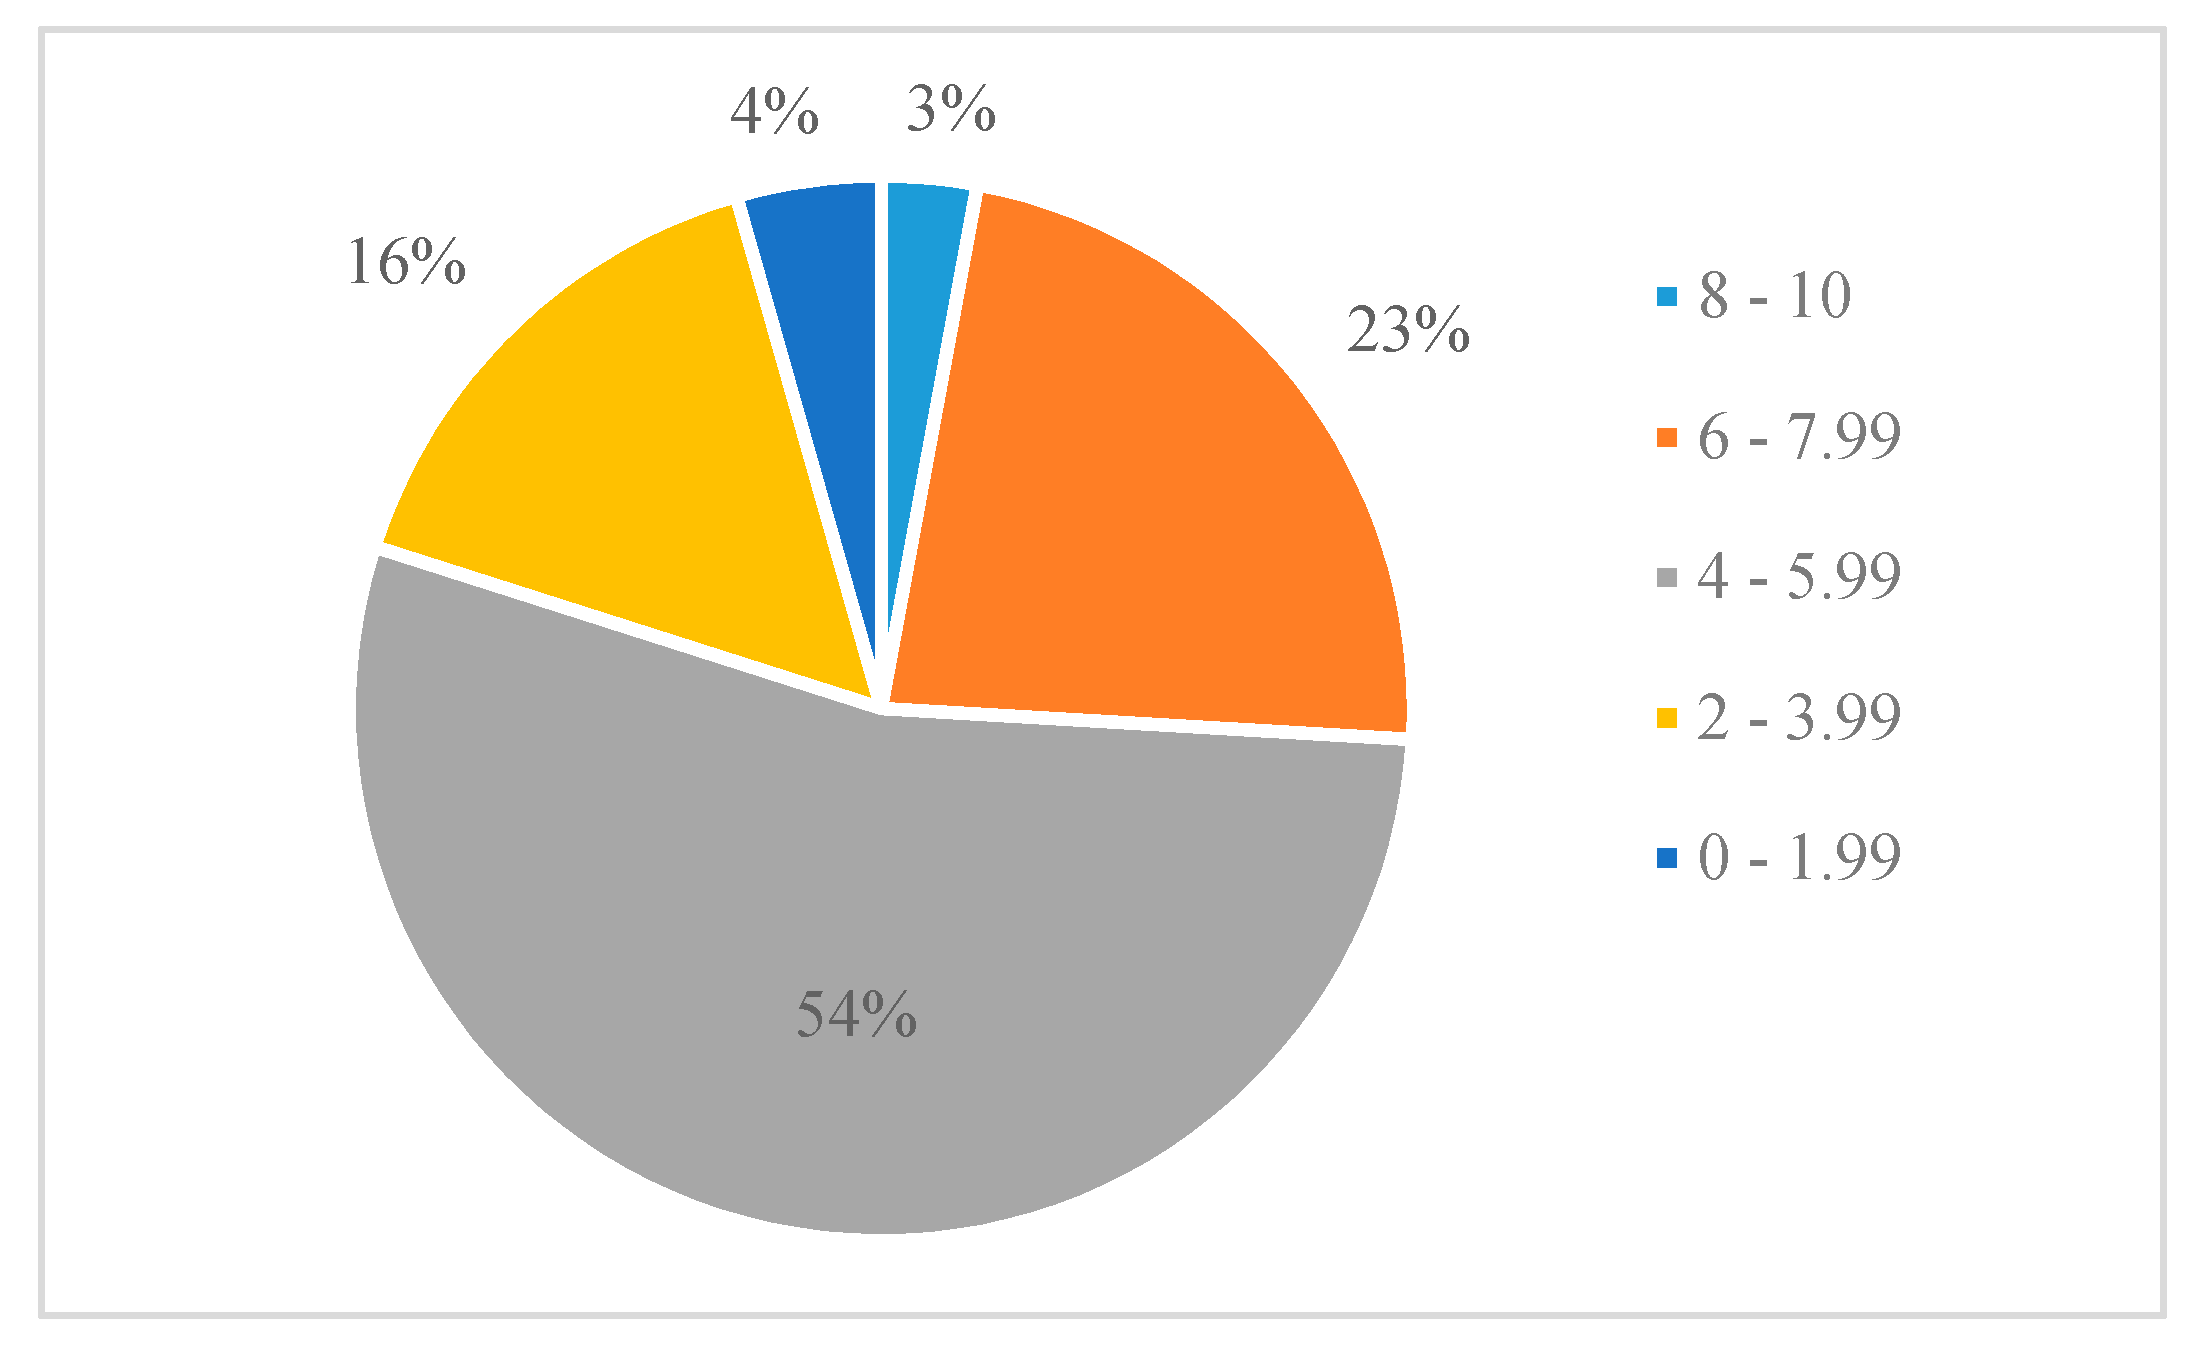
In terms of the formula proposed in Section 3, the mean score of all counties (2573 counties in total) is 5.77, ranging from 1.02 to 9.61. Only a small proportion of counties scored very high (>8) or very low (<2) (Figure 7). Those counties with high FLQ scores are often well-known for iconic attractions within the region, such as national forest parks and natural reserves, while counties where large areas of plantations or open forestland are distributed stand out for low scores. Hence, the results can be used to identify hotspots and areas in need of priority forest protection or further improvement, and can also allow for inter-county comparison.
The resulting FLQ map for China (Figure 8) shows areas with high-quality forest landscape are mainly distributed in high mountain ranges of northeast, southeast and northwest of the country, as well as in tropical forest areas. More specifically, extremely high values are achieved in the greater Xing’an mountain in Inner Mongolia, Changbai mountains in Jilin, west Sichuan and northwest Yunnan, Linzhi and Bomi in Tibet, Tianshan mountains and Altai mountains in Xinjiang, Qinling mountains in Shaanxi, Wuyi mountains in Fujian and Wuzhi mountains in Hainan. In contrast, the lowest values can be found in the low mountains and foothills of east and south China with high dense population and urbanization rate.
4. Discussion
We developed and applied a method to assess and map FLQ in China. The study applies landform patterns and vegetative patterns as two determinants (including nine quantitative indicators) to establish an evaluation index system, and finally implement it on FMPI.
This research makes several methodological contributions to FLQ assessment. First, it provides evidence to support that the expert approach and AHP method could be applied to FLQ assessment in different spatial contexts and on different scales. Based on those two methods, we constructed an evaluation index system which is applicable for FLQ assessment at the national level, hence the method can be used as a supplementary or even an alternative method to traditional assessment approaches. Second, the selection of determinants and indicators was based on a systematic review of the landscape perception theory and empirical studies in this paper. The review shows that there is a basic consensus on influence factors regarding FLQ. Findings also suggest the selection of determinants and indicators should comply with the requirements described above, particularly accounting for data quantifiability and availability. Additionally, the study incorporates local level data (forest sub-compartment data) into the assessment method, and the calculation results of each forest sub-compartment can be aggregated to obtain a total score reflective of FLQ for larger spatial units, such as forest parks and administrative regions (e.g., county, city, and province). Therefore, the method also supports detailed local and regional analysis.
Findings of this study also offer several practical implications for conservation, management, and recreational utilization of forest resources. First, the results demonstrate the different distribution of FLQ scores across the nation, which could usefully inform forest planning and policy-making. Those areas with high FLQ are considered to have high visual quality, which should be listed within the landscape protection areas. The exploration in those areas need to be governed by strict conditions to minimize impacts. For example, buildings and associated services should be regarded as being secondary to the natural features of the area, as well as being forbidden to construct in visually exposed and sensitive areas. However, regions with particularly low FLQ need to focus on changing forest structure, adjusting or replacing tree species in order to improve the quality and stability of forest stands. Second, the numerical weight of each indicator in the final index refers to the relative importance for FLQ, which provides the forest policy-makers and managers with the guidance on priority landscape construction for further improvement. Moreover, the application developed in this paper can easily be run on the GIS platform. The visualization assessment results could not only help forest authorities and managers to better understand the state quo of forest resources, but also observe the dynamic changes over time as a practical monitoring program, therefore allowing for timely policy adjustments.
This study is an exploratory investigation to assess FLQ on a national scale, whereas the empirical results reported herein should be considered with some limitations. Although the database used in this assessment is the best available data source within China’s forest inventory, it does not take into account some variables or indicators that have influence on FLQ, such as water bodies, landscape visibility, and cultural features [39]. This may result in disapproval with the method for having inadequate levels of reliability and validity. However, the predefined evaluation index system can be adjusted and updated if more attributes are added in the forest inventory in the future.
As stated earlier, all the selected indicators in this paper belong to the biophysical attributes of forest landscape, which also means that the assessment method is unlimited in spatial scale. However, the results using different evaluation approaches, such as self-report and psychophysical approach at regional and local levels, may deviate from the results obtained from using our proposed method. There are two reasons for the possible deviation of evaluations. First, the perception-based approaches are based on the subjective perceptions and aesthetic preferences of the evaluators [52]. Second, some aspects of the evaluations cannot be represented at the national level. Thus, using the method to assess the FLQ on a regional or local level need to be further validated.
The national database in this assessment up to now is restricted for use and unavailable to the public, which potentially raises the uncertainty of data use for further research. Moreover, data update at regular intervals is important to detect changes of overall FLQ, which allows for timely policy adjustments. However, doing so would be very costly and time consuming.
In general, compared with the conventional evaluation methods, the methodology proposed in this study has the following advantages: (1) It could be applicable to assess FLQ on a national or sub-national level in term of forest inventory database, therefore expanding the application scale of landscape assessment methods. (2) It could visualize the assessment results in a straightforward way across time and regions, which resonates to the strategy of assessing and mapping ecosystem services advocated in many countries and regions. (3) The developed application based on ArcGIS Engine could be an effective tool for forest management due to its fine interface, simple operation, and ease of updating. Disadvantages of this method include: (1) The selection of the evaluation indicators is subject to available data source, which may result in excluding some influencing factors on FLQ. (2) The difficulty of database use and update in this study could place restrictions on future research.
Based on our findings, there are three important areas that need further development and research. First, more empirical studies are needed to verify the validity and applicability of this assessment approach, particularly at regional and local levels. Thus, we conducted a case study for assessing FLQ in a forest park by adopting a mixed method design including the method proposed in this paper, self-report approach and psychophysical approach. We will present the empirical results in a separate paper. Furthermore, findings from this study reveal the comparable results of FLQ across different regions, which could usefully inform policy and decision-making. However, implementing the research findings in forestry practice requires further investigation and greater resources. Additionally, due to the varying forest inventory systems in different countries and regions, the evaluation indicators and their weights in this method may need to be revised/adjusted in terms of data availability.
5. Conclusions
This paper presents for the first time a methodology for assessing FLQ at the national level. Based on literature analysis and China’s forest inventory database (FMPI), we built up an evaluation index system for FLQ using expert approach and AHP method, and developed a GIS-based application with graphics user interface to visualize the evaluation results. The following conclusions can be drawn from the present study.
Firstly, the FLQ varies substantially across China. Areas of high-quality forest landscape are located in high mountain ranges and tropical forest areas, whereas low FLQ scores are often found in low mountains, foothills, and plains.
Secondly, most forest areas in China are covered with mediocre- or low-quality landscape, and less than one sixth of total forest areas achieved high FLQ scores.
Thirdly, the differences of FLQ among four types of forestland are obvious. Most bamboo forests are characterized by high quality landscape, but over half of the shrub forests stand out with low FLQ scores. The percentage distribution of FLQ levels for mangrove forests is relatively dispersed.
Additionally, findings demonstrate a relatively low correlation between the total forest area and the area of high-quality forest landscape. Rankings of the L1 forest landscape areas are higher than those of the total forest area in most divisions of Southwest and Northwest China, but the opposite is true for northeast regions.
Overall, the method and the results can not only enrich the existing assessment system for FLQ, but also make a significant contribution to the planning, policy development, and decision-making for China’s forest administration. Moreover, the findings respond to the suggestions on mapping and assessing ecosystem services proposed by many countries and regions. Future research includes more empirical studies to verify the validity and applicability of our method at regional and local levels, and implement the research findings in China’s forestry practice. Furthermore, the transferability of the method to other countries should be tested. In conclusion, the scarcity of related research at the national level calls for more empirical studies on this field.
Author Contributions
Conceptualization, J.W. and Y.Z.; formal analysis, Y.Z.; funding acquisition, Y.Z.; methodology, Y.Z.; software, J.W.; writing—original draft, J.W. and Y.Z.; writing—review & editing, J.W. and J.D.
Funding
This research was funded by the Special Fund for Forest Scientific Research in the Public Welfare of China (Grant No. 201404314).
Acknowledgments
The authors gratefully acknowledge the support provided by the Special Fund for Forest Scientific Research in the Public Welfare of China (Grant No. 201404314). Thanks to Susanne Becken from the Griffith Institute for Tourism for her good comments on the paper, and Dali Li and Bin Chu for their assistance in data collection. We also thank the anonymous reviewers for their valuable suggestions.
Conflicts of Interest
The authors declare no conflict of interest.
References
- Chen, X.; Wang, Y. An analytic study on forest beauty—Mostly on form beauty of forest plants. Sci. Silvae Sin. 2001, 37, 122–130. [Google Scholar]
- Zhao, T.; Ouyang, Z.; Zheng, H.; Wang, X.; Miao, H. Forest ecosystem services and their valuation in China. J. Nat. Resour. 2004, 19, 480–491. [Google Scholar]
- Seppelt, R.; Dormann, C.F.; Eppink, F.V.; Lautenbach, S.; Schmidt, S. A quantitative review of ecosystem service studies: Approaches, shortcomings and the road ahead. J. Appl. Ecol. 2011, 48, 630–636. [Google Scholar] [CrossRef]
- Cheng, A.S.; Mattor, K.M. Place-based planning as a platform for social learning: Insights from a national forest landscape assessment process in Western Colorado. Soc. Nat. Resour. 2010, 23, 385–400. [Google Scholar] [CrossRef]
- Pierskalla, C.D.; Saunders, K.E.; McGill, D.W.; Smaldone, D.A. Forest landscape assessment: The effects of pre-experience education on public perception of scenic beauty. In Proceedings of the 2007 Northeastern Recreation Research Symposium, Bolton Landing, NY, USA, 15–17 April 2007. [Google Scholar]
- Xuesong, X.; Jianyu, K.; Wenhu, H.; Yun, S. The Trend of landscape planning as shown through publications in the Journal of Landscape and Urban Planning during the past twenty years. Acta Sci. Nat. Univ. Pekin. 2008, 44, 651–660. [Google Scholar]
- Wang, C.; Zhai, M.; Jin, Y.; Ma, R. Current research and prospects on forest landscape quality assessment. World For. Res. 2006, 19, 18–22. [Google Scholar]
- Vassiljev, P.; Palo, T.; Kull, A.; Kuelvik, M.; Bell, S.; Kull, A.; Mander, Ü. Forest landscape assessment for cross country skiing in declining snow conditions: The case of Haanja Upland, Estonia. Balt. For. 2010, 16, 280–295. [Google Scholar]
- Jingqun, Z.; Wanxing, W.; Tingchun, W. The evaluation on forest landscape resources of Taiping Forest Park in Shaanxi Province. J. Northwest For. Univ. 2006, 21, 168–171. [Google Scholar]
- Clay, G.R.; Daniel, T.C. Scenic landscape assessment: The effects of land management jurisdiction on public perception of scenic beauty. Landsc. Urban Plan. 2000, 49, 1–13. [Google Scholar] [CrossRef]
- Brouwers, N.; Matusick, G.; Ruthrof, K.; Lyons, T.; Hardy, G. Landscape-scale assessment of tree crown dieback following extreme drought and heat in a Mediterranean eucalypt forest ecosystem. Landsc. Ecol. 2013, 28, 69–80. [Google Scholar] [CrossRef]
- Mao, B.; Gong, L.; Xu, C. Evaluating the Scenic Beauty of Individual Trees: A Case Study Using a Nonlinear Model for a Pinus Tabulaeformis Scenic Forest in Beijing, China. Forests 2015, 6, 1933–1948. [Google Scholar] [CrossRef]
- Zhang, T.; Deng, S.; Ma, Q.; Sasaki, K. Evaluations of Landscape Locations along Trails Based on Walking Experiences and Distances Traveled in the Akasawa Forest Therapy Base, Central Japan. Forests 2015, 6, 2853–2878. [Google Scholar] [CrossRef] [Green Version]
- Paudyal, R.; Stein, T.; Ober, H.; Swisher, M.; Jokela, E.; Adams, D. Recreationists’ Perceptions of Scenic Beauty and Satisfaction at a Public Forest Managed for Endangered Wildlife. Forests 2018, 9, 241. [Google Scholar] [CrossRef]
- National Forestry and Grassland Administration. China Sees Forest Travel Boom in 2018. Available online: http://www.chinadaily.com.cn/a/201903/17/WS5c8d8ef8a3106c65c34eeffe.html (accessed on 17 March 2019).
- Xiaoping, G.; You, Y.; Yu, L.; Mingyu, C.; Gu, L.; Zhou, Y. Quality evaluation of forest landscape resources in qipanshan scenic area in shenyang city. J. Cent. South Univ. For. Technol. 2010, 30, 46–52. [Google Scholar]
- Jianmin, Z.; Qing, G.; Benfeng, Y. Evaluation on the forest landscape quality of Qingliang Mountain National Forest Park. J. Landsc. Res. 2011, 3, 62–65. [Google Scholar]
- Na, W.; Yongde, Z.; Sen, I. SBE based evaluation of in-forest landscape aesthetic quality of forest park in suburb. J. Northwest For. Univ. 2017, 32, 308–314. [Google Scholar]
- Xinxin, H.; Zongqing, H.; Huiguang, Z. Evaluation of forestry landscape in Fujian Mandangshan Nature Reserve. Probl. For. Econ. 2006, 26, 39–43. [Google Scholar]
- Guangyuan, H.; Chengyang, X.; Lan, G.; Bin, M.; Jiefang, Z. Landscape quality evaluation on scenic and recreational forest of pinus tabulaeformis in Beijing Xi Mountain. Adv. Mater. Res. 2012, 518, 5281–5284. [Google Scholar]
- Zhang, Z.; Qie, G.; Wang, C.; Jiang, S.; Li, X.; Li, M. Relationship between Forest Color Characteristics and Scenic Beauty: Case Study Analyzing Pictures of Mountainous Forests at Sloped Positions in Jiuzhai Valley, China. Forests 2017, 8, 63. [Google Scholar] [CrossRef]
- Huijuan, Y.; Xuanrui, H. A study of American forest scenery management system and its reference and application in China. World For. Res. 2015, 28, 85–89. [Google Scholar]
- Ye, Z. Ecological civilization, beautiful China and forest ecosystem development. World For. Res. 2014, 27, 1–6. [Google Scholar]
- Fischer, A.P. Forest landscapes as social-ecological systems and implications for management. Landsc. Urban Plan. 2018, 177, 138–147. [Google Scholar] [CrossRef]
- Maes, J.; Teller, A.; Erhard, M.; Murphy, P.; Paracchini, M.L.; Barredo, J.I.; Grizzetti, B.; Cardoso, A.; Somma, F.; Petersen, J.E. Mapping and Assessment of Ecosystems and their Services: Indicators for Ecosystem Assessments under Action 5 of the EU Biodiversity Strategy to 2020; Publications Office of the European Union: Luxembourg, 2014. [Google Scholar]
- Ciecko, L.; Kimmett, D.; Saunders, J.; Katz, R.; Wolf, K.L.; Bazinet, O.; Richardson, J.; Brinkley, W.; Blahna, D. Forest Landscape Assessment Tool (FLAT): Rapid Assessment for Land Management; US Department of Agriculture, Forest Service, Pacific Northwest Research Station: Portland, OR, USA, 2016.
- Lei, X.; Tang, M.; Lu, Y.; Hong, L.; Tian, D. Forest inventory in China: Status and challenges. Int. For. Rev. 2009, 11, 52–63. [Google Scholar] [CrossRef]
- Dengping, X.; Hui, L.; Lijie, P.; Yuxing, Z.; Guosheng, H.; Aihui, H. Research of key technology for National Forest-land “One Map” Database. For. Resour. Manag. 2015, 5, 36–43. [Google Scholar]
- De Vries, S.; Lankhorst, J.R.-K.; Buijs, A.E. Mapping the attractiveness of the Dutch countryside: A GIS-based landscape appreciation model. For. Snow Landsc. Res. 2007, 81, 43–58. [Google Scholar]
- Hermes, J.; Albert, C.; von Haaren, C. Assessing the aesthetic quality of landscapes in Germany. Ecosyst. Serv. 2018, 31, 296–307. [Google Scholar] [CrossRef]
- Norton, L.; Inwood, H.; Crowe, A.; Baker, A. Trialling a method to quantify the ‘cultural services’ of the English landscape using Countryside Survey data. Land Use Policy 2012, 29, 449–455. [Google Scholar] [CrossRef]
- Paracchini, M.L.; Zulian, G.; Kopperoinen, L.; Maes, J.; Schägner, J.P.; Termansen, M.; Zandersen, M.; Perez-Soba, M.; Scholefield, P.A.; Bidoglio, G. Mapping cultural ecosystem services: A framework to assess the potential for outdoor recreation across the EU. Ecol. Indic. 2014, 45, 371–385. [Google Scholar] [CrossRef] [Green Version]
- Litton, R.B. Forest Landscape Description and Inventories—A Basis for Land Planning and Design; U. S. D. A. Forest Service Research Paper PSW-49; Pacific Southwest Research Station, Forest Service, U.S. Department of Agriculture: Albany, CA, USA, 1968.
- Tveit, M.; Ode, Å.; Fry, G. Key concepts in a framework for analysing visual landscape character. Landsc. Res. 2006, 31, 229–255. [Google Scholar] [CrossRef]
- Ode, Å.; Tveit, M.S.; Fry, G. Capturing landscape visual character using indicators: Touching base with landscape aesthetic theory. Landsc. Res. 2008, 33, 89–117. [Google Scholar] [CrossRef]
- Daniel, T.C. Whither scenic beauty? Visual landscape quality assessment in the 21st century. Landsc. Urban Plan. 2001, 54, 267–281. [Google Scholar] [CrossRef]
- Kim, K.-H.; Pauleit, S. Landscape character, biodiversity and land use planning: The case of Kwangju City Region, South Korea. Land Use Policy 2007, 24, 264–274. [Google Scholar] [CrossRef]
- Frank, S.; Fürst, C.; Koschke, L.; Witt, A.; Makeschin, F. Assessment of landscape aesthetics—Validation of a landscape metrics-based assessment by visual estimation of the scenic beauty. Ecol. Indic. 2013, 32, 222–231. [Google Scholar] [CrossRef]
- USDA; Forest Service. Landscape Aesthetics: A Handbook for Scenery Management; Forest Service, USDA: Washington, DC, USA, 1995.
- Bingqing, M.; Chengyang, X.; Jiang, L.; Cheng, C.; Kai, Z.; Xiangqi, K.; Jiayi, L. The influence of forest visual landscape heterogeneity on aesthetic quality. J. Zhejiang A F Univ. 2019, 36, 366–374. [Google Scholar]
- Kangas, J. Multiple-use planning of forest resources by using the analytic hierarchy process. Scand. J. For. Res. 1992, 7, 259–268. [Google Scholar] [CrossRef]
- Gong, L.; Zhang, Z.; Xu, C. Developing a Quality Assessment Index System for Scenic Forest Management: A Case Study from Xishan Mountain, Suburban Beijing. Forests 2015, 6, 225–243. [Google Scholar] [CrossRef] [Green Version]
- Ning, H.; Shao, F.; Sun, X.; Shan, J. AHP-based evaluation on plant landscape of Huagangguanyu Park in Hangzhou. Acta Agric. Zhejiangensis 2011, 23, 717–724. [Google Scholar]
- Minmin, F. The Esthetic Evaluation of Urban Plants Landscape based on the Model of AHP-fuzzy Comprehensive Evaluation. J. Hangzhou Teach. Coll. 2007, 5, 373–378. [Google Scholar]
- Xinzhou, X.; Jianhui, X. Aesthetic Evaluation for Plant Landscape of Wetland Park Based on AHP. J. Northwest For. Univ. 2012, 2, 213–216. [Google Scholar]
- Asgarzadeh, M.; Vahdati, K.; Lotfi, M.; Arab, M.; Babaei, A.; Naderi, F.; Soufi, M.P.; Rouhani, G. Plant selection method for urban landscapes of semi-arid cities (a case study of Tehran). Urban For. Urban Green. 2014, 13, 450–458. [Google Scholar] [CrossRef]
- Silvennoinen, H.; Alho, J.; Kolehmainen, O.; Pukkala, T. Prediction models of landscape preferences at the forest stand level. Landsc. Urban Plan. 2001, 56, 11–20. [Google Scholar] [CrossRef]
- Chingfu, C. Applying the analytical hierarchy process (AHP) approach to convention site selection. J. Travel Res. 2006, 45, 167–174. [Google Scholar]
- Xiaohui, X.; Nanping, X. The discussion of developing system principle and methods based on ArcGIS Engine. Urban Geotech. Investig. Surv. 2006, 21, 46–48. [Google Scholar]
- Bosun, W.; Shaolin, P.; Luo, G.; Youhua, Y. Diversity of tropical forest landscape types in Hainan Island, China. Acta Ecol. Sin. 2007, 27, 1690–1695. [Google Scholar] [CrossRef]
- Yonghong, L.; Yanfeng, Z.; Wei, Z.; Liangming, C. Research on aesthetics value of bamboo landscape. J. Cent. South Univ. For. Technol. 2011, 31, 187–190. [Google Scholar]
- Kangas, J.; Store, R.; Leskinen, P.; MehtaÈtalo, L. Improving the quality of landscape ecological forest planning by utilising advanced decision-support tools. For. Ecol. Manag. 2000, 132, 157–171. [Google Scholar] [CrossRef]
Figure 1.
Research design of this paper.

Figure 2.
The interface of the Forest Management Planning Inventory (FMPI) digital data system (Dotted lines refer to the boundary of forest sub-compartments).
Figure 2.
The interface of the Forest Management Planning Inventory (FMPI) digital data system (Dotted lines refer to the boundary of forest sub-compartments).

Figure 3.
Percentage distribution of level for FLQ in China.

Figure 4.
Percentage distribution of FLQ levels for arbor, bamboo, shrub and mangrove forest.

Figure 5.
Distribution of L1 forest landscape in seven regions by area.

Figure 6.
Rankings of the total forest area and area of L1 forest landscape in all divisions (northeast, southwest and northwest regions highlighted in dotted boxes).
Figure 6.
Rankings of the total forest area and area of L1 forest landscape in all divisions (northeast, southwest and northwest regions highlighted in dotted boxes).

Figure 7.
The distribution percentage of FLQ scores of all counties.

Figure 8.
Forest landscape quality map of Mainland China.


Table 1.
Selection of indicators for forest landscape quality (FLQ) assessment, according to the Scenery Management System (SMS).
Table 1.
Selection of indicators for forest landscape quality (FLQ) assessment, according to the Scenery Management System (SMS).
| Attributes | Indicators | Selected Indicators | Reasons |
|---|---|---|---|
| Land use and cover (3) | Land use type, land degradation type, forest function type | None | Irrelevant to FLQ |
| Site and soil (14) | Location, site type, site quality, number, area, landform, slope, slope position, slope aspect, elevation, soil type, soil depth, humus depth, litter depth | Landform, slope, slope aspect | The three indicators are relevant with landform pattern |
| Stand characteristics (14) | Origin, dominant tree species (group), canopy cover, average age, average DBH ✴, average height, number of trees per hectare, disaster type, disaster grade, ecological function grade, stem density, community structure, health condition, naturality | Origin, dominant tree species (group), canopy cover, average age, average DBH, average height, number of trees per hectare, community structure, naturality | The nine indicators are relevant with vegetative patterns |
| Management and planning (5) | Land tenure, forest program type, forest protection grade, forest function zone, main function area | None | Irrelevant to FLQ |
✴ DBH: Diameter at breast height.
Table 2.
Indicators and weights of FLQ.
| Index | Determinants | Indicators | Weights | |||
|---|---|---|---|---|---|---|
| Arbor | Bamboo | Shrub | Mangrove | |||
| Forest landscape quality | Landform pattern | Landform | 0.10 | 0.10 | 0.12 | / |
| Slope | 0.08 | 0.08 | 0.09 | / | ||
| Slope aspect | 0.05 | 0.05 | 0.05 | / | ||
| Vegetative pattern | Origin | 0.08 | 0.08 | 0.10 | 0.10 | |
| Dominant tree species (group) | 0.07 | 0.07 | 0.10 | 0.10 | ||
| Canopy cover/crown density | 0.10 | 0.10 | 0.14 | 0.18 | ||
| Average age/bamboo stocking | 0.08 | 0.12 | 0.14 | 0.12 | ||
| Average DBH | 0.10 | 0.10 | / | 0.12 | ||
| Average height | 0.12 | 0.12 | 0.14 | 0.14 | ||
| Number of trees/stems per hectare | 0.08 | 0.08 | / | 0.12 | ||
| Community structure | 0.04 | / | / | / | ||
| Naturality | 0.10 | 0.10 | 0.12 | 0.12 | ||
Table 3.
Grading division of FLQ for forest sub-compartments.
| Level | Level 1 (L1) | Level 2 (L2) | Level 3 (L3) | Level 4 (L4) |
|---|---|---|---|---|
| Landscape quality | High | Relatively high | Mediocre | Low |
| Score | 8–10 | 6–7.9 | 4–5.9 | <4 |
© 2019 by the authors. Licensee MDPI, Basel, Switzerland. This article is an open access article distributed under the terms and conditions of the Creative Commons Attribution (CC BY) license (http://creativecommons.org/licenses/by/4.0/).
Share and Cite
MDPI and ACS Style
Wu, J.; Zhong, Y.; Deng, J. Assessing and Mapping Forest Landscape Quality in China. Forests 2019, 10, 684. https://0-doi-org.brum.beds.ac.uk/10.3390/f10080684
AMA Style
Wu J, Zhong Y, Deng J. Assessing and Mapping Forest Landscape Quality in China. Forests. 2019; 10(8):684. https://0-doi-org.brum.beds.ac.uk/10.3390/f10080684
Chicago/Turabian StyleWu, Jiangzhou, Yongde Zhong, and Jinyang Deng. 2019. "Assessing and Mapping Forest Landscape Quality in China" Forests 10, no. 8: 684. https://0-doi-org.brum.beds.ac.uk/10.3390/f10080684
Note that from the first issue of 2016, this journal uses article numbers instead of page numbers. See further details here.