Effect of Impregnation with Maltodextrin and 1,3-Dimethylol-4,5-Dihydroxyethyleneurea on Poplar Wood
by
Mingzhen Cai
1, 
Zongying Fu
2,
Yingchun Cai
1,*,
Zhengdong Li
1,
Can Xu
1,
Cong Xu
1 and
Shuai Li
1 1
Ministry of Education, Key Laboratory of Bio-Based Material Science and Technology, College of Material Science and Engineering, Northeast Forestry University, Harbin 150040, China
2
Research Institute of Wood Industry, Chinese Academy of Forestry, Key Laboratory of Wood Science and Technology of State Forestry Administration, Beijing 100091, China
*
Author to whom correspondence should be addressed.
Forests 2018, 9(11), 676; https://0-doi-org.brum.beds.ac.uk/10.3390/f9110676
Submission received: 3 September 2018
/
Revised: 23 October 2018
/
Accepted: 26 October 2018
/
Published: 28 October 2018
(This article belongs to the Section Forest Ecophysiology and Biology)
Abstract
:Modification of poplar (Populus adenopoda Maxim) wood by using maltodextrin (MA) combined with 1,3-dimethylol-4,5-dihydroxyethyleneurea (DM) resin was investigated in this study. The weight percent gain, dimensional stability, mechanical strength, and microscopic chemical change were determined before and after impregnation. Results indicated that the composite modifier was impregnated into the wood cell lumen, as verified by scanning electron microscopy and a change in weight percent gain. Anti-swelling efficiency was significantly improved compared with the untreated sample; however, the sample treated with MA obtained an anti-swelling efficiency that was slightly lower than that of the sample treated with sucrose. The flexural strength, flexural modulus, and compressive strength perpendicular to the grain increased with an increase in MA concentration, but the compressive modulus and impact strength were reduced. Fourier-transform infrared spectroscopy demonstrated that MA delayed the cross-linking of the DM resin cell wall, and X-ray diffraction analysis showed that the crystallinity of the cellulose crystalline region was reduced to a certain extent. In general, the poplar wood treated with combined MA and DM resin exhibited enhanced properties relative to those of the poplar wood treated with sucrose.
1. Introduction
Wood from planted forests has become an important industrial raw material for the global timber industry [1]. Wood presents several advantages, including light weight, good elasticity, impact resistance, rich and beautiful texture, and ease of processing. However, wood also presents disadvantages, including low density, softness, low dimensional stability, and ease of deformation and cracking. Wood is mainly used to prepare low value-added materials, such as low-end plywood and laminated materials [2]. The solid wood of low-quality, artificial, fast-growing forests has to be modified to enhance the quality and high value-added utilization of plantation wood, and thus, to meet the requirements set for high-quality wood in the timber industry. Chemical modification of wood involves chemical and physical techniques to alter the properties of wood cell walls, and thus, provide a sustained protection to in-service wood [3].
1,3-Dimethylol-4,5-dihydroxyethyleneurea (DM) is widely used in the textile industry as a finishing agent. Fabrics after DM finishing exhibit improved mechanical properties [4]. With reference to the method used to modify textile with nitrogen methylol resin, the wood modified with DM can significantly improve the dimensional stability, durability [5], coating properties [6], and weathering resistance [7,8]. The relative molecular mass of DM resin is only 178, and its molecular size is sufficiently small for impregnation of the wood cell wall and cross-linking with the polymer in the cell wall [9]. Wood modification with DM resin demands vacuum pressure impregnation in which a catalyst, such as magnesium chloride (MgCl2), is generally added to catalyze the reaction. After immersion, the treated materials are cured at 100 °C or higher so that the chemicals can be fixed in the wood as much as possible to achieve the desired modification effect [10]. Resistance to fungal deterioration is improved using the resin treatment [11]. Simonsen investigated the hydrolytic stability of wood treated with DM and wood impregnated with polyethyleneglycol (MW = 400), or glycerol crosslinked with DM, and found that the cross-linked polyglycols showed increased swelling in some cases, resulting in decreased dimensional stability [12].
The performance of modified wood is significantly improved relative to that of untreated materials; however, the process releases free formaldehyde, free phenol, acetic acid, and other volatiles, leading to environmental problems [13]. To address this problem, a green modification technology was developed with polyhydroxy compounds as the main modifying agent. Sugar itself is a component of glycans (celluloses and hemicelluloses) in wood, which are natural and widely available [14,15]. However, low-molecular-weight sugars are polyhydroxy compounds; they lack reactive functional groups that react with hydroxyl groups in the wood cell wall and are difficult to fix in wood. In the process of using these products, problems occur, such as the precipitation of chemicals that pollute the environment and reduce the effect of modification; therefore, the need for a suitable crosslinking agent (DM) is obvious. Using cross-linkers to build chemical bonds between sugar and the molecules of the wood cell wall can effectively achieve sugar fixation. The fixation process mainly involves the formation of an ether bond by reacting two active nitrogen methylol groups on the DM molecule with the hydroxyl groups of the wood cell wall [16]. In addition, DM molecules tend to undergo condensation to form macromolecules, coating the sugar molecules and inhibiting sugar loss. The authors of [17] used DM and citric acid as cross-linking agents; meanwhile, glucose as a modified main agent could effectively fix sugar in poplar wood and improve the dimensional stability of the wood, that is, a 43% reduction in volumetric swelling after water saturation. Li [18] found that the elastic modulus and nail-holding power of modified wood were significantly improved relative to those of unmodified materials after poplar and radiata pine were treated with a DM-sucrose (SU) composite modifier. Xiao [19] found that the adhesion of the modified wood film was significantly higher than that of the unmodified wood, indicating that the modification treatment helped increase the durability of the paint film on the wood surface. Zhang [20] impregnated poplar wood with urea-formaldehyde resin modified using maltodextrin (MA). The process not only retained the original natural properties of the wood, but also exhibited excellent properties. Zhang [21] also conducted a study on the reaction of formaldehyde cross-linked MA, and evaluated the effects of reaction conditions, such as the cross-linking temperature, as well as the time and amount of formaldehyde of the cross-linking reaction. MA has various applications in food, pharmaceuticals, and papermaking because of its mild sweetness, low viscosity, slight odor, and low browning reaction [22,23] (Figure 1).
Similar to SU, MA provides a large number of hydroxyl groups for reaction. In addition, MA not only has a wide range of sources, but also involves simple extraction and low cost. However, no studies on related applications of wood modified with MA/DM have been reported. Therefore, the current study used wood modified with MA and DM to evaluate their effects on the dimensional stability, bending resistance, compressive resistance, impact strength, and chemical properties of wood.
2. Experiment
2.1. Materials
Poplar (Populus adenopoda Maxim) wood measuring 2000 mm (Longitudinal) × 150 mm (Tangential) × 25 mm (Radial) (L × T × R) was purchased from a local timber trading market (Harbin, China). The wood samples measurements (L × T × R) were as follows: 20 mm × 20 mm × 20 mm, 30 mm × 20 mm × 20 mm, and 300 mm × 20 mm × 20 mm. The initial moisture content was about 9.1%. SU and MgCl2 of extra pure grade were purchased from Guangfu Technology Development Co., Ltd. (Tianjing, China). MA was supplied by Jinyu Chemical Co., Ltd. (Shouguang, China). The crosslinkers consisted of 60% solid mass fraction of DM, which was provided by Lanxiang Resin Co., Ltd. (Zhongshan, China).
2.2. Impregnation Treatment
Prior to treatment, the wood samples were oven-dried at 103 °C for 24 h, and the weight was determined after drying. The wood samples were then fully impregnated under vacuum (0.01 MPa, 12 h) and pressure (0.6 MPa, 48 h). The impregnation components were as follows: 10% DM, 10% DM + 5% MA, 10% DM + 10% MA, 10% DM + 15% MA, 10% DM + 20% MA, and 10% DM + 10% SU with 1.5% MgCl2 (Figure 2). Meanwhile, the untreated samples and all experiments consisted of seven groups; each group had 20 replicates. After impregnation, the samples were air-dried at room temperature for 24 h, and then precured at 40 °C for 24 h, followed by curing at 103 °C for 48 h.
2.3. Determination of Weight Percent Gain and Weight Leaching Ratio
The weights of the samples subjected to impregnation and curing, Ww and Wt, respectively, were determined. The samples were placed in seven containers and then pressed with barbed wire. All samples were leached with deionized water, which was changed daily, for 10 days to remove the unreacted chemicals. The wood samples were oven-dried, and the weights were determined after leaching. Samples measuring 20 mm × 20 mm × 20 mm (L × T × R) and 20 replicates were used for each treatment. Weight percent gain (WPG), wet weight percent gain (wWPG), and weight leaching ratio (WLR) were calculated using Equations (1)–(3).
where Wt is the oven-dry mass after modification, Ww is the mass after impregnated, Wc is the oven-dry mass before modification, and W1 is the oven-dry mass after leaching process.
2.4. Determination of Density and Dimensional Stability
The oven-dry density, air-dry density, and basic density of the samples were determined using the following methods: (1) The mass and size of the samples were determined after they were cured at 103 °C for 48 h; (2) The oven-dried samples were placed in a humidity chamber (DHS-225, Beijing, China) and then conditioned (20 °C, 65% relative humidity, RH) for about 20 days until their mass and volume remained constant; (3) The oven-dried samples were immersed in deionized water until their volumes stabilized. The samples’ mass and size of the latter two steps were also determined, as for the first one. Dimensional stability was measured using the same method as that used for density testing. Samples measuring 20 mm × 20 mm × 20 mm (L × T × R) and 20 replicates were used for each treatment. Water uptake (A), swelling rate (B), volume anti-swelling efficiency (ASE), and increase rate (p) were calculated using Equations (4)–(7), respectively.
where W is the mass after the sample was immersed in water, and W0 is the oven-dry mass of the sample.
where VW is the air-dry volume after processing in the humidity chamber, and V0 is the oven-dry volume before balanced treatment.
where ASE is the anti-swelling efficiency, SC is the volume swelling of the untreated wood, and ST is the volume swelling of the treated wood.
where C1 is the value of treated wood, and C0 is the value of untreated wood.
2.5. Mechanical Tests
Bending resistance was measured in accordance with the GB/T 1936.1–2009 and GB/T 1936.2–2009 standards. The sample dimensions were 300 mm × 20 mm × 20 mm (L × T × R). Compressive strength was determined in accordance with the GB/T 1939–2009 and GB/T 1943–2009 standards. The sample dimensions were 30 mm × 20 mm × 20 mm (L × T × R). The loading speeds were 2 and 0.5 mm/min. Both were tested using an electromechanical universal testing machine (CMT5504, MTS Systems Co., Ltd., Shanghai, China). Impact strength was measured in accordance with the GB/T 1940–2009 standard. The type of the sample was 300 mm × 20 mm × 20 mm (L × T × R), and the pendulum energy was 4 J (XJC-15W, Chengde, China). All samples were conditioned to constant weight at a relative humidity of 65% ± 5% and temperature of 20 °C ± 2 °C, which was equal to a 12% equilibrium moisture content before the experiment. A total of 20 replicates were then used for each treatment.
2.6. Morphological Analyses
The distribution of chemicals in wood was observed by scanning electron microscopy (SEM, FEI Company, QuanTa200, Eindhoven, The Netherlands) at an accelerating voltage of 12.5 kV. The cross-section and tangential section of the surfaces of the test samples were sliced with a SEM slicing knife. The fractured samples were then sputter-coated with a layer of gold for SEM analysis. Untreated samples and samples treated with 10% DM, 10% DM + 10% MA, and 10% DM + 10% SU were prepared.
2.7. Fourier-Transform Infrared Spectroscopy
The Fourier-transform infrared (FTIR) spectra of wood powder (100–120 mesh) were recorded in KBr pellets at a resolution of 4 cm−1, with 40 scans and a scanning range of 400–4000 cm−1 (Magna-IR 560 apparatus, Thermo Nicolet, Beijing, China). Untreated samples and samples treated with 10% DM, 10% DM + 10% MA, and 10% DM + 10% SU were prepared.
2.8. X-ray Diffraction Analysis (XRD)
Wood powder (40 mesh) was tested by XRD with a scanning speed of 5°/min, scanning step of 0.02°, and scanning range of 5–45° (D/max 2200, Rigaku Co., Ltd., Sendagaya, Japan). Untreated samples; samples treated with 10% DM and 0%, 5%, 10%, 15%, and 20% MA, and 10% SU were prepared.
2.9. Statistical Analysis
Differences among data were determined using one-way ANOVA followed by origin 8.5 software. Differences between the data were considered significant at p < 0.05.
3. Results and Discussion
3.1. Effect of Modifier Concentration on Weight Percent Gain (WPG) and Weight Leaching Ratio (WLR)
The WPG and WLR of the treated samples are presented in Figure 3. In Figure 3c,d, WPG and WLR increase with an increase in MA concentration. wWPG was positively correlated with dry WPG, which gradually increased from 196.9% to 247.6%, indicating that wWPG could potentially predict the agent fixation rate, the standard deviation (STDVA) of wWPG fluctuated within the range of 3.88–5.45% (Table 1), indicating that the impregnation solution had a relatively uniform impregnation effect with 20 replicates, Differences among data were determined using one-way ANOVA, and the effects of different modifiers on wWPG were significant (p < 0.001) compared with different groups.
The WPG of the sample increased from 16.50% to 52.81% (Figure 3a). The WPG of the sample treated with 10% MA was 34.34%, which is close to that of the SU-treated sample (38.26%). The WLR of the sample soaked in deionized water reached 43.78–54.20%, indicating that the agent was still compatible with the aqueous solution after curing, although the agent might not be completely cured (Figure 3b). After impregnated materials were completely dried, the STDVA of WPG fluctuation was more obvious and reached 4.62% when treated with 10% SU, which was larger than other groups, indicating that high temperature would cause chemical volatilization at different levels. From Table 2, the effects of different modifiers on WPG were significant (p < 0.001) compared with different treatments.
The WLR of the 10% MA-treated sample was 46.50%, whereas that of the sample treated with 10% SU was 69.94%, which is 23.44% higher than the former (Figure 3b). The WLR of 20 samples in each group was relatively uniform, and the STDEV fluctuation ranged from 1.99% to 3.66%, according to ANOVA, the WLR were significant (p < 0.001). In addition, the corresponding dry WPGs of the impregnated materials after washing with deionized water were 20.05% and 11.15%, respectively (Figure 3b), and there was a slight difference in the group after washing. The STDEV reached 3.43% at 20% MA treatment, which was slightly larger than that of the other groups. The WPGs were significant (p < 0.001) among different treatments (p < 0.01). These findings showed that under the same conditions, MA could fix DM more effectively compared with SU. This difference could be attributed to the chemical cross-linking of MA with the reactive N-methylol with condensed DM polymers.
3.2. Changes in Dimensional Stability after Treatment
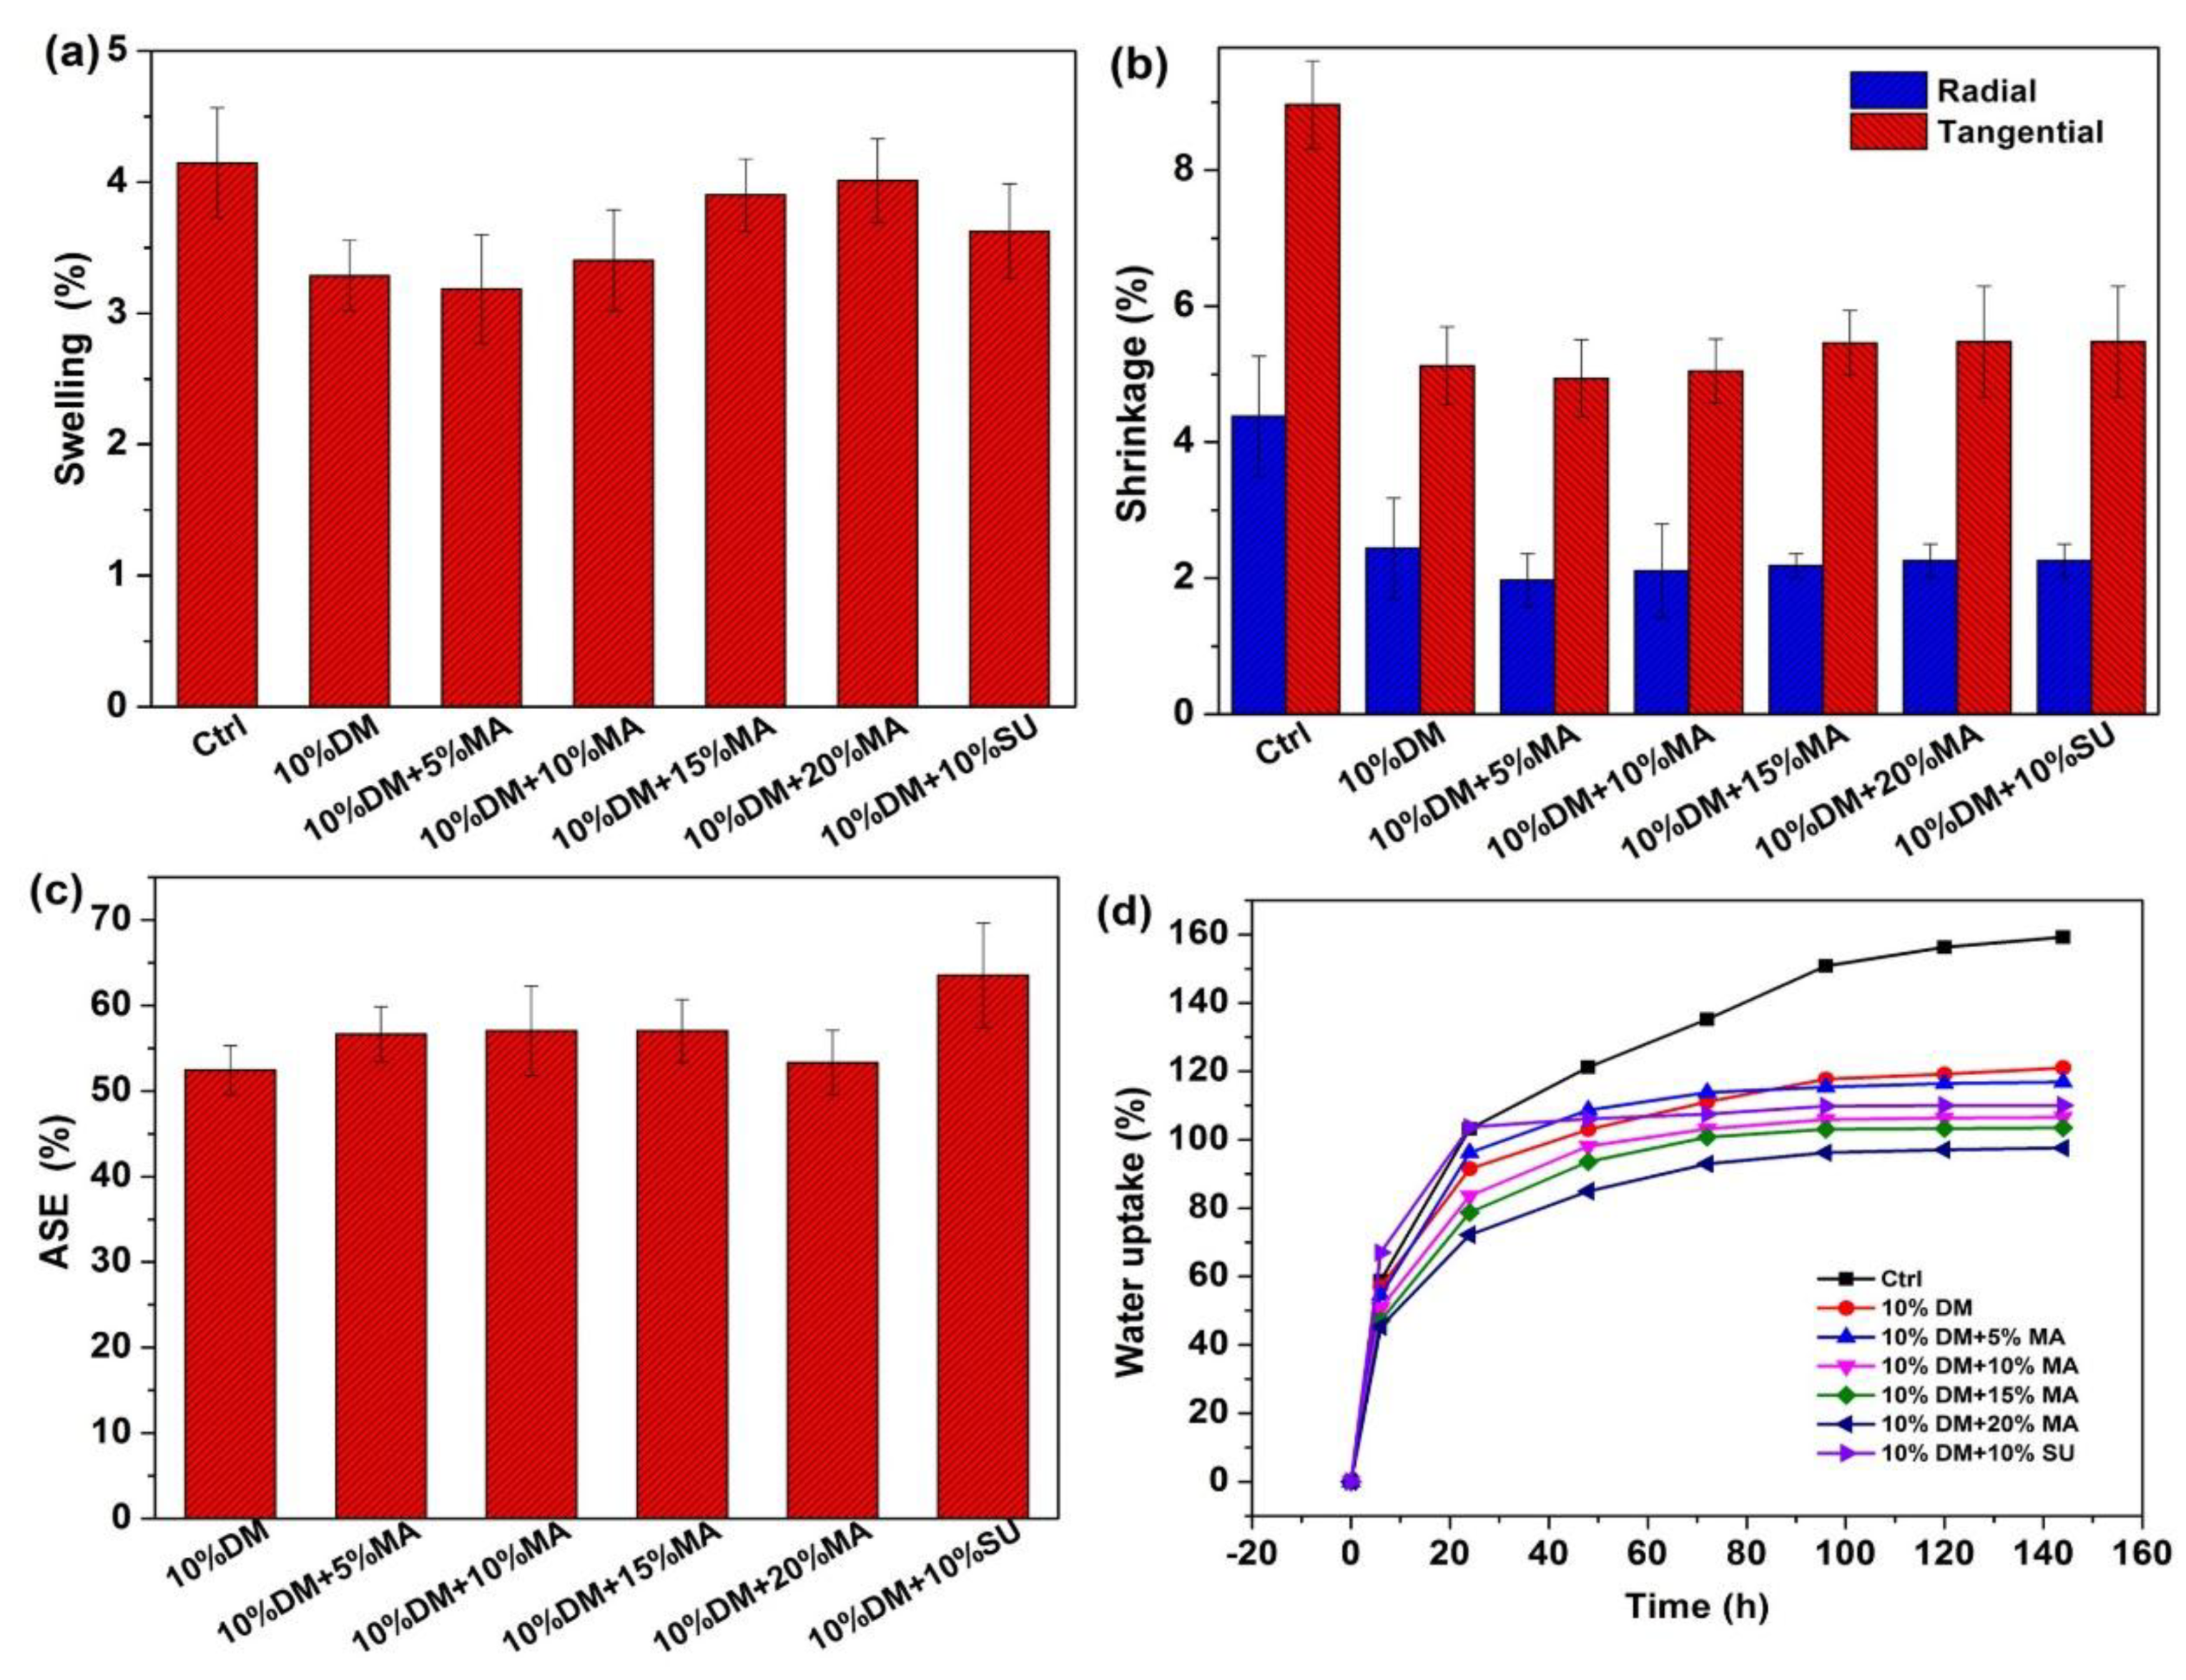
The results are presented in Figure 4. The shrinkage and swelling of the wood treated with chemicals were remedied effectively (Figure 4a,b). The swelling rate first decreased when treated with 10% DM, and then increased (Figure 4a) with an increase in MA concentration, obtaining a minimum of 3.19% at 5% MA concentration. This swelling rate is about 1.00% lower than that of the untreated samples. In the subsequent treatment, the swelling of the wood increased, indicating that the high-concentration inflation agent reduced the swelling. The swelling rate of the wood treated with 10% MA was 3.40%, and that of the wood treated with 10% SU was 3.63%, suggesting that the effect was similar. The reduction in swelling of the chemically-treated wood could be mainly attributed to cross-linking of particle cell wall polymers [24]. Treatments with MA and DM might exhibit cell wall bulking and cross-linking because of increased WPG. After the wood was treated with DM and MA, the control was twice as much as the shrinkage of the treated materials, indicating that chemical treatment could effectively remedy wood shrinkage (Figure 4b). However, no significant fluctuation in shrinkage was observed, even with an increase in concentration. Although the lowest value was obtained using the treatment with 5% MA, the tangential shrinkage and radial shrinkage were 4.94% and 1.97%, respectively. Similar effects were obtained with 10% MA and 10% SU treatments, the error bars of the swelling and the shrinkage were relatively uniform (Figure 4a,b), the STDEV of the swelling fluctuated between 0.27% and 0.42%. The shrinkage was 0.18–0.88% (Table 2), indicating that the difference between the 20 replicates in each set of experiments was moderate, and the data met the statistical requirements, based on ANOVA. The results of swelling and radial shrinkage were significant (p < 0.001) compared with different groups. Meanwhile, the results of tangential shrinkage were significant (p < 0.001), and p < 0.05 when compared with different concentrations of MA.
The ASE volume was positively affected by the MA concentration (Figure 4c). The ASE of the wood treated with a cross-linking agent at a certain concentration initially increased and then decreased with an increase in MA. The ASE of the wood treated with 10% MA reached the maximum (57.05%). Similarly, the wood samples treated separately with MA and SU at the same concentration obtained ASE of 57.05% and 63.55%, respectively. The slight difference indicated that SU resulted in a slightly higher dimensional stability of the modified wood, compared with MA, The error bars distribution of ASE was also relatively uniform (Figure 4c). The STDEV ranged from 2.88–6.12%, and the STDEV of 10% MA (5.26%) and 10% SU (6.12%) treated samples were slightly larger than those of the other groups. From Table 2, the total results of ASE were significant (p < 0.001), but the change was non-significant compared with 10% MA and 15% MA treatment (p > 0.05). The 20 replicate samples ASE value met the statistical requirements. The modification treatment markedly reduced the water uptake of the wood (Figure 4d). As the MA concentration increased to 20%, the water uptake of the wood decreased by 61.62%. The high WPG attributed to the treatment with MA could increase the bulking effects because of the deposition of DM and MA in the cell walls. Such deposition reduced the space within the cell walls, which could be occupied by water. In addition, the water absorption ability was similar for both wood samples treated with MA and SU at the same concentration, 106.6% and 110.1%, respectively. Cross-linking and inflation impeded the movement of microfibrils, and bulking led to pre-swelling of cell walls [24]. Swelling of composites arising from water uptake was thus reduced.
Before impregnation, the dry density, air-dry density, and basic density of the wood were 0.40, 0.42, and 0.35 g/cm3, respectively. Table 3 shows that with an increase in MA concentration, the increase rate of the corresponding density gradually increases. For the wood treated with 20% MA, the increase rates reached 42.00%, 41.26%, and 49.10%; the corresponding densities reached 0.60, 0.57, and 0.52. This trend was close to the growth trend of WPG, indicating the impregnation of MA and DM into wood and inflation within the cell wall. When the same MA and SU concentrations were used to treat wood, the desired increase rate of the corresponding density was nearly achieved.
3.3. Determination of Mechanical Strength
The results are presented in Figure 5a. After the wood was treated with 10% DM, the flexural modulus increased from 5.91 GPa to 8.39 GPa; with an increase in MA concentration, flexural modulus reached the maximum of 10.74 GPa. When treated with 20% MA, the increase rate reached 81.68% (regard to Equation (7)). The reason could be as follows: (i) Cross-linking of DM in the cell wall led to the free slippage of the cell wall microfibrils under the external load to be inhibited [25]; (ii) The modified reagent penetrated and was diffused into the micropores between the microfibrils of the cell wall, hindering the relative movement of the microfibrils [25]; and (iii) Owing to the inflation of the cell wall micropores, the moisture in the wood cell wall was less than that in the material under the same temperature and relative humidity, thereby weakening the plasticizing effect on the microfibrils under external load [26]. The error bars distribution of the 20 replicates were relatively uniform (Figure 5a), but the STDEV reached the maximum value (0.99 GPa) at 5% MA treatment, and the whole fluctuation range was 0.44–0.99 GPa, according to ANOVA, the total results of flexural modulus were significant (p < 0.001), and p < 0.05 when compared with 20% MA and 15% MA (Table 4).
After the modification treatment, the flexural strength increased slightly from 69.75 MPa to 99.14 MPa (Figure 5b). The increase rate reached 42.13%, and the maximum was obtained with 20% MA treatment. This result differed from the reduction in flexural strength reported in a previous study [25]. The modified chemicals were partly presented in the poplar cell walls, and the excess solidified in the cell cavity, forming a rigid reinforcement and enhancing the flexural strength of the wood. In addition, the differences in moisture content in the treated samples influenced the bending strength of the samples [27]. The reduced moisture content in the treated samples could improve the flexural strength of the samples because the moisture could act as a plasticizer, similar to flexural modulus, the maximum STDEV also appeared in 5% MA treatment (10.99 MPa). The overall fluctuation range was 3.82–10.99 MPa (Table 4), and the results of flexural strength were significant (p < 0.001) compared with different groups.
The change in compressive modulus was exactly opposite the change in flexural modulus. The compressive modulus perpendicular to the grain of the test sample after DM immersion initially decreased and then increased, and it was lower than control for all immersed samples. The untreated material obtained compression of 0.25 GPa, which was 16.32% lower than that of the material treated with 10% DM, which was 0.21 GPa (Figure 5c). The reason was that DM caused cross-linking in the cell walls, and thus, induced wood brittleness. The catalyst MgCl2 in the impregnation solution could also lead to the catalytic degradation of the hemicellulose. When the perpendicular-to-grain direction of the wood was subjected to loading force, the cellulose and hemicellulose, which could support the wood, were degraded; thus, the perpendicular direction was easily deformed, reducing the compressive modulus of the wood. With the addition of 5% MA, the compressive modulus of the poplar-impregnated wood slightly increased to 0.22 GPa. This increase was attributed to the reaction of polyhydroxy MA with DM, which reduced the cross-linking of DM to the wood cell wall. A further increase in MA concentration led to a reduction in the increase in compressive modulus, indicating that the increase in concentration of MA reached the saturation level with 10% DM. Since the change in compression modulus was moderate, the STDEV was kept around 0.02 GPa. The results of compressive modulus were significant (p < 0.001), and p < 0.05 when compared with 5% MA and 10% MA, but for 10% SU and 20% MA, the result was non-significant (p > 0.05).
Figure 5d shows that the initial compressive strength of the untreated wood is 4.03 Mpa. With an increase in MA concentration, the compressive strength gradually increased, reaching a maximum at 6.51 MPa with an MA concentration of 20%. The rate of increase reached 61.54%. However, with further increase in MA concentration, the growth gradually flattened out. Owing to the large amount of wood pipe filling, the chemicals initially entered the wood through the wood conduit and flowed through the wood during impregnation. After the curing process, the modifiers deposited themselves into the internal pores of the samples. The compressive strength of the wood increased, thus achieving the purpose of modification. The increase in mechanical strength and hardness resulting from the fast growth of poplar wood after modification was significant [28]. From these findings, an inference could be drawn: the wood chemical modifier penetrated into the wood cell wall. In addition, the chemical modifier influenced the cell wall of the wood to achieve the desired modification effect. The error bars slightly increased compared with the compressive modulus, but the overall distribution was uniform, and the fluctuation range was 0.40 and 0.66 MPa. The results of compressive strength were significant (p < 0.001) among different groups.
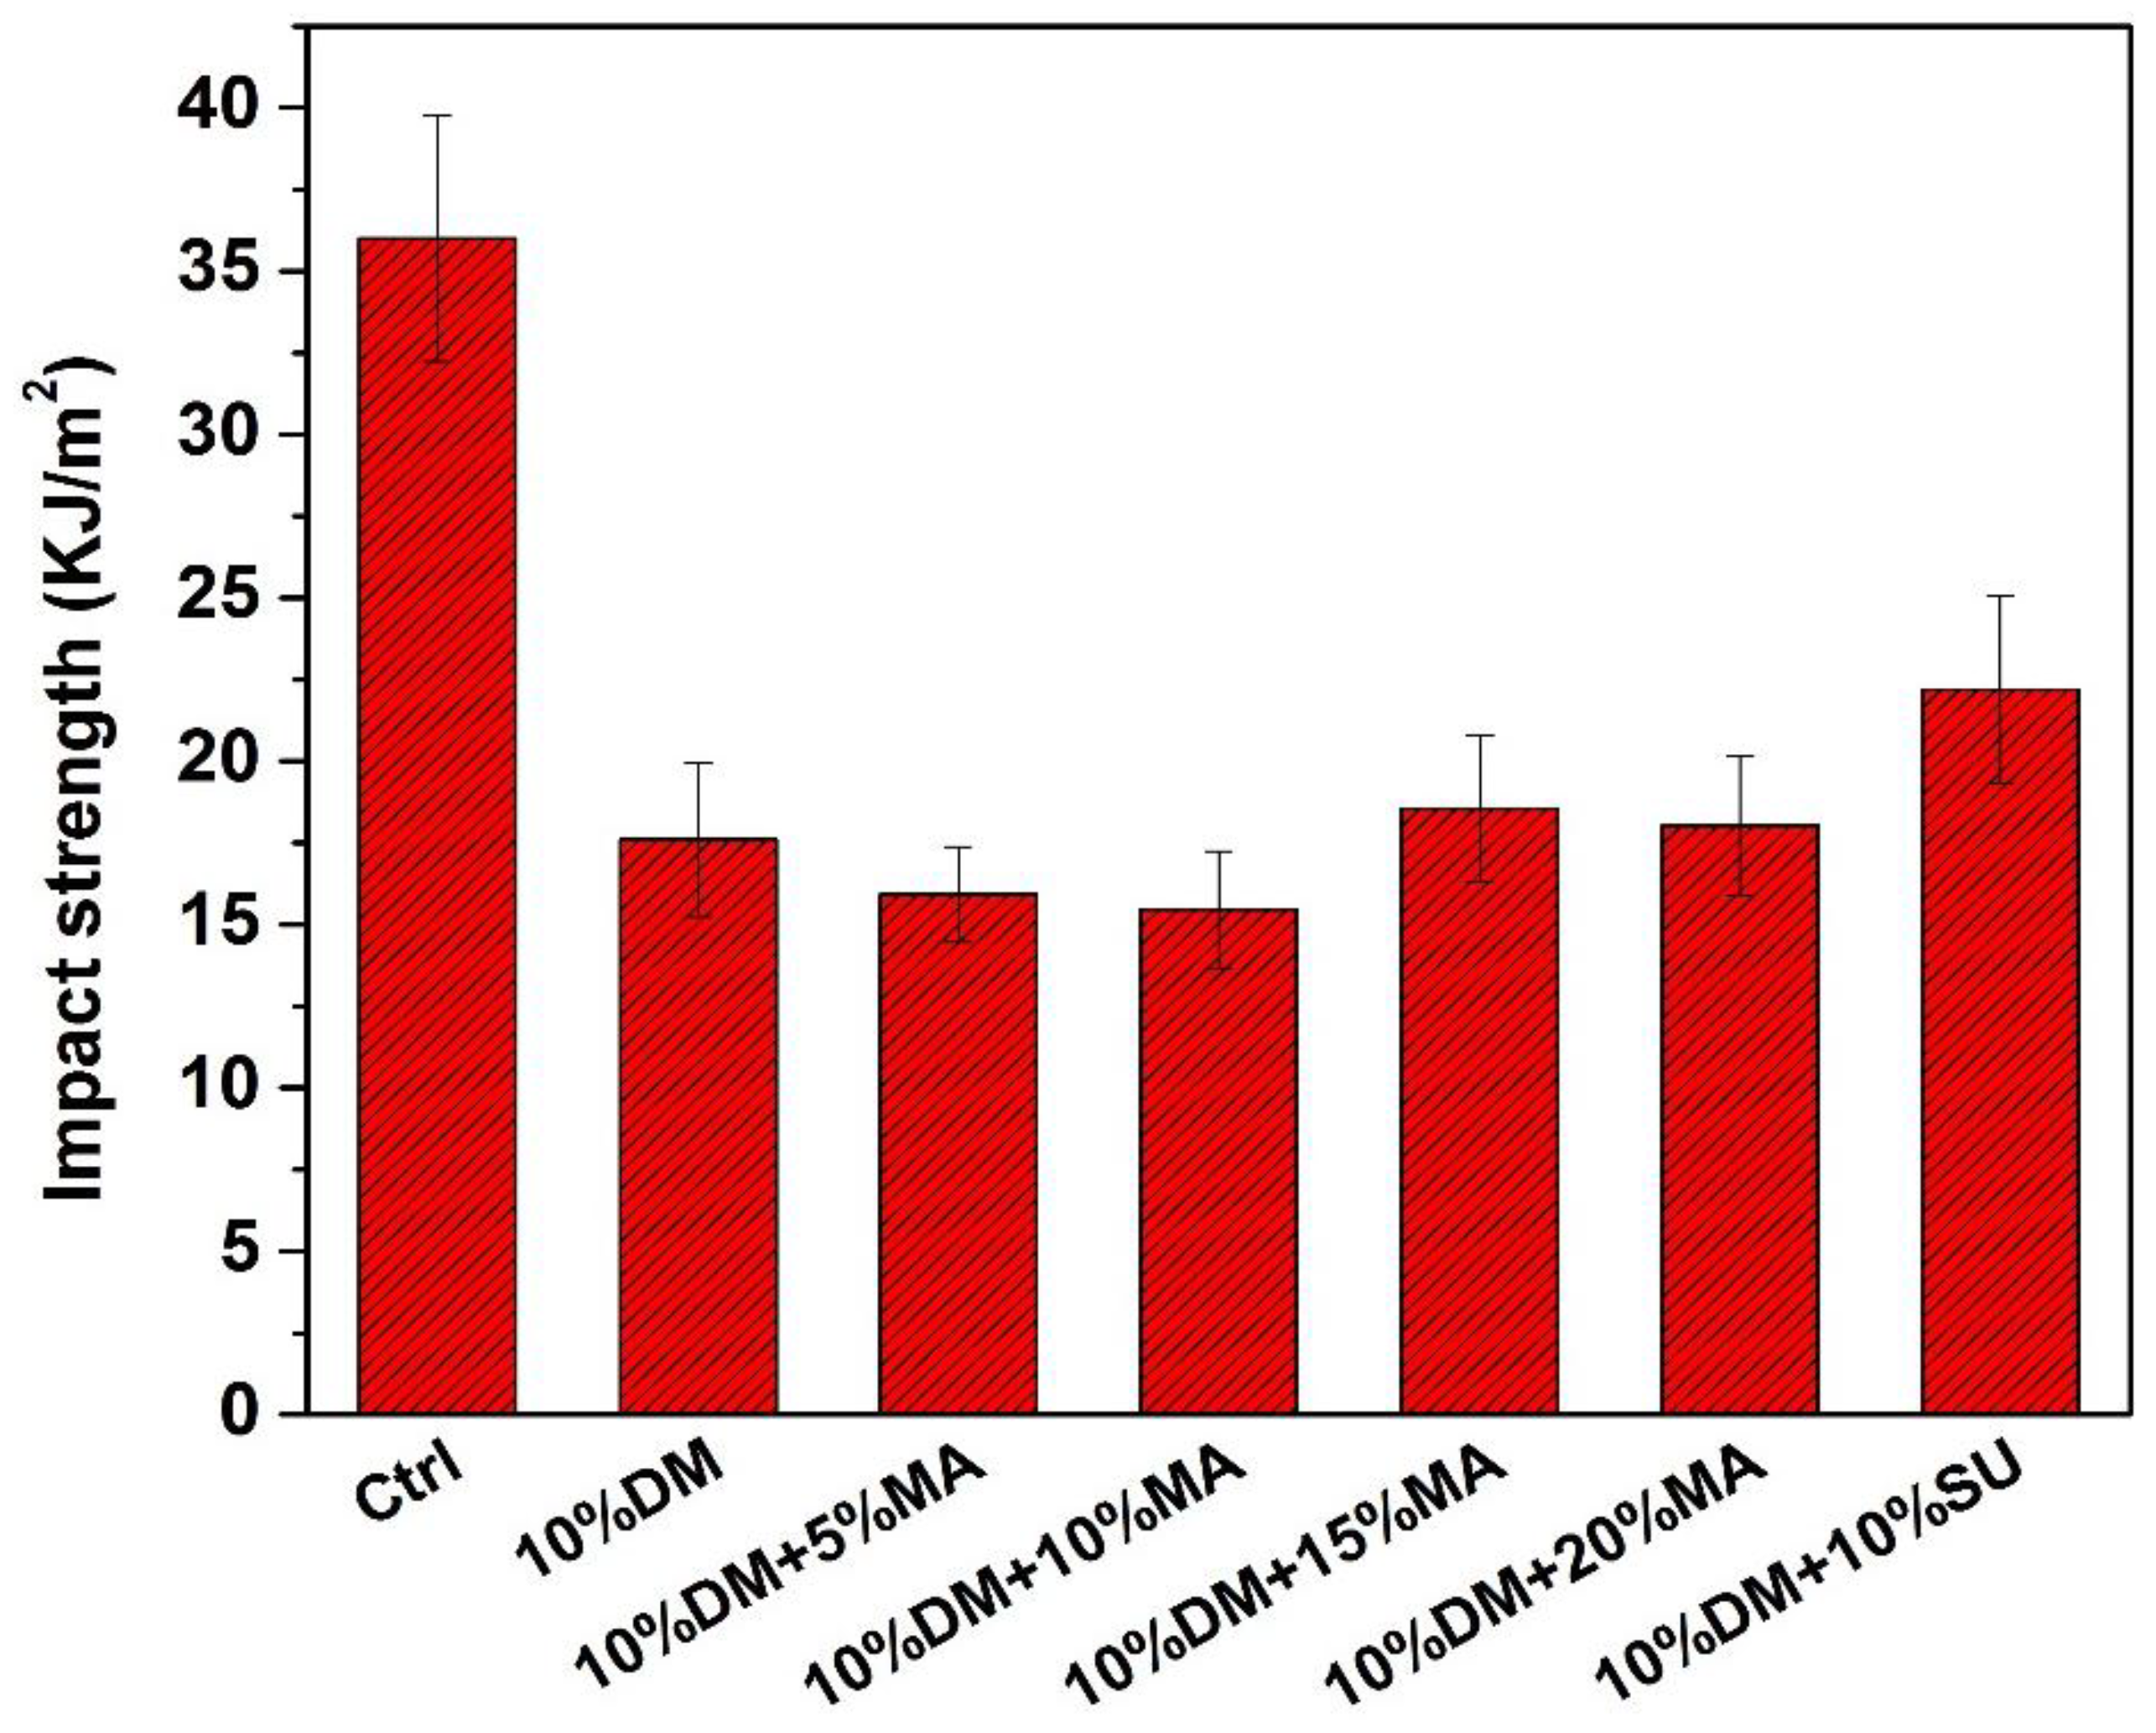
The impact strength of the wood as determined by Charpy impact testing. Strength was reduced by treating the sample with 10% DM as well as MA and SU at different concentrations (Figure 6). The wood impregnated with DM showed a decrease in impact strength from 36.00 kJ/m2 to 17.59 kJ/m2, reflecting a 51.13% reduction compared with untreated samples. An increase in MA concentration led to a reduction in impact strength; however, this change was not significant. The maximum decrease in impact strength was 57.05% relative to that of the untreated controls. When treated with 10% SU, the wood obtained an impact strength of 22.19 kJ/m2, which was 18.69% higher than that of the wood treated with 10% MA. The decrease in impact strength could be explained by the reduction in wood embrittlement attributed to hydrolysis of cell wall polymers, as well as cross-linking, which reduced cell wall moisture [24], the STDEV of the untreated material was slightly larger than those of the other groups (3.75 kJ/m2), which might be influenced by water content distribution, but since the group had 20 replicates, the error was allowed in statistics. The overall range was 1.47–3.75 kJ/m2, and the changes among different groups were significant (p < 0.001).
3.4. Morphological Analyses
No modifiers were observed on the pits inside the lumen (Figure 7a). A thin layer was coated on the inner cell walls, and wood pits were blocked by the resin film (Figure 7b). In contrast, condensed chemicals were deposited on the inner lumen of the wood samples treated with 10% DM + 10% MA and 10% DM + 10% SU, whose corresponding WPGs were 34.34% and 38.26%, respectively. The modifiers almost filled the entire wood lumen (Figure 7c,d), markedly affecting the dimensional stability of the wood samples. In addition, numerous burrs were observed in the cross-sections of the treated wood samples (Figure 7e), whereas a significantly-reduced number of burrs were found in the untreated samples (Figure 7f). This finding verified the significant difference in wood toughness before and after modification.
During impregnation, the chemicals entered the interior of the wood primarily through the lumen, and then circulated throughout the wood. By pressurization, the modifier molecules were freely diffused by Brownian motion under the action of pressure in the intercellular spaces in the wood, cell wall, or cell cavity [29]. During final drying, the water evaporated, and the modifier was polymerized solidified, and deposited where it was, filling the internal pores of the wood. Consequently, the density, mechanical properties, and dimensional stability of the wood were increased.
3.5. Fourier-Transform Infrared Spectroscopy
FTIR is the most effective method of detecting chemical functional groups. Among functional groups were the hydroxyl group (O-H), with absorption bands near 3400, 1160, 1370, and 1315 cm−1 corresponding to the cellulose [30], 1740 and 1032 cm−1 corresponding to the hemicellulose, 1596, 1506, and 1269 cm−1 corresponding to lignin [31], and 1103 cm−1 corresponding to the hydroxyl association absorption band.
The test results are presented in Figure 8, showing the O-H stretching vibration near 3400 cm−1. The vibration enhancement obtained when 10% DM was added, indicating that the DM has a cross-linking reaction with the cell wall in the wood. However, the vibration weakened with the addition of MA and SU, indicating that the hydrogen bond between the sugar and the DM reduced the reaction between the resin and the cell wall. The degree of O-H decrease was basically the same between MA and SU.
The band at 1710 cm−1 was due to the acetyl groups (CH3-CO) of hemicelluloses, aldehyde groups (C=O) of lignin, and extractives in the untreated wood. This absorption was strengthened and shifted to 1640 cm−1 because of the introduction of amidic acetyl groups (O=C-N) after treatment with DM, as well the 10% DM + 10% MA and 10% DM + 10% SU treated materials. The increased intensity of band at 1506 cm−1 could be the assigned to C-N stretching vibration, which caused by the incorporation of DM in the wood. The absorption peaks on the spectrum of the untreated wood were 1260 and 1224 cm−1, and were mainly due to vibrations of several groups in xylan and other hemicelluloses [32]. However, no significant changes in absorption peaks were found in these two locations after treatment. The reason could be that the absorption peak of 1242 cm−1 was too strong, and the two aforementioned absorption peaks were covered.
Moreover, 1160 and 1032 cm−1 were the vibrational peaks corresponding to the cellulose and the hemicellulose, respectively. With the 10% MA and 10% SU added, the vibration gradually weakened. This weakening could be explained by the hydrolysis of the cellulose and hemicellulose owing to high temperature and the addition of the catalyst (MgCl2), leading to a gradual decrease in corresponding functional groups. The hydroxy group-associated absorption band at 1103 cm−1 weakened, indicating that the modifier was cross-linked with certain groups in the wood, in addition to the filling of the cell compartment and intercellular spaces in poplar wood.
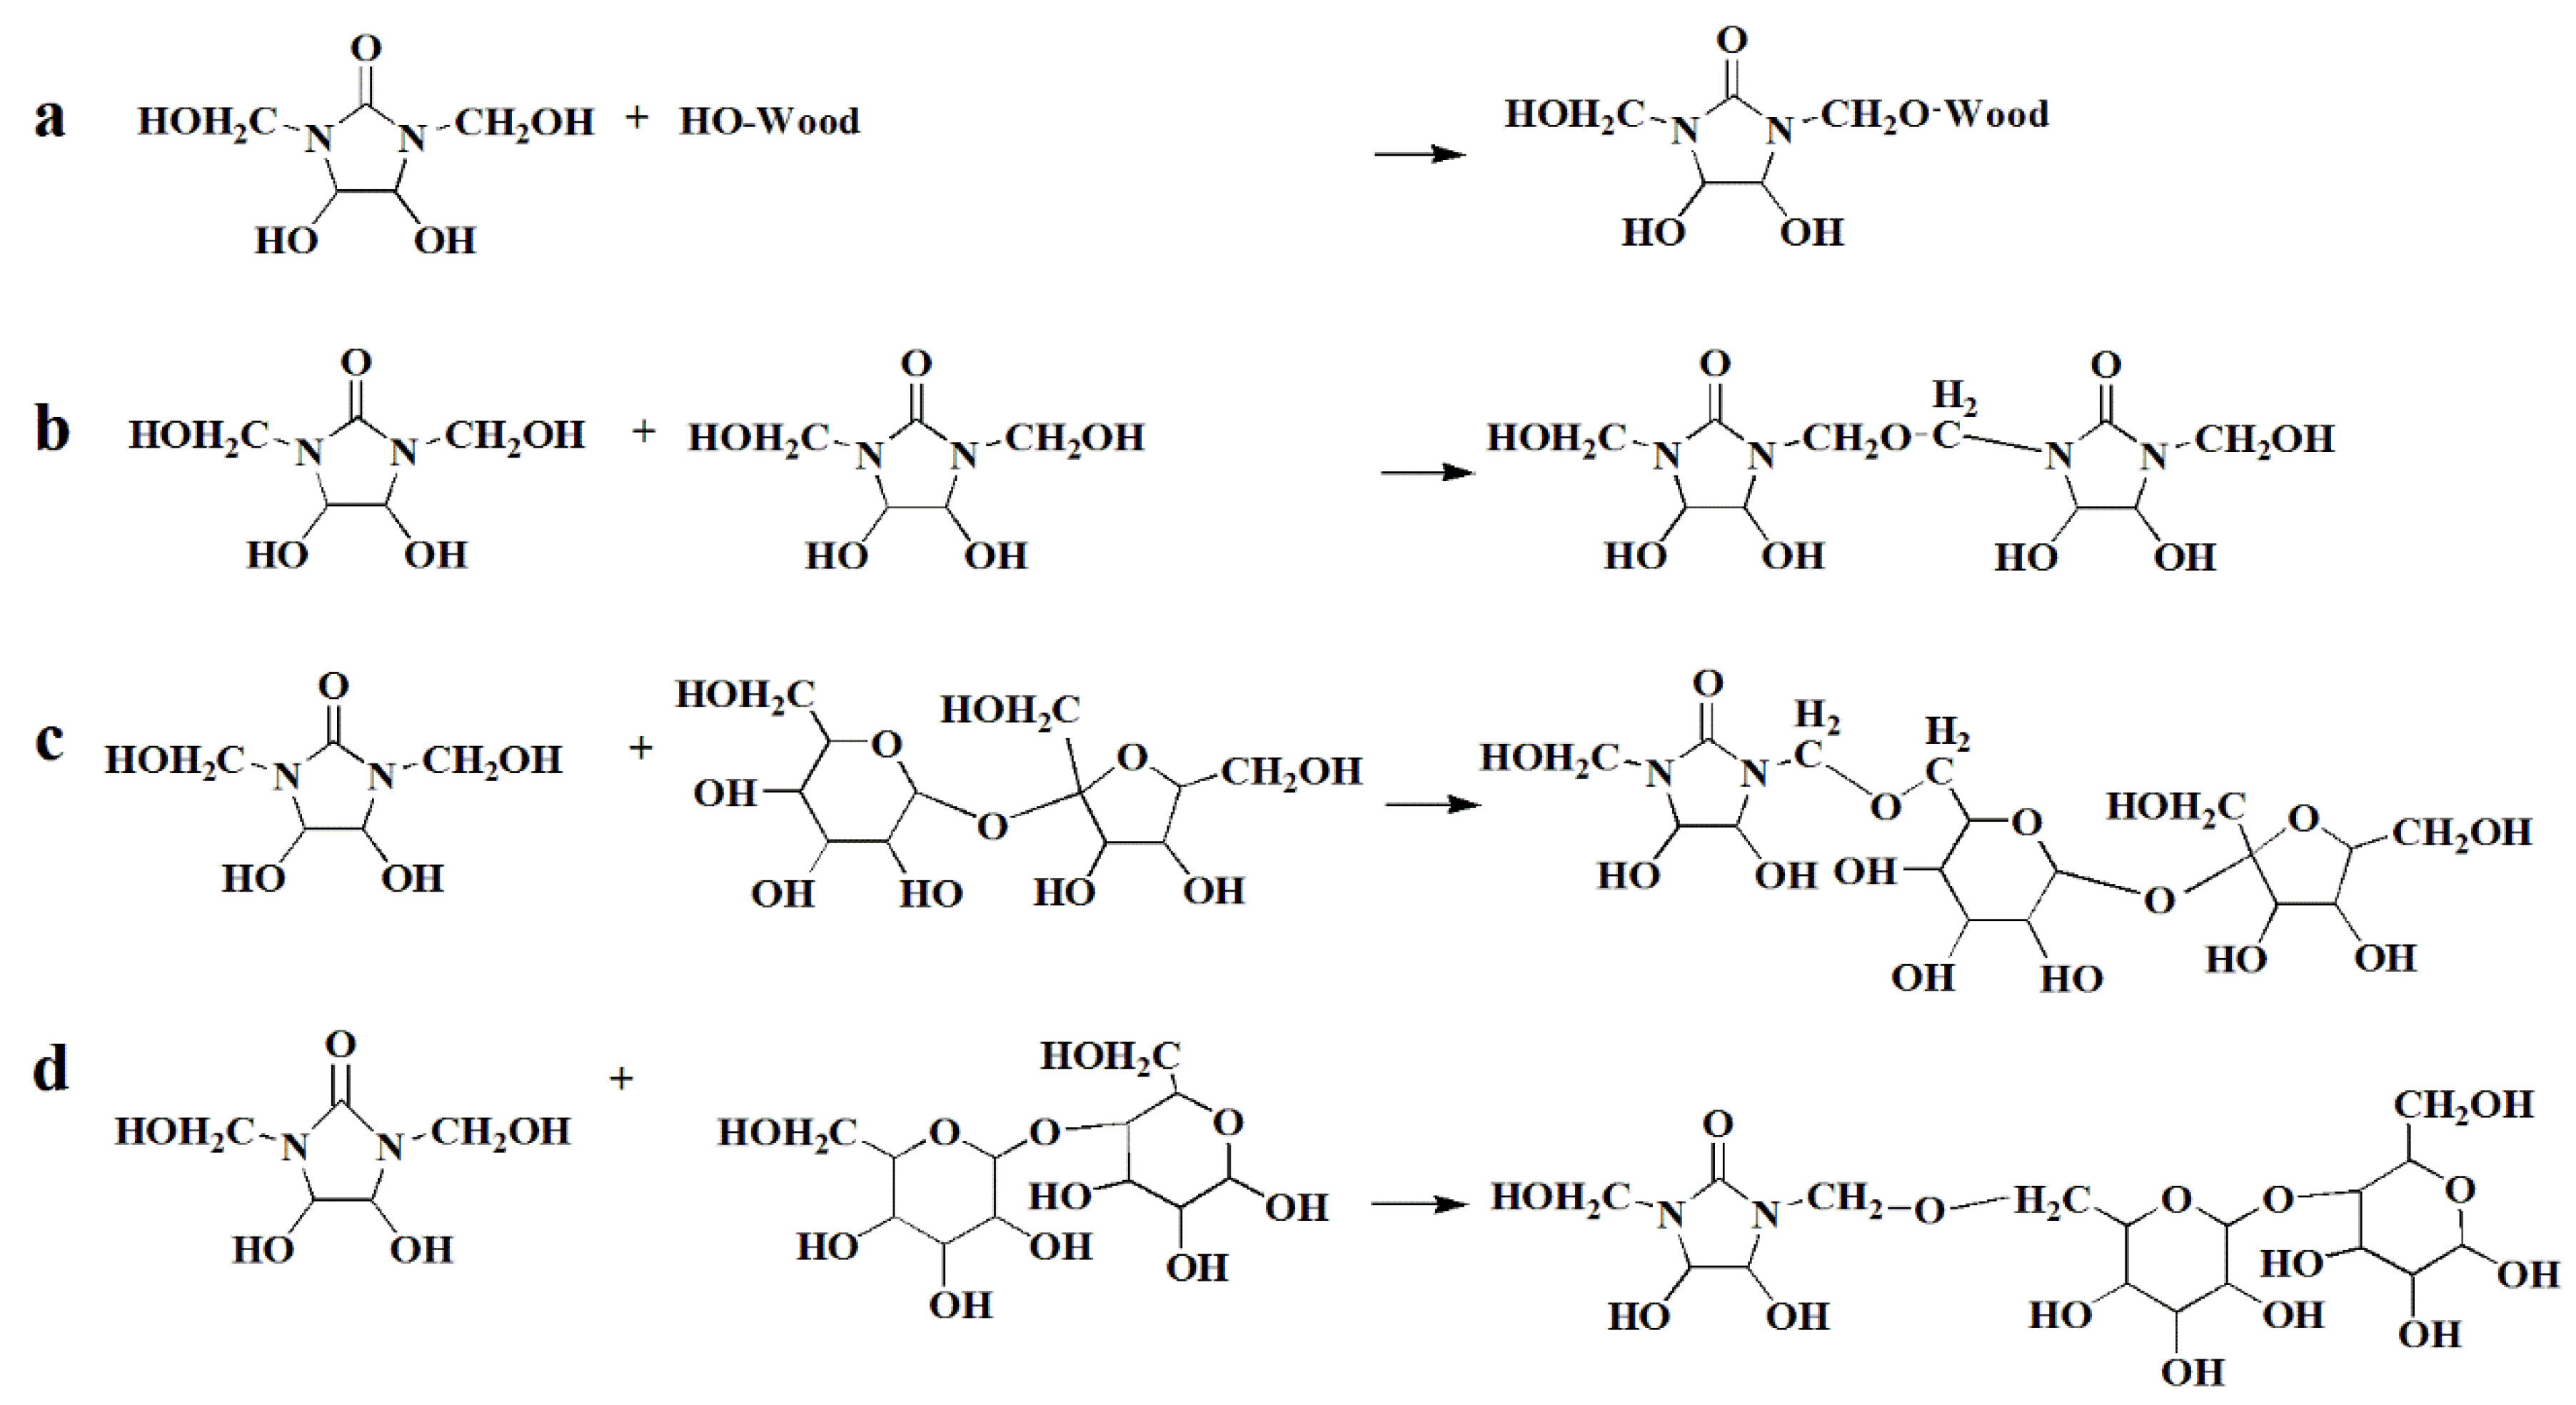
The highest absorption peak of the modified wood FTIR spectrum appeared at 1050 cm−1. In the wood spectra, this vibrational absorption peak was mainly attributed to the stretching vibration of the alcohol and ether groups in the polysaccharide, which was also affected by the vibration of various functional groups in the lignin. These findings suggested that several reactions occurred between the cellulose and DM [33]. In summary, because DM reacted with the O-H in cellulose, hemicellulose, and lignin, the introduction of MA could reduce the cross-linking reaction between DM and wood cell wall to some extent, and formed macromolecular structure with DM, which would be effectively fixed inside the wood and increase the mechanical properties. Meanwhile, the degree of the functional group peaks change in the spectra of MA and SU were basically similar, which further proved that the modification mechanism of SU and MA were consistent (Figure 1).
The chemicals were diffused and penetrated into the wood cell wall, and the cross-linking of the O-H groups of cellulose and hemicellulose was reduced, thereby decreasing the water-absorbing quality of the O-H groups. This reduction markedly decreased moisture and moisture absorption in the wood, increasing wood stability. The results are contributed to the ASE of 10% MA and 10% SU treated materials reaching 57.05% and 63.55%, respectively (Figure 4c).
3.6. XRD Analyses
The results are presented in Figure 9. Three types of cellulose patterns were identified, with 101, 002, and 040 peaks observed near 2θ = 15°, 22°, and 34°, respectively [34]. The changes in the crystal structure of the cellulose in the cell wall affected the crystal size, cell parameters, and crystallinity. The relative crystallinity of wood was essentially the percentage of cellulose crystallization area in the whole cellulose. The change in crystallinity was closely related to the dimensional stability, hardness, tensile strength, and density of the wood. Relative crystallinity was calculated in accordance with the Segal method [35].
The most significant diffraction peak (002) was at 2θ = 22.237° for the control sample, whereas the diffraction peaks at 2θ = 22.002°, 22.063°, 21.985°, 22.861°, 22.835°, and 22.480° represent various proportions of modifiers which are listed in Table 2. These shifts in peak positions could be explained as follows: After modification, the chemicals inside the wood became unevenly distributed, causing macroscopic residual stress and lattice distortion [36]. Macroscopic residual stress led to anisotropic lattice shrinkage, and the diffraction peak shifted to a high angle when compressive stress was applied. In contrast, when tensile stress was applied, the diffraction peak shifted to a low angle [37]. The extent of decrease in crystallinity measured by the experiment was reduced and then stabilized with the addition of MA and SU (Table 5). When the sample was treated with 10% MA, the decrease in crystallinity was 21.57%, which was 6.62% higher than that of wood treated with SU at the same concentration. The DM modification reagent reacted with the amorphous region of the wood, thereby increasing the mass of the amorphous region. Meanwhile, the crystallization region remained unchanged; thus, the relative crystallinity of the wood was reduced [38]. However, another possibility was that at a high temperature, the deacetylation of hemicelluloses led to the formation of acetic acid. Acetic acid caused partial acid hydrolysis of cellulose at high temperatures, destroying the structure of celluloses, thereby decreasing the degree of polymerization of celluloses and resulting in a decrease in crystallinity [39]. However, as the MA concentration increased, its crystallinity remained basically the same, indicating that the reaction between the modifier and the amorphous region reached saturation [40,41,42,43]. However, after the modification of poplar wood, the effect of the modifier on the width of cellulose crystallization zone was not apparent, and the variation range was within 2%.
4. Conclusions
MA combined with a DM-modified reagent was used for vacuum impregnation in poplar wood. The effects of the modified formula on the physical and chemical properties of poplar wood were evaluated. The following conclusions can be drawn.
- (1)
- Before and after leaching, the WPG and WLR of the poplar wood improved, with up to 52.81% increase in MA concentration; however, WLR also increased from 43.78% to 54.20%. The wood treated with 10% MA concentration obtained an ASE with a maximum rate of 57.05%, which is lower than the ASE (63.55%) obtained when the wood was treated with SU at the same concentration. Simultaneously, the dry density, air density, and basic density of the wood increased by more than 40%;
- (2)
- In addition, the flexural strength, flexural modulus, and compressive strength perpendicular to the grain direction increased with an increase in MA concentration, reaching 42.13%, 81.68%, and 61.54%, respectively; however, the compressive modulus was slightly reduced, and the impact strength decreased by 57.05%;
- (3)
- Morphological analysis proved that chemical agents were attached to the cell lumen. FTIR spectroscopy also revealed that MA could inhibit cellulose hydrolysis and cross-linking between DM and the cell wall polymer. Crystallographic analysis showed that with an increase in MA concentration, the crystallinity of the cellulose crystallization zone was slightly reduced.
The experiment proved that MA/DM could effectively enhance the poplar wood, and could even achieve a better effect than the same concentration of SU. These findings offer researchers a potential low-cost method.
Author Contributions
M.C. conceived and designed the experiments; M.C. and Z.F. performed the experiments; M.C., Z.F. and Y.C. analyzed the data; M.C. wrote the paper, with revisions by Z.F. and Y.C. Z.L., C.X. (Can Xu), C.X. (Cong Xu) and S.L. edited numerous drafts.
Funding
This research was funded by the National Natural Science Foundation of China (Grant No. 31670562).
Acknowledgments
This work was financially supported by the National Natural Science Foundation of China (Grant No. 31670562).
Conflicts of Interest
The authors declare no conflict of interest.
References
- Wacker, J.P. Chapter 17: Use of wood in buildings and bridges. In Wood Handbook: Wood as an Engineering Material; General Technical Report FPL GTR-190; US Department of Agriculture, Forest Service, Forest Products Laboratory: Madison, WI, USA, 2010; Volume 190, pp. 1–13. [Google Scholar]
- Schneider, M.H.; Witt, A.E. History of wood polymer composite commercialization. For. Prod. J. 2004, 54, 19–24. [Google Scholar]
- Hill, C.A.S. Wood Modification: Chemical, Thermal and Other Processes; John Wiley & Sons: Hoboken, NJ, USA, 2007. [Google Scholar]
- González-Peña, M.M.; Hale, M.D.C. Rapid assessment of physical properties and chemical composition of thermally modified wood by mid-infrared spectroscopy. Wood Sci. Technol. 2011, 45, 83–102. [Google Scholar] [CrossRef]
- Militz, H. Treatment of timber with water soluble dimethylol resins to improve their dimensional stability and durability. Wood Sci. Technol. 1993, 27, 347–355. [Google Scholar] [CrossRef]
- Xie, Y.; Krause, A.; Militz, H.; Mai, C. Coating performance of finishes on wood modified with an N-methylol compound. Prog. Org. Coat. 2006, 57, 291–300. [Google Scholar] [CrossRef]
- Xie, Y.; Krause, A.; Mai, C.; Militz, H.; Richter, K.; Urban, K.; Evans, P.D. Weathering of wood modified with the N-methylol compound 1,3-dimethylol-4,5-dihydroxyethyleneurea. Polym. Degrad. Stab. 2005, 89, 189–199. [Google Scholar] [CrossRef]
- Xie, Y.; Krause, A.; Militz, H.; Mai, C. Weathering of uncoated and coated wood treated with methylated 1,3-dimethylol-4,5-dihydroxyethyleneurea (mDMDHEU). Holz als Roh-und Werkstoff 2008, 66, 455. [Google Scholar] [CrossRef]
- Krause, A.; Wepner, F.; Xie, Y.; Militz, H. Wood protection with dimethyloldihydroxy-ethyleneurea and its derivatives. In ACS Symposium Series; Oxford University Press: Oxford, UK, 2008; Volume 982, pp. 356–371. [Google Scholar]
- Scheiding, W.; Kruse, K.; Plaschkies, K.; Weiß, B. Thermally Modified Wood for Playground Toys: Investigations on 13 Industrially Manufactured Products. In Proceedings of the 2nd European Conference on Wood Modification, Göttingen, Germany, 6–7 October 2005. [Google Scholar]
- Hoa, T.T.P.; Thanh, N.D.; Loan, N.T. Effects of mDMDHEU treatment on mold and fungal resistance of Canarium album wood. In Proceedings of the IAWS—VFU Workshop Proceeding, Hanoi, Vietnam; 2015. [Google Scholar]
- Simonsen, J. Lack of Dimensional Stability in Cross-Linked Wood-Polymer Composites. Holzforschung 1998, 52, 102–104. [Google Scholar] [CrossRef]
- Homan, W.J.; Jorissen, A.J.M. Wood modification developments. Heron 2004, 49, 360–369. [Google Scholar]
- Stick, R.V. Carbohydrates: The sweet molecules of life. Carbohydr. Res. 2001, 337, 381. [Google Scholar]
- Wyman, C.E.; Dale, B.E.; Elander, R.T.; Holtzapple, M.; Ladisch, M.R.; Lee, Y.Y.; Mitchinson, C.; Saddler, J.N. Comparative sugar recovery and fermentation data following pretreatment of poplar wood by leading technologies. Biotechnol. Prog. 2009, 25, 333–339. [Google Scholar] [CrossRef] [PubMed] [Green Version]
- Feng, X.; Xiao, Z.; Sui, S.; Wang, Q.; Xie, Y. Esterification of wood with citric acid: The catalytic effects of sodium hypophosphite (SHP). Holzforschung 2014, 68, 427–433. [Google Scholar] [CrossRef]
- He, X.; Xiao, Z.; Feng, X.; Sui, S.; Wang, Q.; Xie, Y. Modification of poplar wood with glucose crosslinked with citric acid and 1,3-dimethylol-4,5-dihydroxy ethyleneurea. Holzforschung 2016, 70, 47–53. [Google Scholar] [CrossRef]
- Li, Y.; Xiao, Z.; Zhang, Q.; Huang, Z.; Xie, Y. Mechanical properties of the Fast-growing Planted Wood chemically modified with sucrose and N-methylol resin. J. Northeast For. Univ. 2017, 45, 44–48. [Google Scholar]
- Xiao, Z.; Yuan, P.; Wang, Q.; Guo, Y.; Feng, X.; Xie, Y. Coating and weathering performance of wood modified with a mixing solution of sucrose and DMDHEU. J. For. Eng. 2016, 1, 18–24. [Google Scholar]
- Zhang, Z.; Tu, D.; Guan, L.; Yun, H.; Liao, L. Drying schedule of Chinese White Poplar Lumber Impregnated with Modified Urea-Formaldehyde Resin. China Wood Ind. 2014, 28, 42–44. [Google Scholar]
- Zhang, X.; Wang, R.; Wang, W.; Wang, W.; Li, L.; Chu, Y.; Tian, Q. Study on Cross-Linking reaction of Maltodextrin with Formaldehyde. Guangzhou Chem. Ind. 2018, 46, 58–60. [Google Scholar]
- Qin, J.; Li, X.; Shao, Y.; Shi, K.; Zhao, X.; Feng, T. Optimization of delignification process for efficient preparation of transparent wood with high strength and high transmittance. Vacuum 2018, 158, 158–165. [Google Scholar] [CrossRef]
- Zhao, Y.; Gu, Z. Study on Stability of Maltdextrin. J. Chin. Cereals Oils Assoc. 2008, 23, 96–101. [Google Scholar]
- Xie, Y.; Xiao, Z.; Grüneberg, T.; Militz, H.; Hill, C.A.; Steuernagel, L.; Mai, C. Effects of chemical modification of wood particles with glutaraldehyde and 1,3-dimethylol-4,5-dihydroxyethyleneurea on properties of the resulting polypropylene composites. Compos. Sci. Technol. 2010, 70, 2003–2011. [Google Scholar] [CrossRef]
- Xie, Y.; Fu, Q.; Wang, Q.; Xiao, Z.; Militz, H. Effects of chemical modification on the mechanical properties of wood. Eur. J. Wood Wood Prod. 2013, 71, 401–416. [Google Scholar] [CrossRef]
- Winandy, J.E.; Rowell, R.M. Chemistry of wood strength. In Handbook of Wood Chemistry and Wood Composites; CRC Press: Boca Raton, FL, USA, 2012; pp. 428–471. [Google Scholar]
- Xiao, Z.; Xie, Y.; Militz, H.; Mai, C. Effect of glutaraldehyde on water related properties of solid wood. Holzforschung 2010, 64, 483–488. [Google Scholar] [CrossRef]
- Larnøy, E.; Militz, H.; Eikenes, M. Uptake of chitosan based impregnation solutions with varying viscosities in four different European wood species. Holz als Roh-und Werkstoff 2005, 63, 456–462. [Google Scholar] [CrossRef]
- Bi, Z.; Lang, Q.; Pu, J. Chemical Modification of Fast-Grown Poplar by Urea Formaldehyde and Polyacrylic Resin. Wood Fiber Sci. 2014, 46, 573–580. [Google Scholar]
- Rautkari, L.; Laine, K.; Laflin, N.; Hughes, M. Surface modification of Scots pine: The effect of process parameters on the through thickness density profile. J. Mater. Sci. 2011, 46, 4780–4786. [Google Scholar] [CrossRef]
- Higgins, H.G.; Stewart, C.M.; Harrington, K.J. Infrared spectra of cellulose and related polysaccharides. J. Polym. Sci. 1961, 51, 59–84. [Google Scholar] [CrossRef]
- Faix, O.; Grünwald, C.; Beinhoff, O. Determination of phenolic hydroxyl group content of milled wood lignins (MWL’s) from different botanical origins using selective aminolysis, FTIR, 1H-NMR, and UV spectroscopy. Holzforschung 1992, 46, 425–432. [Google Scholar] [CrossRef]
- Evans, P.D.; Michell, A.J.; Schmalzl, K.J. Studies of the degradation and protection of wood surfaces. Wood Sci. Technol. 1992, 26, 151–163. [Google Scholar] [CrossRef]
- Yuan, J.; Hu, Y.; Li, L.; Cheng, F. The mechanical strength change of wood modified with DMDHEU. BioResources 2013, 8, 1076–1088. [Google Scholar] [CrossRef]
- Wada, M.; Okano, T.; Sugiyama, J. Allomorphs of native crystalline cellulose I evaluated by two equatoriald-spacings. J. Wood Sci. 2001, 47, 124–128. [Google Scholar] [CrossRef]
- Segal, L.G.; Creely, J.J.; Martin, A.E., Jr.; Conrad, C.M. An empirical method for estimating the degree of crystallinity of native cellulose using the X-ray diffractometer. Text. Res. J. 1959, 29, 786–794. [Google Scholar] [CrossRef]
- Jiang, Z. Analysis of the microfibrilla angles & crystallinity index of daemonorops margaritae with X-ray diffractometry and the effects of γ-ray irradiation. Spectrosc. Spectr. Anal. 2010, 30, 1404–1407. [Google Scholar]
- Ma, X.-X.; Wang, C.-G.; Zhang, S.-Y. Analysis of Microfibrilla Angles and Crystallinity Index of Grapevine. Chin. J. Spectrosc. Lab. 2012, 4, 51. [Google Scholar]
- Bhuiyan, M.T.R.; Hirai, N.; Sobue, N. Changes of crystallinity in wood cellulose by heat treatment under dried and moist conditions. J. Wood Sci. 2000, 46, 431–436. [Google Scholar] [CrossRef]
- Zhang, R.H.; He, Z.C.; Wang, H.W.; You, F.; Li, K.N. Study on self-tuning tyre friction control for developing main-servo loop integrated chassis control system. IEEE Access 2017, 5, 6649–6660. [Google Scholar] [CrossRef]
- Sun, X.J.; Zhang, H.; Meng, W.J.; Zhang, R.H.; Li, K.L.; Peng, T. Primary resonance analysis and vibration suppression for the harmonically excited nonlinear suspension system using a pair of symmetric viscoelastic buffers. Nonlinear Dyn. 2018, 4, 1–23. [Google Scholar] [CrossRef]
- Xiong, H.Y.; Zhu, X.L.; Zhang, R.H. Energy Recovery Strategy Numerical Simulation for Dual Axle Drive Pure Electric Vehicle Based on Motor Loss Model and Big Data Calculation. Complexity 2018, 2018, 1–14. [Google Scholar] [CrossRef]
- Wang, L.; Zhang, L.; Li, H.; Ma, Y.; Zhang, R. High selective production of 5-hydroxymethylfurfural from fructose by sulfonic acid functionalized SBA-15 catalyst. Compos. Part B Eng. 2019, 156, 88–94. [Google Scholar] [CrossRef]
Figure 1.
Reaction of DM with wood hydroxyl (a) and its own condensation (b) and reaction of DM with SU (c) and MA monomers (d).
Figure 1.
Reaction of DM with wood hydroxyl (a) and its own condensation (b) and reaction of DM with SU (c) and MA monomers (d).

Figure 2.
Vacuum pressure impregnation.

Figure 3.
WPG and wWPG of the wood treated with 10% DM and chemicals at different concentrations (a,c); WLR and WPGs after leaching of wood treated with 10% DM and chemicals at different concentrations (b,d).
Figure 3.
WPG and wWPG of the wood treated with 10% DM and chemicals at different concentrations (a,c); WLR and WPGs after leaching of wood treated with 10% DM and chemicals at different concentrations (b,d).

Figure 4.
(a) Swelling, (b) shrinkage, and (c) ASE of wood before and after treatment with 10% DM, and MA at different concentrations and 10% DM and 10% SU. Water uptake of untreated wood and wood treated with chemicals (d).
Figure 4.
(a) Swelling, (b) shrinkage, and (c) ASE of wood before and after treatment with 10% DM, and MA at different concentrations and 10% DM and 10% SU. Water uptake of untreated wood and wood treated with chemicals (d).

Figure 5.
(a) Flexure modulus and (b) flexural strength of the samples treated with 10% DM, 10% DM + MA at different concentrations, and 10% DM + 10% SU. Compressive modulus (c) and compressive strength (d) of the samples treated with 10% DM, 10% DM + MA at different concentrations, and 10% DM + 10% SU.

Figure 6.
Impact strength of the sample treated with 10% DM, 10% DM and MA at different concentrations, and 10% DM and 10% SU.
Figure 6.
Impact strength of the sample treated with 10% DM, 10% DM and MA at different concentrations, and 10% DM and 10% SU.

Figure 7.
Micrographs of the tangential sections of (a) the untreated wood sample and the wood samples treated with (b) 10% DM (c) 10% DM + 10% MA (d), 10% DM + 10% SU (Cross-section) of (e) the untreated wood, and (f) the wood treated with 10% DM.
Figure 7.
Micrographs of the tangential sections of (a) the untreated wood sample and the wood samples treated with (b) 10% DM (c) 10% DM + 10% MA (d), 10% DM + 10% SU (Cross-section) of (e) the untreated wood, and (f) the wood treated with 10% DM.

Figure 8.
Fourier-transform infrared (FTIR) spectra of samples treated with 10% DM, 10% DM and MA and SU at different concentrations, and untreated wood powder. Band assignments: (a) O-H bending; (b) carbonyl stretching in wood and DM; (c) aromatic skeletal vibration in lignin; (d) C-O stretching in lignin and hemicellulose; (e) C-O stretching in lignin and acetyl and carbonyl vibration in hemicellulose, as well as C-O vibration at the N-methylol group of DM; and (f) C-O stretching in alcohol and ether groups of polysaccharides and lignin.

Figure 9.
Effects of different modifiers on the X-ray diffraction patterns of poplar wood (a); Effects of MA concentrations on X-ray diffraction patterns of Poplar (b).
Figure 9.
Effects of different modifiers on the X-ray diffraction patterns of poplar wood (a); Effects of MA concentrations on X-ray diffraction patterns of Poplar (b).


Table 1.
Changes in the WPG, wWPG, WLR and WPGs of wood treated with different modifiers.
| Method | WPG (%) | wWPG (%) | WLR (%) | WPGs (%) |
|---|---|---|---|---|
| 10% DM | 16.50 ± 1.32 | 196.92 ± 3.88 | 43.78 ± 2.86 | 9.32 ± 0.84 |
| 10% DM + 5% MA | 25.45 ± 2.08 *,b | 205.04 ± 4.69 *,b | 44.69 ± 1.99 *,b | 14.08 ± 1.58 *,b |
| 10% DM + 10% MA | 34.34 ± 3.11 *,b,c | 209.06 ± 4.76 *,b,c | 46.49 ± 3.04 *,b,c | 20.05 ± 2.87 *,b,c |
| 10% DM + 15% MA | 44.39 ± 2.49 *,b,c,d | 222.97 ± 5.05 *,b,c,d | 47.70 ± 3.06 *,b,c,d | 24.82 ± 2.46 *,b,c,d |
| 10% DM + 20% MA | 52.81 ± 3.22 *,b,c,d,e | 247.61 ± 4.09 *,b,c,d,e | 54.20 ± 2.49 *,b,c,d,e | 29.35 ± 3.43 *,b,c,d,e |
| 10% DM + 10% SU | 38.26 ± 4.62 *,b,c,d,e,f | 219.79 ± 5.45 *,b,c,d,e,f | 69.94 ± 2.51 *,b,c,d,e,f | 11.15 ± 1.47 *,b,c,d,e,f |
All values are expressed as mean ± STDVA, for 20 replicates in each group. b Comparisons are made with 10% DM. c Comparisons are made between with 10% DM + 5% MA. d Comparisons are made between with 10% DM + 10% MA. e Comparisons are made between with 10% DM + 15% MA. f Comparisons are made between with 10% DM + 20% MA. * Statistically significant at p < 0.001.
Table 2.
Changes in the swelling, shrinkage and ASE of wood treated with different modifiers.
| Method | Swelling (%) | Shrinkage (%) | ASE (%) | |
|---|---|---|---|---|
| R | T | |||
| Ctrl | 4.15 ± 0.42 | 4.38 ± 0.88 | 8.97 ± 0.64 | — |
| 10% DM | 3.29 ± 0.27 *,a | 2.44 ± 0.74 *,a | 5.12 ± 0.57 *,a | 52.45 ± 2.88 |
| 10% DM + 5% MA | 3.19 ± 0.41 *,a,b | 1.97 ± 0.39 *,a,b | 4.94 ± 0.56 *,a,b | 56.66 ± 3.24 *,b |
| 10% DM + 10% MA | 3.40 ± 0.38 *,a,b,c | 2.11 ± 0.69 *,a,b,c | 5.05 ± 0.47 *,a,b,**,c | 57.04 ± 5.26 *,b,**,c |
| 10% DM + 15% MA | 3.90 ± 0.28 *,a,b,c,d | 2.18 ± 0.18 *,a,b,c,d | 5.46 ± 0.47 *,a,b,c,d | 57.05 ± 3.66 *,b,c |
| 10% DM + 20% MA | 4.01 ± 0.32 *,a,b,c,d,e | 2.26 ± 0.24 *,a,b,c,d,e | 5.48 ± 0.82 *,a,b,c,d,**,e | 53.33 ± 3.78 *,b,c,d,e |
| 10% DM + 10% SU | 3.63 ± 0.36 *,a,b,c,d,e,f | 2.26 ± 0.23 *,a,b,c,d,e | 5.47 ± 0.81 *,a,b,c,d,**,e,f | 63.55 ± 6.12 *,b,c,d,e,f |
All values are expressed as mean ± STDVA, for 20 replicates in each group. a Comparisons are made with Ctrl. b Comparisons are made with 10% DM. c Comparisons are made between with 10% DM + 5% MA. d Comparisons are made between with 10% DM + 10% MA. e Comparisons are made between with 10% DM + 15% MA. f Comparisons are made between with 10% DM + 20% MA. * Statistically significant at p < 0.001. ** Statistically significant at p < 0.05.
Table 3.
Changes in the density of wood treated with different modifiers.
| Method | Density (g/cm3) | Improvement in Density (%) | ||||
|---|---|---|---|---|---|---|
| Dry | Air | Basic | Dry | Air | Basic | |
| Ctrl | 0.40 | 0.42 | 0.35 | — | — | — |
| 10% DM | 0.45 | 0.47 | 0.41 | 11.40 | 11.39 | 17.53 |
| 10% DM + 5% MA | 0.47 | 0.50 | 0.44 | 18.22 | 18.57 | 26.65 |
| 10% DM + 10% MA | 0.52 | 0.54 | 0.48 | 28.35 | 28.45 | 38.33 |
| 10% DM + 15% MA | 0.53 | 0.55 | 0.49 | 31.53 | 31.15 | 39.89 |
| 10% DM + 20% MA | 0.57 | 0.60 | 0.52 | 42.00 | 41.26 | 49.10 |
| 10% DM + 10% SU | 0.51 | 0.53 | 0.48 | 26.70 | 26.79 | 37.49 |
Table 4.
Changes in the flexural and compressive of wood treated with different modifiers.
| Method | I (GPa) | II (MPa) | III (GPa) | IV (MPa) | V (kJ/m2) |
|---|---|---|---|---|---|
| Ctrl | 5.91 ± 0.44 | 69.75 ± 3.82 | 0.25 ± 0.02 | 4.03 ± 0.40 | 35.99 ± 3.75 |
| 10% DM | 8.38 ± 0.89 *,a | 82.81 ± 8.07 *,a | 0.21 ± 0.03 *,a | 5.39 ± 0.49 *,a | 17.59 ± 2.37 *,a |
| 10% DM + 5% MA | 8.98 ± 0.99 *,a,b | 91.12 ± 10.99 *,a,b | 0.22 ± 0.03 *,a,**,b | 5.71 ± 0.63 *,a,b | 15.93 ± 1.47 *,a,b |
| 10% DM + 10% MA | 9.52 ± 0.98 *,a,b,c | 92.25 ± 9.43 *,a,b,c | 0.23 ± 0.02 *,a,b,**,c | 6.18 ± 0.54 *,a,b,c | 15.46 ± 1.79 *,a,b,**,c |
| 10% DM + 15% MA | 10.38 ± 0.72 *,a,b,c,d | 95.58 ± 8.08 *,a,b,c,d | 0.24 ± 0.02 *,a,b,c,d | 6.35 ± 0.59 *,a,b,c,d | 18.56 ± 2.25 *,a,b,c,d |
| 10% DM + 20% MA | 10.74 ± 0.76 *,a,b,c,d,**,e | 99.14 ± 6.84 *,a,b,c,d,e | 0.25 ± 0.02 *,a,b,c,d,e | 6.51 ± 0.66 *,a,b,c,d,e | 18.02 ± 2.14 *,a,b,c,d,e |
| 10% DM + 10% SU | 9.81 ± 0.55 *,a,b,c,d,e,f | 93.56 ± 5.58 *,a,b,c,d,e,f | 0.23 ± 0.03 *,a,b,c,e,f,**,d | 6.44 ± 0.55 *,a,b,c,d,e,f | 22.19 ± 2.86 *,a,b,c,d,e,f |
I: Flexural modulus; II: Flexural strength; III: Compressive modulus; IV: Compressive strength; V: Impact strength; All values are expressed as mean ± STDVA, for 20 replicates in each group. a Comparisons are made with Ctrl. b Comparisons are made with 10% DM. c Comparisons are made between with 10% DM + 5% MA. d Comparisons are made between with 10% DM + 10% MA. e Comparisons are made between with 10% DM + 15% MA. f Comparisons are made between with 10% DM + 20% MA. * Statistically significant at p < 0.001. ** Statistically significant at p < 0.05.
Table 5.
Crystalline characteristics of modified poplar wood with different chemical treatments.
| Method | Peak Position at 2θ | Cr (%) | D002 (nm) |
|---|---|---|---|
| Ctrl | 22.237 | 56.71 | 3.9944 |
| 10% DM | 22.002 | 55.07 | 4.0366 |
| 10% DM + 5% MA | 22.063 | 48.79 | 4.0255 |
| 10% DM + 10% MA | 21.985 | 44.51 | 4.0446 |
| 10% DM + 15% MA | 22.861 | 45.40 | 3.8868 |
| 10% DM + 20% MA | 22.835 | 45.03 | 3.8911 |
| 10% DM + 10% SU | 22.480 | 40.72 | 3.9517 |
© 2018 by the authors. Licensee MDPI, Basel, Switzerland. This article is an open access article distributed under the terms and conditions of the Creative Commons Attribution (CC BY) license (http://creativecommons.org/licenses/by/4.0/).
Share and Cite
MDPI and ACS Style
Cai, M.; Fu, Z.; Cai, Y.; Li, Z.; Xu, C.; Xu, C.; Li, S. Effect of Impregnation with Maltodextrin and 1,3-Dimethylol-4,5-Dihydroxyethyleneurea on Poplar Wood. Forests 2018, 9, 676. https://0-doi-org.brum.beds.ac.uk/10.3390/f9110676
AMA Style
Cai M, Fu Z, Cai Y, Li Z, Xu C, Xu C, Li S. Effect of Impregnation with Maltodextrin and 1,3-Dimethylol-4,5-Dihydroxyethyleneurea on Poplar Wood. Forests. 2018; 9(11):676. https://0-doi-org.brum.beds.ac.uk/10.3390/f9110676
Chicago/Turabian StyleCai, Mingzhen, Zongying Fu, Yingchun Cai, Zhengdong Li, Can Xu, Cong Xu, and Shuai Li. 2018. "Effect of Impregnation with Maltodextrin and 1,3-Dimethylol-4,5-Dihydroxyethyleneurea on Poplar Wood" Forests 9, no. 11: 676. https://0-doi-org.brum.beds.ac.uk/10.3390/f9110676
Note that from the first issue of 2016, this journal uses article numbers instead of page numbers. See further details here.