Article

Probabilistic Approach to Provide Scenarios of Earthquake-Induced Slope Failures (PARSIFAL) Applied to the Alcoy Basin (South Spain)

1
Dpt. Scienze della Terra and Centro di Ricerca per i Rischi Geologici—CERI, “Sapienza” University of Rome, Piazzale Aldo Moro, 5, 00185 Roma, Italy
2
Dpt. Ciencias de la Tierra y del Medio Ambiente, Universidad de Alicante, Carretera San Vicente del Raspeig s/n, 03690 San Vicente del Raspeig, Spain
3
Agenzia Nazionale per le Nuove Tecnologie, L’energia e lo Sviluppo Economico Sostenibile (ENEA), Via Enrico Fermi, 45, 00044 Frascati, Roma, Italy
*
Author to whom correspondence should be addressed.
Submission received: 30 November 2017 / Revised: 29 January 2018 / Accepted: 31 January 2018 / Published: 6 February 2018
(This article belongs to the Special Issue Natural Hazards and Risks Assessment)

Abstract

:
The PARSIFAL (Probabilistic Approach to pRovide Scenarios of earthquake-Induced slope FAiLures) approach was applied in the basin of Alcoy (Alicante, South Spain), to provide a comprehensive scenario of earthquake-induced landslides. The basin of Alcoy is well known for several historical landslides, mainly represented by earth-slides, that involve urban settlement as well as infrastructures (i.e., roads, bridges). The PARSIFAL overcomes several limits existing in other approaches, allowing the concomitant analyses of: (i) first-time landslides (due to both rock-slope failures and shallow earth-slides) and reactivations of existing landslides; (ii) slope stability analyses of different failure mechanisms; (iii) comprehensive mapping of earthquake-induced landslide scenarios in terms of exceedance probability of critical threshold values of co-seismic displacements. Geotechnical data were used to constrain the slope stability analysis, while specific field surveys were carried out to measure jointing and strength conditions of rock masses and to inventory already existing landslides. GIS-based susceptibility analyses were performed to assess the proneness to shallow earth-slides as well as to verify kinematic compatibility to planar or wedge rock-slides and to topples. The experienced application of PARSIFAL to the Alcoy basin: (i) confirms the suitability of the approach at a municipality scale, (ii) outputs the main role of saturation in conditioning slope instabilities in this case study, (iii) demonstrates the reliability of the obtained results respect to the historical data.

1. Introduction

Landslides are one of the most common collateral effect of earthquakes [1]. Seismic action is, indeed, one of the main triggers to be considered for landslide processes [2], especially in the case of their reactivation [3].
Damages caused by earthquake-induced ground effects can exceed the ones directly linked to seismic shaking [4]. Moreover, earthquake-induced landslides represent the result of a “chain effect” [5] which links two natural events (earthquake and landslide) having an independent probability of occurrence (in the case of landslide reactivation) or a conditioned one (in the case of a first-time landslide). As a consequence, the risk can be amplified because of the combined induced damage (i.e., related to both earthquake shaking and landslide displacement) even if the hazard itself (rigorously considered as probability of occurrence) is lower.
One of the most suitable tools for mitigating risk associated with earthquake-induced landslides, is the formulation of scenarios, which describes how dangerous events manifest themselves, their consequences in terms of damage or losses and the countermeasures to be adopted to limit such negative effects [6].
Thus, the challenge to be taken up when dealing with this kind of risk consists in answering the questions: where could co-seismic slope failures occur in a given area and what is the actual potential of collapse (i.e., displacement beyond a given threshold). Two main approaches are then possible: (i) actions addressed to identify over large areas slope sectors prone to co-seismic slope failures, usually implemented by means of statistics-based models where the seismic input is only implicitly taken into account by back-analyzing specific events [7], and/or by considering the PGA in each mapping and analysis unit [8,9]; (ii) physically-based analyses to quantify the co-seismic displacements, usually performed by applying of the conventional Newmark’s approach, sometimes also over large areas [10,11,12,13,14,15,16,17,
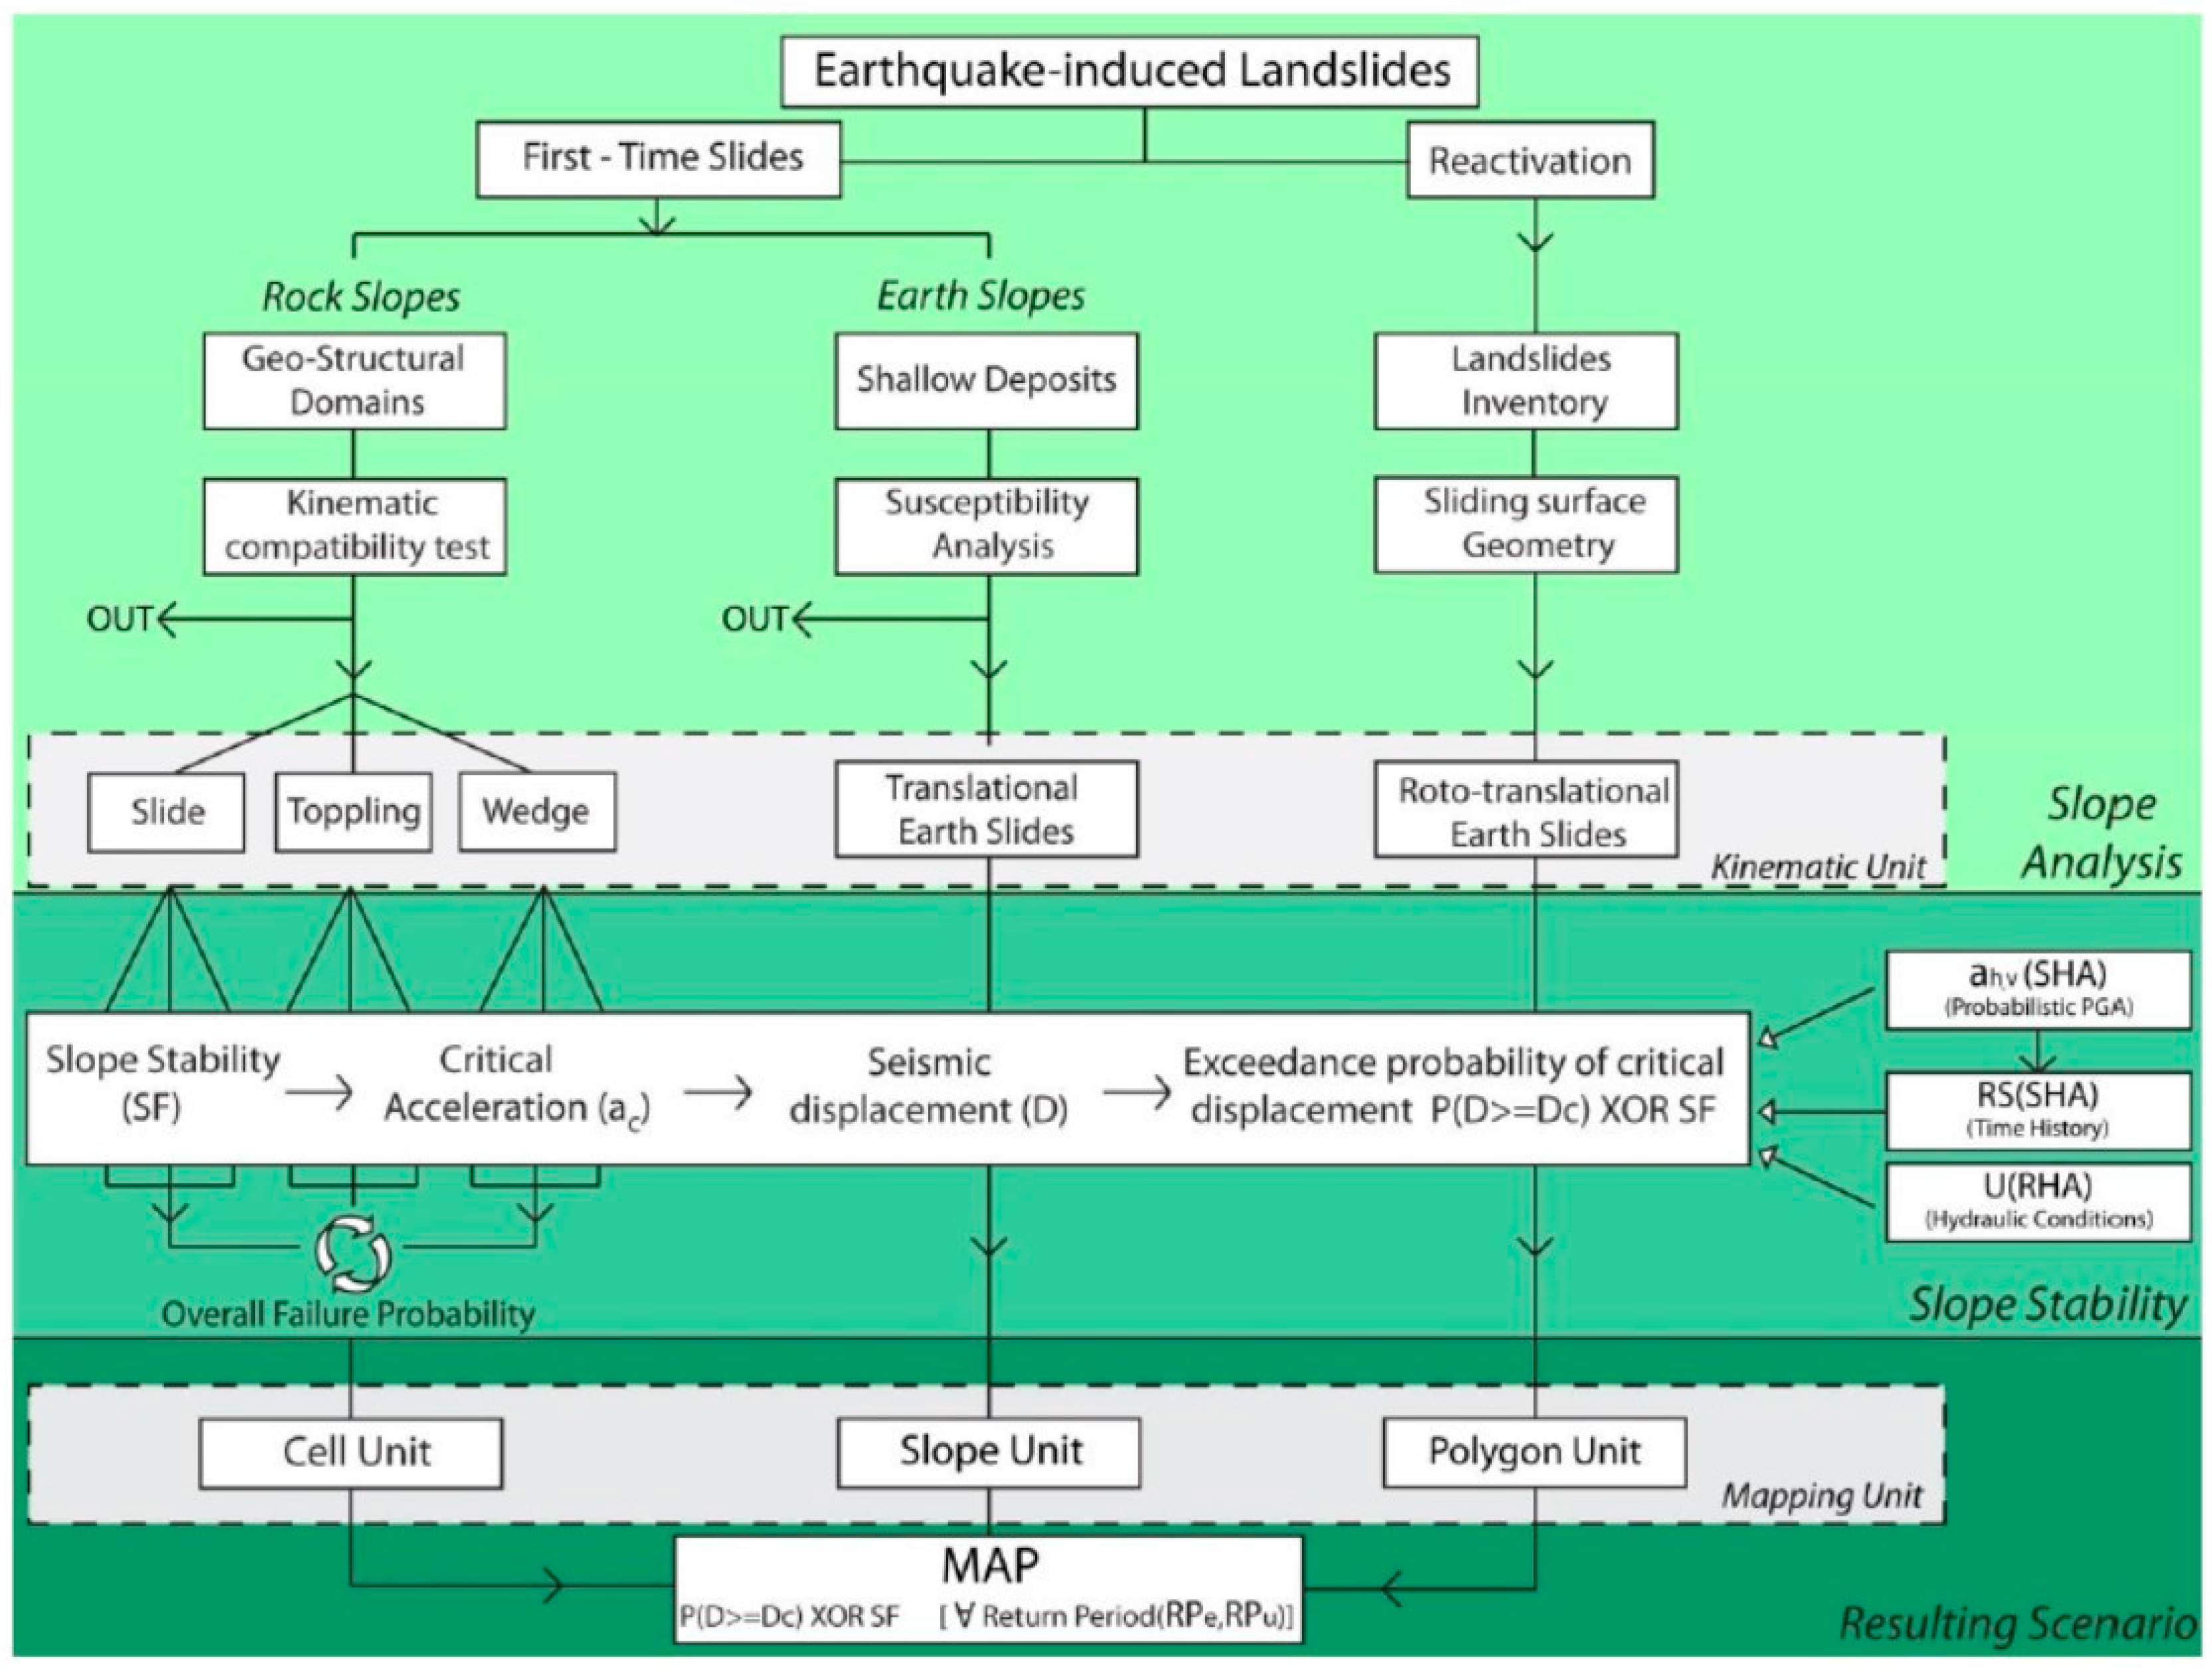
18]. It is worth noting that these approaches generally consider separately different landslide mechanisms, i.e., earth- or rock-slides or rock block toppling. The PARSIFAL approach [1] represents an attempt to overcome the above mentioned limitations, since it consists in a new comprehensive approach to the seismic landslide susceptibility and demonstrates the possibility to: (i) integrate outputs referred to different mechanisms into a unique mapping, (ii) distinguish first-time landslides and reactivations for analytical computations, (iii) analyze both rock and soil slopes (only shallow failures in the case of first time landslides) and their related different failure mechanisms; (iv) consider different hydraulic conditions related to the seasonal variability of soil/rock saturation; (v) account for a probability of exceedance of a co-seismic displacement threshold suitable for slope failure [19,20], in order to restitute scenarios of earthquake-induced landslide distribution.
Such a methodology leads to a synthetic and integrated thematic mapping reporting of the probability of exceedance computed respect to a threshold value of co-seismic displacement (i.e., to be considered for slope failure) for scenarios representative for specific seismic hazard and saturation conditions.
PARSIFAL is thought for extensive analyses (over large territorial areas, as the municipality or the regional ones, i.e., from tens to thousands of square kilometers) and designed as a fully comprehensive methodology to provide expected scenarios. The results can be then considered as a tool for screening and rating the main criticalities (i.e., by ranking the level of severity of specific slope failures) to make it possible to define a priority of more detailed studies as well as of engineer interventions. This allows to accept a higher level of uncertainty in assessing the mechanical parameters and their variability.
This paper focuses on the application of the PARSIFAL to the territory of Alcoy municipality. This approach was already applied to some municipalities of Southern Latium region (Italy) [1,5] and presently is being tested in some municipalities struck by the seismic sequence occurred on 2016–2017 in Central Apennine (Italy) [21].

2. Methods

The PARSIFAL [1] allows for a comprehensive analysis of first-generation landslides on soil and rock slopes as well as for landslide reactivations. The main output consists on a complete mapping of the probability of exceedance of earthquake-induced landslide displacement respect to an assumed threshold, for different scenarios (i.e., return times of earthquakes and saturation conditions).
The methodology includes 3 sequential steps (Figure 1).
  • Step 1: Slope Analysis (SA). This step consists in the identification of slope sectors prone to failure that can be referred to first-time landslides or reactivations of already existing landslide masses, regardless the dynamic input. This step includes a susceptibility analysis for identifying potentially unstable zones (i.e., zones prone to failure for first-time earth slides, rock slides and toppling) and a geomorphological analysis to correctly locate and classify, in terms of failure mechanism, the already existing landslides. The final aim is then to perform a zonation of the study area based on the proneness to a specific failure mechanism. In case of first-time earth slides, areas of outcropping debris cover and colluvial deposits (i.e., the deposits affected by shallow landslides) are subdivided into areas featured by the unique combination of lithology and slope and aspect classes (Unique Condition Units—UCU). The proneness to failure of each UCU is then assessed to select those to be analyzed in detail in the following step. In case of rock slides or toppling, the study area is partitioned in Homogenous Geo-structural zones (HGZ), i.e., zones having similar lithology, morpho-structural setting and geo-structural features (in terms of number and geometrical attitude of discontinuity sets). The kinematic compatibility to wedge, toppling and planar sliding of each elementary unit (raster cell) forming the HGZ is performed to select the cell units to be further analyzed in the following step. In case of already existing landslides (i.e., landslide mass reactivations) they can be identified and inventoried in a GIS geodatabase and analyzed according to their characteristic mechanism (i.e., mainly rotational or translational).
  • Step 2: Slope Stability (SS). This step consists in the assessment of the actual potential of failure/reactivation under combined seismic and hydraulic loading of the areas resulted unstable in the previous phase. Specifically, this step aims at the computation of an exceedance probability of co-seismic displacements based on an assumed threshold for failure (P[D ≥ Dc|a(t), ay]) and performed through the Newmark’s method [22]. In case that the threshold is not exceeded, a safety factor (SF) is computed to provide a stability level of the slope. To perform such an analysis the requested input data consist of: seismic acceleration, response spectra and selected time-histories related to the most severe seismogenic source among the ones that contribute to the seismic hazard of the site. Different conditions of soil/rock-joints saturation can be accounted for.
  • Step 3: Resulting Scenario (RS). This step aims at providing, for each considered scenario of combined seismic and hydraulic conditions, a synthetic and integrated GIS-based graphical representation (mapping) of the slope stability results for both first-time slope failures and landslide reactivations. Such a mapping shows the different territorial units defined as elementary areas able to represent the slope stability results in terms of either exceedance probability or safety factor. In case of rock slopes, these areas are represented by single cells of a raster, while vectorial data are used to represent slope stability results for first time earth-slides and already existing landslides.

3. Case Study

Alcoy is a Spanish municipality of 70,000 inhabitants, belonging to the Comunidad Valenciana in the province of Alicante, located in the south-eastern part of Spain.
The municipality area is about 130 km2 extended and lies within a geological basin known as “Hoya de Alcoy”. The urban texture shows a close connection with the morphological evolution suffered by this area, where the rivers Polop, Bartxell and Molinar, tributaries of the river Serpis, played a main role, modeling valleys with steep slopes that had a remarkable influence on the urban development over time.
Alcoy is characterized by an internal Mediterranean climate, altered from the altitude which ranges between 450 and 600 m a.s.l. in the city area and between 450 and 1356 m a.s.l. (i.e., at the top of Mt. Menechador) in the whole municipality area. Temperatures range from average 5 °C in winter up to average 26 °C in the summer. Rainfalls are strongly influenced by the proximity to the Gulf of Valencia; the average yearly rainfall amount ranges from 300 mm in the southern arid region up to 500 mm and the maximum rainfalls generally occur in autumn while summer is dry and arid.
The study zone is widely affected by landslides. During the Upper Miocene and Pliocene, this intramontane basin was an endorheic one. During the Quaternary river erosion allowed the connection of this basin with the Mediterranean Sea, a sudden change in the base level of rivers took place, which led to a period of intense incision by erosion of slopes that favors the occurrence of landslides [23]. Currently, shallow landslides mainly occur in relation to intense rainy periods [24,25], although deep and large roto-translational landslides can be also related to different triggers [26]. As it regards earthquake-induced landslides, they are well documented for the Alcoy area [27].
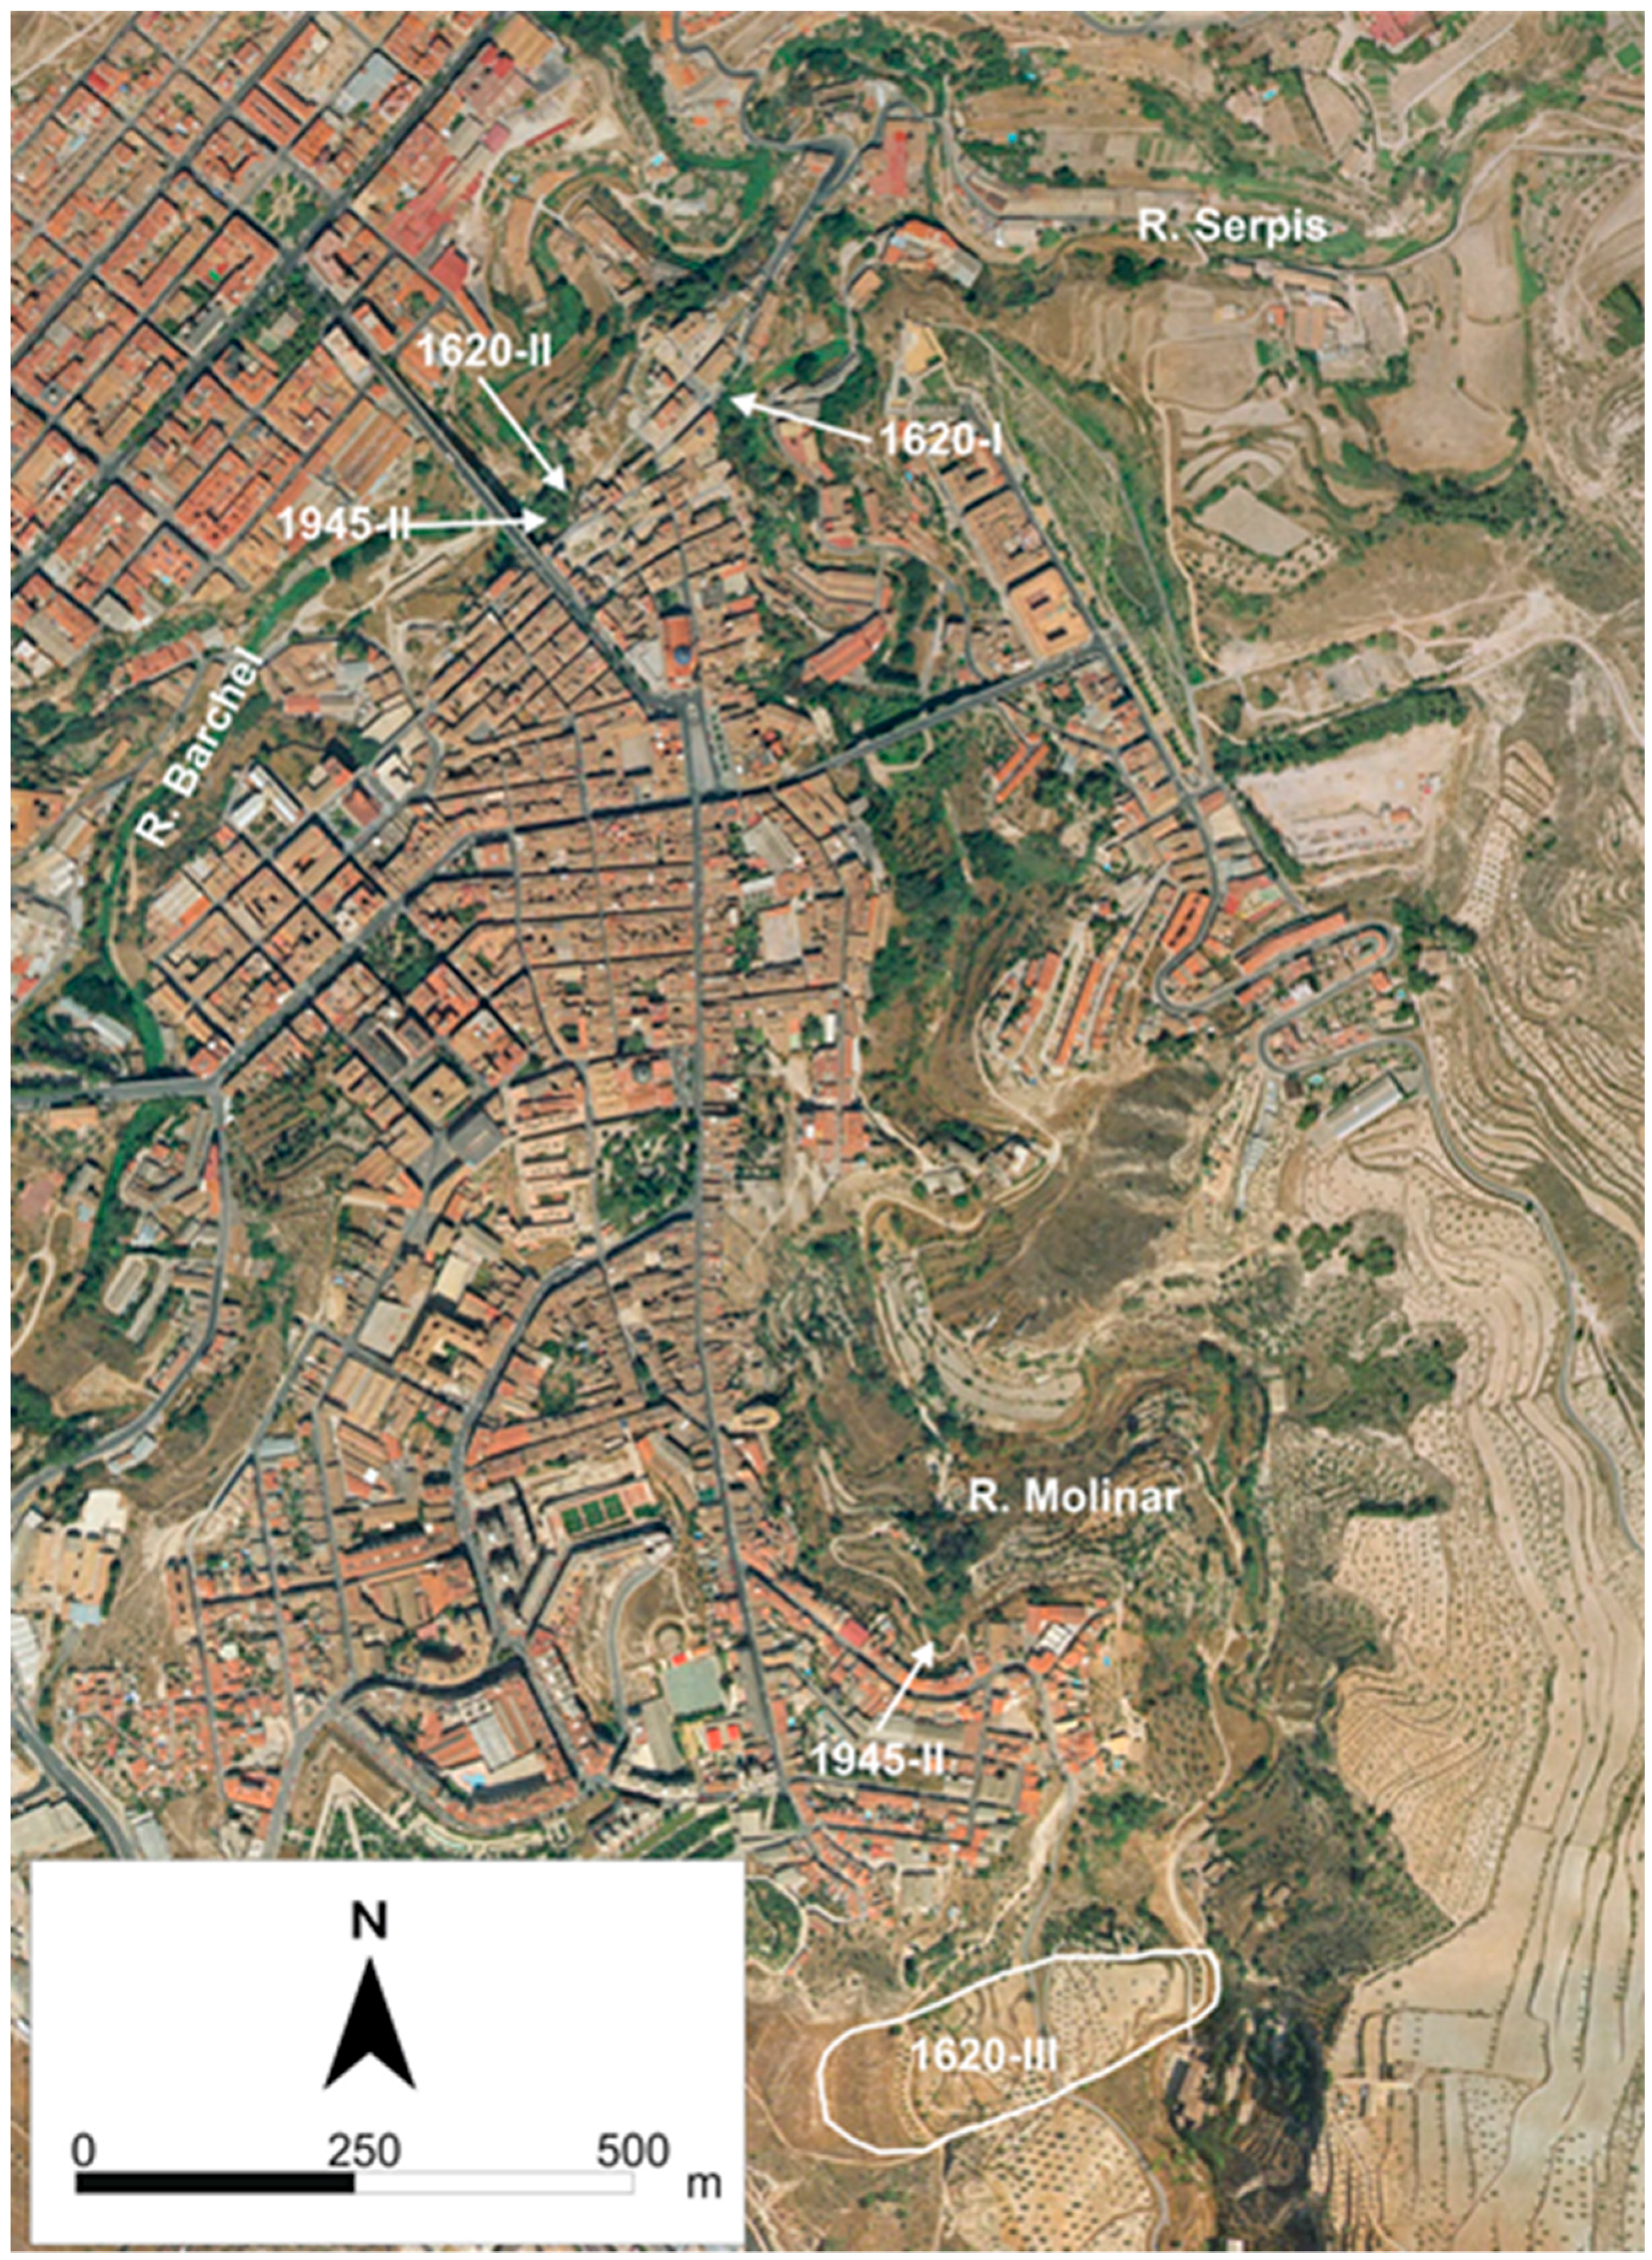
On December 2, 1620, an earthquake (Mw 5.5, Imax VII-VIII in EMS-scale) triggered several landslides that affected slopes of the rivers Barchel and Molinar, causing damage (including collapse) to houses located along several streets of the city in that time (Figure 2). According to historical descriptions, they correspond to moderate sized disrupted landslides (sensu Keefer, [2]) although a large coherent slide was reactivated during this event (instability 1620-III in Figure 2). In historical time, a low magnitude event (Mw 4.8) triggered two new, small sized landslides in the urban area of Alcoy [23,24,25,26,27] (Figure 2).
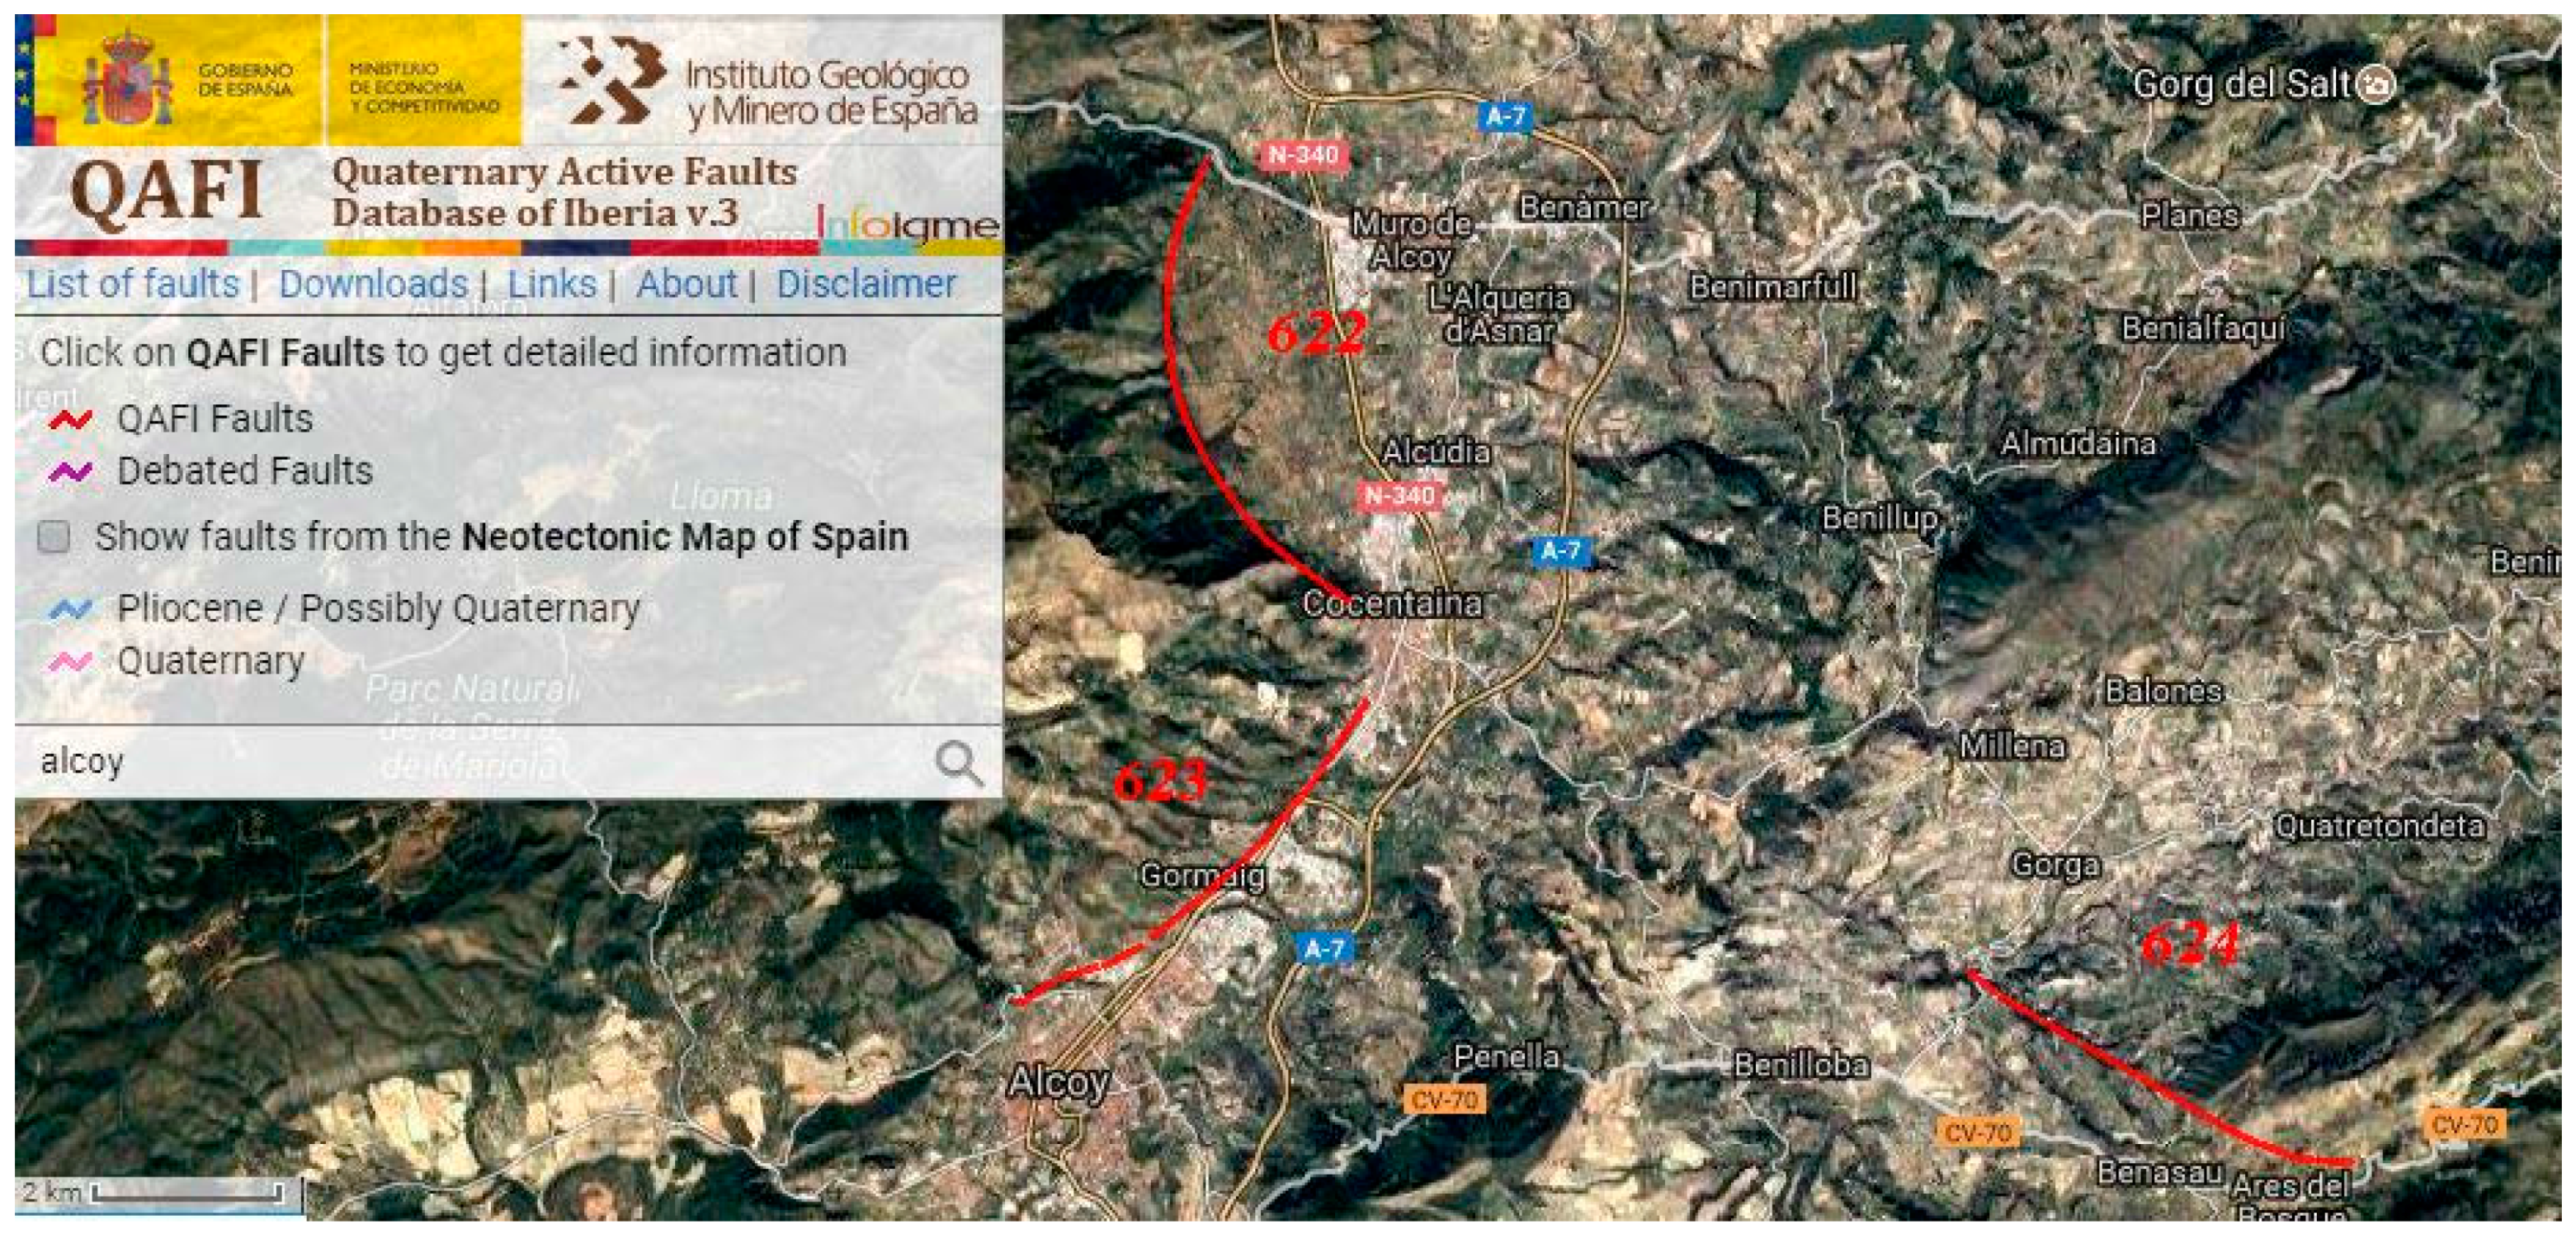
The study area is located in the eastern portion of the Betic Cordillera ridge, south east of the geological Alcoy intramontane basin.
The Betic Cordillera is an Alpine orogen originated by the collision between the African plate and the Eurasian one, which extends 600 km south of the Iberian Peninsula, from the Gulf of Cadiz to the southern province of Valencia and the Balearic Islands [28].
On the basis of the outcropping rocks and their degree of metamorphism, the Betic Cordillera is distinguished in four main geological zones: outer domain; internal domain; complex of Gibraltar and Neogene-quaternary intramontane basins [29]. The Alcoy area is one of these intramontane basins, located within the outer domain of the Betic Cordillera [30].
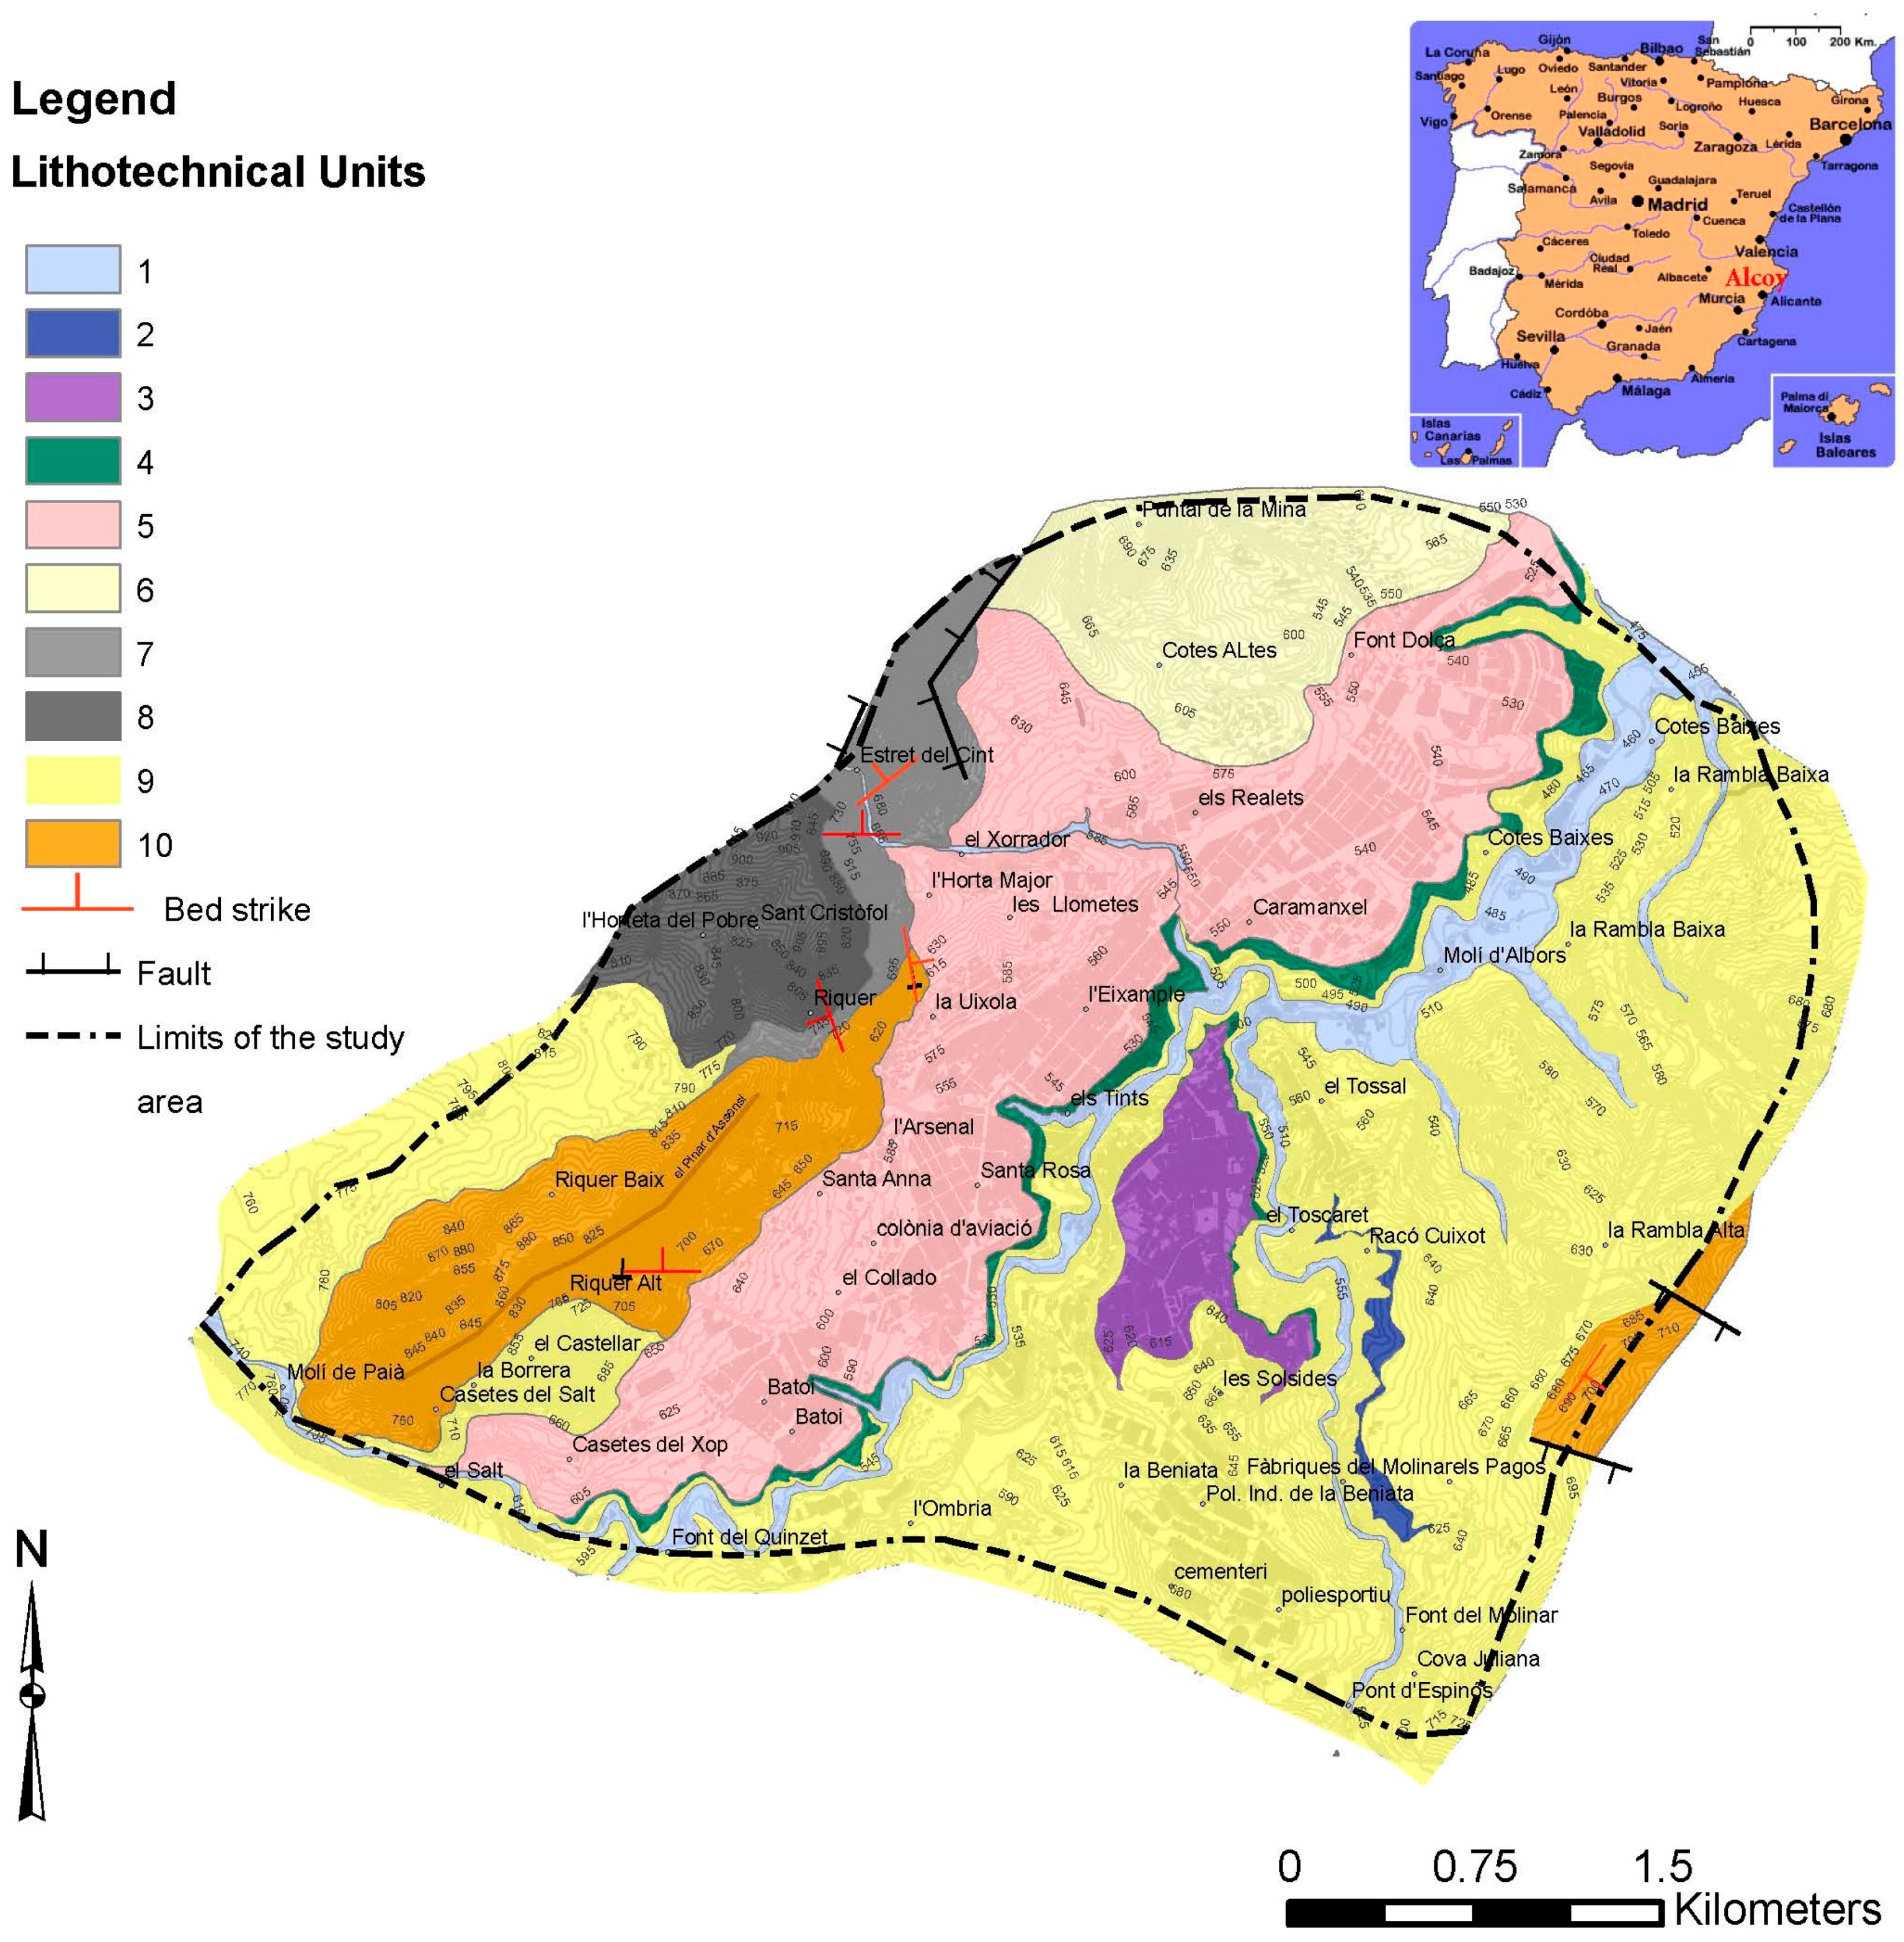
The geological deposits which outcrop in the area of Alcoy (Figure 3) include Oligocene bioclastic limestones, interlayered to conglomeratic and marly levels, Miocene marls and clays (locally named "Marne del Tap Formation”) widely outcropping in the Alcoy basin, bioclastic and biodetritic limestones that outcrop in the reliefs which surround the basin.
On the basis of the outcropping rocks and their degree of metamorphism, the Betic Cordillera is distinguished in four main geological zones: outer domain; internal domain; complex of Gibraltar and Neogene-quaternary intramontane basins [29]. The Alcoy area is one of these intramontane basins, located within the outer domain of the Betic Cordillera [30].
The geological deposits outcropping in the area of Alcoy (Figure 3) include Oligocene bioclastic limestones, interlayered to conglomeratic and marly levels, Miocene marls and clays (locally named "Marne del Tap Formation”) which widely outcrops in the Alcoy basin, bioclastic and biodetritic limestones that outcrop in the reliefs which surround the basin. At the bottom of the main reliefs alluvial fans of Pleistocene and Holocene ages outcrop, which are composed of reddish gravels and clays. Other quaternary deposits consist of alluvial and travertine terraces and alluvial deposits which fill the central part of the Alcoy basin. Travertine terraces are located above the Miocene marls and clays, with thicknesses varying depending on the suffered erosion while the alluvial terraces are distributed at different levels above the present river channel and are mainly composed of calcareous sediments eroded from the surrounding.

4. PARSIFAL Step 1: Slope Analysis (SA)

4.1. Rock Slopes

To analyze the susceptibility to failure of rock slopes (Figure 4), a GIS procedure on a cell-by-cell basis was implemented to verify the compatibility of different failure mechanisms (wedge, planar sliding and toppling), based on data collected through geomechanical surveys according to the ISRM standards [
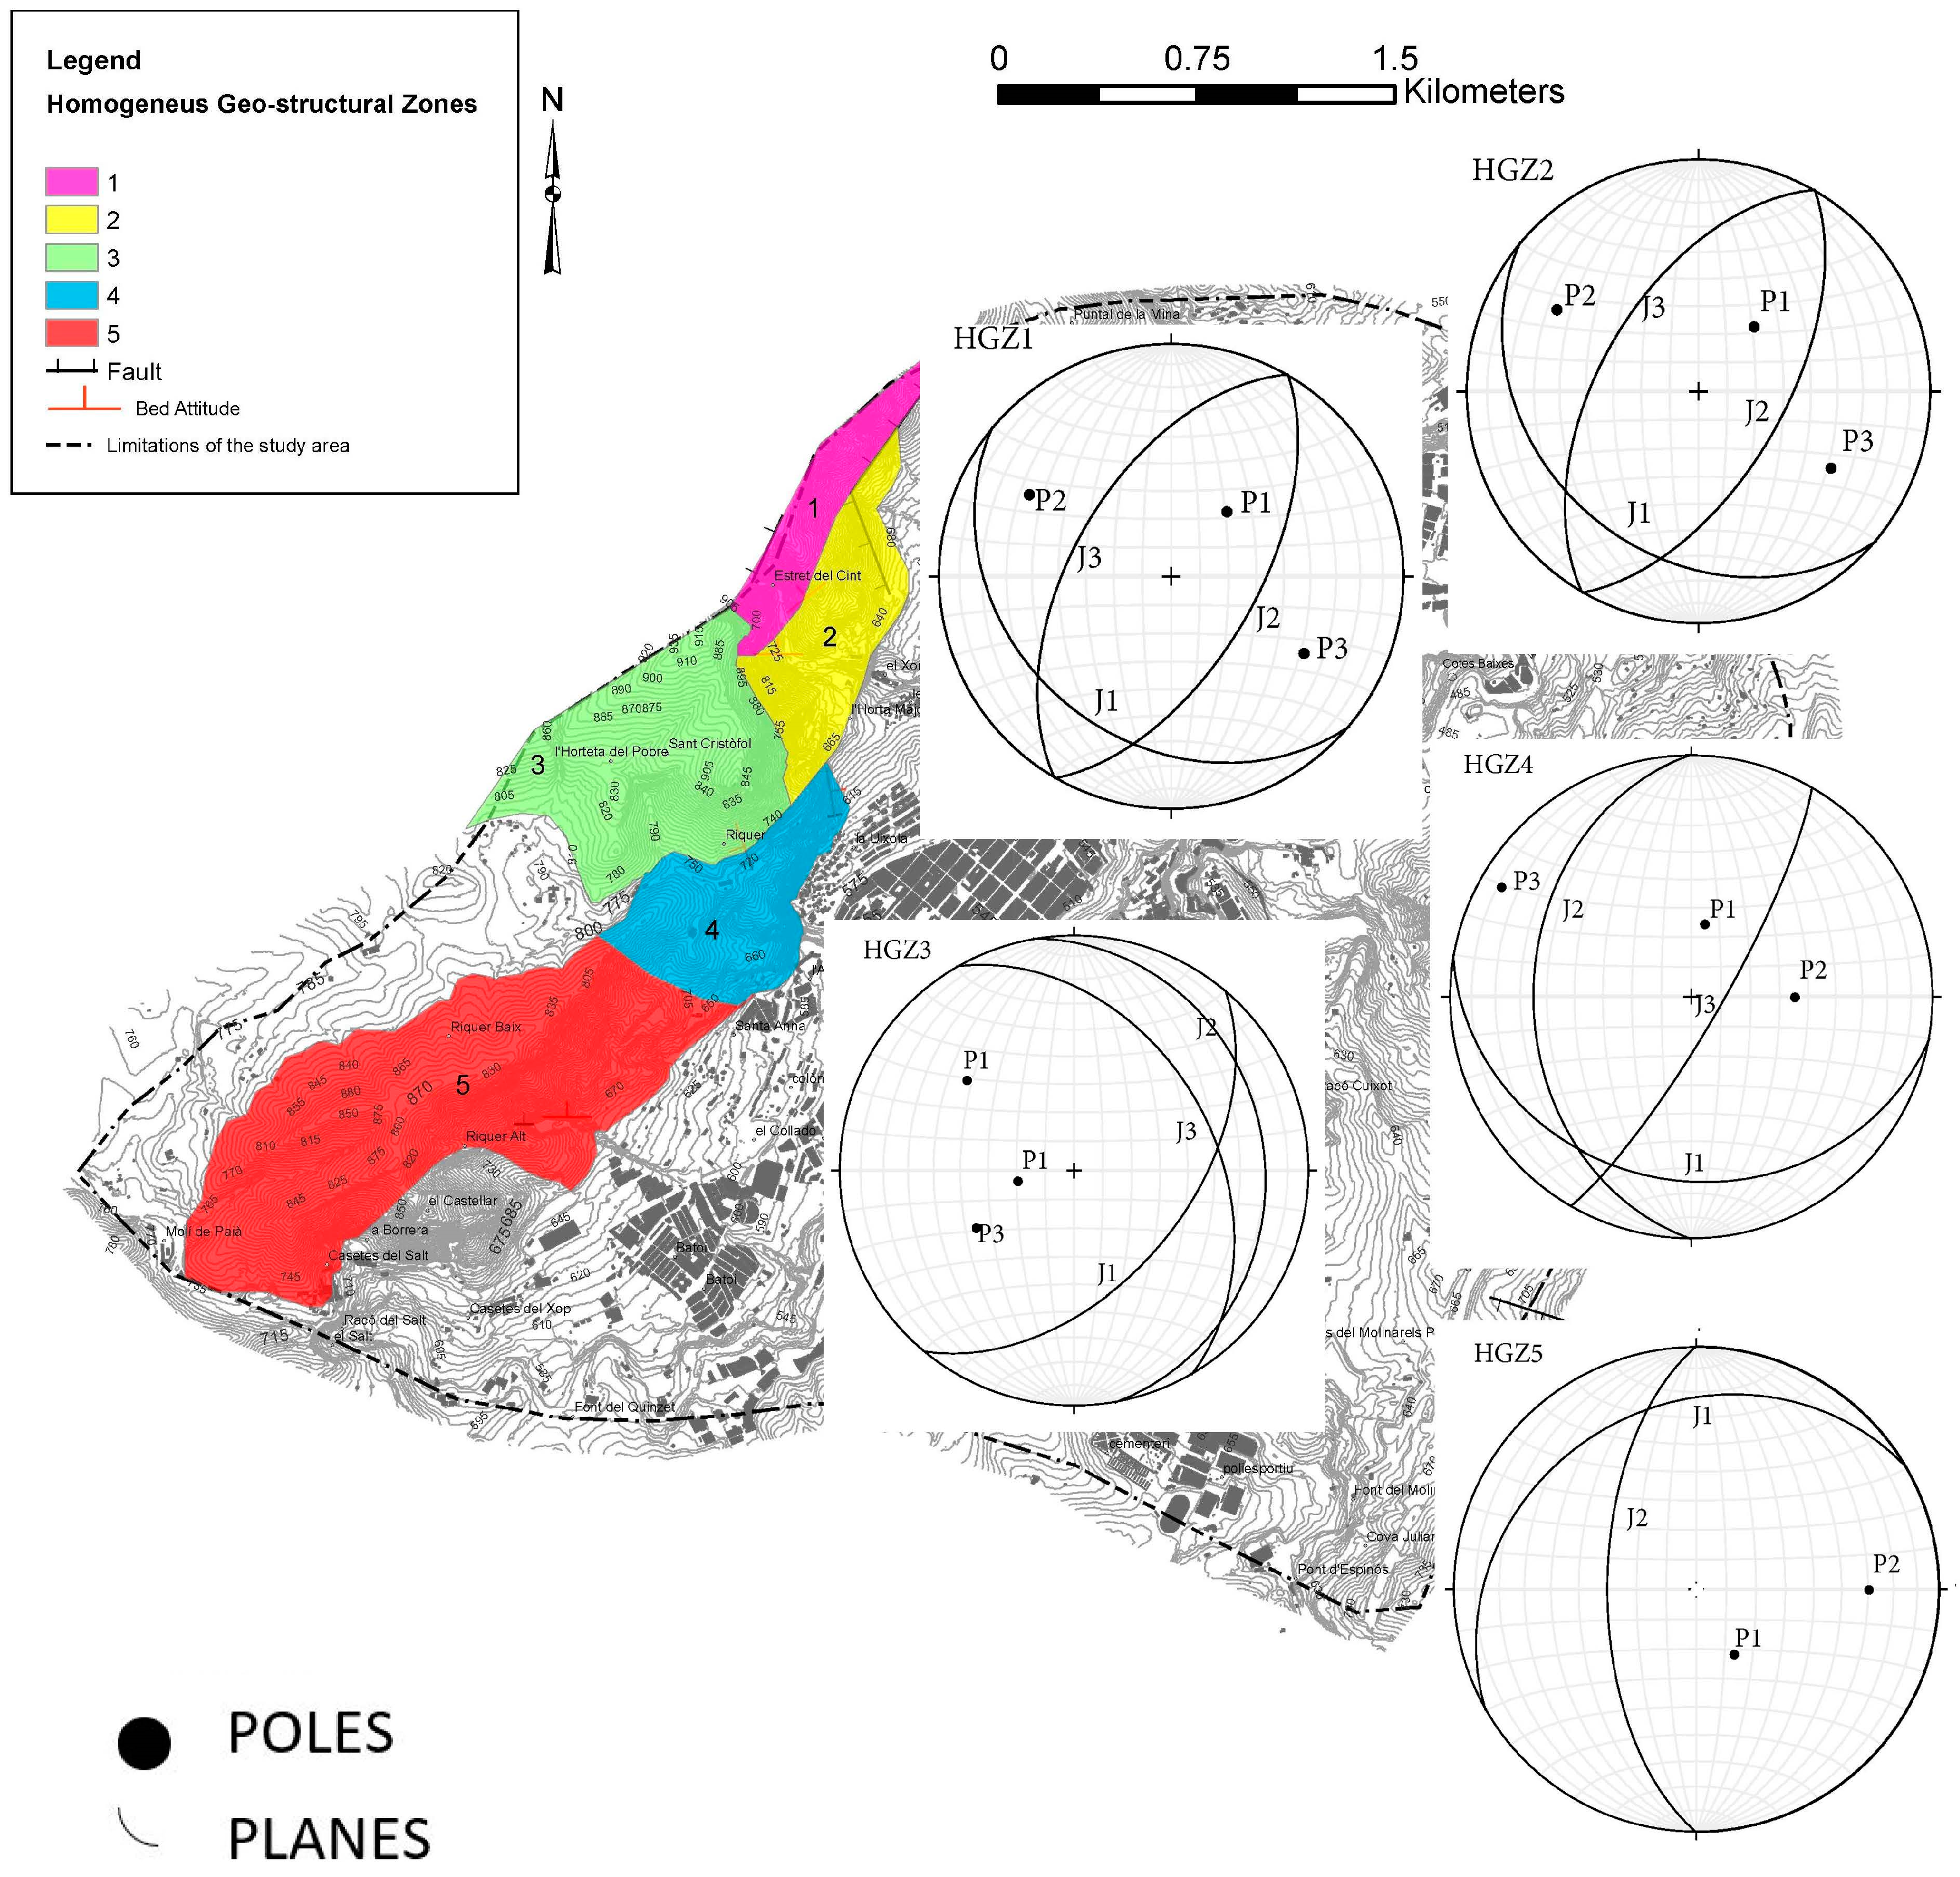
31]. A zonation of the outcropping rock masses in terms of orientation and spacing of main joint sets is required for this analysis.
The attribution of geo-structural parameters over the whole territory (continuous information) starting from punctual survey sites (discrete information) is a challenging issue since too many variables influence the distribution of such parameters. Furthermore, it has to be considered that the clustered location of survey sites, in its turn related to the availability and accessibility of significant outcrops, could greatly limit the reliability and accuracy of a rigorous geostatistical approach. For these reasons an approach based on expert judgment, i.e., the capacity of a geologist to assess to what extent a punctual datum can be attributed to an area, was adopted.
The so derived synthethic stereplots were analyzed to catch the relationships with the morpho-structural setting; the related synthethic information were then attributed to zones considered homogeneous in terms of morphological, lithological and structural features, thus partitioning the study area in the HGZ that are shown in Figure 5.
Based on geomechanical data assigned to each HGZ, tests to check the compatibility of different failure mechanisms were carried out according to Markland tests [32] through a GIS procedure. More specifically the kinematic compatibility to wedge and planar sliding as well as to toppling was verified by applying a conditional analysis of the discontinuity data with respect to slope angle and slope aspect of each single cell pertaining to a given HGZ. This procedure consists in a cell-by-cell analysis on a 5 m × 5 m square mesh grid, where data referred to dip and dip-direction of discontinuity sets are extrapolated from the corresponding HGZ.
The Markland tests [32] performed only assess the kinematic compatibility of the main discontinuity set (for the planar sliding mechanism) or intersection of sets (for wedge sliding mechanism) or release surface (for toppling mechanism). A further filter is then required to verify if other discontinuity sets acting as lateral and/or rear release surfaces are present: if all these necessary conditions in the HGZ are present, the mapping units that resulted kinematically compatible by the Markland tests are finally considered as potentially unstable.
By considering the average spacing and the orientation of discontinuity sets which isolate potentially unstable rock blocks, representative volumes and shapes can be attributed to each mapping unit to be analyzed in the subsequent step (Slope Stability).
In the Alcoy case study, 6 typical blocks for planar sliding, wedge sliding and toppling have been identified at all, nevertheless, among these blocks the ones having volumes lower than 0.03 m3 were excluded for slope stability analyses (Figure 6).

4.2. First Time Earth-Slides

First-time earth-slides were accounted for by analyzing proneness to soil sliding involving slope covers. At this aim, an engineering-geological survey was carried out, supported by a GIS dataset. The mapping unit selected for assessing the susceptibility to shallow earth-slides is represented by the Unique Condition Units (UCU), which represents areas that are homogeneous in terms of slope, aspect, lithology and thickness of the outcropping soil covers. At this aim the study area was firstly divided in small basins by performing GIS-based hydrological analyses consisting in the automated extraction of watersheds from the local DEM. This zoning was then overlaid and intersected with other relevant thematic layers and zoning such as slope and aspect classes, polygons representing outcrops of colluvia and debris in their turn differentiated on the basis of the soil thickness. UCU are then the result of such an intersection of geo-thematic data. For the Alcoy case study 35 UCU were identified (Figure 7), having a total extension of 0.18 km2; the 60% of these UCU correspond to a slope dip ranging from 20° to 40°, the 14% from 40° to 50°, while the remnant percentage is referred to slope dip lower than 20°.
The susceptibility analysis was performed according to the Frequency Ratio (FR) method [33] which measures the reliability of the causative relation between given predisposing factors and landslide processes. A FR value is computed for each class of each considered factor as the ratio of proportion of landslide in a factor class to proportion of area of the same class. Such a relation is significant if the FR value is higher than 1. By summing on a cell-by-cell basis all the Frequency Ratios attributed to each class of all the considered factors, a Landslide Susceptibility Index (LSI) can be defined for each mapping unit.
As it results from this analysis, “lithology” and “aspect” factors do not represent discriminating factors and they were, therefore, neglected for following analysis. More in particular, while the “lithology” factor is too homogeneous the aspect cannot be regarded as a discriminant one since all the derived classes show quite similar FR values.
As a consequence, the “slope” factor resulted the only relevant one, so a LSI threshold of 1 has been chosen to select the potentially unstable UCU.

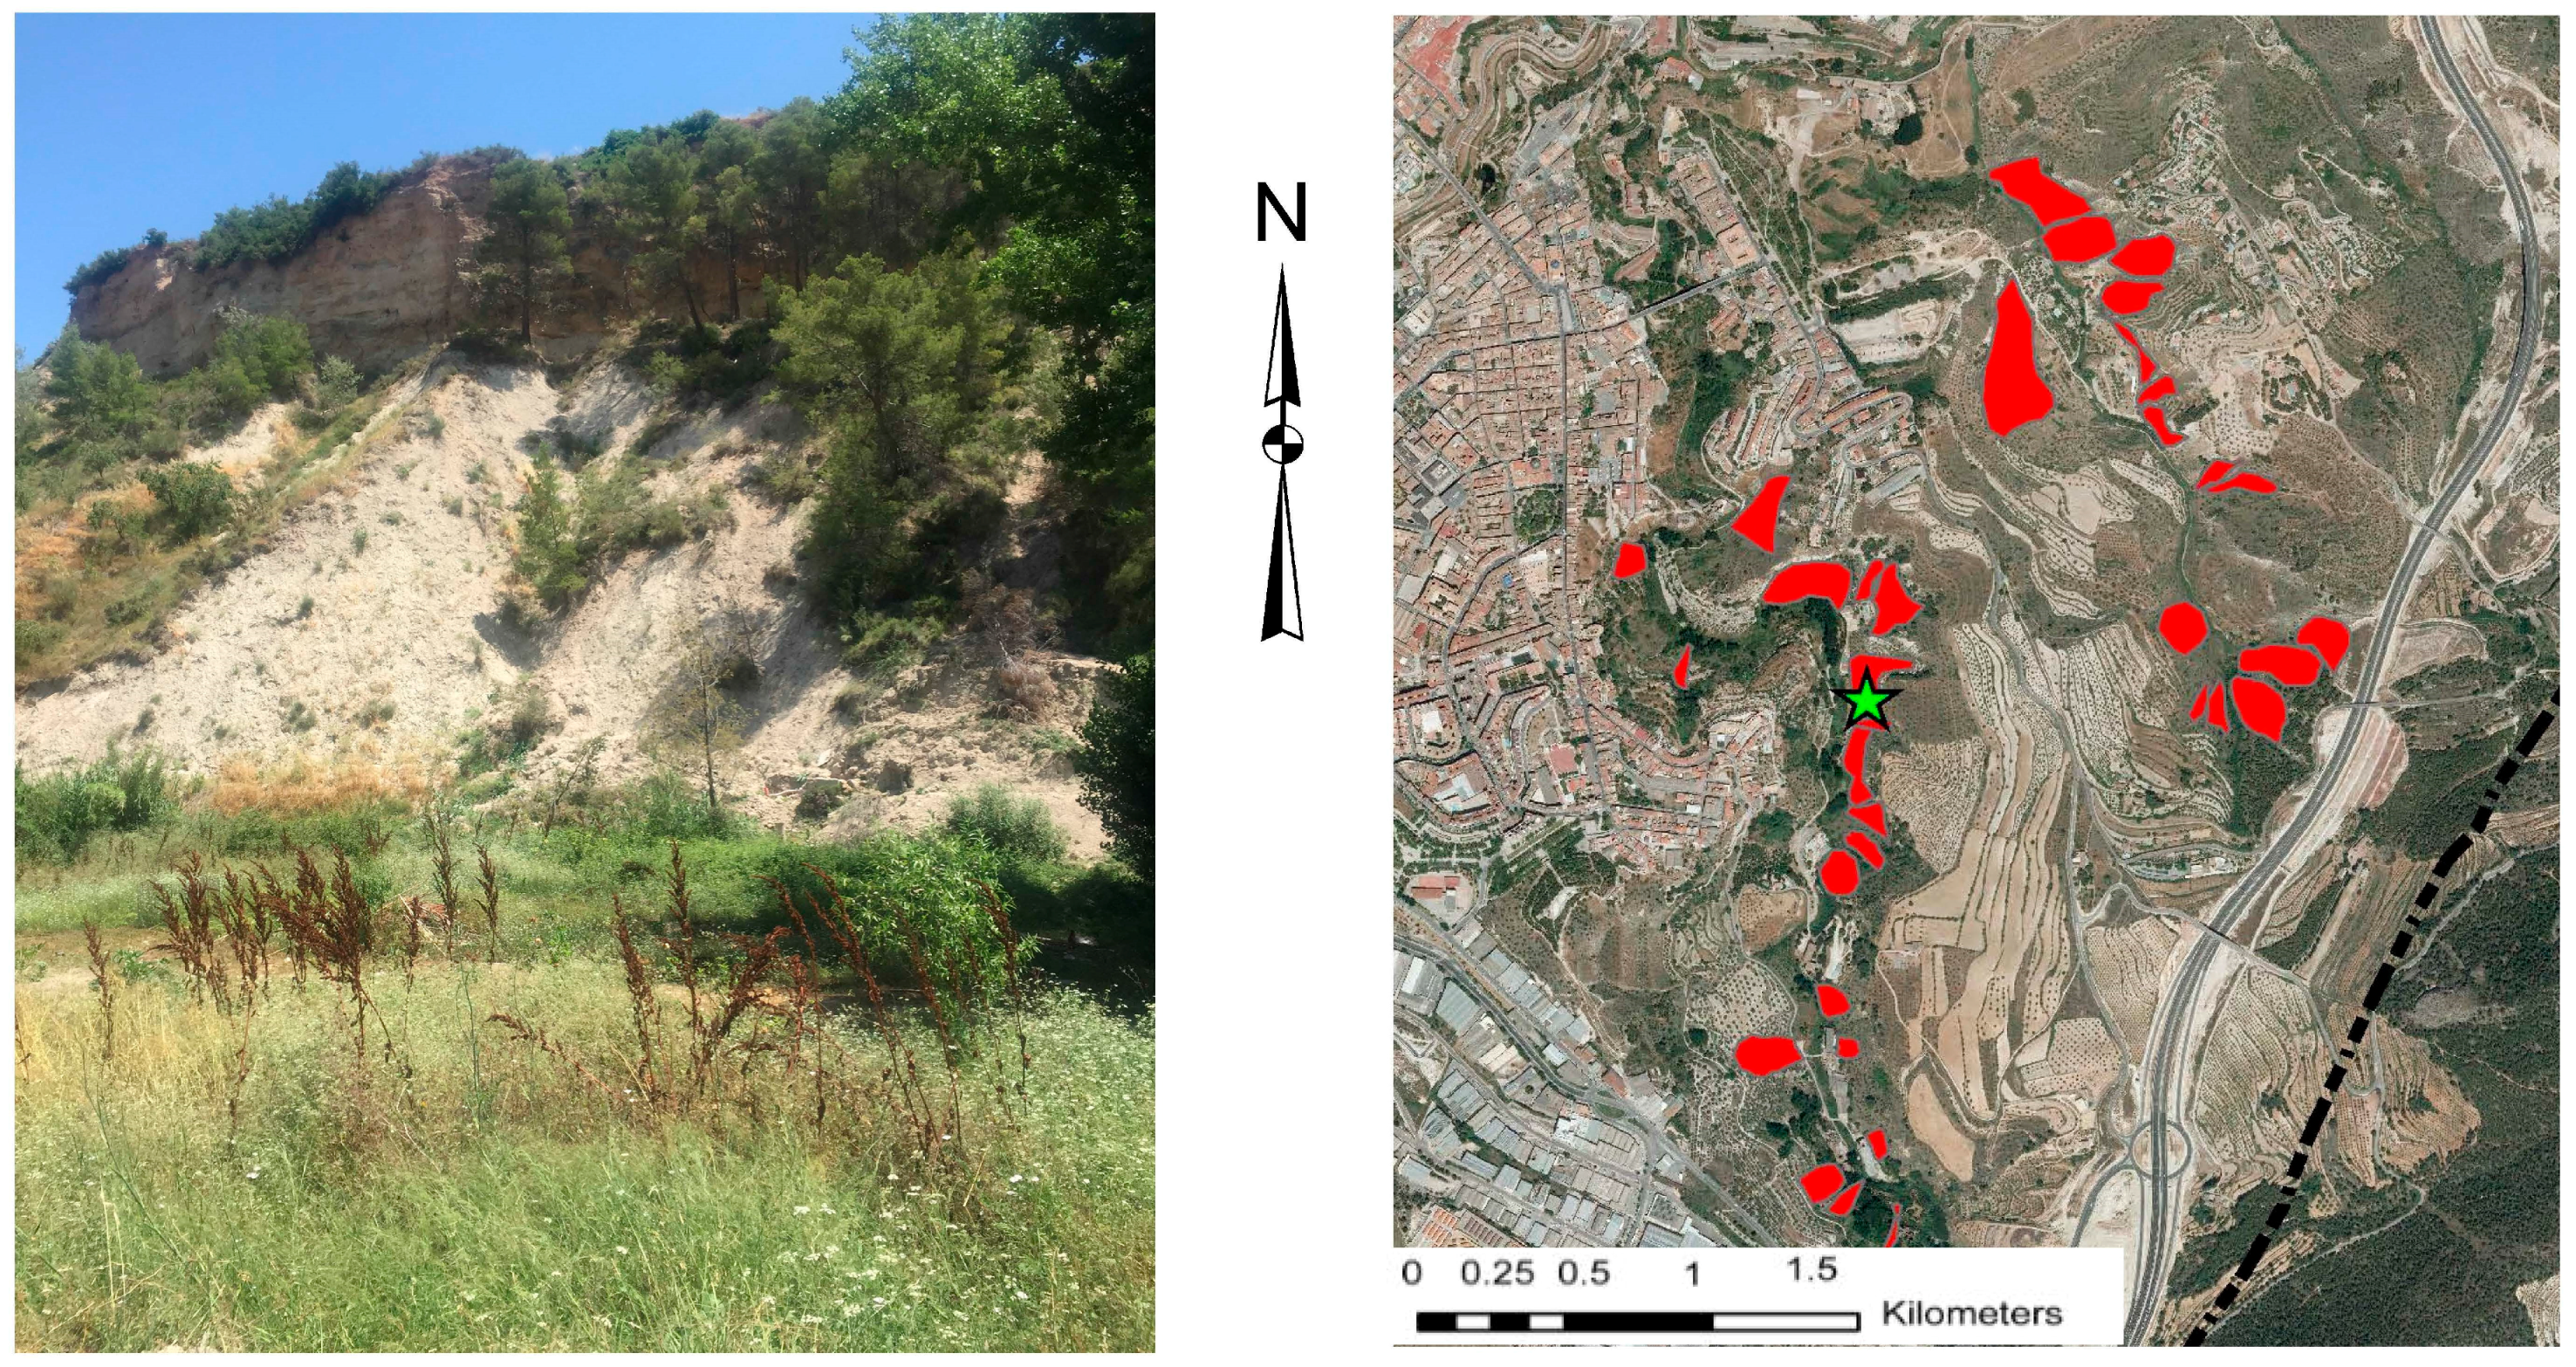
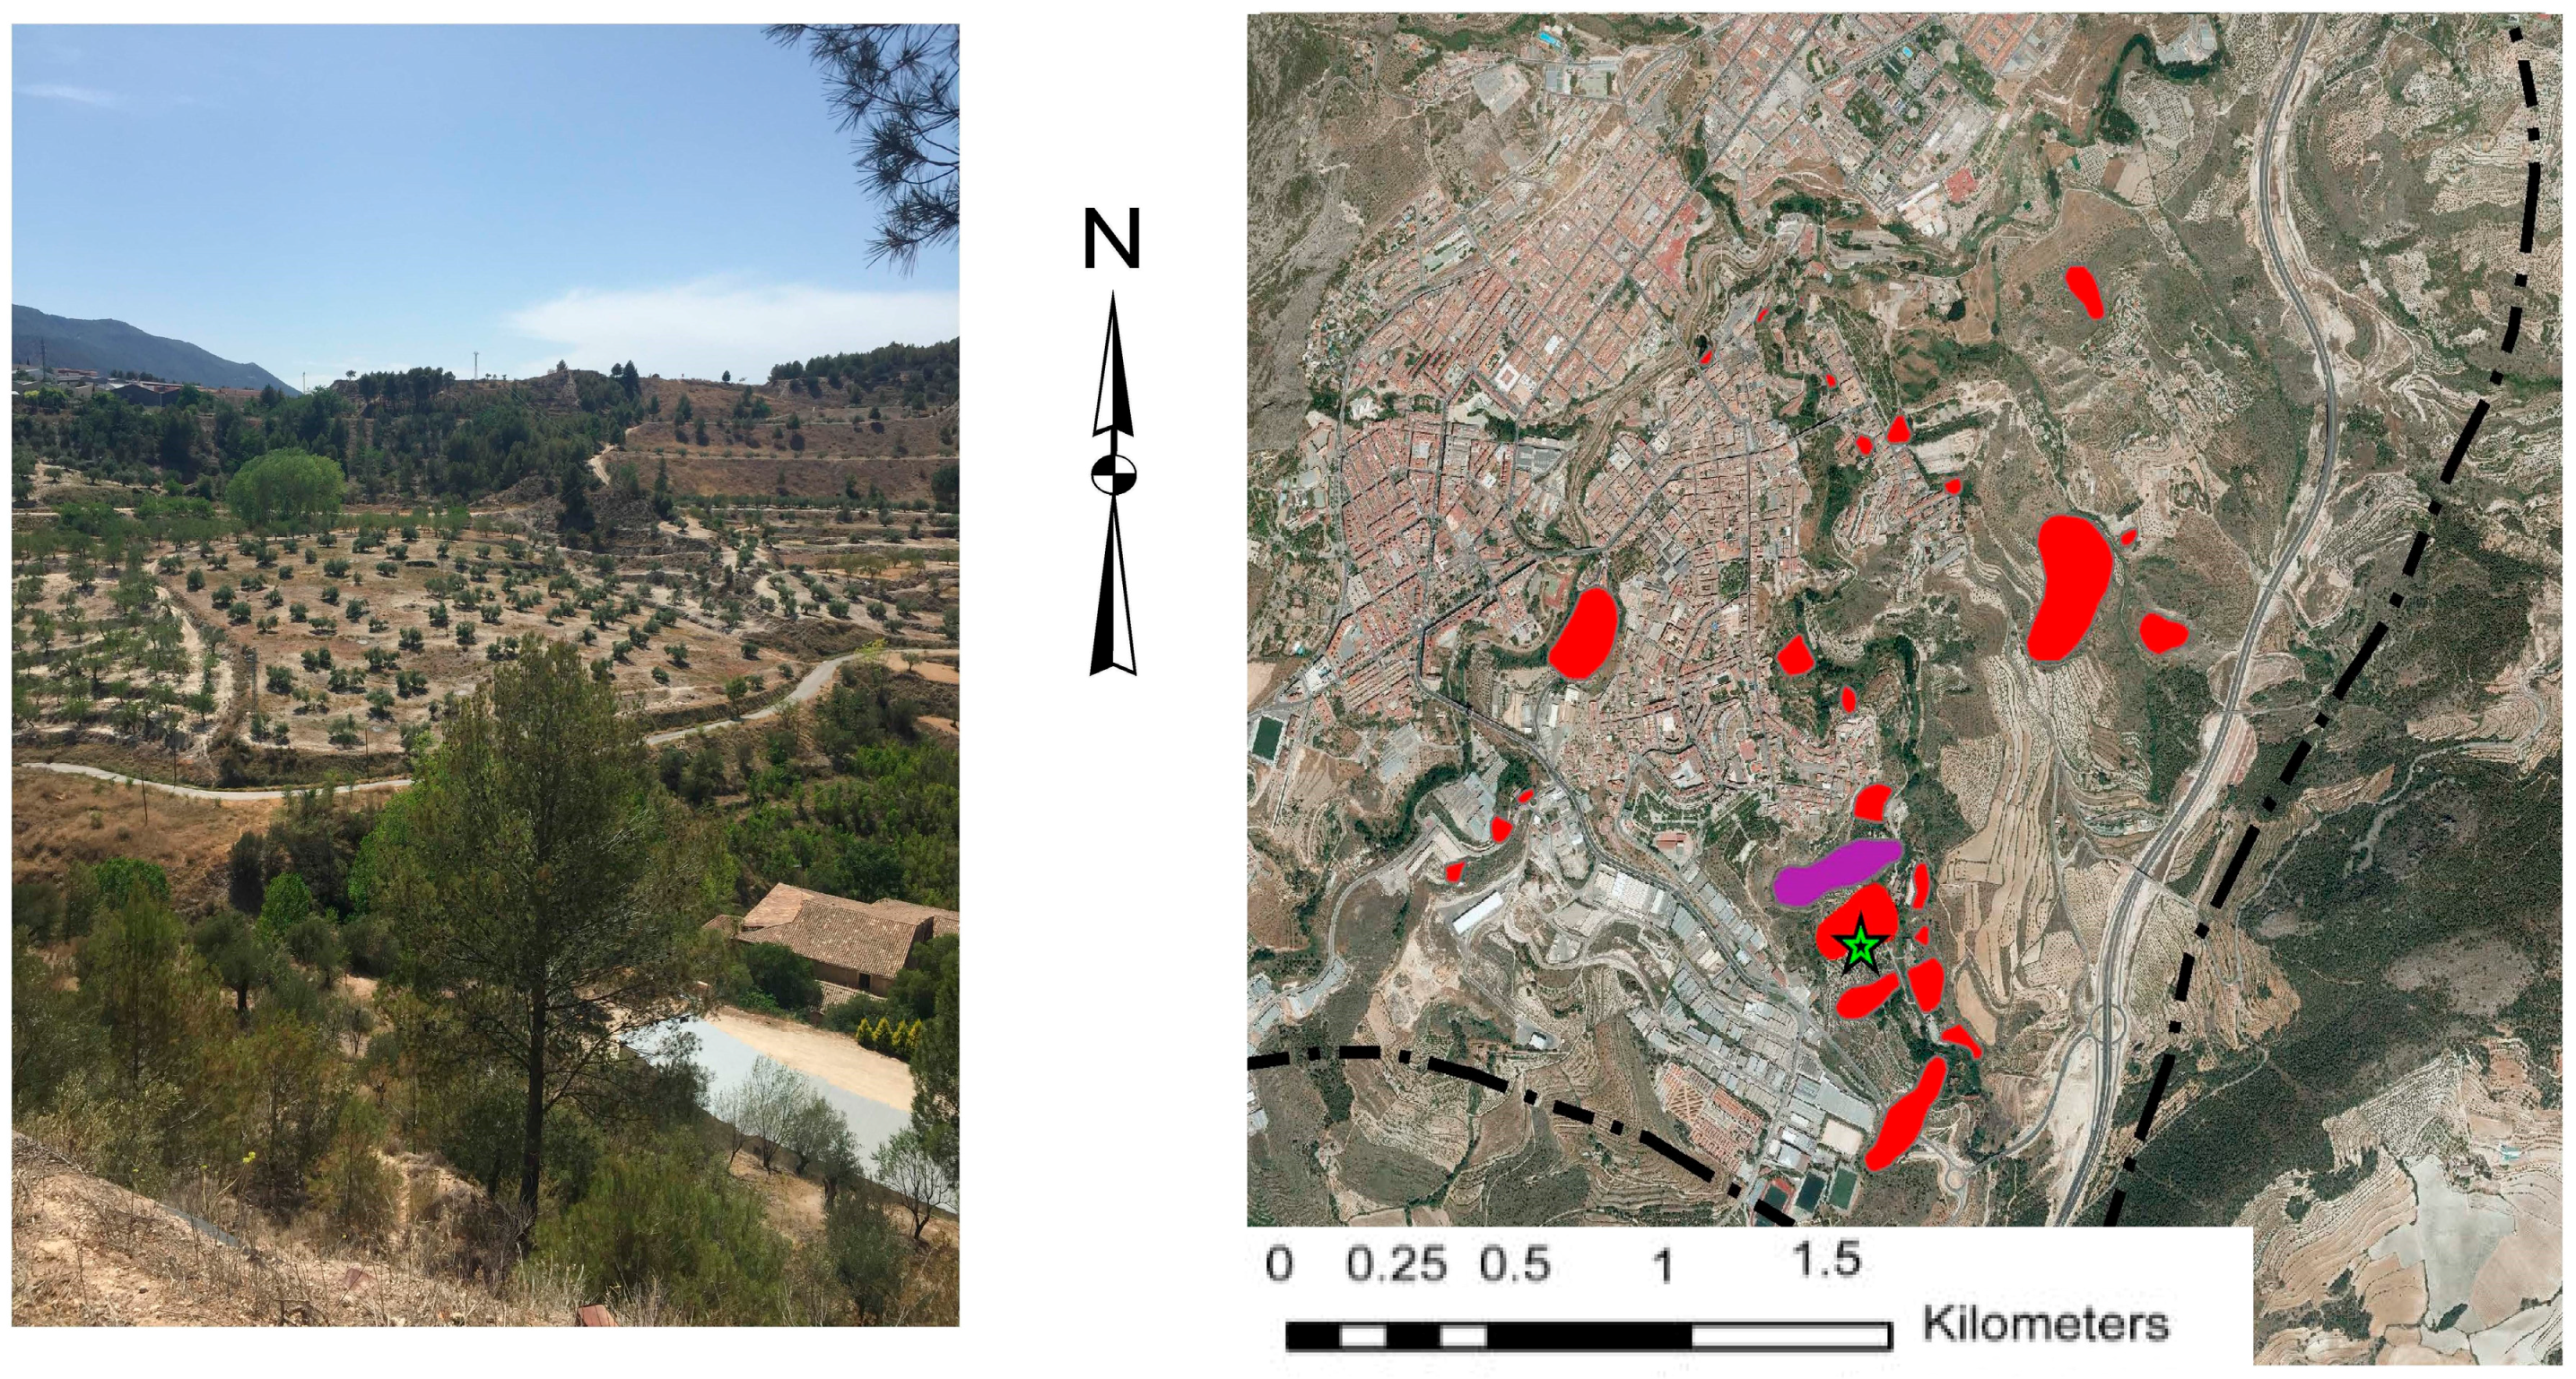
4.3. Already Exsisting Landslides

Already existing landslides were inventoried in the Alcoy municipality area from literature data, aerial photo analysis, and online catalogs as well by field surveys [23,24,34]. The surveyed landslides were mapped (Figure 8), with different failure mechanisms for a total area of 0.92 km2.
Among the 27 inventoried landslides, 11 show a rotational kinematic while 16 show a translational kinematic; all the landslides involve the Miocene marls and clays. The geomechanical parameters used for the stability analyses are summarized in Table 1.

5. PARSIFAL Step 2: Slope Stability (SS)

Slope stability analyses were carried out to derive critical pseudostatic acceleration (ay), suitable for computing co-seismic displacements following the Newmark’s method [22]. At this aim, sensitivity analyses were performed by varying both saturation conditions and pseudostatic actions. Different failure models were assumed for rock slides and toppling, first-time earth-slide and already existing landslides.
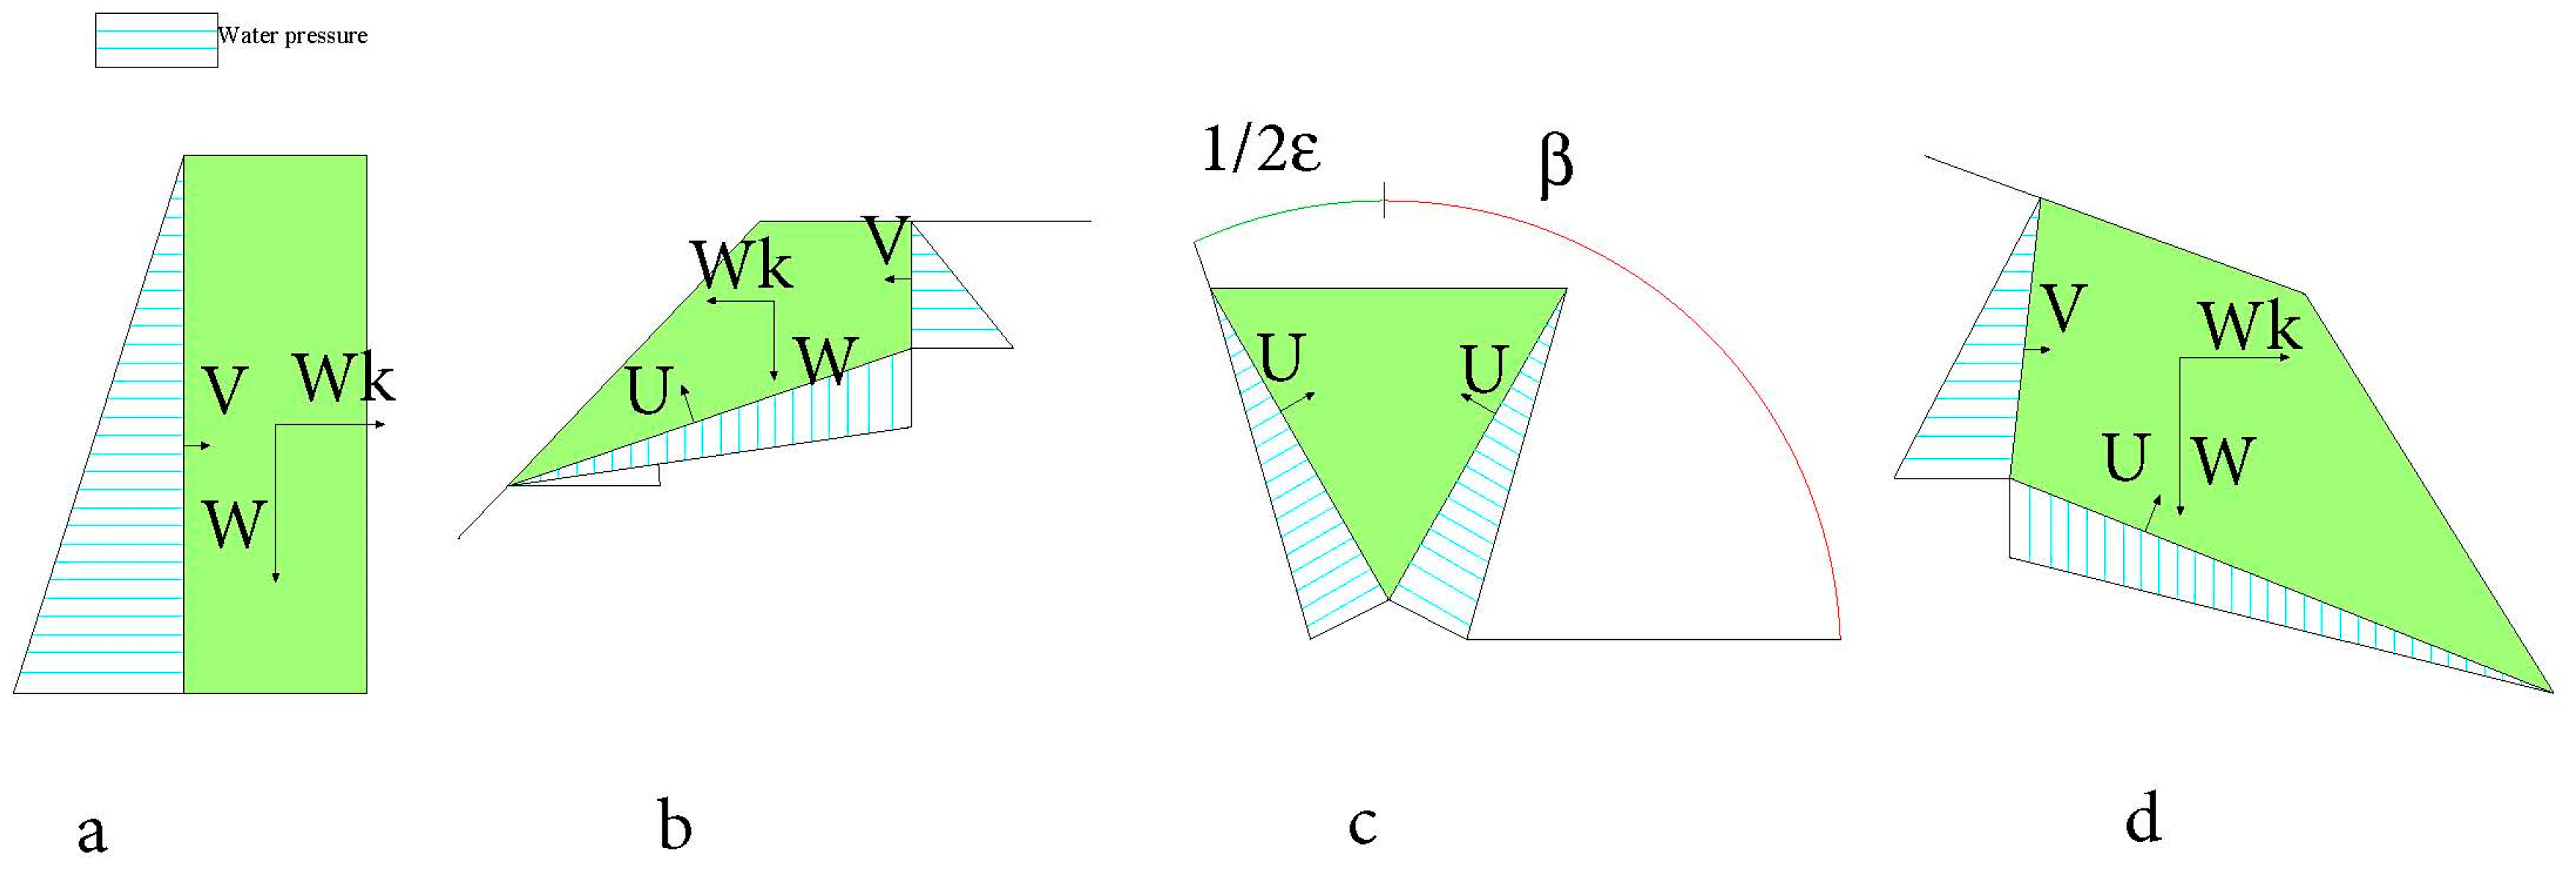
The slope stability of the identified rock blocks was carried out by a pseudostatic approach performed according to conventional computational methods based on Global Limit Equilibrium (GLE) approach [35]. The yielding acceleration coefficients, ay, were derived by a sensitivity analysis performed for each rock block and by assuming joint saturation conditions (expressed by the ratio between wet and total height, hw/h) that range from dry to completely wet. First-time earth-slides were analyzed according to a shallow sliding model represented by infinite slope conditions and assuming a pseudostatic seismic action for different saturation conditions of the earth mass to compute ay.
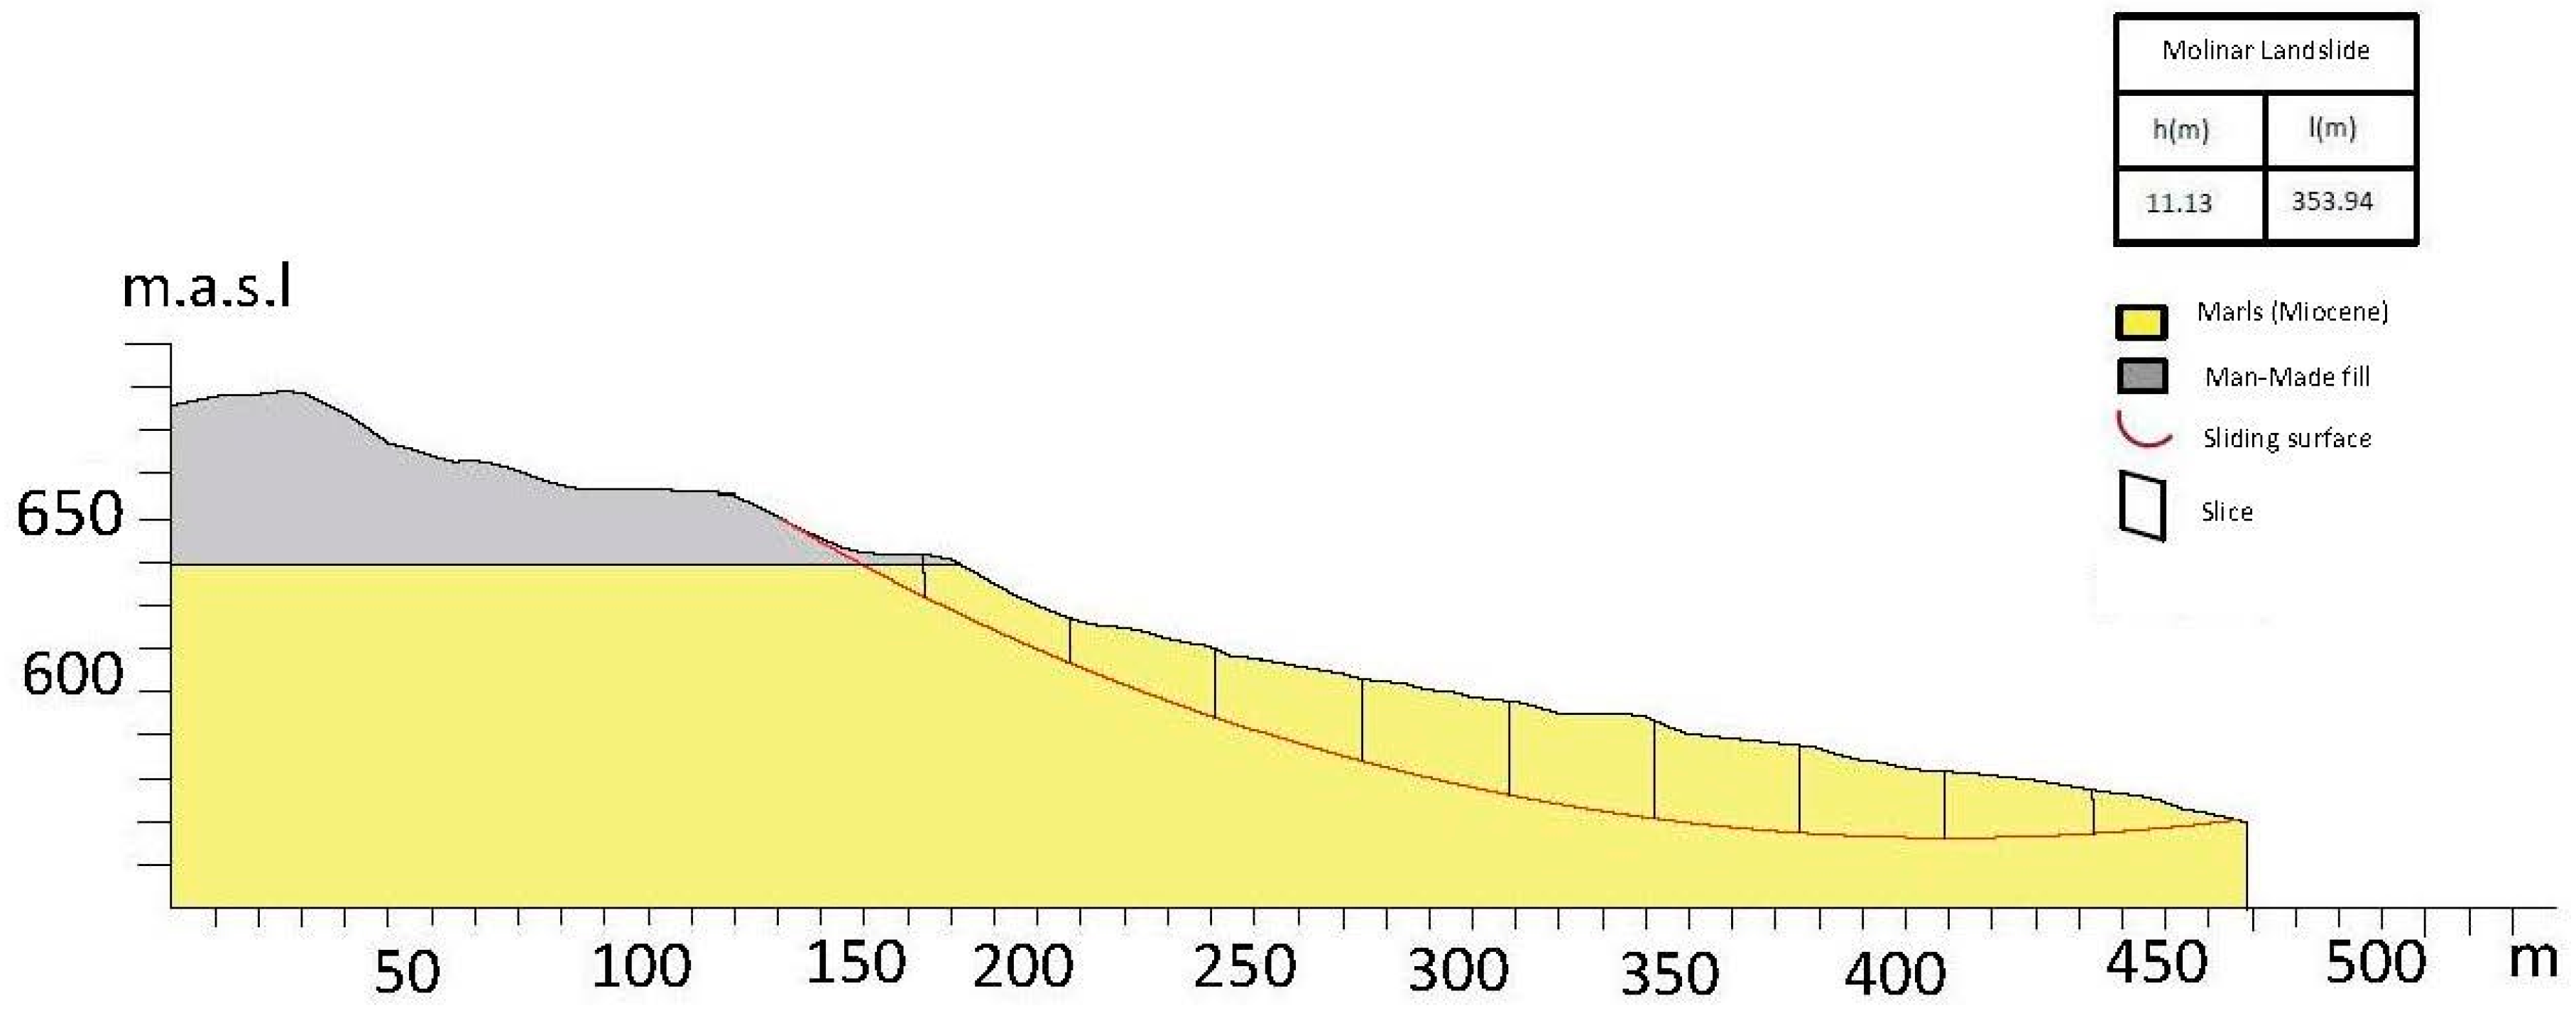
For the already existing landslides, engineering-geological cross-sections were obtained to derive geometrical features of the landslide mass (Figure 9) and attributing geotechnical properties to perform slope stability analyses.
The inventoried landslides were classified by considering morphological and geometrical features, according to Dewitte and Demoulin [36]: Janbu method [37] was applied for slides characterized by 00.1 ≤ H/L ≤ 0.1, i.e., with a mainly translational mechanism; Bishop method [38] was applied for a roto-translational mechanism (where H/L > 0.1). Also in this case, a pseudostatic seismic action was assumed at different saturation conditions expressed by the Bishop coefficient for water pressure distribution (ru) to compute the ay coefficient.
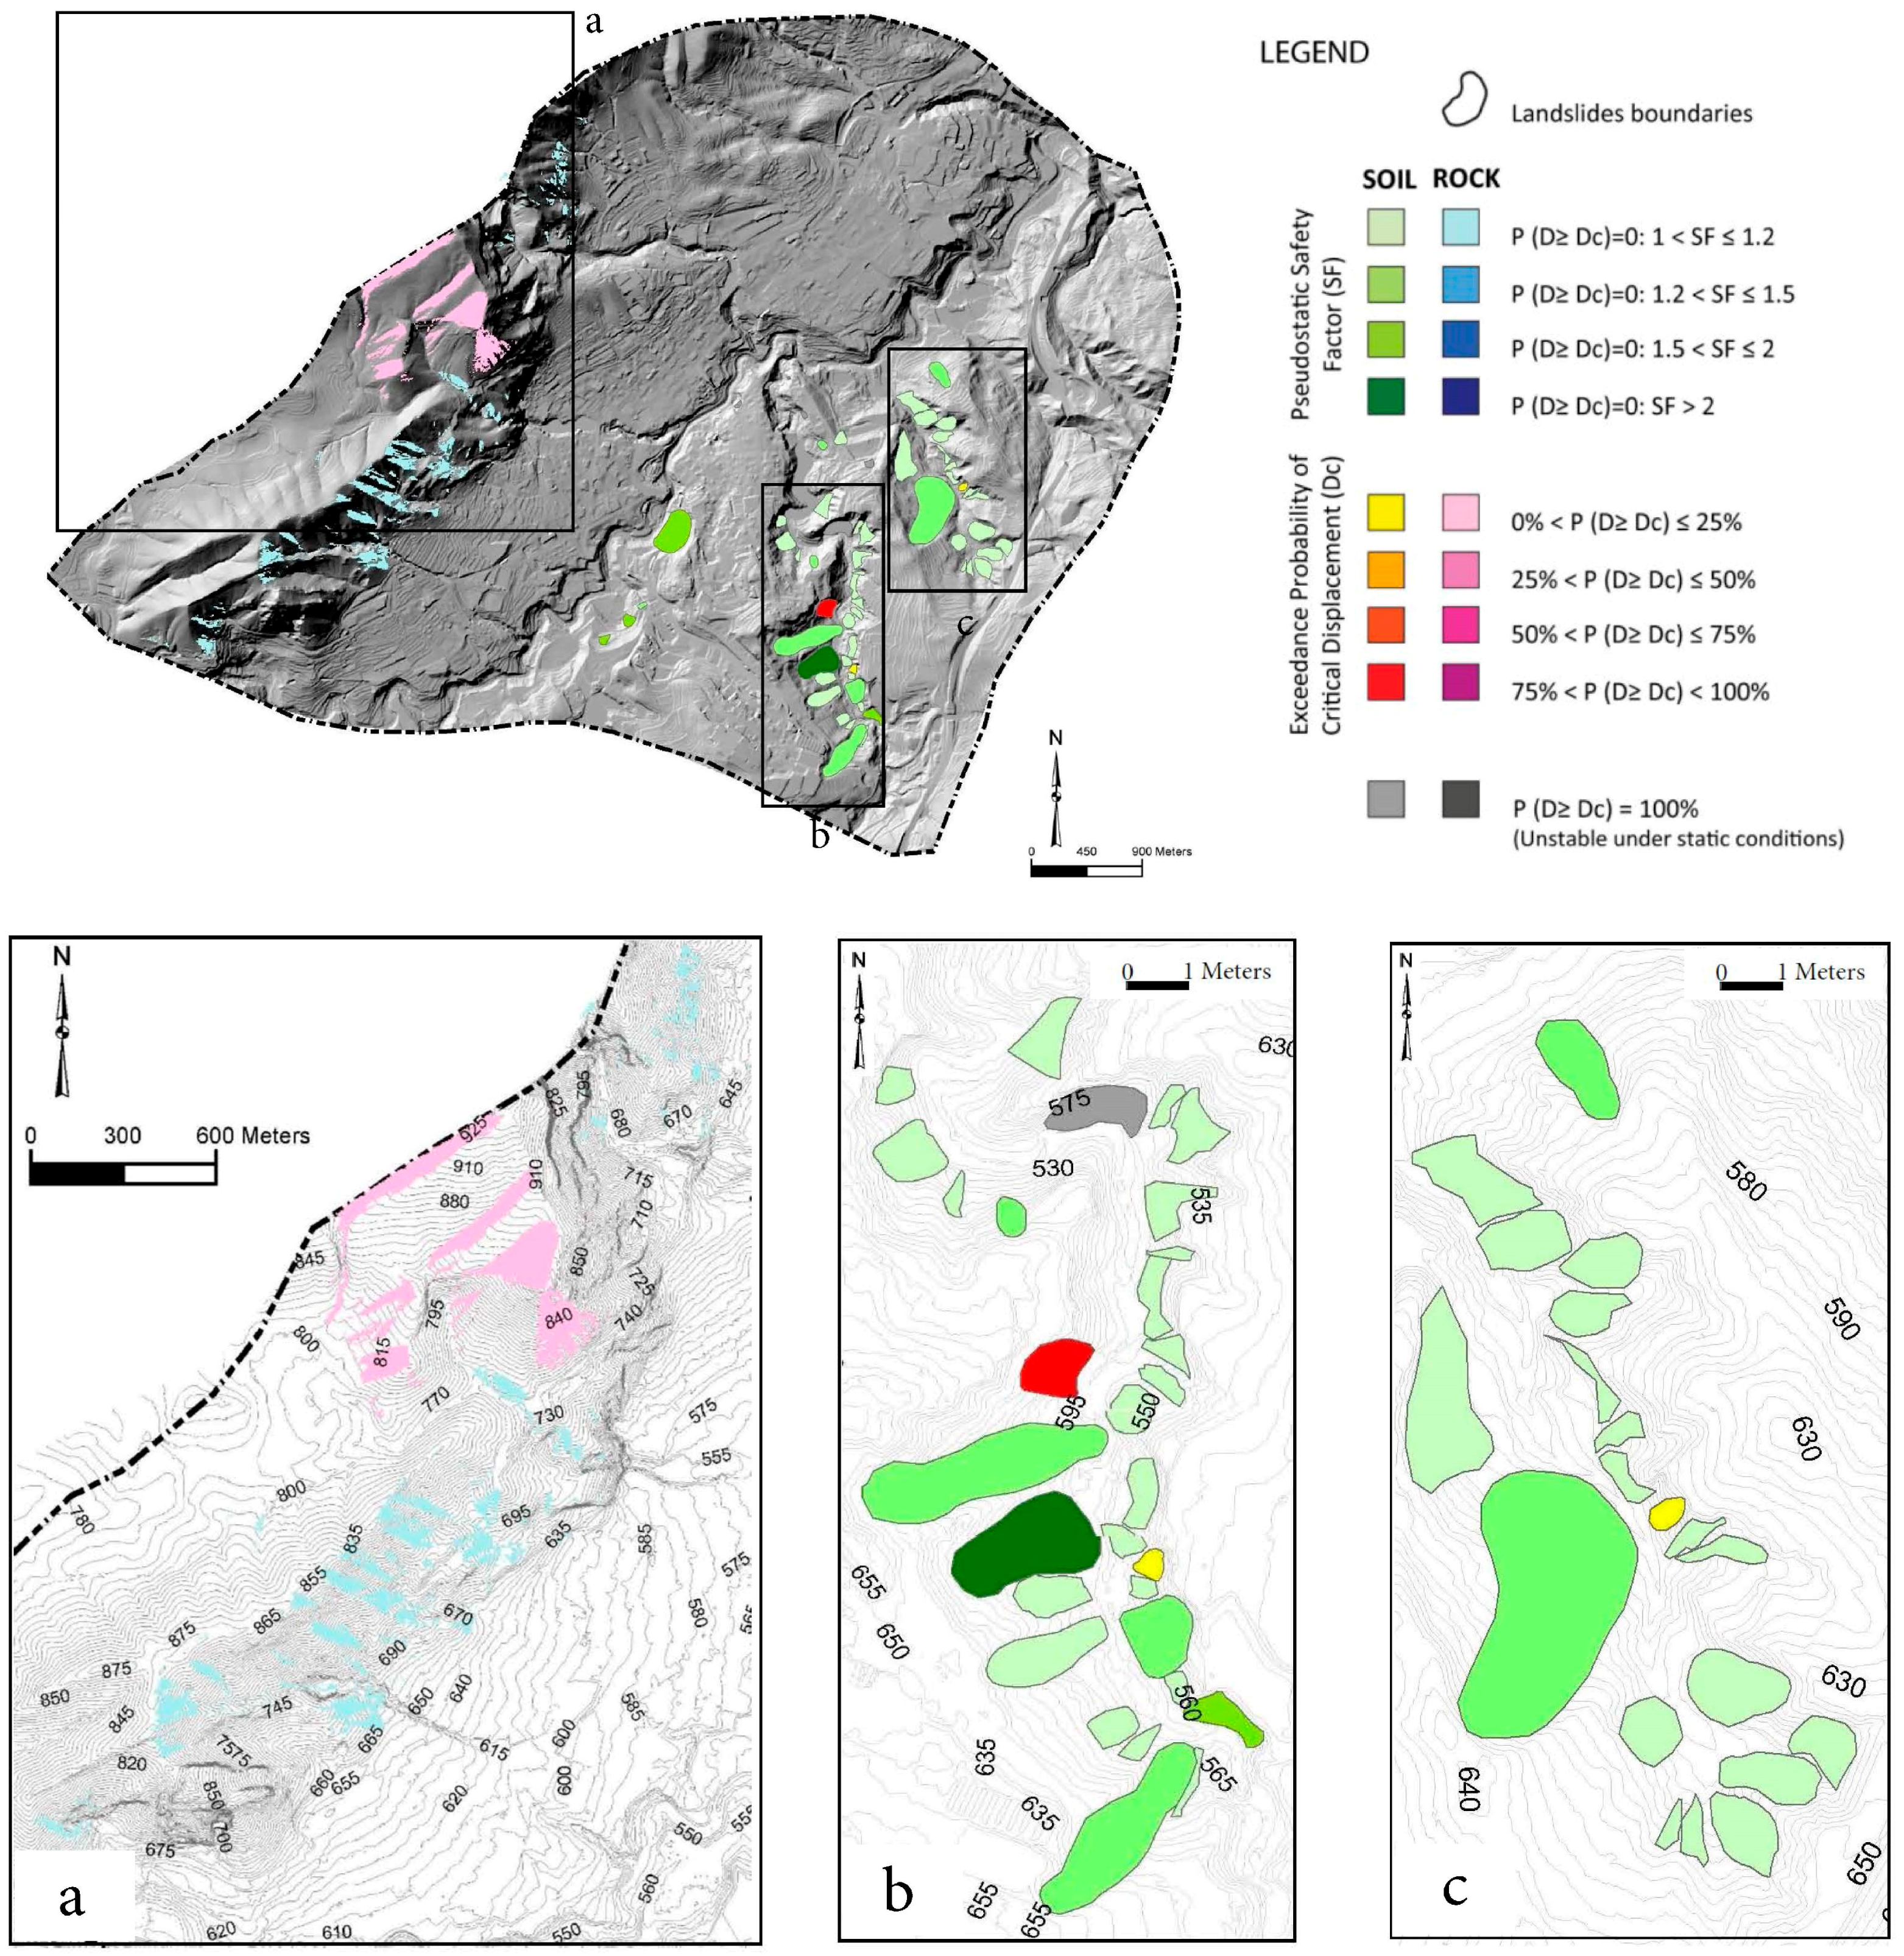
The degree of mobility is expressed by the exceedance probability of a critical displacement (P[D ≥ Dc|a(t), ay]) responsible of the slope collapse, herein assumed to be 10 cm for earth slides and 5 cm for rockslides [4,20]. The specific values considered for the slope failure threshold could be of slightly different [12] and this could obviously condition the results, but only in terms of computed (P[D ≥ Dc|a(t), ay]) values, i.e., not changing the severity ranking of the expected slope failures for each considered scenario. At this regard, it is worth stressing that the PARSIFAL approach mainly aims at restituting a synthetic mapping, suitable to define a priority ranking for planning more detailed studies and/or engineering designs; therefore, the computed P[D ≥ Dc|a(t), a
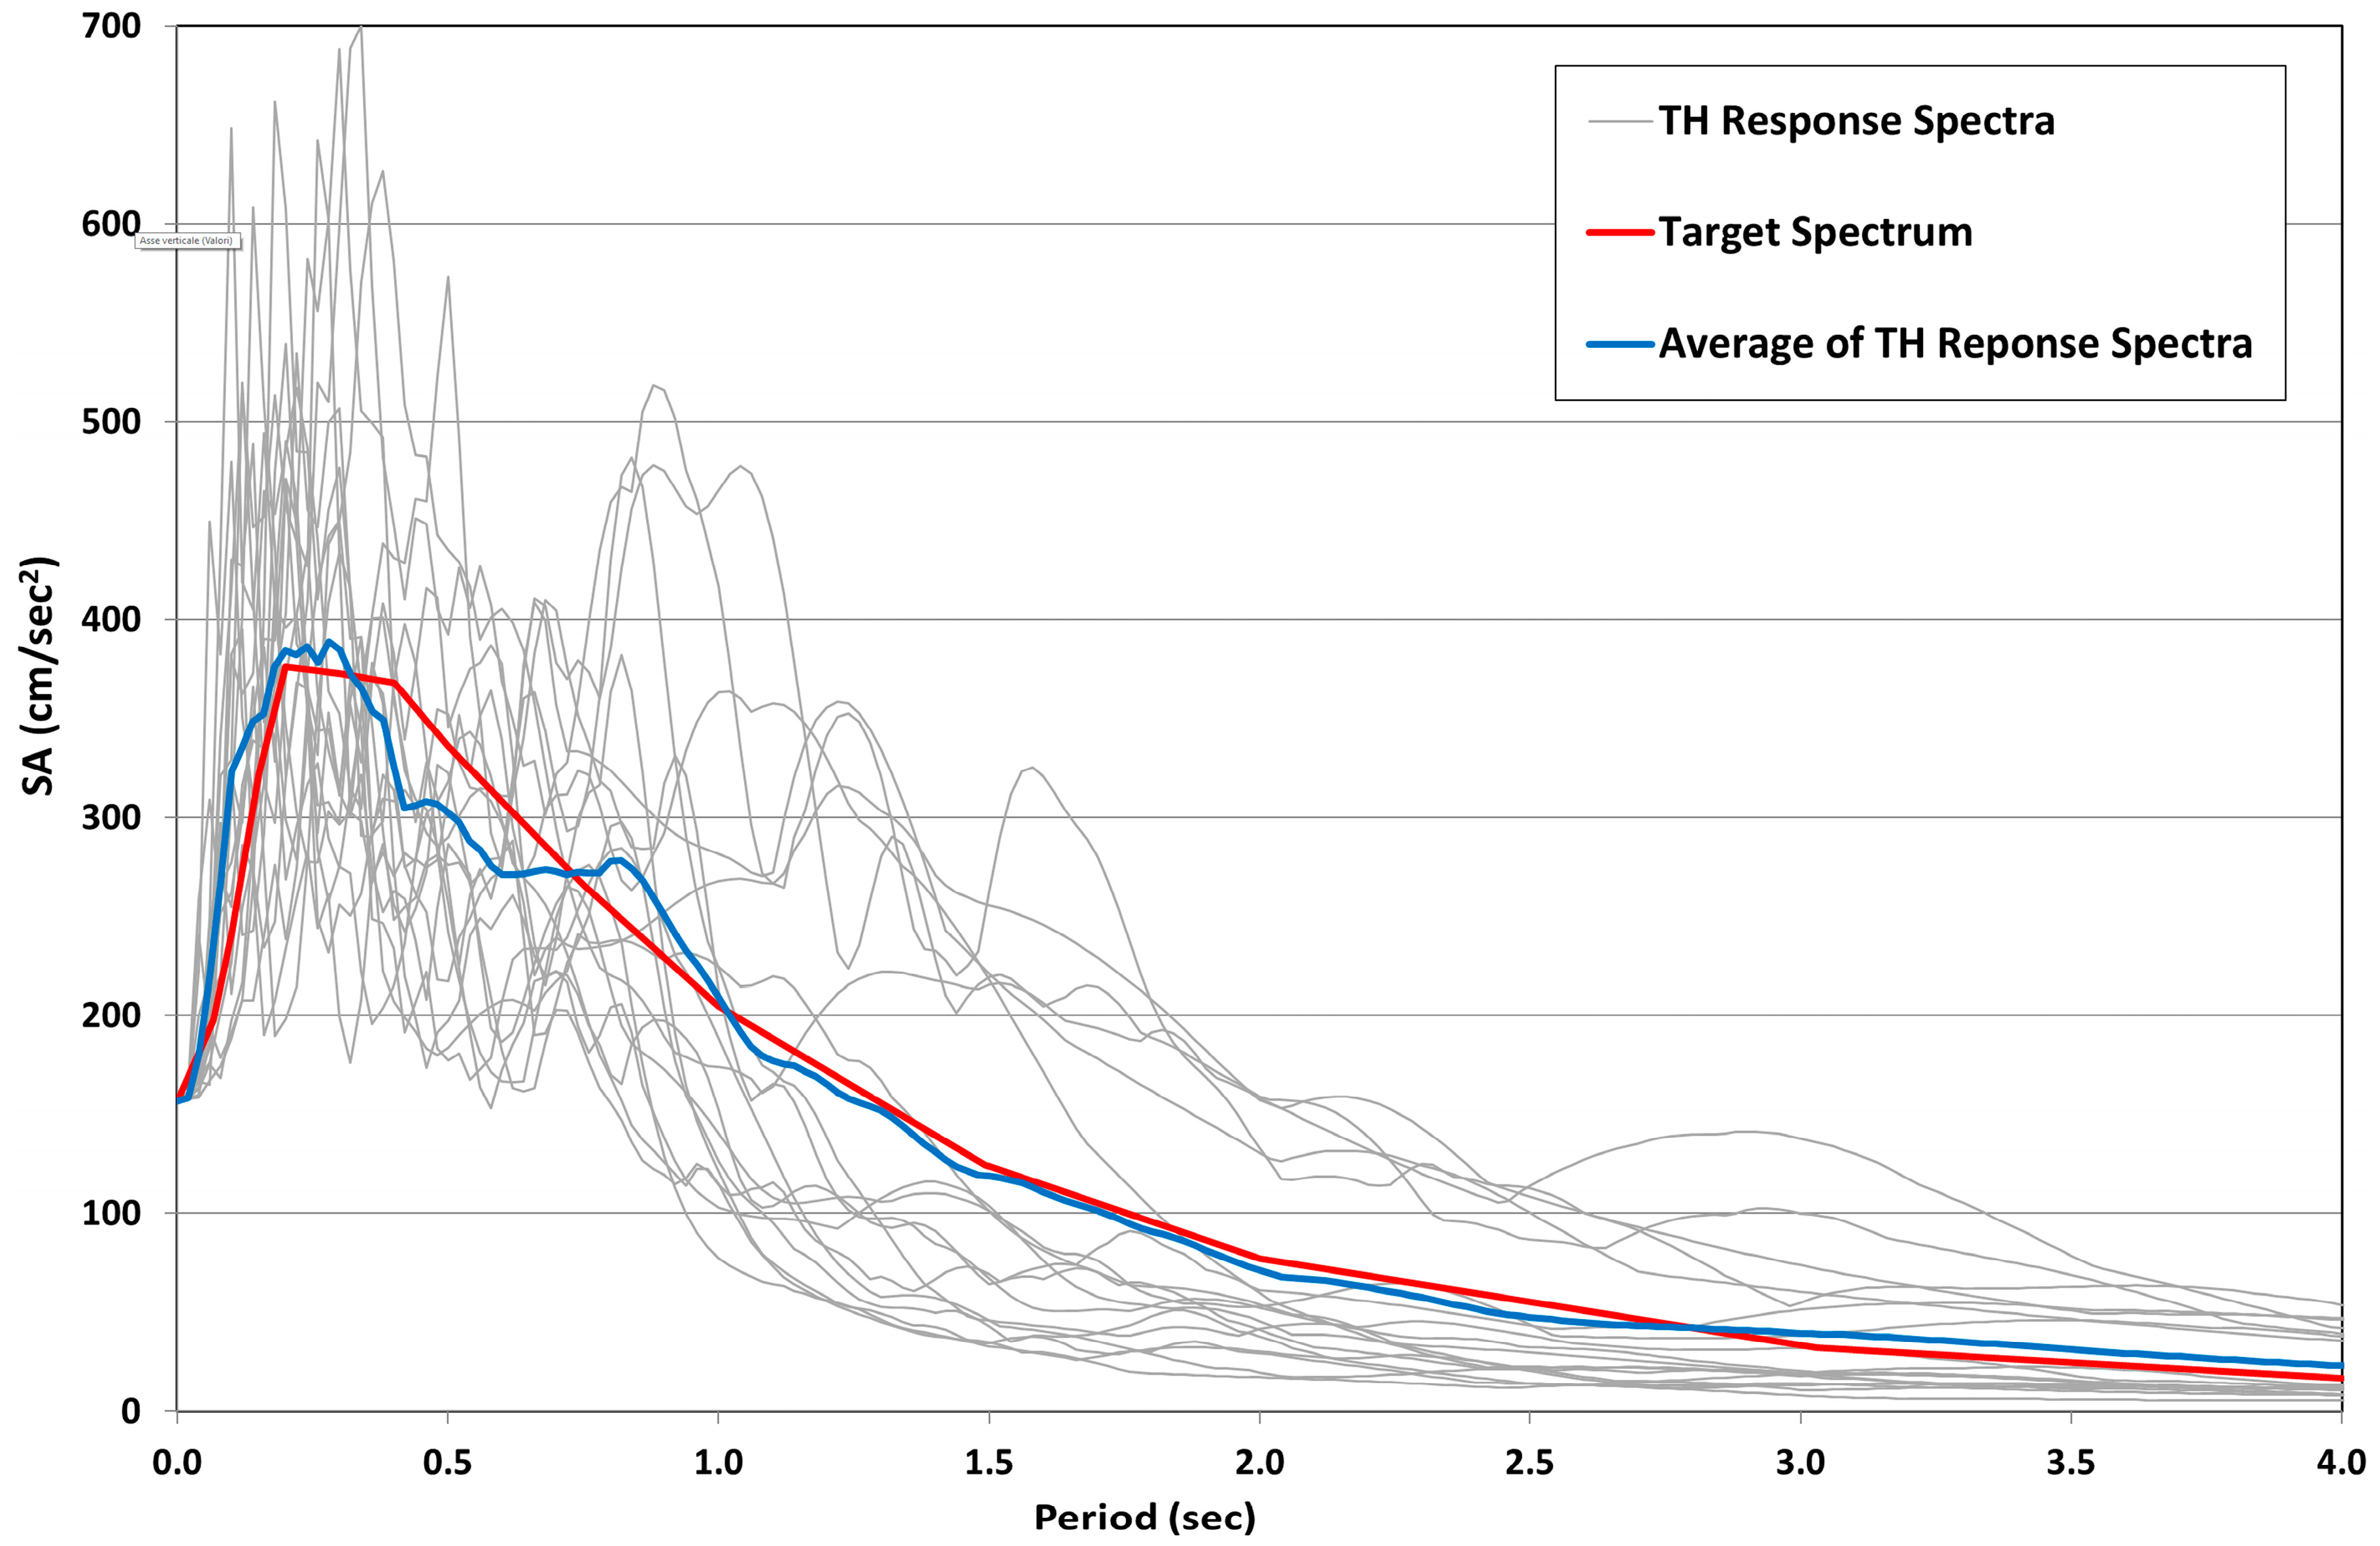
y] values assume a secondary role. The distribution of co-seismic displacements from which probabilities are computed, derives from the application of a set of real accelerograms matching, for each site or zone, the proper seismic hazard scenario according to the selection criteria described in the following sections.

6. PARSIFAL Step 3: Resulting Scenarios (RS)

6.1. Probabilistic Seismic Hazard

The seismic inputs to be used in the Newmark’s analysis were selected after: (1) defining the local seismic hazard through the identification of seismogenic sources responsible of most severe earthquakes that struck the study area and the relative seismological parameters; (2) evaluating the possible level of local ground shaking due to each seismogenetic source by the calculation of response spectra attenuated to the site by the Sabetta and Pugliese [39] attenuation law, their ranking and selection of the most severe as target spectrum (TS); (3) selecting Time Histories (TH) from accelerometric databases queried both in term of seismological parameters and with a spectrum-similarity respect to the TS; scaling the selected TH to the probabilistic PGA calculated for the Alcoy area for a Return Time (RT) of 475 years [34].
The selected seismogenic sources (Figure 10) derive from the QAFI database (Quaternary Active Fault Database of Iberia v_3 edited by the Geological and Mineral Institute of Spain) and correspond to the:
  • Seismogenic source of Alcoy-Cocentaina (E623): characterized by a fault plane of almost 6 km, a transpressive left mechanism and a maximum expected moment magnitude (Mw) equal to 6.2. This fault would be responsible for the 29 August 1547, 2 December 1620 and the 28 July 1941 earthquakes;
  • Seismogenic source of Muro di Alcoy (E622): characterized by a normal dip slip mechanism with a strike of 335; the maximum expected Mw is 6.2 and it was responsible for the 9th May 1947 earthquake;
  • Seismogenic source of Benasau (E624): characterized by a fault plane almost 6 km long, a normal dip slip mechanism and a maximum expected Mw equal to 6.7, responsible for the 9th February 1949 earthquake in Confrides (Alicante).
All the seismogenic sources in the neighborhood of Alcoy are located within a distance of about 10 km. Ranking the response spectra attenuated at the site by the Sabetta and Pugliese [39] attenuation law, although the closest seismogenic source is Alcoy-Cocentaina (E623), the most sever effects in Alcoy are expected to be due to by the seismogenic source of Benasau (E624).
The expected ground motion at each landslide site was obtained from natural time-histories (TH) stored in the strong motion database ITACA (Italian ACcelerometric Archive-version 2.0).
At this aim, TH were chosen through the following criteria. regarding the seismogenic source properties, the focal mechanism was considered “normal” or “normal-oblique”, the Mw interval ± 0.3 of the maximum earthquake inferred from the seismic hazard analysis (i.e., 6.4 to 7.0), the hypocentral depth ≤ 30 km. As regards the recording-site conditions, free-field” or “ground” installation were considered as well as the Eurocode 8 ground type “A” (hard rock/rock or Vs_30 ≥ 800 m/s) or “B” (soft rock/very dense soil or 360 ≤ Vs_30 < 800 m/s) and flat-slope conditions (i.e., slope angle < 15°). As it regards the ground-motion parameters, the intensity of Arias of the time-history (AITH), was select in the range:
average   log 10 ( AI ) 2 σ log 10 ( AI TH ) average   log 10 ( AI ) + 2 σ
Furthermore, a spectrum-similarity analysis was obtained comparing the shape of the TH to the shape of response spectra of each TH so far selected (Figure 11). Finally, the resulting TH was scaled to the PGA calculated by the Istituto Geografico National, Seismic Hazard of Spain [34], for a return period of 475 years (i.e., 10% probability of exceedance in 50 years).

6.2. Results and Mapping

The computed P[D ≥ Dc|a(t), ay] for each category of landslide (i.e., rock slides, topples, first-time earth-slides, existing landslides) were mapped for the considered saturation scenarios.
To restitute a comprehensive mapping, a GIS solution was adopted providing a raster zonation for rocky landslides, by contouring the grid cell susceptible for different failure mechanisms (i.e., planar sliding, wedge sliding, toppling). A weighted probability was initially computed for each failure mechanism respect to the estimated volume of typical blocks and, subsequently, a probability combined was obtained considering different mechanisms. It was possible to map a unique probability value for grid cell representative for the most critical slope condition. Critical threshold for computing P[D ≥ Dc|a(t), ay] was assumed at 10 cm for earth-slides and 5 cm for rock-slides, according to Romeo [20].
To provide a unique value of P[D ≥ Dc|a(t), ay] into the same cell unit, the following criteria were assumed:
  • For the same mechanism, the P[D ≥ Dc|a(t), ay] computed for different block volumes are solved in a unique value by performing a “weight averaging”;
  • “combined probability” is computed for each different mechanism (i.e., toppling, wedge sliding, planar sliding) using the probability values computed for each block volume;
  • In case that only SF values are computed for each block volume and landslide mechanism the “lowest SF value” is attributed to the cell unit.
In a first scenario dry conditions and seismic action corresponding to a return time of 475 years (i.e., corresponding to a PGA of 0.16 g) were considered.
The results obtained for this scenario are reported in Figure 12 and Table 2, Table 3 and Table 4. In a second scenario, middle saturation conditions and the same seismic action of the dry scenario were considered; the obtained results are reported in Table 5, Table 6 and Table 7.
In the third scenario, full saturation conditions and the same seismic action considered for the previous scenarios of dry conditions and middle saturation were assumed. The obtained results are reported in Table 8, Table 9 and Table 10 and in Figure 13.

7. Discussion

The analysis of the resulting scenarios by PARSIFAL at Alcoy highlights that the area involved in landslide in the Alcoy municipality increases with increasing saturation. In the most severe scenario (i.e., total saturation) unstable conditions are reached by among the 85% of the areas susceptible to failure.
These results demonstrate the main role of rainfalls which represent the predominant and most hazardous triggering action in the basin of Alcoy since they occur seasonally. The seasonal rainfalls are generally concentrated in Autumn, after dry and arid Summer seasons.
All the earth-slides involve the Marne del Tap, marly formation that suffer shrinkage during the arid summer generating tension cracks; during the Autumn rainfalls these cracks fill of water so favoring infiltration, soil saturation and earth-slides. The computed P[D ≥ Dc|a(t), ay] are consistent with specific situations that can be monitored over time since landslide activity and stabilization works are well documented; this is the case of the Molinar and La Beniata landslides within the Alcoy urban area. The results obtained for rock landslides indicate that very hazardous conditions interest an extended zone of the Alcoy urban area located NW (namely Sincra Carrer Barranc), close to the mountain relief where the carbonatic succession widely outcrop, so producing high risk scenarios.
The PARSIFAL applied to the Alcoy’s urban area demonstrates its suitability for managing landslide hazard over extended areas leading to higher awareness in environmental planning. In addition to the safety factor, commonly used for rating landslide masses which are prone to failure [40] as well as to the co-seismic displacement computed according to conventional approaches [41], the probability of exceedance used by PARSIFAL allows a thematic mapping which is more suitable in the framework of seismic microzonation studies. Since the earthquake scenarios are linked to the local seismic hazard, the computed probability of exceedance multiplied for the seismic hazard can provide a combined and unconditional probability of slope failure occurrence. In Italy the PARSIFAL is going to be proposed for deriving the mapping of unstable areas due to landslide following the guidelines proposed by the National Civil Protection [21,42]. More in particular, “attention zones” for landslide proneness can be mapped through PARSIFAL and “areas of respect” can be selected among them after further and more detailed investigations.

8. Conclusions

The PARSIFAL was tested in the area of Alcoy municipality, demonstrating its suitability in restituting scenarios of earthquake-induced landslides for a specific seismic hazard and at different saturation conditions. A comprehensive mapping, in terms of exceedance probability of a critical displacement allowed to output high risk areas located close to the carbonatic relief located NW of the Alcoy urban areas, due to the susceptibility to rock slides and toppling as well as along the Molinar river valley due to the widely outcropping marls of the Marne del Tap formation responsible for diffused earth-slides. As it regards the Marne del Tap formation, a relevant effect due to seasonal rainfalls, which generally occur in Autumn after the arid Summer season, was demonstrated.
Future applications of PARSIFAL could take into account the intrinsic variability of geomechanical parameters attributed to rock joints or soil to compute safety factors as well as exceedance probability of co-seismic displacements by performing stochastic parametric analyses. An automatic procedure could be improved to speed up computation and processing for the comprehensive thematic mapping. Moreover, since roads re generally not evident in DEM, because of too low resolution, further applications could be focused on taking into account the role of man-made cuts along roads in earthquake-induced landslide scenarios.

Acknowledgments

This work was partially funded by Spanish MINECO and European funds under project EPILATES (CGL2015.65602-R) and by the University of Alicante, research group VIGROB-184.

Author Contributions

For this research Salvatore Martino coordinated the research activities, participated in field works and contributed to slope stability analysis; Simona Battaglia performed field surveys, processing of geotechnical data, slope stability analysis and mapping; Josè Delgado performed inventory of the existing landslides, contributed to provide materials and geotechnical data, and participated in field works; Carlo Esposito managed the GIS tools for PARSIFAL and contributed to landslide susceptibility assessment, analysis of geomechanical data and mapping the resulting scenarios; Guido Martini performed selection of the seismic inputs, the Newmark analysis and the exceedance probability computation; Cristina Missori contributed to field works and data collection. All the Authors contributed to write the manuscript, to design figures and to final editing.

Conflicts of Interest

The authors declare no conflict of interest.

References

  1. Esposito, C.; Martini, G.; Martino, S.; Pallone, F.; Romeo, R.W. A methodology for a comprehensive assessment of earthquake-induced landslide hazard, with an application to pilot sites in Central Italy. In Landslides and Engineered Slopes. Experience, Theory and Practice; Ass. Geotecnica Italiana: Rome, Italy, 2016. [Google Scholar]
  2. Keefer, D.K. Landslides caused by earthquakes. Geol. Soc. Am. Bull. 1984, 95, 406–421. [Google Scholar] [CrossRef]
  3. Delgado, J.; Garrido, J.; López-Casado, C.; Martino, S.; Peláez, J.A. On far field occurrence of seismically induced landslides. Eng. Geol. 2011, 123, 204–213. [Google Scholar] [CrossRef]
  4. Jibson, R.W.; Harp, E.L.; Michael, J.M. A method for producing digital probabilistic seismic landslide hazard maps. Eng. Geol. 2000, 58, 271–289. [Google Scholar] [CrossRef]
  5. Martino, S. Earthquake-induced landslides in Italy: From the distribution of effects to the hazard mapping. Ital. J. Eng. Geol. Environ. 2017, 1, 53–67. [Google Scholar]
  6. Romeo, R.W.; Mari, M.; Floris, M.; Pappafico, G.; Gori, U. An approach to join the spatial and temporal components of landslide susceptibility: An application to the Marche Region (central Italy). Ital. J. Eng. Geol. Environ. 2011, 2, 63–78. [Google Scholar]
  7. Garcia-Rodirguez, M.J.; Malpica, J.A.; Benito, B.; Diaz, M. Susceptibility assessment of earthquake-triggered landslides in El Salvador using logistic regression. Geomorphology 2008, 95, 172–191. [Google Scholar] [CrossRef] [Green Version]
  8. Xu, C.; Xu, X.; Dai, F.; Saraf, A.K. Comparison of different models for susceptibility mapping of earthquake triggered landslides related with the 2008 Wenchuan earthquake in China. Comput. Geosci. 2012, 46, 317–329. [Google Scholar] [CrossRef]
  9. Xu, C.; Xu, X.; Wang, Y. GIS-based bivariate statistical modelling for earthquake-triggered landslides susceptibility mapping related to the 2008 Wenchuan earthquake, China. Q. J. Eng. Geol. Hydrogeol. 2013, 46, 221–236. [Google Scholar] [CrossRef]
  10. Miles, S.B.; Ho, C.L. Rigorous landslide hazard zonation using Newmark’s method and 620 stochastic ground motion simulation. Soil Dyn. Earthq. Eng. 1999, 18, 305–323. [Google Scholar] [CrossRef]
  11. Jibson, R.W.; Michael, J.A. Maps Showing Seismic Landslide Hazards in Anchorage, Alaska: U.S. Geological Survey Scientific Investigations Map 3077, Scale 1:25,000; United States Geological Survey (USGS): Reston, VA, USA. Available online: http://pubs.usgs.gov/sim/3077 (accessed on 1 November 2017).
  12. Miles, S.B.; Keefer, D.K. Evaluation of CAMEL—Comprehensive areal model of earthquake-induced landslides. Eng. Geol. 2009, 104, 1–15. [Google Scholar] [CrossRef]
  13. Peng, W.F.; Wang, C.L.; Chen, S.T.; Lee, S.T. A seismic landslide hazard analysis with topographic effect, a case study in the 99 Peaks region, Central Taiwan. Environ. Geol. 2009, 57, 537–549. [Google Scholar] [CrossRef]
  14. Rodríguez-Peces, M.J.; García-Mayordomo, J.; Azañón, J.M.; Jabaloy, A. Regional hazard assessment of earthquake-triggered slope instabilities considering site effects and seismic scenarios in Lorca Basin (Spain). Environ. Eng. Geosci. 2011, 17, 183–196. [Google Scholar] [CrossRef]
  15. Bozzano, F.; Esposito, C.; Martini, G.; Martino, S.; Prestininzi, A.; Rinaldis, D.; Romeo, R.W.; Scarascia Mugnozza, G. Earthquake-reactivated landslide scenarios in Southern Italy based on spectral-matching input analysis. Bull. Earthq. Eng. 2013, 11, 1927–1948. [Google Scholar] [CrossRef]
  16. Wang, Y.; Rathje, E. Probabilistic seismic landslide hazard maps including epistemic uncertainty. Eng. Geol. 2015, 196, 313–324. [Google Scholar] [CrossRef]
  17. Chousianitis, K.; Del Gaudio, V.; Sabatakakis, N.; Kavoura, K.; Drakatos, G.; Bathrellos, G.D.; Skilodimou, H.D. Assessment of earthquake-induced landslide hazard in Greece: From arias intensity to spatial distribution of slope resistance demand. Bull. Seismol. Soc. Am. 2016, 106, 174–188. [Google Scholar] [CrossRef]
  18. Caccavale, M.; Matano, F.; Sacchi, M. An integrated approach to earthquake-induced landslide hazard zoning based on probabilistic seismic scenario for Phlegrean Islands (Ischia, Procida and Vivara), Italy. Geomorphology 2017, 295, 235–259. [Google Scholar]
  19. Ambraseys, N.N.; Srbulov, M. Earthquake induced displacements of slopes. Soil Dyn. Earthq. Eng. 1995, 14, 59–71. [Google Scholar] [CrossRef]
  20. Romeo, R.W. Seismically induced landslide displacements: A predictive model. Eng. Geol. 2000, 58, 337–351. [Google Scholar]
  21. Della Seta, M.; Di Martino, G.; Esposito, C.; Giannini, L.M.; Martini, G.; Martino, S.; Pallone, F.; Troiani, F. Application of the PARSIFAL approach for providing scenarios of earthquake-induced landslide in the Accumoli municipality. In Proceedings of the GNGTS 2017 Conference, Trieste, Italy, 14–16 November 2017. [Google Scholar]
  22. Newmark, N.M. Effects of earthquakes on dams and embankments. Geotecnique 1965, 15, 139–159. [Google Scholar] [CrossRef]
  23. Mapa Geotécnico y de Riesgos Geológicos Para la Ordenación Urbana de Alcoy. Mapa de Riesgos Geológicos E:1/25.000, 1/2.500 y 1/1.000. 1980. Available online: http://info.igme.es/cartografiadigital/tematica/Geotecnico25Mapa.aspx?Id=Alcoy&language=es#mapas,_cortes,_leyendas,_etc (accessed on 1 November 2017).
  24. Martínez, J.; Balaguer, J. Litología, Aprovechamiento de Rocas Industriales y Riesgo de Deslizamiento en la Comunidad Valenciana. Available online: http://www.habitatge.gva.es/estatico/areas/urbanismo_ordenacion/infadm/publicaciones/pdf/litologia/LITOLOGIACAS.pdf (accessed on 1 November 2017).
  25. Van Beek, L.P.; Van Asch, T.W. Regional assessment of the effects of land-use change on landslide hazard by means of physically based modelling. Nat. Hazards 2004, 31, 289–304. [Google Scholar] [CrossRef]
  26. La Roca, N. Evolución de Laderas en la Montaña Meridional Valenciana. Ph.D. Thesis, University de Valencia, València, Spain, 1990. [Google Scholar]
  27. Delgado, J.; Peláez, J.A.; Tomás, R.; García-Tortosa, F.; Alfaro, P.; López Casado, C. Seismically-induced landslides in the Betic Cordillera (S Spain). Soil Dyn. Earthq. Eng. 2011, 31, 1203–1211. [Google Scholar] [CrossRef]
  28. Gimènez, J.; Gelaber, B.; Sàbat, F. El relieve de las Islas Baleares. Enseñanza Cienc. Tierra 2007, 15, 157–184. [Google Scholar]
  29. Vera, J.A. Geologìa de Andalucia. Enseñanza Cienc. Tierra 1994, 2, 306–316. Available online: http://www.raco.cat/index.php/ect/article/viewFile/88160/141214 (accessed on 1 November 2017).
  30. Viseras, C. Estratigrafia y Sedimentologíadel Relleno Aluvial de la Cuenca de Guadix (Cordilleras Béticas). Ph.D. Thesis, Universidad de Granada, Granada, Spain, 1991. [Google Scholar]
  31. Barton, N. Suggested methods for the quantitative description of discontinuities in rock masses. Int. J. Rock Mech. Min. 1978, 15, 319–368. [Google Scholar]
  32. Markland, J.T. A useful technique for estimating the stability of rock slopes when the rigid slide type of failure is expected. Imp. Coll. Rock Mech. Res. Repr. 1972, 19, 1–10. [Google Scholar]
  33. Lee, S.; Min, K. Statistical analysis of landslides susceptibility at Yongin, Korea. Environ. Geol. 2001, 40, 1095–1113. [Google Scholar] [CrossRef]
  34. Grupo de Trabajo IGN-UPM. Actualización de Mapas de Peligrosidad Sísmica de España; Instituto Geográfico Nacional: Madrid, Spain, 2012. [Google Scholar]
  35. Hoek, E.; Bray, J.W. Rock Slope Engineering; Taylor and Francis Group: Abingdon, UK, 1981. [Google Scholar]
  36. Dewitte, O.; Demoulin, A. Morphometry and kinematics of landslides inferred from precise DTMs in West Belgium. Nat. Hazards Earth Sys. Sci. 2005, 5, 259–265. [Google Scholar] [CrossRef]
  37. Janbu, N. Slope stability computations: In Embankment-dam Engineering. Textbook. Eds. R.C. Hirschfeld and S.J. Poulos. JOHN WILEY AND SONS INC., PUB., NY, 1973, 40P. Int. J. Rock Mech. Min. Sci. Geomech. Abstr. 1975, 12. [Google Scholar] [CrossRef]
  38. Bishop, A.W. The use of the slip circle in the stability analysis of slopes. Géotechnique 1955, 5, 7–17. [Google Scholar] [CrossRef]
  39. Sabetta, F.; Pugliese, A. Estimation of response spectra and simulation of nonstationary earthquake ground motions. Bull. Seismol. Soc. Am. 1996, 86, 337–352. [Google Scholar]
  40. Lenti, L.; Martino, S.; Musolino, G. Considering seismic coefficient distributions within slopes to calculate landslide reactivation probability. Bull. Eng. Geol. Environ. 2017, 76, 1353–1370. [Google Scholar] [CrossRef]
  41. Martino, S. Earthquake-induced reactivation of landslides: Recent advances and future perspectives. In Earthquakes and Their Impact on Society; D’Amico, S., Ed.; Springer: Berlin, Germany, 2015; pp. 291–322. [Google Scholar]
  42. Dipartimento della Protezione Civile e Conferenza delle Regioni e delle Province Autonome. Indirizzi e Criteri per la Microzonazione Sismica; Dipartimento della Protezione Civile: Rome, Italy, 2008. (In Italian) [Google Scholar]
Figure 1. Flow chart illustrating the 3 steps procedural scheme of the (Probabilistic Approach to pRovide Scenarios of earthquake-Induced slope FAiLures) PARSIFAL.
Geosciences 08 00057 g001
Figure 2. Seismic-induced landslides in the Alcoy urban area.
Geosciences 08 00057 g002
Figure 3. Lithotechnical map of the study area. (1) gravels and sands with variable amounts of silts and clays (Alluvial deposits, Holocene). (2) Travertines (Quaternary). (3) Silts and sands with gravels (alluvial terraces, Quaternary). (4) gravels and sands with variable amounts of silts and clays (Alluvial deposits, Pleistocene). (5) Reddish gravel and sands with silts and clays (alluvial fan deposits, Quaternary). (6) Marls (Miocene). (7) Bioclastic limestone (Miocene). (8) Biodetritic limestone (Miocene). (9) Marls (Marls in tap facies, Miocene). (10) Bioclastic limestone (Oligocene).
Geosciences 08 00057 g003
Figure 4. Example of jointed rock-mass outcropping in the Estret del Cint locality.
Geosciences 08 00057 g004
Figure 5. Homogeneous Geostructural Zones (HGZ) resulting for the rock mass outcropping in the Alcoy urban area. The numbers (1 to 5) codify the recognized HGZ.
Geosciences 08 00057 g005
Figure 6. Typical block geometries assumed for slope stability. (a) Toppling; (b) wedge sliding (longitudinal section); (c) wedge sliding (transversal section); (d) planar sliding. W—mass weight, U and V—water force, Wk—pseudostatic horizontal force, α—sliding surface dip, β—tilt angle, ε—wedge angle.
Geosciences 08 00057 g006
Figure 7. (a) Debris cover near to the Molinar River; (b) aerial photo of Alcoy: the red zones correspond to the Unique Condition Units (UCU) obtained for the Alcoy urban area (Instituto Cartográfico Valenciano 2017, http://www.icv.gva.es/ca/inicio).
Geosciences 08 00057 g007
Figure 8. (a) Example of landslide surveyed in the Alcoy urban area; (b) aerial photo of the Alcoy urban area (Instituto Cartográfico Valenciano 2017, http://www.icv.gva.es/ca/inicio) with the inventoried landslides (red zones). The green star locates the photo-view, the violet color indicates the Molinar landslide.
Geosciences 08 00057 g008
Figure 9. Example of simplified engineering-geology cross-section obtained for the Molinar landslide (see Figure 8 for location). The slices used for the GLE slope stability are also shown.
Geosciences 08 00057 g009
Figure 10. QAFI Map showing the location of seismogenic sources close to the Alcoy basin (http://info.igme.es/qafi/).
Geosciences 08 00057 g010
Figure 11. Response spectra of the selected input (grey) in comparison with the average response spectrum (blue) and target response spectrum (red).
Geosciences 08 00057 g011
Figure 12. Resulting scenario by PARSIFAL obtained in the Alcoy urban area for RT = 475 years in dry conditions (the zoomed areas—a, b, c—are bounded in the key map).
Geosciences 08 00057 g012
Figure 13. Resulting scenario by PARSIFAL obtained in the Alcoy urban area for RT = 475 years in full saturation conditions (the zoomed areas—a, b, c—are bounded in the key map).
Geosciences 08 00057 g013
Table 1. Geomechanical parameters. γn is the total weight for unit volume, c is the cohesion, Φ is the friction angle, n is the normal stress acting on joint, JRC is the Joint Roughness Coefficient and the JCS the Joint Compressive Strength parameter [31]. The HGZ are referred to Figure 5.
Territorial Unitsγn (kN/m3)c (kPa)Φ (°)σn (kPa)JRCJCS (MPa)
Already existing landslides212921
First-time Earth-slides212927
HGZ123 33469105
HGZ223 33461385
HGZ317 37341255
HGZ425 34498159
HGZ524 3347955
Table 2. Results obtained in terms of exceedance probability for the dry scenario (RT = 475 years).
Dry Scenario
HeaderAlready Existing Landslides (%) First-Time Earth Slides (%)First-Time Rock Mass (%)
P[D ≥ Dc|a(t), ay] = 0 709747
0 < P[D ≥ Dc|a(t), ay] < 111052
P[D ≥ Dc|a(t), ay] = 11931
Table 3. Safety factor values computed in the dry scenario for different landslide typologies.
DRY: P[D ≥ Dc|a(t), ay] = 0
Safety Factor (SF)Already Existing Landslides (%)First-Time Earth Slides (%)First-Time Rock Mass (%)
1 < SF ≤ 1.228100100
1.2 < SF ≤ 1.54400
1.5 < SF ≤ 22200
SF > 2600
Table 4. Probability of exceedance values computed in the dry scenario for different landslide typologies.
DRY: 0 < P[D ≥ Dc|a(t), ay] < 1
Exceedance Probability of Critical Displacement (Dc)Already Existing Landslides (%)First-Time Earth Slides (%)First-Time Rock Mass (%)
0% < P(D ≥ Dc) ≤ 25%660100
25% < P(D ≥ Dc) ≤ 50%000
50% < P(D ≥ Dc) ≤ 75%000
75% < P(D ≥ Dc) < 100%3400
Table 5. Results obtained in terms of exceedance probability for the middle saturation scenario (RT = 475 year).
Scenario of Middle Saturation
HeaderAlready Existing Landslides (%) First-Time Earth Slides (%)First-Time Rock Mass (%)
P[D ≥ Dc|a(t), ay] = 0 46710
0 < P[D ≥ Dc|a(t), ay] < 123270
P[D ≥ Dc|a(t), ay] = 1312100
Table 6. Safety factor values computed in the middle saturations scenario for different landslide typologies.
Middle Saturation: P[D ≥ Dc|a(t), ay] = 0
Safety Factor (SF)Already Existing Landslides (%)First-Time Earth Slides (%)First-Time Rock Mass (%)
1 < SF ≤ 1.2591000
1.2 < SF ≤ 1.53300
1.5 < SF ≤ 2800
SF > 2000
Table 7. Probability of exceedance values computed in the middle saturations scenario for different landslide typologies.
Middle Saturation: 0 < P[D ≥ Dc|a(t), ay] < 1
Exceedance Probability of Critical Displacement (Dc)Already Existing Landslides (%)First-Time Earth Slides (%)First-Time Rock Mass (%)
0% < P(D ≥ Dc) ≤ 25%671000
25% < P(D ≥ Dc) ≤ 50%000
50% < P(D ≥ Dc) ≤ 75%16.500
75% < P(D ≥ Dc) < 100%16.500
Table 8. Results obtained in terms of exceedance probability for the full saturation scenario (RT = 475 years).
Scenario of Full Saturation
HeaderAlready Existing Landslides (%)First-Time Earth Slides (%)First-Time Rock Mass (%)
P[D ≥ Dc|a(t), ay] = 0 1500
0 < P[D ≥ Dc|a(t), ay] < 13100
P[D ≥ Dc|a(t), ay] = 154100100
Table 9. Safety factor values computed in the full saturations scenario for different landslide typologies.
Full Saturation: P[D ≥ Dc|a(t), ay] = 0
Safety Factor (SF)Already Existing Landslides (%)First-Time Earth Slides (%)First-Time Rock Mass (%)
1 < SF ≤ 1.25000
1.2 < SF ≤ 1.52500
1.5 < SF ≤ 22500
SF > 2000
Table 10. Probability of exceedance values computed in the full saturations scenario for different landslide typologies.
Full Saturation: 0 < P[D ≥ Dc|a(t), ay] < 1
Exceedance Probability of Critical Displacement (Dc)Already Existing Landslides (%)First-Time Earth Slides (%)First-Time Rock Mass (%)
0% < P(D ≥ Dc) ≤ 25%751000
25% < P(D ≥ Dc) ≤ 50%000
50% < P(D ≥ Dc) ≤ 75%000
75% < P(D ≥ Dc) < 100%2500

