Big Data in Natural Disaster Management: A Review


NSF Spatiotemporal Innovation Center, George Mason University, 4400 University Drive, Fairfax, VA 22030, USA
*
Author to whom correspondence should be addressed.
Geosciences 2018, 8(5), 165; https://0-doi-org.brum.beds.ac.uk/10.3390/geosciences8050165
Submission received: 12 March 2018
/
Revised: 22 April 2018
/
Accepted: 3 May 2018
/
Published: 5 May 2018
(This article belongs to the Special Issue Inaugural Section Special Issue: Key Topics and Future Perspectives in Natural Hazards Research)
Abstract
:Undoubtedly, the age of big data has opened new options for natural disaster management, primarily because of the varied possibilities it provides in visualizing, analyzing, and predicting natural disasters. From this perspective, big data has radically changed the ways through which human societies adopt natural disaster management strategies to reduce human suffering and economic losses. In a world that is now heavily dependent on information technology, the prime objective of computer experts and policy makers is to make the best of big data by sourcing information from varied formats and storing it in ways that it can be effectively used during different stages of natural disaster management. This paper aimed at making a systematic review of the literature in analyzing the role of big data in natural disaster management and highlighting the present status of the technology in providing meaningful and effective solutions in natural disaster management. The paper has presented the findings of several researchers on varied scientific and technological perspectives that have a bearing on the efficacy of big data in facilitating natural disaster management. In this context, this paper reviews the major big data sources, the associated achievements in different disaster management phases, and emerging technological topics associated with leveraging this new ecosystem of Big Data to monitor and detect natural hazards, mitigate their effects, assist in relief efforts, and contribute to the recovery and reconstruction processes.
1. Introduction
Natural disasters can be defined as a combination of natural hazards and vulnerabilities that endanger vulnerable communities that are incapable of withstanding the adversities arising from them [1]. Human beings invariably face threats of natural as well as human-made disasters, which often lead to massive damages, human suffering, and negative economic impacts. The main characteristics of natural disasters are unpredictability, availability of limited resources in impacted areas, and dynamic changes in the environment [2]. Unpredictability implies that severe impacts on people and property during natural disasters cannot be predicted with acceptable accuracy [3]. The issue of limited resources emerges because unpredictability makes it difficult to allocate adequate resources in advance. Dynamic changes in the environment result because it is difficult to make predictions about the movement of people and the damages that may occur because of the natural disaster. It is difficult to predict such changes based on data that pertains to normal periods [4]. Introducing disaster management policies and applying appropriate levels of information technology and equipment offer immense potential in enhancing the capabilities of disaster management policies. In addition, the evolving trends have opened massive technological resources for reducing disaster risks [5].
Big data is defined as the technological paradigm that allows researchers to conduct an efficient analysis of vast quantities of data that is made available through the current practices [6,7]. It is the collection of scientific and engineering methods and tools that help in making the best of massive amounts of available data. Big data addresses not only storage issues, but also issues related to accessibility, distribution, analysis, and effective visual presentation of data and analysis. Big data has now become a crucial element of communication, which complements the conventional exchange of intentional and explicit messages; such as first responders talking over a voice connection; or an announcement of a text message through which warning is given to citizens faced with the threat of an approaching natural disaster [8,9]. More precisely, communication also entails understanding and monitoring the entire body of public and openly available communication such as messages and content that is publicly exchanged on social media. In such situations, people may be exchanging messages in reporting their condition to their loved ones or making appeals for help. However, big data allows researchers to conduct a detailed analysis of all communications which provides valuable information that has a general validity for the population at large; such as information about a disease outbreak.
In general, the disaster management cycle comprises four distinct phases, which are “mitigation”, “preparedness”, “responses”, and “recovery”. The goal of the mitigation phase is to minimize the effects of a disaster (building warning codes and risk zones, risk analysis, public education). The main focus of the preparedness phase is on planning how to respond to a disaster. It includes preparedness plans, emergency exercises, and training, but also the Early Warning System development and implementation. Response activities pertain to providing the required disaster management services to save lives and safeguard property and protect the environment during disaster management situations. “Recovery” is the process of returning systems to normal levels after a disaster.
In recent years, the literature on disaster management mostly focused on the potential that lies in using specific kinds of data for natural disaster management [10,11,12]. It is in this context that this paper makes a review of major big data sources, the associated achievements in different disaster management phases, and emerging technological topics associated with leveraging this new ecosystem of Big Data to monitor and detect natural hazards, mitigate their effects, assist in relief efforts, and contribute to the recovery and reconstruction processes.
2. Review Methodology
In the literature review process, we followed a systematic approach on selecting papers related to “big data” and “disaster management”. Firstly, we searched in Google Scholar with the two key words and obtained 4432 results. Secondly, we manually selected papers that were most relevant to our topic. This step led to a total number of 223 articles. Thirdly, we filtered the list of articles to only include journal articles, leading to 149 articles from 101 journals. It is very likely, though, that we missed several articles that are on the same topic. These articles were reviewed individually for analysis. Starting from two articles in 2011, the number of articles in the review field started to grow gradually, with nine articles in 2012, 15 articles in 2013, 18 articles in 2014, 46 articles in 2015, 25 articles in 2016, 21 articles in 2017, and 12 articles in 2018 (Figure 1). The peak of the topic “big data” in combination with “disaster management” occurred in the year 2015, and researchers might be directed to other related topics or emerging technologies benefiting disaster management. The rest of this paper will mainly discuss three perspectives based on the 149 articles: (1) major data sources; (2) big data contributions in different disaster phases; and (3) emerging technologies benefiting from big data and disaster management.
3. Major Data Sources
To the best of this authors’ knowledge, there is no standard definition of “big data” in disaster management. A Federal Geographic Data Committee (FGDC) report [13] reviewed the emerging data collections, including real-time spatiotemporal data (e.g., GPS data), broadening of participation (e.g., Volunteer Geographic Information and social media), small satellites, and unmanned aircraft vehicles (UAVs). A United Nation (UN) report [14] illustrated examples of big data sources in disaster resilience, including exhaust data (mobile-based, financial transactions, transportation, online traces), digital content (social media and crowd-sourcing), and sensing data (physical sensing devices and remote sensing). In this paper, we define big data as the integration of diverse data sources and the capability to analyze and use the data (usually in real time) to benefit the population that participates in the disaster situation. The concept of big data is beyond the datasets themselves, regardless of their size.
In this section, we endeavor to review the major big data sources—especially the emerging ones —for disaster management, including satellite imagery, aerial imagery and videos from unmanned aerial vehicles (UAVs), sensor web and Internet of Things (IoT), airborne and terrestrial Light Detection and Ranging (LiDAR), simulation, spatial data, crowdsourcing, social media, and mobile GPS and Call Data Records (CDR). Figure 2 illustrates the distribution of reviewed articles by different data sources and their year of publication. It can be observed that an increase in article numbers is shown in almost all types of major data sources during 2014–2016, when the topic “big data” is popular in “disaster management”, and a decrease in 2017. Satellite imagery, crowdsourcing, and social media data serve as the most popular data for disaster management.
3.1. Satellite Imagery
Satellite remote sensing technology provides qualitative and quantitative opportunities in the context of varied functions such as assessing post-disaster damage, responding through operational assistance [15,16,17], and risk reduction. The most remarkable contribution of remote sensing imagery is post-disaster damage assessment through change detection [18]. The application of remote sensing in disaster management is conducted through methods such as higher resolution, multidimensional, and multi-technique.
The recently evolved high resolution satellite imagery facilitates the collection of detailed texture information before and after a natural disaster for change detection. Such information is crucial to attain after the occurrence of disasters. Information collected through high resolution satellite imagery may pertain to the structural deformation of land areas, directional changes and creation of water bodies, and details about damaged building stock in the disaster affected area [19,20]. Consequently, rescue methods can be suggested and initiated for the immediate location and recovery of bereaved persons and for locating the corresponding area accurately by using high-resolution remote sensing techniques [19]. In addition to the two-dimensional information, it is also possible to produce three-dimensional images along with height information in the form of stereo images from satellites, which helps in identifying and measuring the intensity of damage [21,22]. Three-dimensional analysis allows detecting collapsed buildings and affected regions by comparing the differences in the height of buildings and estimating the heights and volumes of piled up debris with the use of pre- and post-disaster stereo image pairs [23,24,25]. To deal with the limitations of optical satellite imagery in cloud cover, rain conditions, and at nighttime, active sensors such as the synthetic aperture radar (SAR) can be effectively used to enlarge its observational capability during a natural disaster [18,26].
3.2. UAV-Based Aerial Imagery and Videos.
Aerial imagery captured via unmanned aerial vehicles (UAVs) is playing an increasingly important role in disaster response, due to its efficiency in situational awareness. Aerial imagery can be captured with a high spatial resolution and processed much faster in comparison to satellite imagery [30]. Besides the improvements offered by oblique imagery acquired from piloted platforms, UAVs provide additional advantages [31]. These include fully controlled flight, VHR imagery of up to a 2 cm resolution that allows the detection of fine cracks, and the large degree of image overlap, which allows the generation of very detailed point clouds. With the use of UAVs, first responders can better understand which structures were affected by the given event and can determine the extent of the damage caused to these structures.
UAVs can carry various types of sensors, including cameras, video, infrared and ultra-violet sensors, radiation sensors, weather sensors, spectrum analyzers, and LIDAR reflectors. UAV imagery and videos can provide real-time, decision-relevant situational information for transportation planners who survey damaged roads, evacuation routes, and support for transport logistics [32].
UAVs are now recognized as a reliable data source for disaster information and for improving the estimation scale of damage [33]. With the combined use of UAV imagery, satellite, and aircraft data, it becomes possible to identify façade and roof damage to buildings by integrating geometrical transformation and environmental information [34]. Combining UAV imagery and crowd-sourcing enables annotation in the context of features of interest, such as damaged shelters and roads blocked by debris [30].
However, UAVs are still in the development stage and several issues need to be resolved; such as short battery life, which leads to a limited area of coverage; unforeseen behavior in different atmospheric conditions; limited scope of pilot training for users; and legislation that severely limits the use of UAVs in most countries. Due to the UAV technology, privacy issues arise. The community concern about exposing victims’ locations needs to be addressed by officials and UAV developers. Public safety needs to be protected for privacy and individual rights during UAV operations in a complex disaster environment [35,36].
3.3. Wireless Sensor Web and Internet of Things
Chen et al. [37] utilized existing and available Wireless Sensor Network (WSN) technologies to develop an early warning system for natural disasters. The WSN technologies provide reliable data transmission and incorporate data fusion from heterogeneous sensors and minimizing energy consumption. Erdeji et al. [38] reviewed the overall structure of the WSN and UAV systems for natural disasters, and proposed the Inundation Monitoring and Alarm Technology in a System of Systems to incorporate smartphone data with WSN for enhanced situational awareness. Erman et al. [39] integrated low-cost embedded devices based on WSN and UAVs for improving the response time in critical situations, minimizing the latency, and maximizing the success ratio of delivery. WSN has also been extensively used in facilitating the intercommunication between a disaster impacted population and rescue teams when traditional infrastructure communication systems fail [40,41]. Tuna et al. [42] utilized a group of mobile robots to explore an unknown region after a disaster and used WSN to extend the range of communication for human existence detection.
While being widely deployed in disaster management, WSN is lacking in terms of the overall coordination of heterogeneous data sources and protocols from “socio-techno-economic perspectives” [43]. WSN contributes as an essential part of Internet of Things (IoT) technologies. Ray et al. [43] reviewed several IoT-enabled disaster management systems, including BRINCO (a notification system for earthquake and tsunami warning), BRCK (communication system under low connectivity areas), and GRILLO (earthquake alarming sensor network). The advantages of IoT include its capability to compensate for the poor infrastructure of a vulnerable population especially in developing countries, and being an alternative means of communication where IoT-enabled devices (battery powered wireless devices) can be used benefits data network resilience during disaster situations [44].
3.4. LiDAR
Airborne and terrestrial Light Detection and Ranging (LiDAR) is a method that provides the ability to extract high-quality elevation models and other features, providing reliable information about on-the-ground conditions during a disaster situation. LiDAR equipment is relatively expensive and collecting and processing of data with it can often prove to be time consuming. However, DEMs generated from LiDAR data can have a very high resolution and are very accurate. Unlike aerial photography, LiDAR scanners collect data at a very-fine (centimeter) scale resolution and can gather information about the ground surface below the vegetation. This ability is very useful for geological mapping and for measuring geological features, including monitoring volcano growth and predicting eruption patterns [45,46]. In addition, LiDAR data is highly sensitive to water and thus proves to be a suitable data source for flood prediction and assessment [47,48]. LiDAR has been useful in identifying and assessing elevation changes or structural damages after natural disasters [49]. For example, Kwan and Ransberger [50] demonstrated the use and analysis of LiDAR data before and after Hurricane Katrina in detecting transport network obstructions during a disaster response. They also demonstrated how the data helped in reducing the time taken by first responders to reach disaster sites. Similarly, Moya et al. [51] detected collapsed buildings after the earthquake that struck Kumamoto, Japan on 16 April 2016. They did so by using digital surface models (DSMs), taken before and after the earthquake during LiDAR flights.
3.5. Simulation Data
Numerical simulation or forecasting is one of the most significant contributions to the prediction of natural disasters occurring on account of meteorological phenomena, land surface phenomena, and various types of pollutions [52,53,54]. In addition, 3D modeling has been helpful in predicting the potential damage and in assessing the changes occurring after the disaster [55,56].
Large amounts and different types of observation data are generated during natural disasters, and these data can be used to produce, verify, validate, and improve models to represent the complexity for all facets of disaster management. Agent-based models are suitable for exploring human behavior and rapid low-level environmental changes using available high resolution data. Dou et al. [57] developed an agent-based framework for human rescue operations in a landslide disaster to evaluate a contingency plan. The framework extracts information from high resolution remote sensing images, simulates a landslide environment based on a three-dimensional landslide geological model, and uses a multi-agent simulation approach to provide individuals’ behavior simulation under dynamic disaster scenarios. The simulations provide positive effects on the evacuation process, e.g., speeding up the process and reducing the number of casualties. Mas et al. [58] reviewed the agent-based models for tsunami mitigation and evacuation planning through case studies in Indonesia, Thailand, Japan, and Peru. Kureshi et al. [59] utilized advanced by combining agent-based models with physical sensors, and adaptively managed the heterogeneous collection of data resources and agent-based models to create what-if scenarios in order to deter- mine the best course of action.
3.6. Vector-Based Spatial Data
Vector-based spatial data provides fundamental support for disaster management, including disaster forecasts about the extent of a particular hazard or disaster, vulnerability analysis for critical facilities (hospital, school, shelter, fire station, etc.) and human beings (age, gender, socioeconomic status, etc.), damage assessment on the actual impact of a hazard, resource inventory (supplies, equipment, vehicles, etc.), and infrastructure (transportation networks and utility grids). Tomaszewski et al. [60] reviewed the importance of geographic information systems (GIS) and major GIS data sources for disaster response, including Federal Emergency Management Agency (FEMA) GIS Data Feeds, Geonames, US Census Bureau TIGER, the National Map, WorldBank Data, and Open Street Map. Herold and Sawada [61] reviewed the GIS applications of disaster management, emphasizing developing countries.
3.7. Crowdsourcing
It is known that both crowdsourcing and social media data are contributed by the public. While crowdsourcing data are actively contributed, social media data are mostly passively contributed, because the contributors are not aware that their activities on social media are leading to data collection [62].
Active crowdsourcing platforms have been developed for users to enthusiastically contribute the required information [63,64,65]. These platforms are usually developed and implemented by members of the affected public, or by non-governmental organizations (NGO’s) such as Ushahidi (https://www.ushahidi.com/). The purpose of such platforms is to improve the disaster response and resource allocation based on real-time reports from disaster victims. Despite several success stories, challenges of using active crowdsourcing platforms are still worthy of consideration, particularly regarding the credibility and the value of integrating crowdsourced data into the decision-making process [66].
The analysis and processing of crowdsourced disaster data requires varied tools and automation processes in view of its noisy nature, large volume, and fast streaming speed. Significance of the crowdsourced data can be prioritized in keeping with the location of the disaster area and the analyzed data [67]. Online platforms and mobile applications have been established to collect and distribute crowdsourced data during and after disasters [68]. dos Santos Rocha et al. [12] have discussed the strategies that can be adopted by disaster managers in improving the performance of digital volunteers. They also assert that crowd sensing and collaborative mapping can be used in functions involving distributed intelligence, participatory engagement, and self-mobilization. They suggested the adoption of a feedback mechanism amongst the stakeholders to enhance the effectiveness of communication.
Government agencies have been slow in launching their own crowdsourcing platforms for disaster management. This might be due to concerns about the technological and human resources costs and risks of adopting and managing crowdsourcing for government operations. However, government agencies were criticized for the poor management of the 2005 Hurricane Katrina for inadequate information collection compared to the citizen efforts on response and recovery [69,70]. In recent years, government agencies have started to interact with citizens during disaster situations for real-time urgent information and better coordinate search and rescue operations [71,72]. FEMA is coordinating different types of crowdsourcing on image analysis, text messages, and mapathons (https://www.data.gov/event/fema-disaster-crowdsourcing-exchange/) for Hurricanes Harvey, Irma, and Maria, and the California Wildfires that happened in 2017.
3.8. Social Media
Social media platforms, including Twitter, Youtube, Foursquare, and Flickr have been contributing significantly to disaster management. Geotagged social media data can be collected by streaming harvest from the APIs provided by the social media companies.
Social media services have contributed significantly to disaster management as a tool to communicate information during disaster management [73]. Social media is increasingly being used by both NGO’s and government disaster management agencies to determine public sentiment and reaction to an event [74]. It is evident that the multidirectional flows of communication and information that crisis crowdsourcing online platforms facilitate can make response and recovery efforts more efficient [70].
Even though social media provides implicit varieties of crowdsourced data, it is being effectively used in disaster management. Granell and Ostermann [75] discussed that Twitter is more effective for detection and prediction and less significant in recovery and response functions. Other data sources such as spatial video, UAV, and phone call data can provide strong evidence (e.g., in-situ images) of the current situation in the affected area during post-disaster stages.
There are varied ways of using social media in disaster management, including data collection, analytic workflow, narrative construction, disaster relevant information extraction, geolocation pattern/text/image analytics, and the broadcasting of information through social media platforms [76].
A number of authors have shown that real time analytics based on social media data provide good opportunities to detect and monitor events automatically [77,78]. Text messages are the basic source of analysis [79]. Visual analytics through social media data facilitate spatiotemporal analysis and create a spatial decision support environment that assists in evacuation planning and disaster management [80]. Given that social media does not rely only on text messages and provides more useful information through images and videos posted by users, visual analytics and image/video-based analysis are becoming more important in extracting the key information from social media posts [81].
3.9. Mobile GPS and Call Data Record
Mobile GPS (Global Positioning System) has emerged as an effective means of gathering mobile sensing data because it can be used to detect human mobility and behavior during large-scale natural disasters. Horanont et al. [82] made use of data collected after the 2011 Great Japan Earthquake and provided useful information on how humans react in disaster scenarios and how the evacuation process can be monitored on a real-time basis. With GPS, it becomes possible to determine the location, magnitude, and other details about an earthquake fault. This is done by using one or more of the three basic components of GPS, which are absolute location, relative movement, and time transfer. GPS data allows automatic calculation of the location, magnitude, and other details about the earthquake fault [83]. Similarly, Song et al. [84] developed a human mobility model to assess the disaster management behavior and mobility patterns of people after the occurrence of the Great East Japan Earthquake and Fukushima nuclear accident. They found that the behavior of human beings and their mobility following large-scale disasters sometimes correlate with their mobility patterns during normal times. In addition, they found that mobility patterns of human beings are also strongly impacted by factors such as their social relationships, intensity of disaster, extent of damage, availability of government shelters, news reporting, population flows, etc. GPS can also be used to determine the resilience of transportation systems during a natural disaster. Donovan and Work [85] conducted quantitative research in measuring transportation resilience by observing about 700 million taxi trips in New York City, which they used to analyze and assess the resilience of the transportation infrastructure to Hurricane Sandy.
It is known that call monitoring and recording applications used by telecommunication companies generate an extremely large amount of call detail records (CDRs) in real-time, and that companies constantly need to analyze this data and make required changes to boost productivity. It is noteworthy in this regard that the volume of the calls and data captured by the call monitoring applications is so large that it is impossible to manually analyze and reach conclusions on the behavior of the network.
CDR datasets are collections of spatiotemporal traces that can characterize individual mobility and social network behaviors at very fine scales. CDR datasets contain information about the location and time at which a communication (call/SMS) is made, along with unique identifiers for the sender and receiver. These data may be valuable for disaster management when they are used to estimate population size and density in a region or city. The information is based on the number of phone subscribers that are present in the coverage area of each cellular tower [86,87]. Information on population distribution before and after a disaster can be useful when assessing exposure risk and response needs. Ghurye et al. [88] utilized call records in using the granular behavior models to evaluate the similarities and differences between the normal and disaster patterns by using data and information relative to the floods that occurred in Rwanda in 2012. Results showed that disasters tend to disrupt both mobility patterns and communication behaviors, while recovery efforts can take several weeks.
4. Usage of Big Data in Disaster Management Phases
The disaster management cycle is a continuous process involving different phases of planning and preparing for expected disasters, including long-term mitigation (i.e., “mitigation/prevention”); short-term preparation and prevention (i.e., “preparedness”); reducing impacts of a disaster through response and rescue efforts (i.e., “response”); and restoration through clean-up and reconstruction (i.e., “recovery”) [89]. In this section, we classify the 149 articles into the four phases and review the “mitigation/prevention” phase in two aspects: (1) long-term risk assessment and reduction; and (2) forecasting and prediction; the “preparedness” phase in two aspects: (1) monitoring and detection, and (2) early warning; two aspects for the “response” phase: (1) damage assessment; and (2) post-disaster coordination and response; and the post-disaster “recovery” phase (Figure 3).
Table 1 shows the disaster management phases, major data sources, and the application fields that were mapped based on the literature reviewed in this paper.
4.1. Mitigation/Prevention
4.1.1. Long-term Risk Assessment and Reduction
Satellite images are known to allow experts to identify geographical and infrastructure risks. Kwak [93] developed a multiple satellite-based flood mapping and monitoring system to assist in risk assessment during disaster risk management. In this system, the Moderate Resolution Imaging Spectroradiometer (MODIS)-derived synchronized floodwater index was used to detect the maximum extent of flood based on annual time-series data for the year 2015. Similarly, Skakun et al. [15] utilized Landsat-5/7 satellite images from 1989 to 2012 and produced a flood risk assessment study that included direct damage categories such as dwelling units, roads, health facilities, and schools. Among these facilities, buildings are one of the most important factors to assess for risk reduction, since they represent human settlements in villages and cities. Building collapse is one of the major sources of casualties in disaster scenarios such as hurricanes and earthquakes, primarily because population distributions can be estimated from building stocks [91].
User-generated data helps in filling past research gaps and provides new opportunities to conduct research on risk assessments. For example, McCormick [94] introduced a crowdsourcing system for oil spill risk assessment, which detected factors that were not found in official expert and government risk assessment reports. Residents observed exposures, such as smells, smoke, and other potential risk factors, that were not detected at harmful levels by expert risk assessors. After the 2015 Nepal Earthquake, Wilson et al. [88] used call detail records pertaining to phone metadata tracking numbers and times of calls to estimate population distribution and socioeconomic status for risk assessment. It became evident that the analysis of mobile data and online content can help policymakers understand the behavior of communities, which allows researchers to test their response to disaster management plans and training [10]. According to Horita et al. [94], combining sensor data with user-generated data proves to be an effective risk management strategy. They developed a spatial decision support system that integrated the information provided by WSN and VGI for flood risk management. This integration can support the decision-making of disaster management agencies by improving the maintainability and assessment of WSN, as well as providing data from poorly gauged or un-gauged areas through VGI.
4.1.2. Forecasting and Predicting
Predictive analytics can be powerful tools for natural disaster management. Natural disasters are difficult to forecast because of the complexity associated with the physical phenomena and variability of the parameters involved [96,97,98]. Existing natural disaster forecasting approaches mostly rely on the underlying physical models and parameters. Nevertheless, prediction capabilities of these approaches have been enhanced in recent years, enabling them to provide higher resolution results, create better physical schemes, and develop the ability to access new data more broadly.
Higher resolution prediction models have been developed for meteorological events, including tropical cyclones, hurricanes, winter storms, or general weather prediction. Murakami et al. [52] introduced the High-Resolution Forecast-Oriented Low Ocean Resolution (FLOR) model (HiFLOR), which has high resolution (~25-km mesh) atmosphere and land components and a more moderate-resolution (~100-km mesh) sea ice and ocean component. The decrease in horizontal resolution (from originally 50 km to 25 km) was made by directly reducing the horizontal grid spacing of the cubed sphere in the underlying model scheme. This resulted in a more realistic simulation of the structure, global distribution, and seasonal and inter-annual variations of tropical cyclones. In addition, it became possible for the higher resolution model to simulate and predict extremely intense tropical cyclones (Saffir–Simpson hurricane categories 4 and 5) and their inter-annual variations. This was the first time that a global coupled model was able to simulate such extremely intense tropical cyclones in situations such as multi-century simulation, sea surface temperature restoring simulations, and retrospective seasonal predictions. Another way to increase prediction resolution is through nested modeling. Goldenberg et al. [54] presented the 2012 version of the Hurricane Weather Research and Forecasting Model (H212). In being an enhanced version of the 2007 version, H212 has an enhanced horizontal resolution of up to 3 km, which makes it the first operational model that meets the condition of running on convection-permitting resolution. The foundational improvement was that the horizontal resolution for HWRF was increased to a 27-km outer domain with 9-km intermediate and 3-km innermost moving nests.
Better underlying physical schemes have been developed with the help of prediction models by integrating big earth observation data [95,96]. As argued by Zhang et al. [95], the most recent upgrades in boundary layer physics have benefited from analyses of in situ aircraft observations in the low-level eye-wall region of major hurricanes. The boundary layer height is an important parameter because it regulates the vertical distribution of turbulent fluxes and helps determine where turbulent fluxes are negligible. Zhang et al. [97] identified different height scales in the hurricane boundary layer in terms of the height of the maximum tangential wind speed, the inflow layer depth, and the mixed layer depth. By analyzing hundreds of GPS dropsondes released from aircraft, they found that there is a clear separation of the thermo-dynamical and dynamical boundary layer depths. They also found that both dynamical and thermo-dynamical boundary layer height scales tend to decrease as distance is reduced from the storm center. These findings were integrated into the operational Hurricane Weather Research and Forecasting (HWRF) Model [98]; and prediction results showed considerable improvements in the simulated storm size, surface inflow angle, near-surface wind profile, and kinematic boundary layer heights in simulations carried out with the improved use of physics [95].
The enhancement of prediction capability becomes partially better due to greater access to new data. A pertinent example in this regard is the Cyclone Global Navigation Satellite System (CYGNSS), which is a NASA earth science mission launched in 2016 that focuses on tropical cyclones and tropical convection [99]. The goal of CYGNSS is to support significant improvements in our ability to forecast tropical cyclone track, intensity, and storm surge through better observations and, ultimately, better understanding of inner-core processes. Another method of integrating observation data into prediction models is through data assimilation, which is defined as (https://www.ecmwf.int/en/research/data-assimilation) “typically a sequential time-stepping procedure, in which a previous model forecast is compared with newly received observations, the model state is then updated to reflect the observations, a new forecast is initiated, and so on.” Zhang and Weng [100] assimilated high-resolution airborne radar observations into hurricane prediction. With this assimilation, four to five days before these storms made landfall, the system produced good deterministic and probabilistic forecasts of not only track and intensity, but also of the spatial distributions of surface wind and rainfall.
4.2. Preparedness
4.2.1. Monitoring and Detection
Effective monitoring is very helpful in improving the management of disasters. One of the major sources of big data for disaster monitoring and detection is remote sensing data, which are available in different spatial and temporal resolutions with an adequate level of accuracy. Satellite remote sensing capabilities have long been used to monitor for timely and near-real-time disaster detection [105]. Effective management of disasters such as fires or floods can be done through multitemporal remotely sensed imagery, which is imagery captured over the same location at several points in time, usually days apart. It can be used to monitor the ways in which the event is spreading and helps decision makers in developing and implementing mitigation strategies [104,106,107]. The major goal of the early monitoring phase is to define a boundary that delimits the affected area, so that preliminary information on the event can be generated. Large coverage remote sensing data with a low spatial resolution (>30 m) is appropriate for this phase, whereas high- and very-high-resolution data could be a waste of resources. Automatic extraction of data relative to the disaster impacted area facilitates quick availability of the required information.
The second major source of big data for disaster monitoring and detection is user-generated data available on various platforms, including social media websites and VGI. According to Arribas-Bel [110], each user is considered as a sensor that contributes data for filling the gaps in the availability of authentic data about disasters [126,127]. Earle et al. [108] investigated the capability of using Twitter for rapid earthquake detection. Their investigation was based on the observation that people start conveying messages on Twitter the moment they start feeling the tremors. Such messages or tweets on Twitter were found to be in correlation with the peaks of earthquake-related tweet-frequency time series and the times when the event started. Cervone et al. [127] conducted comprehensive research in analyzing the flood management efforts during the Boulder flood disaster in 2013. Real-time data from Twitter was monitored to identify hotspots and keywords for the disaster in prioritizing the collection of remote-sensing images for the different disasters.
The integration of traditional remote sensing data and newly emerged big social-sensing data has facilitated better understanding in the context of the location, timing, causes, and impacts of natural disasters. This helps a great deal in enhancing the speed and effectiveness of the disaster response. Musaev et al. [111] developed a landslide detection system that integrates multiple physical sensors (USGS seismic network, NASA TRMM rainfall network) and social media (Twitter, YouTube, and Instagram) to determine the varied origins and compositions of multi-hazards. The authors collected social media data that was systematically preprocessed along with keyword filtering, stop-words and phrases filtering, geotag filtering, classification filtering, and blacklist filtering. Earth surface was represented as fixed-size grids and the geotagged social media posts were grouped based on their coordinates to determine areas where landslides might have occurred. Data from the physical and social sensors were integrated by the fixed grid using a Bayesian-based relevance ranking strategy, while favoring landslide events detected from both social and physical sensors. Jongman et al. [116] integrated near-real-time satellite data and social media information for better flood monitoring. They found that satellite imagery is better suited for monitoring large floods, while Twitter can be used to monitor floods of any size, as long as the observations and discussions are shared by people on social media. Crowdsourced hazard detection techniques can enlist citizens to provide information by posting pictures of the disaster’s activity.
4.2.2. Early Warning
Sensor data are usually the major data sources for early warning system development. Mandl et al. [109] demonstrated the “Namibia Flood SensorWeb” early warning system based on integrated satellite and ground sensor data for flood situational awareness and early warning. Different types of data are integrated in the system, including river gauge, TRMM rainfall, MODIS flood extent, Radarsat SAR derived flood extent, river flow estimated from the Terra satellite, and flood model data. The system is capable of a sensor planning service (query sensor and initiate data acquisition), web notification service (provide alerts for events such as data product availability), sensor observation service (provide access to raw data), and web processing service (provide data processing function to create high level data products). Poslad et al. [112] proposed a semantic early warning system based on IoT, in which metadata is used to enhance rich sensor data acquisition and ontology models describing multilevel knowledge-bases are used to support decision support and workflow orchestration.
Social media also benefits early warning in a certain way. Carley et al. [76] examined the use of Twitter in Indonesia for early warning and planning for disasters. The coverage, spatiotemporal patterns, and identification of opinion leaders were assessed for the suitability of Twitter for early warning. The paper concluded that with careful collection, assessment, and coordination with official disaster Twitter sites, Twitter is capable of supporting early warning; and that a local Twitter opinion leader will have a critical role in the early warning process.
4.3. Response
4.3.1. Damage Assessment
The most well-known data source for damage assessment is remote sensing imagery. Different types and resolutions of remote sensing data are in demand depending on the extent of details required. Low resolution but large scale remote sensing data provides a quick initial assessment of the impacted area when in situ observations are not yet available. The initial assessment also guides disaster responders to prioritize the areas to be inspected with higher resolution data. Detailed damage assessment, including buildings and roads, requires higher resolution and three-dimensional (3D) data to provide accurate information about the intensity of the damage. Using Formosat-2 and Satellite pour Observation de la Terre (SPOT)-5 satellite images, Liou et al. [19] were able to identify the structural deformation of land areas, changes in directions of rivers, creation of new lakes, and the water levels of rivers and lakes in the 2008 Wenchuan earthquake affected area. The method used by Liou et al. [19] for analyzing such satellite imagery was mainly visual interpretation, even though methods of automatic extraction were also developed [20]. Very-High-Resolution satellite imagery (with a spatial resolution finer than1 m) are mostly suited for detecting disruption to transportation networks and for identifying open spaces that can be used for locating shelters [113,128].
UAV-based aerial imagery is an emerging method that allows data collection for disaster management and provides a better resolution than that available through manned aircrafts. They provide more flexible data acquisition that improves the quality of the point clouds that can be derived for this purpose. UAV imagery and videos analyze the disaster-impacted area in a high spatiotemporal resolution. Using UAV data that has a resolution better than 1cm, Fernandez Galarreta et al. [114] identified a number of damage features for each building focusing on aspects such as total collapse, collapsed roof, rubble piles, and inclined façades. The analysis was first conducted through visual inspection by experts using a 3D point cloud (generated from the raw UAV imagery) for damaged features. Thereafter, a more detailed object-based damage feature extraction from imagery was done in the context of façade and roof analysis of the buildings that did not show any damage features in the previous step. Damage information acquired from the 3D point and the imagery was aggregated to identify the extent of major damages.
Crowdsourced platforms, where images and descriptions of the disaster impacted places can be uploaded from disaster impacted residents, have been found to be helpful for damage assessment. During the 2010 Haiti Earthquake, the Global Earth Observation Catastrophe Assessment Network (GEN-CAN) was established by ImageCat Inc. The firm trained over 600 image professionals to identify collapsed and heavily damaged structures over an affected area of 1000 square kilometers [115]. Similarly, in regard to the Super Typhoon Haiyan that swept the Philippines in 2013, volunteers conducted a remote damage assessment based on satellite imagery on an OpenStreetMap-based application, which was led by the Humanitarian OpenStreetMap Team [129]. Social media data was also collected for Tyhoon Haiyan from Chinese microblog “Weibo” to estimate the extent of damage in the typhoon impacted area in China. Twitter was used as a big data tool during and after Hurricane Sandy struck the East Coast of the United States in 2012 [130]. FEMA organized groups of public and private agencies to analyze the tweets to plot out locations where aid and resources were most needed.
4.3.2. Post-Disaster Coordination and Response
It is imperative for a post-disaster response such as search and rescue operations to be conducted quickly and efficiently. A major problem in this regard is the lack of communication and situational awareness during disasters that forces first responder teams to improvise and thus lessen the efficiency of the rescue mission. A major issue with disasters is that they are mostly characterized by limited resources and dynamic change in the environment, and under such circumstances, it is always problematic to use the limited resources effectively in providing the best communication services. Big data analytics provides possible solutions to understand the situations in disaster areas, because it has the potential of using the limited resources optimally.
Aerial ad-hoc networks are associated with the advantage of being deployed in critical situations where terrestrial mobile devices might not operate. However, their implementation is challenging from the point of view of mobility management and coverage lifetime. Di Felice et al. [117] investigated the utilization of low-altitude aerial mesh networks created by Small Unmanned Aerial Vehicles (SUAVs). The objective was to re-establish connectivity among isolated end-user devices located on the ground. They proposed a distributed mobility algorithm based on the virtual spring model, through which the SUAV-based mesh node can self-organize into a mesh structure by guaranteeing Quality of Service over the aerial link and connecting the maximum number of devices. They also proposed a distributed charging scheduling scheme through which a constant coverage of sensing devices can be guaranteed over the disaster scenario. Mosterman et al. [118] proposed an automated disaster response system that integrates varied kinds of autonomous vehicles, including ground vehicles, for setting up local stations, fixed wing aircraft for assessing infrastructure damage, and rotorcraft for delivering disaster supplies. These vehicles are coordinated and controlled by the proposed cyberspace operation system that integrates information and assists disaster response automation. Lu et al. [119] designed and implemented a system called TeamPhone, which provides smart phones with the capabilities of communications during disaster recovery, including a messaging system and a self-rescue system. The messaging system integrates cellular networking, ad-hoc networking, and opportunistic seamless networking and enables effective communications between rescue workers. The self-rescue system efficiently groups the smart phones of trapped survivors and sends out disaster messages in facilitating rescue operations.
The different sources through which big data is used by entities involved in the assessment of disaster damage need to be effectively coordinated in order to confirm the damage, know of the destruction that may have been left undetected, and prevent the duplication of efforts by disaster responders. Cervone et al. [127] found that the integration of user generated data (crowdsourcing and social media) and physical sensing data (satellite and aerial imagery) can enhance the accuracy of the former and increase the temporal resolution of the latter, thus providing a more comprehensive compact dataset. For example, after the Haiti earthquake, coordinating systems such as the UN inter-agency OneResponse website, the Sahana Free and Open Source Disaster Management System, and the crowdsourcing platform Ushaidi were established to coordinate a massive amount of information [120]. These systems allow the public to provide information about missing persons or to track missing people’s location. The comprehensive data proves to be valuable in designing and executing task response operations, which means it should be made available as early as possible so as to limit the death toll and additional loss of property [19].
4.4. Recovery
The post-disaster recovery phase relates to the period after which initial relief has been provided and is characterized by efforts directed at bringing back normalcy in people’s lives and improving the overall circumstances. The major data source for post-disaster recovery monitoring is remote sensing data, including satellite and aerial imagery. Based on change detection from multi-temporal remote sensing data, needs for reconstruction around damaged areas can be detected and monitored. The methodology of change detection is similar in comparison to damage assessment. For example, de Alwis Pitts and So [121] utilized an object-based change detection mechanism to identify the changes before and after two earthquake events; the Van earthquake in eastern Turkey in 2011 and the Kashmir earthquake in northwest Pakistan in 2005. They used high resolution satellite imagery, including the WorldView-2 (0.46 m for panchromatic band and 1.85 m for multispectural band), the Geoeye-1 (0.41 m for panchromatic band and 1.65 m for multispectual band), and the Quickbird-2 (2.44 m for spectral and 0.61 for panchromatic band). Pre- and post-disaster imagery was acquired and road information was obtained from openStreetMap. The changes in edges, texture, and gradient of primary roads were calculated, and changes of open green spaces were also detected. It became apparent that the quantified information contributed to the observation of disaster recovery over time. Contreras et al. [122] reported the progress of recovery efforts after the earthquake at L’Aquila, Italy in 2009. The recovery evaluation was based on remote sensing and ground observations. They used QuickBird imagery to detect the progress during the recovery process from damaged buildings. GPS and other ground observations were collected progressively (every two years). Results of the recovery revealed the socio-economic progress after the earthquake.
The literature has vastly cited the outcomes emanating from user generated data obtained from social media and VGI platforms during post-disaster recovery. A major challenge for disaster management in utilizing such data is their limited capability of handling big data. Afzalan et al. [124] examined how active and influential members of Facebook groups aided in disaster recovery after the occurrence of Hurricane Sandy. Network analysis was carried out to find influential members and a web-survey was conducted to learn about their background and volunteer activity inside and outside Facebook. In effect, disaster recovery organizations can approach these influential people and collaborate with them in conducting recovery procedures. Yan et al. [125] utilized geotagged Flickr photos to monitor and assess post-disaster tourism recovery after the Philippines earthquake and Typhoon Haiyan in 2013. Geotagged Flickr photos were analyzed through quality enhancement (both locational accuracy and thematic accuracy), and quantitative and qualitative investigation of the available visual contents. Results showed spatiotemporal patterns of the recovery status and trends.
5. Two Emerging Topics—Evolutionary Technologies
Figure 4 illustrates the increasing popularity of “machine learning” and a significant popularity of “cyberinfrastructure” applied in the research of “big data” in “disaster management”. Here, we review the two major topics, machine learning and big data cyberinfrastructure, as evolutionary technologies which facilitate disaster management in various ways.
5.1. Machine Learning
A great deal of uncertainty is created when different sources of big data are integrated for the purposes of disaster awareness and response. Manual interpretation and analysis of the integrated data is no longer adequate, which is why sophisticated automatic analysis methods are required to make the process efficient and effective. Machine learning was introduced in the field of disaster management two decades back and has since evolved to become one of the most effective methods for eliminating unrelated data and speeding up the analysis in disaster situations, which helps in quick prediction analysis and identifying optimal response strategies.
Text classification of social media data classifies disaster response-related tweets and facilitates the rapid identification of disaster relief contents. Imran et al. [80] developed a system of Artificial Intelligence for Disaster Response (AIDR) to classify messages that people post during disasters into a set of user-defined categories of information (e.g., “needs”, “damage”, etc.). In meeting this purpose, the system continuously sources data from Twitter, processes it (i.e., using machine learning classification techniques), and leverages human-participation (through crowdsourcing) in real-time. AIDR has been successfully tested to classify informative vs. non-informative tweets posted during the 2013 Pakistan Earthquake. Based on AIDR, Bejiga et al. [131] proposed a hybrid crowdsourcing and real-time machine learning solution to rapidly process large volumes of aerial data for disaster response in a time-sensitive manner. Crowdsourcing was used to annotate features of interest in aerial images (such as damaged shelters and roads blocked by debris). These human-annotated features were then used to train a supervised machine learning system to learn to recognize such features in new unseen images.
Utilizing techniques through which machines are trained to detect damages helps in reducing human interaction and improves the performance of dynamic decision making. During the damage assessment stage, visual interpretation of satellite/aerial imagery and videos often proves to be time consuming, inaccurate, and costly. In addition, ancillary data such as UAV products, LiDAR, or GIS databases are mostly unavailable in regions where the death toll is highest [123]. Machine learning algorithms actively adapt with and learn the problem without relying on statistical assumptions about data distribution [132]. Machine learning algorithms have an overall improved accuracy compared to traditional classification and change detection methods. They work with nonlinear datasets [133], allow learning with limited training data [134], and successfully solve classification problems that are difficult to distinguish. For example, Cooner et al. [135] used high spatial resolution imagery acquired through WorldView-1 and Quickbird 2 to investigate the effectiveness of Artificial Neural Networks and Random Forests in detecting damages to buildings caused by the 2010 Haiti earthquake.
More recently, new learning emerged as one of the breakthroughs in machine learning that could be applied to disaster management. For example, Cha et al. [136] proposed a convolutional neural network approach to detect concrete cracks without the need to calculate a defect feature that is normally impacted by the noise included with the data. The proposed approach classified the detected cracks into different characteristics, including strong light spots, shadows, and very thin cracks and demonstrated robust performance in comparison to traditional edge detection methods (canny and sobel), which fail to provide meaningful crack information. Pouyanfar and Chen [137] proposed an ensemble deep learning framework to extract information from YouTube disaster videos in the context of flood, damage, fire, mud-rock, tornado, and lightning. Videos are firstly preprocessed into shots by boundary detection and key-frame selection, and then features are extracted through deep learning reference models on each key-frame. Well-known classifiers, such as Decision Tree and Support Vector Machine, were applied to the features for such classification.
In addition to real-time damage assessment and disaster monitoring, predictive damage assessment tools can now leverage Machine Learning and historical and Big Data analytics to improve damage forecasting modeling. Asim et al. [138] evaluated four machine learning techniques including the pattern recognition neural network, recurrent neural network, random forest, and linear programming boost ensemble classifier to model relationships between calculated seismic parameters and future earthquake occurrences. In addition, by automating such processes, it becomes possible to respond to the evolving disaster scenarios.
5.2. Big Data Cyberinfrastructure
In the context of data recovery and security, Chang [139] proposed a private cloud approach that allows data to be restored to multiple sites with multiple methods in facilitating the organization to recover close to 100 percent of the data. In doing so, data centers must adopt multi-purpose approaches in ensuring that all the data in the Big Data system can be recovered and retrieved without experiencing a prolonged downtime and complex recovery process.
Disaster management becomes more efficient if data is acquired from different sources in a higher spatial and temporal resolution. However, challenges emerge because of the constantly increasing quantum of image and video data. Emerging technological innovations including social media, location-based systems, radio frequency identification, and big data analytics are considered as powerful tools that may help during the disaster management cycle. Processing and analyzing the heterogeneous big disaster data requires efficient data collection, aggregation, information extraction, visualization, and efficient distribution. The growth of data and the need for an efficient distribution makes the development and operation of cyberinfrastructure very demanding. Wan et al. [140] developed a cloud-based flood cyber-infrastructure that collects, organizes, visualizes, and manages several global flood databases in facilitating location-based visualization and statistical analysis for authorities and the public. This system allows the collection of crowdsourcing data from smart phones or the internet to report new flood events.
Belaud et al. [141] proposed a cloud computing platform for scientific simulation that facilitates efficient natural hazards management with an analysis of big data and its exchange between distant locations. This platform provides pre- and post-processing visualization services, 3D large scientific data-set scalable compression and transmission methods, collaborative virtual environments, and 3D visualization. Puthal et al. [142] presented a framework that supports disaster event detection and the generation of alerts by analyzing the data stream, which includes efficient data collection, data aggregation, and efficient dissemination. One of the goals of such a framework is to support an end-to-end security architecture that protects the data stream from unauthorized manipulation, as well as the leakage of sensitive information. Hua et al. [143] proposed a near-real-time and cost-efficient scheme, called SmartEye, in the cloud-assisted disaster environment, which provides efficient image sharing for disaster detection and scene recognition by de-duplicating and aggregating similar features into one single flow. Wilson et al. [88] deployed a computational architecture and analytical capacity within nine days of the Nepal earthquake of 25 April 2015, to provide spatiotemporally detailed estimates of population displacements from call detail records based on the movements of 12 million de-identified mobile phones users. The analysis reveals the detailed mobility patterns of people after the earthquake and the patterns of their return to affected areas.
Bartoli et al. [144] proposed an efficient architecture of a smart public safety platform that performs a smart and functional integration of heterogeneous components as a smart data gathering and analysis system, a novel professional communication system, wireless sensor networks, and social networks. It integrates advanced infrastructures and analysis methods to coordinate the information flow between first responders, public authorities, and citizens. It allows responders and authorities to access the information available on the platform by using an advanced broadband communication system that can receive multimedia data for more effective and efficient operations in the field. Trono et al. [145] developed a Disruption Tolerant Network (DTN) distributed computing system for disaster map data generation and sharing. The system distributes computing tasks to multiple computing resources in minimizing individual computation loads. First responders and volunteers act as mobile sensing nodes as their GPS traces are collected for real-time disaster relief efforts.
6. Big Data Challenges in Disaster Management
6.1. Big Data Collection
In disaster management scenarios, a rapidly generated, big volume of data (e.g., 452,000 tweets/min, extreme weather simulation TB/day) needs to be analyzed in a real-time fashion for immediate action. Archives of historical data needs to be shared with researchers online and services of evaluation and validation of analysis methods or models need to be standardized and made publically available.
Disaster management requires a large variety of heterogeneous data from different data sources and might fill in the gaps between them, providing valuable information for all phases in the disaster management cycle. Sensors might generate different types of data, including time series, semi-structured data, and textural data; and these data might include noise and misinformation. Integrating multiple sources of data might contribute to the improvement of data quality and data completeness, but individual data validation needs to be conducted before data integration. Data integration in the context of disaster management can benefit from the semantics or properties associated with the data itself.
Noises and misinformation from big data are almost inevitable as a lot of these are unintentional, especially from social media and crowdsourcing. In addition, data privacy and accuracy issues are still one of the main challenges associated with big data collection, even though protocols and analytical methods for dealing with these issues are crucially required during disaster management. Integrating multiple sources of data can help eliminate such noise and misinformation. Streaming data, such as sensor outputs and crowdsourcing data, needs to be enhanced with anomaly detection to identify incorrect data due to system failure or misguiding data collection methods. Machine learning can contribute to automating such data integrating and the filtering process, and ultimately increase the data quality.
6.2. Big Data Analytics
With the synthesis of multi-platform, multi-scale, and multi-discipline data, the capability of predictive modeling of natural disasters should become more efficient. Research and activities related to utilizing the synthesized information and predictive analysis results are expected to better enhance our ability to adaptively respond and plan. It has been found that crowdsourced data, especially the ones provided by the disaster affected people, have significant value during the disaster awareness phase. However, analytical methods are still needed to reliably and accurately integrate these crowdsourced data into the physical sensing data (e.g., satellite, UAV) and authoritative data (e.g., terrain data, census data). Only then can the disaster be effectively characterized in terms of situational awareness, spatiotemporal damage patterns, and community resilience. Consequently, decision-making processes can benefit from the analytical results and design rescue and response efforts in terms of both space and time, for the affected populations and communities.
6.3. Cyberinfrastructures
There is crucial need for the design and development of cyberinfrastructures in ways that big data is effectively integrated into disaster sensing, analysis, and response phases to support first responders and disaster management agencies for real-time decision making. Such capabilities of cyberinfrastructure provide decision makers and responders from different organizations and disciplines with shared knowledge and a communicating platform that allows for conducting the disaster response process in an effective manner. Research efforts and related activities are still required to look into the challenges emanating from big sensing data, particularly in the context of the emerging data volume of streaming videos, including efficient data management, fast data transfer, and intuitive data visualization.
7. Conclusions
In analyzing the recent achievements associated with leveraging Big Data to disaster management, this paper has presented the findings of several researchers on varied scientific and technological perspectives that have a bearing on the efficacy of big data in facilitating disaster management. It has become apparent that in the present age of information technology, a major objective of scientists is to analyze the varied aspects of big data and find ways of making the best of the available technologies in storing the available information in well-integrated structures and using it for the welfare of human societies, particularly in the context of using bid data to effectively deal with natural disasters. The paper has analyzed major big data sources that are valuable in disaster management. A detailed analysis has been conducted to highlight the significance of different big data sources in various disaster management phases. The main challenges pertain to effectively dealing with data collection and management technologies and developing efficient systems of mitigating the adversities associated with natural disasters and managing disasters in ways that result in minimum losses to human lives and property. Other challenges pertain to developing algorithms by way of systems that can be used in resolving operational issues and attaining greater accuracy in predicting disasters. The paper has highlighted the need for further research on big data applications in enhancing the efficiency of the public sector in further developing technology to mitigate the adverse effects of natural disasters. Overall, further research efforts need to be made to look into the challenges emerging from Big Sensing Data, particularly in the context of the emerging data volume of streaming videos, including efficient data management, fast data transfer, and intuitive data visualization.
Author Contributions
Manzhu Yu contributed in the study conception and design, acquisition of the reviewed paper, analysis of the literature review, and the writing. Chaowei Yang contributed in the initial idea of the paper. Yun Li revised an earlier version of the paper.
Funding
This work was supported by the NSF Cyber Polar, Innovation Center, EarthCube and Computer Network System Programs: [Grant NumbersPLR-1349259;IIP-1338925; CNS-1117300; ICER-1343759]; NASA: [Grant Number NNG12PP37I; NNX15AH51G].
Acknowledgments
We thank the anonymous reviewers for their insightful comments, which significantly improved the paper.
Conflicts of Interest
The authors declare no conflict of interest.
References
- Blaikie, P.; Cannon, T.; Davis, I.; Wisner, B. At Risk: Natural Hazards, People’s Vulnerability and Disasters; Routledge: London, UK, 2014. [Google Scholar]
- Celik, S.; Corbacioglu, S. Role of information in collective action in dynamic disaster environments. Disasters 2010, 34, 137–154. [Google Scholar] [CrossRef] [PubMed]
- Sutanta, H.; Bishop, I.D.B.; Rajabifard, A.R. Integrating spatial planning and disaster risk reduction at the local level in the context of spatially enabled government. In Spatially Enabling Society Research, Emerging Trends and Critical Assessment; Abbas, R., Joep, C., Kalantari, M., Kok, B., Eds.; Leuven University Press: Leuven, Belgium, 2010; pp. 55–68. ISBN 978-90-5867-851-5. [Google Scholar]
- Penning-Rowsell, E.C.; Sultana, P.; Thompson, P.M. The ‘last resort’? Population movement in response to climate-related hazards in Bangladesh. Environ. Sci. Policy 2013, 27, 445. [Google Scholar] [CrossRef]
- Gaillard, J.C.; Mercer, J. From knowledge to action: Bridging gaps in disaster risk reduction. Prog. Hum. Geogr. 2013, 37, 93–114. [Google Scholar] [CrossRef]
- Villars, R.L.; Olofson, C.W.; Eastwood, M. Big Data: What It Is and Why You Should Care; IDC: Framingham, MA, USA, 2011. [Google Scholar]
- Hashem, I.A.T.; Yaqoob, I.; Anuar, N.B.; Mokhtar, S.; Gani, A.; Khan, S.U. The rise of “big data” on cloud computing: Review and open research issues. Inf. Syst. 2015, 47, 98–115. [Google Scholar] [CrossRef]
- National Research Council. Public Response to Alerts and Warnings on Mobile Devices: Summary of a Workshop on Current Knowledge and Research Gaps; National Academies Press: Washington, DC, USA, 2011; ISBN 978-0-309-21162-8. [Google Scholar]
- Castillo, C. Big Crisis Data: Social Media in Disasters and Time-Critical Situations; Cambridge University Press: Cambridge, UK, 2016; ISBN 9781107135765. [Google Scholar]
- Cinnamon, J.; Jones, S.K.; Adger, W.N. Evidence and future potential of mobile phone data for disease disaster management. Geoforum 2016, 75, 253–264. [Google Scholar] [CrossRef]
- Erdelj, M.; Natalizio, E. UAV-assisted disaster management: Applications and open issues. In Proceedings of the 2016 International Conference on Computing, Networking and Communications (ICNC 2016), Kauai, HI, USA, 15–18 February 2016; IEEE: Piscataway, NJ, USA, 2016; pp. 1–5. [Google Scholar]
- Dos Santos Rocha, R.; Widera, A.; van den Berg, R.P.; de Albuquerque, J.P.; Helingrath, B. Improving the Involvement of Digital Volunteers in Disaster Management. In Proceedings of the International Conference on Information Technology in Disaster Risk Reduction, Sofia, Bulgaria, 16–18 November 2016; Murayama, Y., Velev, D., Zlateva, P., Gonzalez, J.J., Eds.; Springer: Cham, Switzerland, 2016; pp. 214–224. [Google Scholar]
- Federal Geographic Data Committee. Emerging Technologies and the Geospatial Landscape. A Report of the National Geospatial Advisory Committee. Available online: https://www.fgdc.gov/ngac/meetings/dec-2016/ngac-paper-emerging-technologies-and-the.pdf (accessed on 22 April 2018).
- United Nation. Data-Pop Alliance Synthesis Report Big Data for Climate Change and Disaster Resilience: Realizing the Benefits for Developing Countries. Available online: http://datapopalliance.org/wp-content/uploads/2015/11/Big-Data-for-Resilience-2015-Report.pdf (accessed on 22 April 2018).
- Skakun, S.; Kussul, N.; Shelestov, A.; Kussul, O. Flood hazard and flood risk assessment using a time series of satellite images: A case study in Namibia. Risk Anal. 2014, 34, 1521–1537. [Google Scholar] [CrossRef] [PubMed]
- Plank, S. Rapid damage assessment by means of multi-temporal SAR—A comprehensive review and outlook to Sentinel-1. Remote Sens. 2014, 6, 4870–4906. [Google Scholar] [CrossRef] [Green Version]
- Yamazaki, F.; Liu, W. Remote sensing technologies for post-earthquake damage assessment: A case study on the 2016 Kumamoto earthquake. In Proceedings of the 6th Asia Conference on Earthquake Engineering (6ACEE), Cebu City, Philippines, 22–24 September 2016. [Google Scholar]
- Pradhan, B.; Tehrany, M.S.; Jebur, M.N. A new semiautomated detection mapping of flood extent from TerraSAR-X satellite image using rule-based classification and taguchi optimization techniques. IEEE Trans. Geosci. Remote Sens. 2016, 54, 4331–4342. [Google Scholar] [CrossRef]
- Liou, Y.A.; Kar, S.K.; Chang, L. Use of high-resolution FORMOSAT-2 satellite images for post-earthquake disaster assessment: A study following the 12 May 2008 Wenchuan Earthquake. Int. J. Remote Sens. 2010, 31, 3355–3368. [Google Scholar] [CrossRef]
- Ehrlich, D.; Kemper, T.; Blaes, X.; Soille, P. Extracting building stock information from optical satellite imagery for mapping earthquake exposure and its vulnerability. Nat. Hazards 2013, 68, 79–95. [Google Scholar] [CrossRef]
- Dini, G.R.; Jacobsen, K.; Rottensteiner, F.; Al Rajhi, M.; Heipke, C. 3D building change detection using high resolution stereo images and a GIS database. In Proceedings of the International Archives of the Photogrammetry, Remote Sensing and Spatial Information Sciences, Melbourne, Australia, 25 August–1 September 2012; Volume 39, pp. 299–304. [Google Scholar] [CrossRef]
- Tian, J.; Nielsen, A.A.; Reinartz, P. Building damage assessment after the earthquake in Haiti using two post-event satellite stereo imagery and DSMs. Int. J. Image Data Fusion 2015, 6, 155–169. [Google Scholar] [CrossRef] [Green Version]
- Tong, X.; Hong, Z.; Liu, S.; Zhang, X.; Xie, H.; Li, Z.; Yang, S.; Wang, W.; Bao, F. Building-damage detection using pre-and post-seismic high-resolution satellite stereo imagery: A case study of the May 2008 Wenchuan earthquake. ISPRS J. Photogramm. Remote Sens. 2012, 68, 13–27. [Google Scholar] [CrossRef]
- Tian, J.; Cui, S.; Reinartz, P. Building Change Detection Based on Satellite Stereo Imagery and Digital Surface Models. IEEE Trans. Geosci. Remote Sens. 2014, 52, 406–417. [Google Scholar] [CrossRef] [Green Version]
- Koyama, C.N.; Gokon, H.; Jimbo, M.; Koshimura, S.; Sato, M. Disaster debris estimation using high-resolution polarimetric stereo-SAR. ISPRS J. Photogramm. Remote Sens. 2016, 120, 84–98. [Google Scholar] [CrossRef]
- Chini, M.; Piscini, A.; Cinti, F.R.; Amici, S.; Nappi, R.; DeMartini, P.M. The 2011 Tohoku (Japan) Tsunami inundation and liquefaction investigated through optical, thermal, and SAR data. IEEE Geosci. Remote Sens. Lett. 2013, 10, 347–351. [Google Scholar] [CrossRef]
- Pesaresi, M.; Ehrlich, D.; Ferri, S.; Florczyk, A.; Freire, S.; Haag, F.; Halkia, M.; Julea, A.M.; Kemper, T.; Soille, P. Global human settlement analysis for disaster risk reduction. Int. Arch. Photogramm. Remote Sen. Spat. Inf. Sci. 2015, 40, 837. [Google Scholar] [CrossRef] [Green Version]
- McCallum, I.; Liu, W.; See, L.; Mechler, R.; Keating, A.; Hochrainer-Stigler, S.; Mochizuki, J.; Fritz, S.; Dugar, S.; Arestegui, M.; et al. Technologies to support community flood disaster risk reduction. Int. J. Disaster Risk Sci. 2016, 7, 198–204. [Google Scholar] [CrossRef] [Green Version]
- Raspini, F.; Bardi, F.; Bianchini, S.; Ciampalini, A.; Del Ventisette, C.; Farina, P.; Ferrigno, F.; Solari, L.; Casagli, N. The contribution of satellite SAR-derived displacement measurements in landslide risk management practices. Nat. Hazards 2017, 86, 327–351. [Google Scholar] [CrossRef]
- Ofli, F.; Meier, P.; Imran, M.; Castillo, C.; Tuia, D.; Rey, N.; Briant, J.; Millet, P.; Reinhard, F.; Parkan, M.; et al. Combining human computing and machine learning to make sense of big (aerial) data for disaster response. Big Data 2016, 4, 47–59. [Google Scholar] [CrossRef] [PubMed]
- Nonami, K.; Kendoul, F.; Suzuki, S.; Wang, W.; Nakazawa, D. Introduction. In Autonomous Flying Robots; Springer: Tokyo, Japan, 2010; pp. 1–29. ISBN 978-4-431-53855-4. [Google Scholar]
- Kim, K.; Davidson, J. Unmanned aircraft systems used for disaster management. Transp. Res. Rec. J. Transp. Res. Board 2015, 2532, 83–90. [Google Scholar]
- Foresti, G.L.; Farinosi, M.; Vernier, M. Situational awareness in smart environments: Socio-mobile and sensor data fusion for emergency response to disasters. J. Ambient Intell. Humaniz. Comput. 2015, 6, 239–257. [Google Scholar] [CrossRef]
- Kakooei, M.; Baleghi, Y. Fusion of satellite, aircraft, and UAV data for automatic disaster damage assessment. Int. J. Remote Sens. 2017, 38, 2511–2534. [Google Scholar] [CrossRef]
- Tanzi, T.J.; Chandra, M.; Isnard, J.; Camara, D.; Olivier, S.; Harivelo, F. Towards” drone-borne” disaster management: Future application scenarios. ISPRS Ann. Photogramm. Remote Sens. Spat. Inf. Sci. 2016, 3, 181. [Google Scholar] [CrossRef]
- Griffin, G.F. The use of unmanned aerial vehicles for disaster management. Geomatica 2014, 68, 265–281. [Google Scholar] [CrossRef]
- Chen, D.; Liu, Z.; Wang, L.; Dou, M.; Chen, J.; Li, H. Natural disaster monitoring with wireless sensor networks: A case study of data-intensive applications upon low-cost scalable systems. Mob. Netw. Appl. 2013, 18, 651–663. [Google Scholar] [CrossRef]
- Erdelj, M.; Natalizio, E.; Chowdhury, K.R.; Akyildiz, I.F. Help from the sky: Leveraging UAVs for disaster management. IEEE Pervasive Comput. 2017, 16, 24–32. [Google Scholar] [CrossRef]
- Erman, A.T.; van Hoesel, L.; Havinga, P.; Wu, J. Enabling mobility in heterogeneous wireless sensor networks cooperating with UAVs for mission-critical management. IEEE Wirel. Commun. 2008, 15, 38–46. [Google Scholar] [CrossRef]
- Carli, M.; Panzieri, S.; Pascucci, F. A joint routing and localization algorithm for emergency scenario. Ad Hoc Netw. 2014, 13, 19–33. [Google Scholar] [CrossRef]
- Khalil, I.M.; Khreishah, A.; Ahmed, F.; Shuaib, K. Dependable wireless sensor networks for reliable and secure humanitarian relief applications. Ad Hoc Networks 2014, 13, 94–106. [Google Scholar] [CrossRef]
- Tuna, G.; Gungor, V.C.; Gulez, K. An autonomous wireless sensor network deployment system using mobile robots for human existence detection in case of disasters. Ad Hoc Netw. 2014, 13, 54–68. [Google Scholar] [CrossRef]
- Ray, P.P.; Mukherjee, M.; Shu, L. Internet of things for disaster management: State-of-the-art and prospects. IEEE Access 2017, 5, 18818–18835. [Google Scholar] [CrossRef]
- Sakhardande, P.; Hanagal, S.; Kulkarni, S. Design of disaster management system using IoT based interconnected network with smart city monitoring. In Proceedings of the International Conference on Internet of Things and Applications (IOTA), Pune, India, 22–24 January 2016; IEEE: Piscataway, NJ, USA, 2016; pp. 185–190. [Google Scholar]
- Bisson, M.; Spinetti, C.; Neri, M.; Bonforte, A. Mt. Etna volcano high-resolution topography: Airborne LiDAR modelling validated by GPS data. Int. J. Dig. Earth 2016, 9, 710–732. [Google Scholar] [CrossRef]
- Nomikou, P.; Parks, M.M.; Papanikolaou, D.; Pyle, D.M.; Mather, T.A.; Carey, S.; Watts, A.B.; Paulatto, M.; Kalnins, M.L.; Livanos, I.; et al. The emergence and growth of a submarine volcano: The Kameni islands, Santorini (Greece). GeoResJ 2014, 1, 8–18. [Google Scholar] [CrossRef] [Green Version]
- Costabile, P.; Macchione, F.; Natale, L.; Petaccia, G. Flood mapping using LIDAR DEM. Limitations of the 1-D modeling highlighted by the 2-D approach. Nat. Hazards 2015, 77, 181–204. [Google Scholar] [CrossRef]
- Chen, B.; Krajewski, W.F.; Goska, R.; Young, N. Using LiDAR surveys to document floods: A case study of the 2008 Iowa flood. J. Hydrol. 2017, 553, 338–349. [Google Scholar] [CrossRef]
- Gong, J. (Mobile lidar data collection and analysis for post-sandy disaster recovery. In Proceedings of the Computing in Civil Engineering, Los Angeles, CA, USA, 23–25 June 2013; American Society of Civil Engineers: Reston, VA, USA, 2013; pp. 677–684. [Google Scholar]
- Kwan, M.P.; Ransberger, D.M. LiDAR assisted emergency response: Detection of transport network obstructions caused by major disasters. Comput. Environ. Urban Syst. 2010, 34, 179–188. [Google Scholar] [CrossRef]
- Moya, L.; Yamazaki, F.; Liu, W.; Yamada, M. Detection of collapsed buildings due to the 2016 Kumamoto, Japan, earthquake from Lidar data. Nat. Hazards Earth Syst. Sci. 2017, 18, 65. [Google Scholar] [CrossRef]
- Murakami, H.; Vecchi, G.A.; Underwood, S.; Delworth, T.L.; Wittenberg, A.T.; Anderson, W.G.; Chen, J.H.; Gudgel, R.G.; Harris, L.M.; Lin, S.J.; et al. Simulation and prediction of category 4 and 5 hurricanes in the high-resolution GFDL HiFLOR coupled climate model. J. Clim. 2015, 28, 9058–9079. [Google Scholar] [CrossRef]
- MacLachlan, C.; Arribas, A.; Peterson, K.A.; Maidens, A.; Fereday, D.; Scaife, A.A.; Gordon, M.; Vellinga, M.; Williams, A.; Comer, R.E.; et al. Global Seasonal forecast system version 5 (GloSea5): A high-resolution seasonal forecast system. Q. J. R. Meteorol. Soc. 2015, 141, 1072–1084. [Google Scholar] [CrossRef]
- Goldenberg, S.B.; Gopalakrishnan, S.G.; Tallapragada, V.; Quirino, T.; Marks, F., Jr.; Trahan, S.; Zhang, X.; Atlas, R. The 2012 triply nested, high-resolution operational version of the Hurricane Weather Research and Forecasting Model (HWRF): Track and intensity forecast verifications. Weather Forecast. 2015, 30, 710–729. [Google Scholar] [CrossRef]
- Kim, J.C.; Jung, H.; Kim, S.; Chung, K. Slope based intelligent 3D disaster simulation using physics engine. Wirel. Pers. Commun. 2016, 86, 183–199. [Google Scholar] [CrossRef]
- Yu, M.; Huang, Y.; Xu, Q.; Guo, P.; Dai, Z. Application of virtual earth in 3D terrain modeling to visual analysis of large-scale geological disasters in mountainous areas. Environ. Earth Sci. 2016, 75, 563. [Google Scholar] [CrossRef]
- Dou, M.; Chen, J.; Chen, D.; Chen, X.; Deng, Z.; Zhang, X.; Xu, K.; Wang, J. Modeling and simulation for natural disaster contingency planning driven by high-resolution remote sensing images. Future Gener. Comput. Syst. 2014, 37, 367–377. [Google Scholar] [CrossRef]
- Mas, E.; Koshimura, S.; Imamura, F.; Suppasri, A.; Muhari, A.; Adriano, B. Recent advances in agent-based tsunami evacuation simulations: Case studies in Indonesia, Thailand, Japan and Peru. Pure Appl. Geophys. 2015, 172, 3409–3424. [Google Scholar] [CrossRef]
- Kureshi, I.; Theodoropoulos, G.; Mangina, E.; O’Hare, G.; Roche, J. Towards an info-symbiotic decision support system for disaster risk management. In Proceedings of the 19th International Symposium on Distributed Simulation and Real Time Applications, Chengdu, Sichuan, China, 14–16 October 2015; IEEE Press: Piscataway, NJ, USA, 2015; pp. 85–91. [Google Scholar]
- Tomaszewski, B.; Judex, M.; Szarzynski, J.; Radestock, C.; Wirkus, L. Geographic information systems for disaster response: A review. J. Homel. Secur. Emerg. Manag. 2015, 12, 571–602. [Google Scholar] [CrossRef]
- Herold, S.; Sawada, M.C. A review of geospatial information technology for natural disaster management in developing countries. Int. J. Appl. Geospat. Res. 2012, 3, 14–62. [Google Scholar] [CrossRef]
- Stefanidis, A.; Crooks, A.; Radzikowski, J. Harvesting ambient geospatial information from social media feeds. GeoJournal 2013, 78, 319–338. [Google Scholar] [CrossRef]
- Loukis, E.; Charalabidis, Y. Active and passive crowdsourcing in government. In Policy Practice and Digital Science; Janssen, M., Wimmer, M.A., Deljoo, A., Eds.; Springer: Cham, Switzerland, 2015; pp. 261–289. ISBN 978-3-319-12783-5. [Google Scholar]
- Tong, Y.; Cao, C.C.; Chen, L. TCS: Efficient topic discovery over crowd-oriented service data. In Proceedings of the 20th ACM SIGKDD International Conference on Knowledge Discovery and Data Mining, New York, NY, USA, 24–27 August 2014; ACM: New York, NY, USA, 2014; pp. 861–870. [Google Scholar]
- Qin, H.; Rice, R.M.; Fuhrmann, S.; Rice, M.T.; Curtin, K.M.; Ong, E. Geocrowdsourcing and accessibility for dynamic environments. GeoJournal 2016, 81, 699–716. [Google Scholar] [CrossRef]
- Büscher, M.; Liegl, M.; Thomas, V. Collective intelligence in crises. In Social Collective Intelligence; Miorandi, D., Maltese, V., Rovatsos, M., Nijholt, A., Stewart, J., Eds.; Springer: Cham, Switzerland, 2014; pp. 243–265. [Google Scholar]
- Tavakkol, S.; To, H.; Kim, S.H.; Lynett, P.; Shahabi, C. An entropy-based framework for efficient post-disaster assessment based on crowdsourced data. In Proceedings of the Second ACM SIGSPATIAL International Workshop on the Use of GIS in Emergency Management, San Jose, CA, USA, 3–5 November 2010; ACM: New York, NY, USA, 2010; p. 13. [Google Scholar]
- Poblet, M.; García-Cuesta, E.; Casanovas, P. Crowdsourcing tools for disaster management: A review of platforms and methods. In AI Approaches to the Complexity of Legal Systems; Casanovas, P., Pagallo, U., Palmirani, M., Sartor, G., Eds.; Springer: Berlin/Heidelberg, Germany, 2014; pp. 261–274. [Google Scholar]
- Palen, L.; Hiltz, S.R.; Liu, S. Online Forums Supporting Grassroots Participation in Emergency Preparedness and Response. Commun. ACM 2007, 50, 54–58. [Google Scholar] [CrossRef]
- Roche, S.; Propeck-Zimmermann, E.; Mericskay, B. GeoWeb and crisis management: Issues and perspectives of volunteered geographic information. GeoJournal 2013, 78, 21–40. [Google Scholar] [CrossRef]
- Sievers, J.A. Embracing Crowdsourcing: A strategy for state and local governments Approaching “Whole Community” Emergency Planning. State Local Gov. Rev. 2015, 47, 57–67. [Google Scholar] [CrossRef]
- Nonnecke, B.M.; Mohanty, S.; Lee, A.; Lee, J.; Beckman, S.; Mi, J.; Krishnan, S.; Roxas, R.E.; Oco, N.; Crittenden, C.; et al. Malasakit 1.0: A participatory online platform for crowdsourcing disaster risk reduction strategies in the philippines. In Proceedings of the Global Humanitarian Technology Conference (GHTC), San Jose, CA, USA, 18–21 October 2017; IEEE: Piscataway, NJ, USA, 2017; pp. 1–6. [Google Scholar]
- Charalabidis, Y.N.; Loukis, E.; Androutsopoulou, A.; Karkaletsis, V.; Triantafillou, A. Passive crowdsourcing in government using social media. Transform. Gov. People Process Policy 2014, 8, 283–308. [Google Scholar] [CrossRef]
- Emergency Alerting Platforms Working Group. Social Media & Complementary Alerting Methods–Recommended Strategies & Best Practices. Available online: https://transition.fcc.gov/bureaus/pshs/advisory/csric5/WG2_FinalReport_091416.docx (accessed on 12 March 2018).
- Granell, C.; Ostermann, F.O. Beyond data collection: Objectives and methods of research using VGI and geo-social media for disaster management. Comput. Environ. Urban Syst. 2016, 59, 231–243. [Google Scholar] [CrossRef]
- Carley, K.M.; Malik, M.; Landwehr, P.M.; Pfeffer, J.; Kowalchuck, M. Crowd sourcing disaster management: The complex nature of Twitter usage in Padang Indonesia. Saf. Sci. 2016, 90, 48–61. [Google Scholar] [CrossRef]
- Middleton, S.E.; Middleton, L.; Modafferi, S. Real-time crisis mapping of natural disasters using social media. IEEE Intell. Syst. 2014, 29, 9–17. [Google Scholar] [CrossRef]
- Nguyen, D.T.; Jung, J.E. Real-time event detection for online behavioral analysis of big social data. Future Gener. Comput. Syst. 2017, 66, 137–145. [Google Scholar] [CrossRef]
- Imran, M.; Castillo, C.; Lucas, J.; Meier, P.; Vieweg, S. AIDR: Artificial intelligence for disaster response. In Proceedings of the 23rd International Conference on World Wide Web, Seoul, Korea, 7–11 April 2014; ACM: New York, NY, USA, 2014; pp. 159–162. [Google Scholar]
- Chae, J.; Thom, D.; Jang, Y.; Kim, S.; Ertl, T.; Ebert, D.S. Public behavior response analysis in disaster events utilizing visual analytics of microblog data. Comput. Graph. 2014, 38, 51–60. [Google Scholar] [CrossRef]
- Landwehr, P.M.; Carley, K.M. Social media in disaster relief. In Data Mining and Knowledge Discovery for Big Data; Chu, W.W., Ed.; Springer: Berlin, Germany, 2014; pp. 225–257. ISBN 978-3-642-40836-6. [Google Scholar]
- Horanont, T.; Witayangkurn, A.; Sekimoto, Y.; Shibasaki, R. Large-scale auto-GPS analysis for discerning behavior change during crisis. IEEE Intell. Syst. 2013, 28, 26–34. [Google Scholar] [CrossRef]
- Li, M.; Li, W.; Fang, R.; Shi, C.; Zhao, Q. Real-time high-precision earthquake monitoring using single-frequency GPS receivers. GPS Solut. 2015, 19, 27–35. [Google Scholar] [CrossRef]
- Song, X.; Zhang, Q.; Sekimoto, Y.; Shibasaki, R. Prediction of human emergency behavior and their mobility following large-scale disaster. In Proceedings of the 20th ACM SIGKDD International Conference on Knowledge Discovery and Data Mining, New York, NY, USA, 24–27 August 2014; ACM: New York, NY, USA, 2014; pp. 5–14. [Google Scholar]
- Donovan, B.; Work, D.B. Using coarse GPS data to quantify city-scale transportation system resilience to extreme events. In Proceedings of the 2015 Transportation Research Board Annual Meeting, Washington, DC, USA, 11–15 January 2015; arXiv: Ithaca, NY, USA, 2015. [Google Scholar]
- Bharti, N.; Lu, X.; Bengtsson, L.; Wetter, E.; Tatem, A.J. Remotely measuring populations during a crisis by overlaying two data sources. Int. Health 2015, 7, 90–98. [Google Scholar] [CrossRef] [PubMed]
- Wilson, R.; zu Erbach-Schoenberg, E.; Albert, M.; Power, D.; Tudge, S.; Gonzalez, M.; Guthrie, S.; Chamberlain, H.; Brooks, C.; Hughes, C.; et al. Rapid and near real-time assessments of population displacement using mobile phone data following disasters: The 2015 Nepal Earthquake. PLoS Curr. 2016, 8. [Google Scholar] [CrossRef] [PubMed]
- Ghurye, J.; Krings, G.; Frias-Martinez, V. A Framework to Model Human Behavior at Large Scale during Natural Disasters. In Proceedings of the 17th IEEE International Conference on Mobile Data Management (MDM), Porto, Portugal, 13–16 June 2016; Chow, C., Jayaraman, P., Wu, W., Eds.; IEEE: Piscataway, NJ, USA, 2016; Volume 1, pp. 18–27. [Google Scholar]
- Poser, K.; Dransch, D. Volunteered geographic information for disaster management with application to rapid flood damage estimation. Geomatica 2010, 64, 89–98. [Google Scholar] [CrossRef]
- Alexander, D.E. Principles of Emergency Planning and Management; Oxford University Press on Demand: Oxford, UK, 2002; ISBN 9780195218381. [Google Scholar]
- Ehrlich, D.; Tenerelli, P. Optical satellite imagery for quantifying spatio-temporal dimension of physical exposure in disaster risk assessments. Nat. Hazards 2013, 68, 1271–1289. [Google Scholar] [CrossRef]
- McCormick, S. After the cap: Risk assessment, citizen science and disaster recovery. Ecol. Soc. 2012, 17. [Google Scholar] [CrossRef]
- Kwak, Y.J. Nationwide Flood Monitoring for Disaster Risk Reduction Using Multiple Satellite Data. ISPRS Int. J. Geo-Inf. 2017, 6, 203. [Google Scholar] [CrossRef]
- Horita, F.E.; de Albuquerque, J.P.; Degrossi, L.C.; Mendiondo, E.M.; Ueyama, J. Development of a spatial decision support system for flood risk management in Brazil that combines volunteered geographic information with wireless sensor networks. Comput. Geosci. 2015, 80, 84–94. [Google Scholar] [CrossRef]
- Zhang, J.A.; Nolan, D.S.; Rogers, R.F.; Tallapragada, V. Evaluating the impact of improvements in the boundary layer parameterization on hurricane intensity and structure forecasts in HWRF. Mon. Weather Rev. 2015, 143, 3136–3155. [Google Scholar] [CrossRef]
- Yablonsky, R.M.; Ginis, I.; Thomas, B. Ocean modeling with flexible initialization for improved coupled tropical cyclone-ocean model prediction. Environ. Model. Softw. 2015, 67, 26–30. [Google Scholar] [CrossRef]
- Zhang, J.A.; Marks, F.D.; Montgomery, M.T.; Lorsolo, S. An estimation of turbulent characteristics in the low-level region of intense Hurricanes Allen (1980) and Hugo (1989). Mon. Weather Rev. 2011, 139, 1447–1462. [Google Scholar] [CrossRef]
- Zhang, J.A.; Gopalakrishnan, S.G.; Marks, F.D.; Rogers, R.F.; Tallapragada, V. A developmental framework for improving hurricane model physical parameterizations using aircraft observations. Trop. Cycl. Res. Rev. 2012, 1, 419–429. [Google Scholar] [CrossRef]
- Ruf, C.S.; Atlas, R.; Chang, P.S.; Clarizia, M.P.; Garrison, J.L.; Gleason, S.; Katzberg, S.J.; Jelenak, Z.; Johnson, J.T.; Majumdar, S.J.; O’brien, A. New ocean winds satellite mission to probe hurricanes and tropical convection. Bull. Am. Meteorol. Soc. 2016, 97, 385–395. [Google Scholar] [CrossRef]
- Zhang, F.; Weng, Y. Predicting hurricane intensity and associated hazards: A five-year real-time forecast experiment with assimilation of airborne Doppler radar observations. Bull. Am. Meteorol. Soc. 2015, 96, 25–33. [Google Scholar] [CrossRef]
- Furquim, G.; Filho, G.P.R.; Jalali, R.; Pessin, G.; Pazzi, R.W.; Ueyama, J. How to Improve Fault Tolerance in Disaster Predictions: A Case Study about Flash Floods Using IoT, ML and Real Data. Sensors 2018, 18, 907. [Google Scholar] [CrossRef] [PubMed]
- Kalyuzhnaya, A.V.; Nasonov, D.; Ivanov, S.V.; Kosukhin, S.S.; Boukhanovsky, A.V. Towards a scenario-based solution for extreme metocean event simulation applying urgent computing. Future Gener. Comput. Syst. 2018, 79, 604–617. [Google Scholar] [CrossRef]
- Yan, J.; Jin, J.; Chen, F.; Yu, G.; Yin, H.; Wang, W. Urban flash flood forecast using support vector machine and numerical simulation. J. Hydroinformatics 2018, 20, 221–231. [Google Scholar] [CrossRef]
- San-Miguel-Ayanz, J.; Schulte, E.; Schmuck, G.; Camia, A.; Strobl, P.; Liberta, G.; Giovando, C.; Boca, R.; Sedano, F.; Kempeneers, P.; et al. Comprehensive monitoring of wildfires in Europe: The European forest fire information system (EFFIS). In Approaches to Managing Disaster-Assessing Hazards, Emergencies and Disaster Impacts; Tiefenbacher, J., Ed.; InTech: Rijeka, Croatia, 2012; pp. 87–108. ISBN 978-953-51-0294-6. [Google Scholar]
- Lacava, T.; Brocca, L.; Coviello, I.; Faruolo, M.; Pergola, N.; Tramutoli, V. Integration of optical and passive microwave satellite data for flooded area detection and monitoring. In Engineering Geology for Society and Territory-Volume 3; Lollino, G., Arattano, M., Rinaldi, M., Giustolisi, O., Marechal, J., Gordon, E.G., Eds.; Springer: Cham, Switzerland, 2014; pp. 631–635. ISBN 978-3-319-09053-5. [Google Scholar]
- Kussul, N.; Shelestov, A.; Skakun, S. Flood monitoring from SAR data. In Use of Satellite and In-Situ Data to Improve Sustainability; Kogan, F., Powell, A., Fedorov, O., Eds.; Springer: Dordrecht, The Netherlands, 2011; pp. 19–29. ISBN 978-90-481-9617-3. [Google Scholar]
- De Groeve, T. Flood monitoring and mapping using passive microwave remote sensing in Namibia. Geomat. Nat. Hazards Risk 2010, 1, 19–35. [Google Scholar] [CrossRef]
- Earle, P.S.; Bowden, D.C.; Guy, M. Twitter earthquake detection: Earthquake monitoring in a social world. Ann. Geophys. 2012, 54. [Google Scholar] [CrossRef]
- Mandl, D.; Frye, S.; Cappelaere, P.; Handy, M.; Policelli, F.; Katjizeu, M.; Van Langenhove, G.; Aube, G.; Saulnier, J.F.; Sohlberg, R.; et al. Use of the earth observing one (EO-1) satellite for the namibia sensorweb flood early warning pilot. IEEE J. Sel. Top. Appl. Earth Obs. Remote Sens. 2013, 6, 298–308. [Google Scholar] [CrossRef]
- Arribas-Bel, D. Accidental, open and everywhere: Emerging data sources for the understanding of cities. Appl. Geogr. 2014, 49, 45–53. [Google Scholar] [CrossRef]
- Musaev, A.; Wang, D.; Pu, C. LITMUS: A Multi-Service Composition System for Landslide Detection. IEEE Trans. Serv. Comput. 2015, 8, 715–726. [Google Scholar] [CrossRef]
- Poslad, S.; Middleton, S.E.; Chaves, F.; Tao, R.; Necmioglu, O.; Bügel, U. A semantic IoT early warning system for natural environment crisis management. IEEE Trans. Emerg. Top. Comput. 2015, 3, 246–257. [Google Scholar] [CrossRef]
- Vetrivel, A.; Gerke, M.; Kerle, N.; Vosselman, G. Identification of damage in buildings based on gaps in 3D point clouds from very high resolution oblique airborne images. ISPRS J. Photogramm. Remote Sens. 2015, 105, 61–78. [Google Scholar] [CrossRef]
- Fernandez Galarreta, J.; Kerle, N.; Gerke, M. UAV-based urban structural damage assessment using object-based image analysis and semantic reasoning. Nat. Hazards Earth Syst. Sci. 2015, 15, 1087–1101. [Google Scholar] [CrossRef]
- Corbane, C.; Saito, K.; Dell’Oro, L.; Bjorgo, E.; Gill, S.P.; Emmanuel Piard, B.; Huyck, C.K.; Kemper, T.; Lemoine, G.; Spence, R.J.; et al. A comprehensive analysis of building damage in the 12 January 2010 MW7 Haiti earthquake using high-resolution satellite and aerial imagery. Photogramm. Eng. Remote Sens. 2011, 77, 997–1009. [Google Scholar] [CrossRef]
- Jongman, B.; Wagemaker, J.; Romero, B.R.; de Perez, E.C. Early flood detection for rapid humanitarian response: Harnessing near real-time satellite and Twitter signals. ISPRS Int. J. Geo-Inf. 2015, 4, 2246–2266. [Google Scholar] [CrossRef]
- Di Felice, M.; Trotta, A.; Bedogni, L.; Chowdhury, K.R.; Bononi, L. Self-organizing aerial mesh networks for emergency communication. In Proceedings of the 2014 IEEE 25th Annual International Symposium on Personal, Indoor, and Mobile Radio Communication (PIMRC), Washington, DC, USA, 2–5 September 2014; IEEE: Piscataway, NJ, USA, 2014; pp. 1631–1636. [Google Scholar]
- Mosterman, P.J.; Sanabria, D.E.; Bilgin, E.; Zhang, K.; Zander, J. A heterogeneous fleet of vehicles for automated humanitarian missions. Comput. Sci. Eng. 2014, 16, 90–95. [Google Scholar] [CrossRef]
- Lu, Z.; Cao, G.; La Porta, T. Networking smartphones for disaster recovery. In Proceedings of the 2016 IEEE International Conference on Pervasive Computing and Communications (PerCom), Sydney, Australia, 14–18 March 2016; IEEE: Piscataway, NJ, USA, 2016; pp. 1–9. [Google Scholar]
- Van de Walle, B.; Dugdale, J. Information management and humanitarian relief coordination: Findings from the Haiti earthquake response. Int. J. Bus. Contin. Risk Manag. 2012, 3, 278–305. [Google Scholar] [CrossRef]
- De Alwis Pitts, D.A.; So, E. Enhanced change detection index for disaster response, recovery assessment and monitoring of accessibility and open spaces (camp sites). Int. J. Appl. Earth Obs. Geoinform. 2017, 57, 49–60. [Google Scholar] [CrossRef]
- Contreras, D.; Forino, G.; Blaschke, T. Measuring the progress of a recovery process after an earthquake: The case of L’aquila, Italy. Int. J. Disaster Risk Reduct. 2017. [Google Scholar] [CrossRef]
- Kahn, M.E. The death toll from natural disasters: The role of income, geography, and institutions. Rev. Econ. Stat. 2005, 87, 271–284. [Google Scholar] [CrossRef]
- Afzalan, N.; Evans-Cowley, J.; Mirzazad-Barijough, M. From big to little data for natural disaster recovery: How online and on-the-ground activities are connected. I/S J. Law Policy Inf. Soc. 2015, 11, 153. [Google Scholar] [CrossRef]
- Yan, Y.; Eckle, M.; Kuo, C.L.; Herfort, B.; Fan, H.; Zipf, A. Monitoring and assessing post-disaster tourism recovery using geotagged social media data. ISPRS Int. J. Geo-Inf. 2017, 6, 144. [Google Scholar] [CrossRef]
- Goodchild, M.F.; Glennon, J.A. Crowdsourcing geographic information for disaster response: A research frontier. Int. J. Dig. Earth 2010, 3, 231–241. [Google Scholar] [CrossRef]
- Cervone, G.; Sava, E.; Huang, Q.; Schnebele, E.; Harrison, J.; Waters, N. Using Twitter for tasking remote-sensing data collection and damage assessment: 2013 Boulder flood case study. Int. J. Remote Sens. 2016, 37, 100–124. [Google Scholar] [CrossRef]
- Byun, Y.; Han, Y.; Chae, T. Image fusion-based change detection for flood extent extraction using bi-temporal very high-resolution satellite images. Remote Sens. 2015, 7, 10347–10363. [Google Scholar] [CrossRef]
- Westrope, C.; Banick, R.; Levine, M. Groundtruthing OpenStreetMap building damage assessment. Procedia Eng. 2014, 78, 29–39. [Google Scholar] [CrossRef]
- Virtual Social Media Working Group and DHS First Responders Group. Lessons Learned: Social Media and Hurricane Sandy. Available online: https://www.dhs.gov/sites/default/files/publications/Lessons%20Learned%20Social%20Media%20and%20Hurricane%20Sandy.pdf (accessed on 12 March 2018).
- Bejiga, M.B.; Zeggada, A.; Nouffidj, A.; Melgani, F. A convolutional neural network approach for assisting avalanche search and rescue operations with uav imagery. Remote Sens. 2017, 9, 100. [Google Scholar] [CrossRef]
- Goldberg, D.; Holland, J. Genetic algorithms and machine learning. Mach. Learn. 1988, 3, 95–99. [Google Scholar] [CrossRef]
- Benediktsson, J.; Swain, P.H.; Ersoy, O.K. Neural network approaches versus statistical methods in classification of multisource remote sensing data. IEEE Trans. Geosci. Remote Sens. 1990, 28, 540–552. [Google Scholar] [CrossRef]
- Shao, Y.; Lunetta, R.S. Comparison of support vector machine, neural network, and CART algorithm for the land-cover classifcation using limited data points. ISPRS J. Photogramm. Remote Sens. 2012, 70, 78–87. [Google Scholar] [CrossRef]
- Cooner, A.J.; Shao, Y.; Campbell, J.B. Detection of urban damage using remote sensing and machine learning algorithms: Revisiting the 2010 Haiti earthquake. Remote Sens. 2016, 8, 868. [Google Scholar] [CrossRef]
- Cha, Y.J.; Choi, W.; Büyüköztürk, O. Deep Learning-Based Crack Damage Detection Using Convolutional Neural Networks. Comput.-Aided Civil Infrastruct. Eng. 2017, 32, 361–378. [Google Scholar] [CrossRef]
- Pouyanfar, S.; Chen, S.C. Automatic video event detection for imbalance data using enhanced ensemble deep learning. Int. J. Semant. Comput. 2017, 11, 85–109. [Google Scholar] [CrossRef]
- Asim, K.M.; Martínez-Álvarez, F.; Basit, A.; Iqbal, T. Earthquake magnitude prediction in Hindukush region using machine learning techniques. Nat. Hazards 2017, 85, 471–486. [Google Scholar] [CrossRef]
- Chang, V. Towards a Big Data system disaster recovery in a Private Cloud. Ad Hoc Netw. 2015, 35, 65–82. [Google Scholar] [CrossRef]
- Wan, Z.; Hong, Y.; Khan, S.; Gourley, J.; Flamig, Z.; Kirschbaum, D.; Tang, G. A cloud-based global flood disaster community cyber-infrastructure: Development and demonstration. Environ. Model. Softw. 2014, 58, 86–94. [Google Scholar] [CrossRef]
- Belaud, J.P.; Negny, S.; Dupros, F.; Michéa, D.; Vautrin, B. Collaborative simulation and scientific big data analysis: Illustration for sustainability in natural hazards management and chemical process engineering. Comput. Ind. 2014, 65, 521–535. [Google Scholar] [CrossRef]
- Puthal, D.; Nepal, S.; Ranjan, R.; Chen, J. A secure big data stream analytics framework for disaster management on the cloud. In Proceedings of the 2016 IEEE 18th International Conference on High Performance Computing and Communications; IEEE 14th International Conference on Smart City; IEEE 2nd International Conference on Data Science and Systems (HPCC/SmartCity/DSS), Sydney, Australia, 12–14 December 2016; IEEE: Piscataway, NJ, USA, 2016; pp. 1218–1225. [Google Scholar]
- Hua, Y.; He, W.; Liu, X.; Feng, D. SmartEye: Real-time and efficient cloud image sharing for disaster environments. In Proceedings of the 2015 IEEE Conference on Computer Communications (INFOCOM), Hong Kong, China, 26 April–1 May 2015; IEEE: Piscataway, NJ, USA, 2015; pp. 1616–1624. [Google Scholar]
- Bartoli, G.; Fantacci, R.; Gei, F.; Marabissi, D.; Micciullo, L. A novel emergency management platform for smart public safety. Int. J. Commun. Syst. 2015, 28, 928–943. [Google Scholar] [CrossRef]
- Trono, E.M.; Arakawa, Y.; Tamai, M.; Yasumoto, K. Dtn mapex: Disaster area mapping through distributed computing over a delay tolerant network. In Proceedings of the 2015 Eighth International Conference on Mobile Computing and Ubiquitous Networking (ICMU), Hakodate, Japan, 20–25 January 2015; IEEE: Piscataway, NJ, USA, 2015; pp. 179–184. [Google Scholar]
Figure 1.
Distribution of reviewed articles by year of publication.

Figure 2.
Distribution of reviewed articles by major data sources and year of publication.

Figure 3.
Disaster management cycle derived from Alexander [90].
Figure 3.
Disaster management cycle derived from Alexander [90].

Figure 4.
Distribution of the reviewed article with subtopic “machine learning” and “cyberinfrastructure” respectively over the recent years.
Figure 4.
Distribution of the reviewed article with subtopic “machine learning” and “cyberinfrastructure” respectively over the recent years.


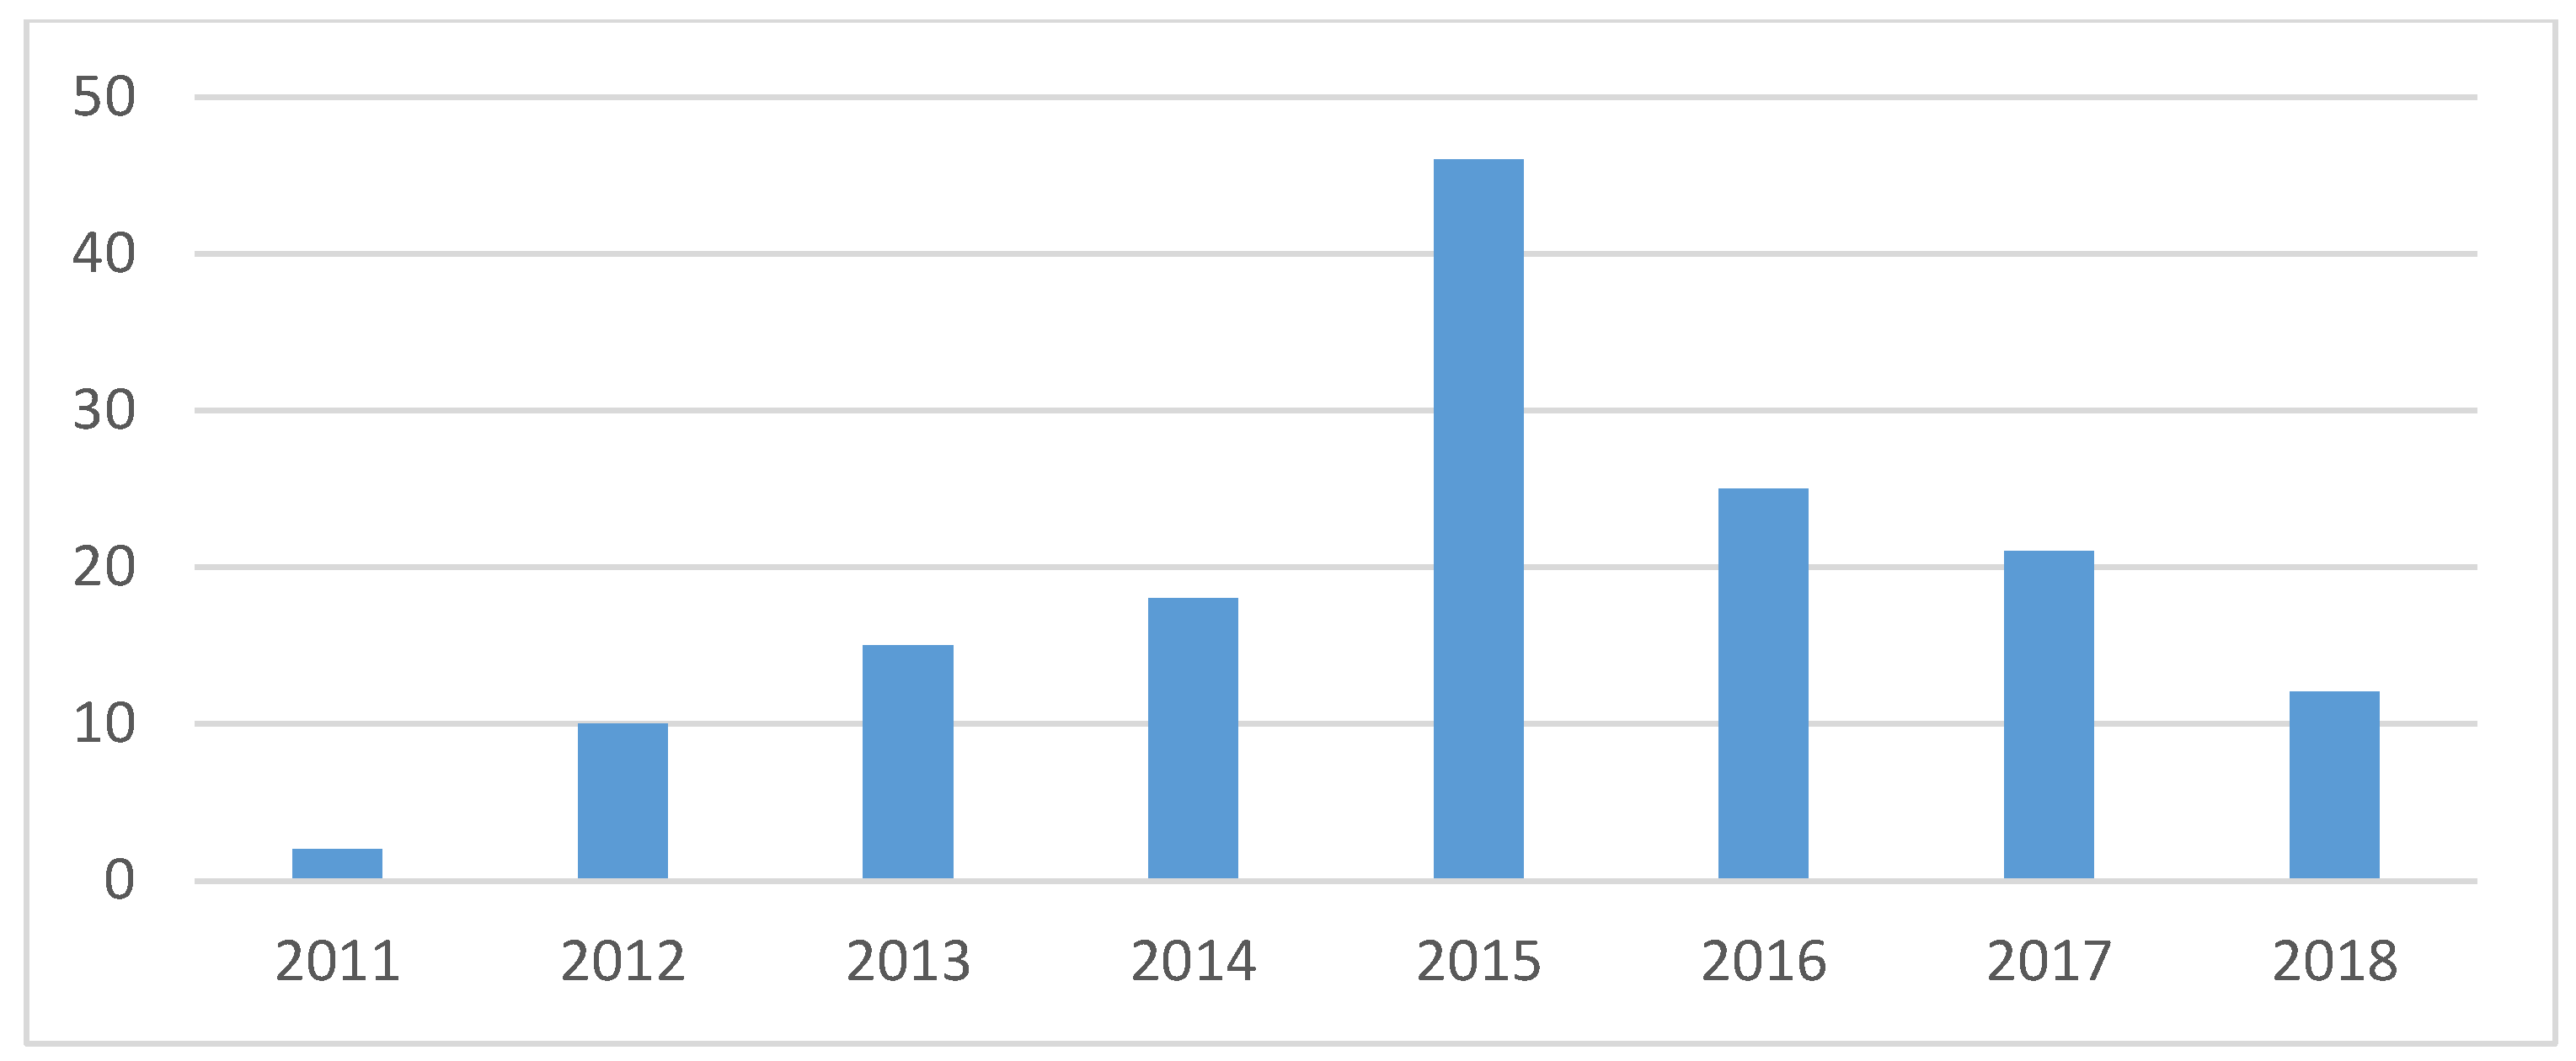
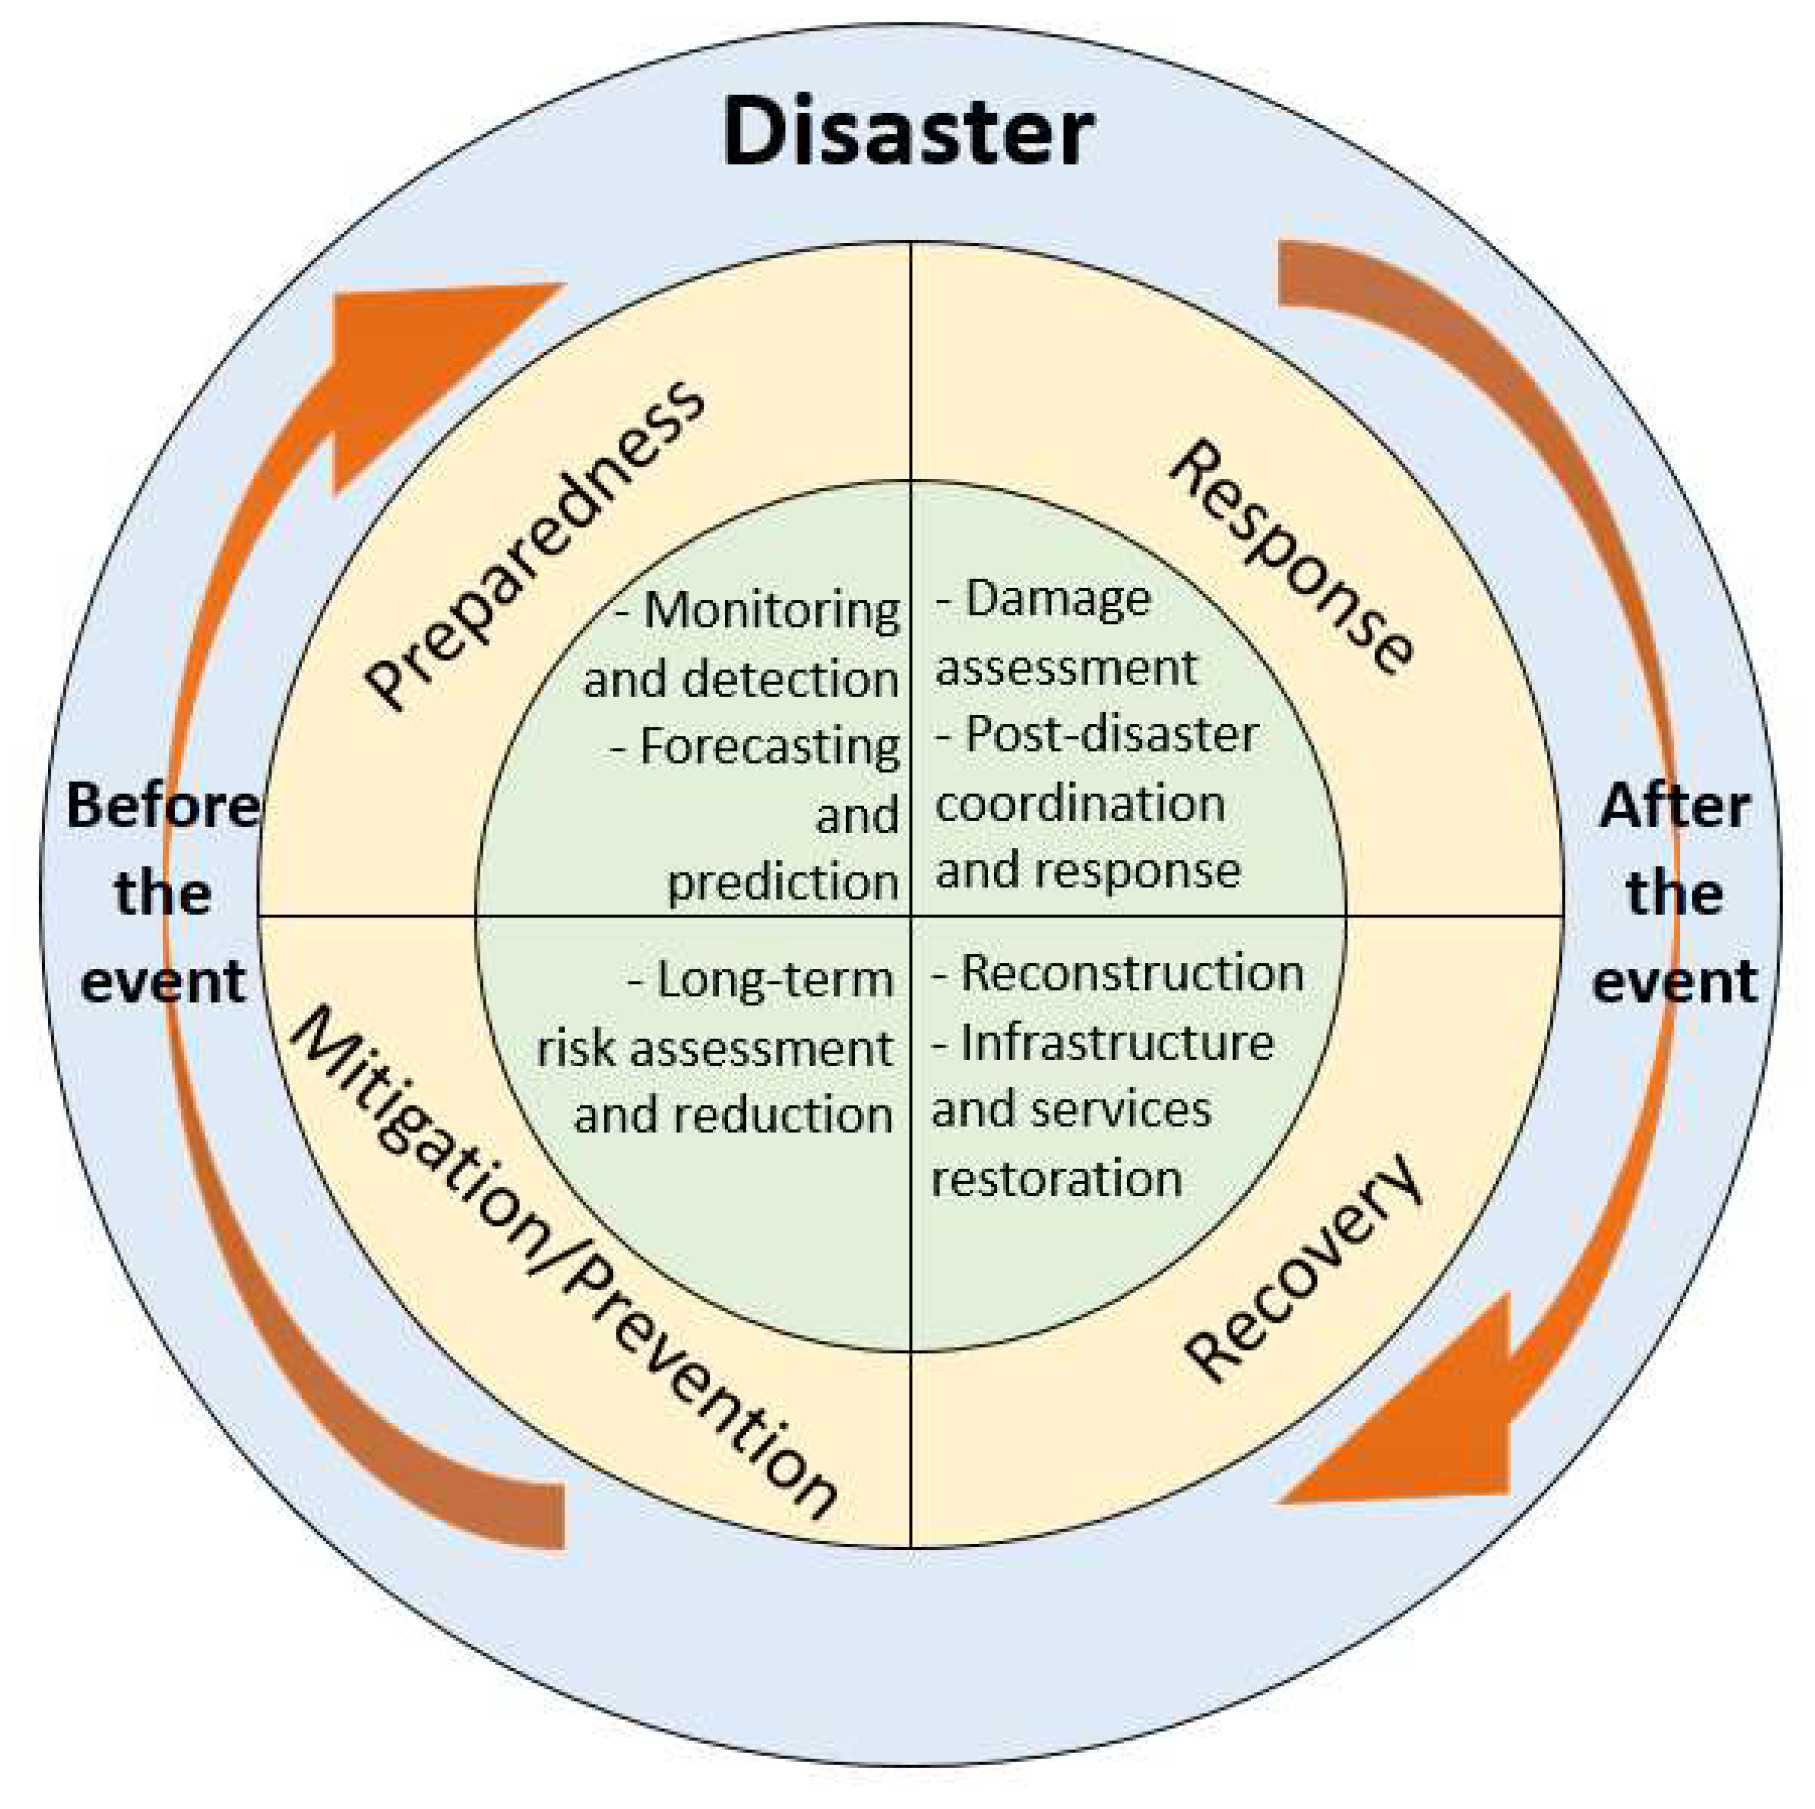
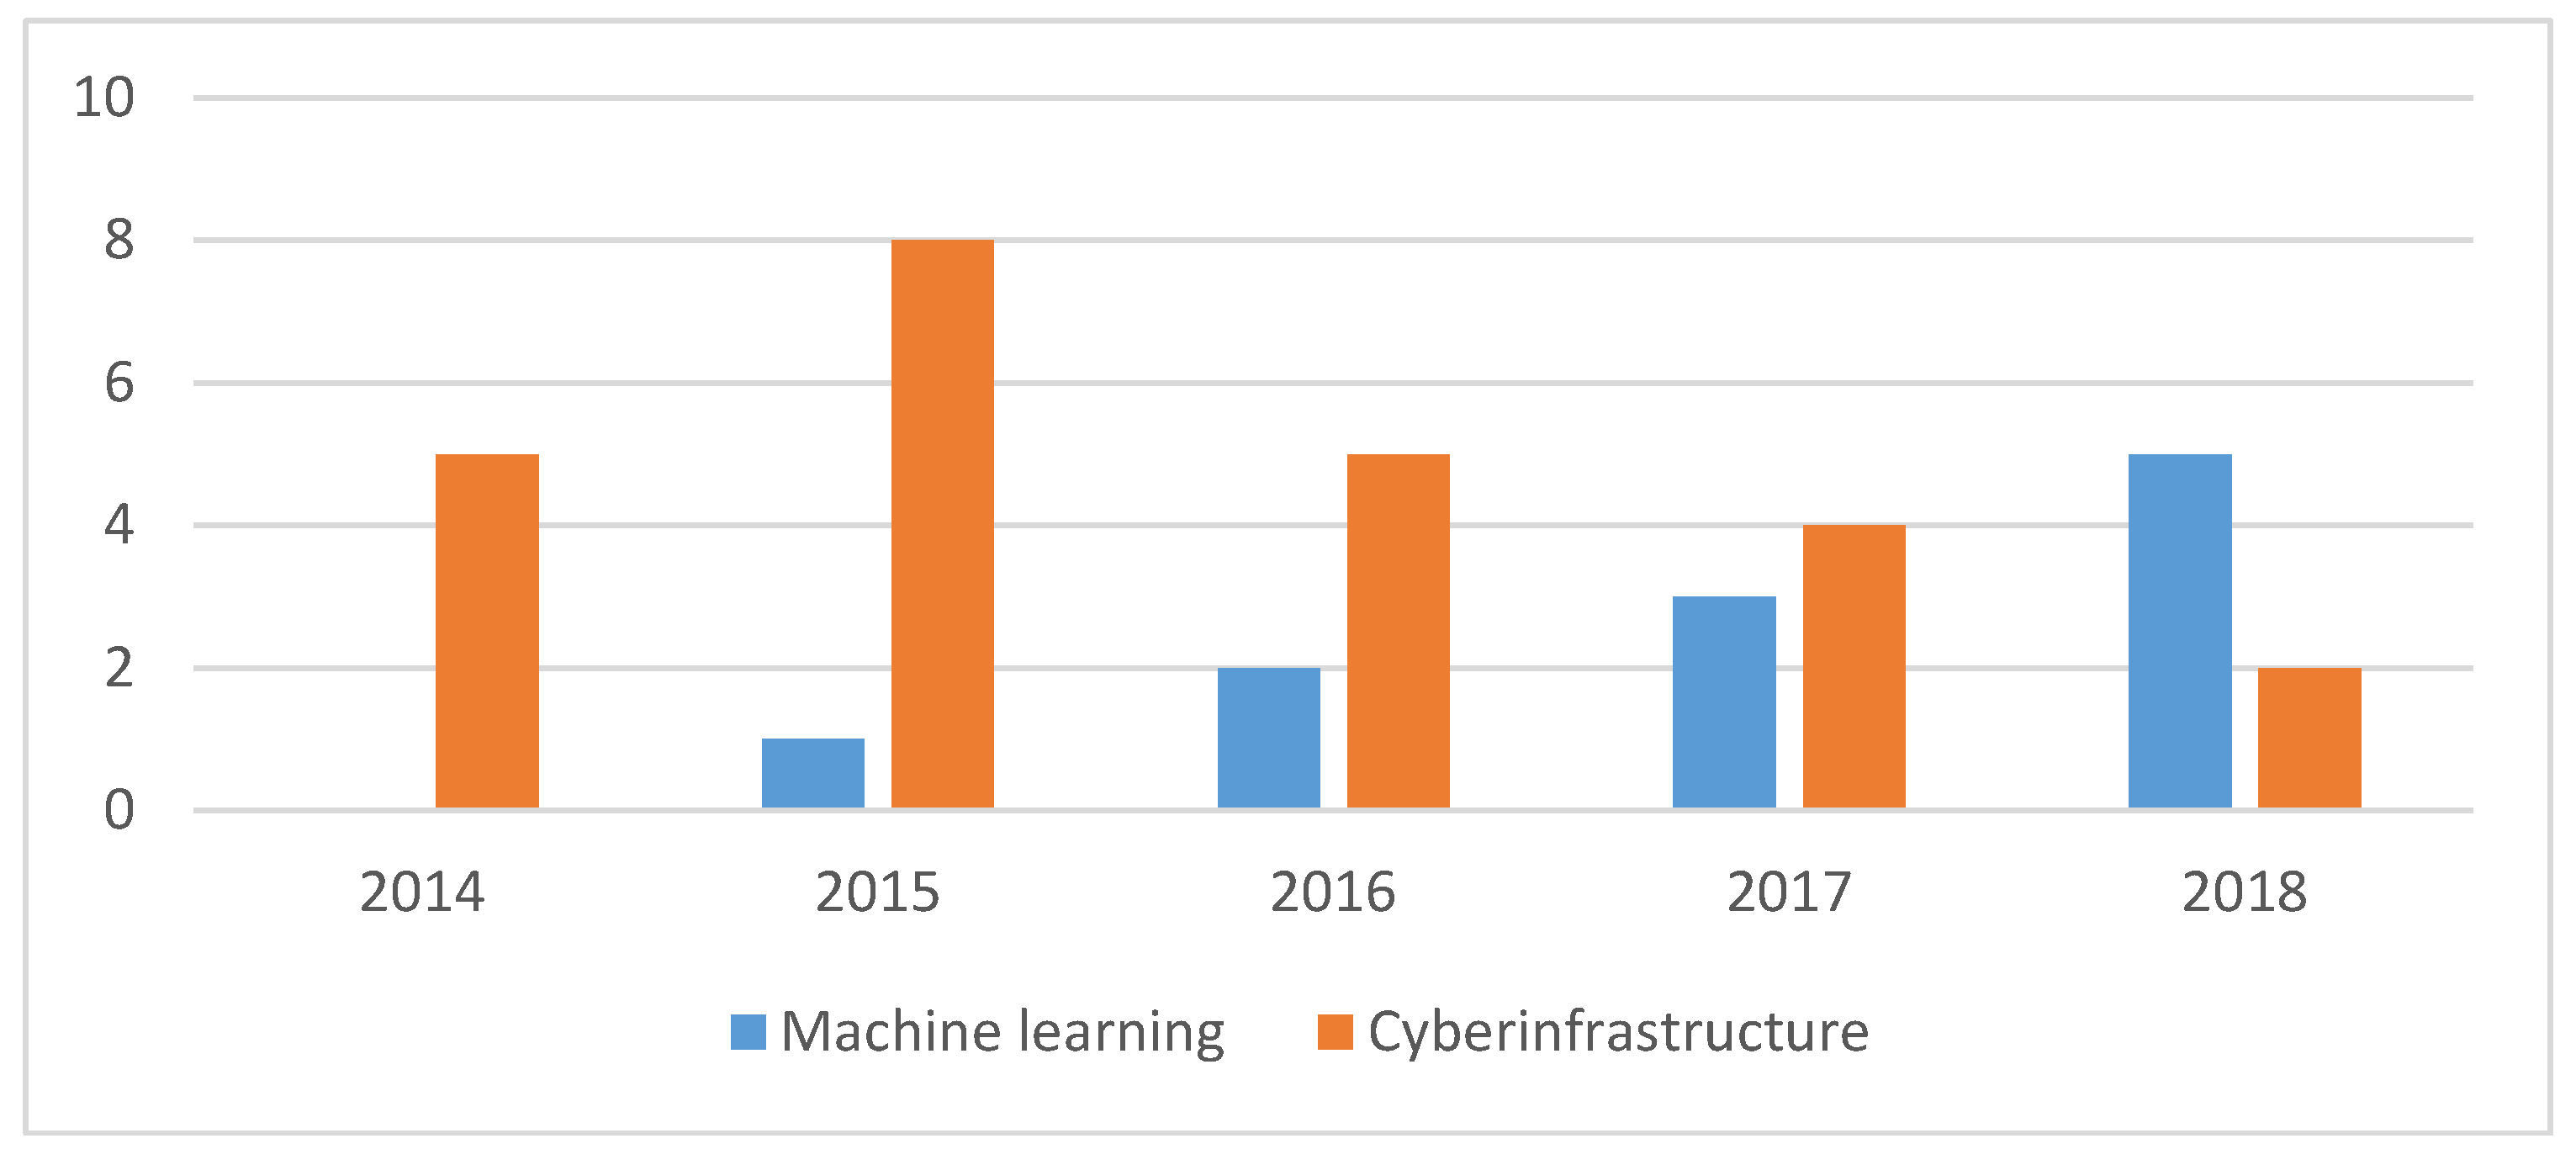
Table 1.
Mapping disaster management phases with major data sources and application fields.
| Disaster Management Phase | Data Source | Reviewed Application Fields |
|---|---|---|
| 1. Mitigation/Prevention | ||
| Long-term risk assessment and reduction | Satellite, 33% Crowdsourcing, 17% Sensor web and IoT, 17% Social media, 13% Mobile GPS and CDR, 12% Simulation, 8% | General natural disaster [10] Earthquake [88,91] Oil spill [92] Flood [15,93,94] |
| Forecasting and Predicting | Simulation, 50% Satellite, 25% Sensor web and IoT, 13% Social media, 12% | Hurricane [52,54,95,96,97,98,99,100] Flood [101,102,103] |
| 2. Preparedness | ||
| Monitoring and detection | Social Media, 31% Sensor web and IoT, 31% Satellite, 13% Combination of various data types, 9% Spatial data, 4% Lidar, 4% Mobile GPS and CDR, 4% Crowdsourcing, 4% | Wildfire [104] Flood [105,106,107,108,109] Earthquake [108,110] Landslide [111] Volcano [45,46] |
| Early warning | Social media, 29% Sensor web and IoT, 29% Simulation 14% Crowdsourcing 14% Satellite, 14% | Flood [112] Tsunami [76,112] |
| 3. Response | ||
| Damage Assessment | Satellite, 53% UAV, 21% Social media, 16% Sensor web and IoT, 5% Crowdsourcing, 5% | Earthquake [19,20,113,114,115] Flood [116] Typhoon [117] Hurricane [118] |
| Post-disaster Coordination and Response | Social media, 25% Satellite, 16% Sensor web and IoT, 16% Crowdsourcing, 10% UAV, 9% Simulation, 6% Spatial data, 6% Lidar, 6% Mobile GPS and CDR, 3% Combination of various data types, 3% | General natural disaster [117,118,119] Flood [89,108] Earthquake [19,83,84,85,120] |
| 4. Recovery | ||
| Combination of various data types, 60% Crowdsourcing, 30% Satellite, 10% | Earthquake [121,122,123] Hurricane [124] Typhoon [125] | |
© 2018 by the authors. Licensee MDPI, Basel, Switzerland. This article is an open access article distributed under the terms and conditions of the Creative Commons Attribution (CC BY) license (http://creativecommons.org/licenses/by/4.0/).
Share and Cite
MDPI and ACS Style
Yu, M.; Yang, C.; Li, Y. Big Data in Natural Disaster Management: A Review. Geosciences 2018, 8, 165. https://0-doi-org.brum.beds.ac.uk/10.3390/geosciences8050165
AMA Style
Yu M, Yang C, Li Y. Big Data in Natural Disaster Management: A Review. Geosciences. 2018; 8(5):165. https://0-doi-org.brum.beds.ac.uk/10.3390/geosciences8050165
Chicago/Turabian StyleYu, Manzhu, Chaowei Yang, and Yun Li. 2018. "Big Data in Natural Disaster Management: A Review" Geosciences 8, no. 5: 165. https://0-doi-org.brum.beds.ac.uk/10.3390/geosciences8050165
Note that from the first issue of 2016, this journal uses article numbers instead of page numbers. See further details here.