Article

A Hybrid Spatial Multi-Criteria Evaluation Method for Mapping Landslide Susceptible Areas in Kullu Valley, Himalayas

by
Sansar Raj Meena
1,
Brijendra Kumar Mishra
2 and
Sepideh Tavakkoli Piralilou
1,*
1
Department of Geoinformatics—Z_GIS, University of Salzburg, 5020 Salzburg, Austria
2
Department of Geology, University of Delhi, New Delhi-06, Delhi 110007, India
*
Author to whom correspondence should be addressed.
Submission received: 28 February 2019 / Revised: 28 March 2019 / Accepted: 1 April 2019 / Published: 3 April 2019
(This article belongs to the Section Natural Hazards)

Abstract

:
In this paper we report our results from analysing a hybrid spatial multi-criteria evaluation (SMCE) method for generating landslide susceptibility mapping (LSM). This study is the first of its kind in the Kullu valley, Himalayas. We used eight related geospatial conditioning factors from three main groups: geological, morphological and topographical factors. Our landslide inventory dataset has a total of 149 GPS points of landslide locations, collected based on a field survey in July 2018. The relationships between landslide locations and conditioning factors were determined using the GIS-based statistical methods of frequency ratio (FR), multi-criteria decision-making (MCDM) and the integration method of hybrid SMCE. We compared the performance of applied methods by dividing the inventory into testing (70%) and validation (30%) datasets. The area under the curve (AUC) was used to validate the results. The integration method of hybrid SMCE gave the highest accuracy rate (0.910) compared to the other two methods, with 0.797 and 0.907 accuracy rates for the analytical hierarchy process (AHP) and FR, respectively. The applied methodologies are easily transferable to other areas, and the resulting landslide susceptibility maps (LSMs) can be useful for risk mitigation and development planning purposes in the Kullu valley, Himalayas.

Graphical Abstract

1. Introduction

Landslides are among the most damaging geological hazards in mountainous regions such as the Himalayas. Globally, every year hundreds of people die as a result of landslides, which also considerably affect local and global economies [1]. The Himalayan orogeny, which is tectonically the most active mountainous region in the world, is highly vulnerable to landslides and associated hazards. Landslide susceptibility mapping (LSM) is an effective tool for understanding the probability of the spatial distribution of future landslides [2]. The LSM requires a multi-criteria decision-making (MCDM) approach to generate maps with high levels of accuracy and reliability, which can then be used as input for disaster management plans [3]. GIS-based MCDM is an important geospatial analysis method which combines geospatial and non-spatial data to produce LSMs of an area [4]. The GIS tool integrated with MCDM methods provides a geospatial framework to organise these various thematic layers into a hierarchical structure and examine the relationships between the different geospatial components [5]. Landslide conditioning factors have been analysed to map susceptible areas in several mountainous regions around the world since the early 1980s [6,7]. However, nowadays with growing geo-computation, there are new methods like automatic and semi-automatic computation for LSM and risk assessments [8,9]. The process of creating these LSMs involves several qualitative and quantitative approaches and methods [10]. Attempts have been made to define landslide susceptibility classes based on qualitative methods by overlaying geological and topographical slope attributes based on landslide inventory maps [11]. There are a number of commonly used LSM methods involved, e.g., analytical hierarchy process (AHP) [12], analytical network process (ANP) [13,14], frequency ratio (FR) [15,16,17], fuzzy logic (FL) [15,16] and artificial neural network (ANN) [17]. The AHP is one of the GIS-based-MCDM methods that has been successfully applied by many scientists to produce landslide susceptibility maps [6,18]. The most common qualitative methods for LSMs, like AHP, use landslide inventories and geospatial parameters within a hieratical structure to recognise sites of comparable geological and geomorphological characteristics, which are susceptible to slope failure. However, weights of geospatial parameters are determined from experts’ knowledge on the subject and area. Although the AHP is a well-known and popular method, it relies on a pairwise matrix based on expert opinions, thus introducing a degree of subjectivity in assigning weightings to the thematic layers for LSM [19]. In the case of applying the FR method, our landslide inventory dataset was associated with each conditioning factor to indicate its importance [20]. FRs show the level of correlation between the inventory dataset and the considered conditioning factors as input data for susceptibility modelling and mapping [21,22]. The level of the correlation is derived from the probability of an occurrence to the probability of a non-occurrence of landslides in LSM [23,24,25]. Hybrid SMCE is a robust, GIS-based methodology used for solving geospatial problems for decision makers, e.g., LSM [23,24]. These methods have provided acceptable results in accurately determining the susceptible landslide zones [25]. The statistical methods analyse the link between controlling factors of landslides and their distribution. The quantitative methods are mainly used to decrease bias in the weight assessment process. Therefore, the objective of using these quantitative methods is to produce more reliable susceptibility maps based on an integrating AHPs and FRs into a hybrid SMCE.
Landslide types mainly rockfalls, rockslides and debris flow, are the most common natural hazards in the Kullu valley, which cause significant economic damage and are of great concern to public administrators and geoscientists [26]. The Kullu valley in Himachal Himalayas has a known history of large-scale landslides and different modes of slope deformation. There was a significant landslide in Kullu valley in 1995 that resulted in the death of 65 people and immense devastation in the Luggar Bhatti area of Kullu town itself—a very popular tourist destination. In this paper, we present a synoptic assessment of landslide susceptibility assessments and GIS-based statistical methods in a comparative study of the AHP, FR and hybrid SMCE methods for creating LSMs in the Kullu valley along the Larji–Kullu tectonic window (LKTW) zone in the higher Himalayas.
The results of this study led to the preparation of landslide susceptibility maps for the Kullu valley and to the identification of zones that are vulnerable to future slope deformations.

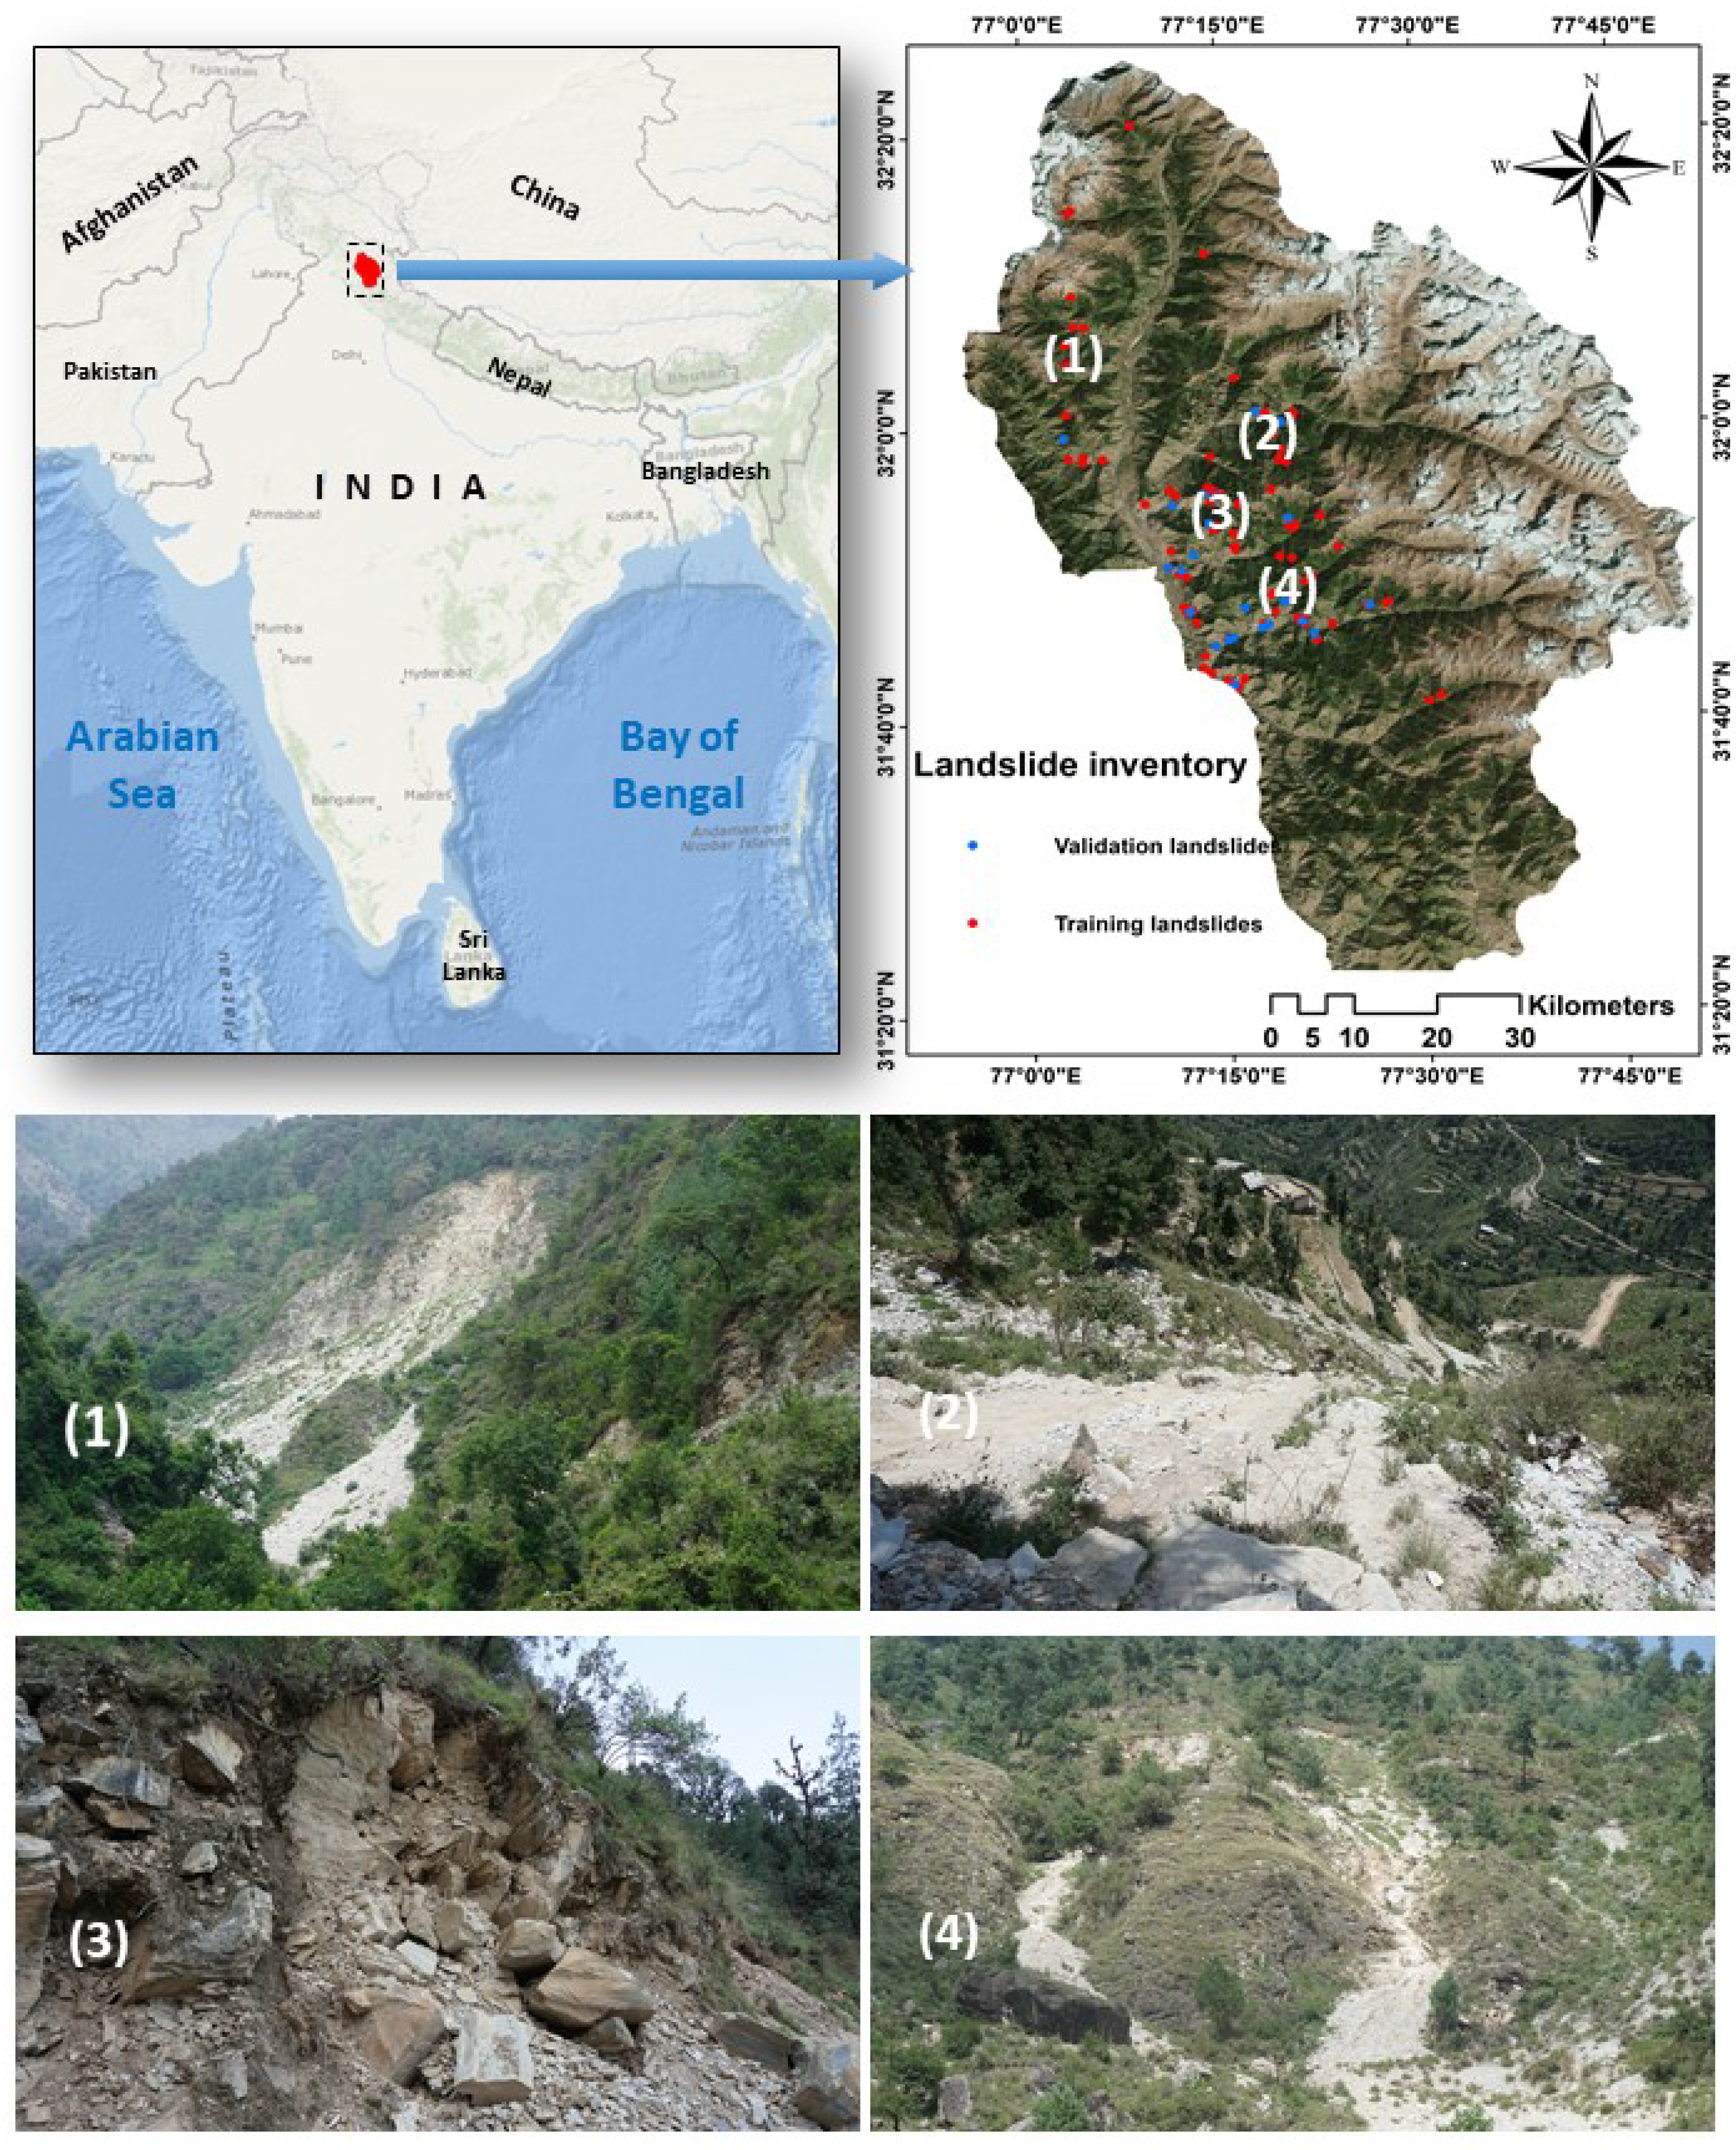
2. Study Area and Inventory Dataset

The Kullu valley is part of the Beas River basin. The River originates in the Pir-Panjal range, near Rohtang crest (4038 m), and flows transversally to the two parallel ranges of Pir-Panjal and Dhauladhar (Figure 1). This district name, Kullu, comes from the name ‘Kulata’, the first mention of which was found on the coin of Raja Viryasasya of ‘Kulata’ dating back to the first or second century [27]. According to ancient Hindu scriptures, the area was also known as ‘Kulantapitha’—the end of the habitable world.
The Kullu district is situated in the transitional zone between the lesser and greater Himalayan Mountain ranges in the central part of Himachal Pradesh. It has rugged topography with altitudes ranging from 1300 m to 6000 m above mean sea level. The higher reaches are endowed with snow-covered peaks and glaciers. The Kullu district borders the Shimla district and part of Kinnaur in the south-east, Lahaul and Spiti in the north-east, Kangra and parts of Chamba in the north-west, and Mandi in the south-west. The district’s total area district is 5503 sq km., which is 9.88% of Himachal’s total area. Sutlej and Beas are the main Rivers in the district. In general, Kullu gets cold temperatures and moderate precipitation, mostly during July, August, December and January. Kullu valley hosts the main river of Beas basin, and its sub-basins Parvati, Hural and Sainj Rivers, which are tributaries of the Beas River. The valley is known for a vibrant cultural heritage, attracting international tourism, as well as hydroelectric construction activities with a series of hydroelectric projects (viz. Parvati valley Hydel Projects and Sainj valley) and providing a corridor of strategic importance to upper reaches of Himalayas.
The present study began with the creation of an inventory map of landslides in the Kullu valley based on manual landslide detection from Rapid Eye satellite imagery with a spatial resolution of 5 m enhanced with the resulting landslide inventory based on extensive fieldwork. Furthermore, eight GIS-based thematic layers of factors, which contribute to landslides, were analysed for LSM using the three different methods of AHP, FR and hybrid SMCE. The thematic layers were lithology, landforms, distance to faults line, distance to lineaments, elevation, slope, slope aspect, distance to roads, and distance to drainage. Finally, the resulting susceptibility maps produced using these three methods were compared and evaluated using validation datasets and the most influential causative factors triggering landslides within the LKTW domain were discussed. The methods applied in this study were dependent on different logical explanations to create a landslide susceptibility map of the Kullu valley and also decrease the influence of the subjective evaluation of a subject specialist.

Landslide Inventory Dataset

The landslide inventory map illustrates the active landslide sites along with their properties such as the type of landslide, structural attributes, and distance from the road. These slope deformation features are related to morphological, geological and climatic conditions at the locations. Thus, these attributes can predict future conditions, which could lead to landslide occurrences in the area. The first step was to identify landslide locations in the satellite imagery and to evaluate landslide-prone areas [28]. To this end, active landslide locations were mapped, and inventory maps were prepared using different techniques, including satellite image interpretation, an extensive field survey, and literature searches for historical landslide records [29,30]. The landslide inventory map showed the spatial distribution of landslides in the study area. The landslide inventory dataset was generated from an extensive field survey carried out in July 2018. A total of 149 landslide locations were identified, and these were randomly divided into two groups with 70% (105) used for training the methods and 30% (44) for validating the results. The Kullu valley exposes highly dissected topography, it is susceptible to physical erosion and heavy rainfalls, and lies in the alpine climate zone, meaning that new landslides are frequent. The drainage also produces flash floods during rainfalls, which cause debris flow. We classified landslide types based on the classification method described in Reference [31]. In our study area, dominant debris slides along with rockfall were present in some areas. Examples of landslide types are shown in Figure 1.
Our landslide inventory was separated into two datasets: one for training and the other for testing. This is a very common approach that has been used in several natural hazard studies [32,33,34]. Training and testing datasets are chosen based on the size of the study area, inventory data and the applied methodology. Currently, there are no standard methodologies for the selection of testing and training samples [32]. In Reference [33], the authors assign different ratios for various methods. The points were sampled randomly from the body of landslides due to the complexity of forms, sizes and shapes of landslide features.

3. Workflow

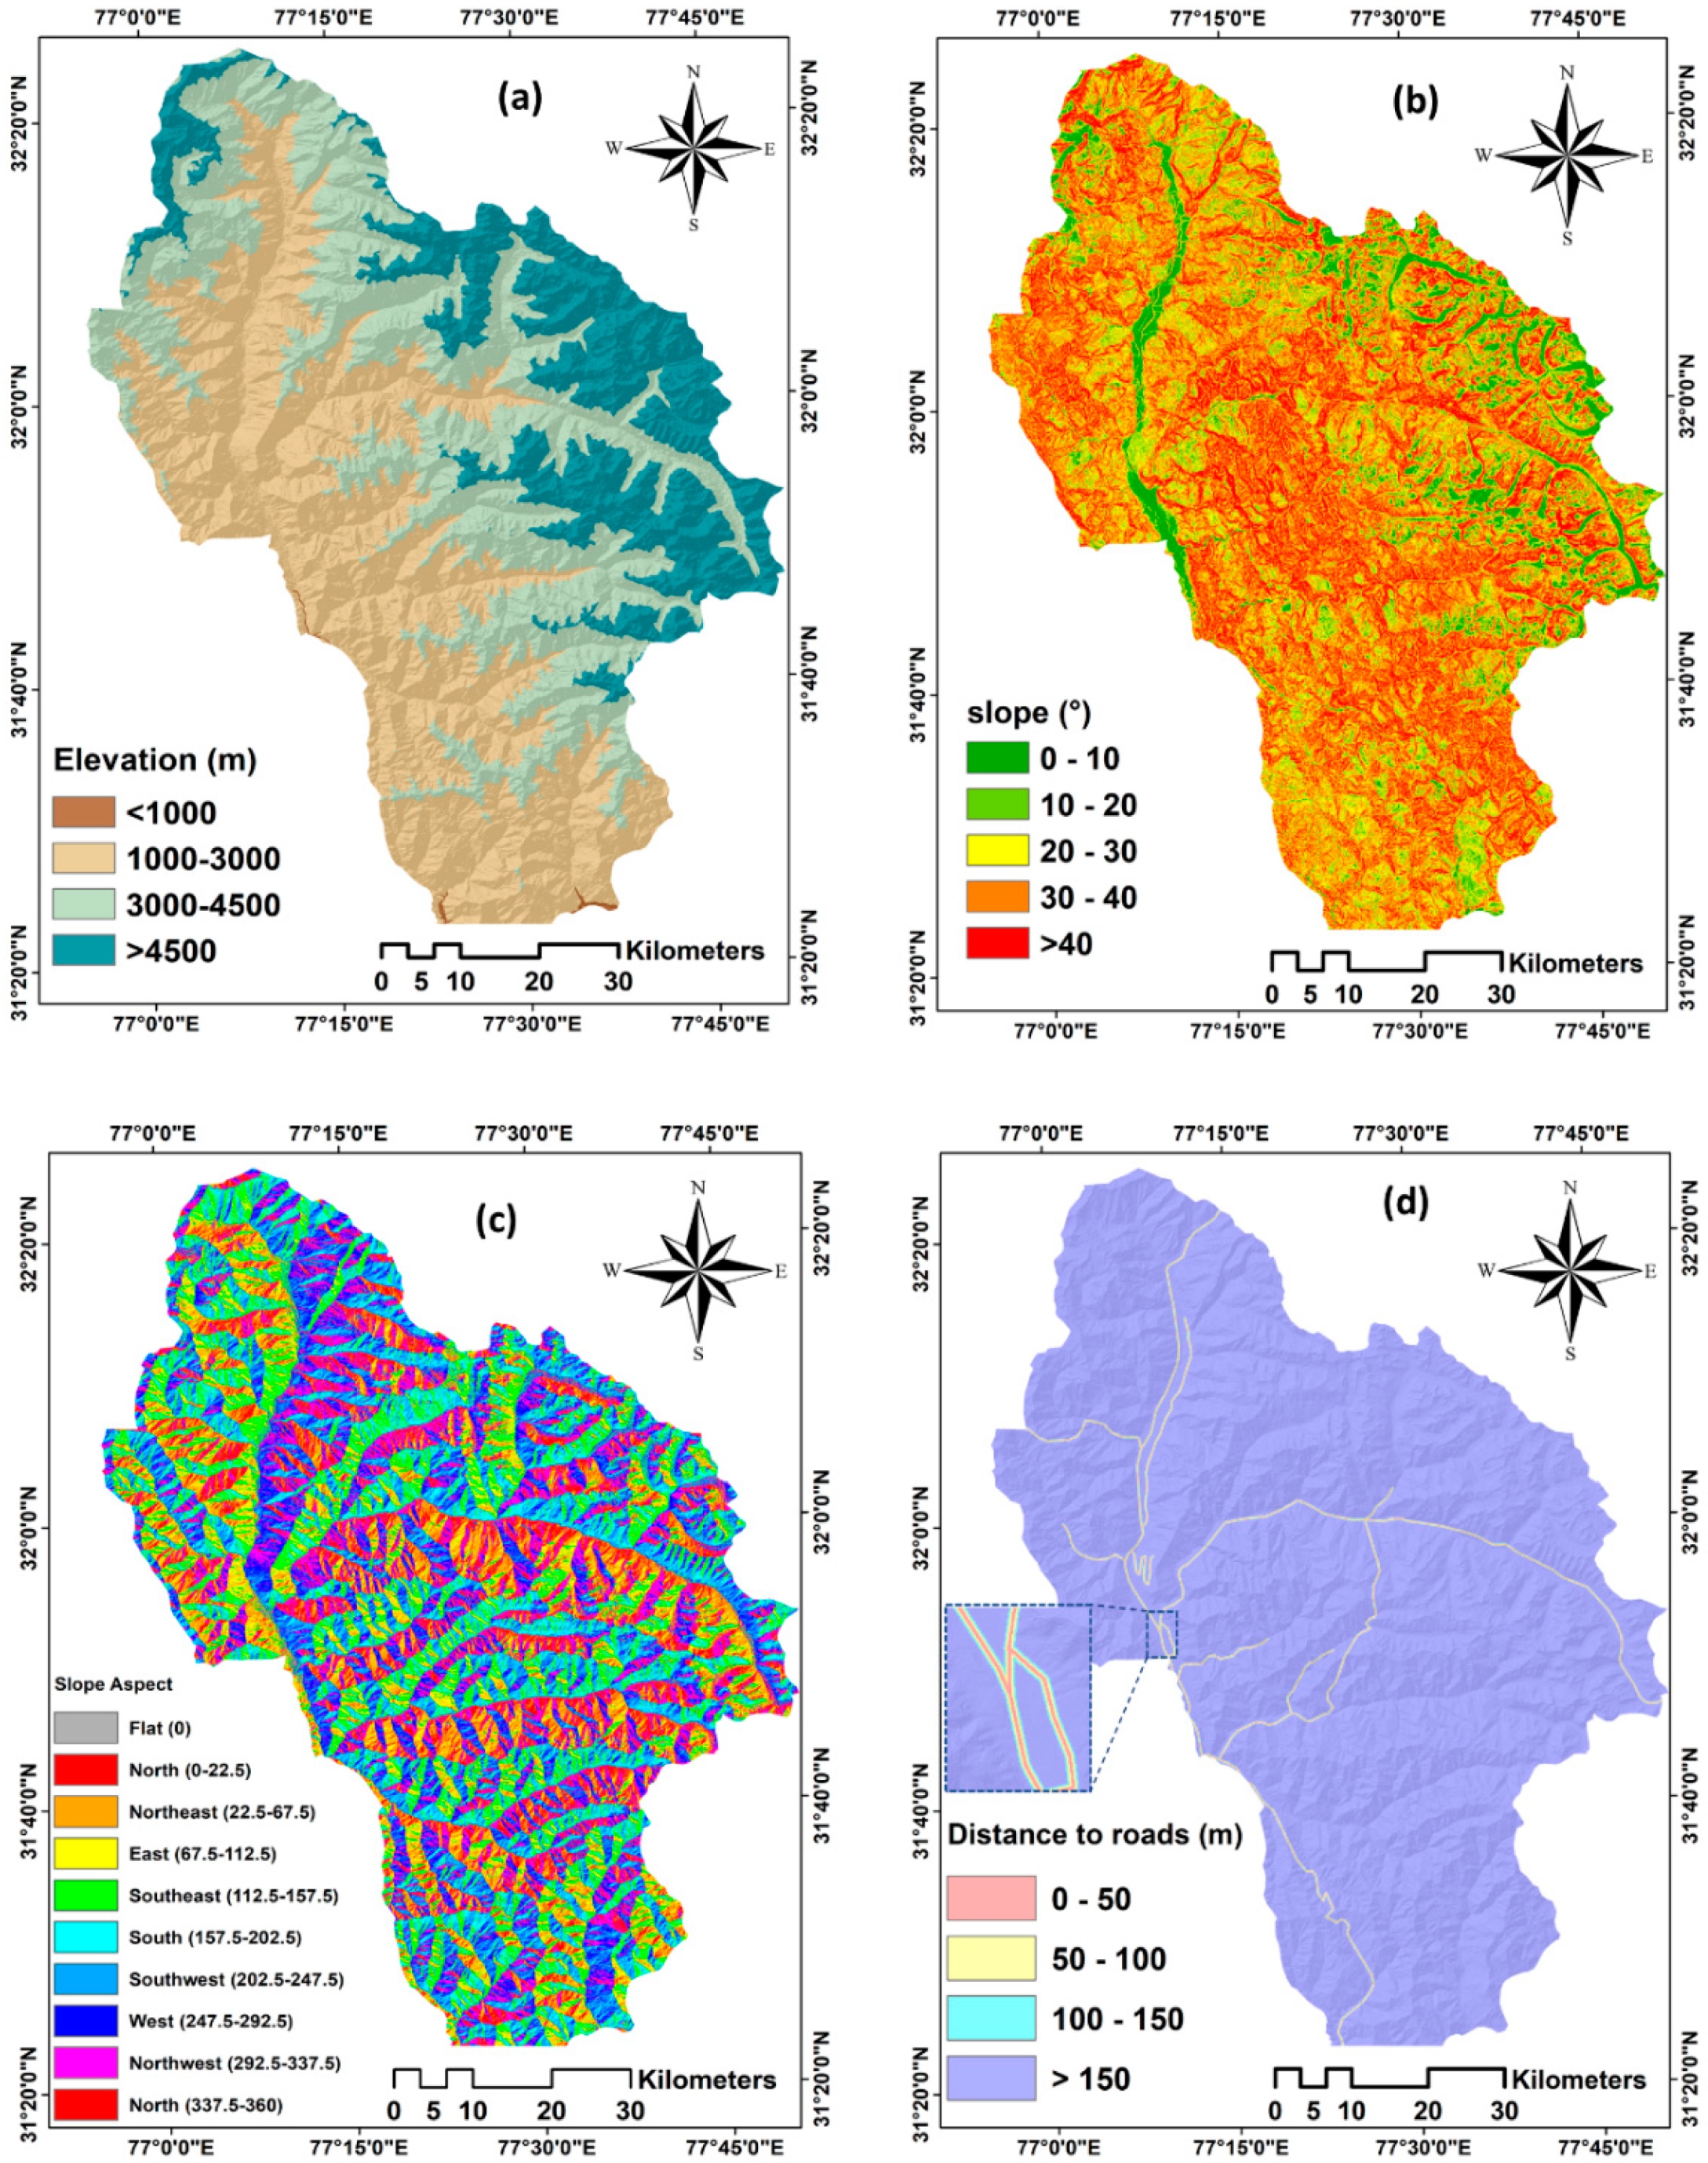
3.1. Conditioning Factors

For this study, we evaluated the ability to derive representative conditioning factors from the resampled (30 m) advanced spaceborne thermal emission and reflection radiometer (ASTER) digital elevation model (DEM) to simplify the data needed for landslide assessment. Figure 2 shows the (30 m) ASTER DEM-derived and field-based data layers representing the study area’s landslide conditioning factors. A description of the conditioning factors is given below.
Terrain slope angle is one of the prominent reasons for slope failure [34]. The topographic slope angle is widely used in landslide susceptibility analysis since landslides are directly linked to slope angle, and it is accepted that terrains with a high slope angle are more susceptible to failure. The study area’s slope map was divided into five slope categories from 0° to >40° by intervals of 10°.
The terrain slope aspect factor is also considered to be an essential factor in landslide susceptibility analysis [35]. The terrain slope aspect factor affects landslides as it relates to meteorological criteria such as precipitation direction and the average amount of sunshine. We classified Kullu valley’s terrain slope aspect into ten classes: north (0°–22.5°; 337.5°–360°), northeast (22.5°–67.5°), east (67.5°–112.5°), southeast (112.5°–157.5°), south (157.5°–202.5°), southwest (202.5°–247.5°), west (247.5°–292.5°), northwest (292.5°–337.5°), north (337.5°–360°) and flat (0°).
Elevation is another essential factor of LSM, as many geomorphological and geological processes are controlled by this factor [36]. It is used to define the study area’s local elevation. The elevation category refers to the elevation range between the lowest and highest points of a region [37]. To find the number of landslides in different elevation classes, four altitude groups were considered in classifying the terrain elevation: 0–1000 m, 1000–3000 m, 3000–4500 m and >4500 m above mean sea level. However, landslides in the first class are dominant (43.54%) due to lithological and geomorphological characteristics.
Drainage is another major controlling factor to be considered in landslide analysis. Drainage provides water which causes material saturation, resulting in landslides in the valleys [38]. Therefore, the effect of drainage and its distance to landslides plays a significant role in slope failures. The study area was classified into five different buffer ranges. The buffers zones were constructed for intervals of 0–100 m, 100–200 m, 200–300 m and >300 m distance.
Distance to roads is a very prominent causal factor for landslide occurrence [24]. The study area was divided into four different buffers zones, which designated the influence of Landslides caused by roads. The interval of buffer zones was 0–50 m, 50–100 m, 100–150 m and >150 m.
Lithology is one of the most crucial factors in landslide studies, due to the fact that different lithological units have different geological strength indices, permeability and susceptibility to failure [39]. It is widely accepted that lithology is one of the most crucial landslide conditioning factors [40,41]. We have thirteen lithological units in our study area. The lithological layer was prepared based on quadrangle maps available from the Geological Survey of India (GSI) with a scale of 1:250,000. The aerial distributions analysis performed according to the lithological units showed that most landslides were identified in areas of micaceous sandstone of the LKTW. The other lithological units were pale to green quartzite, phyllite, schist, schistose quartzite, dolomite, purple limestone, sandstone, Wangtoo granite and streaky banded gneisses.
Understating landform units is a very important in landslide studies. The landforms class can explain highly dissected zones within the region, and landslide activity that is likely to occur. Kullu valley’s landform resulted from GSI, and was classified into nine landform units: the active floodplain, channel island, piedmont slope, river, glaciated terrain, snow cover, younger alluvial plain, highly dissected terrain, moderately dissected terrain, and barely dissected terrain. The highly dissected, moderately dissected and glaciated areas are prone to landslide activity.
In our study area, faults are the primary causative factor controlling landslides [41]. Faults create a gap between two distinctive lithological units and generate fractures and joints within the lithological unit that can propagate landslide activity [42]. Thus, distance to faults plays a crucial role in landslide occurrence. Regions that are closer to faults were also more affected by several earthquakes that occurred in this area. The faults were classified, and the buffer zones were generated and divided into three different buffer ranges, based on the distance to faults, for intervals of 0–500 m, 500–1000 m, 1000–1500 m and >1500 m distance.

3.2. Landslide Susceptibility Mapping Using Different Methods

Landslide susceptibility analysis was carried out using the AHP, FR and hybrid SMCE geo-statistical methods in Kullu valley, Himachal Himalayas.

3.2.1. The AHP Method

The AHP was developed in [43], and can be applied to weight-related factors of spatial problems in GIS environments [44,45]. It is a common tool for analysing complicated spatial problems focusing on site selection, urban planning, and natural hazard susceptibility analysis [46]. The AHP is a decision-making process based on multi-criteria and multiple objectives, and involves the incorporation of expert knowledge [47]. A hierarchical order of factors and numerical values is established based on the importance of each factor. Subsequently, these factors are integrated, and each factor is weighted according to its importance [48]. In addition, the correlative pairwise comparison matrix is established to utilise AHP. This matrix is constructed using values that represent experts’ judgments by comparing the importance of each factor in relation to all the other related factors [14]. Each layer is based on a nine-point rating scale and is included in the matrix as developed shown in [49] (See Table 1). An expert specifies factor values. In this research, both determining decision options and comparing the parameters were based on our landslide inventory dataset. Each factor weight from the matrix class was multiplied by the weight class. Local representation of factors determined the susceptibility map results. These representations can be based on different parameters, including natural (lithology, distance to faults), human-made (roads and other engineering structures), causal (slope, aspect, lithology) and triggering (precipitation, seismicity) [50]. All these factors were weighted in the pairwise comparison matrices of the AHP based on expert knowledge. The principle of transitivity is important in AHP for any given three factors (such as f1, f2 and f3) and is defined as follows: if f1 > f2 and f2 > f3, then f1 > f3. The principle of transitivity is a basis for conditioning factors weighing in AHP. Due to this principle, a consistent pairwise comparison matrix would require that if 2f1 > f2 (i.e., f1 is two times more preferable than f2) and 4f2 > f3, then 8f1 > f3 to cover the transitivity principle [5,51]. Therefore, it is necessary to compute the consistency of expert comparisons in matrices in each stage [12]. Inconsistency can be defined based on the observation that λ _ max > n for comparison matrices and λ _ max = n if C is a consistent comparison. The consistency ratio (CR) can be defined by Equation (1):
CR = ( λ _ max n ) / ( RI ( n 1 ) )
where RI is the random index of a randomly created pairwise comparison matrix and for n = 2, 3, 4, 5, 6, 7, 8 and 9, RI = 0.00, 0.52, 0.89, 1.11, 1.25, 1.35, 1.40 and 1.45, respectively [52]. A consistency ratio of <0.10 means an acceptable level of consistency, whereas a CR > 0.10 points to a degree of inconsistency [43].

3.2.2. The FR Method

FR is a common geospatial assessment tool that provides the probabilities of distributing the presence and absence of a spatial phenomenon for each conditioning factor [53]. Landslide conditioning factors can merely be weighted by considering the ratio of observed landslides to the whole study area. Since this method can find the correlation between the spatial phenomenon and factor classes, it is a useful geospatial assessment tool for understanding the spatial relationship between landslides and individual conditioning factors [54]. For computing the FR weights, the ratio of landslide inventory points was identified for all classes within each factor considered in the current study. The dataset of landslide inventory points was overlaid with the conditioning factors to obtain the area ratio for each factor class to the total area. The FR weights are obtained by dividing the landslide occurrence ratio in a class by the area ratio in that class [55].
A final susceptibility map can be produced using a linear combination of the sum of each factor’s weights (see Equation (2)):
L S M F R = F R w 1 + F r w 2 + F R w 3 + + F R w 9
where FRwi is the corresponding FR weight for the ith factor. FR weights indicate a higher correlation of that class in triggering landslides.

3.2.3. Hybrid SMCE Method

The present hybrid SMCE method is an integrated method of a traditional SMCE with the data-driven method of FR, which enable users to solve the spatial problems associated with natural hazard susceptibility mapping [20]. Alternatives of different factors are defined as lines, points, and areas in this approach. Therefore, the resulting final maps are the results of landslide causal factors [23]. The hybrid SMCE approach incorporates spatial analysis and GIS to use both spatial and non-spatial input data to produce the final maps [56]. In hybrid SMCE, input layers are spatially represented as factors. Based on the criteria tree, input layers are grouped, weighted and normalised from their original values to the 0–1 value range.
The output of hybrid SMCE is one or more composite index maps, which indicates the extent to which criteria do or do not match in different areas and supports decision-making [57]. The multi-criteria evaluation of the AHP method is used as the theoretical background of the hybrid SMCE method. The steps involved in the operation of hybrid SMCE are problem analysis, weighing the factors, standardisation and finally generating the output map. The values in various input maps have different meanings and are probably shown in different units of measurement, such as percentages, meters, distance in meters, or land cover classes [58]. Finally, the landslide conditioning factors were weighted using direct, pairwise, and rank ordering comparison (see Table 2), and the output is a composite index map [59].
Therefore, in this study:
  • For the AHP model, we applied two levels of weightings for eight factors and classes. All weights were generated from pairwise comparison matrices of AHP, which is a widely used method in several natural hazard susceptibility modelling and mapping.
  • For the FR model, we used only one level of the weights resulting from the FR calculations for each class, and the final landslide susceptibility map was produced from these weights.
  • For the hybrid SMCE, we had two different levels of weightings namely factors and classes. As it is an integration methodology of AHP and FR, the resulting weights of AHP were used for the conditioning factors. Furthermore, weightings of the second level hybrid SMCE were from FR.

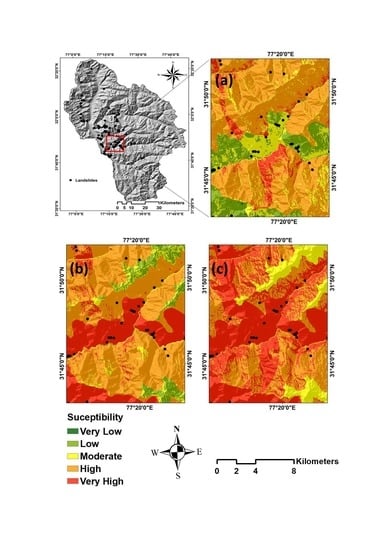
4. Results and Validation

To produce the susceptibility map, three different methods were used, for which the methods’ output values were derived through GIS spatial analysis and data aggregation models [60]. Figure 3 shows the results of the LSM obtained from three methods. The natural breaks classification method used in this study generates classes of similar values separated by breakpoints. This is a common and effective method for categorising potential mapping results when we interpret values close to each class boundary, e.g., values between ‘‘Low’’ and ‘‘Moderate’’ probability [61].
To generate the LSM maps and identify the areas highly susceptible to landslides, the criteria weightings derived from three methods were used for data aggregation within a GIS environment. Figure 3a–c presents the LSM results. The natural breaks classification method applied in our study generates classes of similar values separated by some breakpoints. To validate the resulting LSMs and identify the improvement in accuracy with using sensitivity analysis, a receiver operating characteristic (ROC) curve was used for validation.
Validating the training dataset is a very important step for a susceptibility analysis along with a receiver operating characteristic (ROC) plot to determine its prediction rate [62]. The ROC is a method of estimating the prediction rate, and has been widely used by landslide hazard experts [13]. A value range of the ROC curve between 0.5–1 shows a good-fit, while ROC values of under 0.5 represent a random fit [60].
A total of 105 landslide locations (70%) were used for training LSM methods, and 44 landslide locations (30%) were used for validation purposes. The accuracy of each applied method was also measured by comparing the resulting susceptibility maps with the observed landslides. Calculating the area under the ROC curve is a common approach for estimating accuracy of the occurrence or non-occurrence of predictive methods. In this research, ROC curves were obtained by means of statistical analysis software. The ROC curves of the evaluation for the three resulting susceptibility maps based on the different methods of AHP, FR and hybrid SMCE are shown in Figure 4. The resulting ROC values for AHP, FR and hybrid SMCE were 0.797, 0.907 and 0.910, respectively. According to the results, the FR method seemed to be a more accurate landslide susceptibility prediction method compared to the other two methods. Enlarged sub-areas from the resulting landslide susceptibility maps are presented in Figure 5 for an overview of the results.

5. Discussion

GIS-based statistical modelling is a powerful and essential tool for assessing and mapping landslide susceptibility. In previous studies, AHP, FR and hybrid SMCE methods were used either separately [25,63] or compared with other landslide susceptibility methods. In this paper, we compared the three above-mentioned GIS-based methods, which has never been done in the context of LSM in the higher Himalayan domain. The FR method proved to be simple and easy to apply in the highly rugged topography of the Himalayas.
In contrast, the hybrid SMCE method appeared complex, and the AHP method proved to be more complex where domain expert knowledge is required for giving weight to factors [64]. The FR and consequently the hybrid SMCE methods enable the evaluation of relationships between a dependent and several independent variables only in a discrete form.
On the other hand, the AHP allows evaluating the continuous independent variables in addition to distinct forms [65]. The three landslide susceptibility maps produced as a result of this study show a different spatial distribution of the zones that are highly susceptible to landslides. The FR and hybrid SMCE methods gave very similar results. In some areas, the AHP method map shows significant variations compared to the FR and hybrid SMCE maps. This is mainly the case in the northern and eastern parts of Kullu valley (Figure 3). Only 45% of the very high susceptibility class overlapped in all methods. To verify the results of the three landslide susceptibility methods, we carried out a comparison using the area under the curve (AUC) of the success rate curve (SRC). AUCs of the SRC plot suggest a similar efficiency for the LSMs obtained from the FR and hybrid SMCE methods with values of 0.907 and 0.910, respectively. Only the AHP based LSM showed a significantly lower AUC of 0.797 (Figure 4). The FR method shows almost identical ROC curves (Figure 4). The AHP, FR and hybrid SMCE methods are comparatively good estimators for the LSM.
Nonetheless, all the methods produced similar accuracies, and the choice of method is less important than a good set of predictors. The selection of appropriate factors and modelling approaches plays an important role in obtaining results with a higher AUC [66,67]. Considering relevant factors is required to assess the weightings of factors according to specific locations, especially for AHP and hybrid SMCE. All three methods show that the lithology, distance to fault lines and the terrain slope are more effective controlling factors than other factors in the LKTW domain. This is due to differences in the cohesion and permeability of the rock types, fault joint planes and the Earth’s gravitational [68]. Moreover, the slope aspect and landforms play an important role on this phenomenon in the Kullu valley because they are the factors that control the effects of wind and rainfall and the exposure to sunlight during the daytime [50].
Our study agrees with most landslide studies in the global aspects; namely that there is a correlation between landslide distribution and lithological units. Therefore, different lithological units exhibit different behaviours regarding landslides. Consequently, variations in the lithological units and fault lines in the Kullu valley area are considered to have important roles, controlling the occurrences of landslides. The more stable units are the Wangtoo granites, streaky bent gneisses and sandstone meta-sediments. These are highly water permeable units, which reduce landslide occurrences. The fieldwork observations show that the weathered low-grade meta-sedimentary and clastic rocks, e.g., mica schist, phyllites, quaternary alluvium, limestone, siltstone, etc. show similar behaviour to soil material. The presence of soils rich in clay minerals makes the terrain slopes less stable. Many landslides within the Kullu valley area occur within the phyllite, mica schist and limestone rocks. However, results in Reference [1] show that these rocks are affected by many sets of joints and fractures, which may facilitate water infiltration as well as weathering and create sliding.

6. Conclusions

For the first time, the hybrid SMCE method is applied as an integration of the FR and AHP methods to compute the related weightings regarding landslide susceptibility for the Kullu valley, LKTW, Higher Himalayan region, India. This integration method has not been evaluated previously for the north-western Himalayan terrain, and we thus we attempted to determine their accuracy assessment in LSM. Two of the conditioning factors (i.e., lithology and slope aspect) have more influence than other factors on landslides occurrence. This study demonstrates that the factors of landforms and distance to lineaments have a more useful impact on the resulting susceptibility mapping than other factors such as land use, land cover and slope curvatures. The distance to fault and distance to lineaments layer contributed to an increase in AUC for the FR and hybrid SMCE landslide susceptibility maps. Our results indicate that the FR and hybrid SMCE methods yield similar results for Kullu valley, while the AHP method is less accurate for LSM. The hybrid SMCE and FR methods give the overall higher prediction accuracy for the Kullu valley area. The error and the variability associated with the integration method of the hybrid SMCE and FR are less than AHP method when used separately for the LSM. However, the FR method has an advantage of implementation simplicity compared to the other applied methods in this study. For our future work, we aim to develop GIS-based data mining techniques using machine learning methods for landslide susceptibility modelling and mapping in this study area.

Author Contributions

Conceptualization, S.R.M. and S.T.P.; data curation, B.K.M.; funding acquisition, S.R.M. and S.T.P.; investigation, S.R.M.; methodology, S.R.M.; validation, S.R.M.; visualization, S.R.M.; writing—original draft, S.R.M.; B.K.M. and S.T.P.; writing—review and editing S.R.M. and S.T.P.

Funding

This research is partly funded by the Austrian Science Fund (FWF) through the GIScience DoctoralCollege (DK W 1237-N23).

Conflicts of Interest

The authors declare no conflict of interest.

References

  1. Mishra, B.K.; Bhattacharjee, D.; Chattopadhyay, A.; Prusty, G. Tectonic and lithologic control over landslide activity within the Larji–Kullu Tectonic Window in the Higher Himalayas of India. Nat. Hazards 2018, 92, 673–697. [Google Scholar] [CrossRef]
  2. Feizizadeh, B.; Jankowski, P.; Blaschke, T. A GIS based spatially-explicit sensitivity and uncertainty analysis approach for multi-criteria decision analysis. Comput. Geosci. 2014, 64, 81–95. [Google Scholar] [CrossRef] [Green Version]
  3. Bedia, J.; Herrera, S.; Camia, A.; Moreno, J.M.; Gutiérrez, J.M. Forest fire danger projections in the mediterranean using ensembles regional climate change scenarios. Clim. Chang. 2014, 122, 185–199. [Google Scholar] [CrossRef]
  4. Niu, Q.; Dang, X.; Li, Y.; Zhang, Y.; Lu, X.; Gao, W. Suitability analysis for topographic factors in loess landslide research: A case study of Gangu county, China. Environ. Earth Sci. 2018, 77, 294. [Google Scholar] [CrossRef]
  5. Ghorbanzadeh, O.; Feizizadeh, B.; Blaschke, T. An interval matrix method used to optimize the decision matrix in AHP technique for land subsidence susceptibility mapping. Environ. Earth Sci. 2018, 77, 584. [Google Scholar] [CrossRef]
  6. Feizizadeh, B.; Ghorbanzadeh, O. GIS-based interval pairwise comparison matrices as a novel approach for optimizing an analytical hierarchy process and multiple criteria weighting. GI_Forum 2017, 1, 27–35. [Google Scholar] [CrossRef]
  7. Rossi, M.; Guzzetti, F.; Reichenbach, P.; Mondini, A.C.; Peruccacci, S. Optimal landslide susceptibility zonation based on multiple forecasts. Geomorphology 2010, 114, 129–142. [Google Scholar] [CrossRef]
  8. Czikhardt, R.; Papco, J.; Bakon, M.; Liscak, P.; Ondrejka, P.; Zlocha, M. Ground stability monitoring of undermined and landslide prone areas by means of sentinel-1 multi-temporal InSAR, case study from Slovakia. Geosciences 2017, 7, 87. [Google Scholar] [CrossRef]
  9. Martha, T.R.; Westen, C.J.V.; Kerle, N. Landslide hazard and risk assessment using semi-automatically created landslide inventories. Geomorphology 2013, 184, 139–150. [Google Scholar] [CrossRef]
  10. Aleotti, P.; Chowdhury, R. Landslide hazard assessment: Summary review and new perspectives. Bull. Eng. Geol. Environ. 1999, 58, 21–44. [Google Scholar] [CrossRef]
  11. Trigila, A.; Frattini, P.; Casagli, N.; Catani, F.; Crosta, G.; Esposito, C.; Iadanza, C.; Lagomarsino, D.; Mugnozza, G.S.; Segoni, S. Landslide susceptibility mapping at national scale: The Italian case study. In Landslide Science and Practice; Springer: Berlin/Heidelberg, Germany, 2013; pp. 287–295. [Google Scholar]
  12. Hasekioğulları, G.D.; Ercanoglu, M. A new approach to use AHP in landslide susceptibility mapping: A case study at Yenice (Karabuk, NW Turkey). Nat. Hazards 2012, 63, 1157–1179. [Google Scholar] [CrossRef]
  13. Ghorbanzadeh, O.; Feizizadeh, B.; Blaschke, T. Multi-criteria risk evaluation by integrating an analytical network process approach into GIS-based sensitivity and uncertainty analyses. Geomat. Nat. Hazards Risk 2018, 9, 127–151. [Google Scholar] [CrossRef]
  14. Pirnazar, M.; Karimi, A.Z.; Feizizadeh, B.; Ostad-Ali-Askari, K.; Eslamian, S.; Hasheminasab, H.; Ghorbanzadeh, O.; Hamedani, M.H. Assessing flood hazard using GIS based multi-criteria decision making approach; study area: East-Azerbaijan province (Kaleybar Chay Basin). J. Flood Eng. 2017, 8, 203–223. [Google Scholar]
  15. Van Westen, C. Statistical landslide hazard analysis. ILWIS 1997, 2, 73–84. [Google Scholar]
  16. Hong, H.; Pradhan, B.; Sameen, M.I.; Chen, W.; Xu, C. Spatial prediction of rotational landslide using geographically weighted regression, logistic regression, and support vector machine models in Xing Guo area (China). Geomat. Nat. Hazards Risk 2017, 8, 1997–2022. [Google Scholar] [CrossRef]
  17. Pourghasemi, H.R.; Rahmati, O. Prediction of the landslide susceptibility: Which algorithm, which precision? Catena 2018, 162, 177–192. [Google Scholar] [CrossRef]
  18. Chen, K.; Blong, R.; Jacobson, C. MCE-RISK: Integrating multicriteria evaluation and GIS for risk decision-making in natural hazards. Environ. Model. Softw. 2001, 16, 387–397. [Google Scholar] [CrossRef]
  19. Kritikos, T.R.; Davies, T.R. Gis-based multi-criteria decision analysis for landslide susceptibility mapping at northern evia, greece [gis-basierte multikriterielle entscheidungsanalysen zur kartierung von massenverlagerungspotenzialen im nördlichen evia, griechenland]. Z. Dtsch. Ges. Geowiss. 2011, 162, 421–434. [Google Scholar] [CrossRef]
  20. Shahabi, H.; Hashim, M. Landslide susceptibility mapping using GIS-based statistical models and remote sensing data in tropical environment. Sci. Rep. 2015, 5, 9899. [Google Scholar] [CrossRef] [PubMed]
  21. Wang, Q.; Li, W. A GIS-based comparative evaluation of analytical hierarchy process and frequency ratio models for landslide susceptibility mapping. Phys. Geogr. 2017, 38, 318–337. [Google Scholar] [CrossRef]
  22. Sharma, S.; Mahajan, A. A comparative assessment of information value, frequency ratio and analytical hierarchy process models for landslide susceptibility mapping of a Himalayan watershed, India. Bull. Eng. Geol. Environ. 2018, 1–18. [Google Scholar] [CrossRef]
  23. Günther, A.; Van Den Eeckhaut, M.; Malet, J.-P.; Reichenbach, P.; Hervás, J. Climate-physiographically differentiated Pan-European landslide susceptibility assessment using spatial multi-criteria evaluation and transnational landslide information. Geomorphology 2014, 224, 69–85. [Google Scholar] [CrossRef]
  24. Meena, S.R.; Ghorbanzadeh, O.; Blaschke, T. A comparative study of statistics-based landslide susceptibility models: A case study of the region affected by the Gorkha Earthquake in Nepal. ISPRS Int. J. Geo-Inf. 2019, 8, 94. [Google Scholar] [CrossRef]
  25. Shahabi, H.; Khezri, S.; Ahmad, B.B.; Hashim, M. Landslide susceptibility mapping at central Zab basin, Iran: A comparison between analytical hierarchy process, frequency ratio and logistic regression models. Catena 2014, 115, 55–70. [Google Scholar] [CrossRef]
  26. Varnes, D.J. Slope movement types and processes. Transp. Res. Board Spec. Rep. 1978, 176, 11–33. [Google Scholar]
  27. Meena, S.R.; Mishra, B.K. Landslide risk assessment of Kullu valley using frequency ratio methods and its controlling mechanism, Himachal Himalayas, India. In Proceedings of the INQUIMUS 2018 workshop: Methods and Tools to Assess Multi-Hazard Risk, Vulnerability and Resilience, Venice, Italy, 3–5 December 2018. [Google Scholar]
  28. Ghorbanzadeh, O.; Blaschke, T.; Gholamnia, K.; Meena, S.R.; Tiede, D.; Aryal, J. Evaluation of different machine learning methods and deep-learning convolutional neural networks for landslide detection. Remote Sens. 2019, 11, 196. [Google Scholar] [CrossRef]
  29. Meena, S.R. Web based landslide management system for Nepal. In Proceedings of the 33rd Himalaya-Karakorum-Tibet Workshop (HKT), Lausanne, Switzerland, 10–12 September 2018; pp. 109–110. [Google Scholar]
  30. Pisano, L.; Zumpano, V.; Malek, Ž.; Rosskopf, C.M.; Parise, M. Variations in the susceptibility to landslides, as a consequence of land cover changes: A look to the past, and another towards the future. Sci. Total Environ. 2017, 601, 1147–1159. [Google Scholar] [CrossRef] [PubMed]
  31. Cruden, D.M.; Varnes, D.J. Landslide Types and Processes. In Landslides: Investigation and Mitigation; Transportation Research Board: Leipzig, Germany, 1996; Volume 247, pp. 36–75. [Google Scholar]
  32. Guzzetti, F.; Mondini, A.C.; Cardinali, M.; Fiorucci, F.; Santangelo, M.; Chang, K.-T. Landslide inventory maps: New tools for an old problem. Earth-Sci. Rev. 2012, 112, 42–66. [Google Scholar] [CrossRef] [Green Version]
  33. Basheer, I.A.; Hajmeer, M. Artificial neural networks: Fundamentals, computing, design, and application. J. Microbiol. Methods 2000, 43, 3–31. [Google Scholar] [CrossRef]
  34. Pham, B.T.; Prakash, I.; Khosravi, K.; Chapi, K.; Trong, P.; Trinh, T.Q.N.; Hosseini, S.V.; Bui, D.T. A comparison of Support Vector Machines and Bayesian algorithms for landslide susceptibility modeling. Geocarto Int. 2018, 1–23. [Google Scholar] [CrossRef]
  35. Feizizadeh, B.; Blaschke, T. An uncertainty and sensitivity analysis approach for GIS-based multicriteria landslide susceptibility mapping. Int. J. Geogr. Inf. Sci. 2014, 28, 610–638. [Google Scholar] [CrossRef] [PubMed] [Green Version]
  36. Yu, B.; Chen, F.; Muhammad, S. Analysis of satellite-derived landslide at central Nepal from 2011 to 2016. Environ. Earth Sci. 2018, 77, 331. [Google Scholar] [CrossRef]
  37. Raja, N.B.; Įiįek, I.; Türkoğlu, N.; Aydin, O.; Kawasaki, A. Correction to: Landslide susceptibility mapping of the sera river basin using logistic regression model. Nat. Hazards 2018, 91, 1423. [Google Scholar] [CrossRef]
  38. Gökceoglu, C.; Aksoy, H. Landslide susceptibility mapping of the slopes in the residual soils of the Mengen region (Turkey) by deterministic stability analyses and image processing techniques. Eng. Geol. 1996, 44, 147–161. [Google Scholar] [CrossRef]
  39. Yalcin, A.; Bulut, F. Landslide susceptibility mapping using GIS and digital photogrammetric techniques: A case study from Ardesen (NE-Turkey). Nat. Hazards 2007, 41, 201–226. [Google Scholar] [CrossRef]
  40. Devkota, K.C.; Regmi, A.D.; Pourghasemi, H.R.; Yoshida, K.; Pradhan, B.; Ryu, I.C.; Dhital, M.R.; Althuwaynee, O.F. Landslide susceptibility mapping using certainty factor, index of entropy and logistic regression models in GIS and their comparison at Mugling–Narayanghat road section in Nepal Himalaya. Nat. Hazards 2013, 65, 135–165. [Google Scholar] [CrossRef]
  41. Chen, W.; Pourghasemi, H.R.; Naghibi, S.A. A comparative study of landslide susceptibility maps produced using support vector machine with different kernel functions and entropy data mining models in china. Bull. Eng. Geol. Environ. 2018, 77, 647–664. [Google Scholar] [CrossRef]
  42. Regmi, A.D.; Dhital, M.R.; Zhang, J.-Q.; Su, L.-J.; Chen, X.-Q. Landslide susceptibility assessment of the region affected by the 25 April 2015 Gorkha earthquake of Nepal. J. Mt. Sci. 2016, 13, 1941–1957. [Google Scholar] [CrossRef]
  43. Saaty, T.L.; Vargas, L.G. Hierarchical analysis of behavior in competition: Prediction in chess. Behav. Sci. 1980, 25, 180–191. [Google Scholar] [CrossRef]
  44. Cabrera-Barona, P.; Ghorbanzadeh, O. Comparing classic and interval analytical hierarchy process methodologies for measuring area-level deprivation to analyze health inequalities. Int. J. Environ. Res. Public Health 2018, 15, 140. [Google Scholar] [CrossRef]
  45. Ghorbanzadeh, O.; Moslem, S.; Blaschke, T.; Duleba, S. Sustainable urban transport planning considering different stakeholder groups by an interval-AHP decision support model. Sustainability 2018, 11, 9. [Google Scholar] [CrossRef]
  46. Ayalew, L.; Yamagishi, H.; Ugawa, N. Landslide susceptibility mapping using GIS-based weighted linear combination, the case in Tsugawa area of Agano River, Niigata Prefecture, Japan. Landslides 2004, 1, 73–81. [Google Scholar] [CrossRef]
  47. Saaty, T.L.; Vargas, L.G. Inconsistency and rank preservation. J. Math. Psychol. 1984, 28, 205–214. [Google Scholar] [CrossRef]
  48. Sahnoun, H.; Serbaji, M.M.; Karray, B.; Medhioub, K. GIS and multi-criteria analysis to select potential sites of agro-industrial complex. Environ. Earth Sci. 2012, 66, 2477–2489. [Google Scholar] [CrossRef]
  49. Saaty, T.L. A scaling method for priorities in hierarchical structures. J. Math. Psychol. 1977, 15, 234–281. [Google Scholar] [CrossRef]
  50. Pourghasemi, H.; Pradhan, B.; Gokceoglu, C.; Moezzi, K.D. Landslide susceptibility mapping using a spatial multi criteria evaluation model at Haraz Watershed, Iran. In Terrigenous Mass Movements; Springer: Berlin/Heidelberg, Germany, 2012; pp. 23–49. [Google Scholar]
  51. Malczewski, J.; Rinner, C. Multicriteria Decision Analysis in Geographic Information Science; Springer: New York, NY, USA, 2016. [Google Scholar]
  52. Ghorbanzadeh, O.; Blaschke, T. Wildfire susceptibility evaluation by integrating an analytical network process approach into GIS-based analyses. Int. J. Adv. Sci. Eng. Technol. 2018, 6, 48–53. [Google Scholar]
  53. Pradhan, B. Landslide susceptibility mapping of a catchment area using frequency ratio, fuzzy logic and multivariate logistic regression approaches. J. Indian Soc. Remote Sens. 2010, 38, 301–320. [Google Scholar] [CrossRef]
  54. Mahalingam, R.; Olsen, M.J.; O’Banion, M.S. Evaluation of landslide susceptibility mapping techniques using lidar-derived conditioning factors (Oregon case study). Geomat. Nat. Hazards Risk 2016, 7, 1884–1907. [Google Scholar] [CrossRef]
  55. Demir, G.; Aytekin, M.; Akgün, A.; Ikizler, S.B.; Tatar, O. A comparison of landslide susceptibility mapping of the eastern part of the North Anatolian Fault Zone (Turkey) by likelihood-frequency ratio and analytic hierarchy process methods. Nat. Hazards 2013, 65, 1481–1506. [Google Scholar] [CrossRef]
  56. Malczewski, J. GIS and Multicriteria Decision Analysis; J. Wiley & Sons: New York, NY, USA, 1999; p. 392. [Google Scholar]
  57. Rahman, R.; Saha, S. Remote sensing, spatial multi criteria evaluation (SMCE) and analytical hierarchy process (AHP) in optimal cropping pattern planning for a flood prone area. J. Spat. Sci. 2008, 53, 161–177. [Google Scholar] [CrossRef]
  58. Pourghasemi, H.; Moradi, H.; Aghda, S.F.; Gokceoglu, C.; Pradhan, B. GIS-based landslide susceptibility mapping with probabilistic likelihood ratio and spatial multi-criteria evaluation models (North of Tehran, Iran). Arab. J. Geosci. 2014, 7, 1857–1878. [Google Scholar] [CrossRef]
  59. Abella, E.C.; Van Westen, C. Generation of a landslide risk index map for Cuba using spatial multi-criteria evaluation. Landslides 2007, 4, 311–325. [Google Scholar] [CrossRef] [Green Version]
  60. Ghorbanzadeh, O.; Blaschke, T.; Aryal, J.; Gholaminia, K. A new GIS-based technique using an adaptive neuro-fuzzy inference system for land subsidence susceptibility mapping. J. Spat. Sci. 2018, 1–17. [Google Scholar] [CrossRef]
  61. Calvello, M.; Ciurleo, M. Optimal use of thematic maps for landslide susceptibility assessment by means of statistical analyses: Case study of shallow landslides in fine-grained soils. In Landslides and Engineered Slopes. Experience, Theory and Practice; CRC Press: Boca Raton, FL, USA, 2016; pp. 537–544. [Google Scholar]
  62. Sezer, E.A.; Pradhan, B.; Gokceoglu, C. Manifestation of an adaptive neuro-fuzzy model on landslide susceptibility mapping: Klang valley, Malaysia. Expert Syst. Appl. 2011, 38, 8208–8219. [Google Scholar] [CrossRef]
  63. Das, I.; Stein, A.; Kerle, N.; Dadhwal, V.K. Landslide susceptibility mapping along road corridors in the Indian Himalayas using Bayesian logistic regression models. Geomorphology 2012, 179, 116–125. [Google Scholar] [CrossRef]
  64. Park, S.; Choi, C.; Kim, B.; Kim, J. Landslide susceptibility mapping using frequency ratio, analytic hierarchy process, logistic regression, and artificial neural network methods at the Inje area, Korea. Environ. Earth Sci. 2013, 68, 1443–1464. [Google Scholar] [CrossRef]
  65. Schicker, R.; Moon, V. Comparison of bivariate and multivariate statistical approaches in landslide susceptibility mapping at a regional scale. Geomorphology 2012, 161, 40–57. [Google Scholar] [CrossRef]
  66. Capitani, M.; Ribolini, A.; Bini, M. The slope aspect: A predisposing factor for landsliding? C. R. Geosci. 2013, 345, 427–438. [Google Scholar] [CrossRef]
  67. Borrelli, L.; Ciurleo, M.; Gullà, G. Shallow landslide susceptibility assessment in granitic rocks using GIS-based statistical methods: The contribution of the weathering grade map. Landslides 2018, 15, 1127–1142. [Google Scholar] [CrossRef]
  68. Ozdemir, A.; Altural, T. A comparative study of frequency ratio, weights of evidence and logistic regression methods for landslide susceptibility mapping: Sultan Mountains, SW Turkey. J. Asian Earth Sci. 2013, 64, 180–197. [Google Scholar] [CrossRef]
Figure 1. Map showing the location of the study area, landslide inventory map with the distribution of training and validation datasets, and field photographs: (1) debris slide, (2) debris slide, (3) rockfall, and (4) debris slide.
Geosciences 09 00156 g001
Figure 2. Thematic maps used in this study (a) elevation, (b) slope angle, (c) slope aspect, (d) roads, (e) drainage, (f) faults, (g) landforms, and (h) lithology. These landslide-conditioning factors were derived from 30 m ASTER DEM and fieldwork carried out in the study area.
Geosciences 09 00156 g002aGeosciences 09 00156 g002b
Figure 3. (a) Landslide inventory and output landslide susceptibility maps for each method, (b) AHP, (c) FR, and (d) hybrid SMCE.
Geosciences 09 00156 g003
Figure 4. Results of ROC plots for the produced susceptibility maps.
Geosciences 09 00156 g004
Figure 5. An enlarged sub-area from the resulting LSMs generated based on three different models (a) AHP, (b) FR, and (c) hybrid SMCE.
Geosciences 09 00156 g005
Table 1. Pairwise comparison point-based rating scale of AHP [49].
ImportanceDefinitionExplanation
1Equal importanceContribution to objective is equal
3Moderate importanceThe attribute is slightly favoured over another
5Strong importanceThe attribute is strongly favoured over another
7Very strong importanceThe attribute is very strongly favoured over another
9Extreme importanceEvidence favouring one attribute is of the highest possible order of affirmation
2, 4, 6, 8Intermediate valuesWhen compromise is needed
Table 2. The frequency ratio (FR) values and AHP weights for each class.
Factors & AHP WeightsClassesPixels of Each Class% of PixelsLandslide Pixels% of PixelsFRAHP WeightsCR
LandformsActive flood plain12420.020000.063
0.112Channel island9300000.07
Glacial terrain81,4641.330000.068
Highly dissected hill and valley115,2181.880000.068
Moderately dissected hill and valley732,59011.9826,10033.720.680.174
Piedmont slope2,111,09234.520000.086
River25010.040000.090
Snow cover3,027,19149.549,50063.950.310.270
Younger Alluvial Plain44,6900.7318002.330.010.109
0.527
Distance to fault (m)(1) 0–5001,885,37030.8338,700500.350.641
0.056500–10001,125,37218.422,50029.070.340.221
1000–1500474,3077.7672009.30.260.086
>15002,631,09143.02900011.630.060.050
0.03
Distance to drainage (m)<10013,05,28321.3435,10045.350.420.41
0.085100–2001,097,49717.9419,80025.580.280.254
200–300947,45215.49900011.630.150.152
>3001,999,49432.69900011.630.070.078
0.032
Slope ° (%)0–10396,2046.499001.160.040.053
0.21210–20986,02216.1554006.980.10.067
20–301,593,42026.110,80013.950.130.235
30–401,696,25727.7923,40030.230.250.325
>401,432,37823.4736,90047.670.480.320
0.158
Elevation (m)<100012,8410.210000.067
0.1841000–30002,662,88943.5467,50087.210.850.147
3000–45002,127,20534.78990012.790.160.493
>45001,313,22721.470000.291
0.006
AspectFlat20100000.064
0.141North358,1095.8718002.330.050.047
Northeast704,06911.5345005.810.060.051
East708,56011.6154006.980.070.071
southeast753,76612.3516,20020.930.210.014
South799,80413.121,60027.910.260.016
Southwest854,91014.0118,00023.260.210.018
West814,38513.3454006.980.060.015
Northwest752,59812.3336004.650.050.08
North357,8795.869001.160.020.062
0.092
Distance to roads (m)<50169,2792.7745005.810.210.061
0.03250–100163,7872.68900011.630.440.095
100–150158,5792.5954006.980.270.315
>150 5,624,49591.9658,50075.580.080.527
0.07
LithologyBiotitie schist, Kynite gneiss99,3551.6300.000.000.043
0.101Glacio-Fluvial deposites15170.0200.000.000.042
Granitic_Gneiss and Granitoid114,8261.8800.000.000.045
Micaceous sandstone1,122,71518.3839,60051.160.170.252
Pale white to Green Quartzite151,2712.4800.000.000.073
Pebbly siltstone134,8542.2127003.490.100.07
Phyllite Quartzite, Basic Flows12,4080.2000.000.000.083
Quartzite Schist206,3443.3827003.490.060.064
Slate phyllite957,21215.6718002.330.010.058
Sreaky banded gneisss203,9073.3454006.980.130.049
Wangtoo Granite2,407,18439.4163008.140.010.053
phyllite299,1374.9018002.330.030.047
phyllite schist156,6982.5715,30019.770.460.063
purple Limestone239,8813.9318002.330.040.052
0.016

