Eocene Origin of Owens Valley, California


College of Earth, Oceans, and Atmospheric Sciences, Oregon State University, Corvallis, OR 97331, USA
Geosciences 2019, 9(5), 194; https://0-doi-org.brum.beds.ac.uk/10.3390/geosciences9050194
Submission received: 22 March 2019
/
Revised: 9 April 2019
/
Accepted: 26 April 2019
/
Published: 28 April 2019
(This article belongs to the Special Issue Interactions between Surface Processes, Tectonics and Mantle Dynamics in the Evolution of Topography)
Abstract
:Bedrock (U-Th)/He data reveal an Eocene exhumation difference greater than four kilometers athwart Owens Valley, California near the Alabama Hills. This difference is localized at the eastern fault-bound edge of the valley between the Owens Valley Fault and the Inyo-White Mountains Fault. Time-temperature modeling of published data reveal a major phase of tectonic activity from 55 to 50 Ma that was of a magnitude equivalent to the total modern bedrock relief of Owens Valley. Exhumation was likely accommodated by one or both of the Owens Valley and Inyo-White Mountains faults, requiring an Eocene structural origin of Owens Valley 30 to 40 million years earlier than previously estimated. This analysis highlights the importance of constraining the initial and boundary conditions of geologic models and exemplifies that this task becomes increasingly difficult deeper in geologic time.
1. Introduction
The accuracy of initial and boundary conditions is critical to the development of realistic models of geologic systems. These conditions are often controlled by pre-existing features such as geologic structures and elements of topographic relief. Features can develop under one tectono-climatic regime and persist on geologic time scales, often controlling later geologic evolution by imposing initial and boundary conditions through mechanisms such as the structural reactivation of faults and geomorphic inheritance of landscapes (e.g., [1,2]). Identifying such paleo-features is a prerequisite to the optimization of models of geologic processes and assessing the assumptions that underly them.
Low-temperature thermochronometry provides numerous examples of this phenomenon (e.g., [3,4]). A time–temperature analysis of data from Owens Valley, California leads to insights into the Cenozoic geologic evolution of the southern United States (U.S.) Cordillera, placing new constraints on the timing and mechanism of the demise of the Nevadaplano [5]. (U-Th)/He data from several published transects across Owens Valley document a major Eocene exhumation difference between the bedrock to the east and west of the valley (Figure 1). This difference occurs across a discrete fault-bounded segment of Owens Valley, indicating significant Eocene structural activity on these faults. This excludes the possibility of Neogene geographic continuity of the Nevadaplano with the southern Sierra Nevada, which is in direct opposition to inferences made by previous workers (e.g., [6,7,8]). In shifting the initial and boundary conditions for the regional late Cenozoic tectonic evolution of Owens Valley, this new analysis requires that contiguity of the Nevadaplano with the southern Sierra Nevada did not persist past circa 50 Ma, roughly 30 to 40 million years earlier than previous estimates [6,7,8].
2. Geologic Context
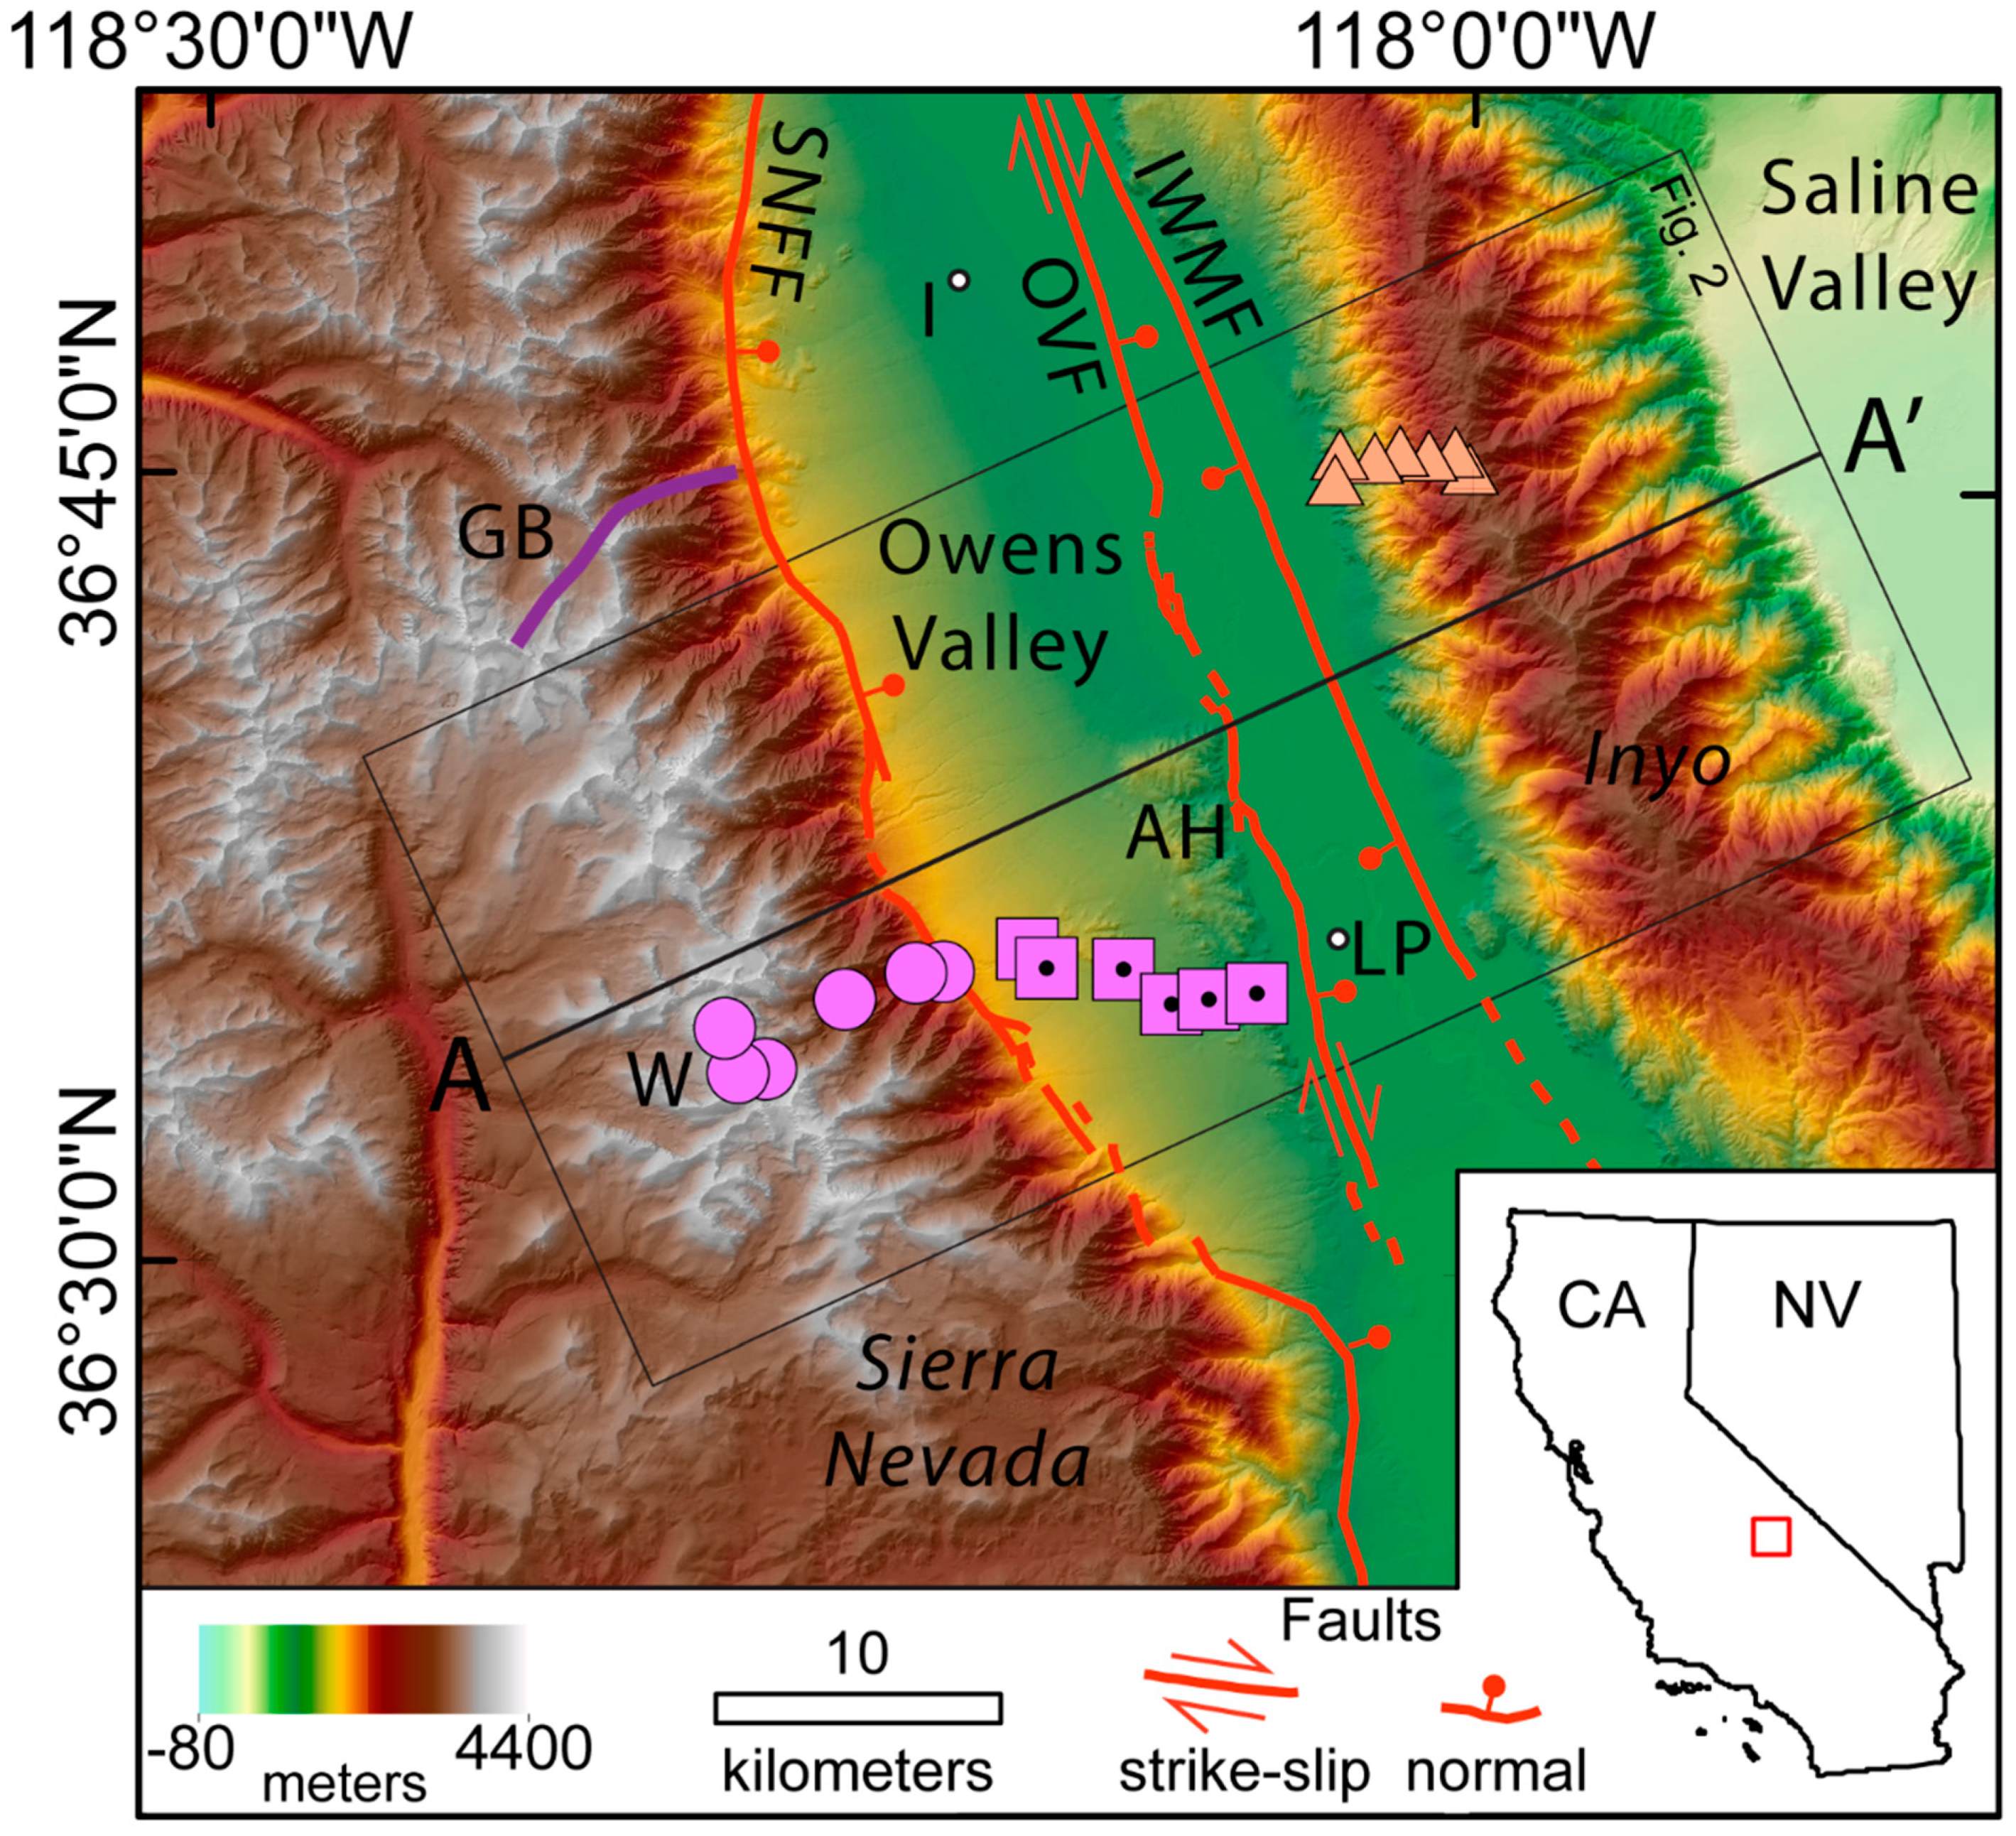
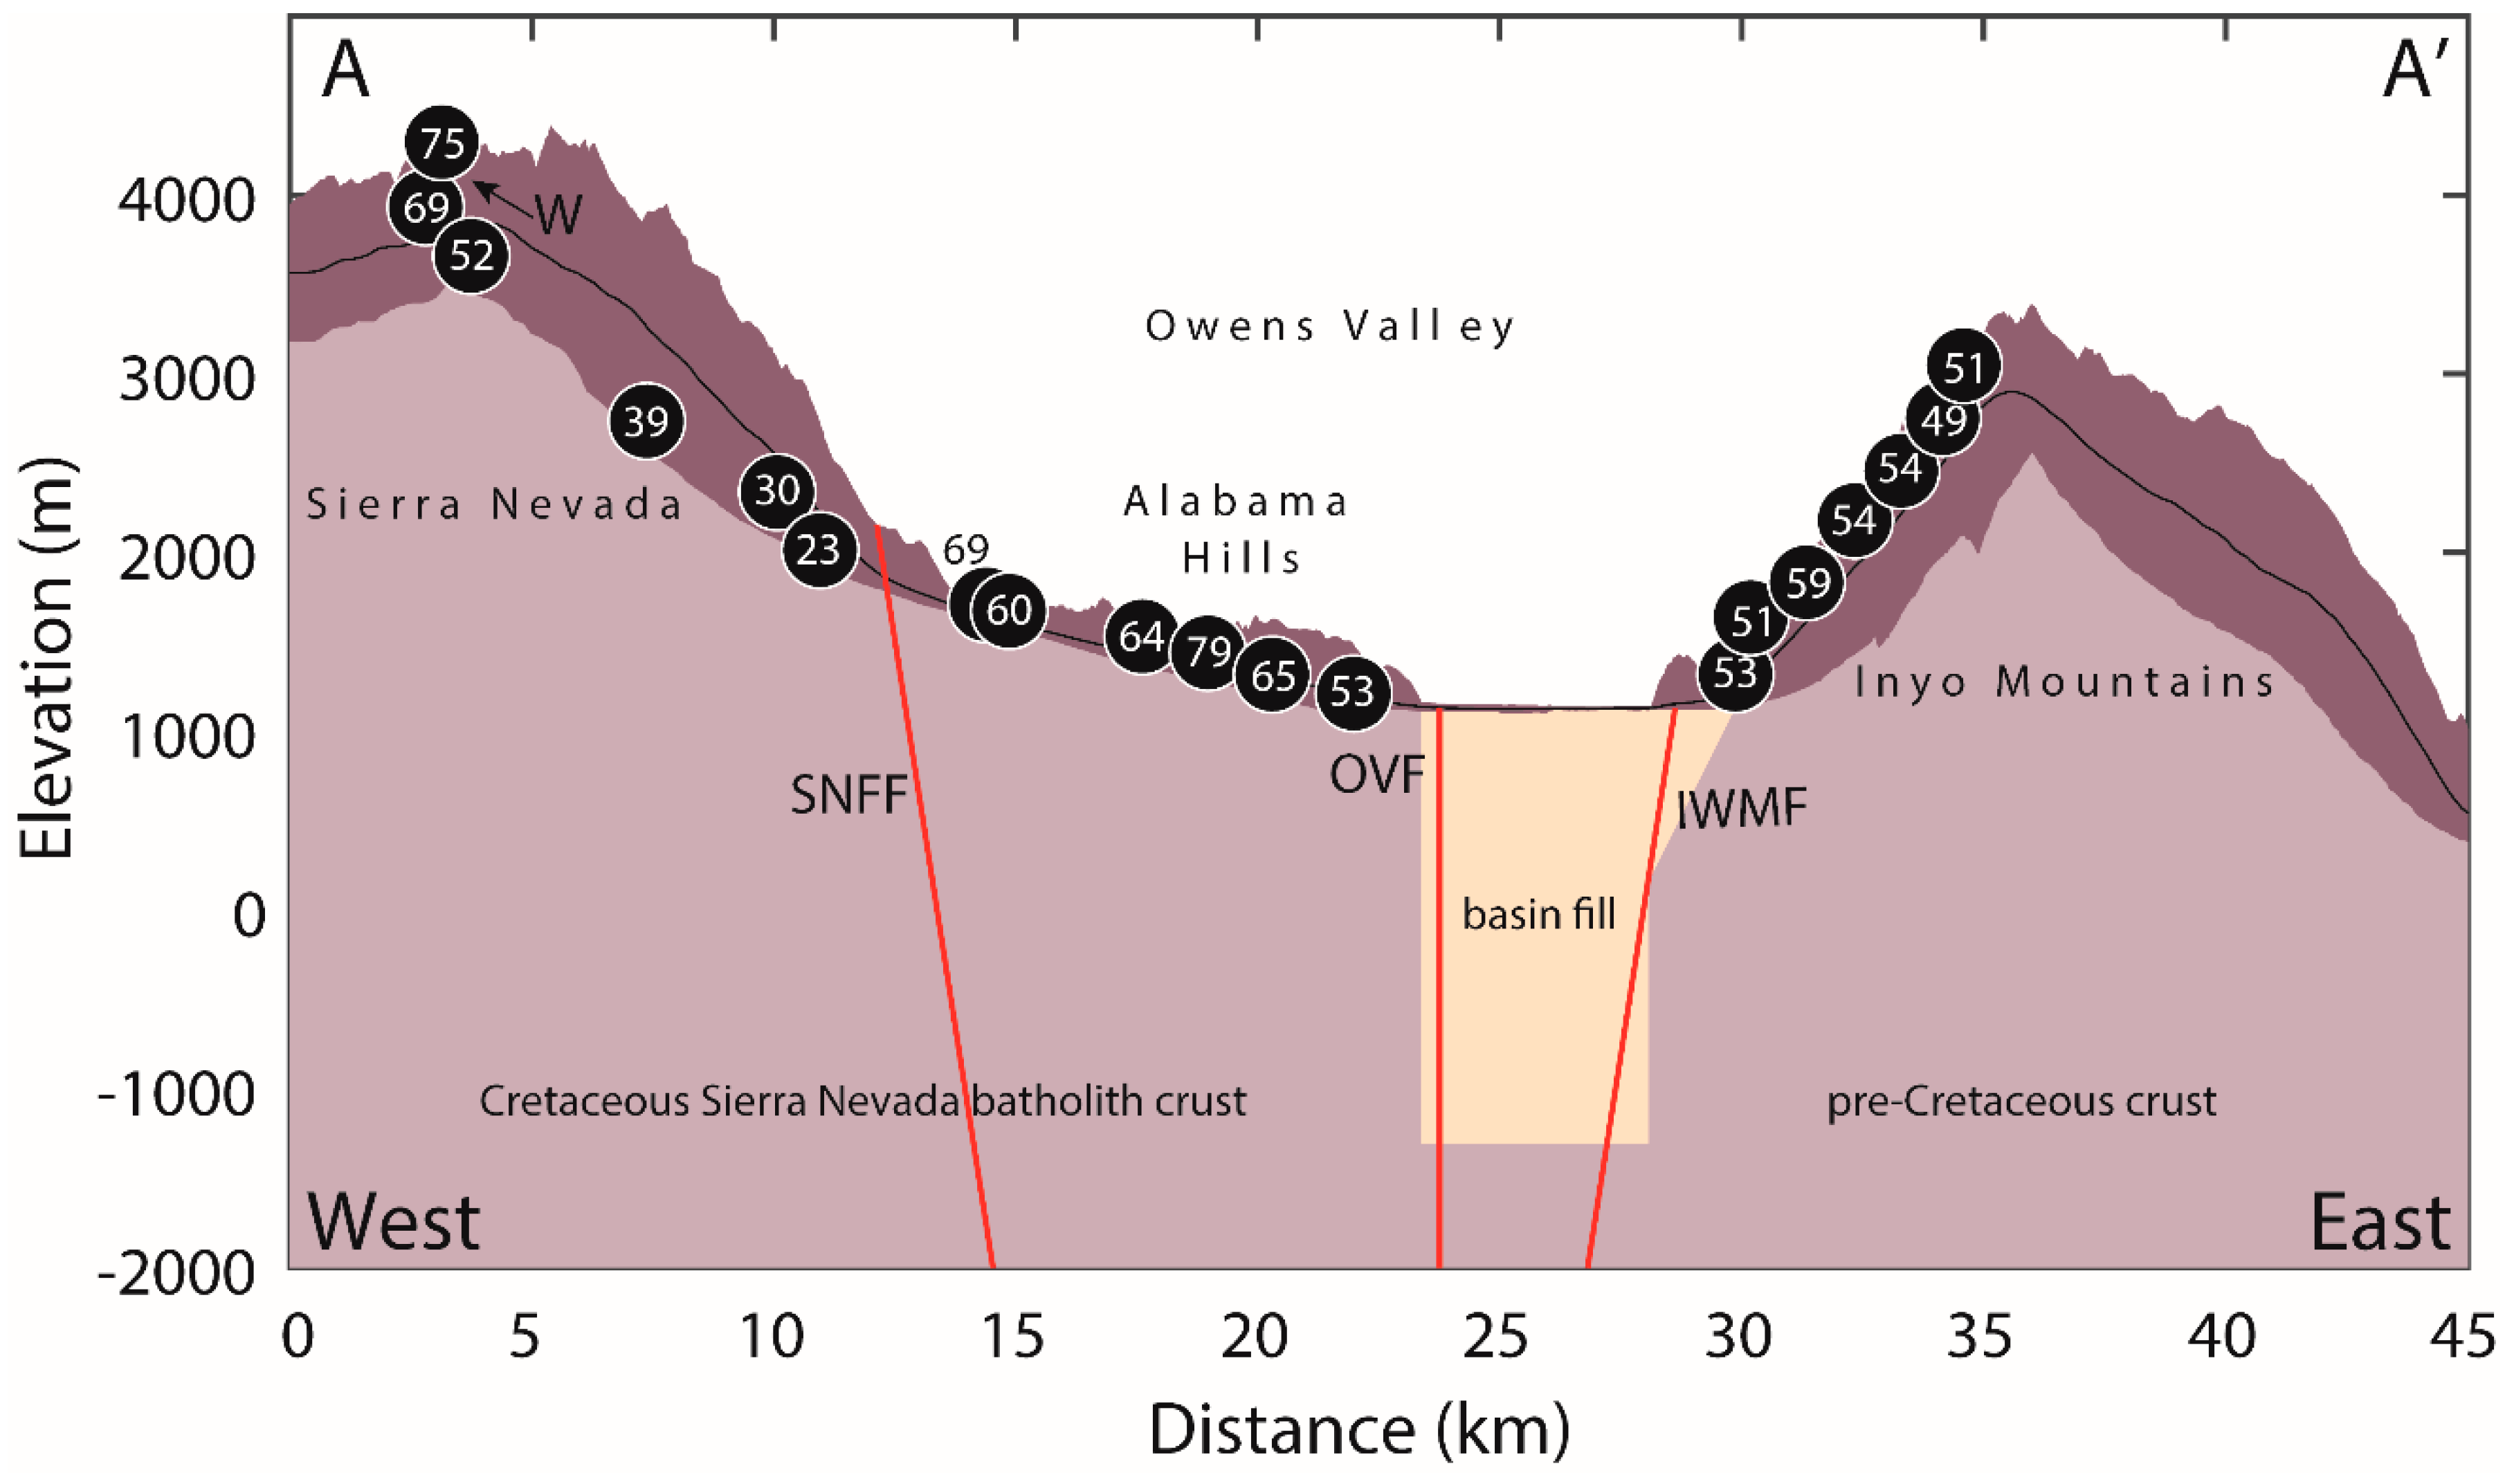
Owens Valley coincides with a crustal-scale boundary between the composite Sierra Nevada Batholith (SNB) to the west and older, metamorphosed, and structurally deformed mostly pre-Cretaceous crust to the east. Near the Alabama Hills (Figure 1), the Sierra Nevada Frontal Fault (SNFF) exhibits about three kilometers of topographic relief separating the SNB outcrops of the high southern Sierra from consanguineous outcrops near the modern valley floor. Two additional kilometers down to the bottom of Owens Valley fill marks a total bedrock relief of over five kilometers ([14]; Figure 2).
Several lines of indirect evidence have led workers to infer a late Cenozoic origin of Owens Valley. These include a lack of pre-late Miocene rocks in Owens Valley, evidence of late Cenozoic activity on the SNFF (e.g., [15,16]), Owens Valley Fault (OVF; e.g., [13,17]) and Inyo-White Mountains Fault (IWMF; e.g., [18,19]), and coupled geomorphic and volcanic stratigraphic resemblances between the high southern Sierra Nevada and Inyo Mountains [6,8,20]. Greater than 60 km of dextral offset was measured across Owens Valley post-83 Ma based on correlation of the Golden Bear dike in the study area (Figure 1) and the Coso dikes about 60 km to the south [21]. However, the structure responsible for the offset is not constrained and no Eocene exhumation difference or relief generation is ascribed to it.
Different scenarios for the pre-Neogene paleogeography of the Owens Valley region have been posited, including potentially integrated Paleogene drainages, flowing both north-to-south [22] and east-to-west [23], as well as a continuous low-relief, high-elevation landscape spanning from the high peaks of the southern Sierra Nevada eastward across the Inyo-White Mountains that persisted until at least 12 Ma [6,8,20]. The lack of evidence for through-going Eocene drainages across the southern Sierra Nevada was used by [24] to suggest a drainage divide near the present southern Sierra crest. None of these scenarios include major pre-Neogene Owens Valley structures. Instead, these studies generally presume that the major structures controlling Owens Valley initially formed in late Cenozoic, due to the westward encroachment of basin and range tectonics across the eastern boundary of the composite SNB. In the absence of direct evidence for a pre-Neogene Owens Valley, it has been reasonable to assume the veracity of a late Cenozoic origin of Owens Valley. This paper presents evidence to the contrary.
3. Materials and Methods
3.1. (U-Th)/He Data
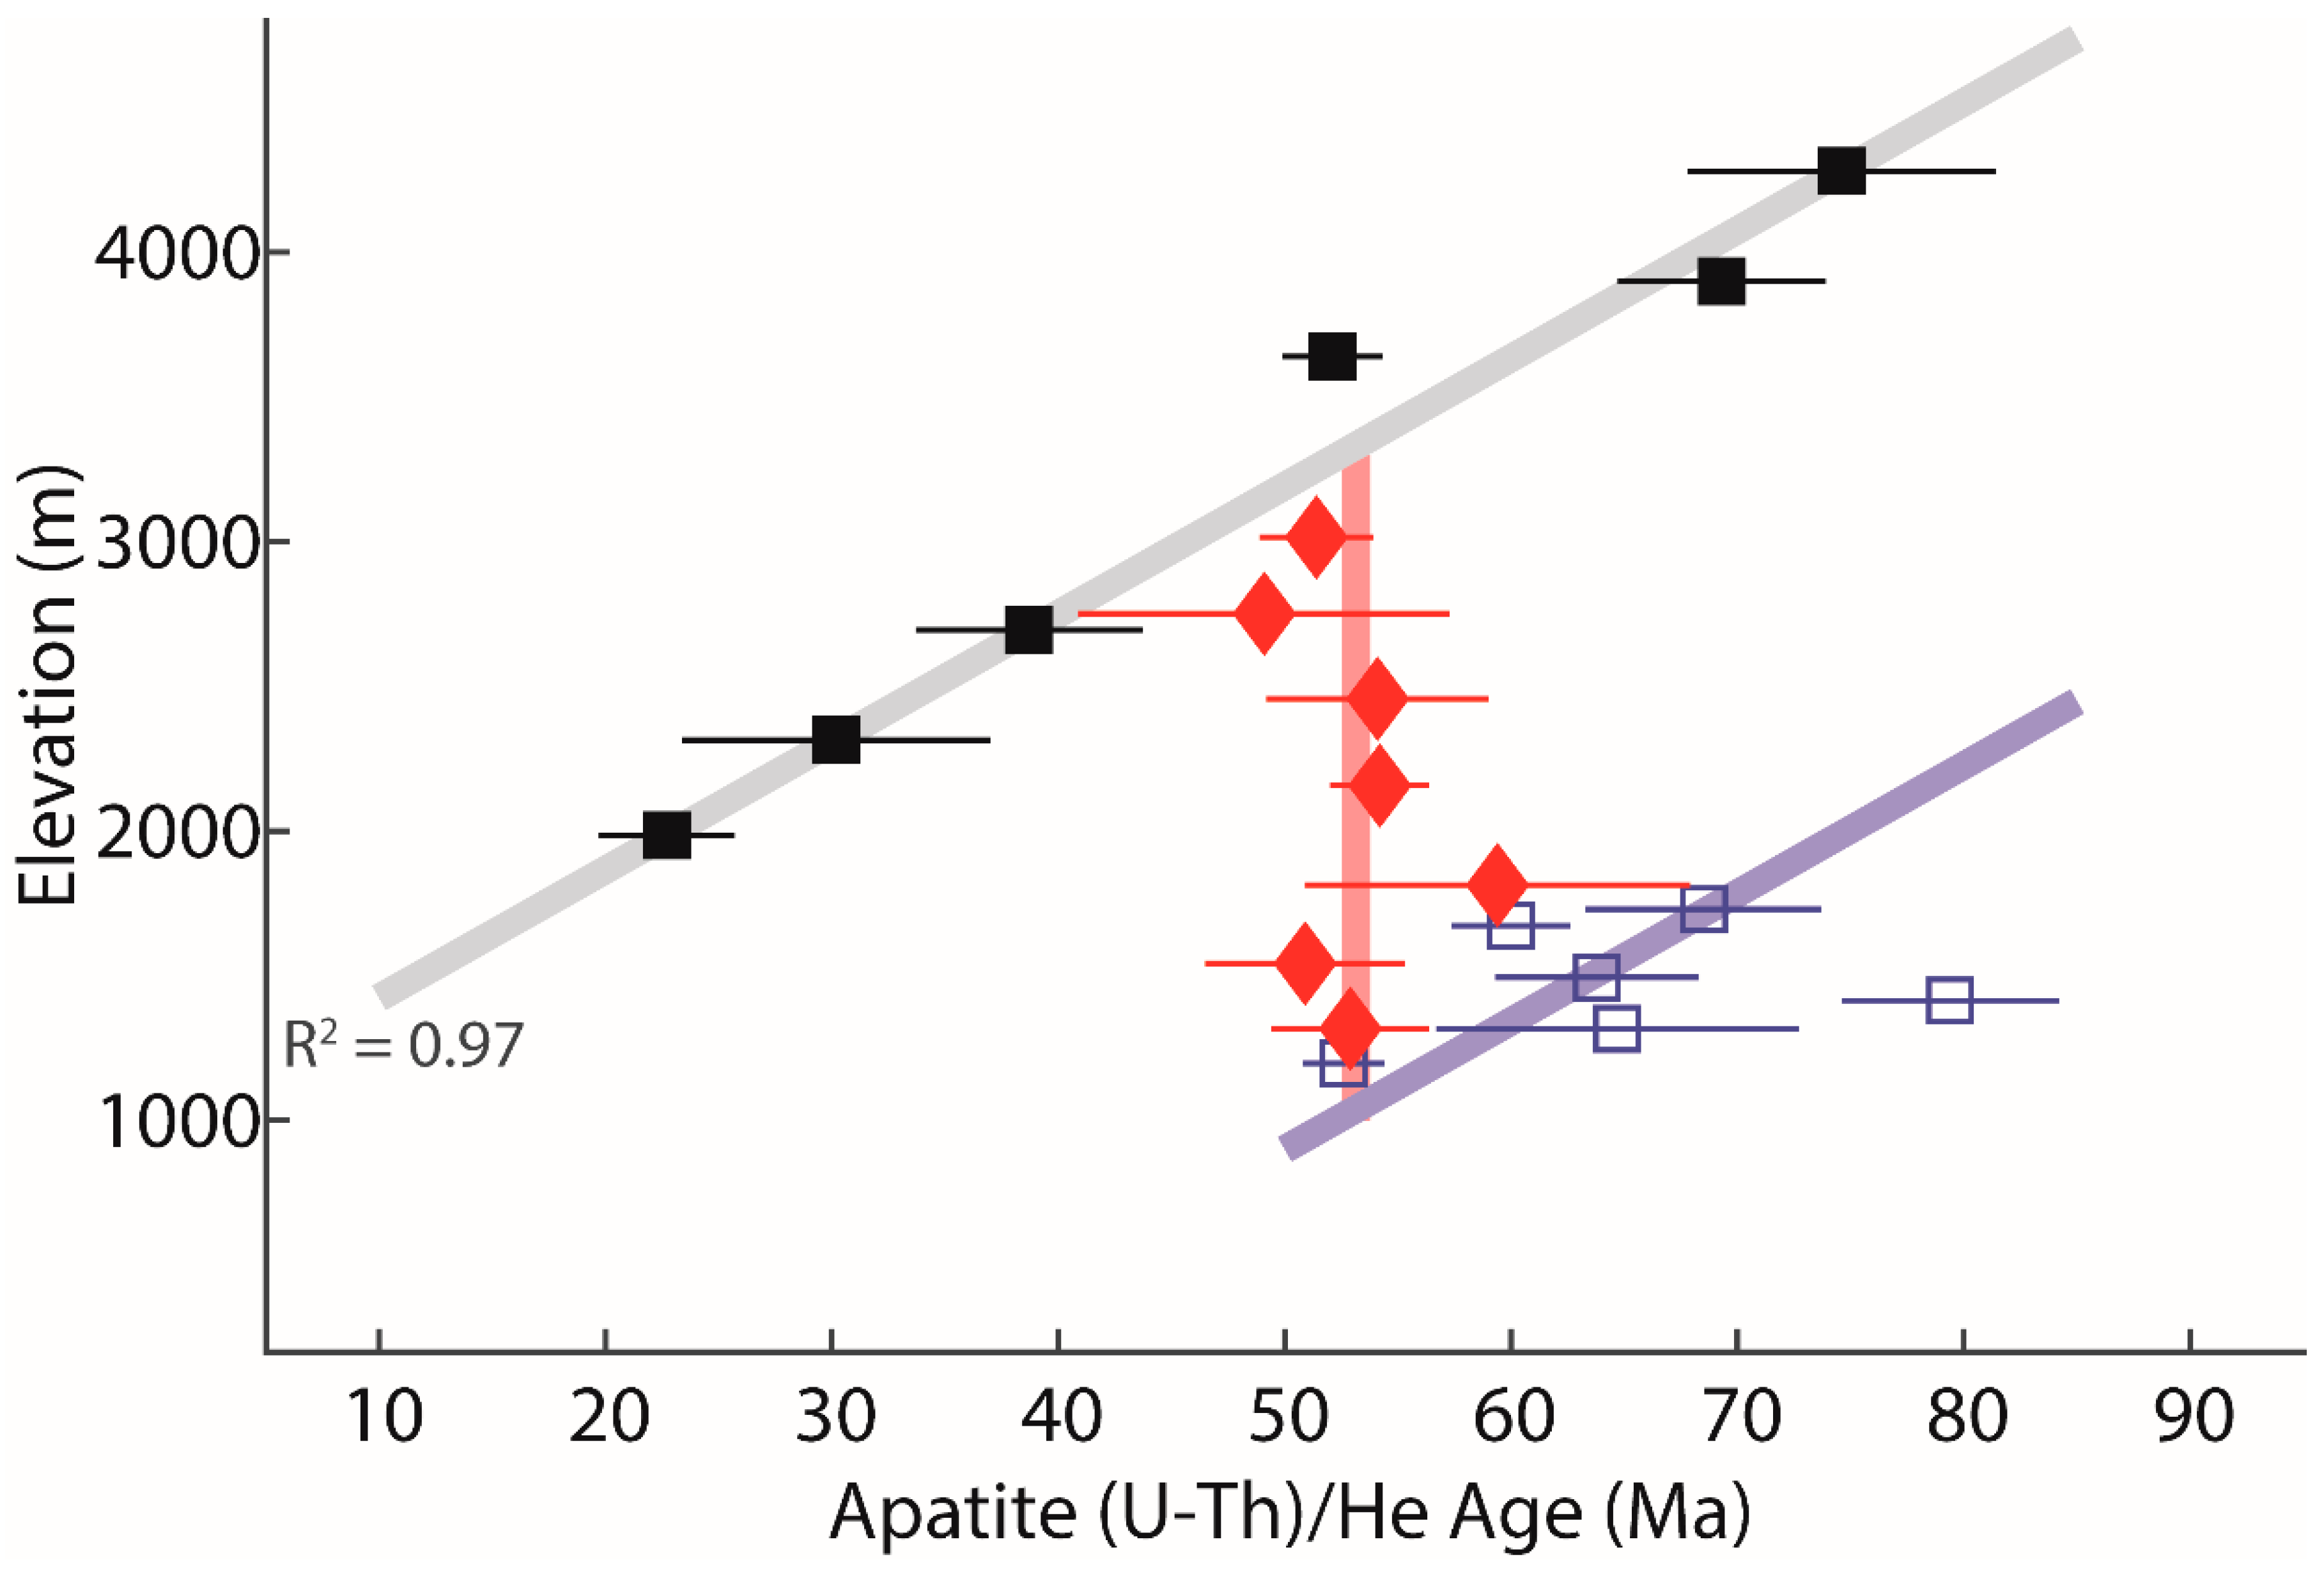
Three bedrock (U-Th)/He datasets together form a composite transect across Owens Valley drawn from three data sources which were published independently ([9,10,11]; Table 1). The first transect starts near the peak of Mount Whitney and descends the eastern Sierra Nevada front (Figure 2; [9]). The samples all come from the circa 83 Ma Mount Whitney intrusive suite [25,26]. Apatite (U-Th)/He (AHe) ages decrease with elevation from 75 Ma at 4200 m elevation to 22 Ma at 1900 m elevation. The data form a line in age-elevation space with a slope of about 40 to 50 m per million years (Figure 3). This slope corresponds to a long-term Cenozoic exhumation rate corroborated by numerous other southern Sierra Nevada AHe datasets [3,9,27,28,29,30,31].
The second segment is a suite of six samples from outcrops in the Alabama Hills spanning an elevation of 1194 m to 1730 m. These samples also come from the Mount Whitney intrusive suite. AHe ages range from 52.6 Ma to 79.4 Ma, and do not exhibit a strong correlation between AHe age and elevation (Figure 3). Interpreted together with AHe data from the Mount Whitney vertical transect, these data are consistent with several kilometers of east-down faulting on the SNFF post-dating the youngest ages in either of the suites, which was 22.7 Ma [10].
The third dataset is a transect from 1317 m to 3015 m elevation up the western flank of the Inyo Mountains at the eastern edge of Owens Valley (Figure 1), and includes both apatite and zircon (U-Th)/He ages (ZHe). Samples come from the Jurassic Pat Keyes Pluton (circa 183 Ma; [32,33]). The AHe ages from this transect are invariant across nearly two kilometers of vertical relief, with an average age of 53.1 +/− 3.1 Ma (1σ, Figure 3). The ZHe ages from this transect range from 64.1 Ma to 76.5 Ma (Table 1). These data are clearly different than the Mount Whitney and Alabama Hills data, and must have experienced a different exhumation history. This exhumation difference coincides with a narrow, deep basin bounded by the OVF and IWMF along the eastern edge of Owens Valley (Figure 2; [14]).
3.2. Quantitative Thermochronologic Modeling
This work uses the modeling software QTQt v.5.6.0 to constrain the thermal histories of the rocks comprising the two transects from the southern Sierra Nevada and Inyo Mountains [34]. This program utilizes a Bayesian Monte Carlo Markov chain statistical approach to constrain the time-temperature paths of thermochonometric data. Inputs to QTQt include grain size and U and Th concentrations, and diffusion parameters are calculated using the radiation damage accumulation and annealing model (RDAAM) of [35] for apatite, and the radiation damage model of [36] for zircon. Sphere equivalent radii were calculated using the Qt Ft program [37,38]. QTQt implements an iterative process of perturbation and comparison of the pre-perturbation and post-perturbation thermal histories, followed by a choice of the better of the two according to an acceptance criterion [34]. I first ran the model for a “burn-in” period of at least 5 × 10⁵ iterations, with the purpose of allowing the model to reach a best fit (after [30,31,39,40]). This was validated by comparing the model outputs to the measured AHe ages (Supplementary Materials), and was followed by a post-“burn in” run of 5 × 10⁵ additional iterations to document the best-fit region. The outputs of the post-“burn in” runs are displayed as the final model results. In all the cases, I minimized the input model constraints to the greatest possible extent. The inputs were limited to the AHe and ZHe data, the pluton emplacement age as a high-temperature initial condition, and the modern surface temperature boundary condition of 20° ± °5 C. For details about the model set-up and outputs, see Table 2 and the Supplementary Materials.
One strength of the QTQt program is its ability to handle vertical transect data natively. This is accomplished by tying each (U-Th)/He age to its elevation and then fitting a geothermal gradient to the overall transect. The geothermal gradient is simultaneously fit as an additional variable that is iteratively perturbed by the model and can change with time. I defined a range of allowable geothermal gradients to allow the model to fully explore the potentially geologically reasonable values (10 °C/km to 50 °C/km).
4. Results
4.1. Southern Sierra Nevada
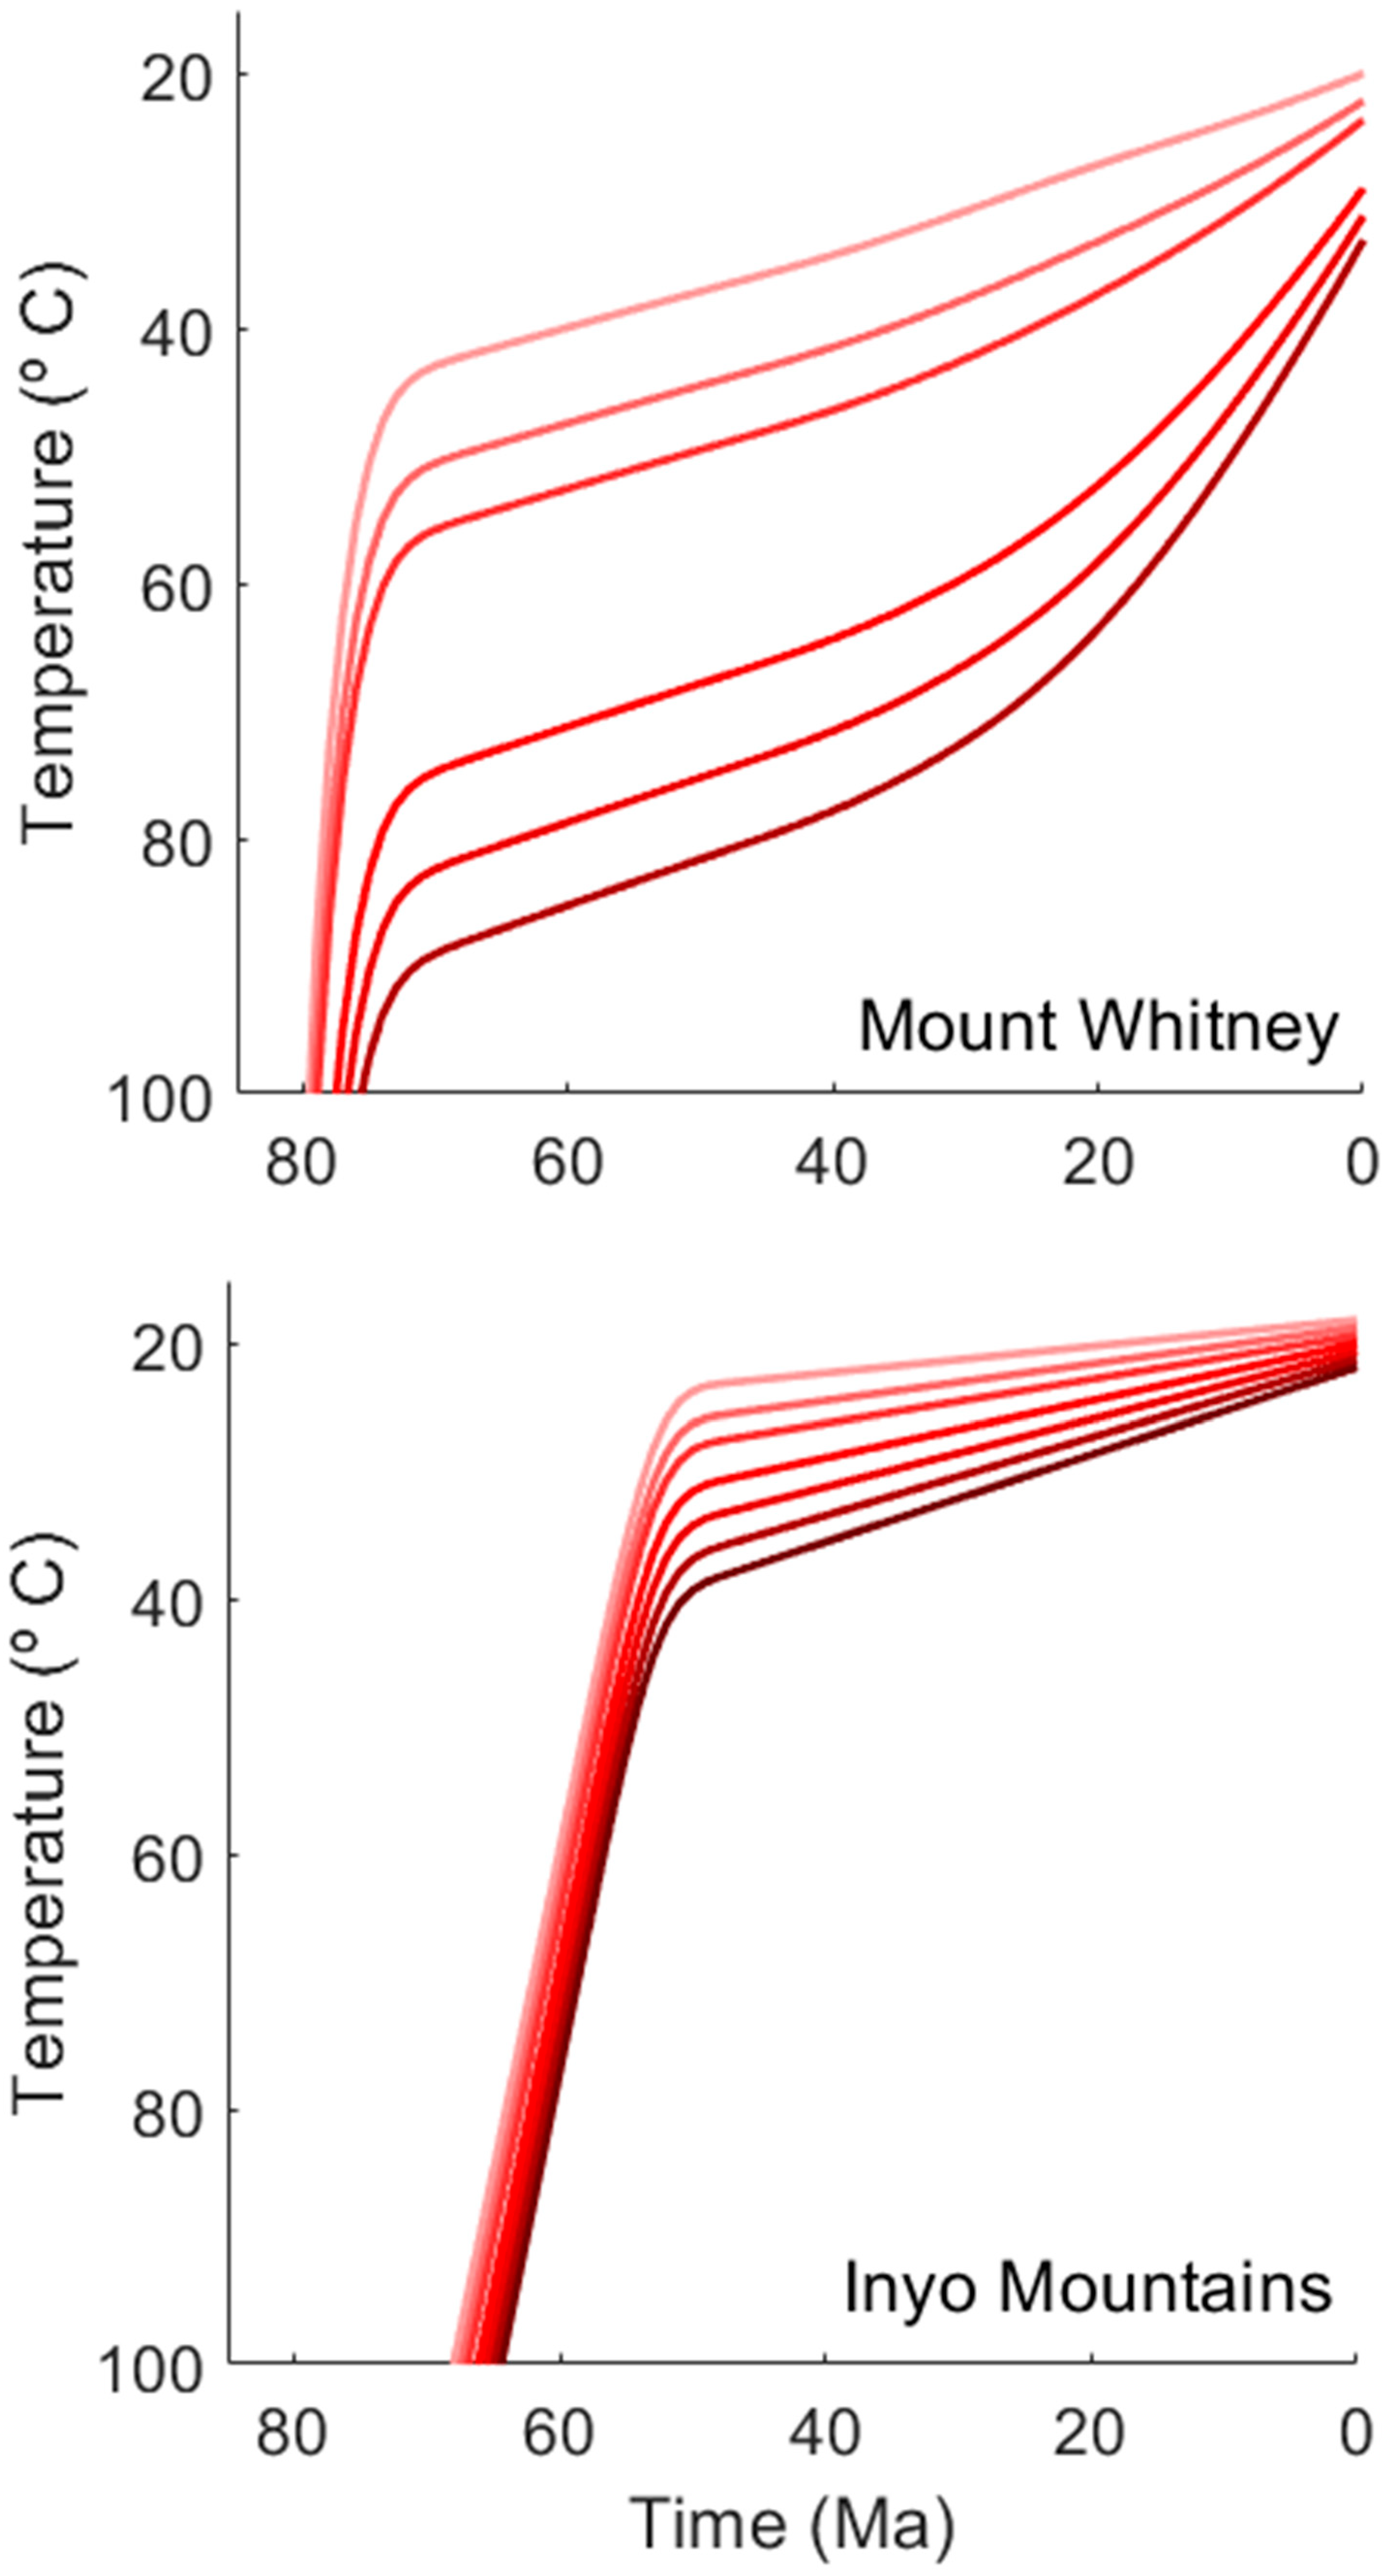
The thermal model results of the Mount Whitney transect are consistent with 83 Ma igneous emplacement followed by cooling of the top of the transect through AHe closure around 75 Ma (Figure 4). Following rapid post-emplacement cooling, the transect cooled slowly through early Cenozoic time, corresponding to the range-wide slow exhumation rate of about 40 to 50 m/my. A late Cenozoic increase in the cooling rate roughly corresponds to the youngest age in the transect (ca. 22 Ma), and accounts for the final exhumation of the rocks comprising the transect. The timing of this acceleration is in general agreement with estimates for Neogene initiation of the SNFF and the eastern Sierra escarpment, which forms the western wall of modern Owens Valley (e.g., [3,15]).
4.2. Inyo Mountains
In stark contrast to the multiphase cooling history of the southern SNB, the invariant AHe ages and Late Cretaceous ZHe ages from the Inyo Mountains transect require less than 1 to 2 kilometers of exhumation since circa 54 Ma. The models developed by [11] utilize the AHe and ZHe data modeled here, as well as a longer transect across the entire Inyo Range from Owens Valley up, across, and down into Saline Valley. Two endmember scenarios are described by [11], depending on the magnitude of an earlier Late Cretaceous exhumation event. All the scenarios require a circa 54 Ma major pulse of eastward tilt (12° to 20°) and exhumation (3.9 km to 5.6 km) of the western Inyo Mountains, which form the eastern wall of the modern Owens Valley. Additionally, a significant Neogene westward tilting event (opposite sense to Eocene tilting) is predicted by [11]. Due to this later tilt, I use the predicted sample elevations at onset of the 54 Ma rapid exhumation (Figure 11b in [11]) rather than utilize the modern elevations of the samples. The QTQt model results for the western slope of the Inyo Mountains require rapid exhumation of the entire transect through the AHe PRZ circa 55–50 Ma (Figure 4). Note that the use of the elevations from [11] does not significantly affect the results. Model runs utilizing modern elevations (not shown) and all of the scenarios from [11] require rapid exhumation circa 55–50 Ma.
4.3. Conditions for Owens Valley Evolution
In light of the published constraints on the thermal evolution and crustal structure of the bedrock to the west of Owens Valley (Sierra Nevada) and to the east of Owens Valley (Inyo Mountains) near the Alabama Hills, one can consider the initial and boundary conditions required to understand the evolution of Owens Valley in the Eocene. First, a major pre-Cenozoic crustal boundary existed at the eastern edge of the Sierra Nevada batholith, with less deformed Cretaceous batholithic crust to the west, and older more deformed mixed metamorphic and batholithic crust to the east. Second, the cooling history in the Eocene is highly disparate across Owens Valley, and this difference is geographically limited to a narrow deep basin at the eastern edge of Owens Valley. These conditions critically underly the evolution of the geologic system, as is reflected in the discussion that follows.
5. Discussion
5.1. Exhumation Athwart Owens Valley
Previous work has constrained the exhumation history of the Inyo mountains block, considering the AHe and ZHe data modeled here along with a longer transect of data that continues down the eastern side of the range into Saline Valley, California [11]. Although the focus of [11] is mostly on Neogene and younger tectonic activity, the authors utilized the (U-Th)/He data in conjunction with a Late Cretaceous to Paleogene geothermal gradient of 15 °C/km [19,41] to constrain a circa 54 Ma pulse of tectonic activity, estimating 3.9 km to 5.6 km of exhumation of the western Inyo Mountains at a rate of >800 m/my to >1100 m/my accompanied by 12° to 20° of eastward tilt [11]. The new QTQt model results presented above concur with the timing of this exhumation event, and agree that its magnitude was sufficient to set the western Inyo Mountains AHe ages.
In contrast to this major Eocene exhumation of the Inyo Mountains block, model results for the Mount Whitney transect (Figure 4) indicate slow Paleogene exhumation at a rate of about 40 to 50 m/my. This is in accord with previous studies from the southern SNB [3,27,28,29]. Published data extend this Paleogene history eastward to include Mount Whitney intrusive suite rocks outcropping in the Alabama Hills [10]. These rocks were continuous with outcrops of the high Sierra until Neogene time, after which they were broken up and faulted down to their current location. This structural deformation of the Alabama Hills basement rocks makes it impossible to reconstruct their source elevations relative to the Mount Whitney transect for possible modeling [10]. Using the rates calculated for the Inyo Mountains (from [11] and corroborated herein) and for the southern Sierra Nevada circa 54 Ma (from [3,9,27,30,31] and corroborated herein), in the roughly five million years required to exhume 5000 m of the western Inyo Mountains (5000 m at 1000 m/my), only about 250 m of exhumation occurred in the southern Sierra (five million years at 50 m/my).
The data and model results require Eocene cooling rates across Owens Valley that are not reconcilable with a common exhumation history. The Mount Whitney and Alabama Hills data require slow Eocene exhumation (ca. 50 m/my) contemporaneously with exhumation and tilting of the Inyo Mountains (ca. 1000 m/my). These concurrent exhumation rates differ by a factor of 20. Furthermore, the locations of the samples restrict this Eocene exhumation difference to a swath along the eastern edge of Owens Valley less than 10 kilometers wide, where the total bedrock relief is over five kilometers. This strip is fault-bound by the OVF on the west and the IWMF on the east (Figure 1).
5.2. Possibility of Tilted Isochrones
The tectonic models presented in [11] predict that Neogene westward tilting (in the opposite sense to Eocene tilting) of the Inyo Mountains block resulted in a relative increase in topographic relief amongst the western flank Inyo Mountains samples. I take this into account by utilizing the estimated sample elevations at 54 Ma rather than the modern elevations in the Inyo Mountains model runs (Table 1). It is also worth noting that the other endmember from [11] results in an even more muted pre-Eocene relief structure than that which I use for the modeling herein. I consider it prudent to utilize the intermediate estimate for the modeling scenarios, but I have also run another Inyo Mountains model using the exact same parameters, but the most muted pre-Eocene sample elevations. The results of this model show no difference in the thermal history of the western Inyo Mountains (see the Supplementary Materials for the model outputs). Furthermore, it is also worth considering the possibility that the Neogene westward tilting was much greater than expected by [11]. Considering an extreme case where one assumes that the western Inyo Mountains was tilted so greatly in the Neogene that the samples all represent a single depth of exhumation, it would be inappropriate to treat these samples as a vertical transect. However, because the predicted exhumation patterns presented by [11] (Figure 11 therein) are based in aggregate on AHe and ZHe data across the entire Inyo Range, this case would not change the required exhumation history of the western Inyo Mountains. Greater than 4 km of exhumation at roughly 1000 m/my circa 54 Ma would still be required for the western Inyo Mountains, and the profound difference athwart Owens Valley would still need a structural explanation.
5.3. Eocene Structural Activity
The exhumation difference across eastern Owens Valley requires an Eocene structural accommodation. (U-Th)/He sample locations require this accommodation to be within the 10 km-wide eastern strip of Owens Valley, which is bound to the west and east by the OVF and IWMF, respectively. The geometry and kinematics of this structure is not directly constrained by the thermochronometric data and model results presented in this paper. However, a number of previous studies have proposed the kinematics that are relevant to this structure. One study argues for >60 km of dextral horizontal offset post 83 Ma based on offset of the Golden Bear dike and Coso dikes across Owens Valley [21]. However, the very broad temporal constraint (any time post 83 Ma), and dextral kinematics of this offset do not help constrain the Eocene structure required to explain the data across Owens Valley. Another study suggested that most of this dextral offset may have accumulated during the Late Cretaceous to Paleogene time [42], possibly related to the geometric complexity in the extensional detachment system that exhumed the southernmost Sierra Nevada batholith and was active into the Paleogene [43,44]. While this system may have remained active into the Paleogene, its activity primarily exhumed the southern Sierra Nevada batholith about 150 km southwest of the study area. The AHe data from the Mount Whitney transect locally require slow cooling of the SNB circa 55 Ma, which preclude it from significantly affecting the exhumation difference presented here.
Farther north in Owens Valley, earlier studies neither recognize a major phase of Eocene tectonic activity, nor do they rule out the possibility of such an earlier phase [19,41]. In fact, the uppermost portions of the AHe and apatite fission track (AFT) transect from the central and northern White Mountains, above the inferred Neogene AHe partial retention and AFT partial annealing zones, include roughly invariant ages, circa 60 Ma to 50 Ma, spanning about a kilometer in paleo-structural elevation [19]. This signal is not so clearly defined as in the Inyo Mountains, but it does demonstrate the possibility of a similar scenario farther north in Owens Valley. In sum, published evidence for early Cenozoic tectonic activity in Owens Valley fail to adequately explain the magnitude of exhumation, timing, and location required by the thermochronometric data.
For a compressional structure, the basin geometry would require the structure to be at a high angle, suggesting the presence of a reverse fault dipping eastward beneath the Inyo Mountains. However, the kinematics of this structure would not be consistent with the eastward tilt required by the thermochronologic data or the surface topography of a deep narrow basin. Considering this, I propose two new hypothetical scenarios for normal faulting that could explain the exhumation athwart Owens Valley.
Hypothesis 1 posits that an Eocene normal fault developed at the pre-existing crustal boundary at the eastern edge of the southern SNB. In this scenario, normal faulting at the western edge of the Inyo Mountains on what is now the Inyo-White Mountains Fault generated basement relief as the Inyo Mountains block tilted eastward (Figure 5b). Rapid exhumation of the Inyo Mountains drove bedrock cooling recorded by the data. Relative to the Inyo Mountains uplift, the paleo-Owens Valley was dropped down, generating a significant amount of basement relief.
Under the second hypothesis, an Eocene normal fault-bound graben developed asymmetrically at the eastern edge of the southern SNB. In this scenario, the graben between the paleo-Owens Valley Fault and paleo Inyo-White Mountains fault was dropped down relative to both the eastern SNB and Inyo-White Mountains (Figure 5c). The magnitude of relative uplift would have to be much greater for the Inyo Mountains than for the southern Sierra Nevada, as documented by the different exhumation histories recorded by the thermochronometric data.
Under either hypothesis, it is expected that large amounts of colluvium would have been deposited syntectonically. In the case of hypothesis 1, eroded detritus would have been initially deposited locally, but a lack of local accommodation space would have resulted in the large-scale shedding of detritus westward toward the Great Valley and southward toward the Goler depositional basins, both of which are over 100 km away and record deposition in Eocene time [45,46,47,48,49,50].
On the other hand, hypothesis 2 likely would have resulted in more local deposition in the paleo-Owens Valley in addition to the shedding of material to the west and south. Deep subsurface data for Owens Valley could potentially help discriminate between these scenarios by estimating the volume of subsurface colluvial Paleogene sediments in Owens Valley, but no such data has been published to date. Both scenarios allow for the slow Paleogene exhumation for the SNB, as well as the contemporaneous pulse of rapid exhumation in the Inyo Mountains. In the absence of further data, one cannot discern with certainty if either of these scenarios is incorrect. Based on the complexity of the geology of Owens Valley and its along-strike variability in the modern period, I suggest that the most likely scenario is a combination of the two hypotheses with along-strike variation and some segments of Owens Valley exhibiting more half-graben versus full-graben character.
These scenarios require major structural activity at Owens Valley circa 55 to 50 Ma. The magnitude of this event presents strong evidence that the Late Cretaceous to Paleogene high-standing continental plateau, which is referred to as the Nevadaplano, could not have maintained substantive continuity with the southern Sierra Nevada past circa 50 Ma. Late Cenozoic activity on the SNFF and the consequent growth of the modern Owens Valley represents an expansion of Owens Valley westward into the southern SNB that generated the eastern Sierra escarpment, but did not generate Owens Valley relief de novo.
5.4. Regional Eocene Extension
AHe and apatite 4He/3He thermochronometry have been used to identify Eocene extension-related exhumation and west-down normal faulting within the southern Sierra Nevada and in the Great Valley subsurface [30,31,48,51,52]. These studies infer the timing of the extension to be circa 45 Ma at one location along Kings River. It is posited by [31] that a series of roughly range parallel normal fault scarps identified through detailed field work during the early 20th century by [53] were active in Eocene time, and further identified a number of time-equivalent features indicating east–west extension in the Great Valley subsurface. In conjunction with the Eocene extension identified in this paper at the eastern edge of the southern SNB, this suggests a regional tectonic regime that persisted for much of Eocene time and was characterized by a westward migrating locus of extension.
6. Conclusions
Time-temperature modeling of published (U-Th)/He data across Owens Valley, California results in a new understanding of early Cenozoic exhumation and requires an Eocene origin for Owens Valley, California. This includes Eocene structural activity on one or both of the Owens Valley Fault and Inyo-White Mountains Fault as outlined by two possible structural scenarios. This represents a significant change in the initial conditions for models of the Cenozoic geologic evolution of eastern California. One can no longer assume that the high-elevation plateau that continued eastward from the southern Sierra Nevada persisted into late Cenozoic time. This study highlights the importance of accurately constraining initial and boundary conditions when building models of geologic systems.
Supplementary Materials
The following are available online at https://0-www-mdpi-com.brum.beds.ac.uk/2076-3263/9/5/194/s1, Table S1: Single-grain apatite and zircon data for Inyo Mountains transect. Figure S1: Summary model predictions of expected model results for Inyo Mountains transect. Figure S2: Raw QTQt expected model output for Inyo Mountains transect. Figure S3: Summary model predictions of expected model results for Mount Whitney transect. Figure S4: Raw QTQt expected model output for Mount Whitney transect. Tables S2–S7: QTQt input data file text for six samples of the Mount Whitney transect. Tables S8–S14: QTQt input data file text for seven samples of the Inyo Mountains transect. Table S15: maximally muted elevations used for model inputs expressed in Figures S5–S7. Figure S5: QTQt expected model output for maximally muted elevations, clipped to same extent as the main paper in Figure 4. Figure S6: Summary model predictions of expected model results for Inyo Mountains transect using maximally muted elevations. Figure S7: Raw QTQt expected model output for Inyo Mountains transect using maximally muted elevations.
Funding
This research received no external funding.
Acknowledgments
I gratefully acknowledge the scientists that have endeavored to understand the history of Owens Valley on whose shoulders this work stands. Special thanks to Lindsey Hedges for a lifetime of excellence in the laboratory and to Kerry Gallagher for continued work improving QTQt. I am grateful to Gilby Jepson and an anonymous reviewer who provided helpful comments that greatly improved this manuscript, as well as Nathan Niemi and Peter Reiners, who provided feedback on an earlier version.
Conflicts of Interest
The author declares no conflict of interest.
References
- Ahnert, F. Equilibrium, scale and inheritance in geomorphology. Geomorphology 1994, 11, 125–140. [Google Scholar] [CrossRef]
- Sibson, R.H. A note on fault reactivation. J. Struct. Geol. 1985, 7, 751–754. [Google Scholar] [CrossRef]
- Mahéo, G.; Saleeby, Z.; Saleeby, J.; Farley, K.A. Tectonic control on southern Sierra Nevada topography, California. Tectonics 2009, 28, 28. [Google Scholar] [CrossRef]
- Chapman, A.D.; Saleeby, J.; Wood, D.J.; Piasecki, A.; Kidder, S.; Ducea, M.N.; Farley, K.A. Late Cretaceous gravitational collapse of the southern Sierra Nevada batholith, California. Geosphere 2012, 8, 314–341. [Google Scholar] [CrossRef]
- DeCelles, P.G. Late Jurrasic to Eocene evolution of the Cordilleran thrust belt and foreland basin system, western U.S.A. Am. J. Sci. 2004, 304, 105–168. [Google Scholar] [CrossRef]
- Jayko, A.S. Deformation of the late Miocene to Pliocene Inyo Surface, eastern Sierra region, California. In Late Cenozoic Structure and Evolution of the Great Basin-Sierra Nevada Transition; Geological Society of America: Boulder, CO, USA, 2009. [Google Scholar]
- Phillips, F.M. Geological and hydrological history of the paleo–Owens River drainage since the late Miocene. In Late Cenozoic Drainage History of the Southwestern Great Basin and Lower Colorado River Region: Geologic and Biotic Perspectives; Geological Society of America: Boulder, CO, USA, 2008. [Google Scholar]
- Phillips, F.M.; Majkowski, L. The role of low-angle normal faulting in active tectonics of the northern Owens Valley, California. Lithosphere 2011, 3, 22–36. [Google Scholar] [CrossRef]
- House, M.A.; Wernicke, B.P.; Farley, K.A.; Dumitru, T.A. Cenozoic thermal evolution of the central Sierra Nevada, California, from (UTh)/He thermochronometry. Earth Planet. Sci. Lett. 1997, 151, 167–179. [Google Scholar] [CrossRef]
- Ali, G.A.H.; Reiners, P.W.; Ducea, M.N. Unroofing history of Alabama and Poverty Hills basement blocks, Owens Valley, California, from apatite (U-Th)/He thermochronology. Int. Geol. 2009, 51, 1034–1050. [Google Scholar] [CrossRef]
- Lee, J.; Stockli, D.F.; Owen, L.A.; Finkel, R.C.; Kislitsyn, R. Exhumation of the Inyo Mountains, California: Implications for the timing of extension along the western boundary of the Basin and Range Province and distribution of dextral fault slip rates across the eastern California shear zone. Tectonics 2009, 28, 20. [Google Scholar] [CrossRef]
- Stone, P.; Dunne, G.C.; Moore, J.G.; Smith, G.I. Geologic Map of the Lone Pine 15’Quadrangle, Inyo County, California; US Geological Survey: Reston, VA, USA, 2000.
- Haddon, E.K.; Amos, C.B.; Zielke, O.; Jayko, A.S.; Burgmann, R. Surface slip during large Owens Valley earthquakes. Geochem. Geophys. Geosystems 2016, 17, 2239–2269. [Google Scholar] [CrossRef] [Green Version]
- Pakiser, L.C.; Kane, M.F.; Jackson, W.H. Structural Geology and Volcanism of Owens Valley Region, California—A Geophysical Study. Available online: https://pubs.usgs.gov/pp/0438/report.pdf (accessed on 22 March 2019).
- Maheo, G.; Farley, K.; Clark, M. Cooling and Exhumation of the Sierra Nevada Batholith in the Mount Whitney Area (California) Based on (U-Th)/He Thermochronometry. Available online: http://adsabs.harvard.edu/abs/2004AGUFM.T41D1252M (accessed on 22 March 2019).
- Rood, D.H.; Burbank, D.W.; Finkel, R.C. Spatiotemporal patterns of fault slip rates across the Central Sierra Nevada frontal fault zone. Earth Planet. Sci. Lett. 2011, 301, 457–468. [Google Scholar] [CrossRef]
- Beanland, S.; Clark, M.M. The Owens Valley Fault Zone, Eastern California, and Surface Faulting Associated with the 1872 Earthquake. Available online: https://pubs.usgs.gov/bul/1982/report.pdf (accessed on 22 March 2019).
- Bachman, S.B. Pliocene-Pleistocene break-up of the Sierra Nevada–White-Inyo Mountains block and formation of Owens Valley. Geology 1978, 6, 461–463. [Google Scholar] [CrossRef]
- Stockli, D.F.; Dumitru, T.A.; McWilliams, M.O.; Farley, K.A. Cenozoic tectonic evolution of the White Mountains, California and Nevada. GSA Bull. 2003, 115, 788–816. [Google Scholar] [CrossRef]
- Phillips, F.M.; McIntosh, W.C.; Dunbar, N.W. Chronology of late Cenozoic volcanic eruptions onto relict surfaces in the south-central Sierra Nevada, California. GSA Bull. 2011, 123, 890–910. [Google Scholar] [CrossRef]
- Kylander-Clark, A.R.C.; Coleman, D.S.; Glazner, A.F.; Bartley, J.M. Evidence for 65 km of dextral slip across Owens Valley, California, since 83 Ma. GSA Bull. 2005, 117, 962–968. [Google Scholar] [CrossRef]
- Lechler, A.R.; Niemi, N.A. Sedimentologic and isotopic constraints on the Paleogene paleogeography and paleotopography of the southern Sierra Nevada, California. Geology 2011, 39, 379–382. [Google Scholar] [CrossRef]
- Henry, C.D.; Hinz, N.H.; Faulds, J.E.; Colgan, J.P.; John, D.A.; Brooks, E.R.; Cassel, E.J.; Garside, L.J.; Davis, D.A.; Castor, S.B. Eocene-Early Miocene paleotopography of the Sierra Nevada-Great Basin-Nevadaplano based on widespread ash-flow tuffs and paleovalleys. Geosphere 2012, 8, 1–27. [Google Scholar] [CrossRef]
- Wakabayashi, J. Paleochannels, stream incision, erosion, topographic evolution, and alternative explanations of paleoaltimetry, Sierra Nevada, California. Geosphere 2013, 9, 191–215. [Google Scholar] [CrossRef]
- Chen, J.H.; Moore, J.G. Uranium-Lead Isotopic Ages from the Sierra-Nevada Batholith, California. J Geophys. Res. 1982, 87, 4761–4784. [Google Scholar] [CrossRef]
- Evernden, J.F.; Kistler, R.W. Chronology of Emplacement of Mesozoic Batholithic Complexes in California and Western Nevada. Available online: https://pubs.usgs.gov/pp/0623/report.pdf (accessed on 22 March 2019).
- Clark, M.K.; Maheo, G.; Saleby, J.; Farley, K.A. The non-equilibrium landscape of the southern Sierra Nevada, California. GSA Today 2005, 15, 4–10. [Google Scholar] [CrossRef]
- House, M.A.; Wernicke, B.P.; Farley, K.A. Paleo-geomorphology of the Sierra Nevada, California, from (U-Th)/He ages in apatite. Am. J. Sci. 2001, 301, 77–102. [Google Scholar] [CrossRef]
- House, M.A.; Wernicke, B.P.; Farley, K.A. Dating topography of the Sierra Nevada, California, using apatite (U-Th)/He ages. Nature 1998, 396, 66–69. [Google Scholar] [CrossRef]
- Sousa, F.J.; Saleeby, J.; Farley, K.A.; Unruh, J.R.; Lloyd, M.K. The southern Sierra Nevada pediment, central California. Geosphere 2017, 13, 82–101. [Google Scholar] [CrossRef]
- Sousa, F.J.; Farley, K.A.; Saleeby, J.; Clark, M. Eocene activity on the Western Sierra Fault System and its role incising Kings Canyon, California. Earth Planet. Sci. Lett. 2016, 439, 29–38. [Google Scholar] [CrossRef] [Green Version]
- Dunne, G. Petrology of the Pat Keyes pluton, Inyo Mountains, California, and its relation to the Sierra Nevada batholith. Soc. Am. Abs. Progr. 1971, 3, 113–114. [Google Scholar]
- Dunne, G. Petrology of a portion of the Pat Keyes pluton, Inyo County, California: San Jose, Calif., San Jose State University. Master’s Thesis, San Jose State University, San Jose, CA, USA, 1970. [Google Scholar]
- Gallagher, K. Transdimensional inverse thermal history modeling for quantitative thermochronology. J. Geophys. Res. Solid Earth 2012, 117, B02408. [Google Scholar] [CrossRef]
- Flowers, R.M.; Ketcham, R.A.; Shuster, D.L.; Farley, K.A. Apatite (U–Th)/He thermochronometry using a radiation damage accumulation and annealing model. Geochim. Cosmochim. Acta 2009, 73, 2347–2365. [Google Scholar] [CrossRef]
- Guenthner, W.R.; Reiners, P.W.; Ketcham, R.A.; Nasdala, L.; Giester, G. Helium diffusion in natural zircon: Radiation damage, anisotropy, and the interpretation of zircon (U-Th)/He thermochronology. Am. J. Sci. 2013, 313, 145–198. [Google Scholar] [CrossRef]
- Ketcham, R.A.; Gautheron, C.; Tassan-Got, L. Accounting for long alpha-particle stopping distances in (U–Th–Sm)/He geochronology: Refinement of the baseline case. Geochim. Cosmochim. Acta 2011, 75, 7779–7791. [Google Scholar] [CrossRef]
- Gautheron, C.; Tassan-Got, L.; Ketcham, R.A.; Dobson, K.J. Accounting for long alpha-particle stopping distances in (U–Th–Sm)/He geochronology: 3D modeling of diffusion, zoning, implantation, and abrasion. Geochim. Cosmochim. Acta 2012, 96, 44–56. [Google Scholar] [CrossRef] [Green Version]
- Gavillot, Y.; Meigs, A.J.; Sousa, F.J.; Stockli, D.; Yule, D.; Malik, M. Late Cenozoic Foreland-to-Hinterland Low-Temperature Exhumation History of the Kashmir Himalaya. Tectonics 2018, 37, 3041–3068. [Google Scholar] [CrossRef]
- Vermeesch, P.; Tian, Y. Thermal history modelling: HeFTy vs. QTQt. Earth-Sci. Rev. 2014, 139, 279–290. [Google Scholar] [CrossRef] [Green Version]
- Stockli, D.F.; Farley, K.A.; Dumitru, T.A. Calibration of the apatite (U-Th)/He thermochronometer on an exhumed fault block, White Mountains, California. Geology 2000, 28, 983–986. [Google Scholar] [CrossRef]
- Bartley, J.M.; Glazner, A.F.; Coleman, D.S.; Kylander-Clark, A.; Mapes, R.; Friedrich, A.M. Large Laramide dextral offset across Owens Valley, California, and its possible relation to tectonic unroofing of the southern Sierra Nevada. In Exhumation Associated with Continental Strike-Slip Fault Systems; Roeske, S.M., Till, A.B., Foster, D.A., Sample, J.C., Eds.; Geological Society of America: Boulder, CO, USA, 2007. [Google Scholar]
- Saleeby, J.; Farley, K.A.; Kistler, R.W.; Fleck, R.J. Thermal Evolution and Exhumation of Deep-Level Batholithic Exposures, Southernmost Sierra Nevada, California; Geological Society of America: Boulder, CO, USA, 2007. [Google Scholar]
- Wood, D.J.; Saleeby, J.B. Late Cretaceous-Paleocene Extensional Collapse and Disaggregation of the Southernmost Sierra Nevada Batholith. Int. Geol. Rev. 1997, 39, 973–1009. [Google Scholar] [CrossRef]
- Cox, B. Stratigraphy, depositional environments, and paleotectonics of the Paleocene and Eocene Goler Formation, El Paso Mountains, California: Geologic summary and roadlog. In Basin Analysis and Paleontology of the Paleocene and Eocene Goler Formation, El Paso Mountains, California: Los Angeles, Pacific Section; Society for Sedimentary Geology: Tulsa, OK, USA, 1987. [Google Scholar]
- Cox, B. Stratigraphy, Sedimentology, and Structure of the Goler Formation (Paleocene), El Paso Mountains, California: Implications for Paleogene Tectonism on the Garlock Fault Zone; University of California, Riverside: Riverside, CA, USA, 1982. [Google Scholar]
- Reid, S.A. Late Cretaceous and Paleogene sedimentation along the east side of the San Joaquin Basin. AAPG Bull. 1988, 60, 157–171. [Google Scholar]
- Saleeby, J.; Saleeby, Z.; Le Pourhiet, L. Epeirogenic transients related to mantle lithosphere removal in the southern Sierra Nevada region, California, part II: Implications of rock uplift and basin subsidence relations. Geosphere 2013, 9. [Google Scholar] [CrossRef]
- Saleeby, J.; Saleeby, Z.; Sousa, F. From deep to modern time along the western Sierra Nevada Foothills of California, San Joaquin to Kern River drainages. Geol. Soc. Am. Field Guides 2013, 32, 37–62. [Google Scholar] [CrossRef]
- Saleeby, J.; Le Pourhiet, L.; Saleeby, Z.; Gurnis, M. Epeirogenic transients related to mantle lithosphere removal in the southern Sierra Nevada region, California, part I: Implications of thermomechanical modeling. Geosphere 2012, 8, 1286–1309. [Google Scholar] [CrossRef] [Green Version]
- Sousa, F.; Saleeby, J.; Farley, K.A. Chronology of Tectonic and Landscape Evolution of the southern Sierra Nevada Foothills-eastern San Joaquin Basin Transition, CA. In Proceedings of the Pacific Section AAPG, SPE and SEPM Joint Technical Conference, Bakersfield, CA, USA, 27–30 April 2014. [Google Scholar]
- Sousa, F.; Saleeby, J.; Farley, K.A.; Unruh, J. The Southern Sierra Nevada Foothills Bedrock Pediment. In Proceedings of the GSA Cordilleran Section Meeting, Fresno, CA, USA, 25–28 September 2017. [Google Scholar]
- Hake, B.F. Scarps of the Southwestern Sierra Nevada, California. GSA Bull. 1928, 39, 1017–1030. [Google Scholar] [CrossRef]
Figure 1.
Overview map of Owens Valley, California in the vicinity of the Alabama Hills (AH). Base imagery is 10-m digital elevation model overlain with partially transparent hillshade. Extent and center line of the area used for topographic swath profile A–A’ (Figure 2) are shown in black lines. (U-Th)/He sample sites are symbolized according to data source. Purple solid circles: Mount Whitney data [9]. Purple squares with black dot: Alabama Hills data [10]. Salmon solid triangles: Inyo Mountains data [11]. OVF: Owens Valley Fault [12,13]. SNFF: Sierra Nevada Frontal Fault [11,12]. IWMF: Inyo-White Mountains Fault [12]. GB: Golden Bear Dike. W: Mount Whitney. I: Independence, California. LP: Lone Pine, California. CA: California. NV: Nevada.

Figure 2.
Topographic swath profile across Owens Valley, California. The extent of the swath is shown in Figure 1. Average elevation across the swath is shown as a solid black line. Range from minimum to maximum elevation across each segment of swath are shown as dark purple range. Apatite (U-Th)/He samples are projected onto the center line of the swath profile. Sample average AHe age is plotted on each sample. Geometry and depth of Owens Valley fill (shown in beige) is from [14]. Locations of SNFF: Sierra Nevada Frontal Fault, OVF: Owens Valley Fault, and IWMF: Inyo-White Mountains Fault are from [12]. W: Mount Whitney.

Figure 3.
Apatite (U-Th)/He age versus elevation for the three sample suites of the composite transect across Owens Valley, with two sigma errors plotted. Black solid squares and grey line: [9] data and linear regression. Red diamonds with red line: [11] data with a vertical line plotted at the average age. Blue open squares with blue line: [10] data from the Alabama Hills with slope of the southern Sierra Nevada regional exhumation rate, which is the same as the regressed value shown here as a grey line through black squares.

Figure 4.
QTQt model results for Mount Whitney and Inyo Mountains vertical transects. For each, the darkest color indicates the lowest elevation sample, and the lightest indicates the highest elevation sample, as listed in Table 1. See Table 2 and the Supplementary Materials for details of the model set-up, outputs, and model fits to input data.

Figure 5.
Schematic cartoon depicting the structural evolution of Owens Valley described in hypotheses 1 and 2. A. Before Eocene time, the Nevadaplano is continuous with the proto-southern Sierra Nevada. B. Hypothesis 1 with west-down normal faulting developing along the Eocene Inyo-White Mountains fault. C. Hypothesis 2 with normal fault activity on both the Eocene Owens Valley Fault and Inyo-White Mountains Fault. The beige shaded area is the Eocene Owens Valley basin fill. SNFF: Sierra Nevada Frontal Fault. OVF: Owens Valley Fault. IWMF: Inyo-White Mountains Fault. SNB: Sierra Nevada Batholith.


Table 1.
Apatite (U-Th)/He data.
| Sample Name | Mineral | Average Age ± 1σ (Ma) | Elevation ‡ (m) | U (ppm) | Th (ppm) | Ft | Source * | Pluton Age (Ma) † | Latitude (°N) | Longitude (°W) |
|---|---|---|---|---|---|---|---|---|---|---|
| Mt Whitney Transect ** | ||||||||||
| 109 | Apatite | 74.6 ± 3.4 | 4280 | 10 | 27 | 0.87 | H | 83 | 36.576 | 118.292 |
| 113 | Apatite | 69.3 ± 2.3 | 3900 | 9 | 26 | 0.89 | H | 83 | 36.562 | 118.286 |
| 114 | Apatite | 52.1 ± 1.1 | 3640 | 9 | 30 | 0.86 | H | 83 | 36.563 | 118.276 |
| 118 | Apatite | 38.7 ± 2.5 | 2695 | 10 | 30 | 0.89 | H | 83 | 36.586 | 118.245 |
| 105 | Apatite | 30.2 ± 3.4 | 2315 | 41 | 46 | 0.85 | H | 83 | 36.595 | 118.217 |
| 102 | Apatite | 22.7 ± 1.5 | 1985 | 51 | 45 | 0.82 | H | 83 | 36.595 | 118.206 |
| Alabama Hills Transect *** | ||||||||||
| AH1 | Apatite | 68.5 ± 5.2 | 1730 | 13 | 50 | 0.74 | A | 83 | 36.602 | 118.173 |
| AH2 | Apatite | 60.0 ± 2.6 | 1673 | 13 | 62 | 0.65 | A | 83 | 36.597 | 118.165 |
| AH3 | Apatite | 63.8 ± 4.5 | 1494 | 13 | 62 | 0.71 | A | 83 | 36.596 | 118.135 |
| AH4 | Apatite | 79.4 ± 4.8 | 1417 | 14 | 75 | 0.62 | A | 83 | 36.586 | 118.116 |
| AH5 | Apatite | 64.7 ± 8.0 | 1316 | 13 | 65 | 0.67 | A | 83 | 36.587 | 118.101 |
| AH6 | Apatite | 52.6 ± 1.8 | 1197 | 11 | 52 | 0.61 | A | 83 | 36.590 | 118.082 |
| Inyo Mountains Transect∞ | ||||||||||
| IM950 | Apatite | 51.4 ± 2.5 | 3015 (3015) | 20 | 69 | 0.64 | L | 183 | 36.757 | 118.001 |
| IM900W | Apatite | 49.1 ± 8.2 | 2751 (2792) | 18 | 69 | 0.63 | L | 183 | 36.762 | 118.007 |
| IM800W | Apatite | 54.1 ± 4.9 | 2457 (2612) | 32 | 81 | 0.67 | L | 183 | 36.761 | 118.017 |
| IM700W | Apatite | 54.2 ± 2.1 | 2157 (2328) | 72 | 61 | 0.70 | L | 183 | 36.762 | 118.028 |
| IM600W | Apatite | 59.4 ± 8.5 | 1813 (2092) | 52 | 57 | 0.61 | L | 183 | 36.760 | 118.038 |
| IM500W | Apatite | 50.9 ± 4.4 | 1542 (1860) | 35 | 33 | 0.59 | L | 183 | 36.761 | 118.052 |
| IM430W | Apatite | 52.9 ± 3.5 | 1317 (1646) | 23 | 29 | 0.65 | L | 183 | 36.753 | 118.054 |
| IM950 | Zircon | 64.8 ± 2.4 | 3015 (3015) | 211 | 115 | 0.78 | L | 183 | 36.757 | 118.001 |
| IM900W | Zircon | 65.5 ± 4.4 | 2751 (2792) | 324 | 187 | 0.76 | L | 183 | 36.762 | 118.007 |
| IM800W | Zircon | 64.1 ± 6.4 | 2457 (2612) | 301 | 123 | 0.72 | L | 183 | 36.761 | 118.017 |
| IM700W | Zircon | 70.1 ± 7.5 | 2157 (2328) | 307 | 193 | 0.75 | L | 183 | 36.762 | 118.028 |
| IM600W | Zircon | 71.8 ± 4.7 | 1813 (2092) | 174 | 145 | 0.84 | L | 183 | 36.760 | 118.038 |
| IM500W | Zircon | 76.5 ± 2.0 | 1542 (1860) | 200 | 156 | 0.77 | L | 183 | 36.761 | 118.052 |
| IM430W | Zircon | 68.2 ± 4.2 | 1317 (1646) | 453 | 463 | 0.72 | L | 183 | 36.753 | 118.054 |
* Data source: H = [9], A = [10], L = [11]. ** Mt Whitney data reflect the fact that analytical methods used multi grain aliquots, not averages of single grains data. *** Alabama Hills average ages are calculated as arithmetic mean of single grain replicates ± 1 s.d., which differ slightly from the reported weighted mean values in [10]. † Plutons sampled: MWIS = 83 Ma Mount Whitney Intrusive Suite [25,26]. PKP = 183 Ma Pat Keyes Pluton [32,33]. ‡ Modern sample elevations and (pre-Eocene elevations) used for model inputs from [11] for Inyo data. ∞ Single grain data used for modeling of Inyo Mountains transect are detailed in the Supplementary Materials.
Table 2.
Data interpretation and reporting summary.
| Mt Whitney | Inyo | |
|---|---|---|
| number of samples | 6 AHe * | 7 AHe *, 7 ZHe * |
| elevation range | 1985–4280 | 1646–3015 |
| time-temperature bounding box | 100–0 Ma 85 °C +/− 70 °C | 200–0 Ma 150 °C +/− 135 °C |
| High-temperature constraints | 85 +/− 2 Ma 650 °C +/− 100 °C | 185 +/− 10 Ma 650 °C +/− 100 °C |
| modern temperature constraints | 20 °C +/− 5 °C | 20 °C +/− 5 °C |
| geothermal gradient | 30 °C/km +/− 20 °C/km | 30 °C/km +/− 20 °C/km |
| data source | [9] | [11] |
| pre-“burn in” iterations | ≥500,000 | ≥500,000 |
| post-“burn in” iterations | 500,000 | 500,000 |
| birthing parameter | uniform | uniform |
* AHe: apatite (U-Th)/He. ZHe: zircon (U-Th)/He.
© 2019 by the author. Licensee MDPI, Basel, Switzerland. This article is an open access article distributed under the terms and conditions of the Creative Commons Attribution (CC BY) license (http://creativecommons.org/licenses/by/4.0/).
Share and Cite
MDPI and ACS Style
Sousa, F.J. Eocene Origin of Owens Valley, California. Geosciences 2019, 9, 194. https://0-doi-org.brum.beds.ac.uk/10.3390/geosciences9050194
AMA Style
Sousa FJ. Eocene Origin of Owens Valley, California. Geosciences. 2019; 9(5):194. https://0-doi-org.brum.beds.ac.uk/10.3390/geosciences9050194
Chicago/Turabian StyleSousa, Francis J. 2019. "Eocene Origin of Owens Valley, California" Geosciences 9, no. 5: 194. https://0-doi-org.brum.beds.ac.uk/10.3390/geosciences9050194
Note that from the first issue of 2016, this journal uses article numbers instead of page numbers. See further details here.