Article

Chemical and Microbial Quality of Groundwater in Siloam Village, Implications to Human Health and Sources of Contamination

Department of Hydrology and Water Resources, University of Venda, Thohoyandou 0950, South Africa
*
Author to whom correspondence should be addressed.
Int. J. Environ. Res. Public Health 2018, 15(2), 317; https://0-doi-org.brum.beds.ac.uk/10.3390/ijerph15020317
Submission received: 13 December 2017 / Revised: 24 January 2018 / Accepted: 8 February 2018 / Published: 12 February 2018

Abstract

:
Due to inaccessibility of potable water, rural communities drill boreholes within their homesteads despite vulnerability to groundwater contamination and associated health risks. This study assessed the quality of groundwater, identified potential sources of contamination and potential human health risks in Siloam Village, South Africa. Statistical difference between similar water quality parameters at different sites was determined at a significance level (α) of 0.05. Water quality parameters with serious potential health effects on human beings were correlated with selected water quality parameters to understand the nature of correlation and possible sources of contamination. Fluorides and nitrates had excessively high concentrations associated with tooth damage and pronounced skeletal fluorosis, and methaemoglobinaemia in infants and mucous membrane irritation in adults, respectively. There were statistically significant differences between means of most water quality parameters. Contrasting correlation of fluoride with calcium and pH indicated the need to further identify local sources and fluoride control mechanisms. Correlation of nitrate with chloride mostly indicated that faecal contamination is the potential source of high nitrates in groundwater. This requires further verification. Presence of total coliforms and E. coli in most boreholes indicated potential presence of faecal contamination. The need to educate borehole owners’ on possible strategies to minimise groundwater pollution was identified.

1. Introduction

Composition of precipitation, anthropogenic activities, geological structure and processes within an aquifer determine the quality of groundwater [1]. Dissolution of minerals within the soil, sediment, and bedrock contribute to different cations and anions in groundwater depending on the geology of an area. For example, natural geology has been found to contribute to high fluoride, calcium, and trace metal concentrations in Kwazulu Natal [2], water hardness in the Central Free State [3], fluoride concentrations in Limpopo, Northern Cape, North-West and KwaZulu-Natal Provinces [4], in South Africa. Dedzo et al. [5] and Basavarajappa et al. [6] associated weathering of rock minerals with groundwater chemistry in Central-East Cameroon and Kanata, India, respectively.
Poor and deteriorating groundwater quality associated with diverse anthropogenic sources is widespread in South Africa [7]. Faecal matter from pit latrines also has potential to contaminate groundwater, thereby threatening human health [8]. Despite the water quality problems associated with groundwater, most rural areas of South Africa located in semi-arid remote areas characterized by inadequate potable water supply are use groundwater for domestic purposes. Due to lack of access to potable water, residents in rural areas drill their own private boreholes without considering the potential sources of groundwater contamination. In these areas, boreholes are drilled within the vicinity of pit latrines and subsistence farms within the owners’ homesteads.
Holland [9] confirmed microbial contamination of numerous village water supply boreholes that are sited close to pit latrines in basement areas of Limpopo Province. In the Tshitale-Hlanganani region of Limpopo Province boreholes drilled close to sanitary facilities (pit latrine and septic tanks) had high microbial contamination [10]. Similar cases have been noted in rural areas of Zimbabwe [11], South West Nigeria [12], Bihar State in India [13], amongst others. Dissolution of rocks and infiltration from pit-latrines were identified as sources of groundwater pollution in Kwale District, Kenya [14]. In Siloam Village, agricultural practices and washing of clothes within the vicinity of boreholes were associated with high concentrations of calcium, magnesium and nitrate in groundwater [15]. The current study is focused on determining the quality status of groundwater from private boreholes and implications for domestic use, as well as inferring possible sources of contamination. This will be used to inform private borehole owners of the quality status of their borehole water and suggest ways of minimising groundwater contamination. The study also builds up on previous studies and provide additional information on water quality status of Siloam Village which will aid in generating solutions and decision making. Odiyo and Makungo [16] determined that calcium and pH influence fluoride concentrations in groundwater in Siloam Village but did not determine the relationship between these parameters. The latter study associated low calcium concentration to the high concentration of fluoride, while increased fluoride concentrations were attributed to alkaline pH in some of the boreholes in Siloam Village. Correlation can assist in identifying the sources of pollution and the significance of the water quality parameters. This is crucial when developing strategies to minimise pollution. Correlation studies also aid in choosing parsimonious parameters for frequent determination of water quality status [17], since it is cumbersome and costly to regularly monitor all water quality parameters. Thus, this will aid in ensuring continuous monitoring of the quality of groundwater.

2. Materials and Methods

2.1. Study Area

Siloam Village (Figure 1) falls within the semi-arid Nzhelele area in Limpopo Province, South Africa. Nzhelele River is the main river with low and variable flow pattern due to low and unpredictable rainfall (average 350 to 400 mm) within its catchment [18]. The area is characterized by basic extrusive basalt rocks of the Sibasa formation, Soutpansberg Group. Groundwater occurs in intergranular and fractured rocks with borehole yields ranging from 0.5 to 2 L/s [19]. Within Nzhelele area, boreholes depths varies from 65 to 85 m while average depth to groundwater is 15–25 m [20]. The use of groundwater to supplement surface water and harvested rainwater supply is common in Siloam Village. In addition to one public borehole that exists in Siloam Village, most residents have drilled boreholes within their homesteads to supplement their water needs.

2.2. Methods

Groundwater samples from 11 boreholes in Siloam Village (BH1 to BH11 in Figure 1) were collected in sterile 1 L plastic containers and transported to the University of Venda research laboratory for physico-chemical analysis. The samples were collected once a month from August 2013 to January 2014. August and September 2013 fall in the dry season, while October to December 2013 and January 2014 are in the wet (rainfall) season. EC and pH were measured using Cyberscan PC510 benchtop meter while turbidity was measured using Eutech TN 100 turbidity meter. Samples were kept at 4–10 °C during transport to the laboratory. Non-metals (nitrates, fluoride, chloride, phosphate, sulphate) and metals (copper, manganese, zinc, calcium, potassium, magnesium, and iron) were analysed using 850 Professional Ion Chromatography (Anions Cation Metrohm Carbon dioxide Suppression (AnCat MCS) model, Metrohm (pty) Ltd., Pretoria, South Africa) and atomic absorption spectroscopy, respectively. These non-metallic and metallic parameters were selected because they are general indicators of water quality, which may lead to health problems [21], if they are in excessive concentrations. All equipment were calibrated following manufacturers’ instructions and the samples were analysed in triplicate for quality assurance purposes. Samples were analysed within 24 h of collection. This is below the seven day period reported by the Department of Water Affairs and Forestry (DWAF) [22] for samples collected for chemical analysis, provided that they are kept in a cool environment.
Descriptive statistics (minimum, mean, maximum) were calculated to summarise the results of physico-chemical parameters and to assess the overall quality status of groundwater in the study area. The results were also compared with DWAF [23] target water quality ranges (TWQRs) for domestic use to infer the potential health risks. TWQR gives concentration range that have no effects on human health for a given water quality parameter. Water quality parameters with serious potential health effects on human beings were correlated with selected water quality parameters to understand the nature of correlation and possible sources of contamination. Relationships between fluoride with calcium and pH were determined from correlation coefficient at significance level (α) of 0.05. This was aimed at establishing the control mechanism of fluoride in groundwater, and nature of correlation and significance of quality parameters on fluoride as suggested by [24,25]. Nitrates were also correlated with chloride and potassium to identify and determine potential sources of nitrate contamination. Statistical differences between similar water quality parameters at different sites was determined using single factor analysis of variance (ANOVA) within Microsoft Excel (2013, Microsoft, Johannesburg, South Africa). The tests were run at a significance level (α) of 0.05.
Microbial quality indicators (total coliform, heterotrophic bacteria, Escherichia coli (E. coli) and faecal coliform were assessed in a previous study conducted by Mudau [26]. These were used to assess microbial status of groundwater and verify potential presence of faecal contamination of groundwater as indicated by the correlation between nitrates and chlorides. Total coliform and heterotrophic bacteria informed hygienic quality and general microbial quality of water while E. coli and faecal coliform indicated potential faecal contamination of groundwater.

3. Results

3.1. Groundwater Quality and Implications to Human Health

Descriptive statistics for water quality parameters for a six month period are in Table 1 and Table 2. pH was mostly within TWQR of 6–9 except for maximum values for August, November, and December 2013, and January 2014, which were slightly above 9. Maximum and mean turbidity values for August 2013 and January 2014 exceeded TWQR of 0–1 NTU indicating chances of transmission of diseases by micro-organisms associated with particulate matter. Maximum and mean EC values were above TWQR of 070 mS/m for the entire period. Water is noticeably salty but is well tolerated and no health effects are likely to occur at EC values from 70 to 150 mS/m [23]. Water with EC values from 150 to 300 mS/m is associated with marked, salty taste, though it has no adverse health effects in the short term [23]. Maximum EC values for September, October, and December 2013 were only slightly above 150 mS/m and, therefore, may not pose serious aesthetic and health risks.
Minimum, mean, and maximum fluoride concentrations were above TWQR of 0–1 mg/L except for minimum concentration for August 2013 (Table 1). Minimum and mean fluoride concentrations mostly ranged from 1 to 5 mg/L which is associated with slight mottling of dental enamel in sensitive individuals [23]. Maximum fluoride concentrations for September to November 2013, and January 2014, and mean concentrations for October to November 2013 and January 2014 were within the range of 4 to 6 mg/L which can severely damage the teeth particularly those of infants and soften the enamel and dentine if water is used continuously [23]. Maximum fluoride concentrations for August and December 2013 were within the range of 6 to 8 mg/L, which can severely damage teeth and cause pronounced skeletal fluorosis on long-term exposure [23].
Mean chloride concentrations for August and December 2013, and January 2014, and maximum for November 2013 exceeded DWAF [23] TWQR of 0 to 100 mg/L (Table 1), though they had no aesthetic or health effects. Maximum chloride concentrations for August to October 2013, December 2013 and January 2014 exceeded 200 mg/L. Water with chloride concentrations exceeding 200 mg/L has a distinctly salty taste, but no health effects [23]. Mean and maximum nitrates were >20 mg/L and, hence, exceeded TWQR of 0 to 6 mg/L. Nitrate concentrations >20 mg/L are associated with methaemoglobinaemia in infants and occurrence of mucous membrane irritation in adults [23]. Maximum sulphates for October and November 2013, and January 2014 exceeded a TWQR of 200 mg/L. DWAF [23] indicated that water with sulphates exceeding 200 mg/L can cause diarrhoea and it is salty and bitter. Most metals were within their specific TWQR (Table 2), except for maximum and mean manganese concentrations for September 2013 to January 2014, and September and December 2013, respectively, which exceeded the TWQR of 0 to 0.05 mg/L. Water with manganese concentrations from 0.05 to 0.1 mg/L is within tolerable range associated with no health effects [23]. Concentrations of Mn between 0.15 to 1.0 and 1.0 to 2.0 mg/L indicate thresholds for significant staining and very severe staining, respectively, though the water has no health effects [23]. Thus, maximum manganese concentrations in September and December 2013, and January 2014, which were >0.15, but <1 mg/L could cause significant staining, but no health effects. Maximum iron concentrations in December 2013 and January 2014 ranged from of 0.1 to 0.3 mg/L which, has very slight effects on taste, but no health effects [23].

3.2. ANOVA and Correlations

Results of ANOVA test (Table 3) showed statistically significant difference between means of most of the water quality parameters since p-values were less than 0.05, except for chloride, copper and zinc. Misi [27] reported no significant differences (p > 0.05) between mean values of pH, turbidity, EC, chloride, fluoride, iron, zinc, and copper across sampling sites located in basement aquifer of Upper Manyame Sub-catchment in Zimbabwe. This was explained to be due to the fact that sampling was conducted in the rainy season, hence, less variation could be expected due to the dilution effect from the rain. Sampling period in the current study partially covered both dry and rainy seasons showing that variations in rainfall possibly resulted in significant differences between means of most of the water quality parameters. Mean values for chloride, copper and zinc were, however, not affected by seasonal variations in rainfall since their p-values were higher than 0.05.
Nitrates and fluorides were the only parameters with excessively high concentrations in groundwater which are associated with health effects on human beings, and their correlation with related parameters was determined. Negative correlation between calcium and fluoride was found in seven of the boreholes while four had positive correlation (
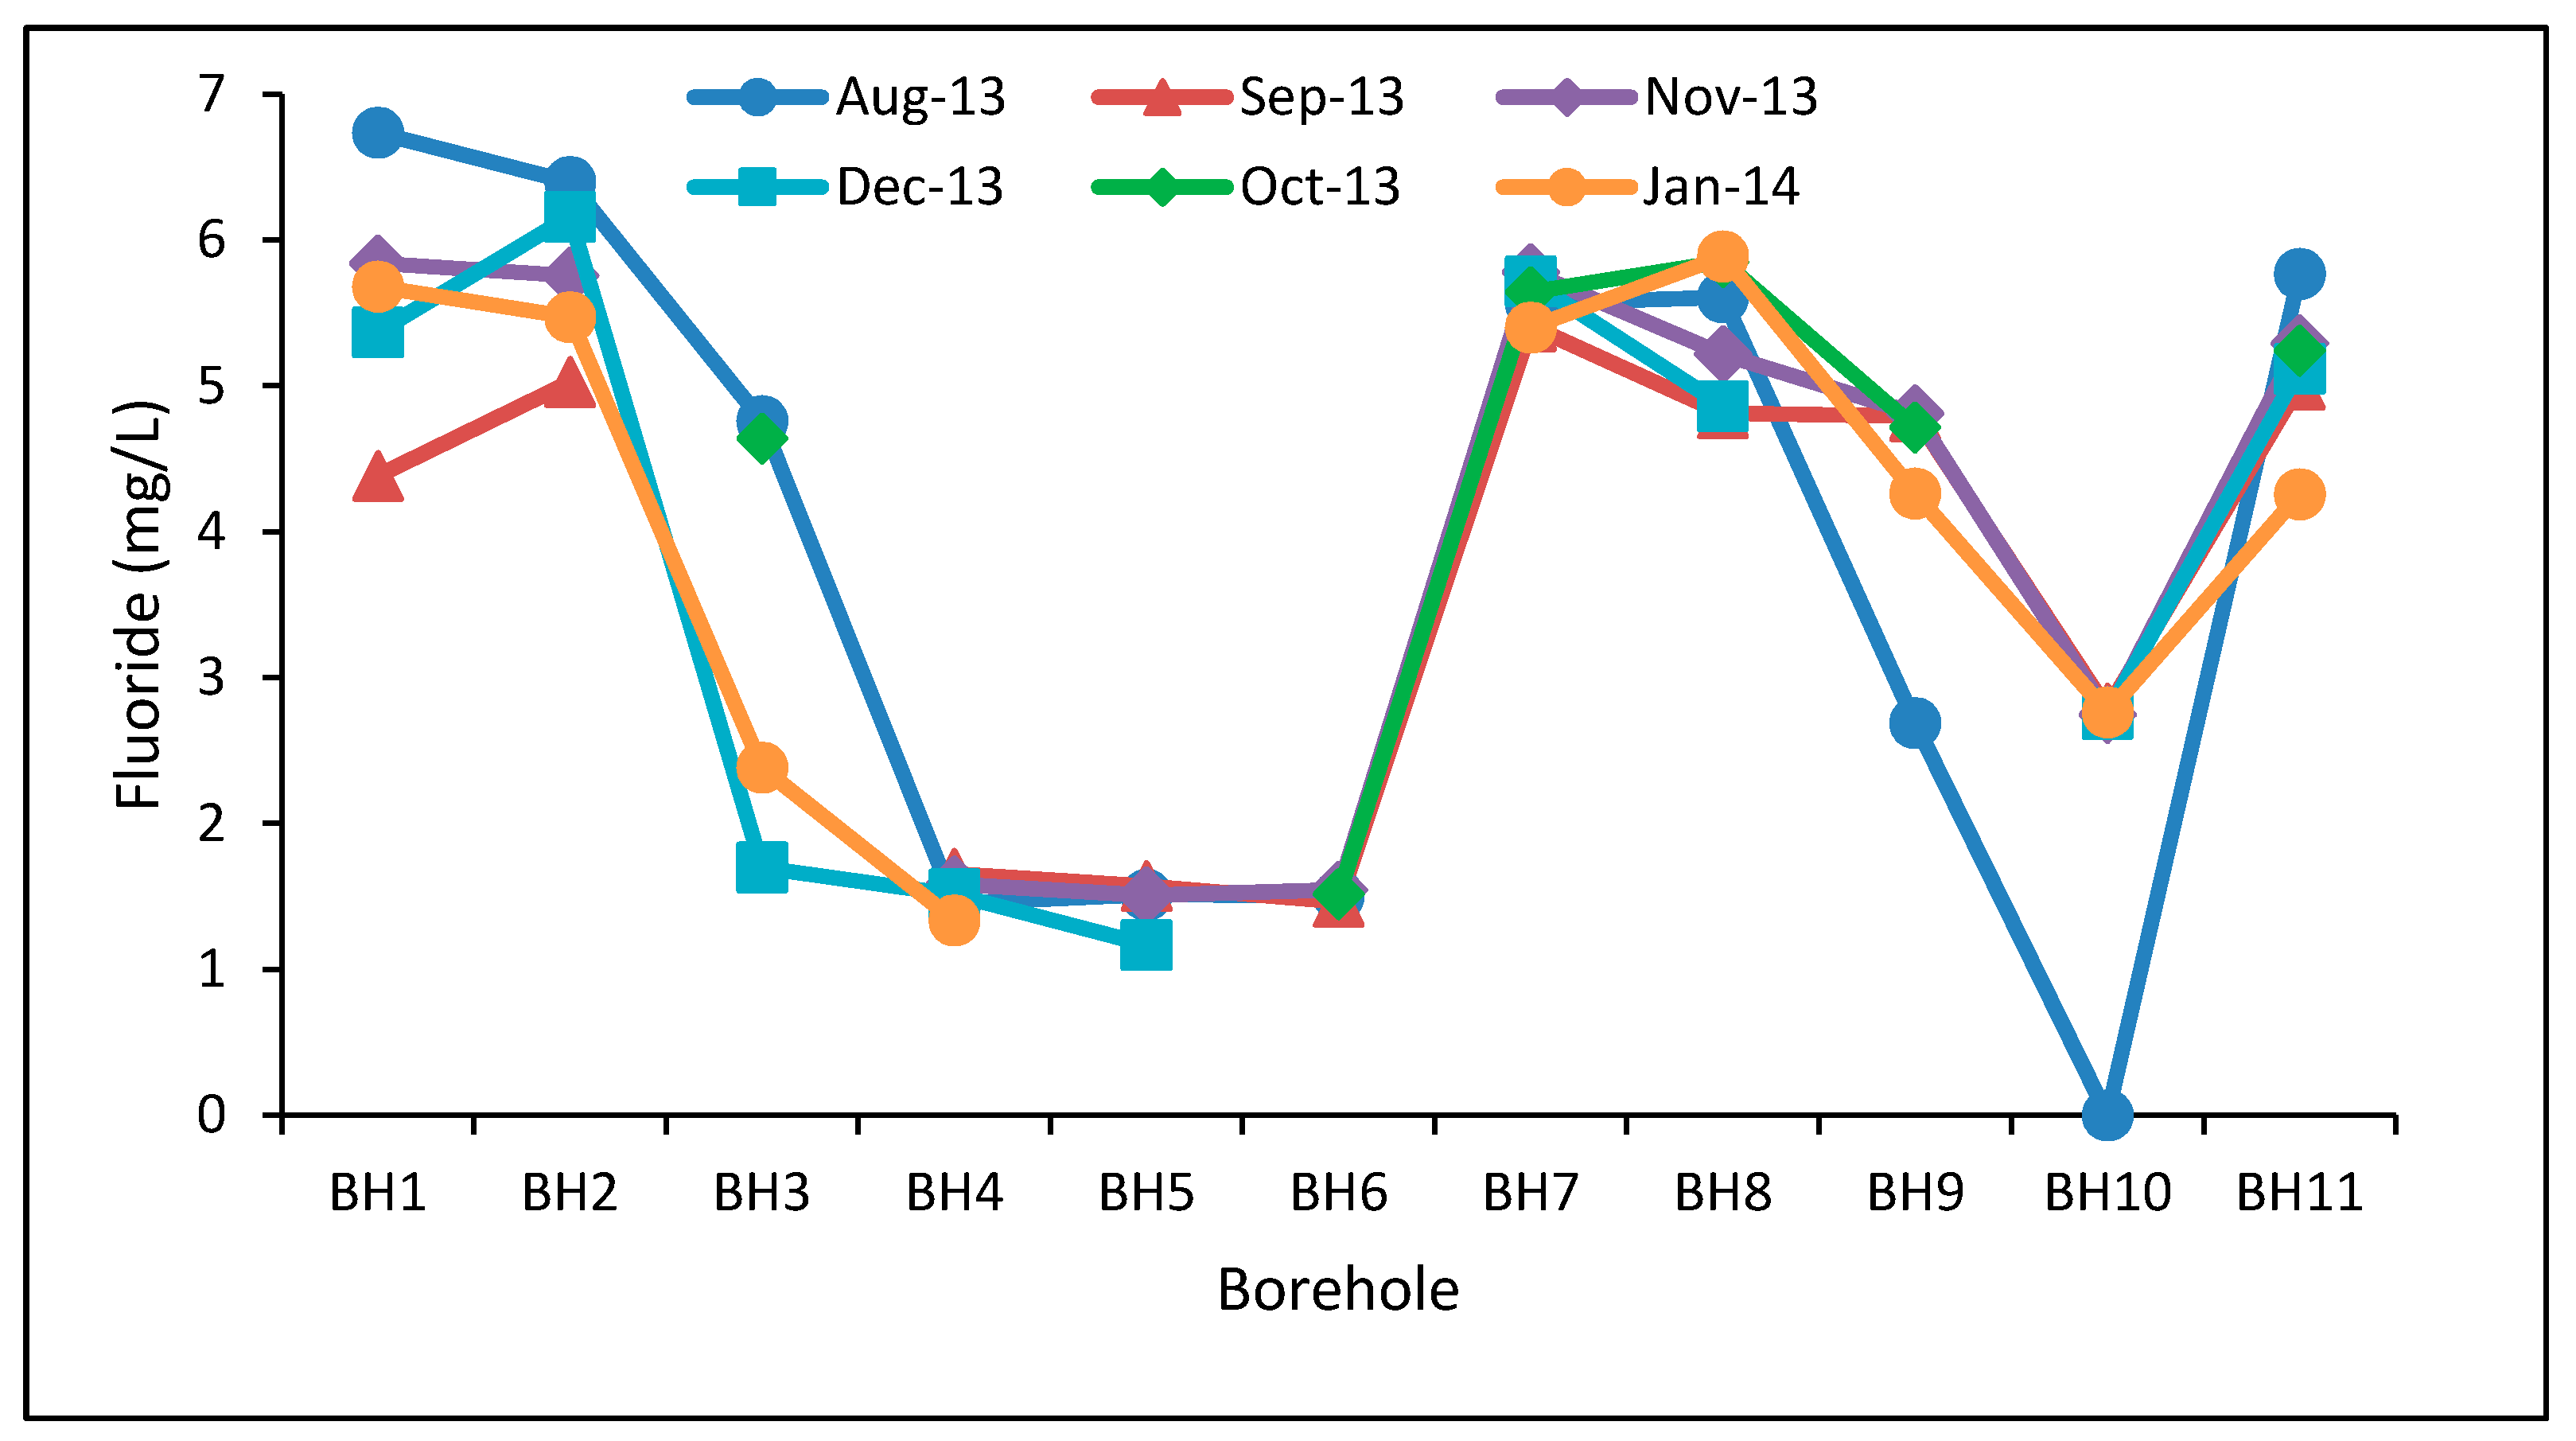
Table 4). The contrasting correlations is an indication of the local variations of geological formations that are in contact with groundwater within the aquifer. This has resulted to the spatial variations in fluoride concentrations in the study area (Figure 2). Though surface geology around all boreholes in the area is similar, it is possible that there are variations in geology in the deep formations where groundwater is found. Odiyo and Makungo [16] associated increase in calcium with decrease in fluoride in Siloam Village, thereby, suggesting negative correlation of the two variables. The results of the latter study were, however, limited to three sites (two boreholes and one hotspring) which are excluded in the current study. Negative correlation between fluoride and calcium is attributed to low solubility of fluoride from fluoride bearing rocks [28], suggesting the possibility of ion-exchange process [29].
Ncube [4] reported negative correlation of calcium and fluoride for a borehole in Stelnberg and positive correlation for boreholes in Tugela and Zalexbayi in South Africa. Negative correlations were associated with moderate fluoride concentrations (0.3–1.0 mg/L) while positive correlations were associated with low and high fluoride concentrations. The results of this study did not follow this trend. For example, BH2 with high fluoride concentrations (5.03–6.40 mg/L) and BH5 with low concentrations (1.17–1.57 mg/L) had negative correlation while BH4 with low fluoride concentrations (1.34–166 mg/L) and BH1 with high concentrations (4.38–6.74 mg/L) had a positive correlation (Table 4). Odiyo and Makungo [16] reported increased fluoride concentrations resulted from reduced dilution effect on groundwater chemical composition due to arid/dry conditions in Siloam Village. In addition, the fluorite, which is a fluoride bearing rock, was identified as the likely source of fluoride in Siloam Village in the latter study. This indicates that further investigations are required to identify the local sources and fluoride control mechanisms in the study area. Chakraborti [30] reported positive correlation of fluoride with calcium in groundwater in Assam, India, which [31] attributed to the presence of limestone in that area. Avtar et al. [32] indicated positive correlation between pH and calcium with groundwater in Chhatarpur area, Madhya Pradesh, India. The correlation between calcium and fluoride was linked to minerals like fluorspar, apatite, and fluorapatite. Liu et al. [33] noted that positive correlation between Ca and F indicated that they have the same origin.
Correlation between pH and F in five of the boreholes was positive, while the rest had negative correlation. A positive relationship with pH indicates towards a possible leaching of fluoride under high alkaline conditions of water [29]. Negative correlation between pH and F and positive correlation between Ca and F was reported in Iran [34]. Umarani and Ramu [35] reported that negative correlation of pH and F in groundwater from Tamilnadu, India, indicated though fluoride concentrations were low (0.02 to 1.54 mg/L), they could still dissolve in groundwater. Fluoride concentrations in the latter study were within. Nephalama and Muzerengi [36] also attributed negative correlation of pH and F to low levels of fluoride in the rock in Masisi Village in Limpopo Province, South Africa where fluoride concentrations ranged from 0.31 to 0.94 mg/L. In the current study, BH5, BH6 and BH10 had negative correlation of pH and F, and relatively low F concentrations which ranged from 1.17 to 1.57, 1.46 to 1.55, and 0.00 to 2.79 mg/L, respectively (Table 4 and Figure 2). Thus, these low concentrations are likely to indicate low fluoride concentrations in the rocks at these sites and, therefore, explains negative correlation between F and pH. These findings therefore show variable occurrence of fluoride bearing rocks in the study area.
BH1 and BH7 had relatively high positive correlations of potassium and nitrates (Table 5). Correlation between potassium and nitrates indicates that contamination is mainly from fertilizers [37]. BH3, BH4, BH6, BH7, BH8, and BH11 had positive high correlation of nitrates and chlorides (Table 5). Correlation between chlorides and nitrates indicates that contamination is mainly from animal and human wastes [37]. The boreholes are located within homesteads where there are no animals or livestock that can generate animal waste which has potential to pollute groundwater. Thus, the only likely source of groundwater contamination is faecal matter from pit latrines which are within the vicinity of the boreholes. However, further studies are required verify to if faecal matter is the source of nitrate contamination of groundwater in Siloam Village. The distances between pit latrines and boreholes in the study area as measured by Mukhumo [38] and presented in Table 5, show that boreholes are within proximity of pit latrines. The recommended minimum safe distance between point source of groundwater supply and pit latrine should be >50 m [39]. Thus, there is high risk of groundwater contamination by human wastes in Siloam Village. Mudau [26] showed that there is contamination of groundwater by faecal matter from pit latrines that are not placed at an appropriate distance from the boreholes in Nzhelele area including Siloam Village. Results from [11] indicated that pit latrines impacted on microbiological groundwater quality up to 25 m lateral distance. The ease through which aquifer material/geology restricts or permits movement of microbial contaminants into the aquifer influences the distance up to which microbial contamination of groundwater occurs. Bessong et al. [40] indicated that microbial contamination of groundwater was reduced due to local geological barriers within the aquifer and/or filtration through attachment to soil media.
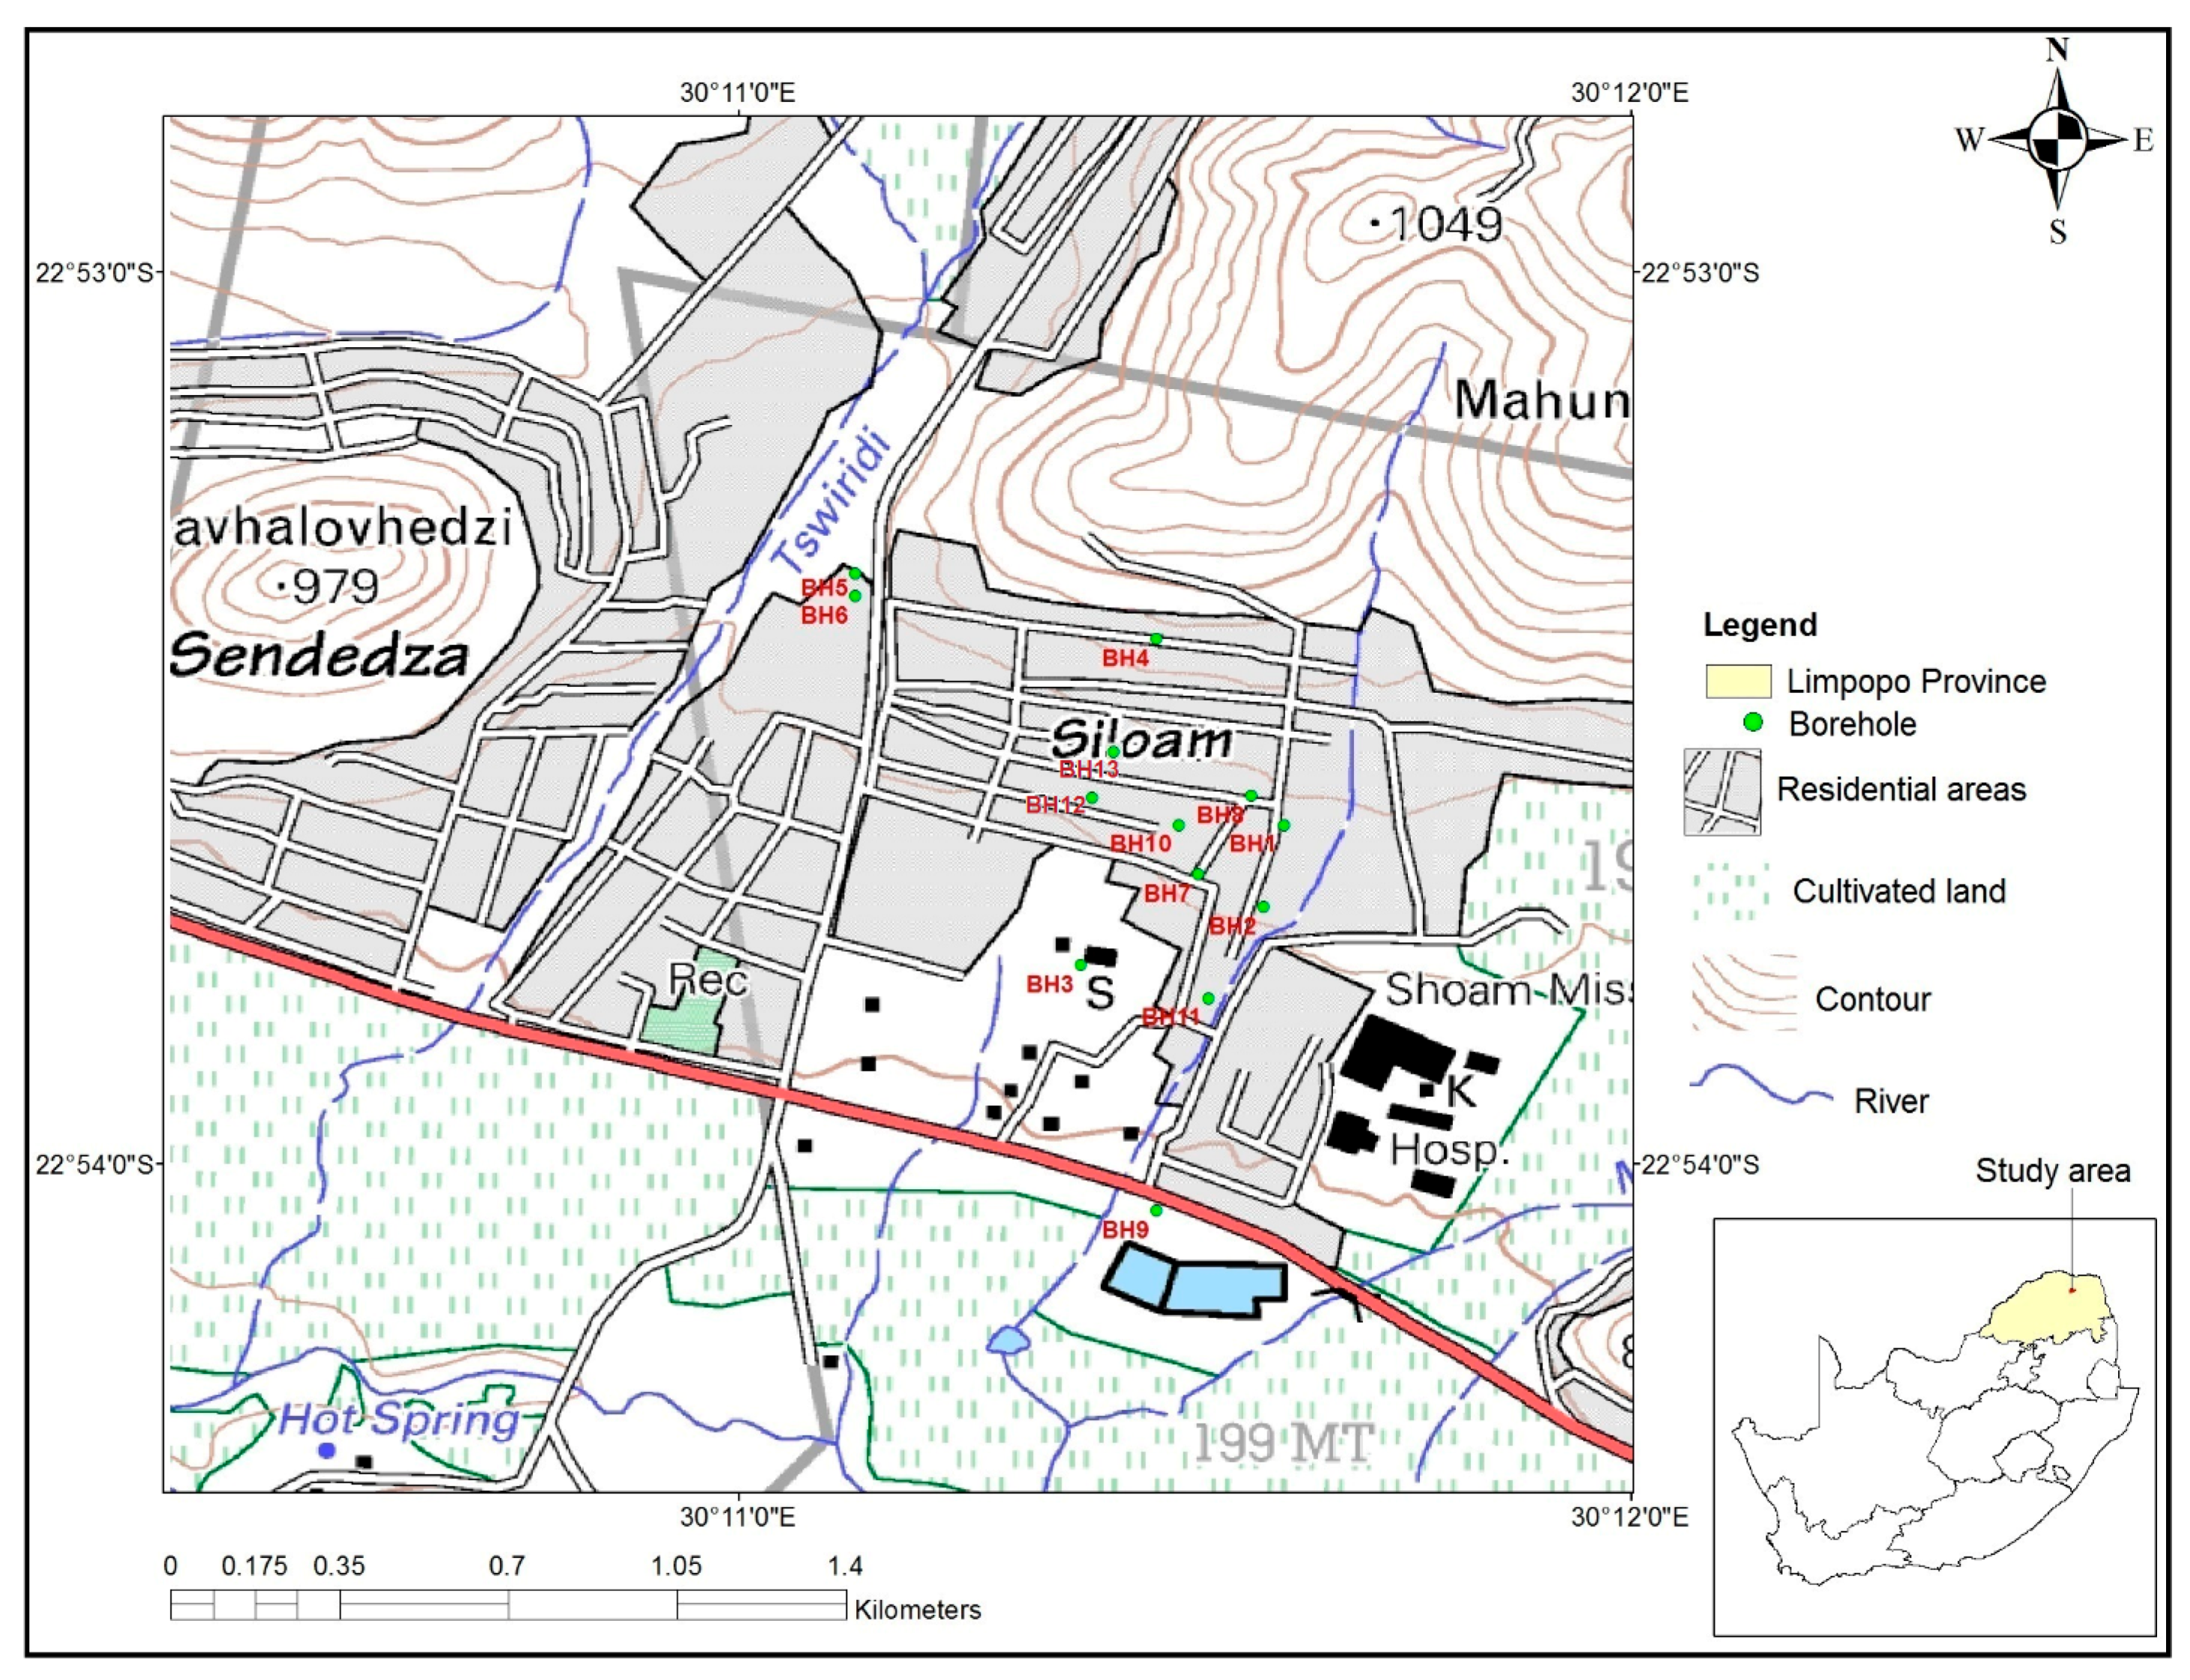
Microbial water quality indicators obtained in boreholes BH12 and BH13 (Figure 1) in Table 6 mostly exceeded their specific TWQR. This indicated a high risk of infectious disease transmission [26]. Studies done in rural areas of South Africa (for example, Potgieter et al. [10], Mpenyana-Monyatsi et al. [41], Palamuleni and Akoth [42]) have also indicated that faecal contamination of groundwater poses health risks to communities. Faecal coliform and E. coli are indicators of faecal pollution of water and their presence in most of the boreholes, though determined within a different study period, therefore, support the high correlation of nitrates and chloride obtained in the current study.

4. Conclusions

The study showed that nitrates and fluorides were the only parameters with excessively high concentrations in groundwater which are associated with health effects on human beings. Potential risks associated with high concentrations of fluorides and nitrates include tooth damage and pronounced skeletal fluorosis on long-term exposure, and methaemoglobinaemia in infants and the occurrence of mucous membrane irritation in adults, respectively. The means of most of the water quality parameters were statistically different, as shown from the results of the ANOVA test.
Though earlier studies have identified potential sources of fluoride in Siloam Village, the contrasting correlations obtained with calcium and pH in this study indicate the need for further investigations to identify the local sources and fluoride control mechanisms in the study area. Microbial contamination of groundwater mainly from pit latrines was also identified. Subsistence farming was also found to contribute to nitrate pollution in some of the boreholes. There is a need to discuss possible strategies to minimise groundwater pollution with borehole owners in Siloam Village. These include relocation of pit latrines to acceptable distances from boreholes and efficient application of fertilizers to only the levels required by the crops.

Acknowledgments

The Research and Publications Committee of the University of Venda is acknowledged for providing funds for covering the costs to publish in open access.

Author Contributions

Rachel Makungo assisted by students conducted field collection of water samples and analysis of physical water quality parameters. This also included laboratory analysis of metals and non-metals in groundwater. Rachel Makungo compiled the map of the study area, conducted descriptive statistics and ANOVA tests, and drafted the manuscript. John Ogony Odiyo conceptualised and designed the study, performed the correlation analysis, and revised and finalised the manuscript. John Ogony Odiyo also contributed reagents and materials used in both field and laboratory work.

Conflicts of Interest

The authors declare no conflict of interest.

References

  1. André, L.; Franceschi, M.; Pouchan, P.; Atelia, O. Using geochemical data and modelling to enhance the understanding of groundwater flow in a regional deep aquifer, Aquitaine Basin, South-West of France. J. Hydrol. 2005, 305, 40–62. [Google Scholar] [CrossRef]
  2. Sherman, H.M. The Assessment of Groundwater Quality in Rural Communities: Two Case Studies from KwaZulu-Natal. Master’s Thesis, University of Natal, Durban, South Africa, 1998. [Google Scholar]
  3. Esterhuizen, L.; Fossey, A.; Potgieter, E. Groundwater quality on dairy farms in central South Africa. Water SA 2015, 41, 194–198. [Google Scholar] [CrossRef]
  4. Ncube, E.J. The Distribution of Fluoride in South African Groundwater and the Impact There of on Dental Health. Master’s Thesis, University of Pretoria, Pretoria, South Africa, 2006. [Google Scholar]
  5. Dedzo, M.G.; Tsozué, D.; Mimba, M.E.; Tedd, F.; Nembungwe, R.M.; Linida, S. Importance of rocks and their weathering products on groundwater quality in Central-East Cameroon. Hydrology 2017, 4, 23. [Google Scholar] [CrossRef]
  6. Basavarajappa, H.T.; Manjunatha, M.C.; Pushpavathi, K.N. Rock-water interaction and chemical quality analysis of groundwater in hard rock terrain of Chamrajanagara District, Karnataka, India using geoinformatics. J. Org. Inorg. Chem. 2015, 1, 1–11. [Google Scholar]
  7. DWA. Groundwater Strategy 2010; Department of Water Affairs: Pretoria, South Africa, 2010; p. 64.
  8. Graham, J.P.; Matthew, L.P. Pit latrines and their impacts on groundwater quality: A systematic review. Environ. Health Perspect. 2013, 121, 521–530. [Google Scholar] [CrossRef] [PubMed]
  9. Holland, M. Hydrogeological Characterisation of Crystalline Basement Aquifers within the Limpopo Province, South Africa. Ph.D. Thesis, University of Pretoria, Pretoria, South Africa, 2011. [Google Scholar]
  10. Potgieter, N.; Mudau, L.S.; Maluleke, F.R.S. Microbiological quality of groundwater sources used by rural communities in Limpopo Province, South Africa. Water Sci. Technol. 2006, 54, 371–377. [Google Scholar] [CrossRef] [PubMed]
  11. Dzwairo, B.; Hoko, Z.; Love, D.; Guzha, E. Assessment of the impacts of pit latrines on groundwater quality in rural areas: A case study from Marondera district, Zimbabwe. Phys. Chem. Earth 2006, 31, 779–788. [Google Scholar] [CrossRef]
  12. Adekunle, I.M.; Adetunji, M.T.; Gbadebo, A.M.; Banjoko, O.B. Assessment of groundwater quality in a typical rural settlement in Southwest Nigeria. Int. J. Environ. Res. Public Health 2007, 4, 307–318. [Google Scholar] [CrossRef] [PubMed]
  13. Sorensen, J.P.R.; Sadhu, A.; Sampath, G.; Sugden, S.; Gupta, S.D.; Lapworth, D.J.; Marchant, B.P.; Pedley, S. Are sanitation interventions a threat to drinking water supplies in rural India? An application of tryptophan-like fluorescence. Water Res. 2016, 88, 923–932. [Google Scholar] [CrossRef] [PubMed]
  14. Mzuga, J.M.; Tole, M.P.; Ucakuwun, E.K. The impact of geology and pit latrines on groundwater quality in Kwale District. In Dunes, Groundwater, Mangroves and Birdlife in Coastal Kenya; Hoorweg, J., Ed.; Acts Press: Nairobi, Kenya, 1998; pp. 85–96. ISBN 9966-41-101-1. [Google Scholar]
  15. Odiyo, J.O.; Makungo, R. Water Quality Problems and Management in Rural Areas of Limpopo Province, South Africa, Water Pollution XI; WIT Transactions on Ecology and the Environment: Southampton, UK, 2012; Volume 164, pp. 135–146. [Google Scholar]
  16. Odiyo, J.O.; Makungo, R. Fluoride concentrations in groundwater and human health impact in Siloam Village, Limpopo Province, South Africa. Water SA 2012, 38, 731–736. [Google Scholar] [CrossRef]
  17. Patel, J.Y.; Vaghani, M.V. Correlation study for assessment of water quality and its parameters of par river Valsad, Gujarat, India. IJIERE 2015, 2, 150–156. [Google Scholar]
  18. Ashton, P.; Love, D.; Mahachi, H.; Dirks, P. An Overview of the Impacts of Mining and Mineral Processing Operations on Water Resources and Water Quality in the Zambezi, Limpopo and Olifants Catchments in Southern Africa; MMSD Southern Africa Research Reports, Report No. ENV-P-C 2001-042; International Institute for Environment and Development: London, UK, 2001; p. 336. [Google Scholar]
  19. Du Toit, W.H.; Mulin, H.; Jonck, F. 1:500,000 Hydrogeological Map Series of the Republic of South Africa, Messina 2230, 1st ed.; DWAF: Pretoria, South Africa, 2002. [Google Scholar]
  20. Busari, O. Groundwater in the Limpopo Basin: Occurrence, use and impact. Environ. Dev. Sustain. 2008, 10, 943–957. [Google Scholar] [CrossRef]
  21. DWAF; DoH; WRC. Volume 1: Assessment Guide. In Quality of Domestic Water Supplies, 2nd ed.; Water Research Commission No: TT 101/98; DWAF: Pretoria, South Africa, 1998. [Google Scholar]
  22. DWAF; DoH; WRC. Volume 2: Sampling Guide. In Quality of Domestic Water Supplies, 1st ed.; Water Research Commission No: TT 117/99; DWAF: Pretoria, South Africa, 2000. [Google Scholar]
  23. DWAF. Volume 1: Domestic water use. In South African Water Quality Guidelines, 2nd ed.; DWAF: Pretoria, South Africa, 1996; p. 216. [Google Scholar]
  24. Reza, R.; Singh, S. Groundwater quality status with respect to fluoride contamination in industrial area of Angul District Orissa India. Indian J. Sci. Res. Technol. 2013, 1, 54–61. [Google Scholar]
  25. Alagumuthu, G.; Rajan, M. Monitoring of fluoride concentration in groundwater of Kadayam Block of Tirunelveli District, India: Correlation with physico-chemical parameters. Rasayan J. Chem. 2008, 1, 920–928. [Google Scholar]
  26. Mudau, T.C. Effects of Pit Latrines Location on Groundwater of Nzhelele Village within Limpopo Province. Ph.D. Thesis, University of Venda, Thohoyandou, South Africa, 2011. [Google Scholar]
  27. Misi, A. 2016 Assessment of Groundwater Potential and Vulnerability in the Upper Manyame Sub-Catchment of Zimbabwe. Master’s Thesis, University of Zimbabwe, Harare, Zimbabwe, 2016. [Google Scholar]
  28. Sharma, R.; Shah, S.; Mahanta, C. Hydrochemical study of groundwater fluoride. Asian J. Water Environ. Pollut. 2005, 2, 47–54. [Google Scholar]
  29. Chakrabarty, S.; Sarma, H.P. Fluoride geochemistry of groundwater in parts of Brahmaputra flood plain in Kamrup district, Assam, India. Arch. Appl. Sci. Res. 2011, 3, 37–44. [Google Scholar]
  30. Chakraborti, D.; Chanda, C.R.; Samanta, G.; Chowdhury, U.K.; Mukherjee, S.C.; Pal, A.B. Fluorosis in Assam, India. Curr. Sci. 2000, 78, 1421–1423. [Google Scholar]
  31. Dutta, J.; Nath, M.; Chetia, M.; Misra, A.K. Monitoring of fluoride concentration in ground water of Small Tea Gardens in Sonitpur District, Assam, India: Correlation with physico-chemical parameters. Int. J. ChemTech Res. 2010, 2, 1199–1208. [Google Scholar]
  32. Avtar, A.; Kumar, P.; Surjan, A.; Gupta, L.N.; Roychowdhury, K. Geochemical processes regulating groundwater chemistry with special reference to nitrate and fluoride enrichment in Chhatarpur area, Madhya Pradesh, India. Environ. Earth Sci. 2013, 70, 1699–1708. [Google Scholar] [CrossRef]
  33. Liu, M.; Mande, S.-L.A.-S.; Zhang, Y.; Chen, H. Geochemical evaluation and nitrate in groundwater: A case study from Qinkenpao area, Daqing, China. Afr. J. Agric. Res. 2014, 2, 2992–3000. [Google Scholar]
  34. Dobaradaran, S.; Mahvi, A.M.; Dehdashti, S.; Dobaradaran, S.; Shoara, R. Correlation of fluoride with some inorganic constituents in groundwater of Dashtestan, Iran. Fluoride 2009, 42, 50–53. [Google Scholar]
  35. Umarani, P.; Ramu, A. Fluoride contamination status of groundwater in East Coastal area in Tamilnadu, India. IJIRSET 2014, 3, 10045–10051. [Google Scholar]
  36. Nephalama, A.; Muzerengi, C. Assessment of the influence of coal mining on groundwater quality: Case of Masisi Village in the Limpopo Province of South Africa. In Proceedings of the Freiberg/Germany, Mining Meets Water—Conflicts and Solutions (IMWA 2016), Leipzig, Germany, 11–15 July 2016; pp. 430–438. [Google Scholar]
  37. Alvi, S.K.; Khan, F.A.; Siddiqui, I.U.; Usmani, T.H.; Mahmood, S.N. Nitrate/nitrate contamination in groundwater of Karachi and its correlation with other physicochemical parameters. J. Chem. Soc. Pak. 2005, 27, 490–495. [Google Scholar]
  38. Mukhumo, V. Investigating Suitability of Groundwater for Domestic Use in Siloam Village. Honours Dissertation, University of Venda, Thohoyandou, South Africa, 2014. [Google Scholar]
  39. Xu, Y.; Braune, E. Minimum distance as an important concept for borehole source protection in South Africa. In Proceedings of the Ground Water 1995 Conference, Midrand, South Africa, 26–28 September 1995. [Google Scholar]
  40. Bessong, P.O.; Odiyo, J.O.; Musekene, N.J.; Tessema, A. Spatial distribution of diarrhoea and microbial quality of domestic water during an outbreak of diarrhoea in the Tshikuwi Community in Venda, South Africa. J. Health Popul. Nutr. 2009, 27, 652–659. [Google Scholar] [CrossRef] [PubMed]
  41. Mpenyana-Monyatsi, L.; Onyango, M.S.; Momba, M.N.B. Groundwater quality in a South African rural community: A possible threat to public health. Pol. J. Environ. Stud. 2012, 21, 1349–1358. [Google Scholar]
  42. Palamuleni, L.; Akoth, M. Physico-chemical and microbial analysis of selected borehole water in Mahikeng, South Africa. Int. J. Environ. Res. Public Health 2015, 12, 8619–8630. [Google Scholar] [CrossRef] [PubMed]
Figure 1. Location of the study area.
Ijerph 15 00317 g001
Figure 2. Variations of fluoride concentrations.
Ijerph 15 00317 g002
Table 1. Descriptive statistics for physical water quality parameters and non-metals.
ParameterDescriptive StatisticAugust 2013September 2013October 2013November 2013December 2013January 2014TWQR
pHMin7.147.277.227.007.266.836–9
Max9.068.888.869.089.299.28
Mean7.687.877.757.837.887.86
STDEV0.530.540.690.830.640.89
Turbidity (NTU)Min0.000.000.010.000.000.001
Max25.910.890.550.470.6911.85
Mean2.540.170.180.090.191.80
STDEV7.770.270.230.150.263.97
EC (mS/m)Min34.9036.6043.8036.1023.6830.1070
Max141.80156.60158.80141.00151.70139.90
Mean81.9690.8386.0284.6885.6390.33
STDEV38.1043.0740.9433.9543.7742.27
Fluoride (mg/L)Min0.001.401.521.511.171.341
Max6.745.415.855.846.165.89
Mean3.823.694.604.013.824.16
STDEV2.411.641.591.922.011.64
Chloride (mg/L)Min5.730.000.000.0024.890.00100
Max1177.40223.58223.13198.22296.27410.86
Mean198.0183.4099.6187.84134.12160.56
STDEV332.6669.4383.8867.2395.93145.55
Min0.226.7710.102.666.107.92
Sulphate (mg/L)Max188.3664.18365.36313.79174.58404.01200
Mean34.4524.0780.2043.7544.9970.12
STDEV53.1420.33140.2995.3054.39126.57
Nitrate (mg/L)Min0.000.000.000.000.000.006
Max137.04409.9365.51209.94596.42543.27
Mean40.9688.6934.4345.5799.99107.63
STDEV48.36129.8625.7664.61193.17175.59
Note: Values in bold exceeded TWQR.
Table 2. Descriptive statistics for metals.
ParameterDescriptive StatisticAugust 2013September 2013October 2013November 2013December 2013January 2014TWQR
Magnesium (mg/L)Min0.330.335.460.090.541.0830
Max10.8611.1911.2611.2210.5711.27
Mean7.988.359.298.328.348.14
STDEV3.643.822.073.613.203.96
Manganese (mg/L)Min0.010.010.000.010.010.010.05
Max0.040.560.100.140.270.23
Mean0.020.090.020.040.060.05
STDEV0.010.170.040.050.090.07
Potassium (mg/L)Min0.300.380.450.340.000.7650
Max4.675.843.947.708.677.30
Mean2.012.121.782.892.362.77
STDEV1.481.951.272.702.962.04
Copper (mg/L)Min0.000.000.010.010.000.011
Max0.020.020.090.040.010.21
Mean0.010.000.020.020.010.03
STDEV0.010.010.030.010.000.07
Zinc (mg/L)Min0.000.000.010.000.000.013
Max0.050.300.840.371.000.88
Mean0.010.060.160.080.150.22
STDEV0.010.090.330.120.330.30
Calcium (mg/L)Min0.030.000.050.070.000.0232
Max4.121.895.254.673.265.59
Mean0.780.381.401.440.771.35
STDEV1.200.672.011.591.171.94
Iron (mg/L)Min0.000.000.000.000.000.000.1
Max0.000.010.000.060.140.17
Mean0.000.000.000.010.020.02
STDEV0.000.000.000.020.050.06
Note: Values in bold exceeded TWQR.
Table 3. Statistical significance based on single factor ANOVA.
Parameterp-ValueStatistical Significance
pH6.69444 × 10−12Yes
EC4.1007 × 10−19Yes
Turbidity3.03 × 10−2Yes
Fluoride7.98306 × 10−15Yes
Chloride0.5255362No
Sulphate6.17901 × 10−10Yes
Nitrate1.28 × 10−4Yes
Manganese6.46 × 10−3Yes
Potassium1.94 × 10−7Yes
Copper0.2159No
Zinc0.1658No
Iron1.05 × 10−2Yes
Table 4. Correlation of fluoride with calcium and pH.
SiteCalcuimpHFluoride Ranges
BH10.140.684.38–6.74
BH2−0.31−0.755.03–6.40
BH3−0.94−0.941.70–4.76
BH40.060.771.34–1.66
BH5−0.55−0.311.17–1.57
BH60.12−0.151.46–1.55
BH7−0.29−0.045.40–5.78
BH8−0.300.044.81–5.89
BH9−0.390.112.69–4.81
BH10−0.96−0.700.00–2.79
BH110.630.344.20–5.77
Table 5. Correlation of nitrate with chloride and potassium.
SiteChloridePotassiumDistance between Pit Latrines and Boreholes
BH1−0.170.6435
BH2−0.610.0140
BH30.46−0.6824, 38, 46 *
BH40.99−0.0224
BH5−0.060.0118
BH60.67−0.1847
BH70.990.4834
BH80.84−0.3127
BH9−0.36−0.3045
BH10−0.35−0.4230
BH110.84−0.3123.3
* Borehole surrounded by 3 pit latrines.
Table 6. Microbial water quality indicators.
SiteSampling DateTotal ColiformHeterotrophic BacteriaE. coliFaecal Coliform
TWQR0–50–10000
BH1214 September 2009211NM0NM
16 October 20090NM71NM
9 March 201012136512022
7 April 201021937013034
BH1314 September 200954NM0NM
16 October 20090NM0NM
9 March 2010682492150
7 April 2010504031144
NM = not measured.

