Islamic Finance and Herding Behavior Theory: A Sectoral Analysis for Gulf Islamic Stock Market


1
Department of Finance and Investment, College of Economics and Administrative Sciences, Imam Muhammad Ibn Saud Islamic University (IMSIU), 11432 Riyadh, Saudi Arabia
2
Department of Economics and Quantitative methods, High Business School, Sfax University, 3029 Sfax, Tunisia
3
Department of Management, High Business School, Sfax University, 3029 Sfax, Tunisia
*
Author to whom correspondence should be addressed.
Int. J. Financial Stud. 2019, 7(4), 65; https://0-doi-org.brum.beds.ac.uk/10.3390/ijfs7040065
Submission received: 18 July 2019
/
Revised: 30 September 2019
/
Accepted: 1 October 2019
/
Published: 4 November 2019
Abstract
:This study examines herding behavior in four sectors of the Gulf Islamic stock markets. Based on the methodology of Chiang and Zheng (2010), results showed evidence of herding among investors in major sectors for the Gulf Cooperation Council (hereinafter GCC) Islamic stock market during falling periods. In addition, we found that conventional return dispersions have a dominant influence during both falling and rising market periods. We also found evidence of herding around the conventional sectors during down market periods only in banking, hotel and restaurant sectors. There is evidence of herding around the conventional sectors during up market periods for insurance and industrial sectors.
Keywords:
Islamic stock market; GARCH model; Quantile regression; herding behavior; GCC countries; sectoral analysisJEL Classification:
G11; G12; G151. Introduction
Stock market anomalies and inefficiencies for major markets, especially developed and emergent, have questioned the importance of standard finance theory, and this has given rise to the development of modern behavioral finance theory (Kahneman and Tversky 1979). However, the rejection of the basics of conventional finance theory, such as heterogeneity of investors, asymmetric information, and irrationality of investors, is explained by the psychology of investors, which is different among individuals. This modern theory gives rise to the development of behavioral biases on financial practitioners such as anchoring, availability, herding, mental accounting, optimism, overconfidence, and representativeness. This analysis focuses on herding behavior bias. More specifically, this paper examines sectoral-specific herding behavior in the Islamic GCC stock market for the period September 2013–October 2018. Previous studies1 have shown that, as in developed and emerging markets, evidence of herding behavior has been confirmed for the Islamic GCC stock market, but this bias differs among GCC countries. Do these differences exist among sectors for these countries? Our objective is to determine which sectors display herding in the Islamic GCC stock market.
Mimicry or herding behavior is often observed during periods of crisis and rapid growth, and this phenomenon damages both investors and stock markets. In its simplest form, herding is defined as the result of buying and selling the same stocks in the same period. It is based on the fact that less informed investors copy others because they believe that other investors are more informed and have better access to information than them. Some investors make this decision of following others because of the complexity or the lack of understanding of the characteristics of the market. Complexities of markets differ from one sector to another, and sectors do not have the same characteristics. However, herding is evident in some sectors, but not others.
Also, researchers insist on the fact that investors choose to follow others in the market or herd when volatility and unpredictability is high. Herding has a severe effect on the stock markets and can occur particularly during extreme periods (crisis or high growth). Investors tend to mimic the actions of others, especially during periods when volatility and uncertainty in the market are high. According to Banerjee (1992), herding behavior is defined as: “…doing what everyone else is doing, even when one’s private information suggests doing something else.” Hwang and Salmon (2004) define herding as, “… imitating observed decisions of other investors or movements on the financial market rather than following own beliefs and information.” Cote and Sanders (1997) define this bias as, “… individuals [who] alter their private beliefs to correspond more closely with the publicly expressed opinions of others.”
In the Gulf region, Islamic stock markets have registered prominent growth due to the religious beliefs of investors and the high level of economic developments in the region. Most studies interested in the comparison between Islamic and conventional stock markets have suggested similarities among markets. Given that herding behavior has been detected for major developed and emerging markets for conventional stocks, this has also been proven for the GCC Islamic stock markets (Chaffai and Medhioub 2018). Contrary to conventional markets, the studies have shown that sectors are specifically oriented in the Islamic stock markets, and that they are dominated by the financial sector, especially the banking sector which represents more than 30% of Islamic activities. Specifically, this study tests the phenomenon of herding in the GCC Islamic stock market by investigating the previous issues from the previous studies, in a sectoral manner.
Due to their religious beliefs, Muslim investors will not be easy to trade with in stock markets, and therefore, some behavioral biases are confirmed (Callen and Fang 2015; Goel and Srivastava 2016, etc.). Is this the case for herding behavior in the GCC Islamic stock market and is it different from one sector to another? In this paper, we examine the dispersion of Islamic GCC stock market return because of the importance of the Islamic transactions in the region and due to the rapid growth has taken place in recent decades. Also, given that the financial system in GCC countries is characterized by the operation of both Islamic and conventional stocks, agents and investors possibly herd because of the influence of the conventional elements on the Islamic elements. We test, in this analysis, whether Muslim investors follow decisions taken in conventional markets or not.
The major contributions of this paper are as follows. First, since most studies have examined whether herding behaviors differ among periods of expansion and crisis, we have tried to explore the effects of extreme periods in the Islamic GCC stock market on herding, by using quantile regression analysis. First, from our quantile regression analysis, the results confirm that herding is present in banking, insurance, hotels, restaurants, and foods sectors, but only during down market periods for the Islamic GCC stock market. Second, since introducing the GCC conventional herding behavior, the empirical findings suggest the influence of this factor on Islamic herding stock market in the region. We found that conventional return dispersions have a dominant influence on the Islamic GCC stock market during both falling and rising market periods in all sectors. Third, results showed evidence of herding around the conventional sectors during down market periods, only in the banking, hotels, restaurants, and foods sectors. Lastly, there is evidence of herding around conventional sectors during both falling and rising periods in the insurance and industrial sectors.
The remainder of the paper is organized as follows. Section 2 presents an overview of the Islamic GCC stock market. Section 3 provides a review of the literature on herding behavior. Section 4 presents the methodology and data sources employed in this research. The empirical results and their interpretations are also presented in this section. Our conclusion is in Section 5.
2. Characteristics of Islamic GCC Market and Herding Behavior for Muslim Countries
Since recent crises in 2007–2008, Islamic finance has been given great attention, has witnessed a solid growth, and Islamic stock markets have gained a large interest from Muslim investors seeking stocks and investments compliant with Shariah. However, due to the confidence and support accorded by governments to Islamic markets, Muslim investors participate positively in the rapid growth of Islamic finance, due to their strong demand for Shariah-compliant products. They believe that the Islamic market offers investments that are ethical (prohibition of products non-compliant with Shariah and prohibition of speculative activities) and stable (less risky than the conventional market). Therefore, Islamic investments are considered socially more responsible than conventional investments.
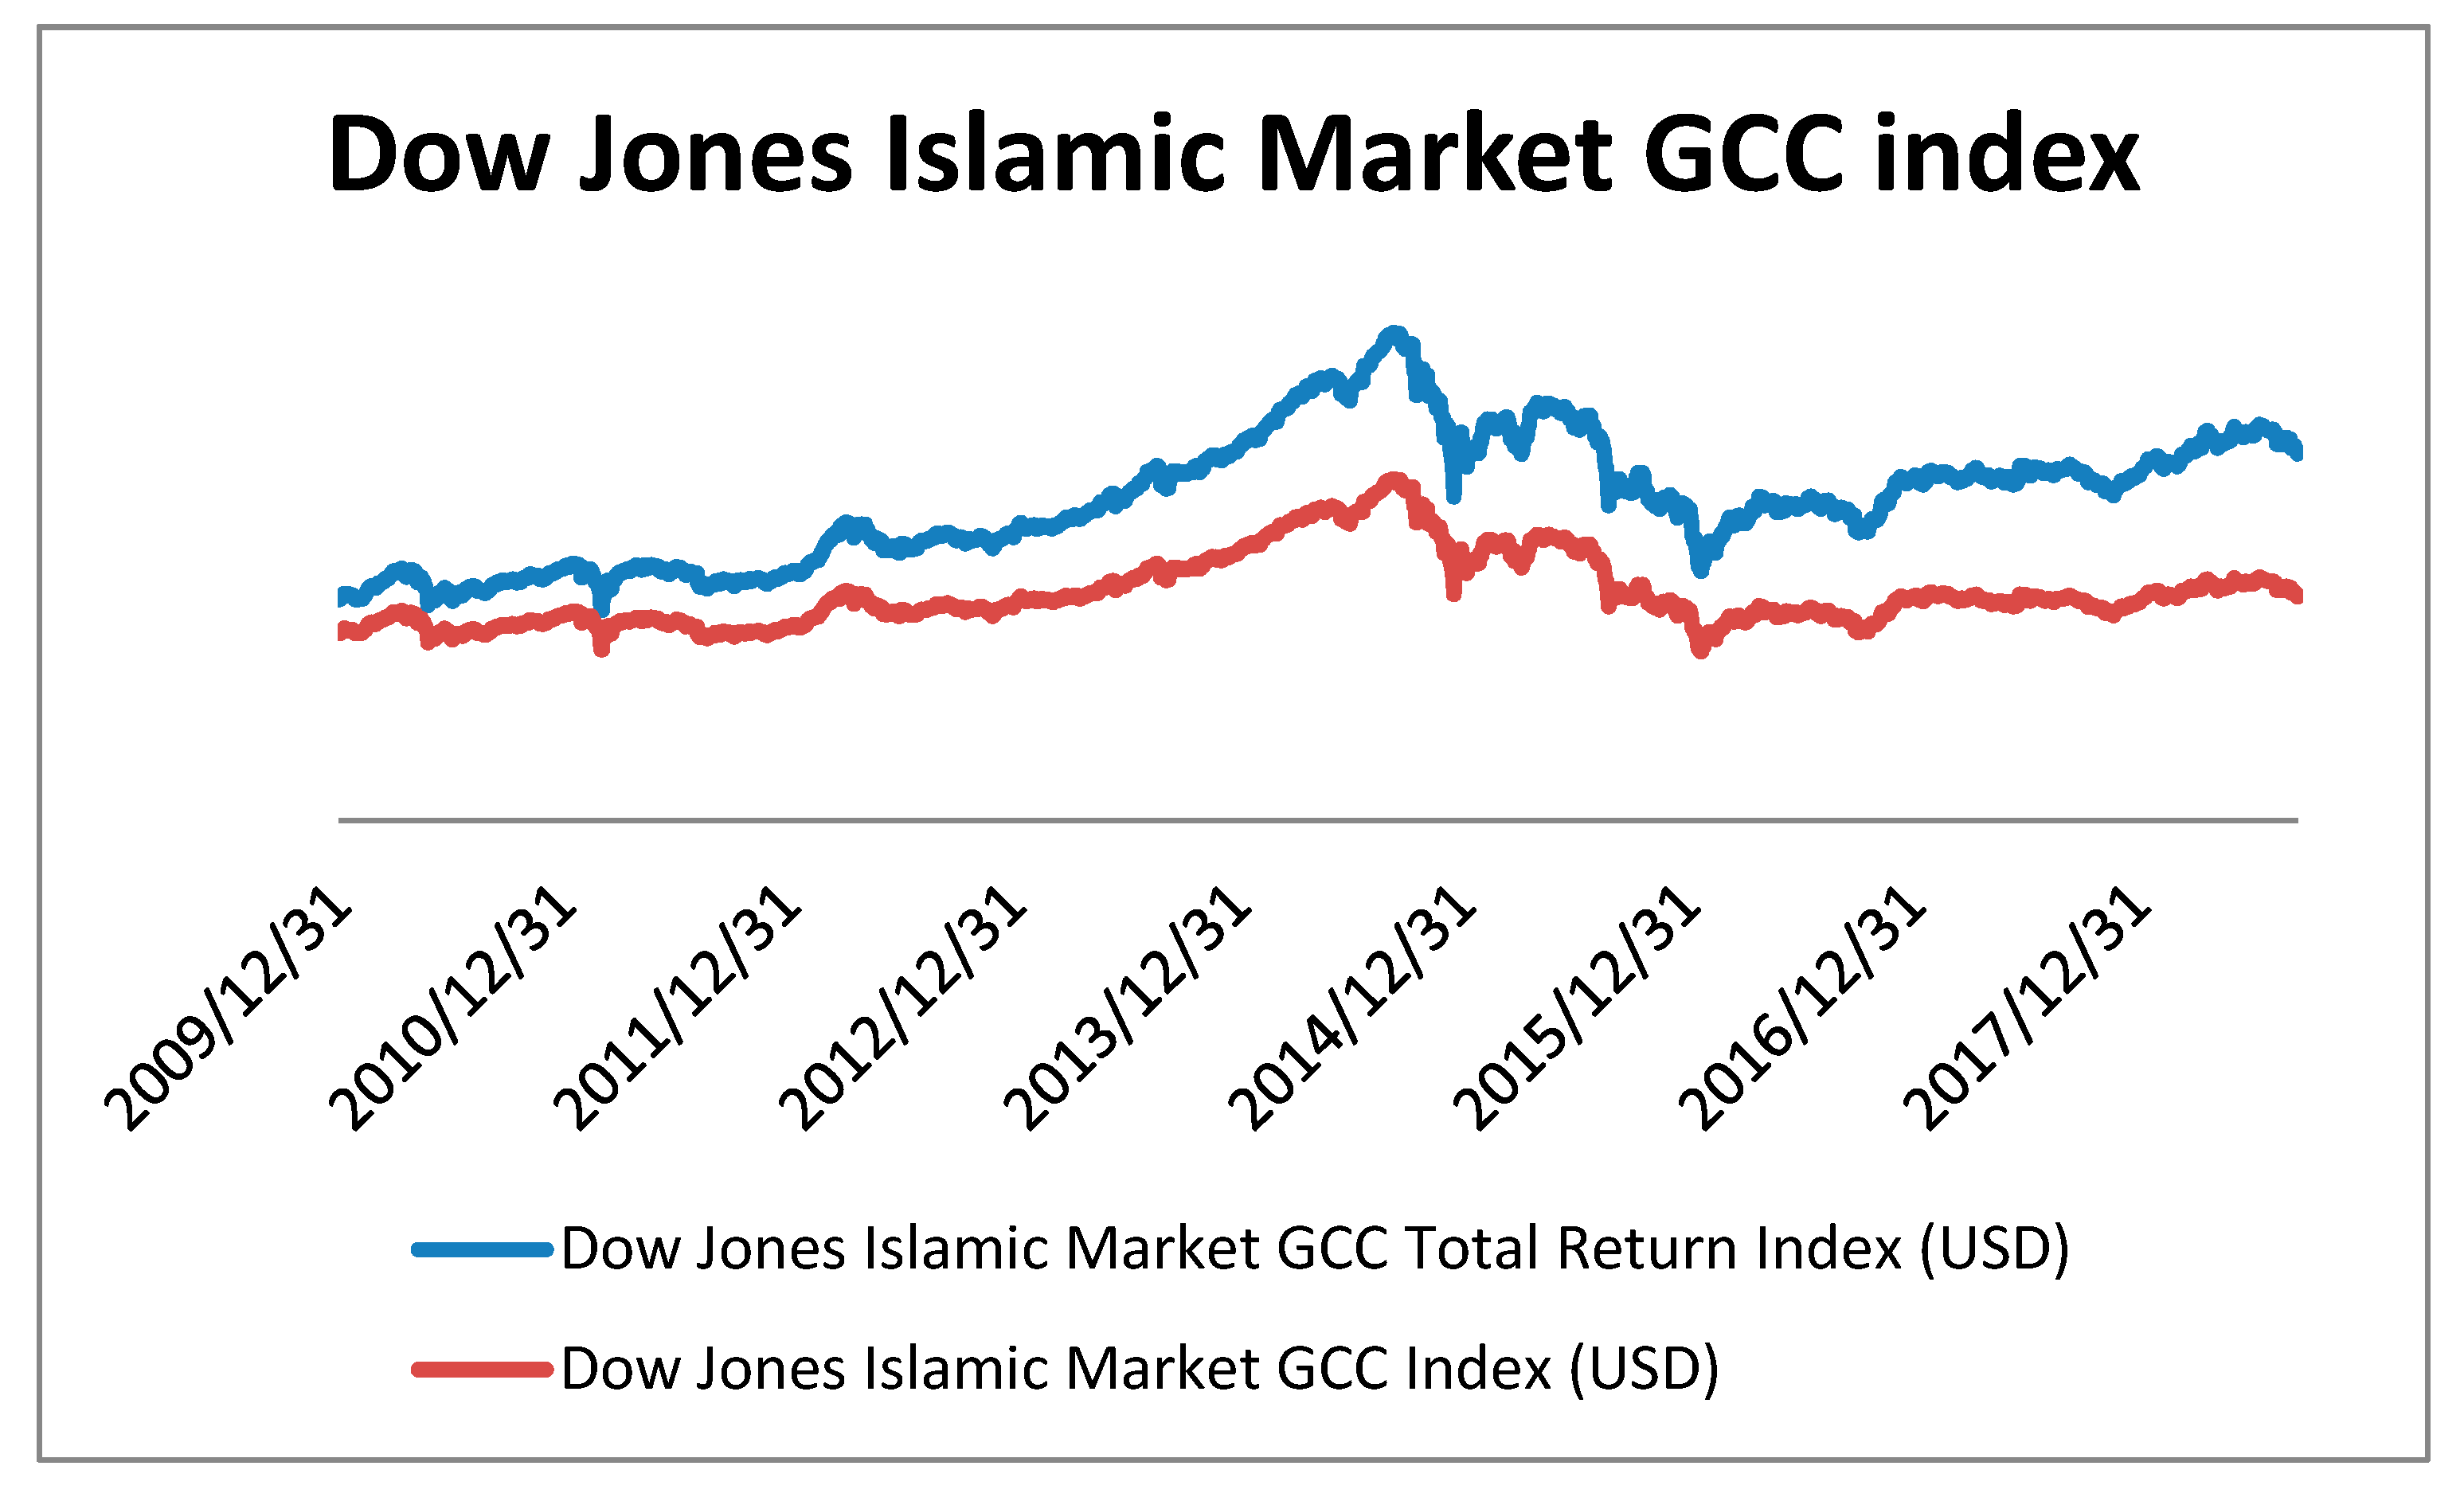
In major Muslim countries, the stock market consists of both types of market: Islamic and conventional. Moreover, the Islamic market is considered as an important complement to the conventional, which offers a wide range of Shariah-compliant financial products and services. On 18 August 2010, the Dow Jones Islamic Market GCC index was launched. This index represents a part of the Dow Jones Islamic market index and is employed to measure the stock performance of GCC companies that are compliant with Shariah. This market, supported by GCC governments, provides a benchmark for Muslim investors who believe in the application of the Shariah principles and seek ethical investments.
Over recent years, the Dow Jones Islamic Market GCC index has performed strongly and has been very volatile. Compared to its conventional counterpart in the region, the Dow Jones Islamic Market GCC index released a better performance, especially during extreme periods. In August 2012, the Dow Jones Islamic Market GCC index gained 2.30 percent while the conventional index released a growth of only 1.45 percent in the same period. Other studies, though, have shown that there is no considerable difference between the GCC Islamic and the conventional GCC index (Miniaoui et al. 2015). Additionally, they found also that there are differences on the impact of financial crises among GCC countries and sectors.
Filtering criteria and screening procedures adopted to dismiss companies that are non-compliant with Shariah encourage Muslim investors to invest in Islamic markets that are less risky than conventional markets and do not lead to huge losses in case of crisis or extreme periods.
These filtering procedures result from the concentration in some sectors. For the Dow Jones Islamic GCC stock index, the financial sector is the more important sector, with a weighting exceeding a third of the index, followed by the sector of basic materials and telecommunications. Health care, utilities, and oil and gas represent the weakest sectors for this market. On the other hand, for the conventional indexes, we observe that the industrial sector, consumer goods and services sector, and the financial sector are the most important sectors. For this region, the financial sector is dominated by the banking sector where Islamic banks are considered to be the prominent source of financial intermediation in the region. As presented in Table 1, the Islamic GCC banking sector represented 38.2 percent of global Islamic banking assets in 2014. Due to the differences in sector orientations between conventional and Islamic markets, we observed a difference between both markets in risk-adjusted performance. Results showed higher risk-adjusted performance for Islamic markets compared to its conventional counterpart and the existence of differences in performance at a sector level (Charles et al. 2015).
Looking at Figure 1, GCC’s Islamic stock market is interesting and resembles emerging and developed markets. Muslims participate largely in its development, and GCC governments encourage and help it in order to release the best performances.
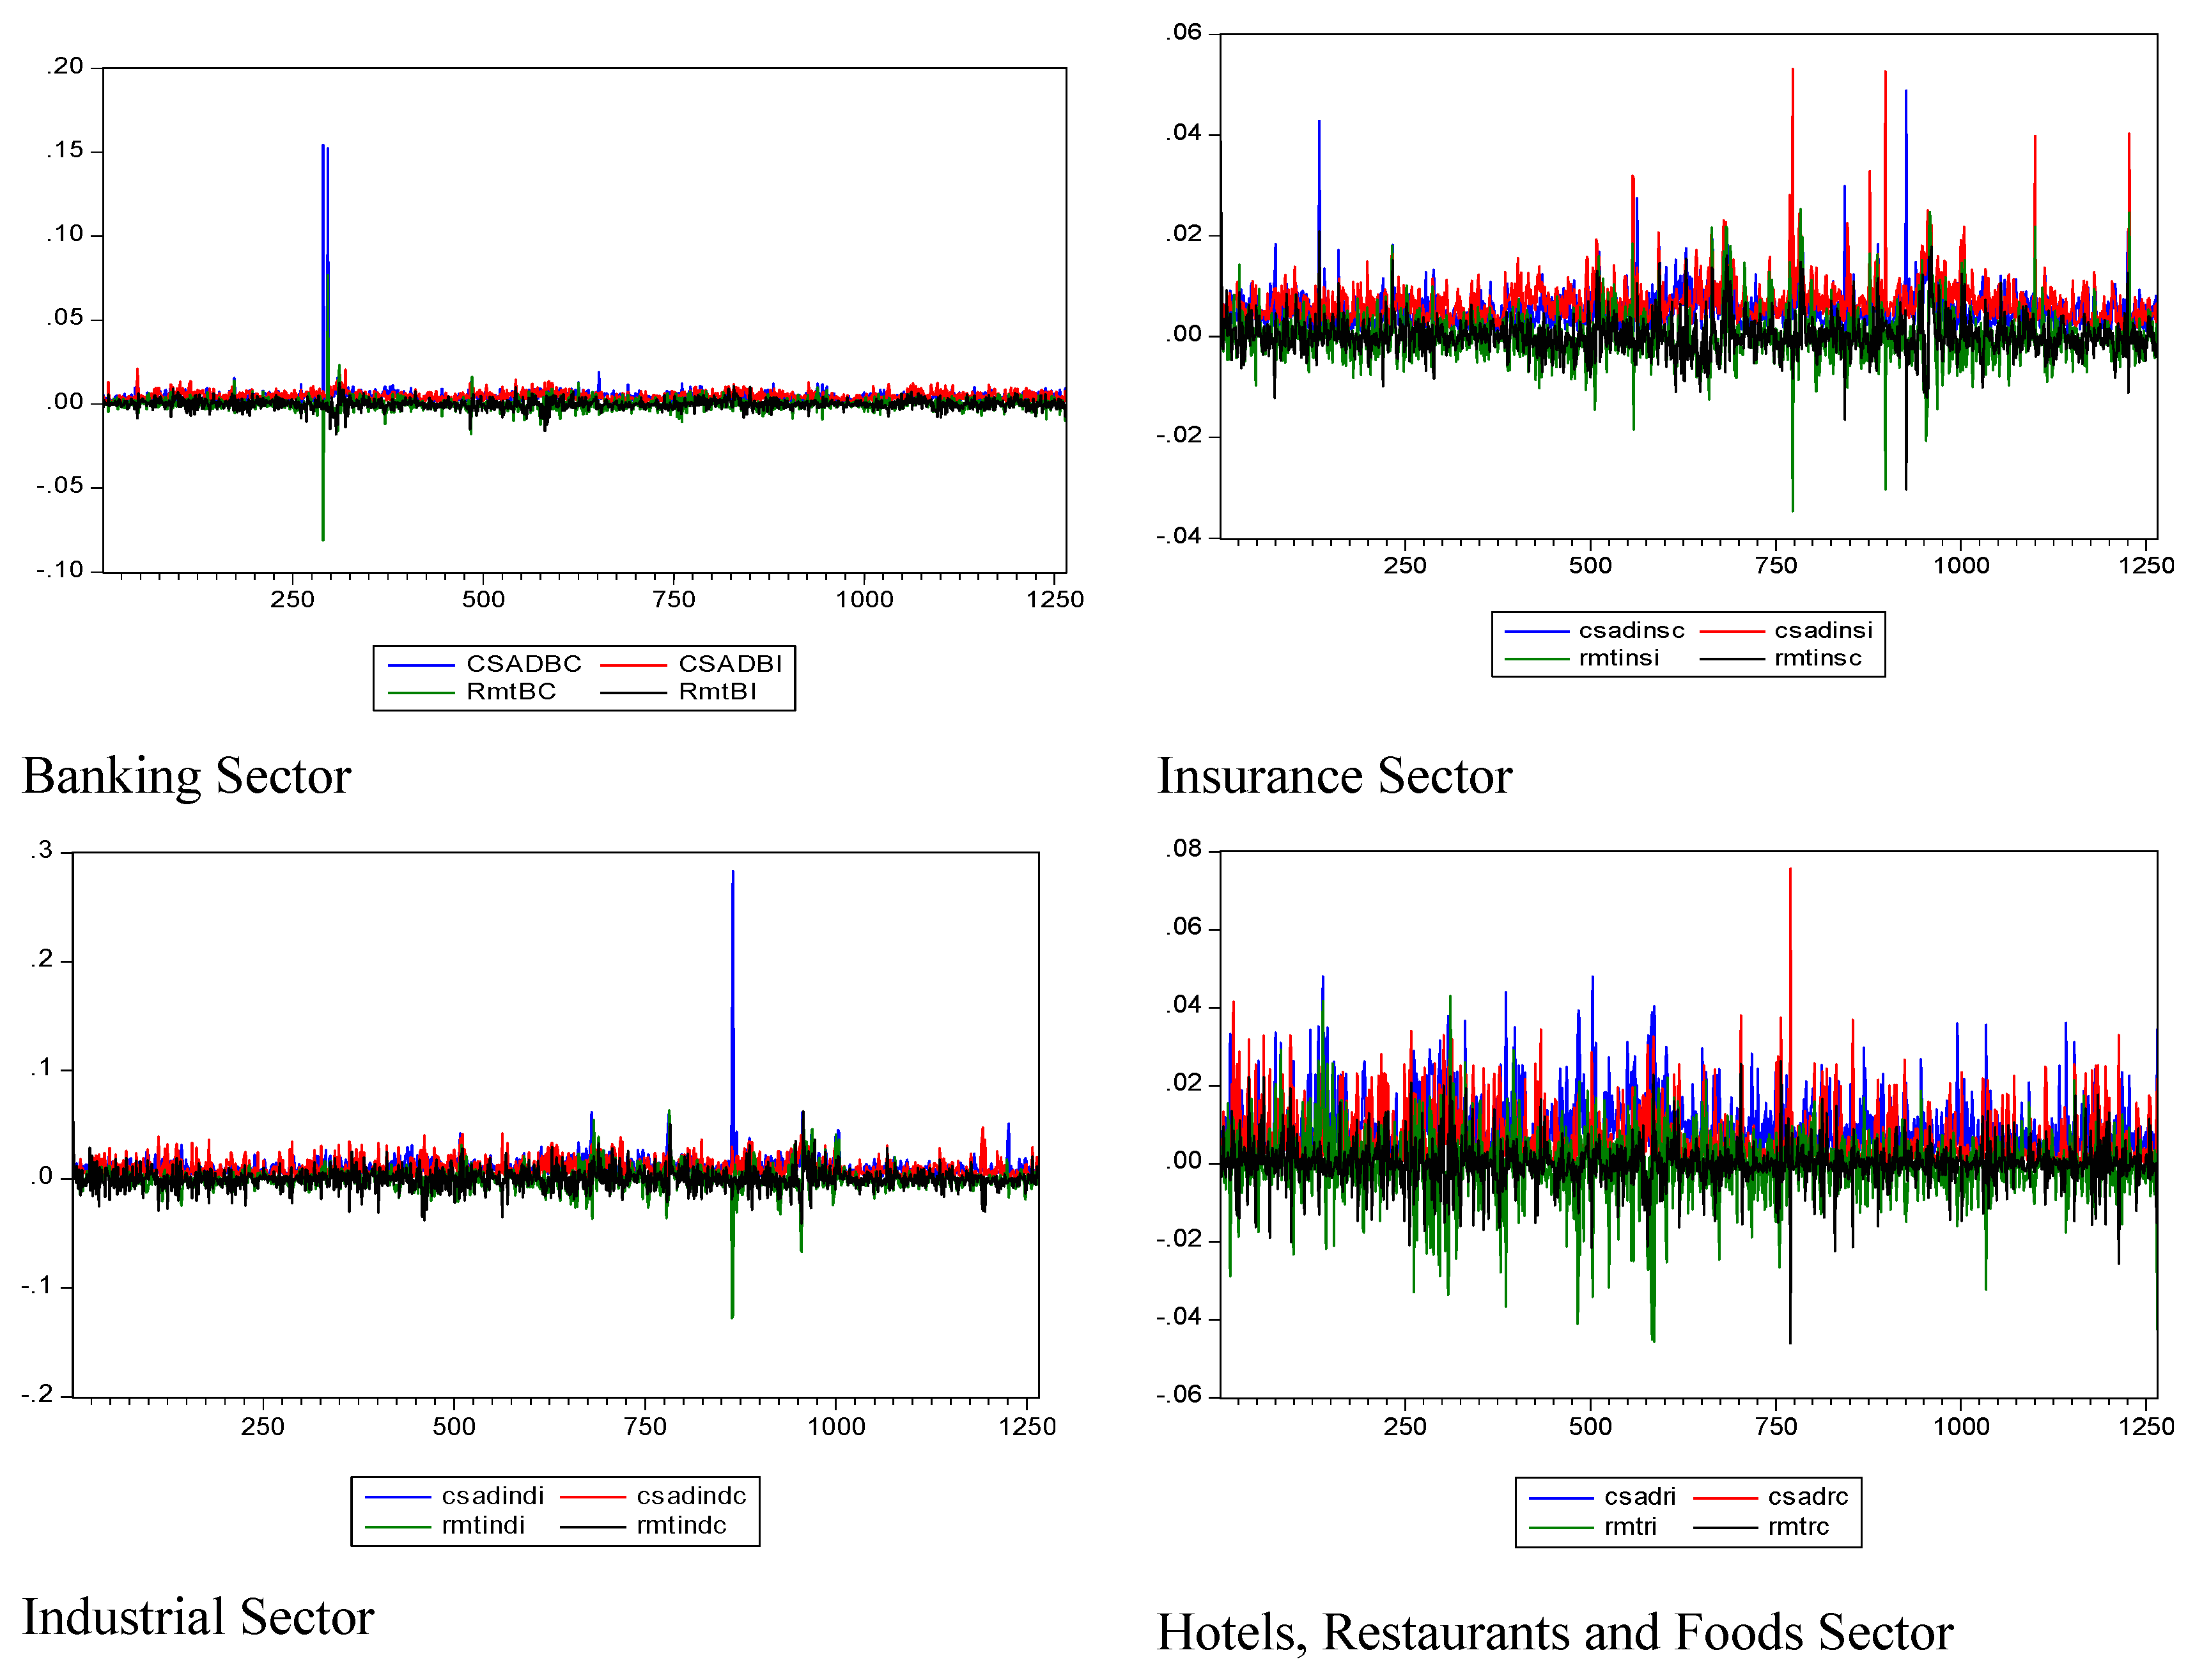
From Figure 2, we remark that the financial Islamic sectors (banking and insurance) are more volatile than other sectors compliant with Shariah, such as industrial, hotels, and restaurant sectors. This can be explained by the fact that the more important Islamic sectors are banking and insurance, and that the competition for these sectors with the conventional ones is very important. The banking sector accounts for more than 80 percent of the total assets of the Global Islamic financial stocks and dominates the Islamic financial sector. Also, in a dual system such as in the GCC region, the problem of interest represents the core center of the differences between both systems. Takaful, the Shariah compliant counterpart of conventional insurance, is very similar to mutual insurance and is based on the concept of risk sharing and solidarity. This Islamic sector contributes to the stability of the Islamic financial system. Otherwise, for sectors other than banking and insurance, it is not hard for investors to distinguish between prohibited products (alcohol, pork, gambling, etc.) and products compliant with Shariah. One of the most important difficulties for investors is to know whether the financial products (banking and insurance sectors) are free of interest and gharar or not.
3. Herding Behavior: Literature Review
Studies on herd behavior in GCC stock markets are recent. All of them have focused on the overall market and a non-sectoral analysis has been conducted. Generally, studies have found evidence of herding by using different methodologies and different time periods. For example, Gabbori (2018) studied the impact of religious events (such as Ramadan, Ashoura, Eid-El-Fitr, Eid-El-Idha, etc.) on herd behavior in Saudi Arabia’s stock market for the period between October 2005–February 2016. She found that there is evidence of herding around religious events during crisis periods only. Based on monthly data for GCC Islamic stock markets, Medhioub and Chaffai (2018) concluded the evidence of herding behavior during down market periods in the case of Qatar and Saudi Arabia. They also found that Kuwaiti and Emirates Islamic stock markets herd with the local conventional stock markets. By using daily stock data for the period between 2010–2016 for GCC Islamic stock markets, Chaffai and Medhioub (2018) suggested the presence of herding behavior in Islamic GCC stock markets during upward market periods. However, they mentioned no evidence of herding behavior during stress market periods. Youssef and Mokni (2018) examined the effect of herding behavior on dependence structure between GCC stock markets. Based on weekly data for the period 2003–2017, they concluded the presence of herding behavior in most of the GCC markets, except for Bahraini and Kuwaiti markets. They showed that the effect of this behavior on the dependence structure is statistically significant and positive. Ulussever and Demirer (2017) examined the evidence of herding behavior in the GCC stock markets for the period 2003–2013. They distinguished the evidence of herding in all the GCC markets except for the Omani and Qatari markets. Moreover, the authors suggest that herding behavior among investors is more prominent during periods of market stress, possibly due to loss aversion by traders. Gavriilidis et al. (2016) made a comparison between Ramadan and non-Ramadan days on herding for seven Islamic countries (Bangladesh, Egypt, Indonesia, Malaysia, Morocco, Pakistan, and Turkey). They found that religious social moods and habits in the period of Ramadan lead to increased herding in most of the countries.
In the same way, Yousaf et al. (2018) studied the impact of Ramadan and financial crises on the herding behavior of the Pakistani stock market. Daily and yearly analyses were conducted. For the daily analysis, the data showed an absence of herding behavior during down and up market periods as well as during high and low volatility in the market. Based on yearly stock analysis, the data showed that herding behavior was detected during the period 2005–2007, but was not detected during the rest of the period.
We relate our study to the study of Medhioub and Chaffai (2018) in which they used the cross-sectional absolute deviation of returns (CSAD) to estimate herding behavior in the Islamic GCC stock market. We include the impact of the conventional cross-sectional absolute deviation of returns and the stock market returns of the GCC market. Additionally, in order to track the behavior of the Islamic GCC stock index under downward and upward market conditions, we divide the sample period into two sub periods by employing the Markov switching approach. Quantile regression analysis was conducted to estimate herding behavior under these two periods. CSAD represents the degree of non-linearity between dispersion and market return, which can be increased or decreased during certain periods where investors follow aggregate market behavior. Chang et al. (2000) argued that CSAD can be used to measure herding, as during downward market periods, there is an increasing association between the dispersion and the market return if investors follow the aggregate market, which can lead then to the evidence of non-linearly between dispersion and market returns. Authors in the domain have agreed that CSAD can be calculated using the following formula:
where:
- CSAD: represents the cross-sectional absolute deviation of returns
- Rit: represents the company i stock’s return at period t
- Rmt: represents the market return at period t
- N: represents the number of stocks at time t
To test evidence of herding, a nonlinear relationship between individual returns and portfolio return was considered by the following regression:
According to regression (1), we accept the evidence of herding behavior when we obtain a statistically negative estimated coefficient indicating a nonlinear relationship between CSAD and during extreme periods. As many studies showed the evidence of asymmetry between stock return dispersion during up market and declining market periods (Chiang and Zheng 2010; Huang et al. 2015, etc.), we introduce in model (1) a dummy variable Dt, which equals 1 if the market return is negative and zero otherwise, to detect differences in herding between up and down market periods. The equations to use are the following:
The GCC market is characterized by the coexistence of both systems: conventional and Islamic. This can lead to the transmission of shocks from one system to another, and this can affect herding. For this reason, we introduce respectively in Equation (2a,b) the impact of the CSAD and the squared market return of the conventional system. Therefore, Equations (3) and (4a,4b) are defined as:
where:
- CSADconv,mt: represents the cross-sectional absolute deviation of conventional returns.
- Rconv,mt: represents the GCC conventional market return at period t.
- RIslam,mt: represents the GCC Islamic market return at period t.
For Equation (3), we can say that a statistically negative coefficient indicates a market-wide herd behavior coming from the Islamic stock market return, while a significant negative coefficient implies that the Islamic stock market herd around the conventional one. In the same way, a statistically positive coefficient indicates a significant impact of conventional market return on the Islamic stock market returns. So, various types of herding behavior will be examined in the Islamic GCC stock market during the period 2013–2018 in the next section.
4. Empirical Results
4.1. Data Description
This analysis is devoted to the Islamic GCC stock market. We considered the daily market prices of the Dow Jones Islamic GCC stock market. The conventional Dow Jones GCC market is also considered to test the influence of the conventional market on the herding of the Islamic market. The stock prices were considered for the periods that cover 15 September 2013 to 14 October 2018. Descriptive statistics of the stock returns and for the CSAD series for both Islamic and conventional markets are reported in Table 22. This table shows that the Islamic market index appeared to be less risky than the conventional market, but also that emerging Islamic indexes appear to show the highest return in mean. Regarding the properties of the series, we also remark significant asymmetry, a negative skewed distribution and a leptokurtic excess for all-time series data. Also, based on the Jarque–Bera test, the normality hypothesis is rejected for all series. Finally, the Augmented Dickey Fuller (ADF) test rejects the unit root hypothesis for all series, while we identified the presence of an ARCH effect in CSAD time series for the banking sector.
4.2. Estimation and Interpretation
After the presentation of descriptive statistics, we now present the results of estimation for selected sectors. With regard to the estimation method, it should be noted that we first used the least squares method and performed the ARCH test. If we reject the constant variance assumption, GARCH processes are employed to model the non-constant volatility. Table 3 presents the results.
According to the estimates of the Islamic banking sector in the GCC countries, which is presented in Table 3, panel A, the results show some differences between down and up market periods. We find that there is no herding behavior for both periods as the estimate of for all models is positive. This indicates that during the time period under investigation, investors in all sectors for this market do not follow the performance of the market and take into account the individual characteristics of the stocks. Results obtained from models (4a) and (4b) are interesting and present the difference between both periods. We find a positive and highly statistically significant for both periods for all sectors, which imply that the conventional sector return dispersions have a dominant influence on the Islamic sector during down and up market periods.
We find a negative and statistically significant at a significance level of 5% during down markets for all sectors. This coefficient is positive and negative but not significant during up market periods respectively for banking and hotels, restaurants and food sectors. The estimate of is negative and statistically significant for insurance and industrial sectors during rising periods. We conclude then that the Islamic sectors herd around the conventional banking sector in the GCC market during periods of stress only, but it herds around the conventional insurance and industrial sectors during both falling and rising periods.
The results confirm the existence of asymmetries between both periods in the Islamic banking sector in the region. The same concept is obtained for the hotels, restaurants, and foods sector. We essentially conclude the evidence of asymmetry between down and up market periods and that, like in the Islamic banking sector, hotels, restaurants, and foods companies compliant with Shariah herd around the conventional sector in the GCC market only during periods of stress.
4.3. Quantile Regression Analysis
Quantile regression analysis is applied to take into account the extreme values characterizing the financial series. As herding behavior can be detected in the tails of the market return distribution, we employ in our analysis the quantile regression method to take into account the presence of outliers. For doing this, we follow the methodology developed by Chiang et al. (2010) and we consider different values of the quantile to obtain quantile estimates for extreme high and low returns. Looking for the results presented in Table 4a,b, we can show a difference between sectors and periods. First, according to Table 4a relative to the up market period, the results show the absence of herding behavior in all sectors, as all estimated coefficients of the variable Rmt2 for the Islamic sector are not statistically significant during rising periods. Additionally, we obtain a negative and statistically significant during up market for all sectors, except hotels, restaurants and foods sectors, indicating then that the Islamic Banking, insurance and industrial sectors herd around the conventional banking sector in the GCC market during periods of rising. This coefficient is significant only for the insurance sector during the down market periods. During down market periods (Table 4b), there is an evidence of herding for all studied sectors in this research except the industrial sector. In fact, we obtain a negative and statistically significant for all sectors.
5. Conclusions
In this paper, our focus is devoted to the study of herd behavior in the Islamic GCC stock market. A sectoral analysis was considered, and we have chosen the sectors of banking insurance, industrial and hotels, restaurants, and foods. As we said, market-wide herding arises when investors ignore individual characteristics of stocks and follow the decision of other investors in the market. We used the approach of Chiang and Zheng (2010) and Christie and Huang (1995) to detect herding in the market. This approach is based on the assumption that herd behavior in the market is consistent with a non-linear relationship between dispersions (CSAD) and the corresponding market return, which means then that the dispersions decrease, or at least increase at a slower rate than that of the market return. By considering a sectoral analysis for the Islamic GCC stock market, we note a slight difference among sectors analyzed in this paper. There is evidence of herding among investors in banking, insurance and hotels, restaurants, and foods sectors for the GCC Islamic stock market during the falling period when we consider a quantile regression analysis. While this concept is not present for all sectors during rising periods, we are interested in the concept of asymmetry between up and down market periods. Our results confirm the evidence of asymmetric concepts between both periods for some sectors. In fact, we found that there is evidence of asymmetry in the herding of conventional sectors on Islamic ones and that there is evidence of herding around the conventional sectors in down market periods for all sectors, except for hotels, restaurants, and foods sectors. We obtain evidence of herding around the conventional sector during up market periods for insurance and industrial sectors.
Overall, the results imply that Islamic GCC market is exposed to irrational herding due to the influence of conventional stock market and the external effects such as financial crisis and large oil price fluctuations which can reduce the psychological expectation effects of investors. Also, the interaction between oil price volatility and stock market fluctuations in the region are considered as important factors that can influence the decision of investors especially during extreme periods. Herd behavior is more pronounced during stress market periods and during large drops in oil price, where irrationality has an important influence on herding for GCC Islamic stock market. The interaction between oil price, GCC stock market and its impact on herding behavior can be the object of future research. Also, suggestions for further research include the study of interdependence between Islamic sectors in the GCC market to examine the influence of some sectors on other sectors in this market. This can give an explanation of why herd behavior is found in some sectors but not others. Furthermore, more sophisticated data and time periods for more sectors can be used to conduct an additional test of herding in the region and can lead to important results that are different from the previous results.
Author Contributions
M.C. and I.M. jointly developed the study design. M.C. conducted the theoretical study. I.M. analyzed the data. Both authors wrote the first draft, revised the paper and edited the revision.
Conflicts of Interest
The authors declare no conflict of interest.
References
- Banerjee, Abhijit V. 1992. A simple model of herd behavior. Quarterly Journal of Economics 107: 797–817. [Google Scholar] [CrossRef]
- Callen, Jeffrey L., and Xiaohua Fang. 2015. Short interest and stock price crash risk. Journal of Banking and Finance 60: 181–94. [Google Scholar] [CrossRef]
- Chaffai, Mustapha, and Imed Medhioub. 2018. Herding behaviour in Islamic GCC stock market: A daily analysis. International Journal of Islamic and Middle Eastern Finance and Management 11: 182–93. [Google Scholar] [CrossRef]
- Chang, Eric C., Joseph W. Cheng, and Ajay Khorana. 2000. An examination of herd behavior in equity markets: An international perspective. Journal of Banking and Finance 24: 1651–79. [Google Scholar] [CrossRef]
- Charles, Amélie, Olivier Darné, and Adrian Pop. 2015. Risk and ethical investment: empirical evidence from Dow Jones Islamic indices. Research in International Business and Finance 35: 33–56. [Google Scholar] [CrossRef]
- Chiang, Thomas C., and Dazhi Zheng. 2010. An empirical analysis of herd behavior in global stock markets. Journal of Banking and Finance 34: 1911–21. [Google Scholar] [CrossRef]
- Chiang, Thomas C., Jiandong Li, and Lin Tan. 2010. Empirical investigation of herding behavior in Chinese stock markets: Evidence from quantile regression analysis. Global Finance Journal 21: 111–24. [Google Scholar] [CrossRef]
- Christie, William G., and Roger D. Huang. 1995. Following the pied piper: do individual returns herd around the market? Financial Analysts Journal 51: 31–37. [Google Scholar] [CrossRef]
- Cote, Jane, and Debra Sanders. 1997. Herding Behavior: Explanations and Implications. Behavioral Research in Accounting 9: 20–45. [Google Scholar]
- Gabbori, Dina. 2018. The impact of Islamic Events on herding Behaviour in Saudi Arabia financial market. Paper presented at 2018 Annual Meeting of Europe Financial Management Associate, Milan, Italy, June 27–30. [Google Scholar]
- Gavriilidis, Konstantinos, Vasileios Kallinterakis, and Ioannis Tsalavoutas. 2016. Investor mood, herding and the Ramadan effect. Supplement. Journal of Economic Behavior and Organization 132: 23–38. [Google Scholar] [CrossRef]
- Goel, Shweta, and Rakesh Srivastava. 2016. Religious grouping as predictor of individual investment behaviour. Review of Knowledge Management 6: 19. [Google Scholar]
- Huang, Teng-Ching, Bing-Huei Lin, and Tung-Hsiao Yang. 2015. Herd behavior and idiosyncratic volatility. Journal of Business Research 68: 763–70. [Google Scholar] [CrossRef]
- Hwang, Soosung, and Mark Salmon. 2004. Market stress and herding. Journal of Empirical Finance 11: 585–616. [Google Scholar] [CrossRef] [Green Version]
- Kahneman, Daniel, and Amos Tversky. 1979. Prospect theory: An analysis of decision under risk. Econometrica 47: 263–92. [Google Scholar] [CrossRef]
- Medhioub, Imed, and Mustapha Chaffai. 2018. Islamic finance and herding behavior: An application to Gulf Islamic stock markets. Review of Behavioral Finance 10: 192–206. [Google Scholar] [CrossRef]
- Miniaoui, Hela, Hameedah Syani, and Anissa Chaibi. 2015. The Impact of financial crisis on Islamic and conventional indices of the GCC countries. Journal of Applied Business Research 31: 357–70. [Google Scholar] [CrossRef]
- Ulussever, Talat, and Rıza Demirer. 2017. Investor herds and oil prices evidence in the Gulf Cooperation Council (GCC) equity markets. Central Bank Review 17: 77–89. [Google Scholar] [CrossRef]
- Yousaf, Imran, Shoaib Ali, and Syed Zulfiqar Ali Shah. 2018. Herding behavior in Ramadan and financial crises: The case of the Pakistani stock market. Financial Innovation 4. [Google Scholar] [CrossRef]
- Youssef, Mouna, and Khaled Mokni. 2018. On the effect of herding behavior on dependence structure between stock markets: Evidence from GCC countries. Journal of Behavioral and Experimental Finance 20: 52–63. [Google Scholar] [CrossRef]
| 1 | See Medhioub and Chaffai (2018), “Islamic finance and herding behavior: an application to Gulf Islamic stock markets”, Review of Behavioral Finance, Vol. 10, Issue: 2, pp. 192–206. |
| 2 | All data were collected from the website: www.investing.com. |
Figure 1.
Dow Jones Islamic Market GCC index.

Figure 2.
CSAD and stock returns for sectoral Islamic and conventional markets.


Table 1.
Index properties.
| Lunch Date | 18 August 2009 | Number of Constituents | 114 |
|---|---|---|---|
| Financial | 38.2% | Saudi Arabia | 66 |
| Basic Materials | 27.1% | Kuwait | 18 |
| Telecommunications | 10% | Qatar | 11 |
| Industrial | 8.8% | United Arab Emirates | 8 |
| Consumer Services | 6.6% | Oman | 8 |
| Others | 9.3% | Bahrain | 3 |
Table 2.
Descriptive statistics.
| Series Statistics | Industrial | Banking | Insurance | Hotels, Restaurants and Foods | ||||
|---|---|---|---|---|---|---|---|---|
| CSAD | Rmt | CSAD | Rmt | CSAD | Rmt | CSAD | Rmt | |
| Mean | 0.0451 | 0.00074 | 0.00601 | 0.000059 | 0.0361 | 0.000156 | 0.0361 | 0.000159 |
| Median | 0.0443 | −0.00024 | 0.00535 | 0.000117 | 0.0361 | −0.000146 | 0.0361 | −0.000146 |
| Std. Dev | 0.0125 | 0.0111 | 0.00337 | 0.00390 | 0.00453 | 0.0051 | 0.00453 | 0.005118 |
| Min | 0.0125 | −0.1275 | 0.00269 | −0.0733 | 0.0167 | −0.0346 | 0.0167 | −0.0346 |
| Max | 0.28335 | 0.06307 | 0.0784 | 0.0732 | 0.0718 | 0.0358 | 0.0718 | 0.0358 |
| Skewness | 1.662 | 1.0011 | 1.302 | −0.107 | 0.296 | 0.743 | 0.296 | 0.7417 |
| Kurtosis | 9.861 | 10.4258 | 5.656 | 5.904 | 9.218 | 10.525 | 9.181 | 10.477 |
| Jarque–Bera | 1816.53 | 1831.73 | 1040.61 | 637.934 | 2057.09 | 3101.92 | 2015 | 3039 |
| ADF | −30.504 | −8.515 | −19.726 | −35.339 | −24.821 | −26.005 | −24.705 | −25.891 |
Table 3.
Regression of cross-sectional absolute deviation of returns (CSADt).
| CSAD Islamic | Down Period | Up Period | ||
|---|---|---|---|---|
| Model (2a) | Model (4a) | Model (2b) | Model (4b) | |
| Panel A: Banking Sector | ||||
| Constant | 0.00577 *** | 0.00266 *** | 0.00439 *** | 0.00405 *** |
| Rmt Islam | −0.146 *** | −0.592 *** | 0.971 *** | 0.938 *** |
| Rmt2 Islam | 0.114 *** | 0.533 *** | 0.578 | 1.011 |
| CSAD Conv | 0.219 *** | 0.0372 * | ||
| Rmt2 Conv | −0.771 ** | 0.775 ** | ||
| ARCH(q) | 2.525 [0.087] | 2.076 [0.126] | 0.339 [0.671] | 0.208 [0.811] |
| R2 | 0.737 | 0.749 | 0.874 | 0.876 |
| Panel B: Insurance Sector | ||||
| Constant | 0.0387 *** | 0.0293 *** | 0.0339 *** | 0.0017 *** |
| Rmt Islam | −1.535 *** | −1.481 *** | −1.302 *** | −1.171 *** |
| Rmt2 Islam | 0.410 *** | 0.525 *** | 0.0456 | 0.0501 |
| CSAD Conv | 0.226 *** | -------- | 0.444 *** | |
| Rmt2 Conv | −0.163 *** | -------- | −0.271 *** | |
| ARCH(q) | 1.66 [0.183] | 1.44 [0.235] | −0.0348 [0.145] | |
| R2 | 0.537 | 0.589 | 0.633 | 0.718 |
| Panel C: Industrial Sector | ||||
| Constant | 0.0444 *** | 0.0247 *** | 0.0445 *** | 0.0302 *** |
| Rmt Islam | −0.912 *** | −0.915 *** | −0.941 *** | −0.842 *** |
| Rmt2 Islam | 0.287 *** | 0.381 | 0.109 *** | 0.119 *** |
| CSAD Conv | 0.361 *** | 0.268 *** | ||
| Rmt2 Conv | −0.326 ** | −0.351 *** | ||
| ARCH(q) | 12.59 *** [0.000] | 11.85 [0.000] | 3.988 ** [0.019] | 3.088 [0.0463] |
| R2 | 0.562 | 0.597 | 0.266 | 0.338 |
| Panel D: Hotels, Restaurants and Foods | ||||
| Constant | 0.0359 *** | 0.0358 *** | 0.0345 *** | 0.0358 *** |
| Rmt Islam | −0.982 *** | −0.985 *** | −0.956 *** | −0.928 *** |
| Rmt2 Islam | 1.134 *** | 0.943 *** | 0.226 *** | 0.191 *** |
| CSAD Conv | 0.0013 *** | 0.319 *** | ||
| Rmt2 Conv | −0.838 *** | −0.00252 | ||
| ARCH(q) | 2.272 ** [0.0462] | 4.395 ** [0.0127] | 0.112 [0.851] | |
| R2 | 0.683 | 0.752 | 0.498 | 0.501 |
*, **, and *** denote the null hypothesis is rejected at one percent, five percent and ten percent level statistical, respectively.
Table 4.
Quantile Regression results under up market periods (a) and down market periods (b).
| (a) | ||||
|---|---|---|---|---|
| CSAD | Banking | Insurance | Industrial | |
| Constant | 0.00432 *** | 0.0554 *** | 0.00878 *** | 0.0132 *** |
| Rmt Islam | 0.741 *** | 0.803 ** | 1.343 *** | 0.945 *** |
| Rmt2 Islam | 0.818 *** | 0.253 *** | −0.203 | −0.623 |
| CSAD Conv | 0.397 *** | 0.708 *** | 0.0408 | 0.232 ** |
| Rmt2 Conv | −0.909 *** | −0.359 ** | −0.0851 | −0.456 *** |
| Pseudo R2 | 0.452 | 0.490 | 0.534 | 0.322 |
| (b) | ||||
| CSAD | Banking () | Insurance ) | ) | Industrial ) |
| Constant | 0.00161 *** | 0.0613 *** | 0.0848 *** | 0.0134 *** |
| Rmt Islam | 0.925 ** | 0.267 | 1.593 *** | 0.431 * |
| Rmt2 Islam | −0.165 *** | −0.584 *** | −0.173 ** | 0.135 *** |
| CSAD Conv | 0.0293 | 0.468 *** | 0.0444 | 0.337 * |
| Rmt2 Conv | −0.0236 | −0.286 *** | −0.0855 | −0.0606 |
| Pseudo R2 | 0.512 | 0.348 | 0.508 | 0.476 |
*, **, and *** denote the null hypothesis is rejected at one percent, five percent and ten percent level statistical, respectively.
© 2019 by the authors. Licensee MDPI, Basel, Switzerland. This article is an open access article distributed under the terms and conditions of the Creative Commons Attribution (CC BY) license (http://creativecommons.org/licenses/by/4.0/).
Share and Cite
MDPI and ACS Style
Medhioub, I.; Chaffai, M. Islamic Finance and Herding Behavior Theory: A Sectoral Analysis for Gulf Islamic Stock Market. Int. J. Financial Stud. 2019, 7, 65. https://0-doi-org.brum.beds.ac.uk/10.3390/ijfs7040065
AMA Style
Medhioub I, Chaffai M. Islamic Finance and Herding Behavior Theory: A Sectoral Analysis for Gulf Islamic Stock Market. International Journal of Financial Studies. 2019; 7(4):65. https://0-doi-org.brum.beds.ac.uk/10.3390/ijfs7040065
Chicago/Turabian StyleMedhioub, Imed, and Mustapha Chaffai. 2019. "Islamic Finance and Herding Behavior Theory: A Sectoral Analysis for Gulf Islamic Stock Market" International Journal of Financial Studies 7, no. 4: 65. https://0-doi-org.brum.beds.ac.uk/10.3390/ijfs7040065
Note that from the first issue of 2016, this journal uses article numbers instead of page numbers. See further details here.