Article

GIS Supported Landslide Susceptibility Modeling at Regional Scale: An Expert-Based Fuzzy Weighting Method

by
Christos Chalkias
1,*,
Maria Ferentinou
2 and
Christos Polykretis
1
1
Department of Geography, Harokopio University, El. Venizelou 70, Athens 17671, Greece
2
Department of Geological Sciences, University of KwaZulu-Natal, Westville, Private Bag X54001, South Africa
*
Author to whom correspondence should be addressed.
ISPRS Int. J. Geo-Inf. 2014, 3(2), 523-539; https://0-doi-org.brum.beds.ac.uk/10.3390/ijgi3020523
Submission received: 21 November 2013 / Revised: 10 March 2014 / Accepted: 19 March 2014 / Published: 2 April 2014

Abstract

:
The main aim of this paper is landslide susceptibility assessment using fuzzy expert-based modeling. Factors that influence landslide occurrence, such as elevation, slope, aspect, lithology, land cover, precipitation and seismicity were considered. Expert-based fuzzy weighting (EFW) approach was used to combine these factors for landslide susceptibility mapping (Peloponnese, Greece). This method produced a landslide susceptibility map of the investigated area. The landslides under investigation have more or less same characteristics: lateral based and downslope shallow movement of soils or rocks. The validation of the model reveals, that predicted susceptibility levels are found to be in good agreement with the past landslide occurrences. Hence, the obtained landslide susceptibility map could be acceptable, for landslide hazard prevention and mitigation at regional scale.

Graphical Abstract

1. Introduction

Landslides are considered as one of the most destructive geohazards [1] as they cause substantial economic, human, and environmental losses in worldwide. Nearly 9% of global natural disasters refer to landslides [2]. The publication of landslide papers has experienced a remarkable increase from the 1990s to the present [3]. Landslide susceptibility assessment can be tricky because it is very difficult to evaluate both the spatial and temporal distribution of past events for large areas mainly due to limitations and gaps of both historical records and geographic information [4,5]. Thus, a considerable amount of recent research has focused on landslide susceptibility assessment [6,7].
Landslide susceptibility (LS) is the propensity of soil or rock to produce various types of landslides [6,8]. LS is usually expressed through cartographic means. Such maps are useful for developing mitigation plans and selecting the most suitable locations for construction. A LS map presents the areas with the potential of landsliding in the future by combining some of the critical factors, which contributed to the occurrence of past landslides [9].
Elevation, slope, aspect, lithology, land cover, precipitation and seismicity were selected as these factors in our study. Among all parameters for LS zonation, elevation, slope and aspect have been recognized as the most important conditioning factors [10,11,12]. The elevation dataset is useful to classify the local relief and locate points of maximum and minimum heights within terrains. Generally, it is well justified through the literature [13,14], that slope gradients have a large impact on landsliding in Peloponnese. The aspect parameter is related to differential weathering, exposure to sunlight and drying winds, and soil moisture. Lithology also plays a key role in landslide activity since different lithologic units have different landslide susceptibility values [15]. Moreover, slope stability is strongly influenced by land cover. Finally, during the last decades, both seismicity [16,17,18] and precipitation factor [19,20,21] have been used as conditioning factors in many LS zonation studies. Considering the geotectonic context in the study area, as well as the climate factor, seismicity and precipitation were included in the study.
Geographic Information Systems (GIS) is an efficient technology to integrate and analyze a large amount of geographical data. During the last decades, many GIS-based LS assessment methods have been developed. General overviews of landslide susceptibility analyses are presented in [22,23,24,25]. LS modeling is divided into qualitative and quantitative methods. The most important difference between these methods is their degree of objectivity.
The qualitative methods depend on the knowledge and previous experience of the experts, and include the geomorphologic analysis [26] and the use of index or parameter maps [27,28]. The quantitative methods depend on numerical expressions of the relationships between conditioning factors and landslide occurrence. They include geotechnical engineering approaches [29,30], statistical analysis [31,32,33], as well as new interesting approaches of LS assessment such as artificial neural network (ANN) and neuro-fuzzy logic methods [34,35].
Some qualitative approaches however incorporate the idea of ranking and weighting the parameters involved, and may turn to be semi-quantitative in nature [34,35,36,37]. The use of quantitative methods should not be seen as an easier option than the quantitative methods. Qualitative methods are of value where the available resources or data dictate that more formalized quantitative assessment would be inappropriate or impractical [38]. Since, the current working scale is a regional, (1:500,000), it was considered by the authors to investigate the application of the expert based fuzzy weighting. It is also worth emphasizing the quality of a landslide risk assessment, is related to the extend the hazards are recognized, understood, and explained, which is not necessarily, related to the extent to which they are quantified [39]. Such an approach, known as trapezoidal fuzzy number weighting (TFNW), was applied in this study. Wang et al. [40] applied a model to produce a LS zonation map using GIS in the Guizhou area (176,167 km2). The weight of each factor (and subclass relatively) caused landslide was achieved by the TFNW approach. Also, Wang et al. [37] presented a weighting method, integrating objective weight (based on entropy) with subjective weight (based on TFNW) to assess the LS under GIS environment. The distinction of this method is that a landslide inventory is not compulsory, because the weightings are assigned based on the field knowledge of an experienced geomorphologist [41].
The main aim of this paper was to produce a regional landslide susceptibility map at regional scale using a semi-quantitative analysis approach. The performance of this model was evaluated in Peloponnese peninsula, Greece. Furthermore, validation analysis was implemented to estimate the prediction ability of the applied model.

2. Study Area

The proposed method was evaluated in Peloponnese, which constitutes the largest peninsula of Greece and one of its nine geographical departments. It is located in the southern part of Greece (Figure 1), and is connected with the mainland through the Isthmus of Corinth. The total area of Peloponnese is 21,439 km2, and its population stands at 1,086,935 inhabitants (Hellenic Statistical Agency, 2001). Agricultural, forest and semi-natural areas cover the main part of Peloponnese, whereas urban is the dominant land cover in the coastal zone of the peninsula. The climate is typical Mediterranean with a hot and relatively dry summer between June and August, and a wet season during autumn, winter and spring [42].
Figure 1. The location of the study area (Peloponnese peninsula) and the landslide validation dataset.
Ijgi 03 00523 g001
Peloponnese has a complex geomorphology, with mountainous inland, many coastal cliffs in the south, and basins, coastal beaches, lakes and inland basins in west and southeast coasts. The slopes vary from gentle to very steep, while the drainage network is well developed, and is highly controlled by fault tectonics. The study area belongs to an active zone with tectonism expressed through faults, thrust zones and folds. The main lithological formations in the study area are (a) carbonate rocks (44%): limestones, dolomites and marbles; and (b) Neogene sediments (22%): usually marls, sandstones and mudstones. In these formations the majority of landslides have occurred.
Peloponnese is a region highly damaged by the occurrence of severe natural disasters such as earthquakes, floods, landslides, and forest fires. Heavy rainfall and earthquakes have triggered several landslide events, mainly in northern and western areas of the peninsula [13,43,44]. Many serious events are related to major fault tectonics and to unstable zones located in steep slopes. In addition, the human interventions for the construction of roads have played a key role in landslide activation.
Accordingly, the study area forms a complex physiographic region where all conditioning factors of landslides present a high spatial variability. The high spatial variability of the factors is related to the complexity of the local conditions. These conditions reflect the regional characters of landslide manifestation process. Moreover, this variability permitted the creation of distinguishable classes in order to implement experts’ assessment of LS for each class.

3. Data—Methods

In order to accomplish the LS analysis in the study area a spatial database was designed and developed, and spatial analysis tools were implemented within GIS environment with the use of ArcGIS (ver. 9.3) software package. This database comprises two main parts: (a) the datasets with the background geographic conditions (slope, lithology, land cover, etc.); and (b) the landslide (validation) dataset.

3.1. Data

In this study, elevation, slope, aspect, seismicity, precipitation, lithology and land cover have been selected as the conditioning factors on landslide susceptibility. Although there are no standard guidelines for selecting these parameters [23], the nature of the study area, the scale of the analysis, and data availability were taken into account [25]. The seven factors used in current research were selected on the basis of the aforementioned criteria while literature outputs and general guidelines for GIS-based studies were also considered [11,12,17,20,25].
Most of these layers consist of continuous data, thus they need to be reclassified into discrete subclasses. Here, the categorization of all conditioning factors was implemented as following: the equal area categorization (in five classes) was implemented for the factors with continuous values (elevation, slope, seismicity, precipitation). For the landcover, lithology, and aspect we preserved all the classes of the nominal scale.
The lithological map of the study area was created from the Geological Map of Greece with scale 1:500,000 (IGME, 1983). The land-cover layer (with cell size 250 × 250 m) in the region of Peloponnese was based on CORINE program (Coordinate of Information on the Environment). The study area was classified by following the level-1 classification scheme of the CORINE data [45].
The Digital Elevation Model (DEM) was the key to generate various topographic parameters related to the landslide activity of the area under investigation. Here, we used the DEM from SRTM (Shuttle Radar Topography Mission) database, with cell size 90 × 90 m. From this DEM, elevation (0–2367 m), slope angle (0–54°) and slope aspect have been extracted. The precipitation data (339–1655 mm) used in this study refers to the mean annual precipitation (MAP) during the period from 1950 through 1974 (source: Public Power Company, PPC, cell size: 250 × 250 m). MAP is the average of the available long-term records [46]. The seismic factor (0.05–3.95 m/s2) was produced from the map of expected Peak Ground Acceleration (PGA) with 475-year return period (10% probability of exceedance in 50 years). PGA is the absolute maximum amplitude of recorded acceleration [47]. The source of this map (with cell size 250 × 250 m) was the Technical Chamber of Greece (TCG, 1992). Landslide distribution is strongly affected by seismicity and especially by ground acceleration, while magnitude—distance relations have been established for earthquake induced landslides [48]. Previous studies emphasized the need of incorporating dynamic factors (Seismicity, Rainfall) with other “static” factors for Landslide Susceptibility Zonation mapping in areas whereas these factors are playing an important role not only in the reactivation of old landslides but in the development of new ones [49,50].
Given that the implementation of the semi-quantitative analysis proposed here is not based on a landslide inventory, a validation dataset (Figure 1) was only used for the verification of the results produced from the model. This validation dataset consisted of 141 landslides (presented as point features in the centroid of each landslide) throughout the study area which were derived from two main landslide databases: (a) a database maintained by Institute of Geology and Mineral Exploration (IGME) formed only from the recent historical records, covering a time period 1910 to 1995 [51], and (b) a database—with landslide events that occurred from 1995 through 2003—developed on the basis of field work and aerial photograph interpretation. The landslides under investigation have more or less same characteristics: lateral based and downslope movement of soils or rocks. Seismic triggered landslides, occur in the vicinity of active faults, and usually related to other secondary seismic events, like soil liquefaction, subsidence of the coastal strip, and rock falls [48,52,53]. Subaqueous, and liquefaction events are not included in this study. Rainfall triggered landslides usually are rapid short moving events, while slow short-moving type also occur including extensive instability zones [54]. They occur in gentle natural slopes where the translational type predominates. The occasional planar slip surfaces are located in the weathered zone of marls or flysch while ground water level reaches the surface of the slope during heavy rainfall. The most critical landslide—prone formations regarding lithology, and structure are flysch and neogene sediments, while schist and cherts significantly contribute in landslide phenomena [55]. Slides which usually take place in the gentle slope of flysch mantle are typically quite shallow and take form of a sheet of weathered zone sliding on a slip surface parallel to the ground [56]. In line with [57,58], in this paper the term landslide is used for translational and rotational earth slides, which were recorded in the validation dataset. These events vary consistently in volume, from some thousands of m3 to several million m3 [55], and depicting small to extremely large magnitude, according to [59] classification.

3.2. Expert-Based Fuzzy Weighting (EFW) Method

The expert-based, semi-quantitative method that used in this paper is a modification of the weighted linear combination. This method develops a LS map by combining various factor maps corresponding to the conditioning parameters [36]. Here, in order to quantify the impact of various classes for the standardization of each factor, we used the trapezoidal fuzzy number weighting (TFNW). The details of this approach have been described by [40]. Thus, we introduced an expert-based fuzzy weighting (EFW) procedure. The main steps of this procedure are presented below:
(a)
Definition of linguistic variables and fuzzy numbers for LS classes in order to incorporate uncertainty in the analysis. All fuzzy numbers expressed as (ak, bk, ck, dk). The definition of these fuzzy numbers is shown in Table 1.
Table 1. Linguistic variables and their correspondence fuzzy numbers and membership.
Fuzzy Variables (Susceptibility)Fuzzy NumbersFuzzy Membership
Very High (VH)(7, 10, 10, 10) Ijgi 03 00523 i001
High (H)(5, 7, 7, 10)
Moderate (M)(2, 5, 5, 8)
Low (L)(0, 3, 3, 5)
Very Low (VL)(0, 0, 0, 3)
(b)
Next, we invited three experts, with experience and scientific knowledge of the study area, to list a linguistic importance weight for every class of each factor. From these linguistic judgments we obtained the corresponding fuzzy numbers. Such judgments are inevitably subjective, but, by proposing, several possible scenarios, followed by the systematic testing and elimination of options, as a result of additional investigation and discussion, it is possible to develop reliable estimates. Experimental evidence suggests that group judgments; appear to be more accurate than judgments of a typical, group member [38]. The sum of these numbers is still a fuzzy number. Thus, we proceeded to the computation of the aggregated fuzzy weights of individual subclasses (Table 2).
(c)
After the defuzzification of the fuzzy weights of individual landslide susceptibility subclasses, we proceed to the computation of the normalized weights and the construction of the weight vector.
For example, the standardization of the first category (“artificial surfaces”) for the land cover (LC) factor is based on three expert fuzzy variables D1, D2, D3 with D1 = (5, 7, 7, 10), D2 = (2, 5, 5, 8), and D3 = (2, 5, 5, 8). Thus, the aggregated fuzzy weight for this class is w′LC,1 = ((D11 + D21 + D31)/3), ((D12 + D22 + D32)/3, ((D13 + D23 + D33)/3), ((D14 + D24 + D34)/3)) = (3.0, 5.7, 5.7, 8.7). Similarly, the aggregated fuzzy weights for the other two categories of LC factor are w′LC,2 = (4.0, 6.3, 6.3, 9.3) and w′LC,3 = (0.7, 3.7, 3.7, 6.0). The defuzzified values of the aggregated fuzzy weights are dw′LC,1 = ((3.0 + 5.7 + 5.7 + 8.7)/4) = 5.8, dw′LC,2 = ((4.0 + 6.3 + 6.3 + 9.3)/4) = 6.5 and dw′LC,3 = ((0.7 + 3.7 + 3.7 + 6.0)/4) = 3.5. Accordingly, the normalized weights are wLC,1 = 0.37, wLC,2 = 0.41 and wLC,3 = 0.22 and the weighted vector for the land cover factor is wLC = (0.37, 0.41, 0.22). The weighted vector provides the standard values for each class of all factors. By implementing the same procedure described previously, we used expert-based linguistic variables to calculate the weight of importance for each factor (Table 3).
Table 2. Categories, fuzzy values and weights for landslide related factors.
Layers (Factors)Categories (Classes)(Experts) Fuzzy ValueEFW Weight
Land coverArtificial surfaces(H,M,M)0.37
Agricultural areas(M,H,H)0.41
Forest and semi-natural land(L,L,M)0.22
LithologyPhyllites/Gneiss (metamorphic)(L,M,L)0.08
Limestones—Marbles(L,L,L)0.06
Volcanic(M,M,M)0.11
Schists (metamorphic)(M,M,M)0.11
Neogene(H,VH,M)0.16
Tertiary(H,VH,M)0.16
Flysch(VH,VH,VH)0.22
Cherts—Schists(M,L,M)0.10
Precipitation<750 mm(L,VL,M)0.09
750–880 mm(M,L,H)0.16
881–990 mm(M,M,H)0.19
991–1170 mm (H,H,VH)0.26
>1170 mm(VH,VH,VH)0.30
Seismic <2.20 m/s2(L,VL,L)0.08
acceleration2.20–2.50 m/s2(L,L,L)0.10
2.51–2.90 m/s2(M,M,M)0.19
2.91–3.10 m/s2(H,H,H)0.28
>3.10 m/s2(VH,VH,VH)0.35
Elevation<132 m(L,VL,L)0.08
132–330 m(L,L,M)0.14
33–600 m(H,M,M)0.23
601–880 m(Μ,H,H)0.26
>880 m(M,VH,H)0.29
Slope<2°(VL,VL,L)0.06
2–6°(L,L,L)0.11
7–10°(M,M,M)0.19
11–15°(H,H,H)0.28
>15°(VH,VH,VH)0.36
AspectFlat(L,VL,M)0.11
North(H,H,M)0.24
East(M,M,M)0.19
South(M,M,M)0.19
West(H,H,H)0.27
Table 3. Weight values for each factor according to the expert-based fuzzy weighting (EFW) method.
ParameterParameter Importance (Expert Judgement)EFW Weight
Land cover(M,M,H)0.11
Lithology(VH,VH,H) 0.17
Precipitation(VH,VH,VH)0.18
Seismicity(H,H,H)0.15
Elevation(M,L,H)0.09
Slope(VH,VH,VH)0.18
Aspect(H,M,M)0.12
VL: Very Low, L: Low, M: Moderate, H: High, VH: Very High.
(d)
The last step is the aggregation of relative values, and the generation of the final expert-based landslide susceptibility map (Figure 2). This step was implemented by using the weighted linear combination method [60]. Therefore, each standardized factor is multiplied by its weight, and the results are summarized according to the following formula:
Ijgi 03 00523 i002
where, LSExpert is the final landslide susceptibility score calculated for each pixel, fwi is the weight of the factor and wi,j is the standardized score for the class j of the factor. We classified the final LS map into five discrete categories: “Very Low”, “Low”, “Moderate”, “High” and “Very High” landslide susceptibility according to the standard deviation [23]. This method uses the mean value to generate class breaks by adding or subtracting one standard deviation at a time [10]. Moreover, in order to maintain five classes, we embedded extremely low and high outliers into “Very Low” and “Very High” susceptibility classes respectively.
Figure 2. The landslide susceptibility map produced by the EFW model.
Ijgi 03 00523 g002

4. Results

The overall results of the EFW analysis are presented in Table 2 and Table 3. According to the experts, the most important conditioning factors are precipitation, slope and lithology with weight values 0.18, 0.18 and 0.17, respectively. Importance evaluation for each subclass is more or less linear for factors with continuous values (slope, precipitation, seismicity). With regards to these factors, the experts estimated that high values are related to high landslide susceptibility. As far as lithology, land cover and aspect (factors with nominal values) are concerned, “flysch”, “agricultural areas” and “west facing” subclasses have the highest importance values (i.e., weight values of 0.22, 0.41 and 0.27, respectively). On the contrary, “limestones”, “forest and semi-natural land” and “Flat facing” subclasses were found to have the lowest importance values relating to LS mapping (i.e., weight values of 0.06, 0.22 and 0.11 respectively).
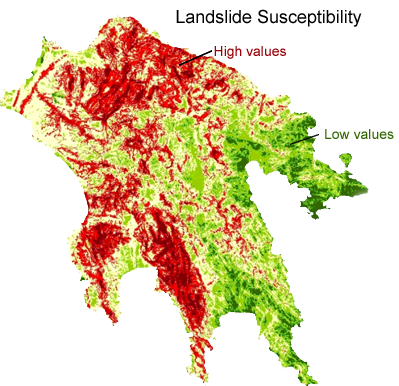
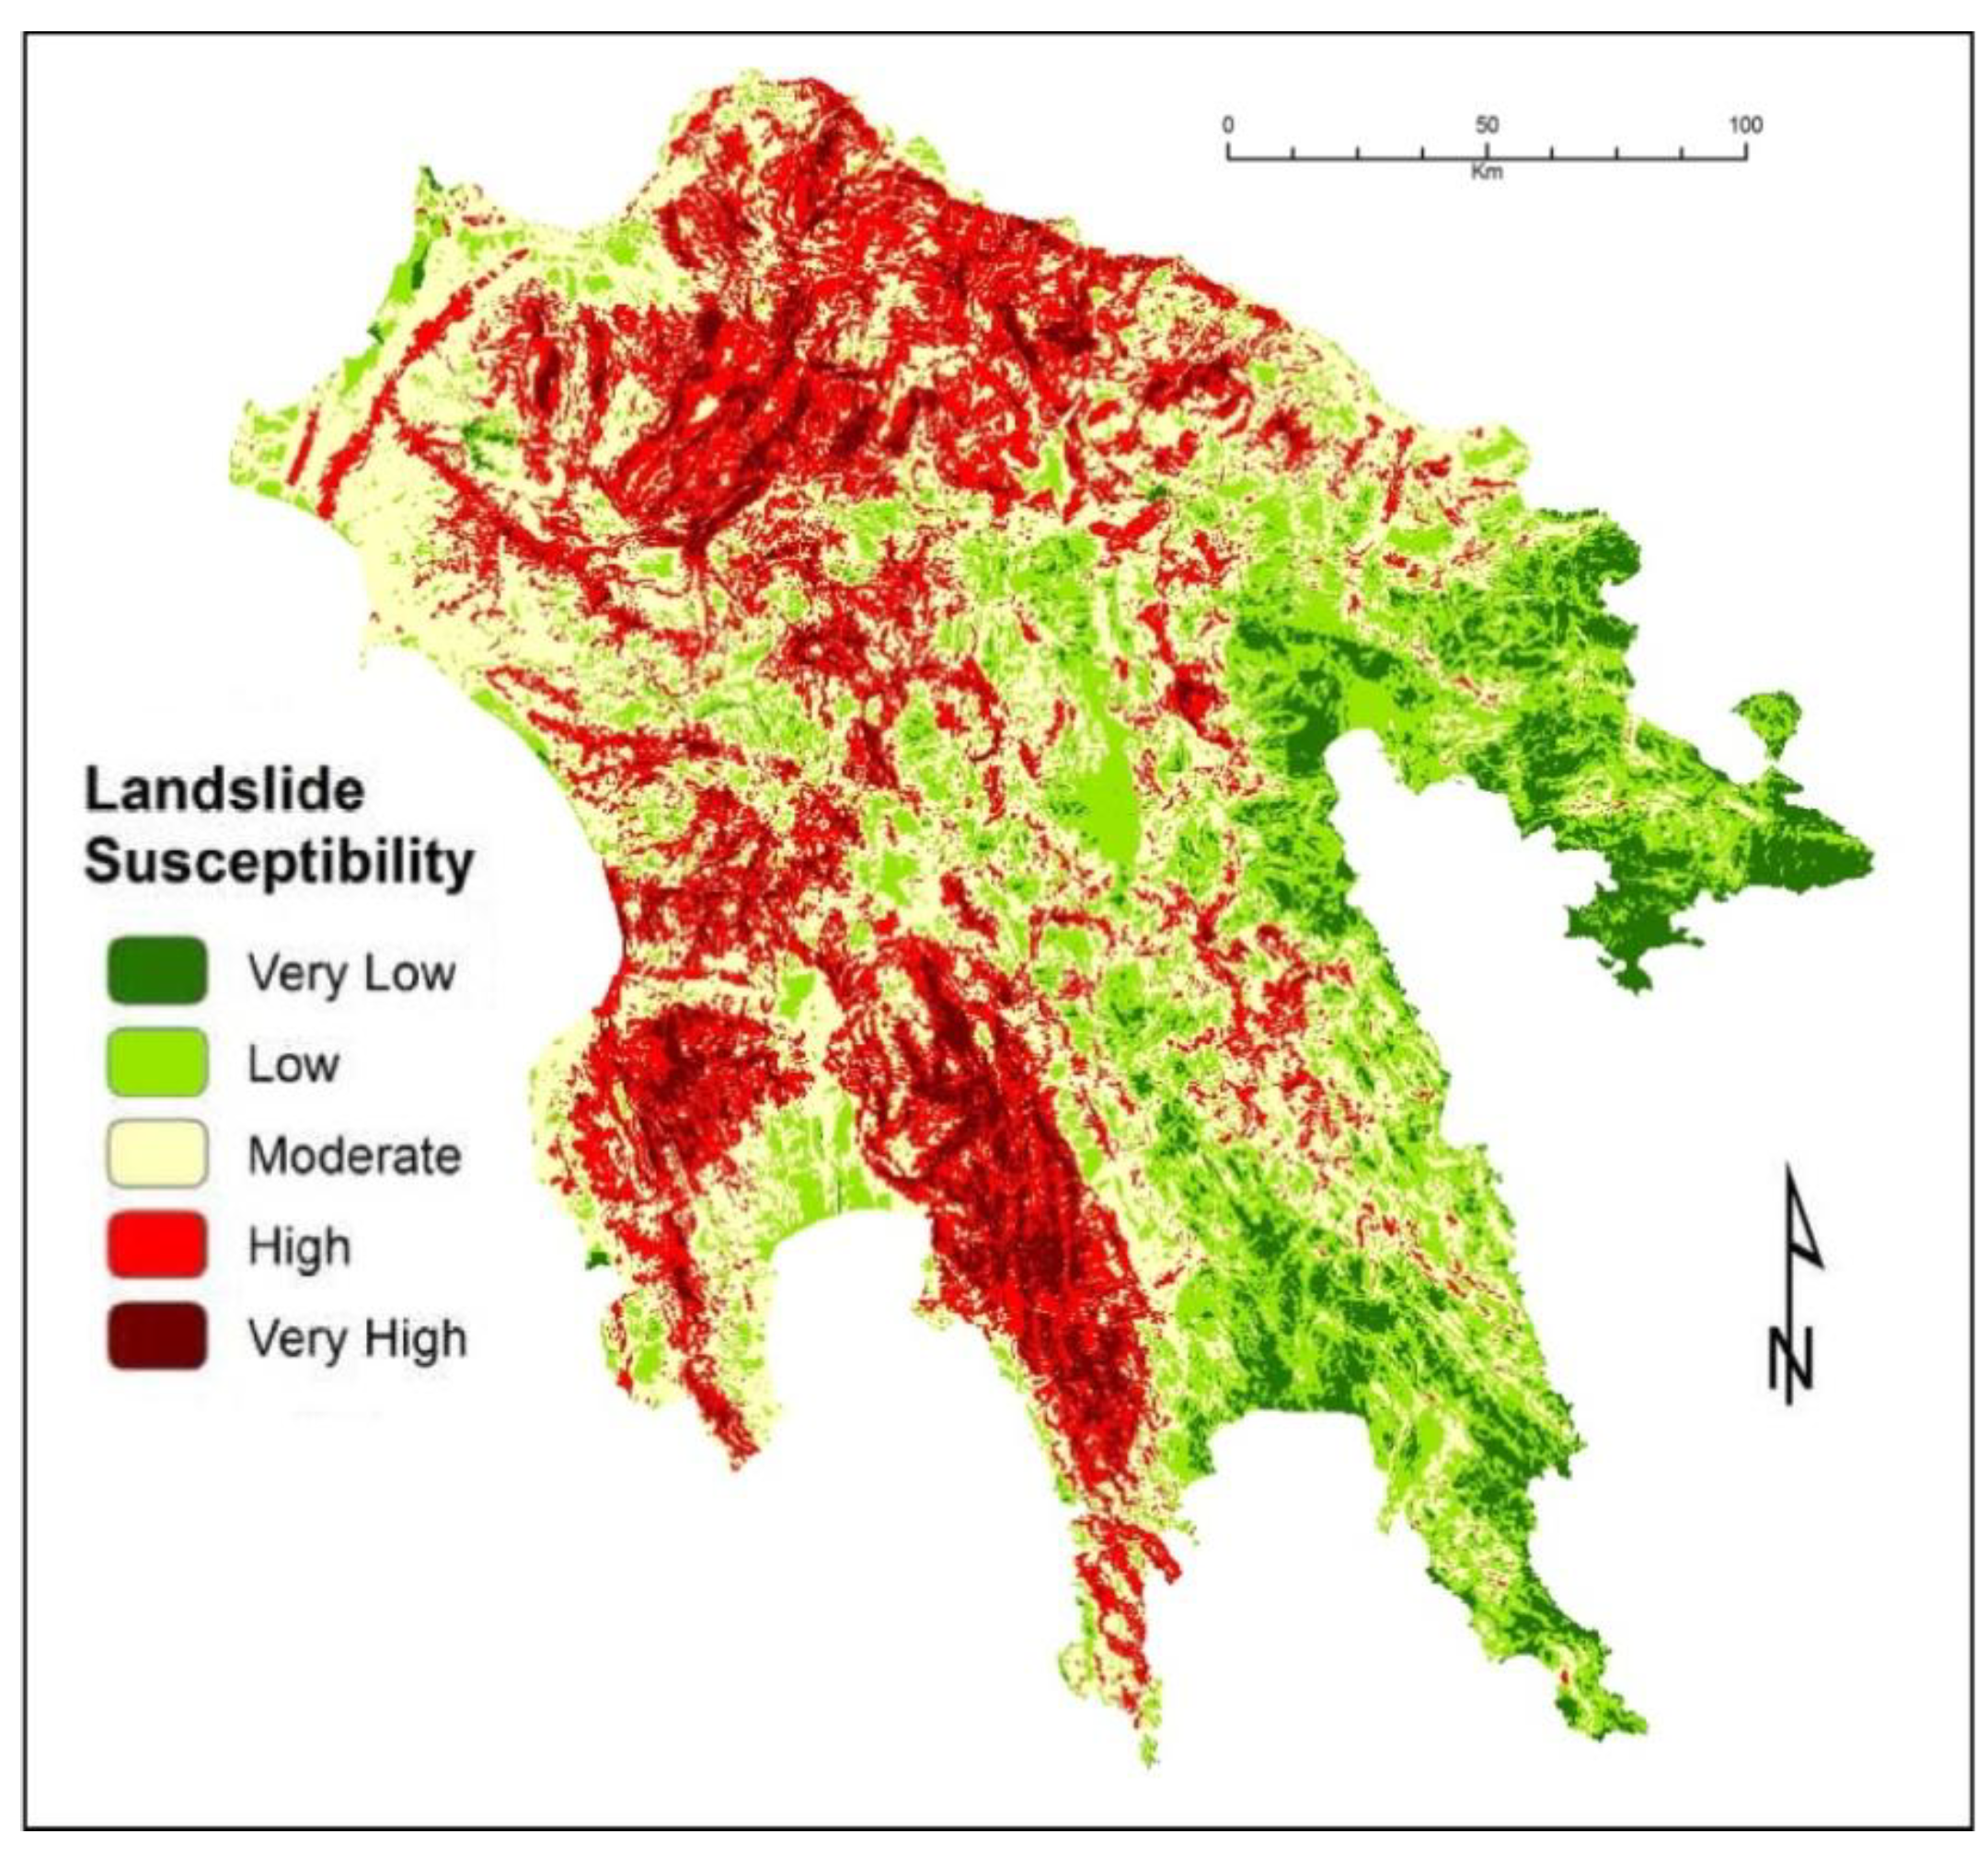
The output LS map (Figure 2) from the EFW model shows that 25% (5239 km2) and 7% (1370 km2) of the study area were classified as “High” and “Very High” susceptibility zones, respectively. The same map also shows that the northern, central and south-southwestern parts of the study area are susceptible at “High” and “Very High” scale. Finally, the overlay of the final LS map with the landslide validation dataset indicated that 16%, 38% and 38% (total: 92%) of the landslide events fall within “Very High”, “High” and “Moderate” landslide susceptibility zones (in total 71% of the study area), respectively. It is notable that according to the used model only 7% and 1% of the landslide events fall in “Low” and “Very Low” susceptibility zones, respectively.
To estimate the sensitivity of the weighting for the aforementioned method sensitivity analysis was implemented by changing the weight of the three most important factors (slope, MAP and lithology) and examine the effect of this change on the output LS map [61].
Thus, a series of evaluation runs were conducted. In these tests the weight of the most important factor was altered (±5%, 10% and 20%). At the same time, the weights of the other criteria were adjusted proportionally to satisfy the rule which requires all weights to sum to one. Accordingly, for each simulation a series of evaluation LS maps was generated and compared with the LS output map of the base run. Finally, a summary table (Table 4, Table 5 and Table 6) was created to quantify the changes in the evaluation maps in comparison with the base map.
Table 4. Changes in evaluation map (%) (Slope factor sensitivity analysis).
Weight Change %Change in Classification
M to HH to MM to LL to MH to L/L to H
−208.78%6.55%6.03%6.08%0.14%
−107.57%6.72%5.92%6.21%0.13%
−57.48%6.52%5.98%6.17%0.13%
+57.43%6.38%6.11%5.97%0.14%
+107.40%6.48%6.07%6.05%0.14%
+208.78%6.55%6.03%6.08%0.14%
Table 5. Changes in evaluation map (%) (mean annual precipitation (MAP) factor sensitivity analysis).
Weight Change%Change in Classification
M to HH to MM to LL to MH to L/L to H
−207.47%6.71%6.19%6.33%0.14%
−107.30%6.51%5.99%6.21%0.13%
−57.47%6.39%6.00%6.21%0.13%
+57.30%6.48%5.92%5.90%0.13%
+107.61%6.38%5.84%5.98%0.13%
+207.74%6.22%5.99%5.92%0.15%
Table 6. Changes in evaluation map (%) (Lithology factor sensitivity analysis).
Weight Change %Change in Classes of Landslide Susceptibility
M to HH to MM to LL to MH to L/L to H
−207.59%6.32%5.97%5.96%0.13%
−107.50%6.30%5.84%5.94%0.13%
−57.21%6.45%5.88%5.96%0.13%
+57.48%6.42%6.17%5.83%0.14%
+107.48%6.52%6.20%6.08%0.14%
+207.44%6.76%6.19%6.13%0.13%
The results of the sensitivity analysis show that there is very limited area (less than 0.2%) with very significant change (more than one susceptibility class) from each original rank on the base run. Moreover, slope is the most sensitive criterion which causes susceptibility class modification equal to 27.6% when its weight changes for 20%. The greatest change (8.78%) in this run was from the class Moderate to the class High. The greatest variation throughout sensitivity analysis occurred in the classes Moderate, High and Low. Classes Very High and Very Low are relatively stable.
A standard validation analysis was additionally performed, using the validation dataset in order to estimate the overall performance of the LS model in the study area. For the validation of the output from our analysis, the receiver operating characteristics (ROC) curve was drawn, and the area under curve (AUC) value was calculated for the proposed model. In practice, the AUC performs very well and is often used when a general measure of predictiveness is desired [62]. ROC analysis is considered as a powerful method for the validation of landslide susceptibility models [19,63]. The AUC value ranges from 0.5 to 1.0. The ideal model yields an AUC value close to 1.0 (perfect fit), whereas a value close to 0.5 indicates an inaccurate model (random fit).
Figure 3 shows the ROC curve of EFW model for the validation dataset. The AUC value of 0.70 indicates a reasonable prediction ability of the model.
Figure 3. Receiver operating characteristics (ROC) curve for the EFW model.
Ijgi 03 00523 g003

5. Discussion and Conclusions

This study applied an expert-based (EFW) method to prepare a landslide susceptibility map at regional scale (Peloponnese peninsula, Greece). To achieve this objective, seven conditioning factors (elevation, slope, aspect, seismicity, precipitation, lithology and land cover) were taken into consideration.
For the creation of the EFW susceptibility map all the factors were combined, after expert-based weighting. For this model the landslide inventory map is not needed. This kind of analysis is purely subjective. To some extent, opinions may change for every individual expert and thus may be subjected to cognitive limitations with uncertainty and subjectivity. However, methods depend on expert opinions are often useful for regional assessments [22]. Most of the quantitative/semi-quantitative landslide susceptibility research follows similar strategy with the proposed one by inviting a limited number of experts (See among others [24,64]). The main issue is not to invite as many scientists as possible but to invite experts with detailed knowledge of the landslides in the area under investigation and to ensure an overall consensus of their evaluation about the importance of the factors involved.
With the implementation of ROC analysis we can assess the prediction accuracy of a model. In this study, the empiric ROC area for the EFW model was estimated to be 0.70 for the validation dataset (Figure 3). Then, there is 70.0% agreement between prepared LS map and landslide locations of the validation dataset, which is a reasonable result, taking into consideration the scale of analysis. Recently, LS analyses in the international literature have used ROC analysis, not only to validate the landslide susceptibility mapping models, but also to compare their prediction capabilities. Many researchers—among others [65,66]—have implemented expert-based approaches for LS mapping at regional scale with fair to good results (AUC values: 0.65–0.81).
The implementation of the expert-based model in the study area revealed that there are different zones within Peloponnese, which seem to configure various landslide susceptibility clusters (Figure 2). The high susceptibility values are mainly located in the northern, central and south-southwestern Peloponnese. According to the final LS map, the “Very High” susceptibility zone covers a significant part of the study area (7% of the total area). Most of the landslide events of validation dataset occur in areas with elevation lower than 880 m, slope angle from 7° to 15°, north or west facing, high levels of annual precipitation (991–1170 mm) and high seismic acceleration (2.91–3.10 m/s2).
The most important factors for the LS zonation in the study area are precipitation, slope and lithology. It seems that the incorporation of dynamic factors (precipitation, seismicity) in this regional analysis was more or less beneficial to the assessment of landslide susceptibility.
The main idea behind this research strategy is to investigate how this “subjective” method is effective in this scale. The findings of our analysis are more or less acceptable. Thus, in a future worl, we intent to combine this method with statistical modeling (based on landslide inventories) in a “hybrid approach”.
Some basic characteristics, limitations and assumptions of the method have to be pointed out. A limitation of the proposed method is that the LS assessment is dependent on the subjective judgment of the experts and can be sensitive to slight differences in the weights associated with factors [64,67,68]. To deal with this problem the sensitivity analysis was performed. Secondly, as the analysis based on medium-scale datasets, the results are unsuitable for detailed site-oriented specific analysis. At large scales, more exhaustive datasets and detailed geotechnical information are required. The subclass division of the conditioning factors is considered as the most subjective aspect of slope instability zonation methods. However, using some consistency (e.g., the adoption of similar classification approach) in different study areas may help to reduce the effects of subjectivity. Additionally, the proposed approach does not insist on consensus but rather formalizes a synthetic outcome from experts’ judgments. Furthermore, it should be mentioned that, according to our analysis, the output LS map presents only the predicted spatial distribution of landsliding. It does not present the temporal probability of landsliding. Therefore, the result from this paper should be used in the first stage of preliminary susceptibility mapping. Despite these limitations, the used method can produce trustworthy landslide susceptibility maps at regional scale. This is very useful information for local authorities and decision makers in order to target their mitigation strategies.

Acknowledgments

Authors thank the anonymous reviewers as well as Yuanyuan Yang, associate editor of IJGI, for their comments and constructive review to this paper.

Author Contributions

CC conceived of the study, designed the analysis, carried out its implementation and drafted the manuscript. MF participated in the design and implementation of the study and in the preparation of the validation dataset. CP participated in the spatial database creation, and in the implementation of sensitivity analysis. CC, MF and CP participated in the revision of the manuscript. All authors read and approved the final manuscript.

Conflicts of Interest

The authors declare no conflict of interest.

References

  1. Zillman, J. Report by the Director of Meteorology on the Bureau of Meteorology’s Forecasting and Warning Performance for the Sydney Hailstorm of 14 April 1999. Bur. Meteorol. 1999. Available online: http://www.bom.gov.au/inside/services_policy/storms/sydney_hail/hail_report.shtml (accessed on 18 November 2013).
  2. Gokceoglu, C.; Sonmez, H.; Nefeslioglu, H.A.; Duman, T.Y.; Can, T. The 17 March 2005 Kuzulu landslide (Sivas, Turkey) and landslide-susceptibility map of its near vicinity. Eng. Geol. 2005, 81, 65–83. [Google Scholar] [CrossRef]
  3. Gutiιrrez, F.; Soldati, M.; Audemard, F.; Balteanu, D. Recent advances in landslide investigation: Issues and perspectives. Geomorphology 2010, 124, 95–101. [Google Scholar] [CrossRef]
  4. Van Westen, C.J.; van Asch, T.W.J.; Soeters, R. Landslide hazard and risk zonation—Why is it still so difficult? Bull. Eng. Geol. Environ. 2006, 65, 167–184. [Google Scholar] [CrossRef]
  5. Vergari, F.; Della Seta, M.; Del Monte, M.; Fredi, P.; Lupia Palmieri, E. Landslide susceptibility assessment in the Upper Orcia Valley (Southern Tuscany, Italy) through conditional analysis: A contribution to the unbiased selection of causal factors. Nat. Hazard. Earth Syst. Sci. 2011, 11, 1475–1497. [Google Scholar] [CrossRef]
  6. Guzzetti, F.; Carrara, A.; Cardinali, M.; Reichenbach, P. Landslide hazard evaluation: A review of current techniques and their application in a multi-scale study central Italy. Geomorphology 1999, 31, 181–216. [Google Scholar] [CrossRef]
  7. Van Westen, C.J. The modeling of landslide hazards using GIS. Surv. Geophys. 2000, 21, 241–255. [Google Scholar] [CrossRef]
  8. Crozier, M.J.; Glade, T. Landslide Hazard and Risk: Issues, Concepts and Approach. In Landslide Risk Assessment; Glade, T., Anderson, M.G., Crozier, M.J., Eds.; John Wiley: New York, NY, USA, 2005; pp. 1–40. [Google Scholar]
  9. Santacana, N.; Baeza, B.; Corominas, J.; De Paz, A.; Marturia, J. A GIS-based multivariate statistical analysis for shallow landslide susceptibility mapping in La Pobla de Lillet area (Eastern Pyrenees Spain). Nat. Hazard. 2003, 30, 281–295. [Google Scholar]
  10. Ayalew, L.; Yamagishi, H. The application of GIS-based logistic regression for landslide susceptibility mapping in the Kakuda-Yahiko Mountains Central Japan. Geomorphology 2005, 65, 15–31. [Google Scholar] [CrossRef]
  11. Magliulo, P.; Lisio, A.; Russo, F.; Zelano, A. Geomorphology and landslide susceptibility assessment using GIS and bivariate statistics: A case study in southern Italy. Nat. Hazard. 2008, 3, 411–435. [Google Scholar] [CrossRef]
  12. Hasekioǧullari, G.D.; Ercanoglu, M. A new approach to use AHP in landslide susceptibility mapping: A case study at Yenice (Karabuk, NW Turkey). Nat. Hazard. 2012, 63, 1157–1179. [Google Scholar] [CrossRef]
  13. Rozos, D.; Bathrellos, G.D.; Skillodimou, H.D. Comparison of the implementation of rock engineering system and analytic hierarchy process methods, upon landslide susceptibility mapping, using GIS: A case study from the Eastern Achaia County of Peloponnesus, Greece. Environ. Earth Sci. 2011, 63, 49–63. [Google Scholar] [CrossRef]
  14. Papathanassiou, G.; Valkaniotis, I.; Ganas, A.; Pavlides, S. GIS-based statistical analysis of the spatial distribution, of earthquake-induced landslides in the island, of Lefkada, Ionian Islands, Greece. Landslides 2012, 10, 771–783. [Google Scholar]
  15. Carrara, A.; Cardinali, M.; Detti, R.; Guzzetti, F.; Pasqui, V.; Reichenbach, P. GIS techniques and statistical models in evaluating landslide hazard. Earth Surf. Process. Landf. 1991, 16, 427–445. [Google Scholar] [CrossRef]
  16. Komac, M.; Ribicic, M. Landslide susceptibility map of Slovenia at scale 1:250,000. Geologija 2006, 49, 295–309. [Google Scholar] [CrossRef]
  17. Das, O.; Sonmez, H.; Gokceoglu, C.; Nefeslioglu, H. A study on the effect of the ground acceleration on landslide susceptibility maps. Geophys. Res. Abstr. 2010, 12. EGU2010-5885-1. [Google Scholar]
  18. Pareek, N.; Sharma, M.L.; Arora, M.K. Impact of seismic factors on landslide susceptibility zonation: A case study in part of Indian Himalayas. Landslides 2010, 7, 191–201. [Google Scholar] [CrossRef]
  19. Nandi, A.; Shakoor, A. Preparation of a Landslide Susceptibility Map of Summit County, Ohio, USA, Using Numerical Models. In Proceedings of the 10th IAEG Congress, Nottingham, UK, 6–10 September 2006. Paper No. 660..
  20. He, Y.; Beighley, R.E. GIS-based regional landslide susceptibility mapping: A case study in southern California. Earth Surf. Process. Landf. 2008, 33, 380–393. [Google Scholar] [CrossRef]
  21. Feizizadeh, B.; Blaschke, T.; Rafiq, L. GIS-Based Landslide Susceptibility Mapping: A Case Study in Bostan Abad County, Iran. In Proceedings of the GI4DM Conference, Antalya, Turkey, 3–8 May 2011.
  22. Van Westen, C.J.; Rengers, N.; Soeters, R. Use of geomorphological information in indirect landslide susceptibility assessment. Nat. Hazard. 2003, 30, 399–419. [Google Scholar]
  23. Ayalew, L.; Yamagishi, H.; Maruib, H.; Takami, K. Landslides in Sado Island of Japan: Part II. GIS-based susceptibility mapping with comparisons of results from two methods and verifications. Eng. Geol. 2005, 81, 432–445. [Google Scholar]
  24. Thiery, Y.; Malet, J.-P.; Sterlacchini, S.; Puissant, A.; Maquaire, O. Landslide susceptibility assessment by bivariate methods at large scales: Application to a complex mountainous environment. Geomorphology 2007, 92, 38–59. [Google Scholar] [CrossRef] [Green Version]
  25. Yalcin, A. GIS-based landslide susceptibility mapping using analytical process and bivariate statistics in Ardesen (Turkey): Comparisons of results and confirmations. Catena 2008, 72, 1–12. [Google Scholar] [CrossRef]
  26. Pellegrini, G.B.; Surian, N. Geomorphological study of the Fadalto landslide Venetian Prealps Italy. Landslides Eur. Union 1996, 15, 337–350. [Google Scholar]
  27. Nielsen, T.H.; Wright, R.H.; Vlasic, T.C.; Spangle, W.E. Relative Slope Stability and Land-Use Planning in the San Francisco Bay Region California; Professional Paper; U.S. Govt. Print. Off.: Washington, DC, USA, 1979. [Google Scholar]
  28. Demir, G.; Aytekin, M.; Akgün, A.; Ikizler, S.B.; Tatar, O. A comparison of landslide susceptibility mapping of the eastern part of the North Anatolian Fault Zone (Turkey) by likelihood-frequency ratio and analytic hierarchy process methods. Nat. Hazard. 2013, 65, 1481–1506. [Google Scholar] [CrossRef]
  29. Pathak, S.; Poudel, R.K.; Kansakar, B.R. Application of Probabilistic Approach in Rock Slope Stability Analysis—An Experience from Nepal Disaster Mitigation of Debris Flows, Slope Failures and Landslides. In Proceedings of the INTERPRAEVENT International Symposium Disaster Mitigation of Debris Flows, Slope Failures and Landslides, Niigata, Japan, 25–27 September 2006; pp. 797–802.
  30. Thiebes, B.; Bell, R.; Glade, T. Deterministic Landslide Susceptibility Analysis Using SINMAP—Case Study in the Swabian Alb Germany. In Proceedings of the Conference “Geomorphology for the Future”, Obergurgl, Austria, 2–7 September 2007; pp. 177–184.
  31. Oh, H.-J.; Lee, S.; Soedradjat, G.M. Quantitative landslide susceptibility mapping at Pemalang area, Indonesia. Environ. Earth Sci. 2010, 60, 1317–1328. [Google Scholar] [CrossRef]
  32. Akgun, A. A comparison of landslide susceptibility maps produced by logistic regression, multi-criteria decision, and likelihood ratio methods: A case study at İzmir, Turkey. Landslides 2012, 9, 93–106. [Google Scholar] [CrossRef]
  33. Piacentini, D.; Troiani, F.; Soldati, M.; Notarnicola, C.; Savelli, D.; Schneiderbauer, S.; Strada, C. Statistical analysis for assessing shallow-landslide susceptibility in South Tyrol (south-eastern Alps, Italy). Geomorphology 2012, 151–152, 196–206. [Google Scholar] [CrossRef]
  34. Pradhan, B.; Lee, S. Landslide risk analysis using artificial neural net-work model focusing on different training sites. Int. J. Phys. Sci. 2009, 4, 1–15. [Google Scholar]
  35. Pourghasemi, H.R.; Pradhan, B.; Gokceoglu, C. Application of fuzzy logic and analytical hierarchy process (AHP) to landslide susceptibility mapping at Haraz watershed, Iran. Nat. Hazard. 2012, 63, 965–996. [Google Scholar] [CrossRef]
  36. Akgün, A.; Bulut, F. GIS-based landslide susceptibility for Arsin-Yomra (Trabzon, North Turkey) region. Environ. Geol. 2007, 51, 1377–1387. [Google Scholar] [CrossRef]
  37. Wang, W.-D.; Guo, J.; Fang, L.-G.; Chang, X.-S. A subjective and objective integrated weighting method for landslides susceptibility mapping based on GIS. Environ. Earth Sci. 2012, 65, 1705–1714. [Google Scholar] [CrossRef]
  38. Lee, E.M.; Jones, D.K.C. Landslide Risk Assessment; Thomas Telford: London, UK, 2004; p. 161. [Google Scholar]
  39. Powell, G. Landslide risk management concepts and quidelines. Aust. Geomech. 2000, 35, 49–52. [Google Scholar]
  40. Wang, W.D.; Xie, C.M.; Du, X.G. Landslides susceptibility mapping based on geographical information system, GuiZhou, south-west China. Environ. Geol. 2009, 58, 33–43. [Google Scholar] [CrossRef]
  41. Dutta, P.J.; Sarma, S. Landslide susceptibility zoning of the Kala-Pahar hill, Guwahati, Assam state, (India), using a GIS-based heuristic technique. Int. J. Remote Sens. Geosci. 2013, 2, 49–55. [Google Scholar]
  42. Pnevmatikos, J.D.; Katsoulis, B.D. The changing rainfall regime in Greece and its impact on climatological means. Meteorol. Appl. 2006, 13, 331–345. [Google Scholar] [CrossRef]
  43. Stournaras, G.; Tsimpidis, G.; Tsoumanis, P.; Yannatos, G.; Guillande, R. Instability phenomena in the Neogenne deposits of Northern Peloponnese. Bull. Eng. Geol. Environ. 1998, 57, 65–68. [Google Scholar] [CrossRef]
  44. Papathanasiou, G. Estimating slope failure potential in an earthquake prone area: A case study at Skolis Mountain, NW Peloponnesus, Greece. Bull. Eng. Geol. Environ. 2012, 71, 187–194. [Google Scholar] [CrossRef]
  45. Heymann, Y.; Steenmans, C.; Croisille, G.; Bossard, M. CORINE Land Cover: Technical Guide; Office for Official Publications of the European Communities: Luxembourg, 1994; p. 136. [Google Scholar]
  46. Huade, G.; Wilson, J.L.; Makhnin, O. Geostatistical mapping of mountain precipitation incorporating autosearched effects of terrain and climatic characteristics. J. Hydrometeorol. 2005, 6, 1018–1031. [Google Scholar] [CrossRef]
  47. Arjun, C.R.; Kumar, A. Artificial neural network-based estimation of peak ground acceleration. ISET J. Earthq. Technol. 2009, 46, 19–28. [Google Scholar]
  48. Papadopoulos, G.A.; Plessa, A. Magnitude-distance relations for earthquake-induced landslides in Greece. Eng. Geol. 2000, 58, 377–386. [Google Scholar] [CrossRef]
  49. Sato, H.P.; Hasegawa, H.; Fujiwara, S.; Tobita, M.; Koarai, M.; Une, H.; Iwahashi, J. Interpretation of landslide distribution triggered by the 2005 Northern Pakistan earthquake using SPOT 5 imagery. Landslides 2007, 4, 113–122. [Google Scholar] [CrossRef]
  50. Owen, L.A.; Kamp, U.; Khattak, G.A.; Harp, E.L.; Keefer, D.K.; Bauer, M.A. Landslides triggered by the 8 October 2005 Kashmir earthquake. Geomorphology 2008, 94, 1–9. [Google Scholar] [CrossRef]
  51. Koukis, G.; Tsiambaos, G.; Sabatakakis, N. Landslides Movements in Greece: Engineering Geological Characteristics and Environmental Consequences. In Proceedings of the International Symposium of Engineering geology and the Environment, Athens, Greece, 23–27 June 1997; Balkema: Athens, Greece, 1997; pp. 789–793. [Google Scholar]
  52. Koukouvelas, I.K.; Doutsos, T. The Effects of Active Faults on the Generation of Landslides in NW Peloponnese, Greece. In Engineering Geology and the Environment; Marinos, P.G., Koukis, G.C., Tsiambaos, G.C., Stournaras, G.C., Eds.; Balkema: Rotterdam, The Netherlands, 1997; pp. 799–804. [Google Scholar]
  53. Koukouvelas, I. The Egion fault, earthquake-related and long-term deformation, Gulf of Corinth, Greece. J. Geodyn. 1998, 6, 501–513. [Google Scholar] [CrossRef]
  54. Dounias, G.; Fikiris, I.F.; Kollios, A.; Kabbadas, M.; Marinos, P. The Nemea Landslide. Trigger Mechanism—Remedial Measures. In Proceedings of the 5th Panellenic Conference of Geotechnics and Geoenvironmental Engineering, Xanthi, Greece, 31 May–2 June 2006.
  55. Sabatakakis, N.; Koukis, G.; Vassiliades, E.; Lainas, S. Landslide susceptibility zonation in Greece. Nat. Hazard. 2013, 65, 523–543. [Google Scholar] [CrossRef]
  56. Christoulas, S.; Kalteziotis, N.; Gassios, E.; Sabatakakis, N.; Tsiambaos, G. Instability Phenomena in Weathered Flysch in Greece. In Proceedings of the 5th International Symposium on Landslides, Lausanne, Switzerland, 10–15 July 1988; Volume 1, pp. 103–108.
  57. Cruden, D.M.; Varnes, D.J. Landslide Types and Processes. In Landslides: Investigation and Mitigation; Turner, A.K., Schuster, R.L., Eds.; National Academy Press: Washington, DC, USA, 1996; pp. 36–75. [Google Scholar]
  58. Dikau, R.; Brunsden, D.; Schrott, L.; Ibsen, M. Landslide Recognition: Identification, Movement and Causes; Wiley: Chichester, UK, 1996; p. 251. [Google Scholar]
  59. Fell, R. Landslide risk assessment and acceptable risk. Can. Geotech. J. 1994, 31, 261–272. [Google Scholar] [CrossRef]
  60. Malczewski, J. GIS and Multicriteria Decision Analysis; John Wiley & Sons: New York, NY, USA, 1999. [Google Scholar]
  61. Chen, Y.; Yu, J.; Khan, S. Spatial sensitivity analysis of multi-criteria weights in GIS-based land suitability evaluation. Environ. Model. Softw. 2010, 25, 1582–1591. [Google Scholar] [CrossRef]
  62. Fawcett, T. An introduction to ROC analysis. Pattern Recognit. Lett. 2006, 27, 861–874. [Google Scholar] [CrossRef]
  63. Frattini, P.; Crosta, G.; Carrara, A. Techniques for evaluating the performance of landslide susceptibility models. Eng. Geol. 2010, 111, 62–72. [Google Scholar] [CrossRef]
  64. Lari, S.; Frattini, P.; Crosta, G.B. Integration of natural and technological risks in Lombardy, Italy. Nat. Hazard. Earth Syst. Sci. 2009, 9, 2085–2106. [Google Scholar] [CrossRef]
  65. Intarawichian, N.; Dasananda, S. Analytical hierarchy process for landslide susceptibility mapping in Lower Mae Chaem Watershed, Northern Thailand. Suranaree J. Sci. Technol. 2010, 17, 277–292. [Google Scholar]
  66. Mezughi, T.H.; Akhir, J.M.; Rafek, A.G.; Abdullah, I. Analytical hierarchy process method for mapping landslide susceptibility to an area along the E-W highway (Gerik-Jeli), Malaysia. Asian J. Earth Sci. 2012, 5, 13–24. [Google Scholar] [CrossRef]
  67. Chang, N.; Parvathinathan, G.; Breeden, J. Combining GIS with fuzzy multicriteria decision-making for landfill siting in a fast-growing urban region. J. Environ. Manag. 2008, 87, 139–153. [Google Scholar]
  68. Fernández, D.S.; Lutz, M.A. Urban flood hazard zoning in Tucumán Province, Argentina, using GIS and multicriteria decision analysis. Eng. Geol. 2010, 111, 90–98. [Google Scholar] [CrossRef]

