Urban Morphological Change Analysis of Dhaka City, Bangladesh, Using Space Syntax


Abstract
:
1. Introduction
2. Data Collection
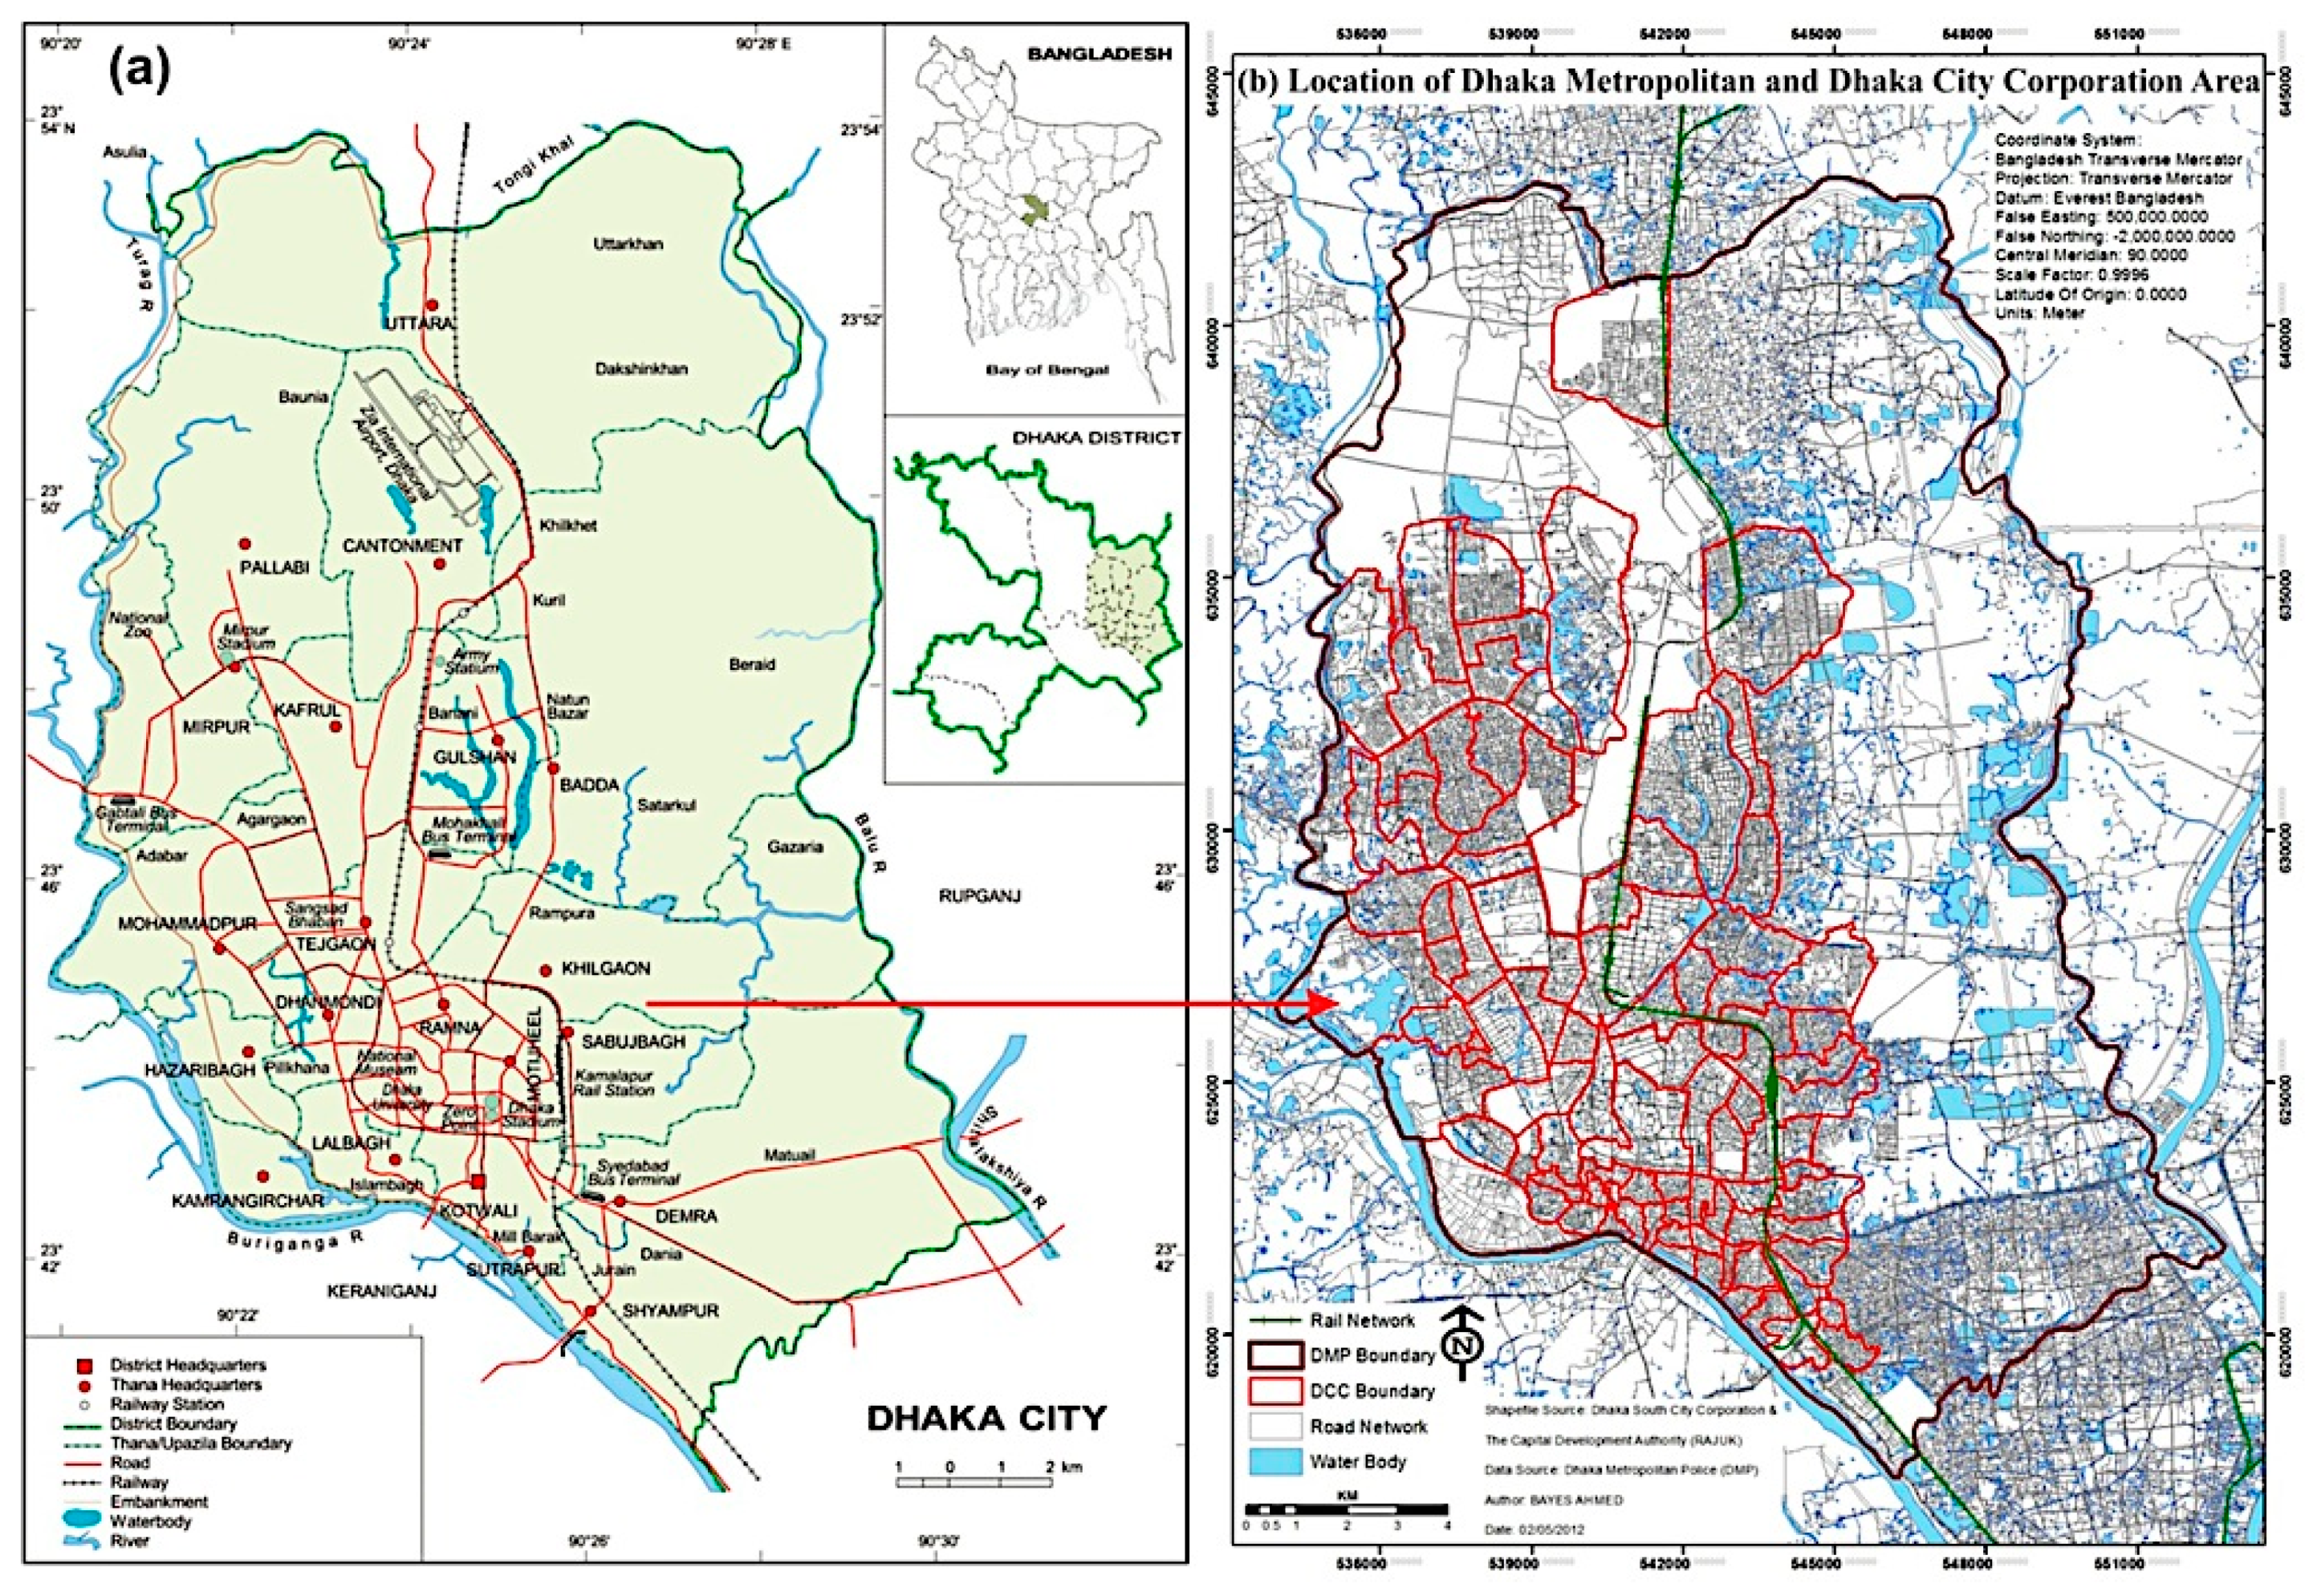
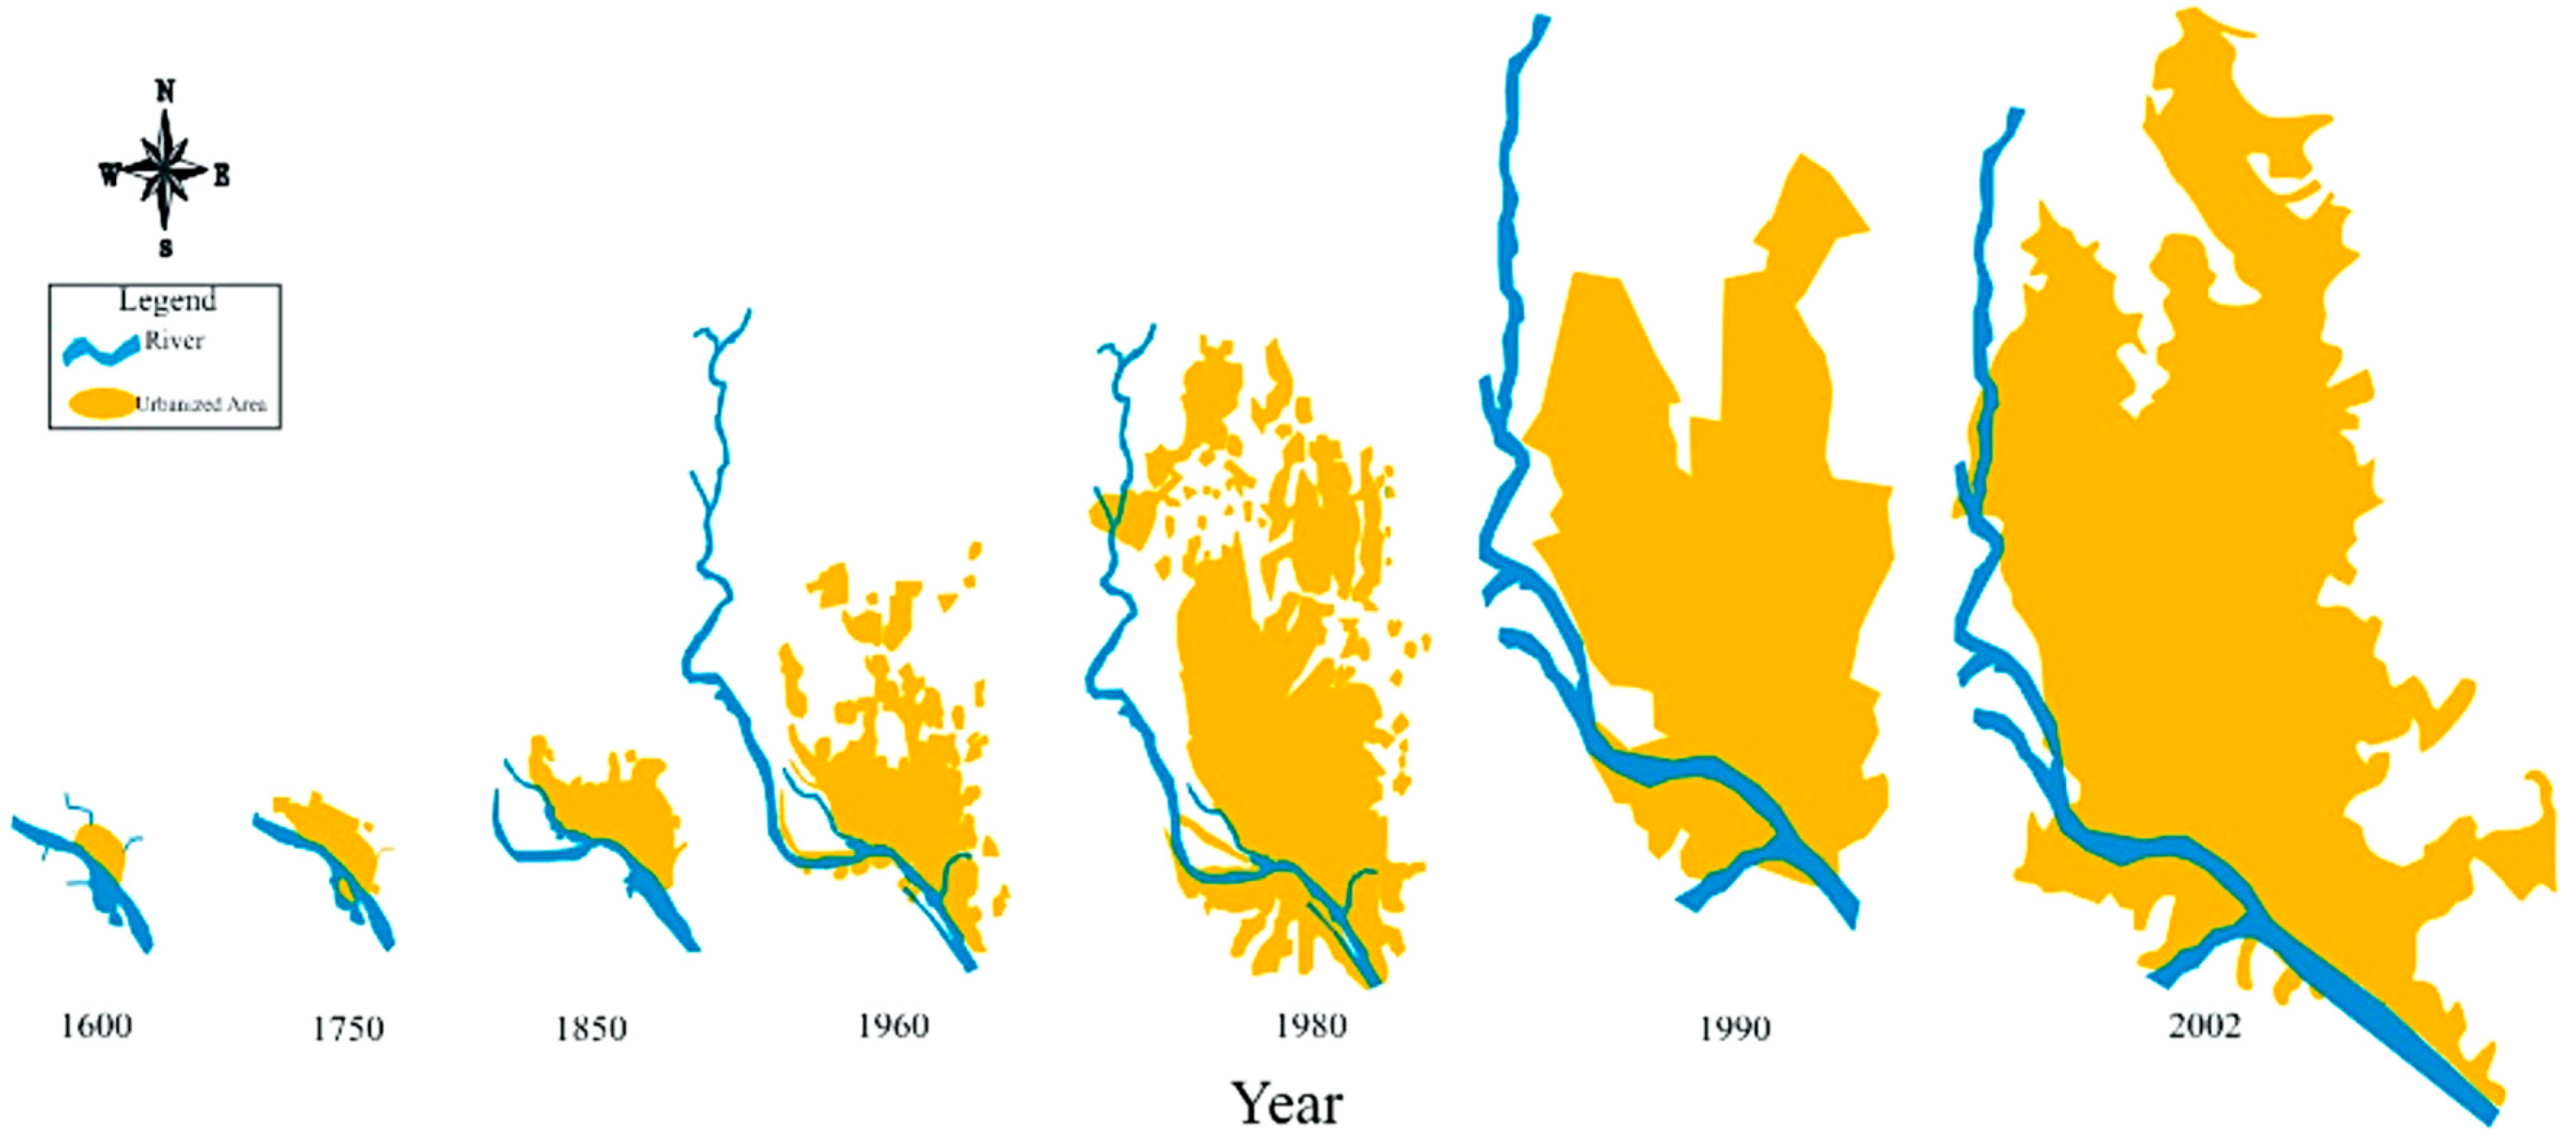
2.1. Study Area Profile

2.2. Selection of Study Areas

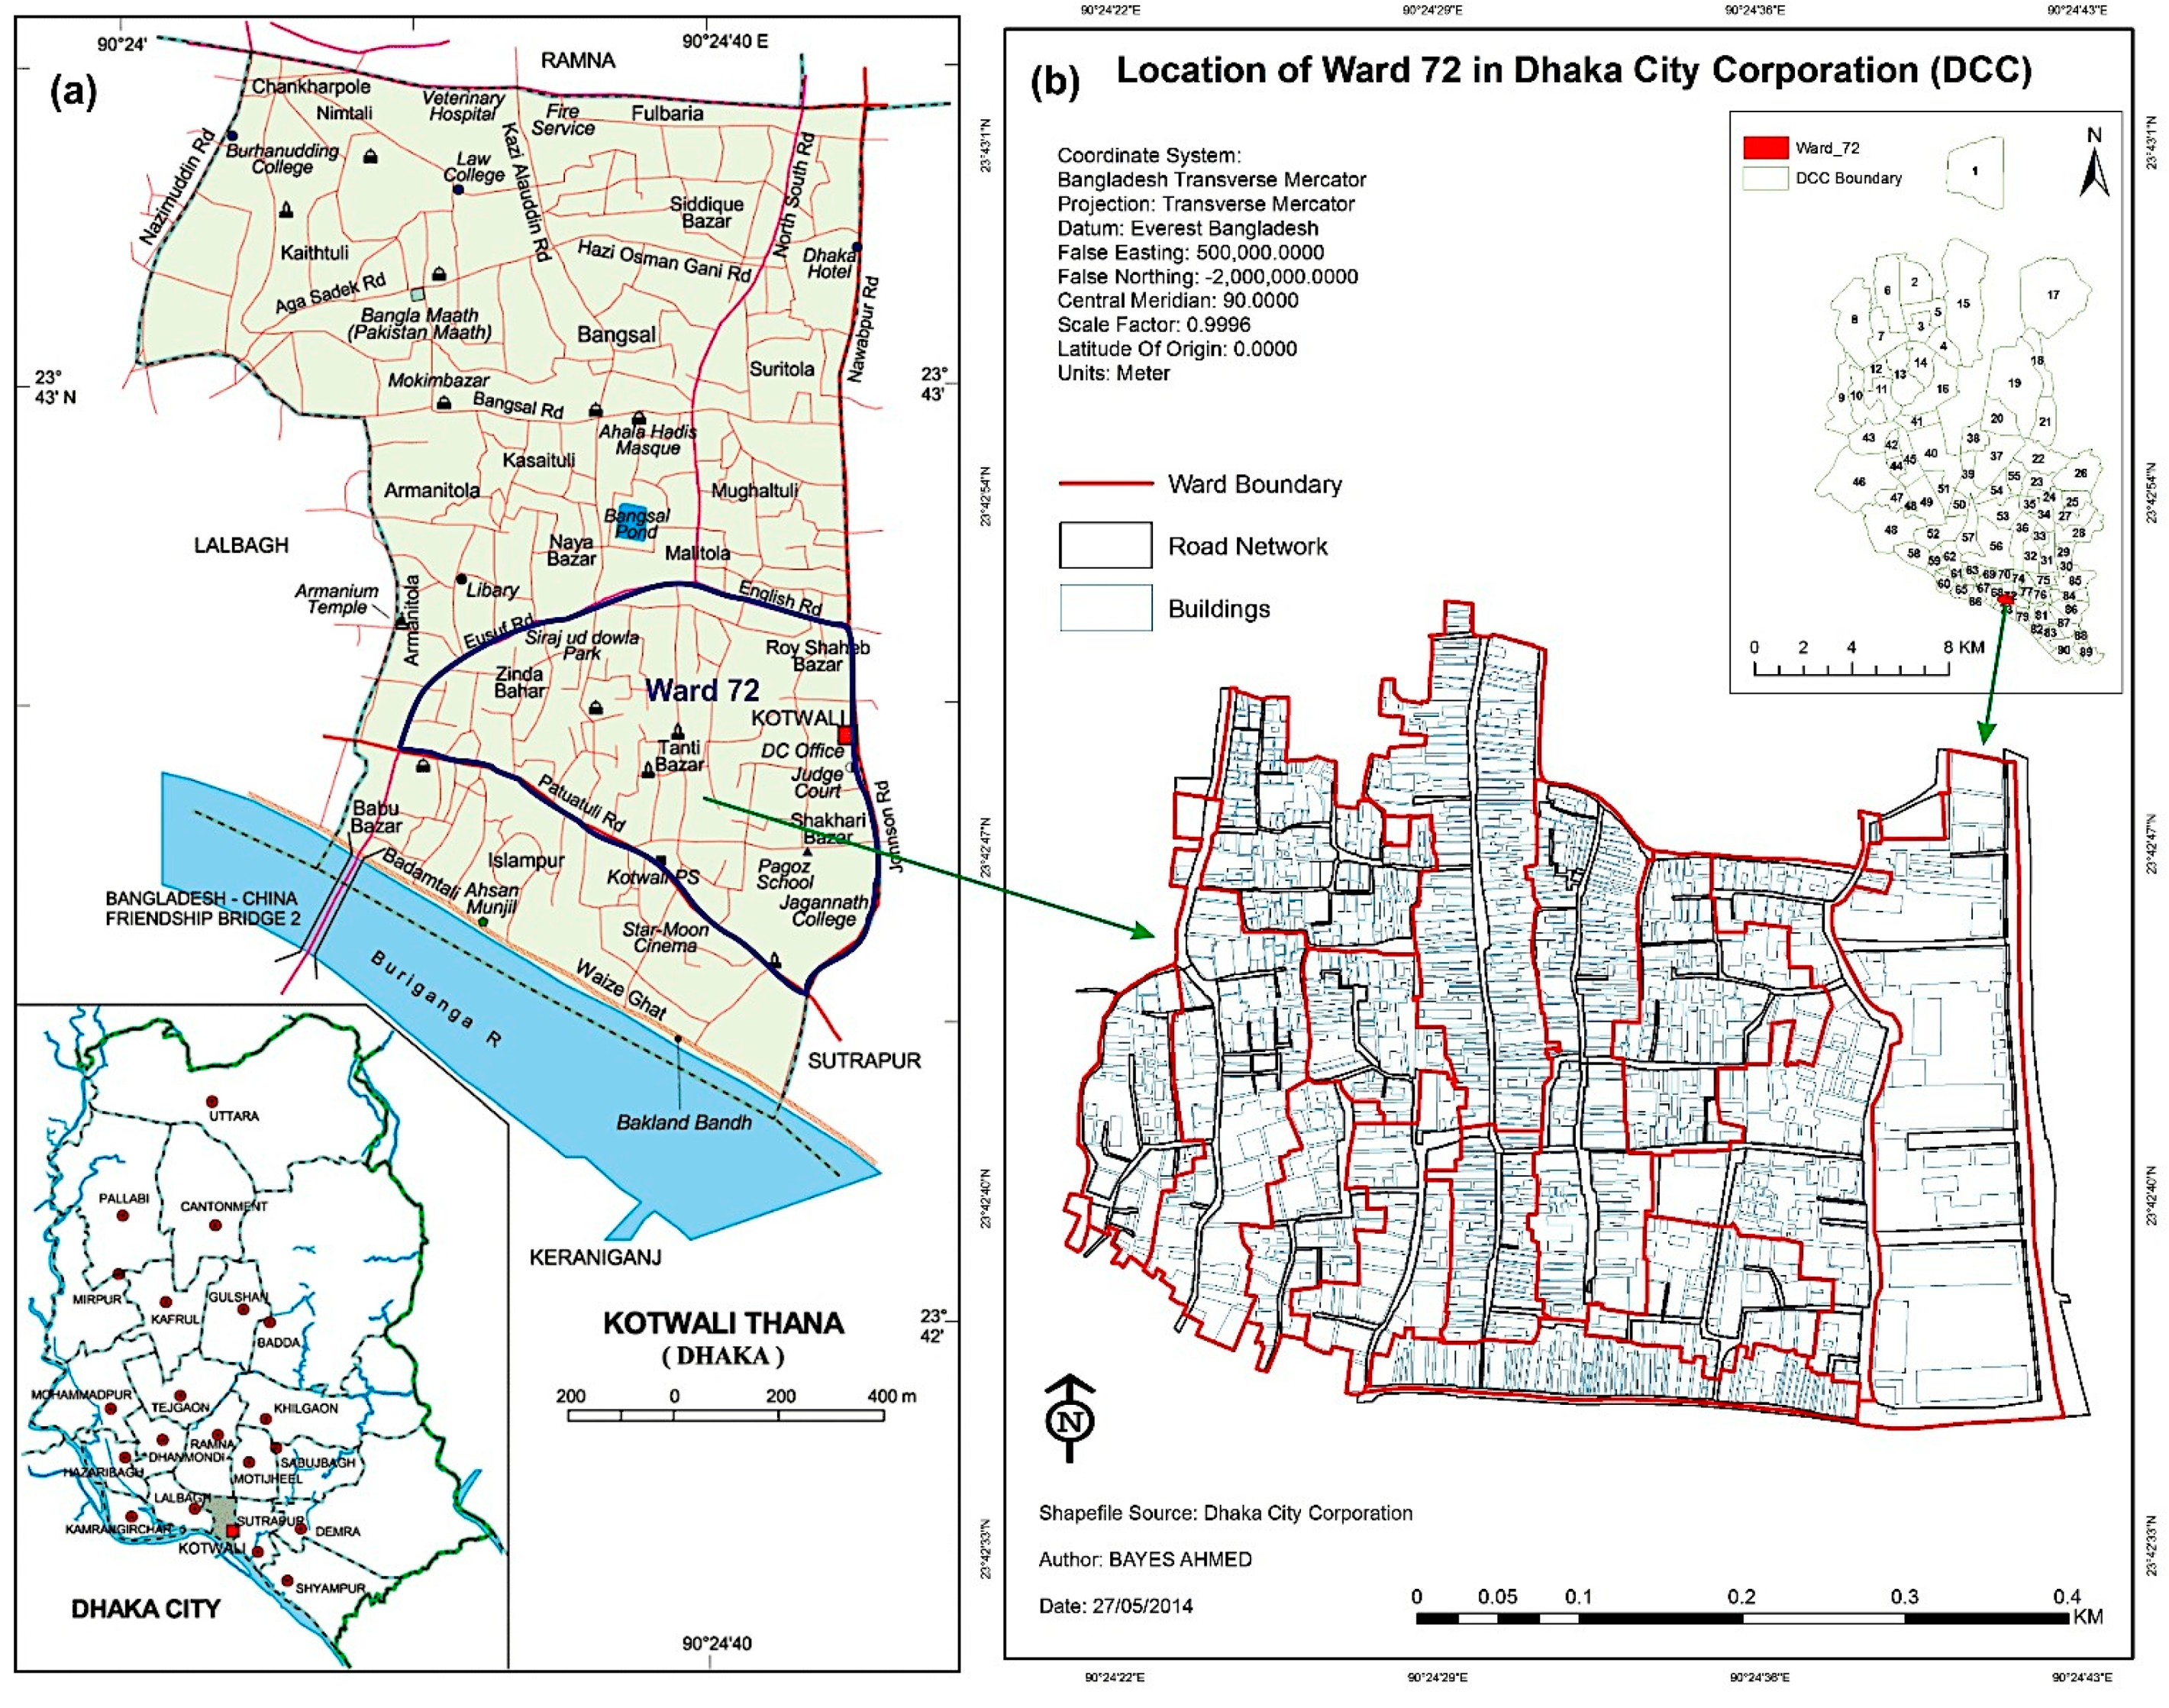
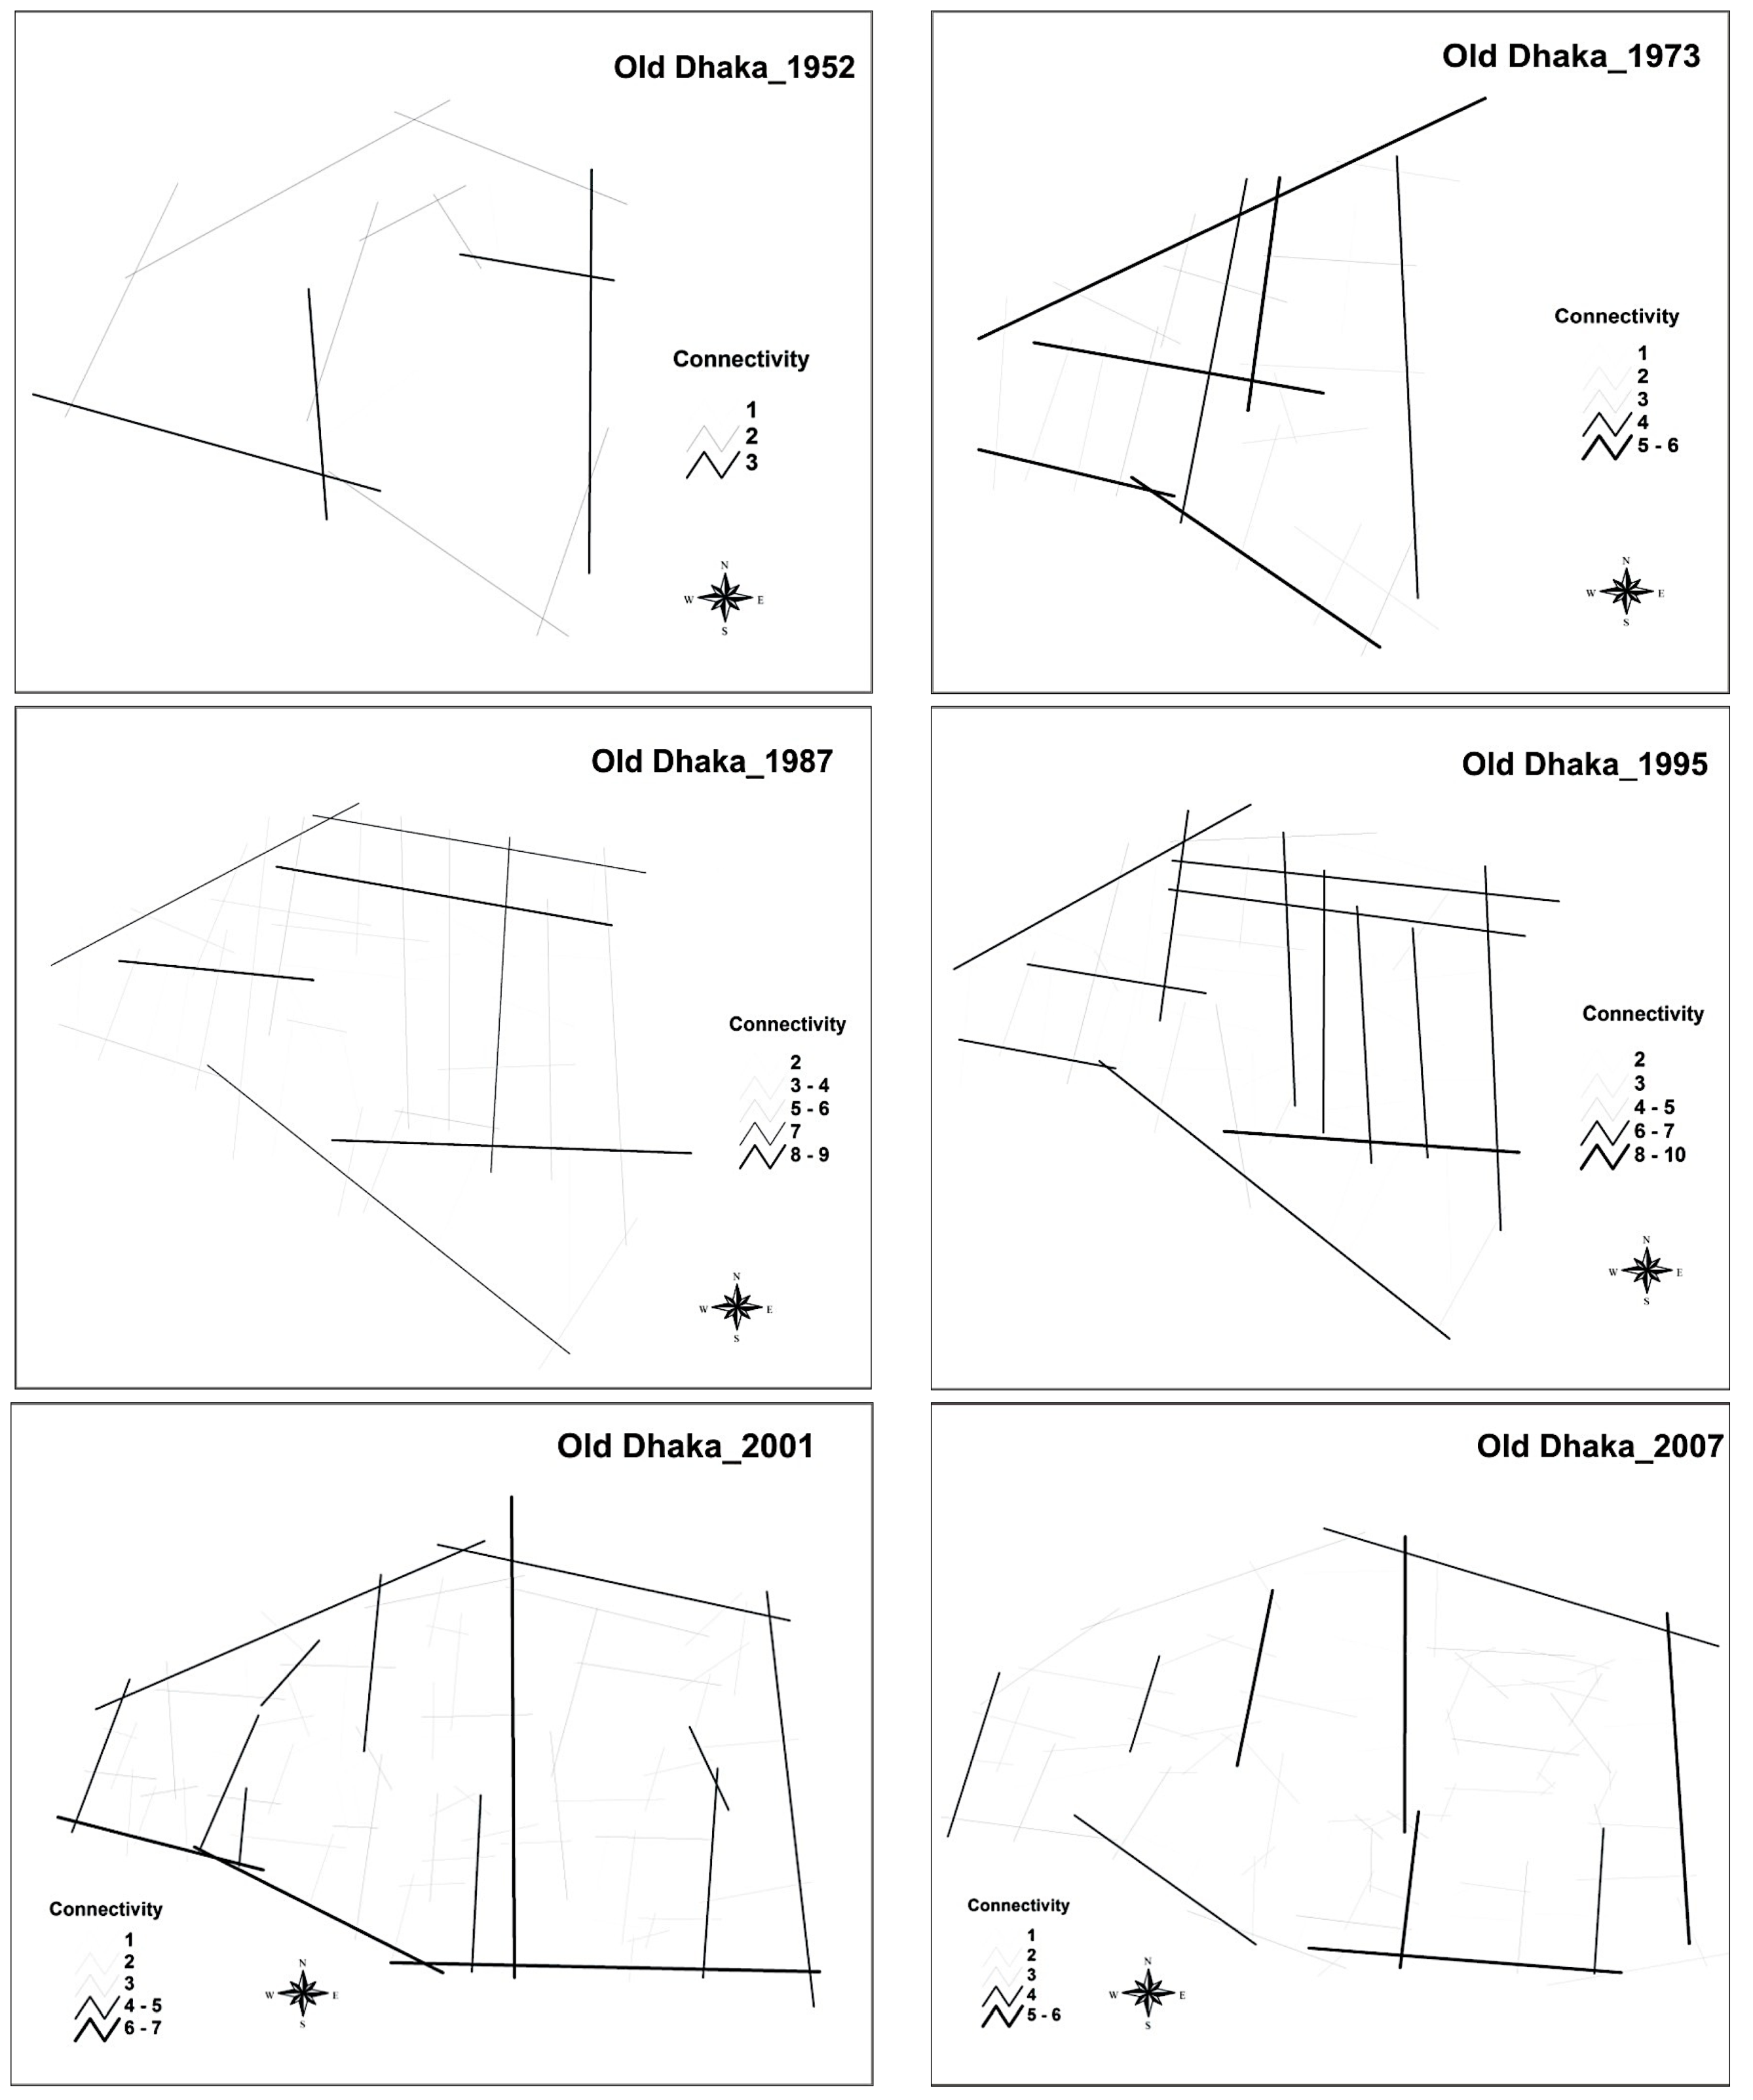
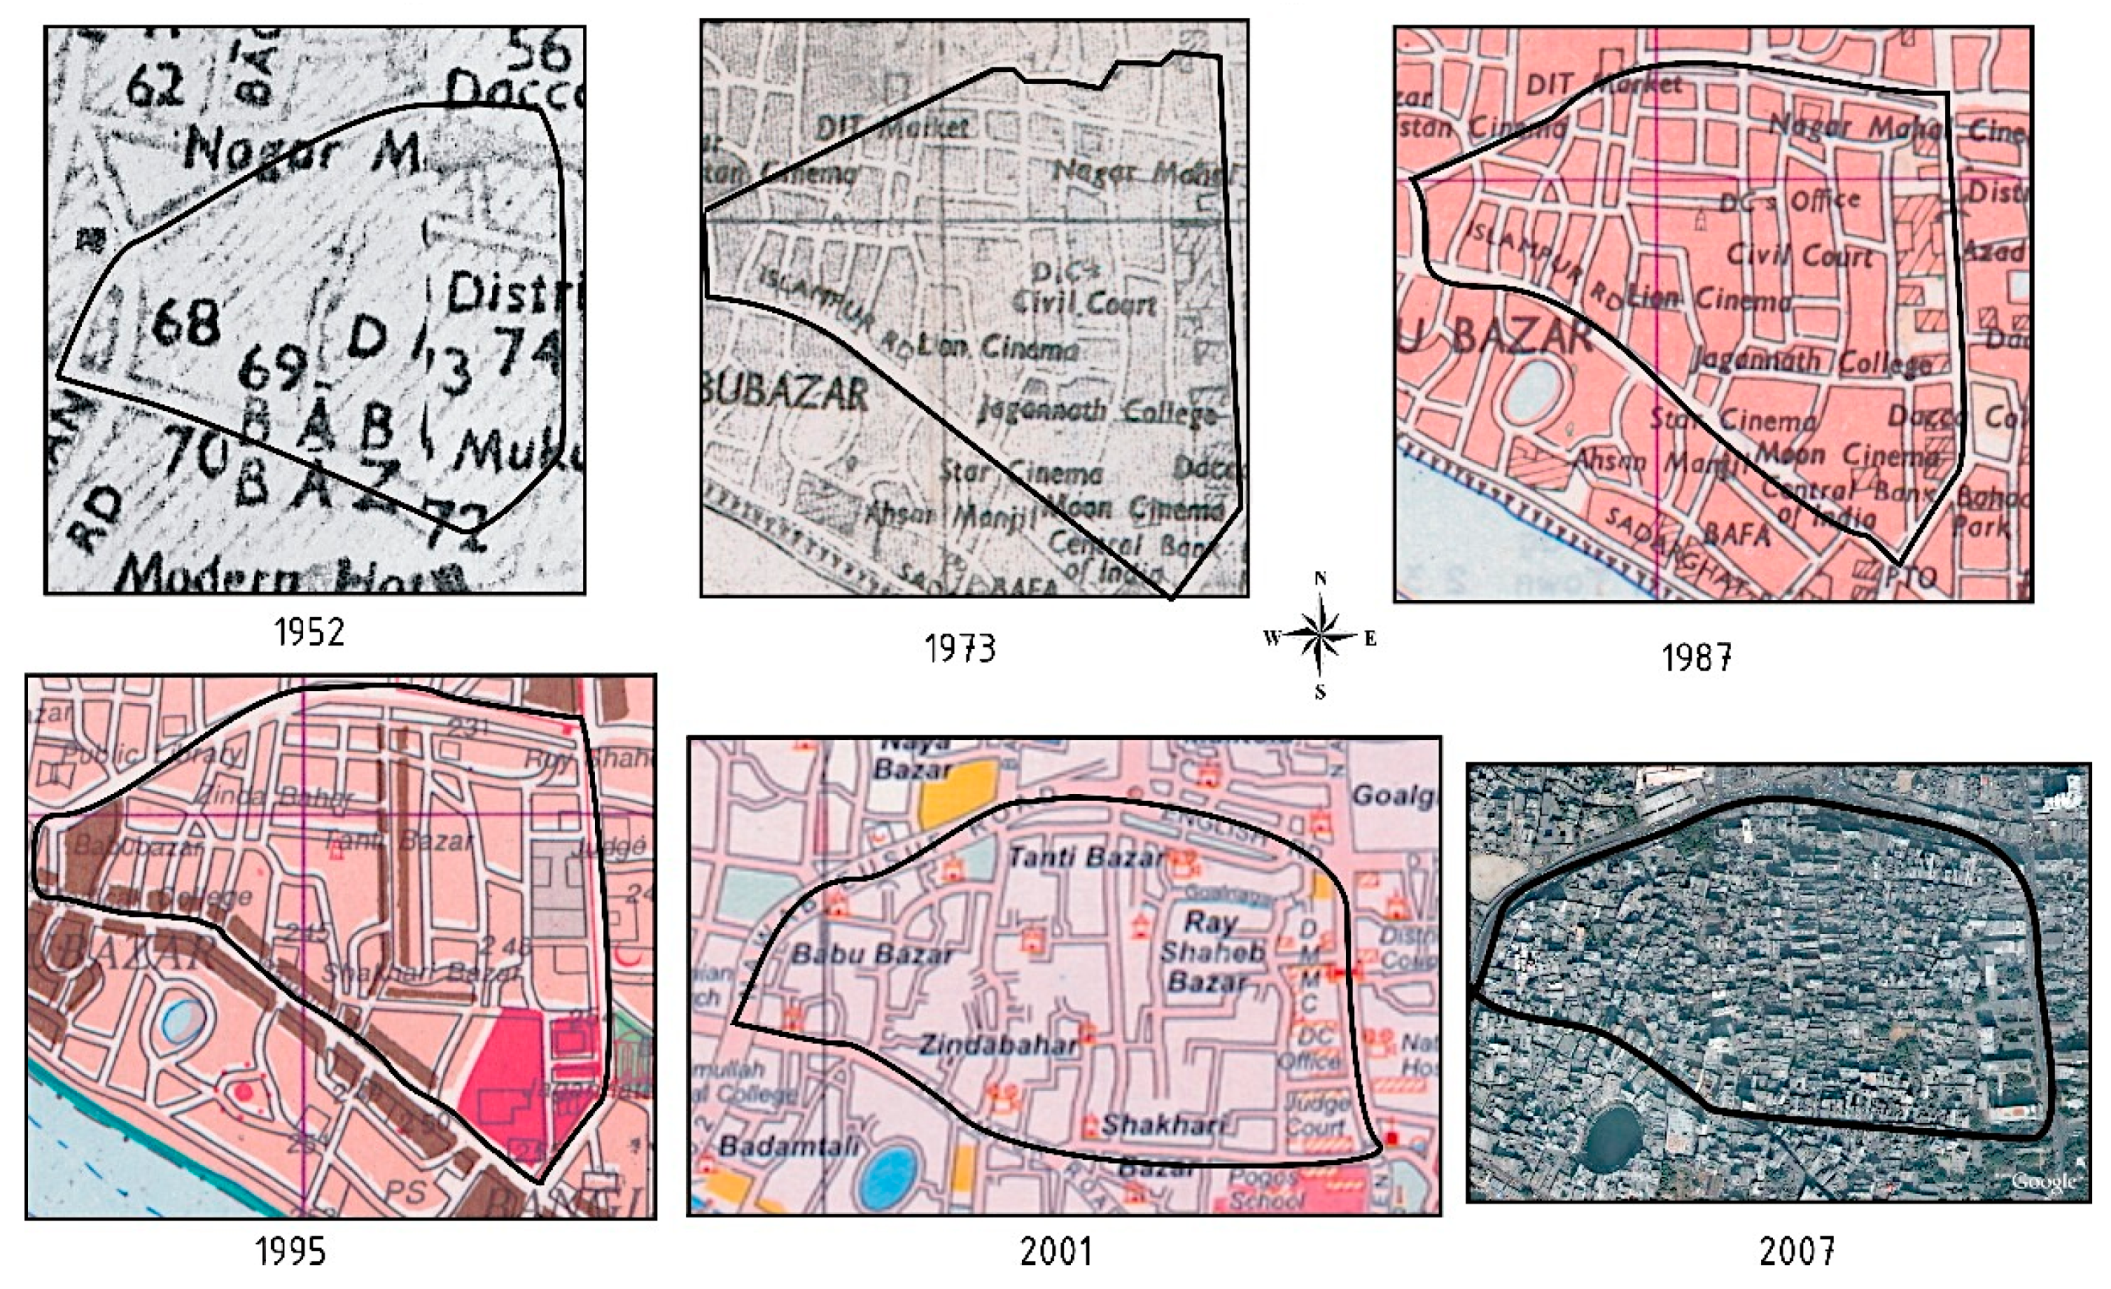
2.2.1. Ward 72: Old Dhaka (Indigenous Settlement)

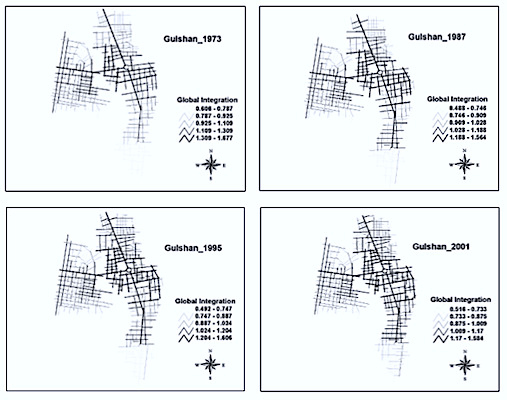
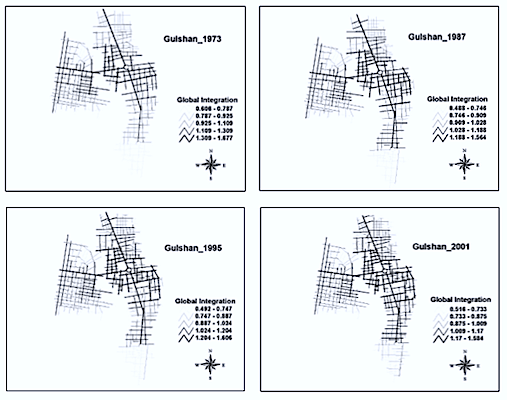
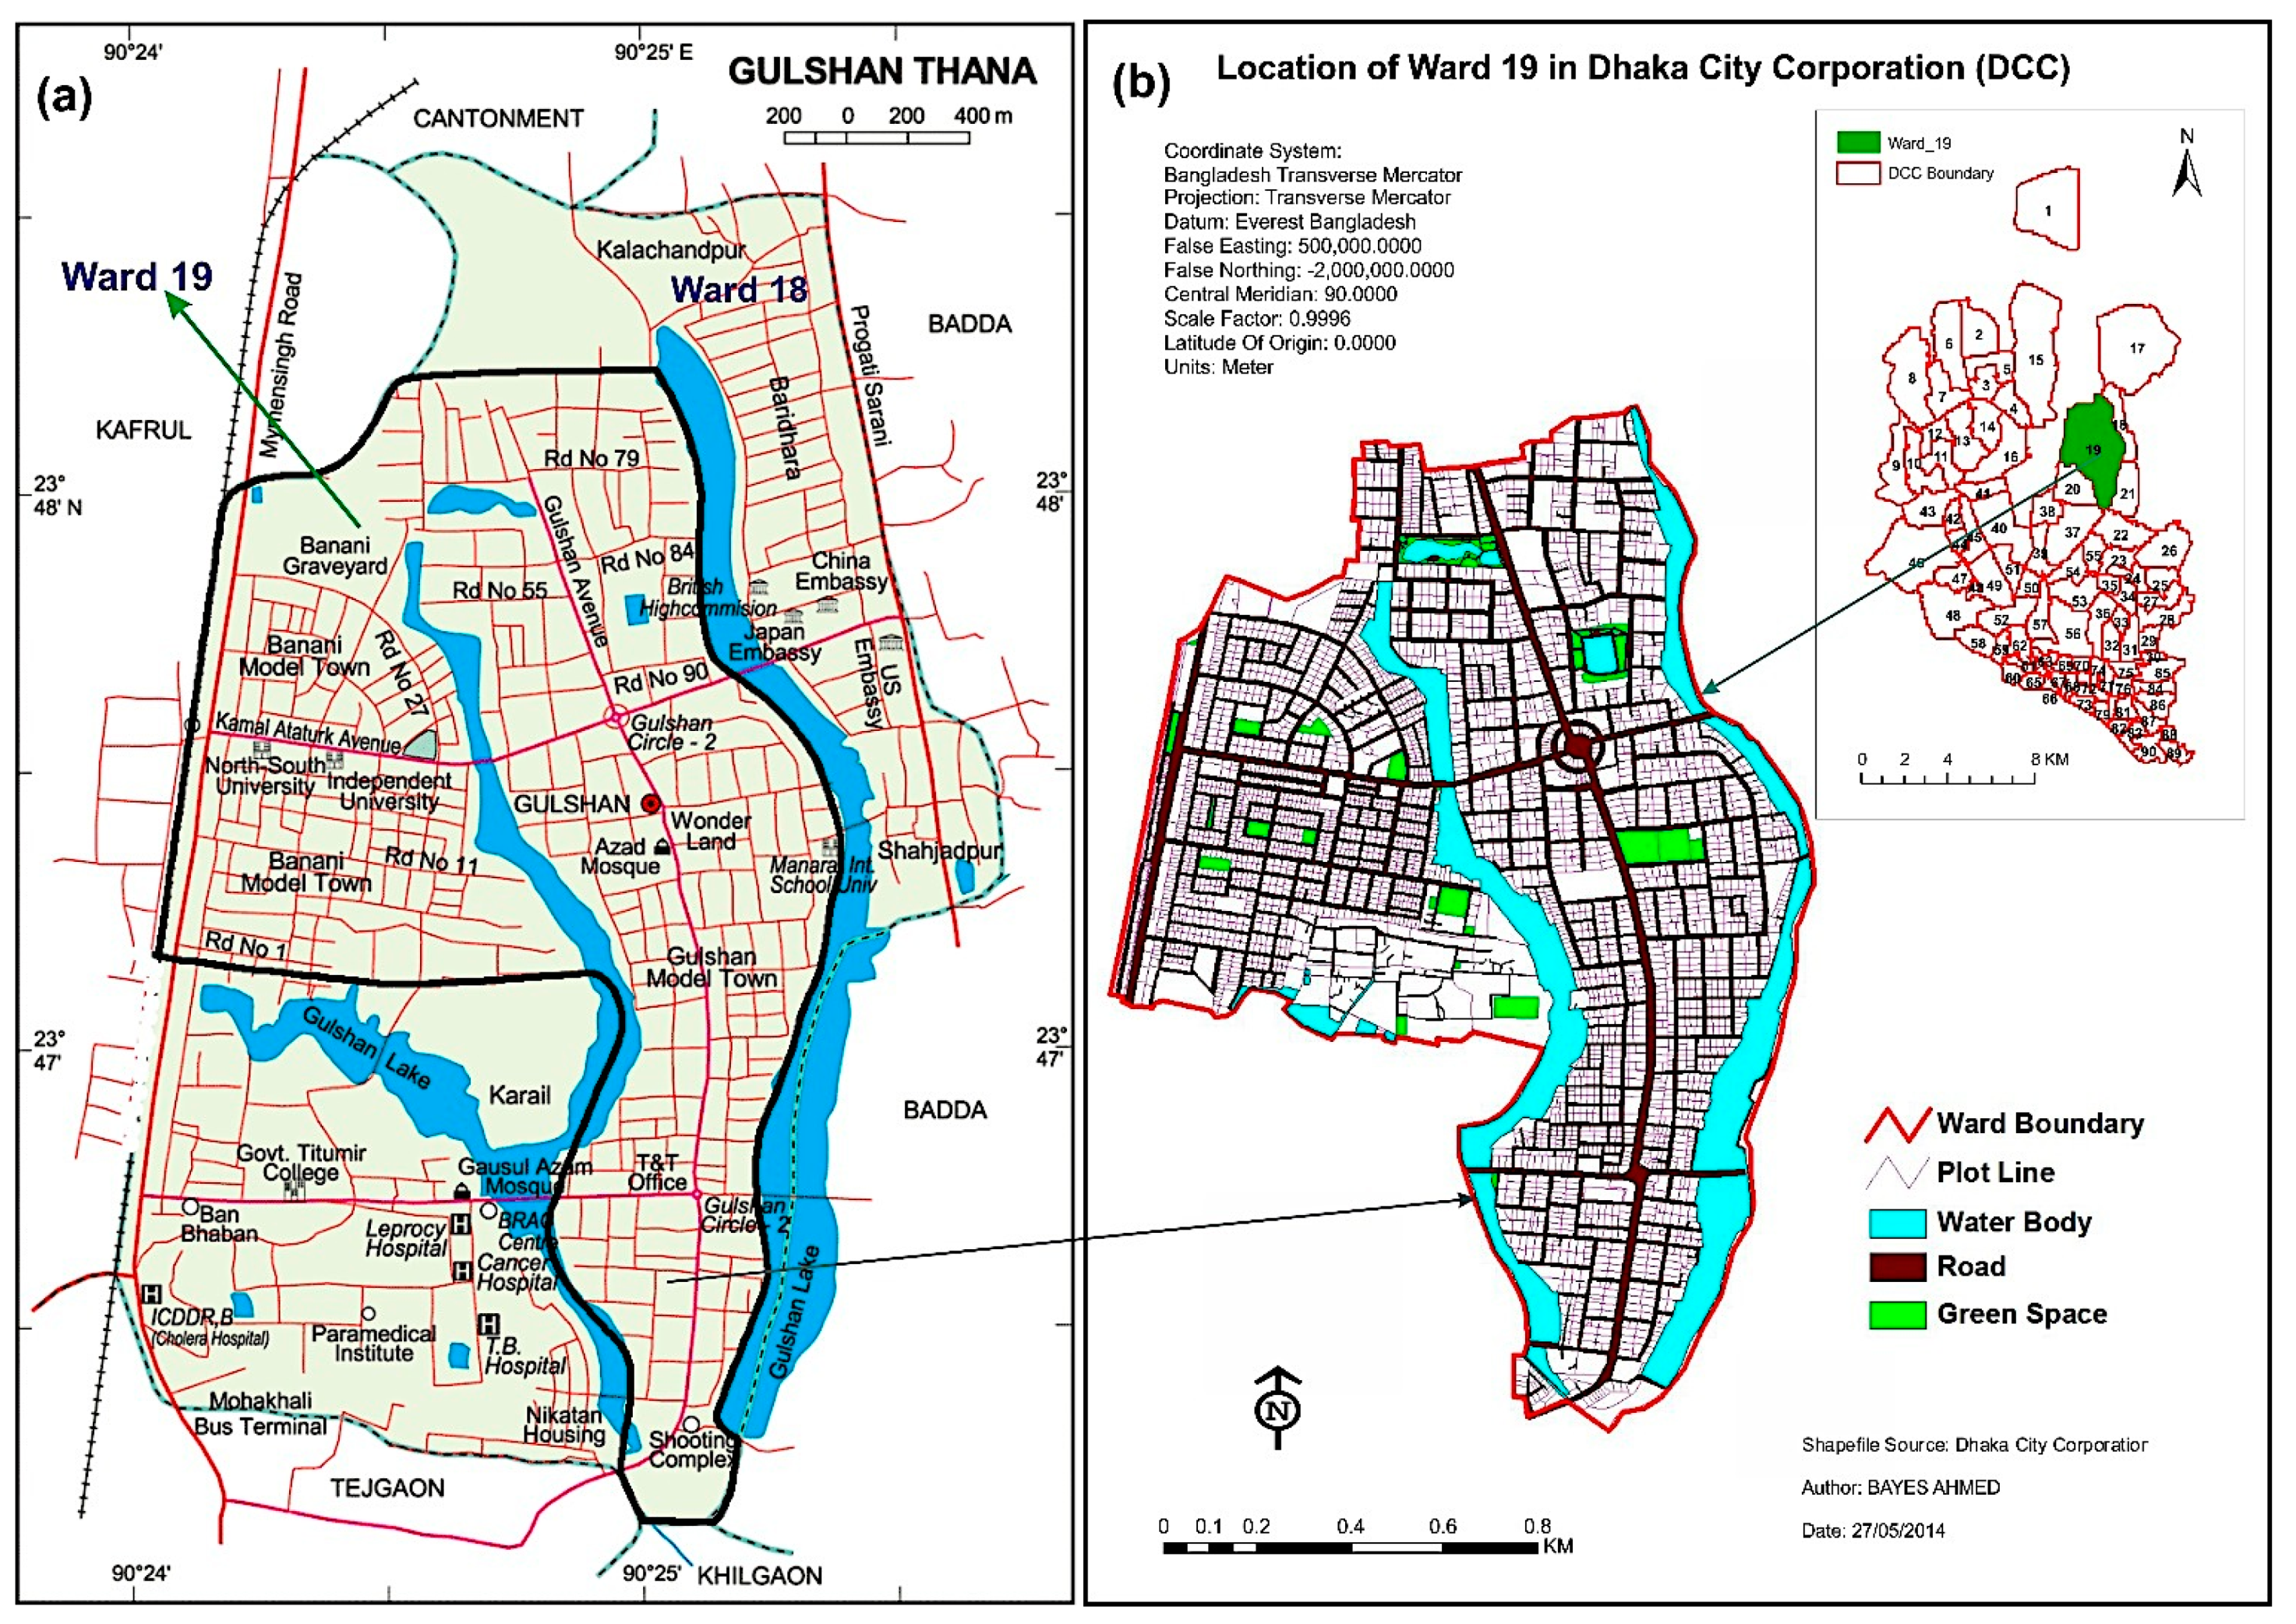
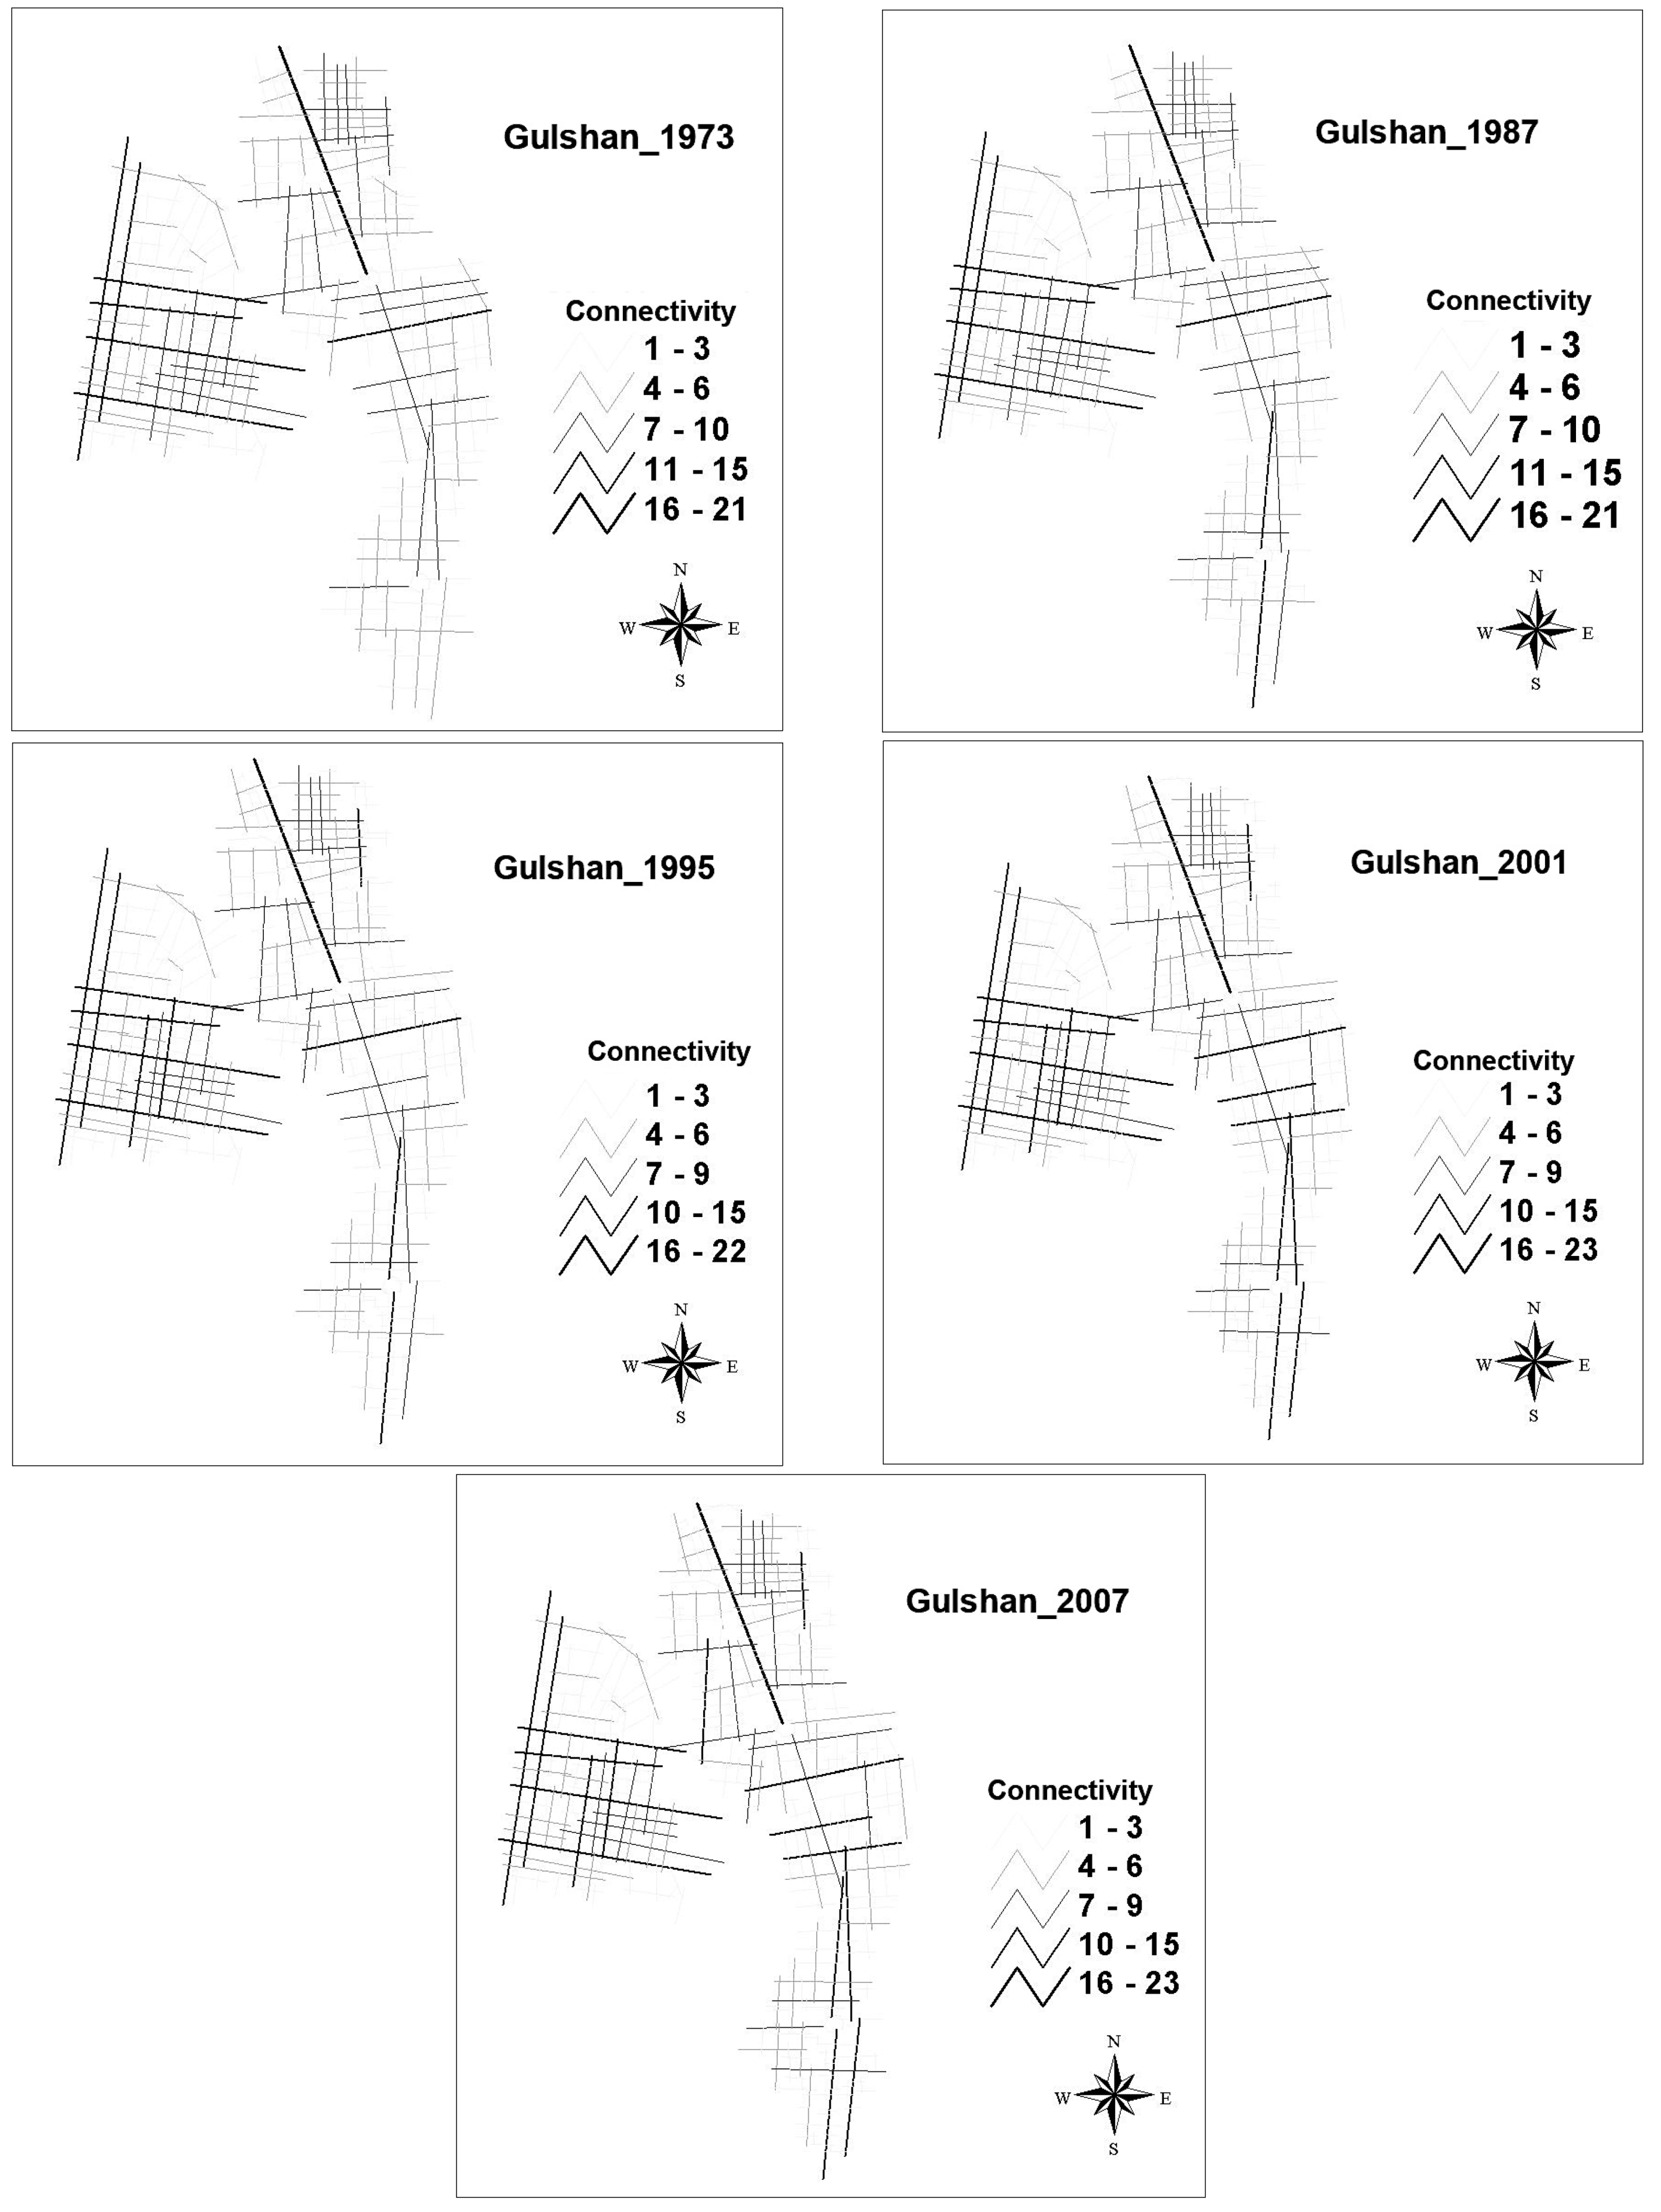
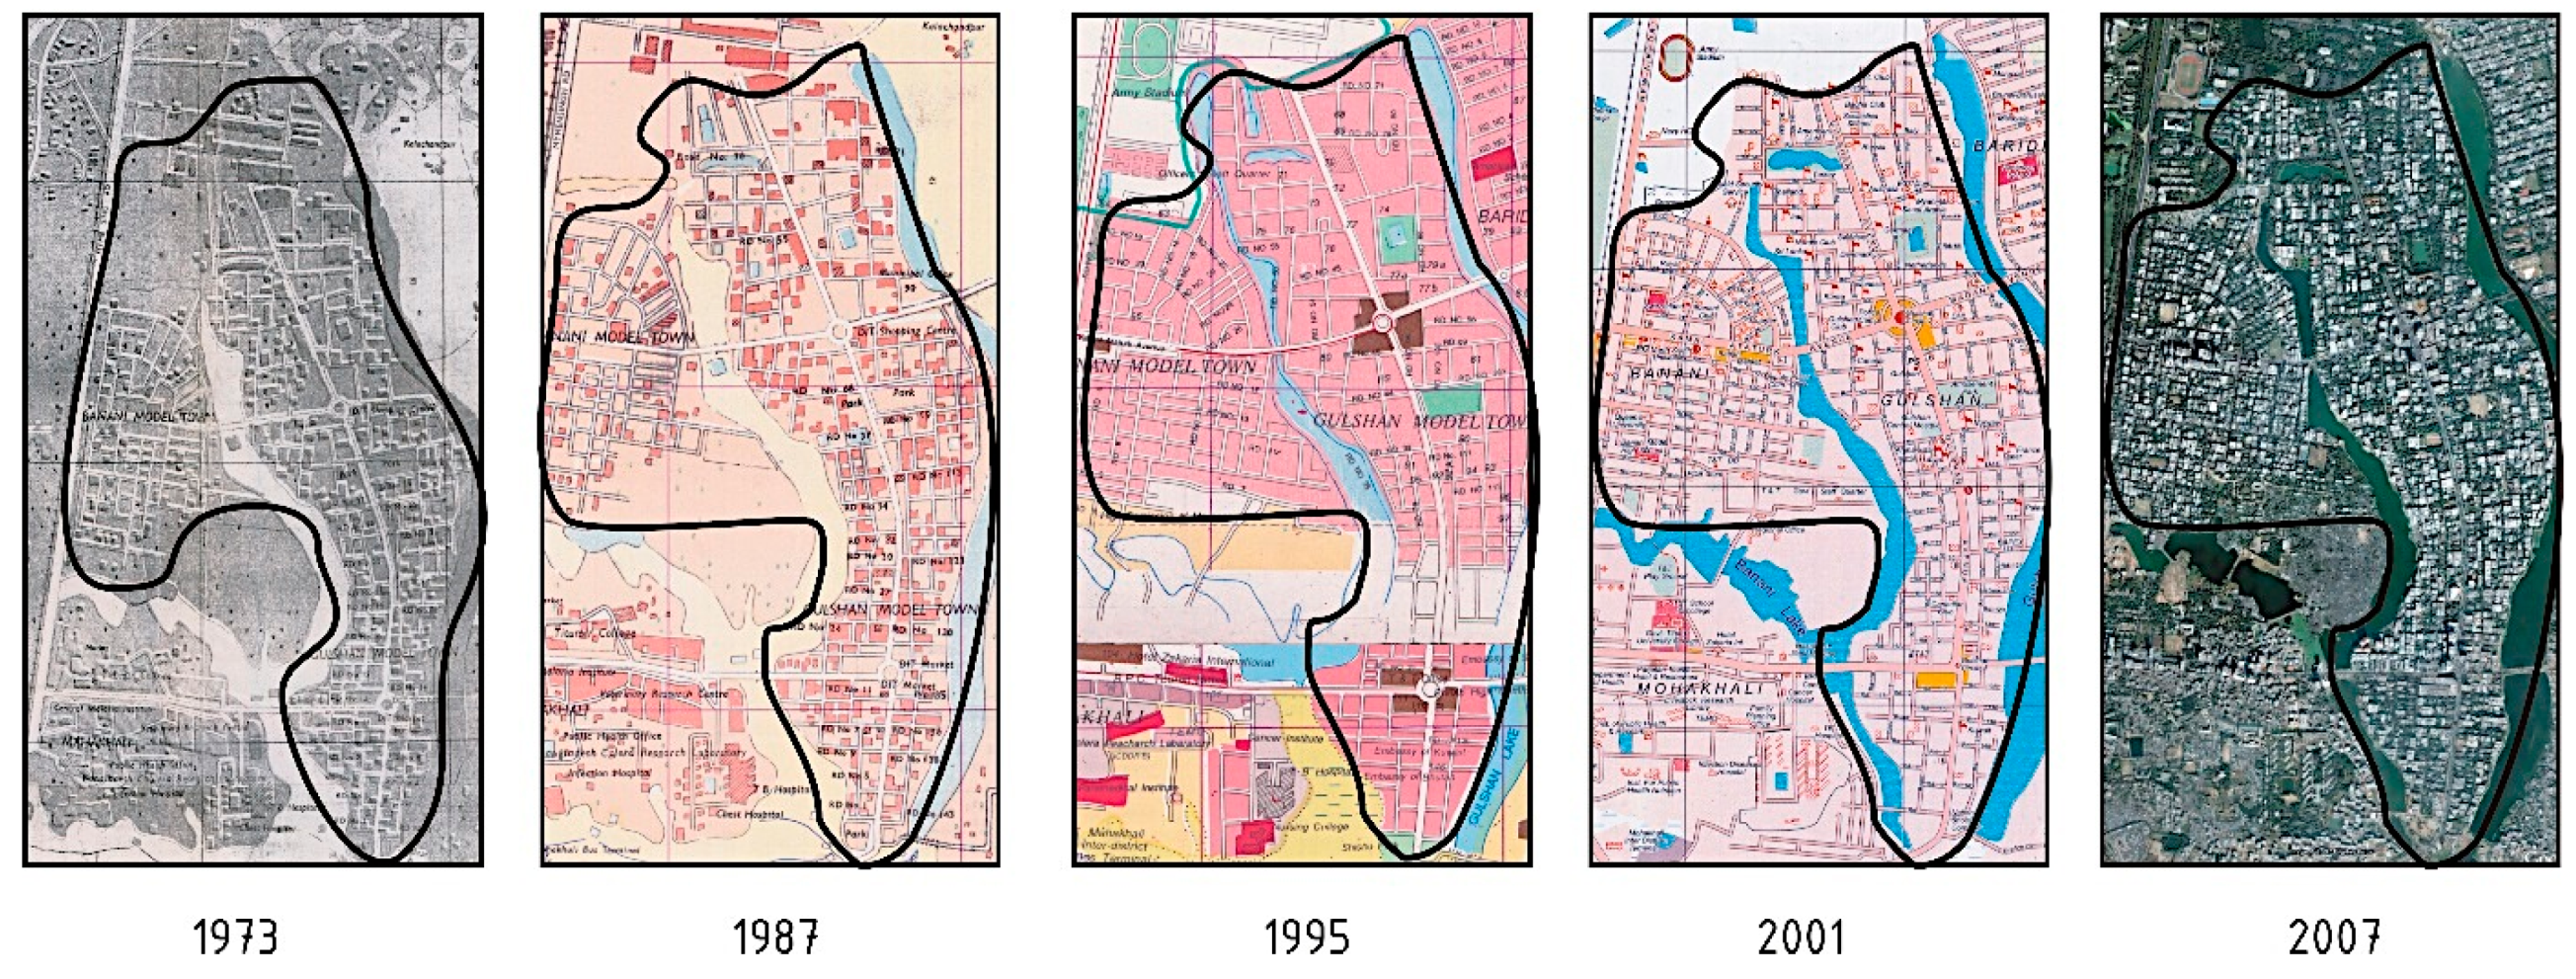
2.2.2. Ward 19: Gulshan and Banani Model Town (Planned Settlement)

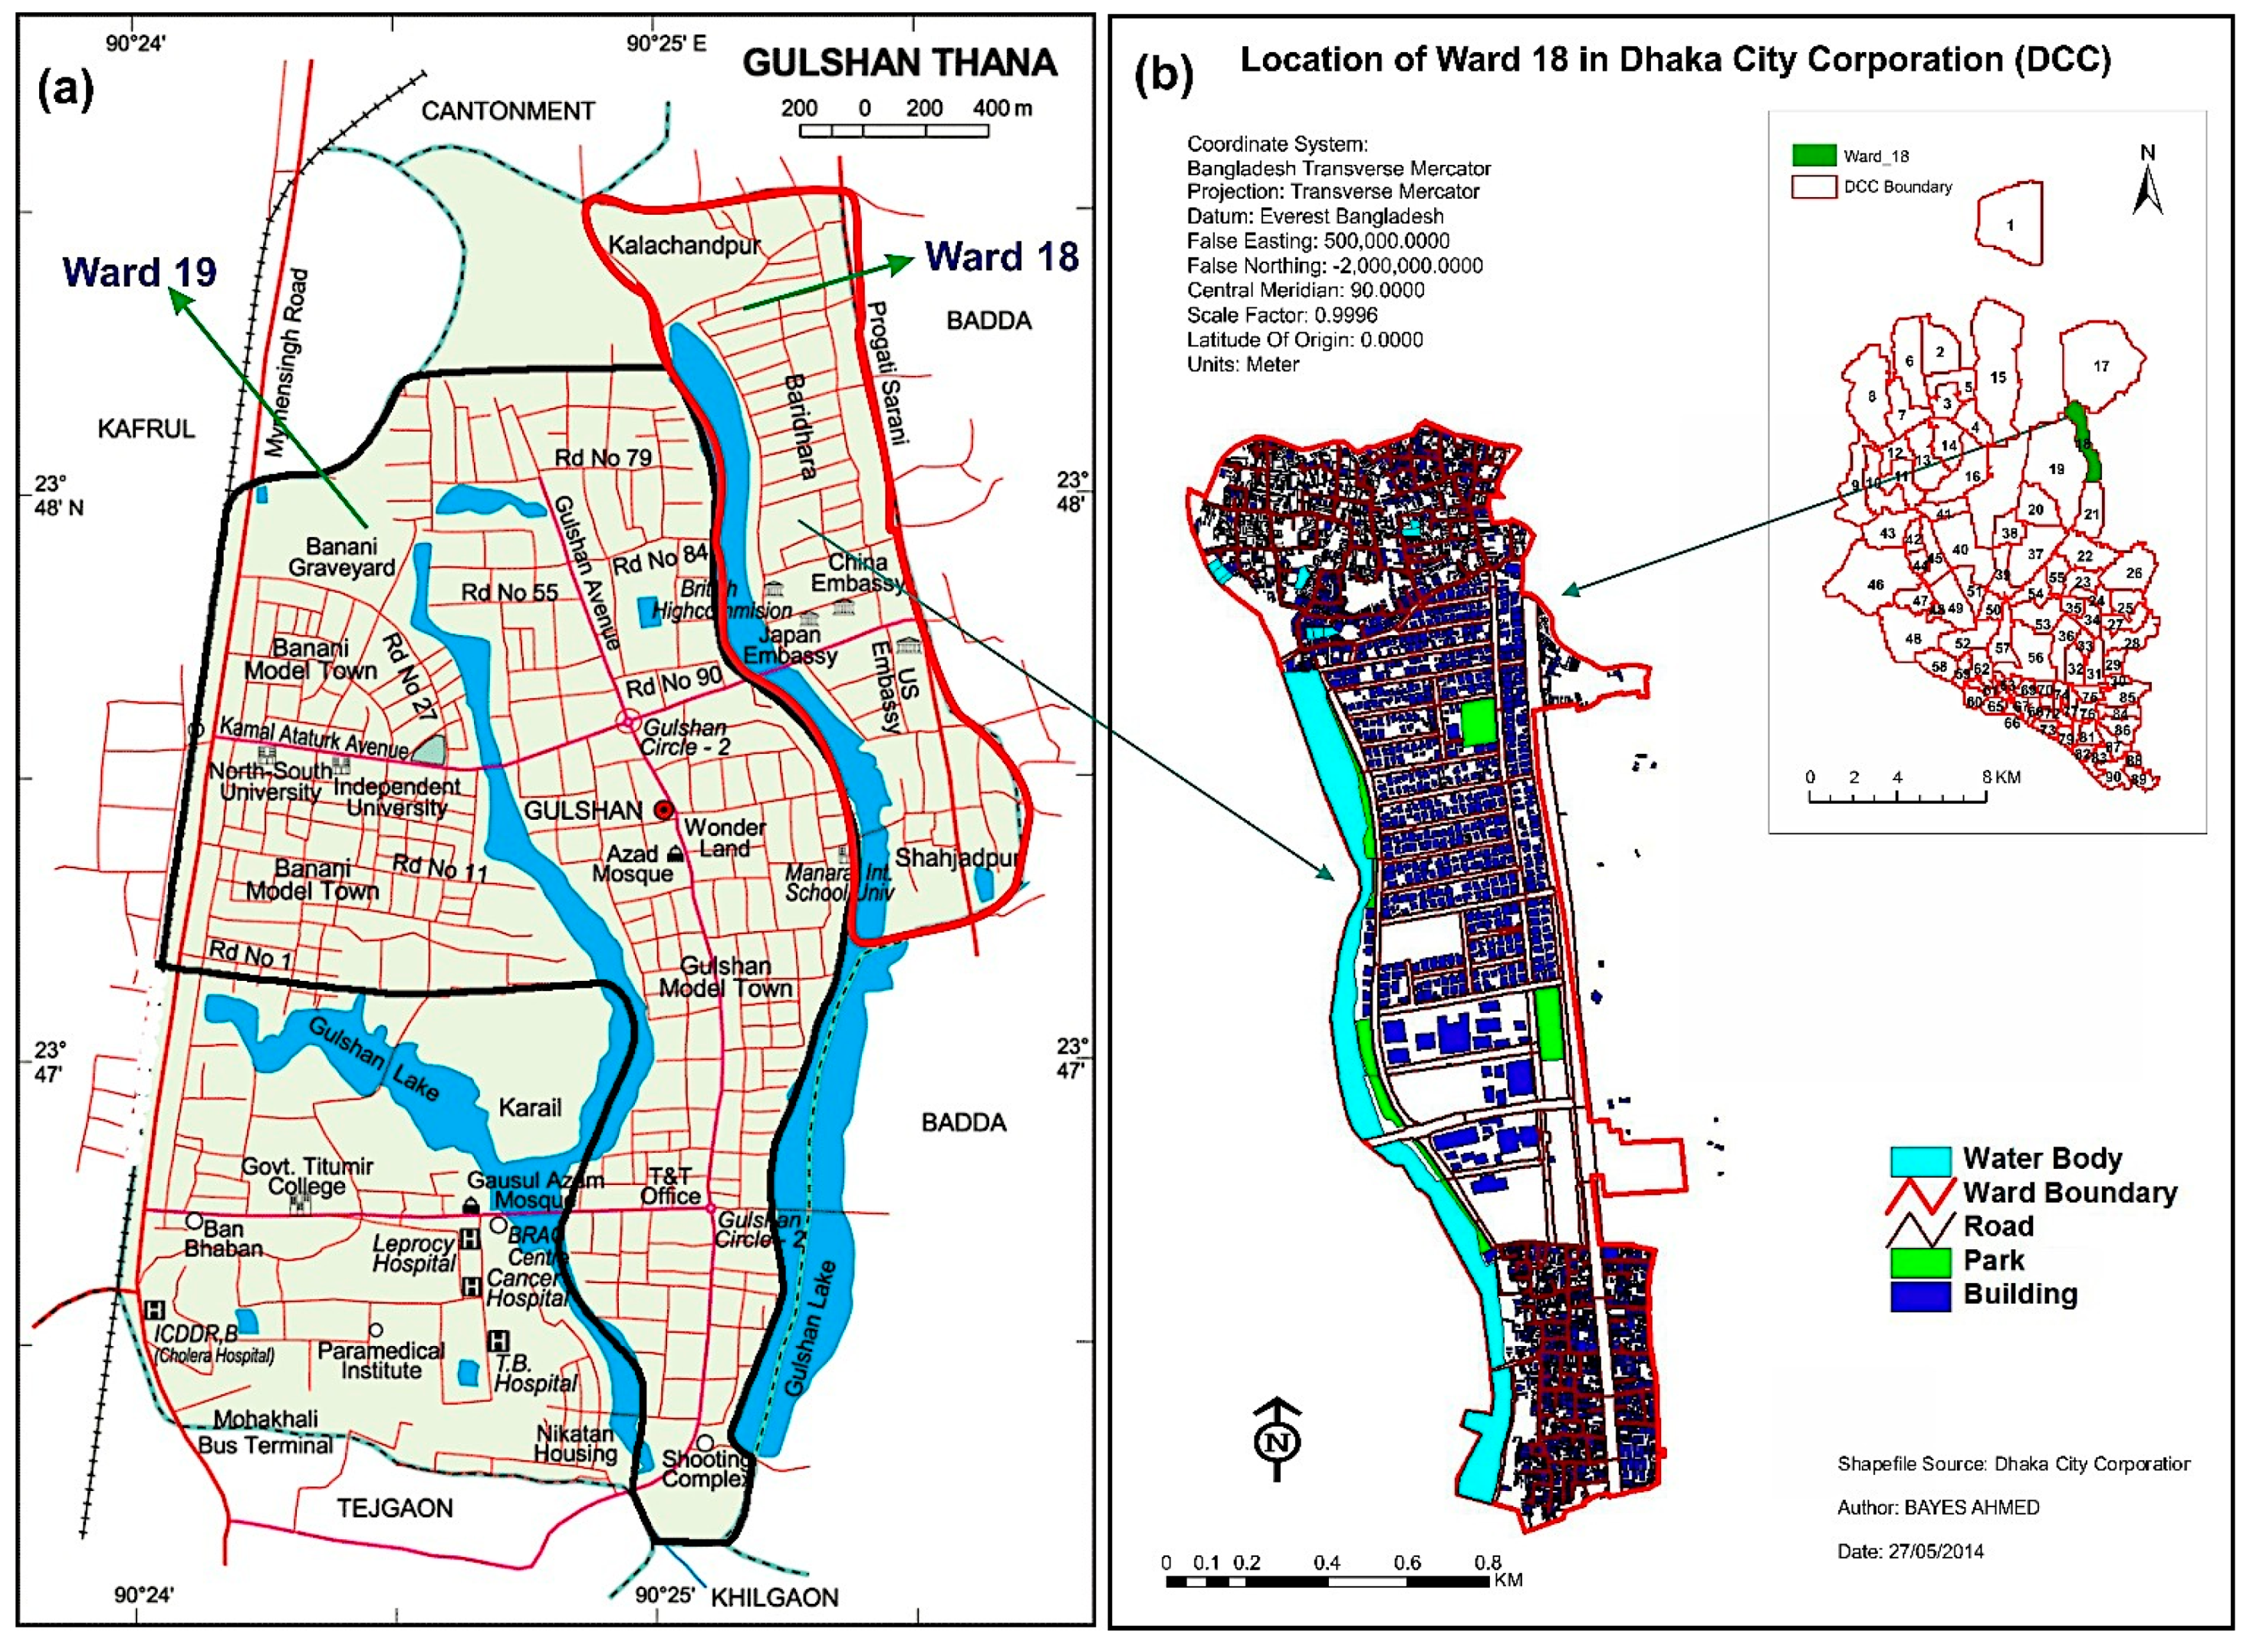
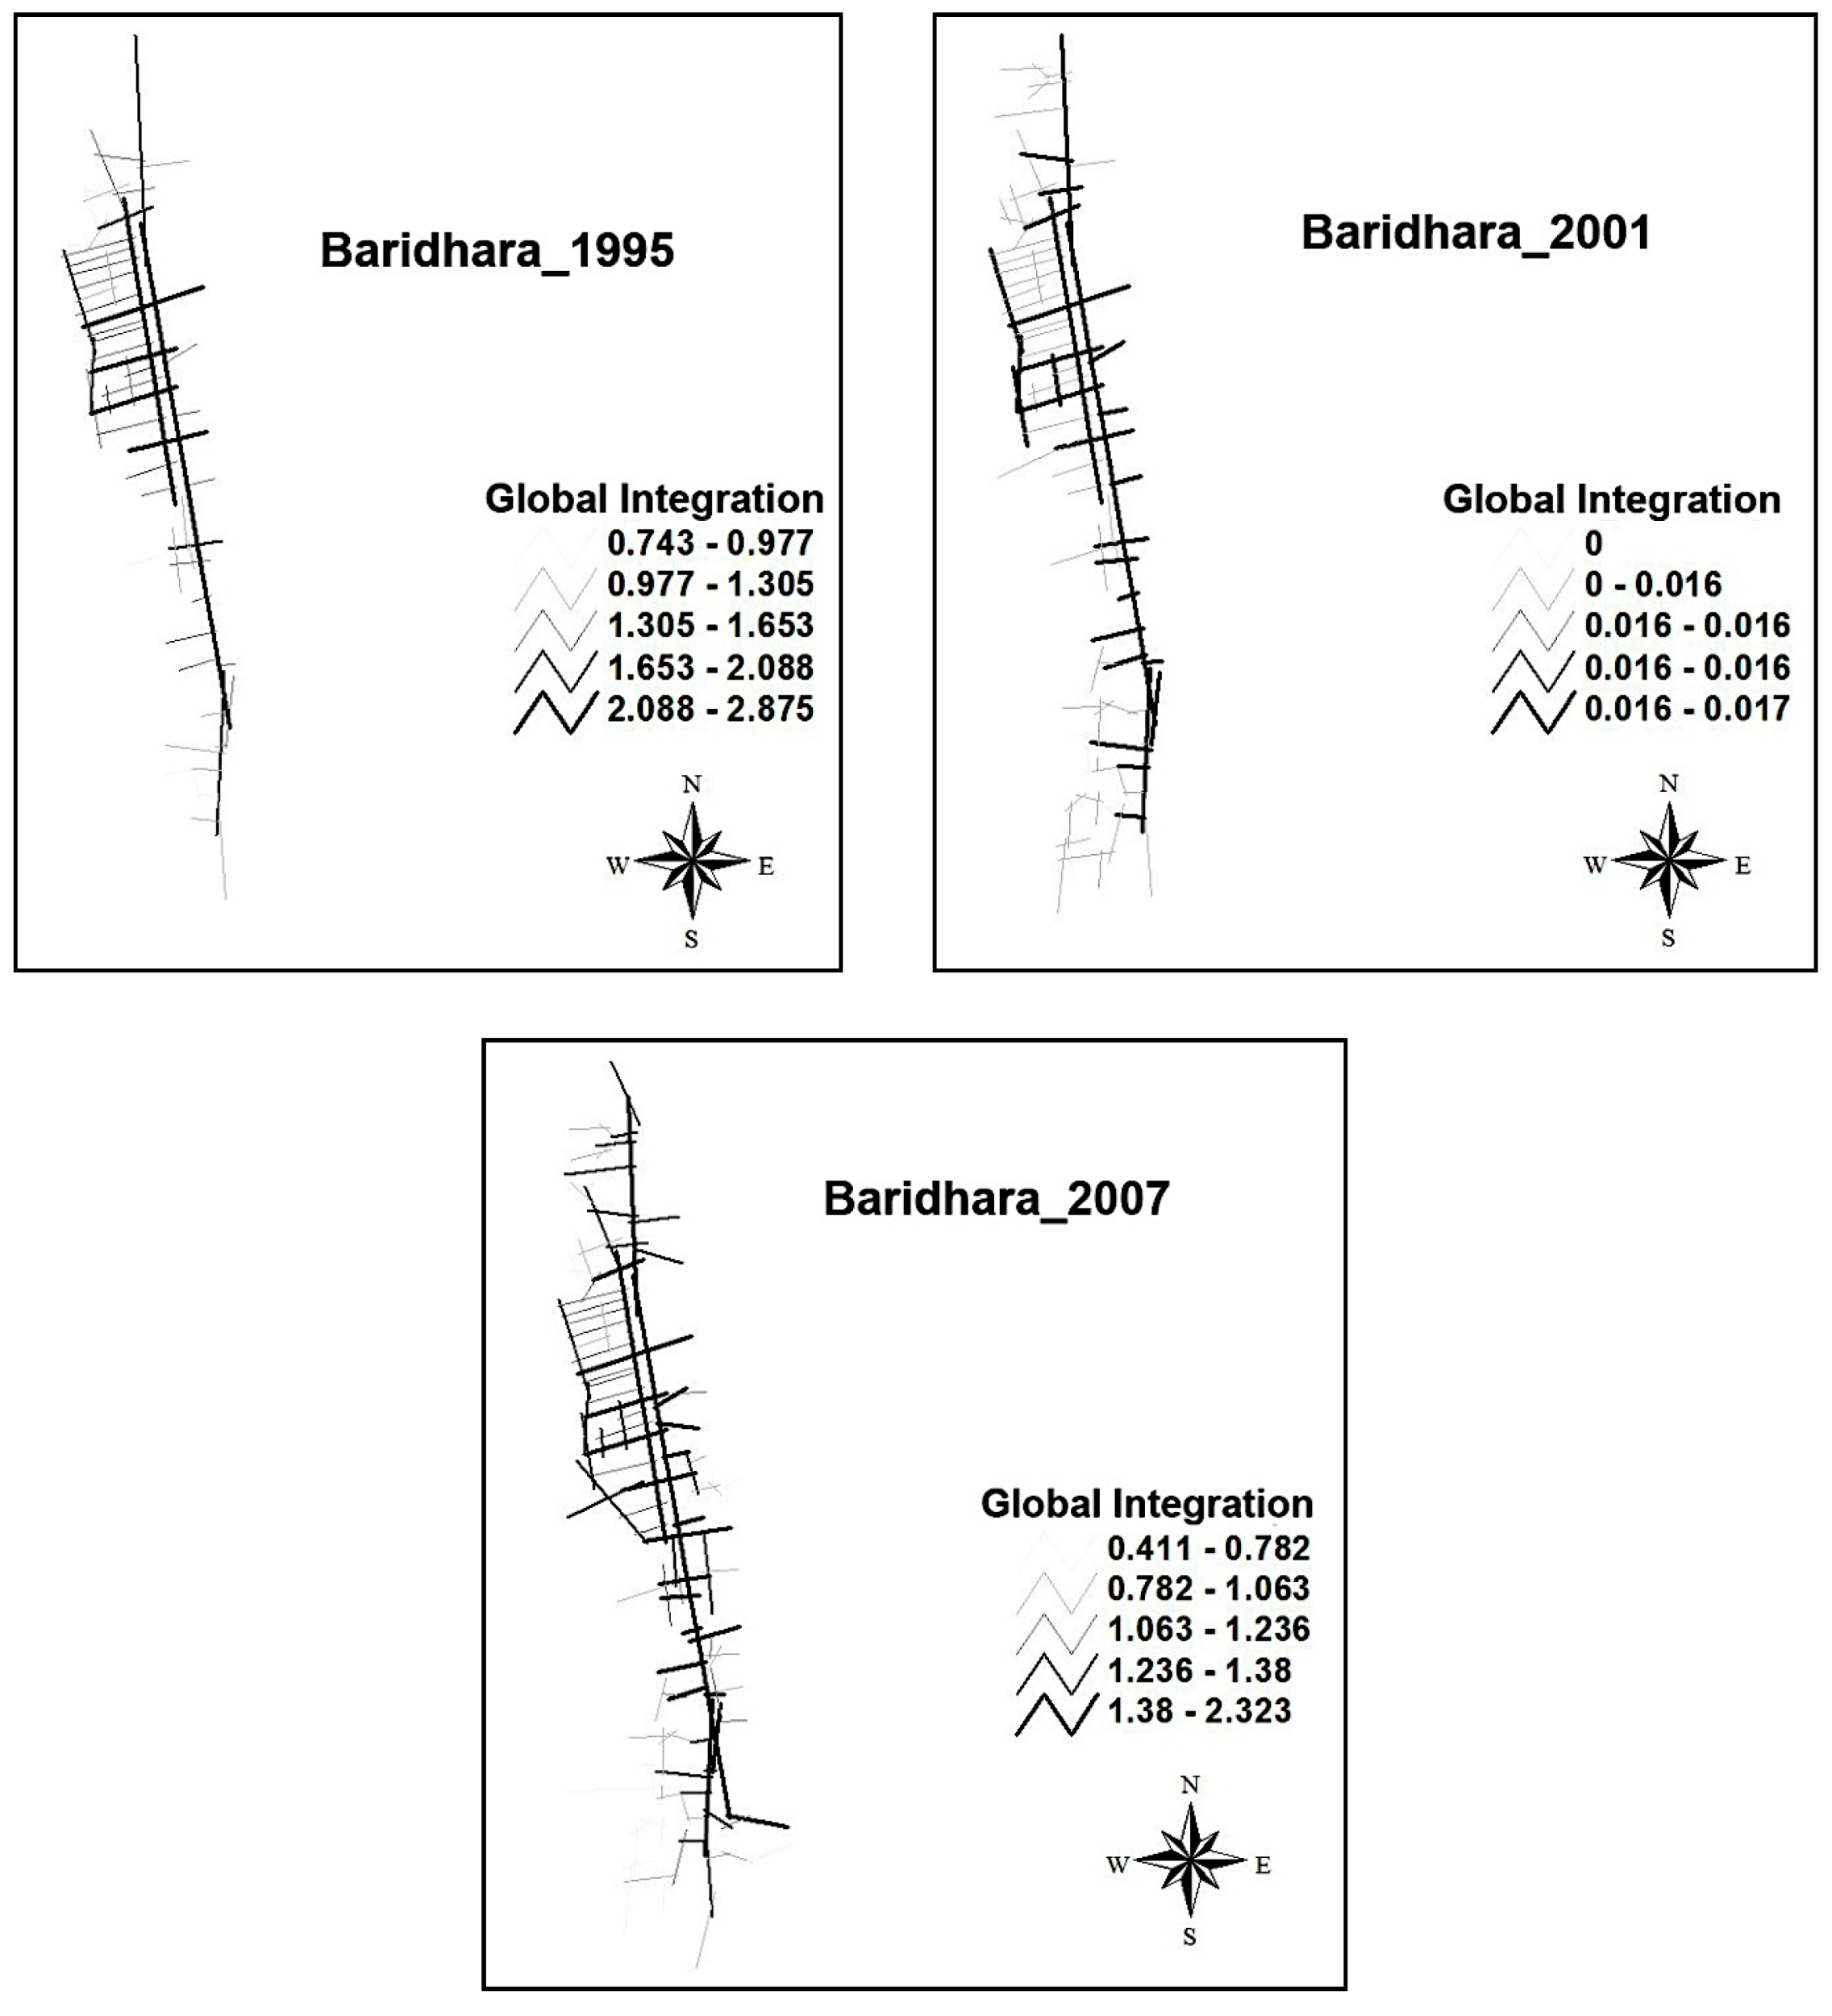
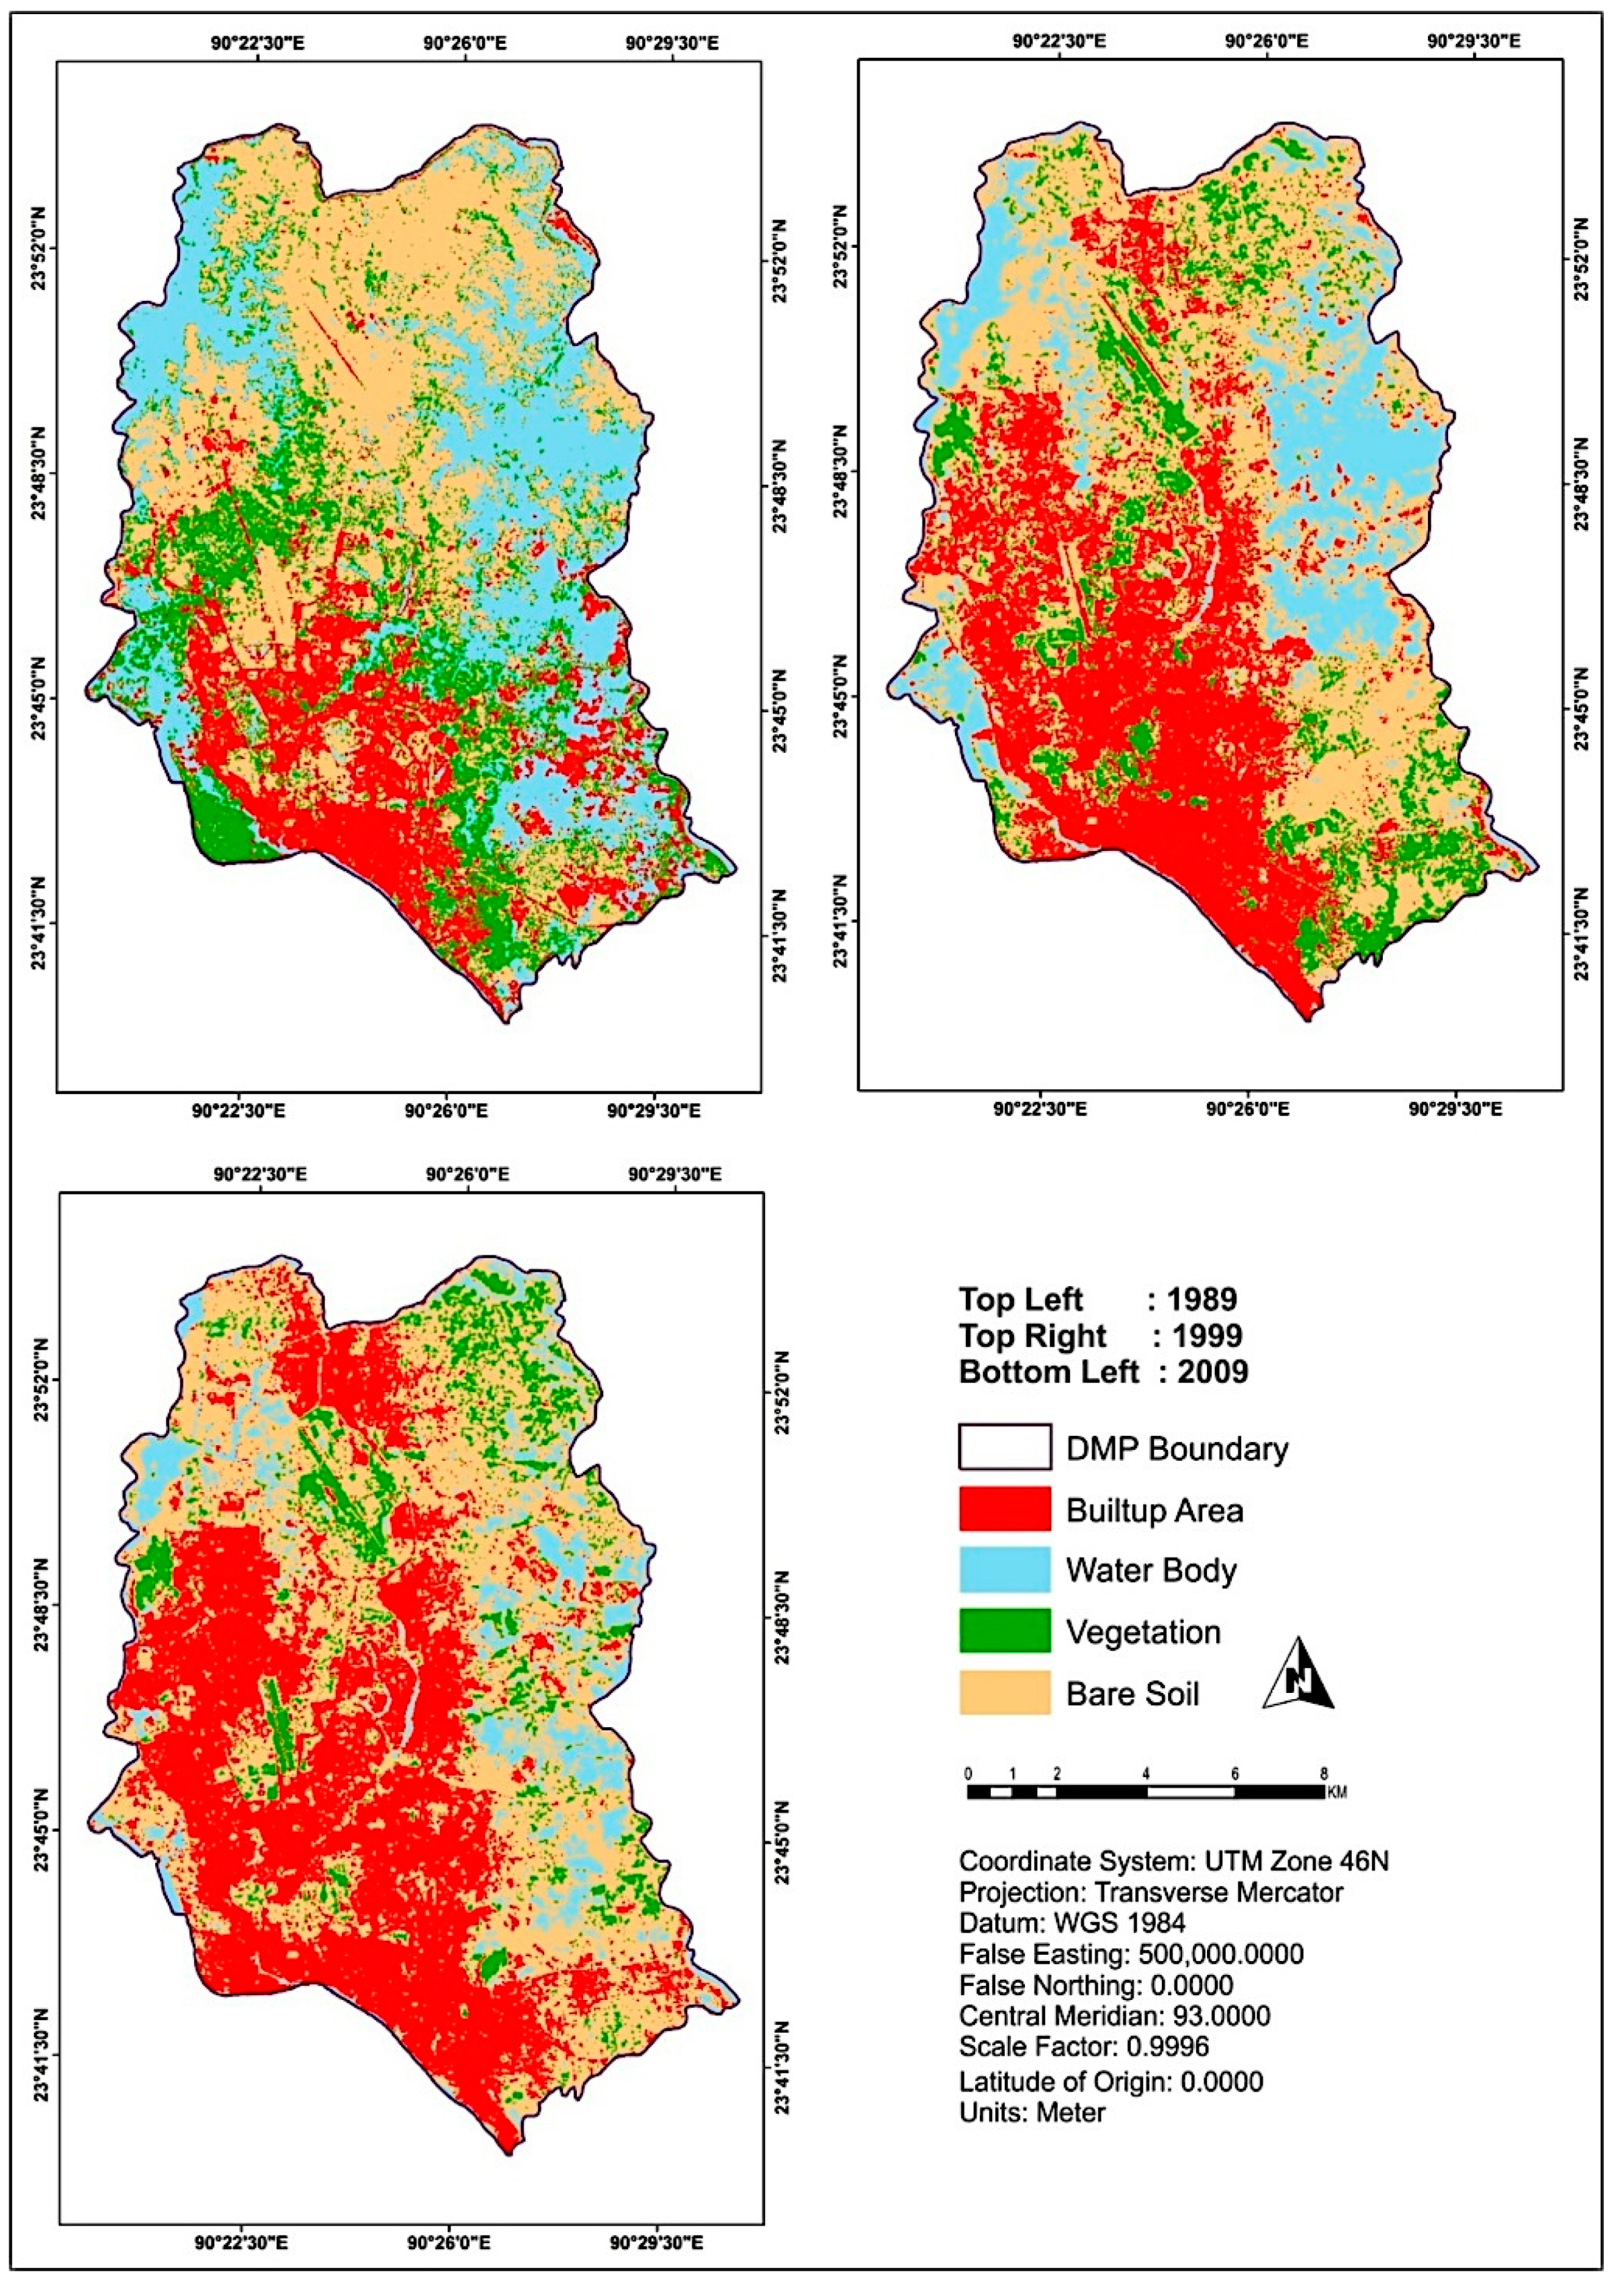
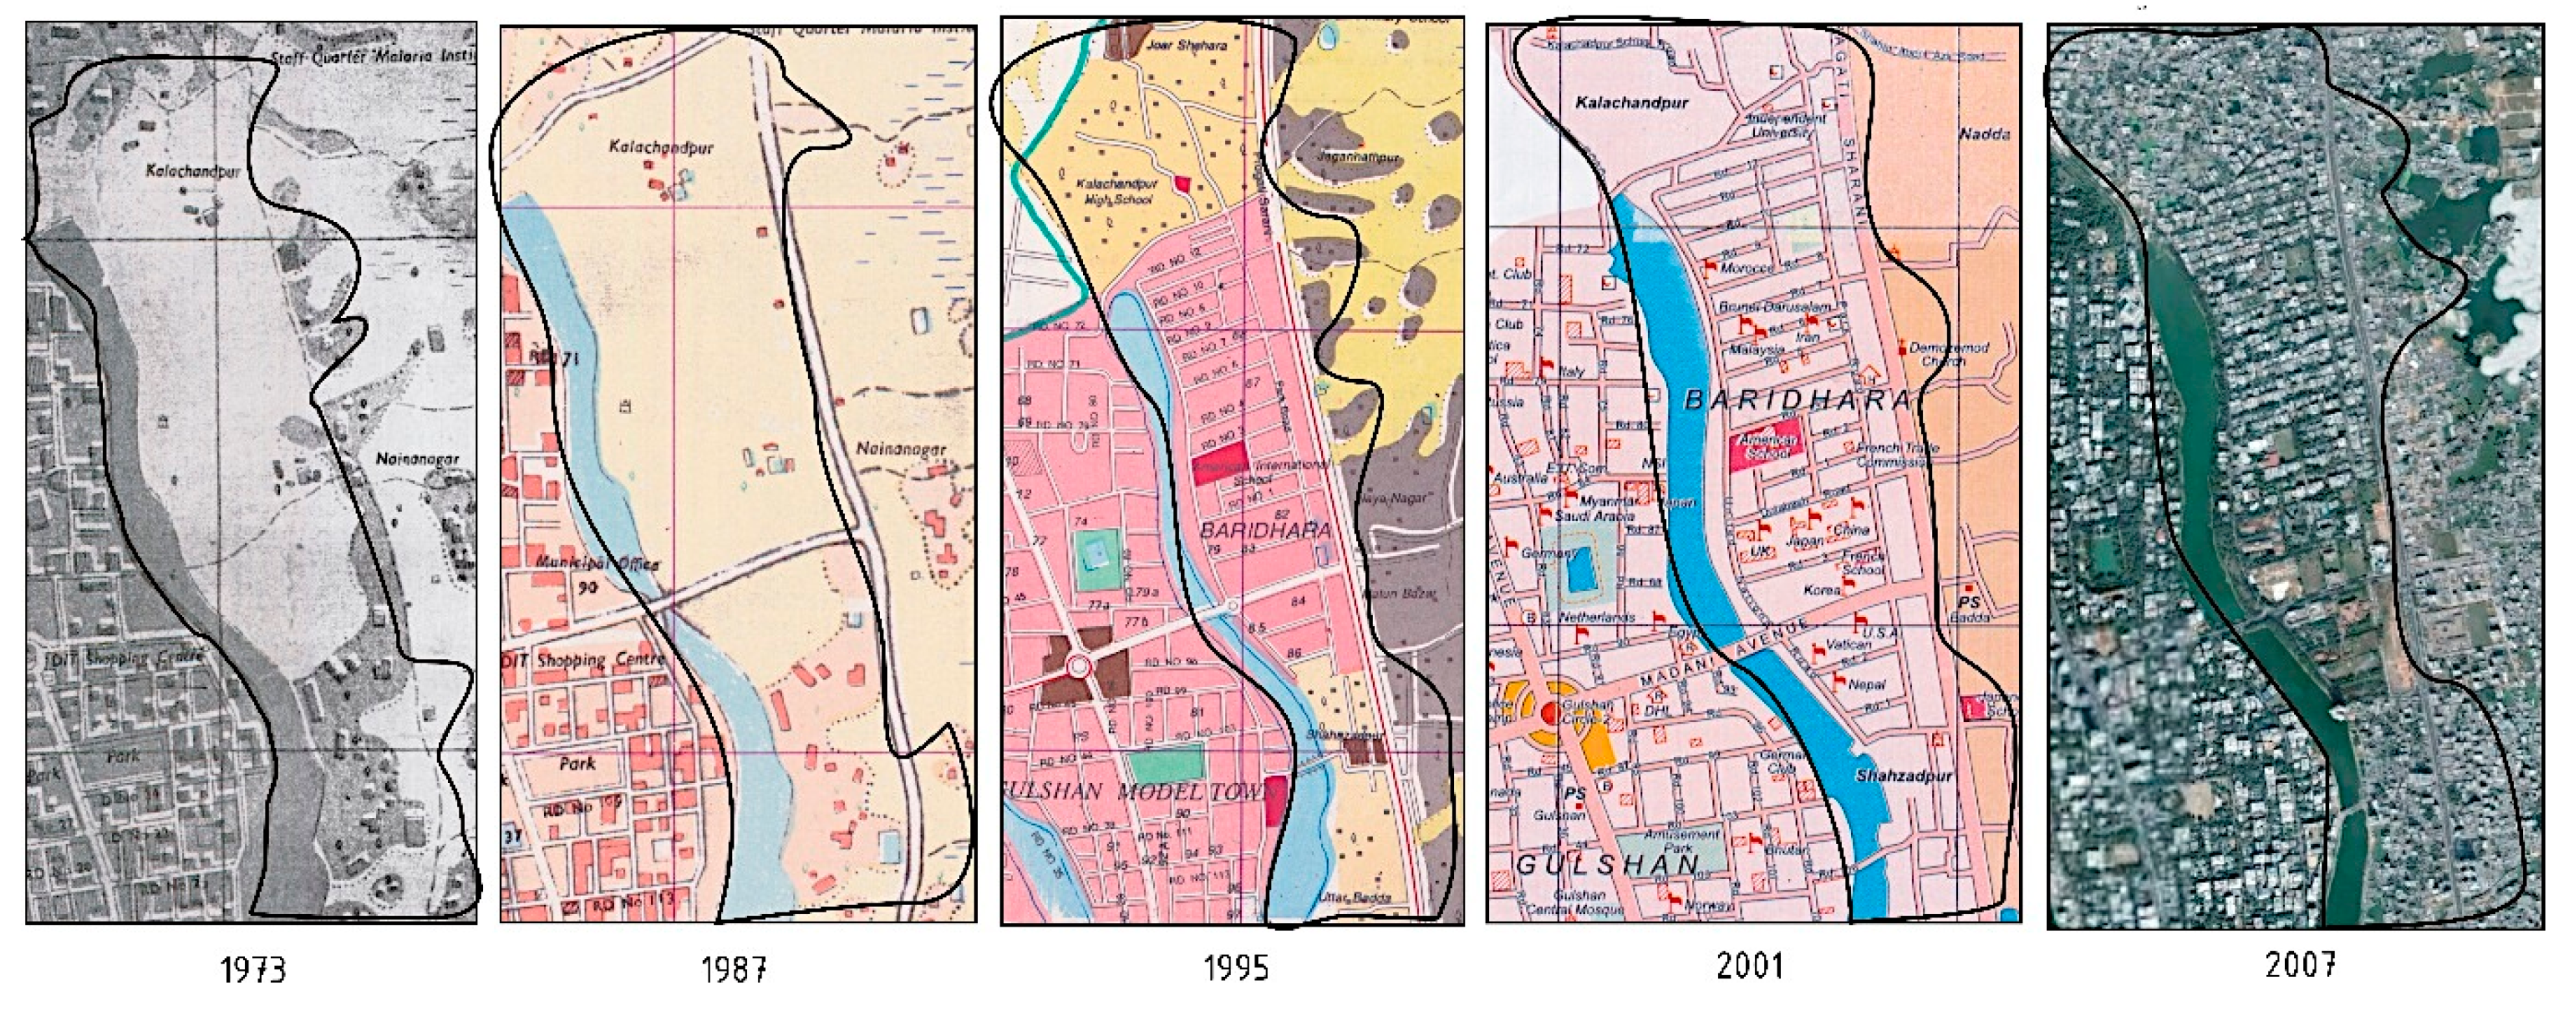
2.2.3. Ward 18: Baridhara, Shahzadpur, and Kalachadpur (Mixed Settlements)

2.3. Data Collection
3. Methodology
3.1. Theoretical Framework
3.2. Space Syntax
4. Findings
4.1. Generating the Syntactic Measures
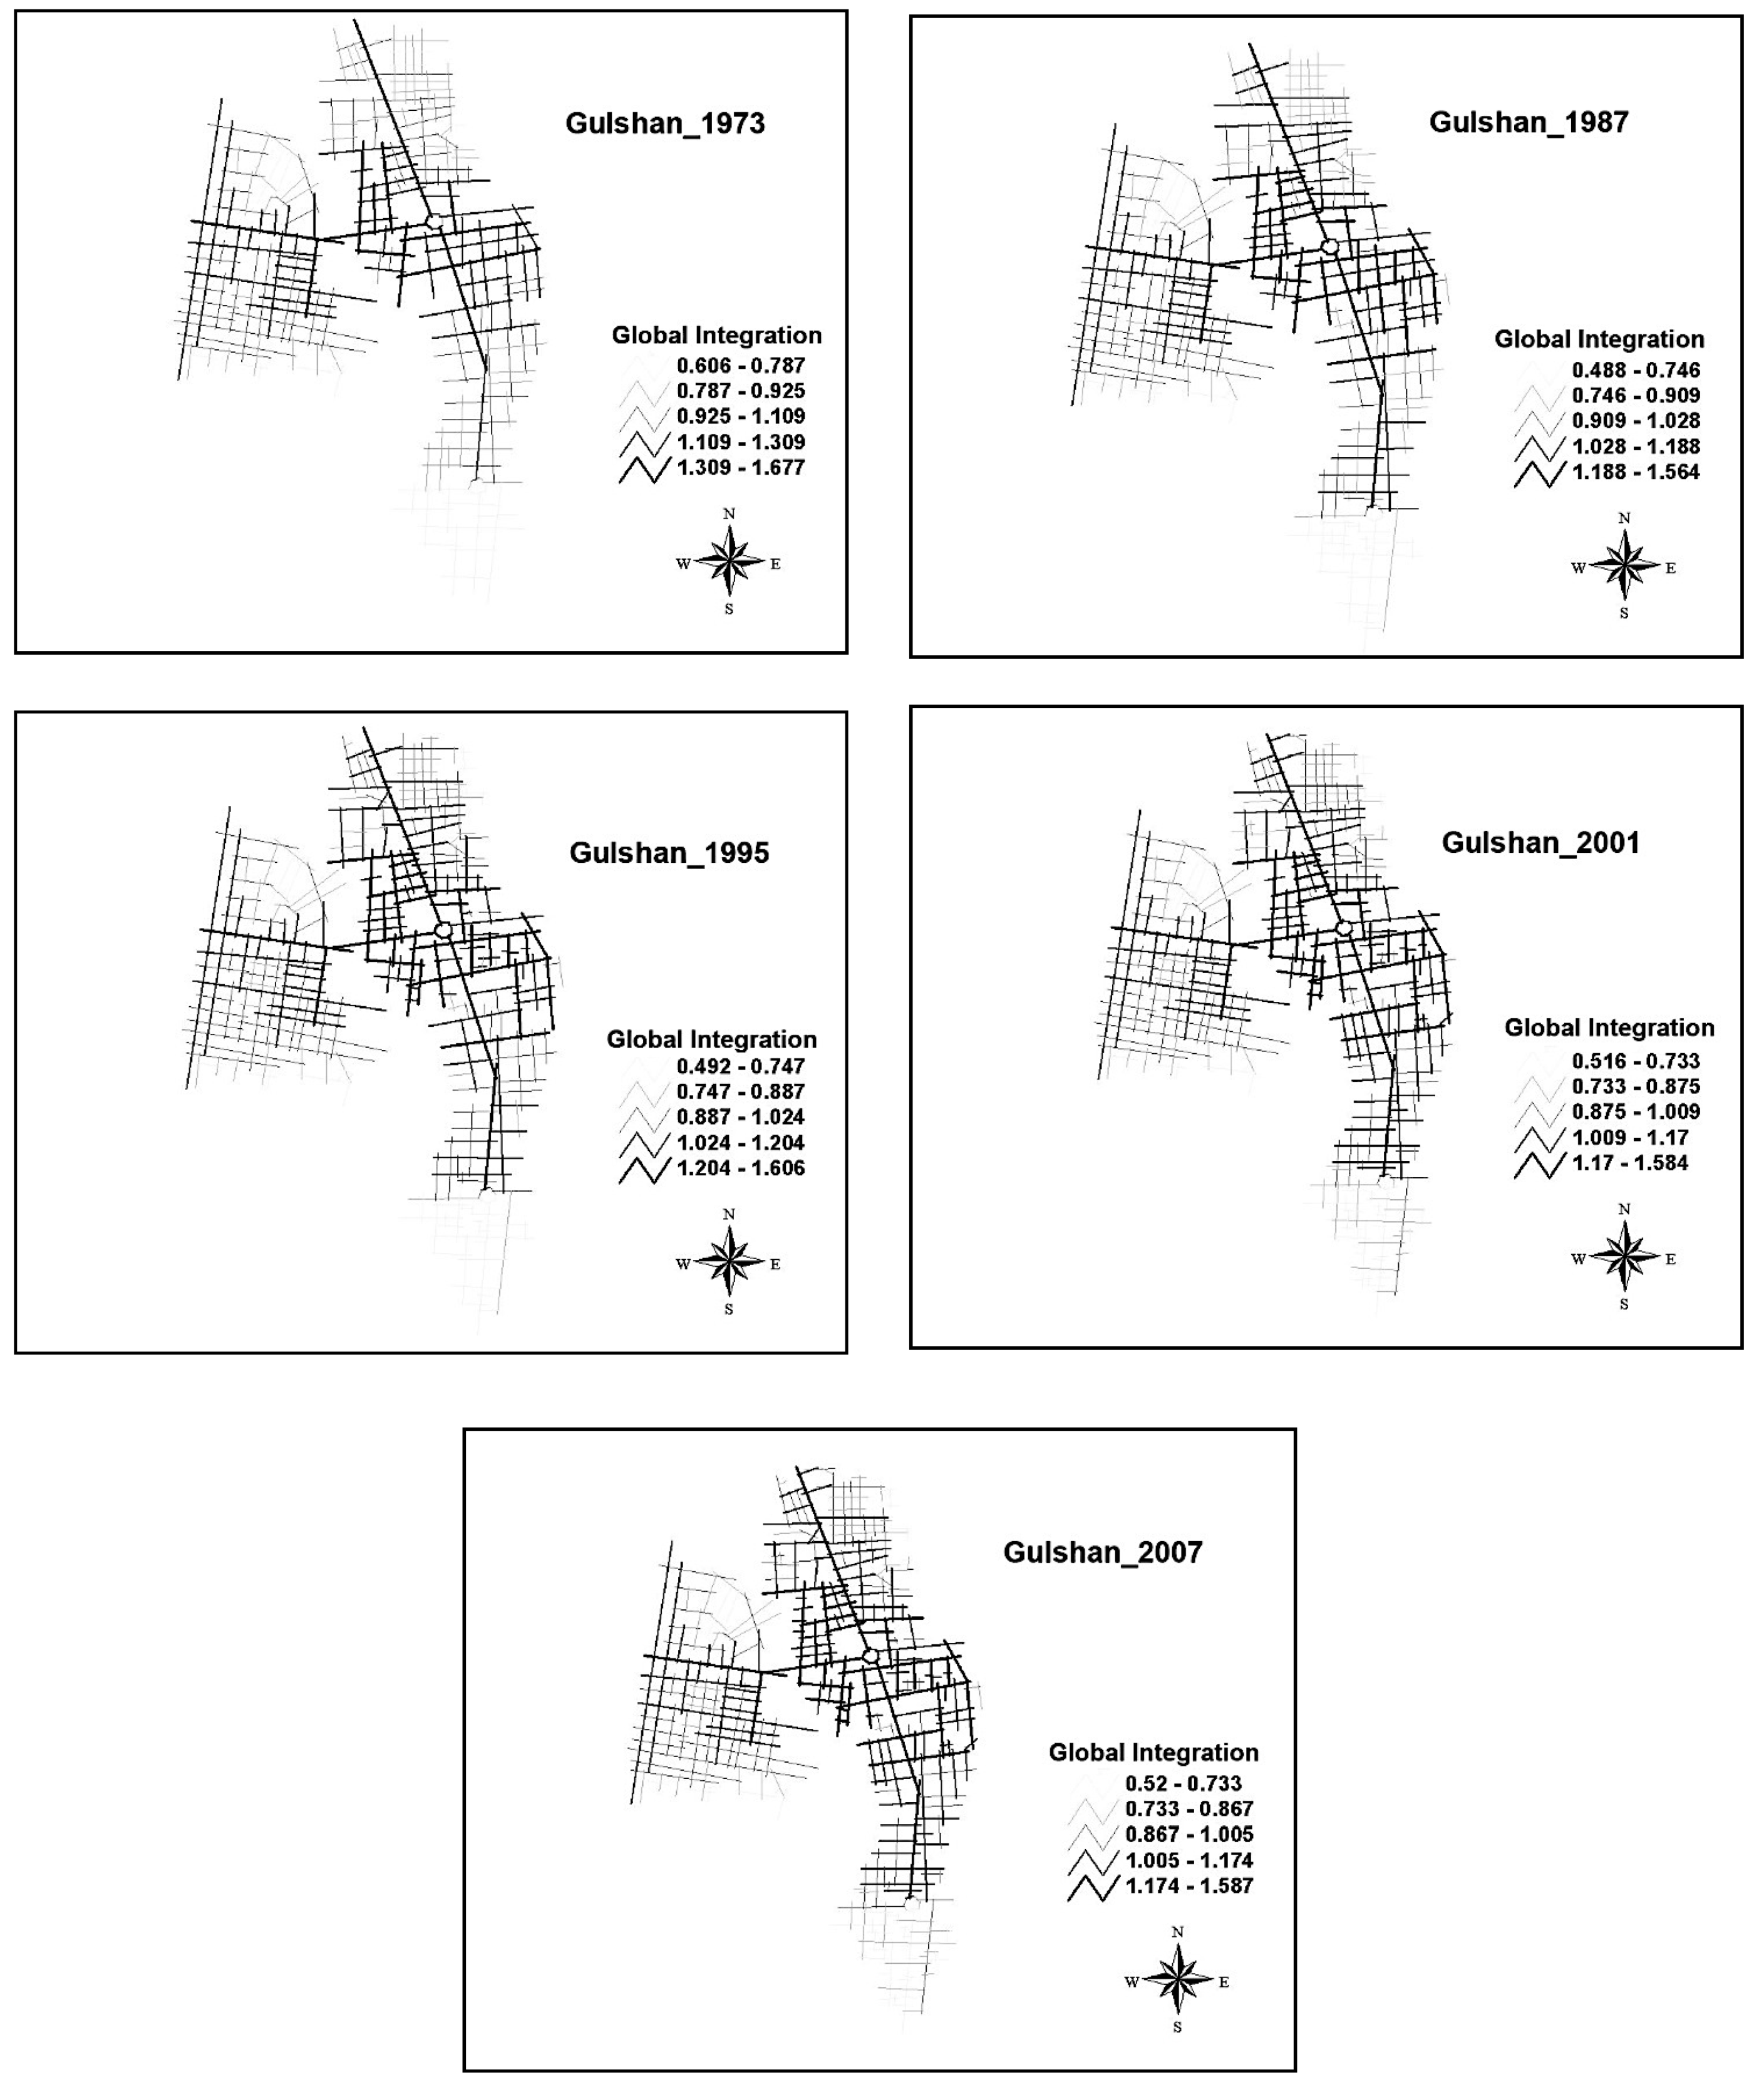
4.1.1. Global Integration Core


4.1.2. Connectivity and Control

4.1.3. Global (R = n) and Local (R = 3) Integration Pattern

4.1.4. Intelligibility


4.2. Analyses of the Syntactic Measures
4.2.1. Summary of the Syntactic Analysis of Ward 72
- (a)
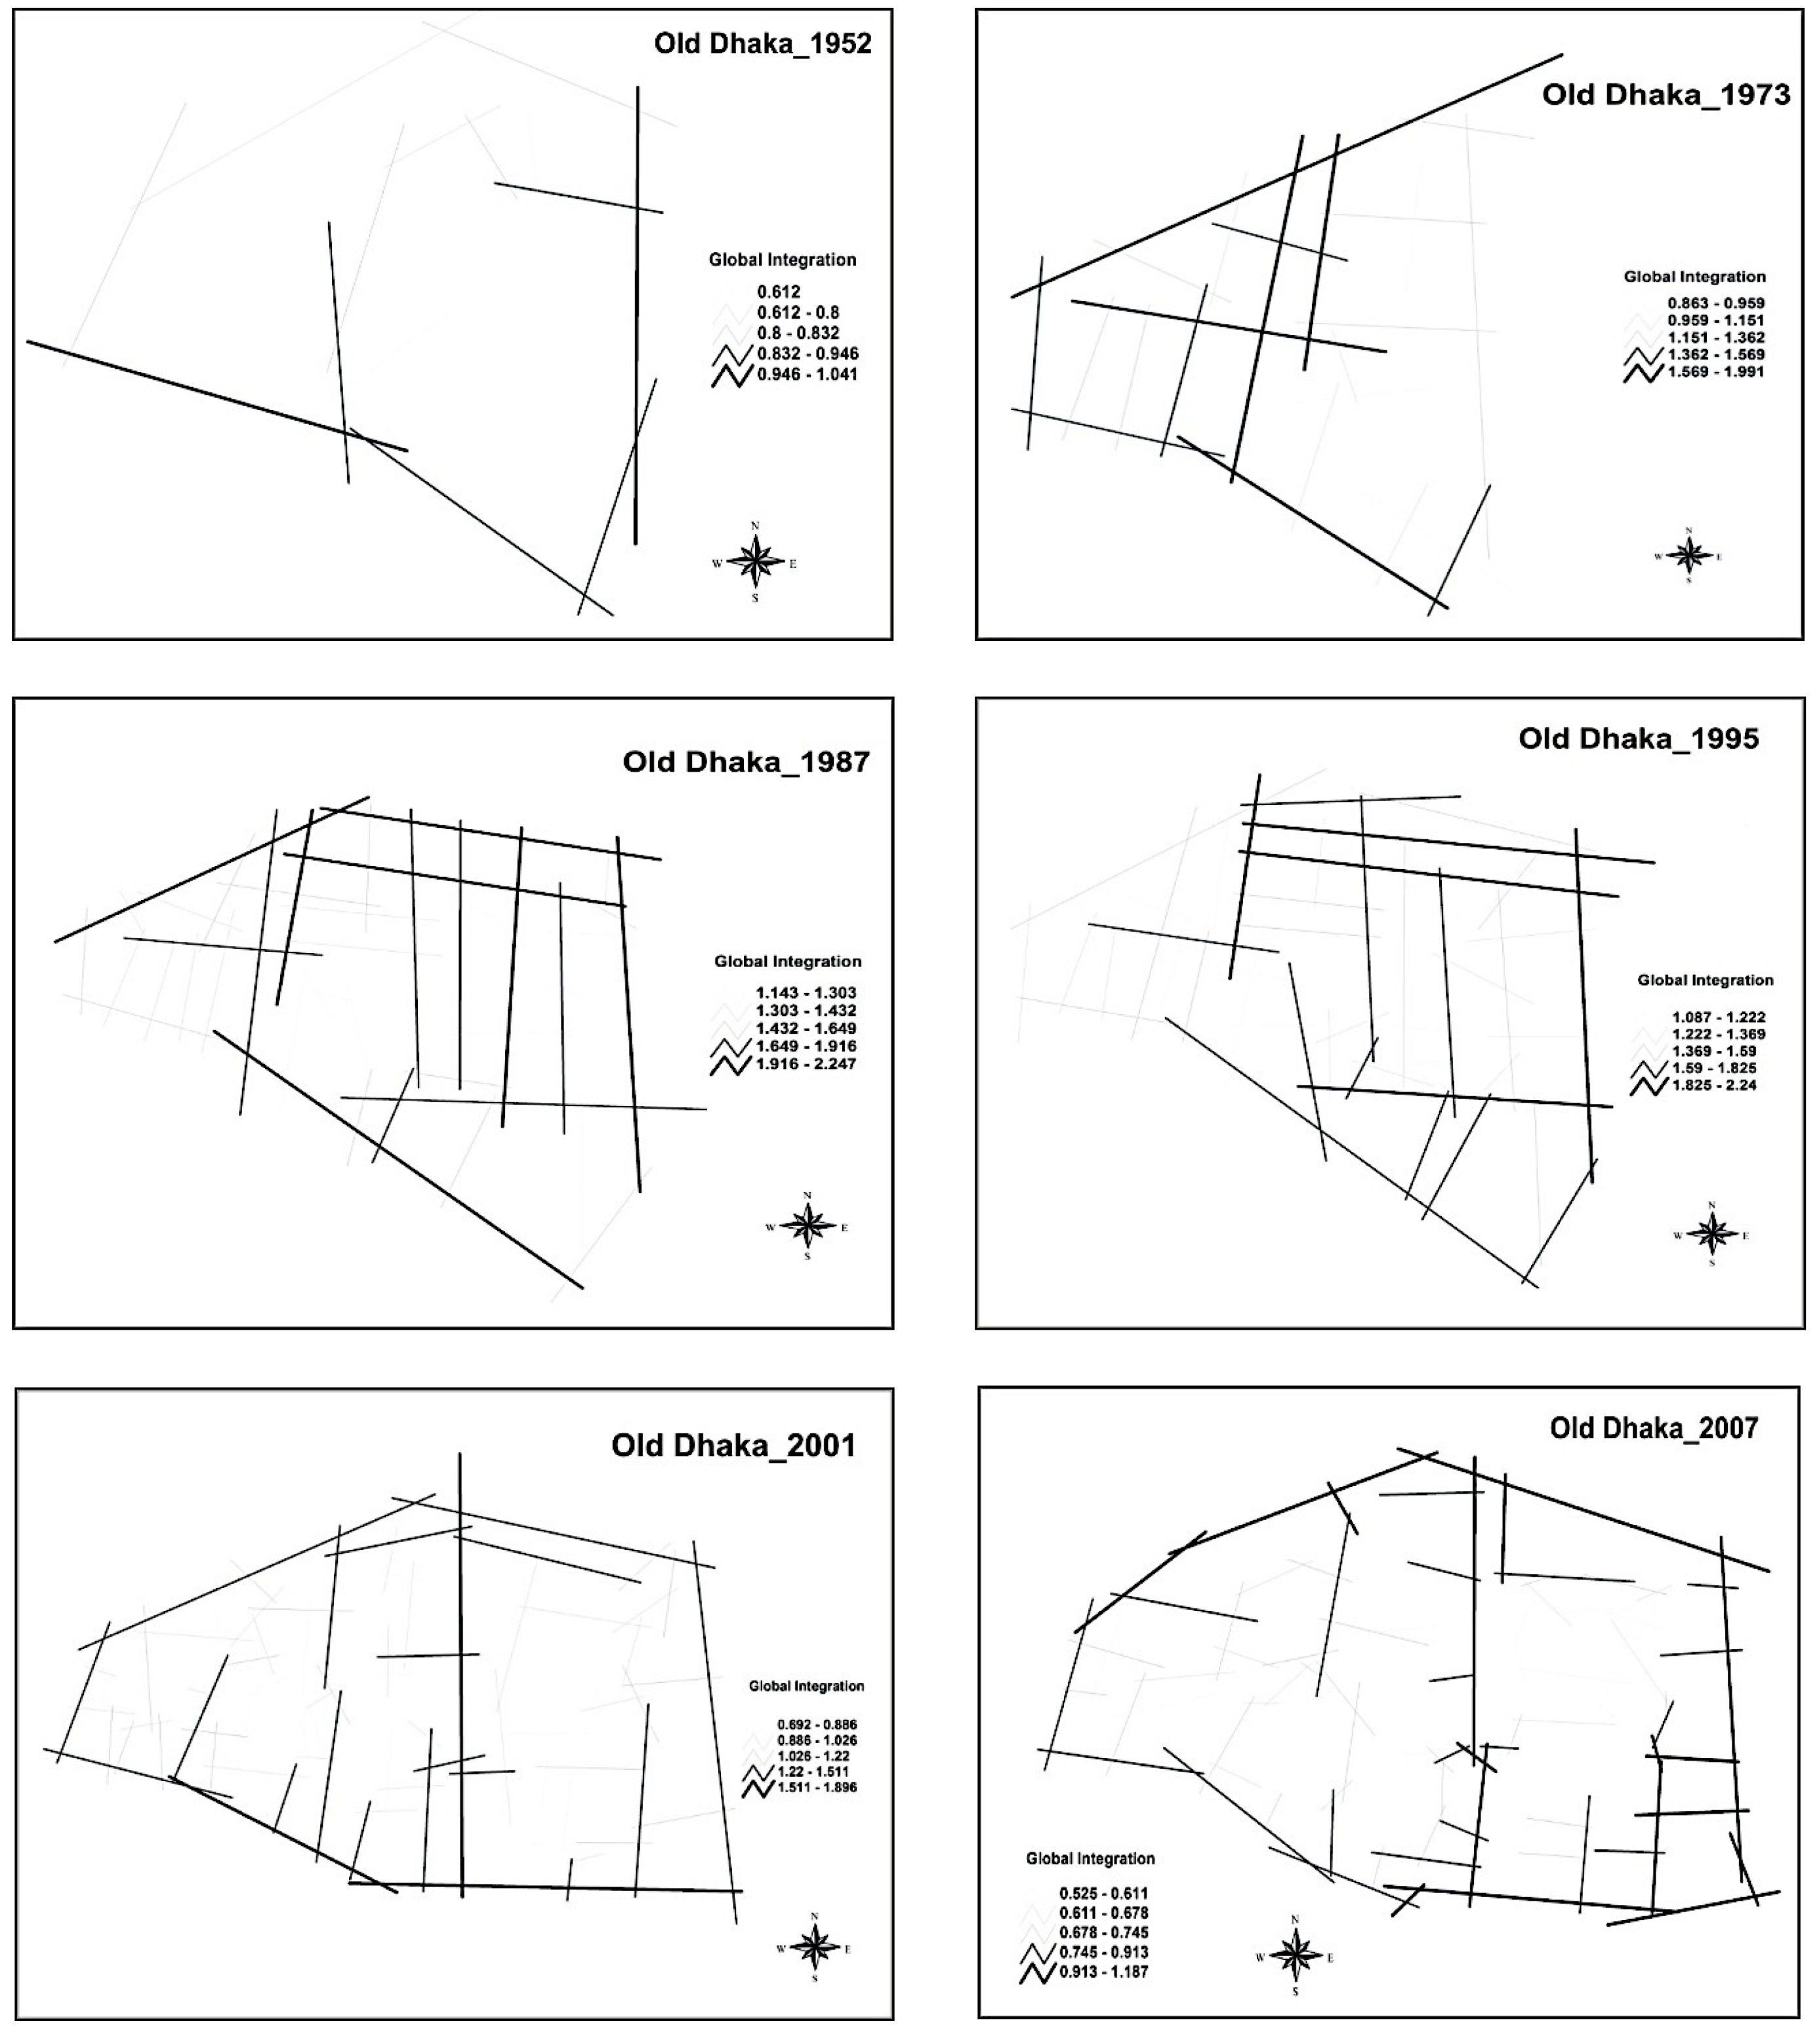
- The integration core lies generally along Shakhari Bazar Road, English Road, Johnson Road, and Kotwali Road (Figure 6). These roads are the important administrative and commercial hubs of this area.
- (b)
- The number of segments in the core is increasing throughout the years (Table 1). It means that the road network is expanding.
- (c)
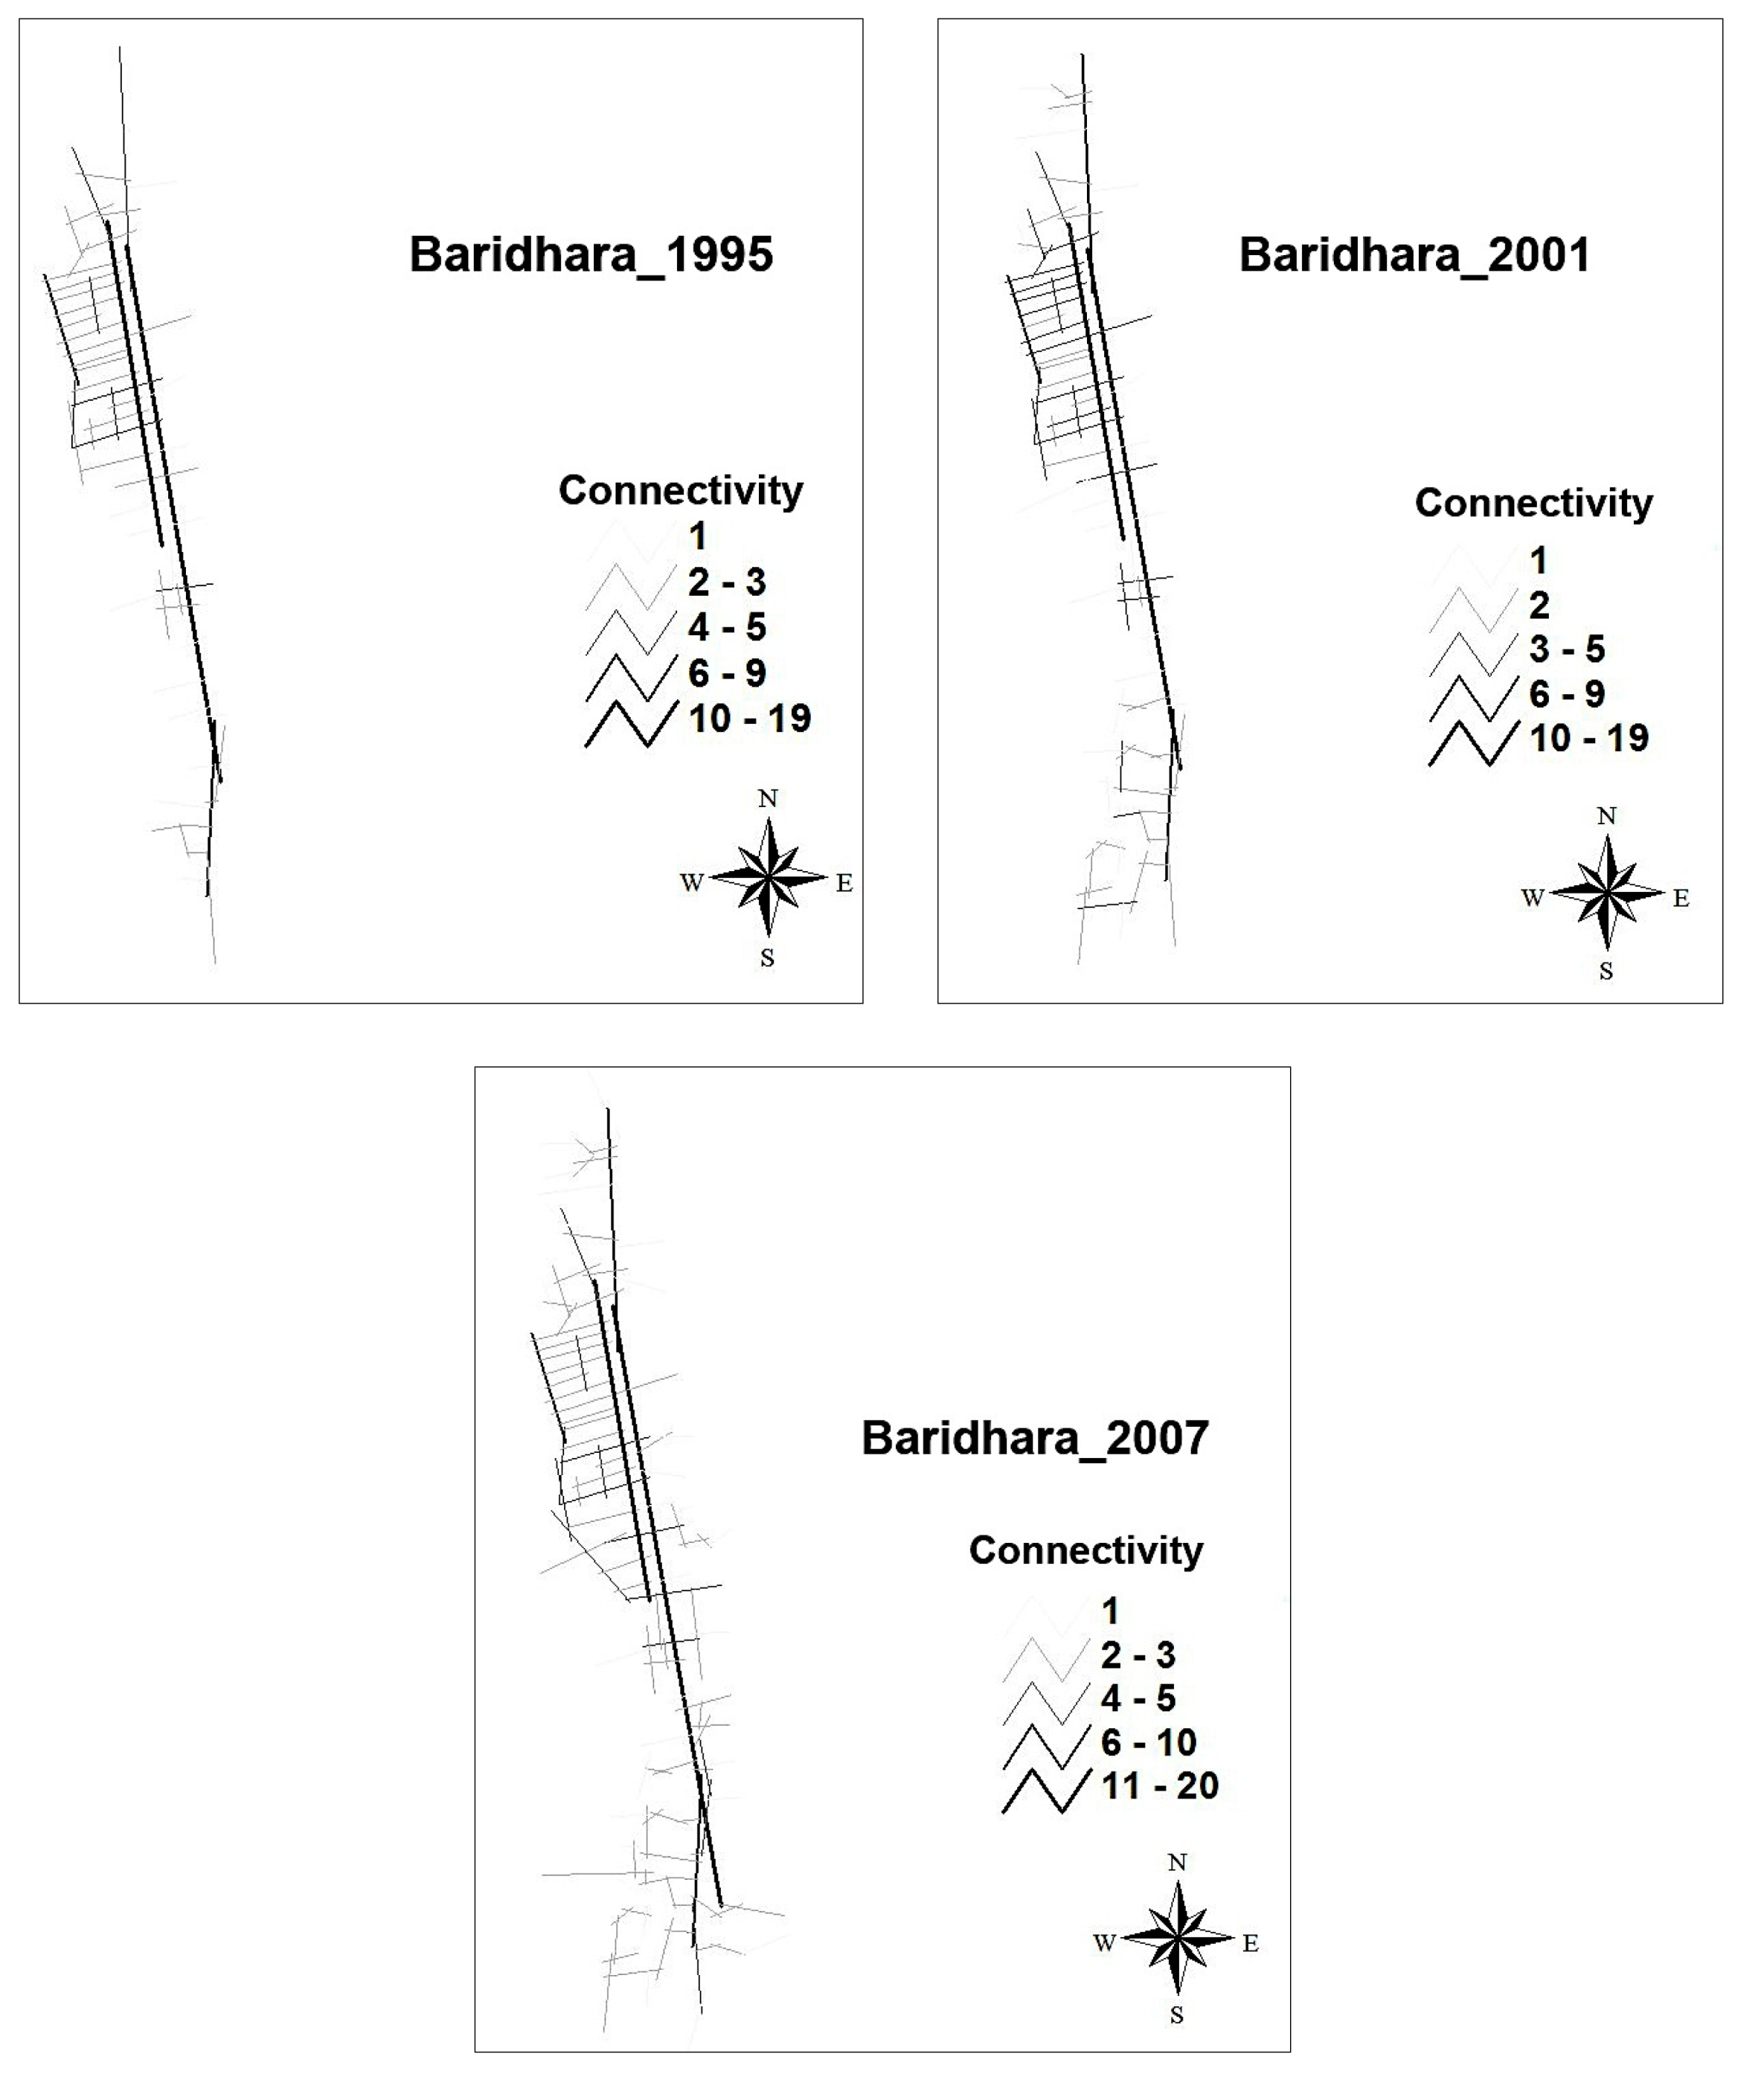
- Shakhari Bazar and Kotwali roads show the highest connectivity and control values over the years (Figure 9).
- (d)
- The global and local integration remain almost constant and balanced in all phases (Table 1). This indicates that the locally important roads are always important for the local inhabitants irrespective of the global measures.
- (e)
- It also suggests that the changes in the urban grid in recent times were particularly detrimental. Actually, throughout the years, the population density and building height of this area was increasing without recourse to any formal planning. This has led to locally important roads being isolated and disintegrated from the urban core.

| Syntactic Measures | Time Period | 1952 | 1973 | 1987 | 1995 | 2001 | 2007 |
|---|---|---|---|---|---|---|---|
| Integration Global R = n | Segment No. | 14 | 24 | 44 | 48 | 79 | 87 |
| R = n Max | 1.0405 | 1.9912 | 2.2465 | 2.2398 | 1.8958 | 1.1870 | |
| R = n Min | 0.6120 | 0.8628 | 1.1430 | 1.0869 | 0.6921 | 0.5247 | |
| R = n Mean | 0.8585 | 1 | 1.5620 | 1 | 1.0818 | 0.7671 | |
| Std. Deviation | 0.1323 | 0.3227 | 0.2674 | 0.2865 | 0.2472 | 0.1510 | |
| Integration Local R = 3 | R = 3 Max | 1.7239 | 2.9422 | 3.6980 | 3.8832 | 3.2143 | 3.0309 |
| R = 3 Min | 0.5000 | 0.5000 | 1.2737 | 1.1634 | 0.2109 | 0.2109 | |
| R = 3 Mean | 1.2098 | 1.8533 | 2 | 2.2081 | 1.5369 | 1.4014 | |
| Std. Deviation | 0.3994 | 0.6220 | 0.6624 | 0.6752 | 1 | 0.5725 | |
| Connectivity (CN) | CN Max | 3 | 6 | 9 | 10 | 7 | 6 |
| CN Min | 1 | 1 | 2 | 2 | 1 | 1 | |
| CN Mean | 2 | 3 | 4 | 3.6250 | 2.6075 | 2.3448 | |
| Std. Deviation | 0.6629 | 1.4116 | 2.1085 | 2.1499 | 1.2951 | 1.0764 | |
| Control (CV) | CV Max | 1.8333 | 2.2833 | 2.8333 | 3.5595 | 2.3666 | 3.7500 |
| CV Min | 0.3333 | 0.3333 | 0.2539 | 0.2428 | 0.2500 | 0.1666 | |
| CV Mean | 1 | 1 | 1 | 1 | 1 | 1 | |
| Std. Deviation | 0.4529 | 0.6005 | 1 | 0.8586 | 0.5288 | 0.6603 |
- (f)
| Syntactic Measures | Time Period | 1973 | 1987 | 1995 | 2001 | 2007 |
|---|---|---|---|---|---|---|
| Integration Global R = n | Segment No. | 217 | 246 | 280 | 307 | 316 |
| R = n Max | 1.67741 | 1.56433 | 1.60611 | 1.58368 | 1.58726 | |
| R = n Min | 0.60603 | 0.48831 | 0.49204 | 0.51589 | 0.52042 | |
| R = n Mean | 1.01691 | 0.97269 | 0.98003 | 0.96249 | 0.96299 | |
| Std. Deviation | 0.203706 | 0.197051 | 0.201944 | 0.195078 | 0.195516 | |
| Integration Local R = 3 | R = 3 Max | 5.52801 | 5.46918 | 5.58466 | 5.69637 | 5.69637 |
| R = 3 Min | 0.21093 | 0.21093 | 0.21093 | 0.21093 | 0.21093 | |
| R = 3 Mean | 2.34078 | 2.27591 | 2.16151 | 2.15832 | 2.13796 | |
| Std. Deviation | 0.832402 | 0.880432 | 0.934867 | 0.954401 | 0.962622 | |
| Connectivity (CN) | CN Max | 21 | 21 | 22 | 23 | 23 |
| CN Min | 1 | 1 | 1 | 1 | 1 | |
| CN Mean | 4.15668 | 4 | 3.77857 | 3.70033 | 3.65823 | |
| Std. Deviation | 2.762742 | 2.812509 | 2.814626 | 2.901673 | 2.897776 | |
| Control (CV) | CV Max | 5.81071 | 5.83333 | 6.05238 | 8.30952 | 8.30952 |
| CV Min | 0.12500 | 0.08333 | 0.09091 | 0.07143 | 0.07143 | |
| CV Mean | 1 | 1 | 1 | 1 | 1 | |
| Std. Deviation | 0.748989 | 0.824897 | 0.82999 | 0.941863 | 0.957755 |
| Syntactic Measures | Time Period | 1995 | 2001 | 2007 |
|---|---|---|---|---|
| Integration Global R = n | Segment No. | 59 | 64 | 116 |
| R = n Max | 2.87544 | 3.13252 | 2.32346 | |
| R = n Min | 0.74309 | 0.90779 | 0.41149 | |
| R = n Mean | 1.50835 | 1.59059 | 1.18374 | |
| Std. Deviation | 0.40984 | 0.42213 | 0.33398 | |
| Integration Local R = 3 | R = 3 Max | 6.75685 | 6.19064 | 6.06299 |
| R = 3 Min | 0.50003 | 0.21093 | 0.21093 | |
| R = 3 Mean | 2.18363 | 2.16773 | 1.79783 | |
| Std. Deviation | 1.03783 | 1.04257 | 1.03977 | |
| Connectivity (CN) | CN Max | 19 | 19 | 20 |
| CN Min | 1 | 1 | 1 | |
| CN Mean | 3.01695 | 2.96875 | 2.70690 | |
| Std. Deviation | 3.15404 | 3.27069 | 2.75686 | |
| Control (CV) | CV Max | 9.70952 | 11.49167 | 9.74167 |
| CV Min | 0.05263 | 0.05556 | 0.05000 | |
| CV Mean | 1.00000 | 1.00000 | 1.00000 | |
| Std. Deviation | 1.72539 | 1.82773 | 1.30540 |
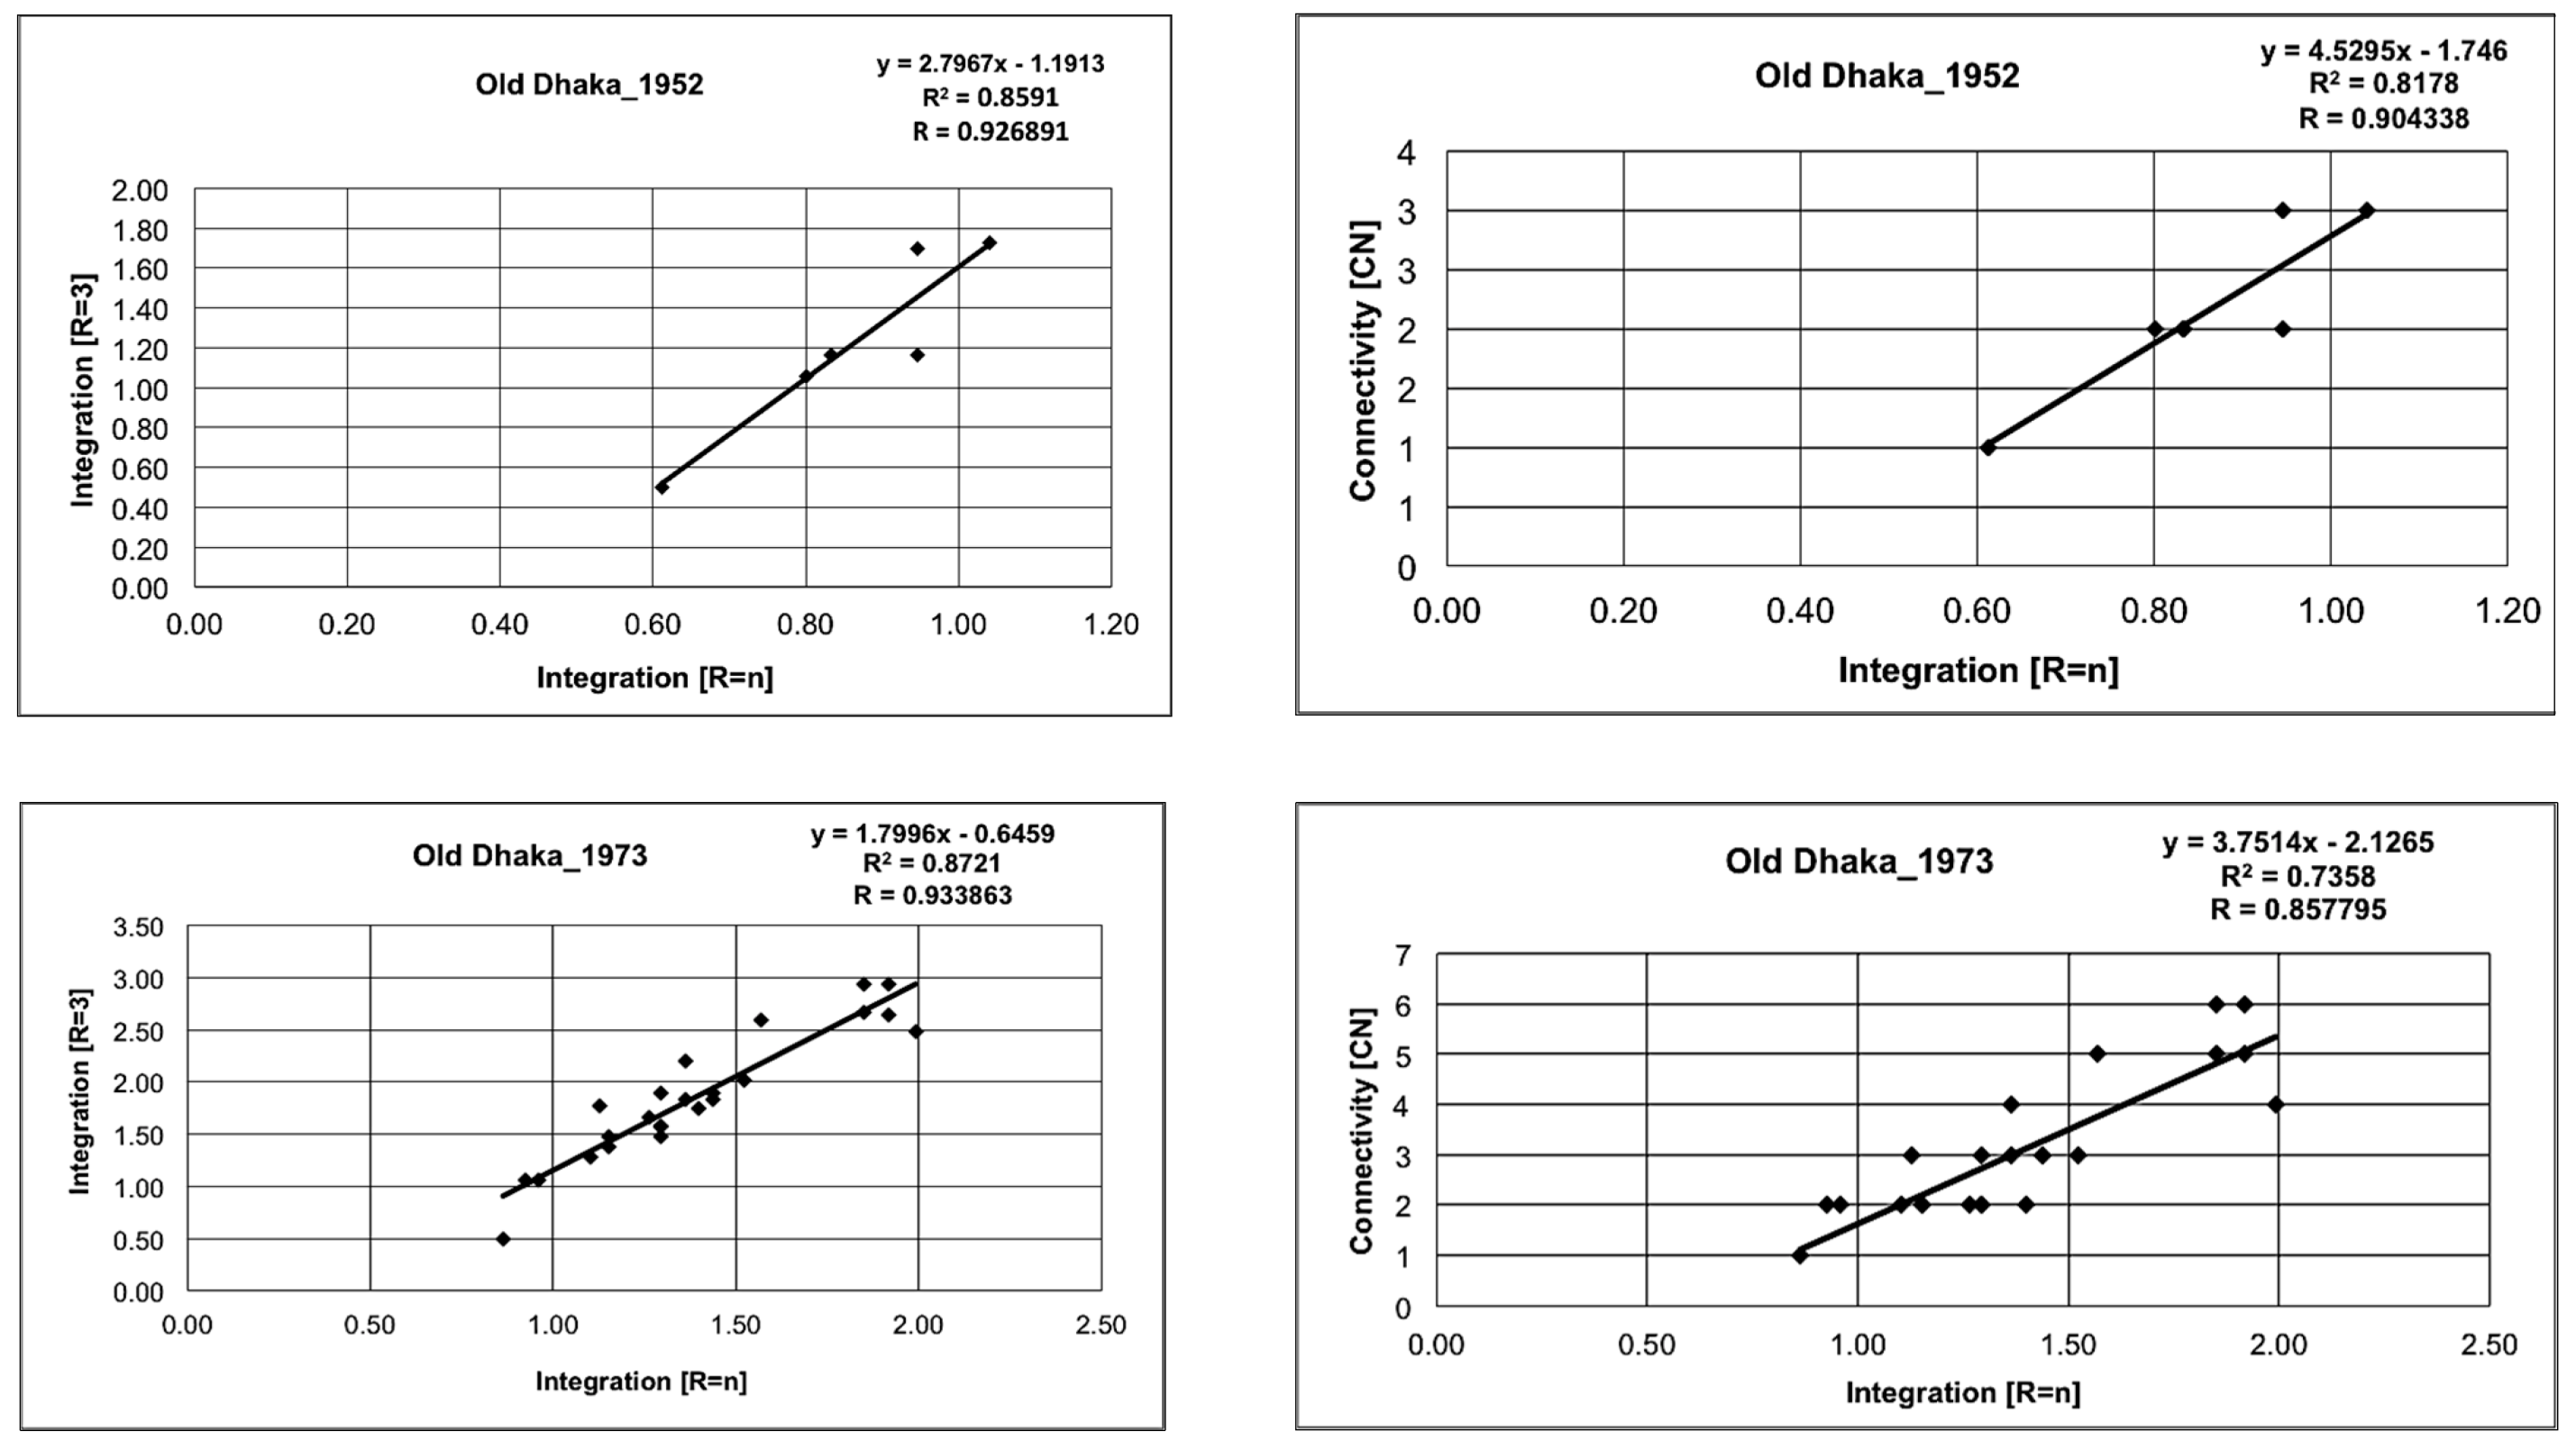
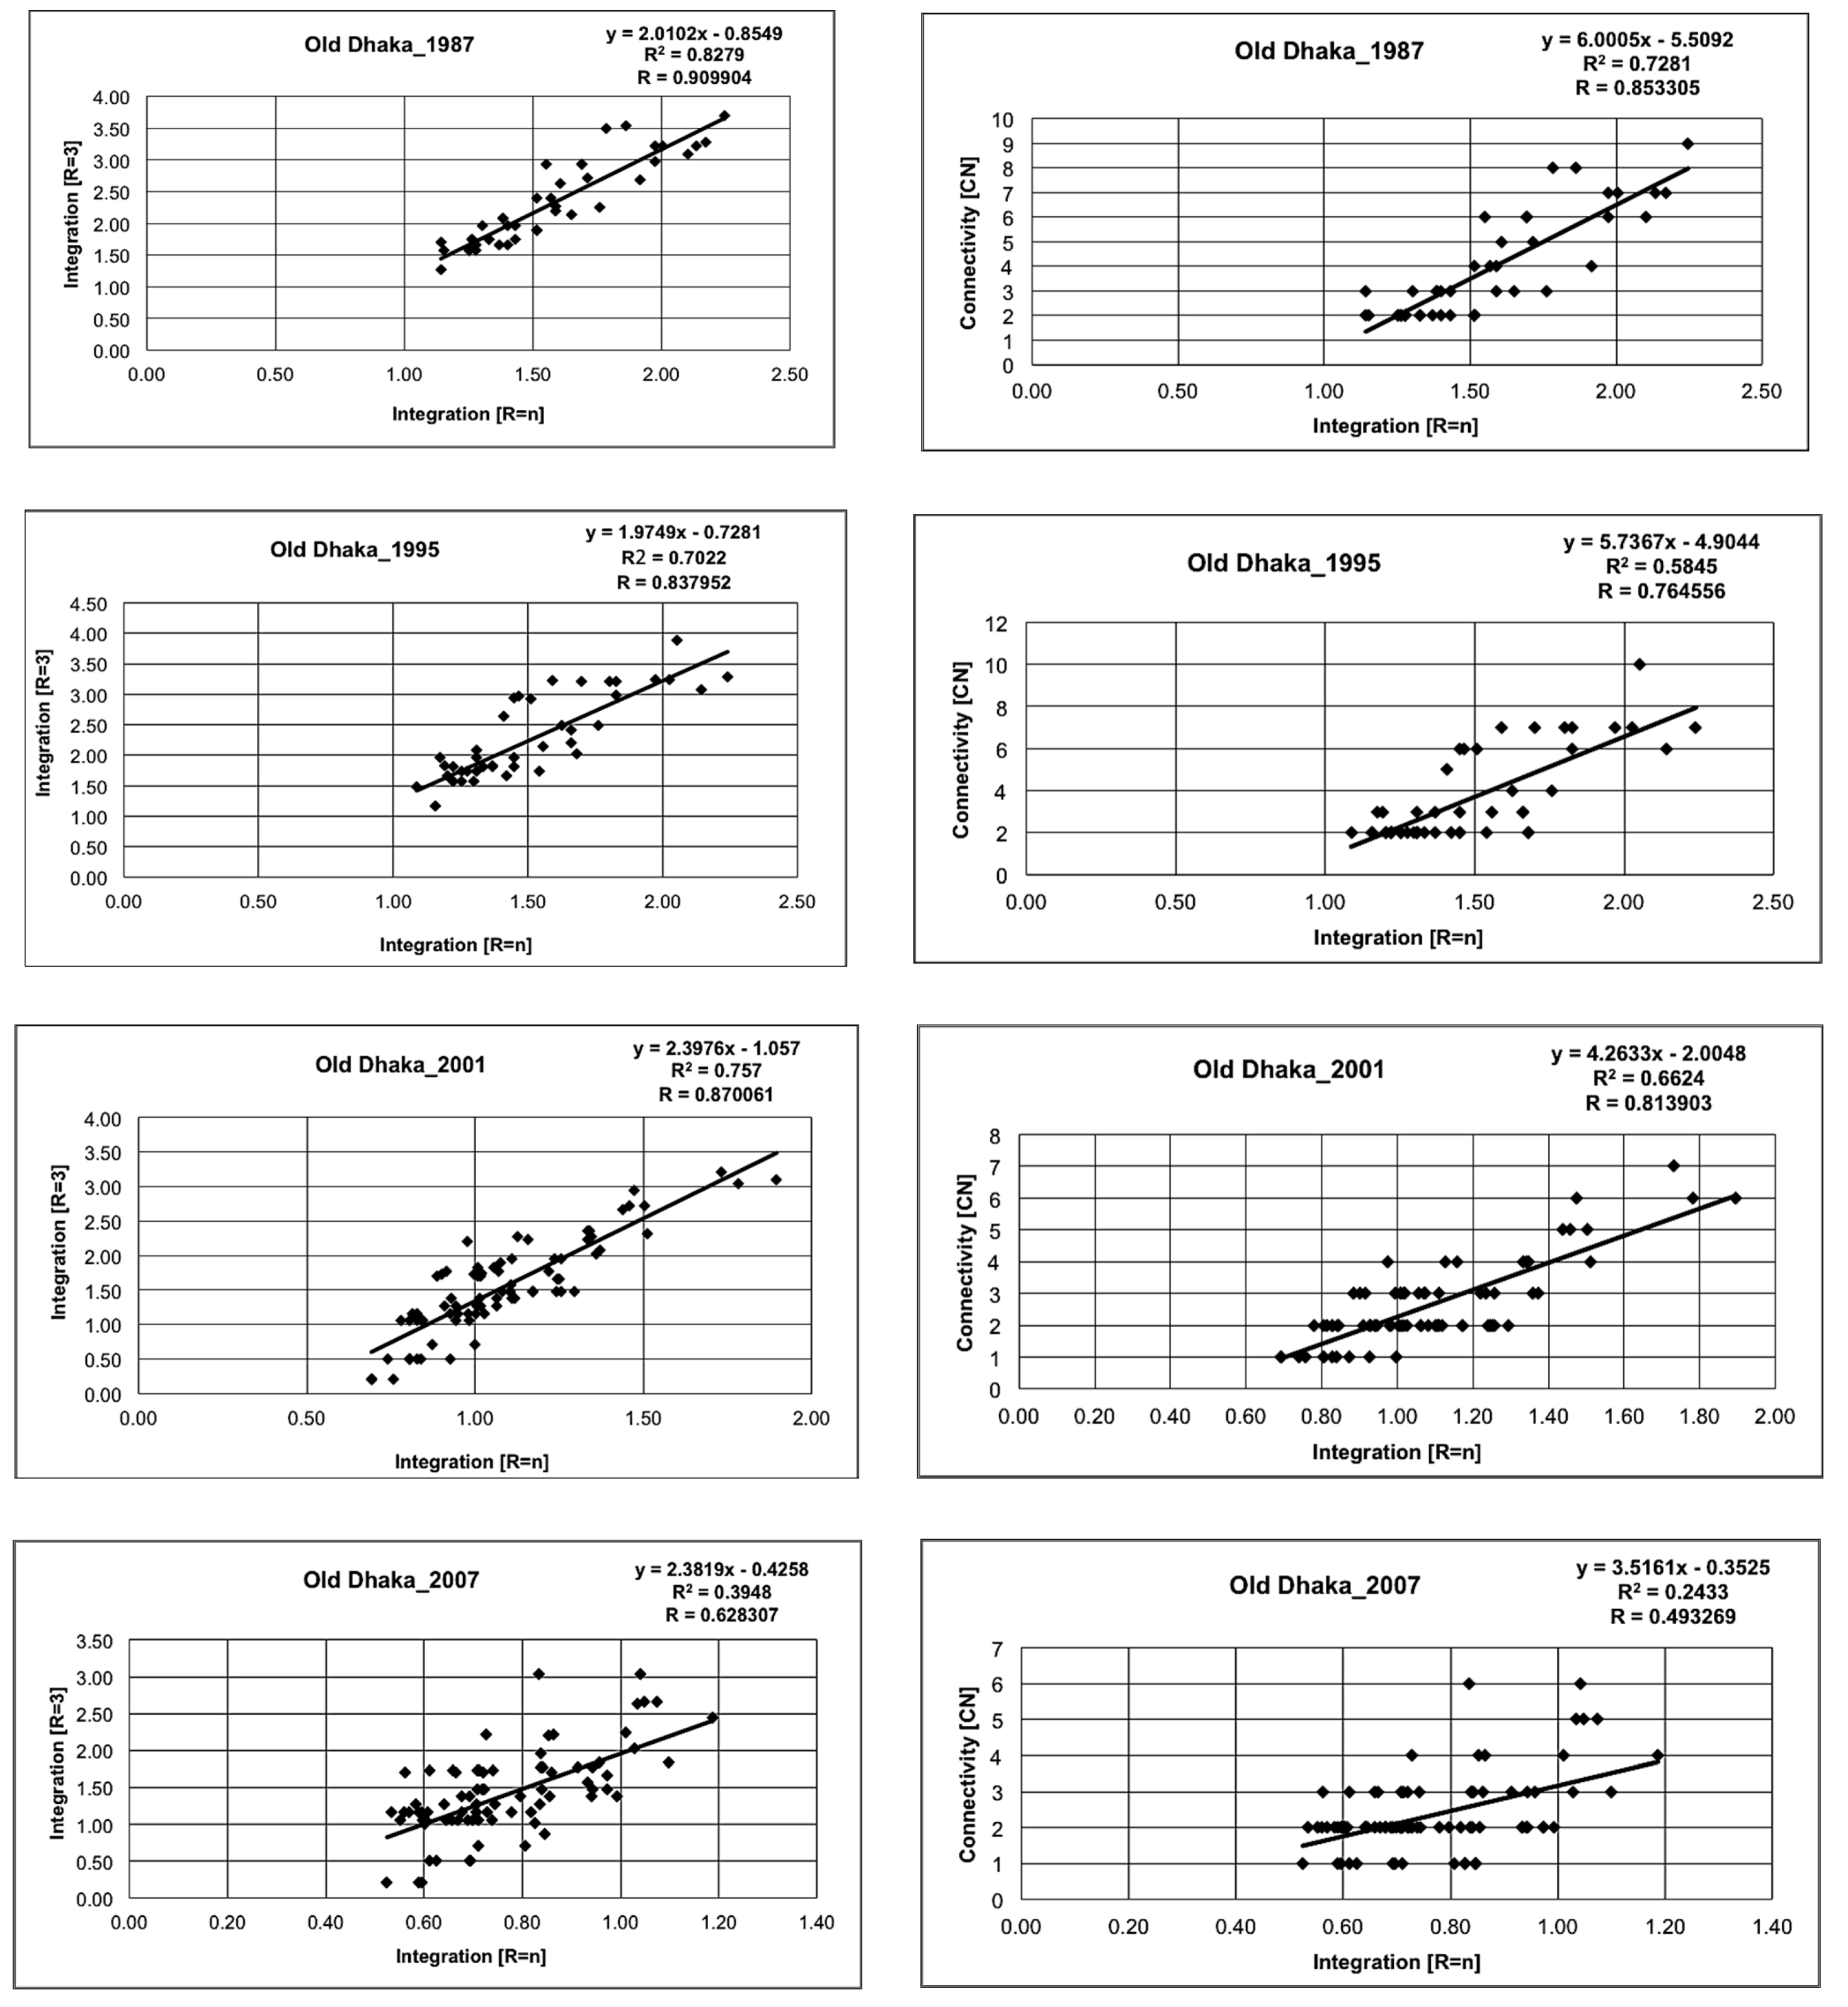
| Time Period | R of Rn-R3/Intelligibility | Equation | R of Rn-CN/Intelligibility | Equation |
|---|---|---|---|---|
| 1952 | 0.926891 | y = 2.7967x − 1.1913 R2 = 0.8591 | 0.904338 | y = 4.5295x − 1.746 R2 = 0.8178 |
| 1973 | 0.933863 | y = 1.7996x − 0.6459 R2 = 0.8721 | 0.857795 | y = 3.7514x − 2.1265 R2 = 0.7358 |
| 1987 | 0.909904 | y = 2.0102x − 0.8549 R2 = 0.8279 | 0.853305 | y = 6.0005x − 5.5092 R2 = 0.7281 |
| 1995 | 0.837952 | y = 1.9749x − 0.7281 R2 = 0.7022 | 0.764556 | y = 5.7367x − 4.9044 R2 = 0.5845 |
| 2001 | 0.870061 | y = 2.3976x − 1.057 R2 = 0.757 | 0.813903 | y = 4.2633x − 2.0048 R2 = 0.6624 |
| 2007 | 0.628307 | y = 2.3819x − 0.4258 R2 = 0.3948 | 0.493269 | y = 3.5161x − 0.3525 R2 = 0.2433 |
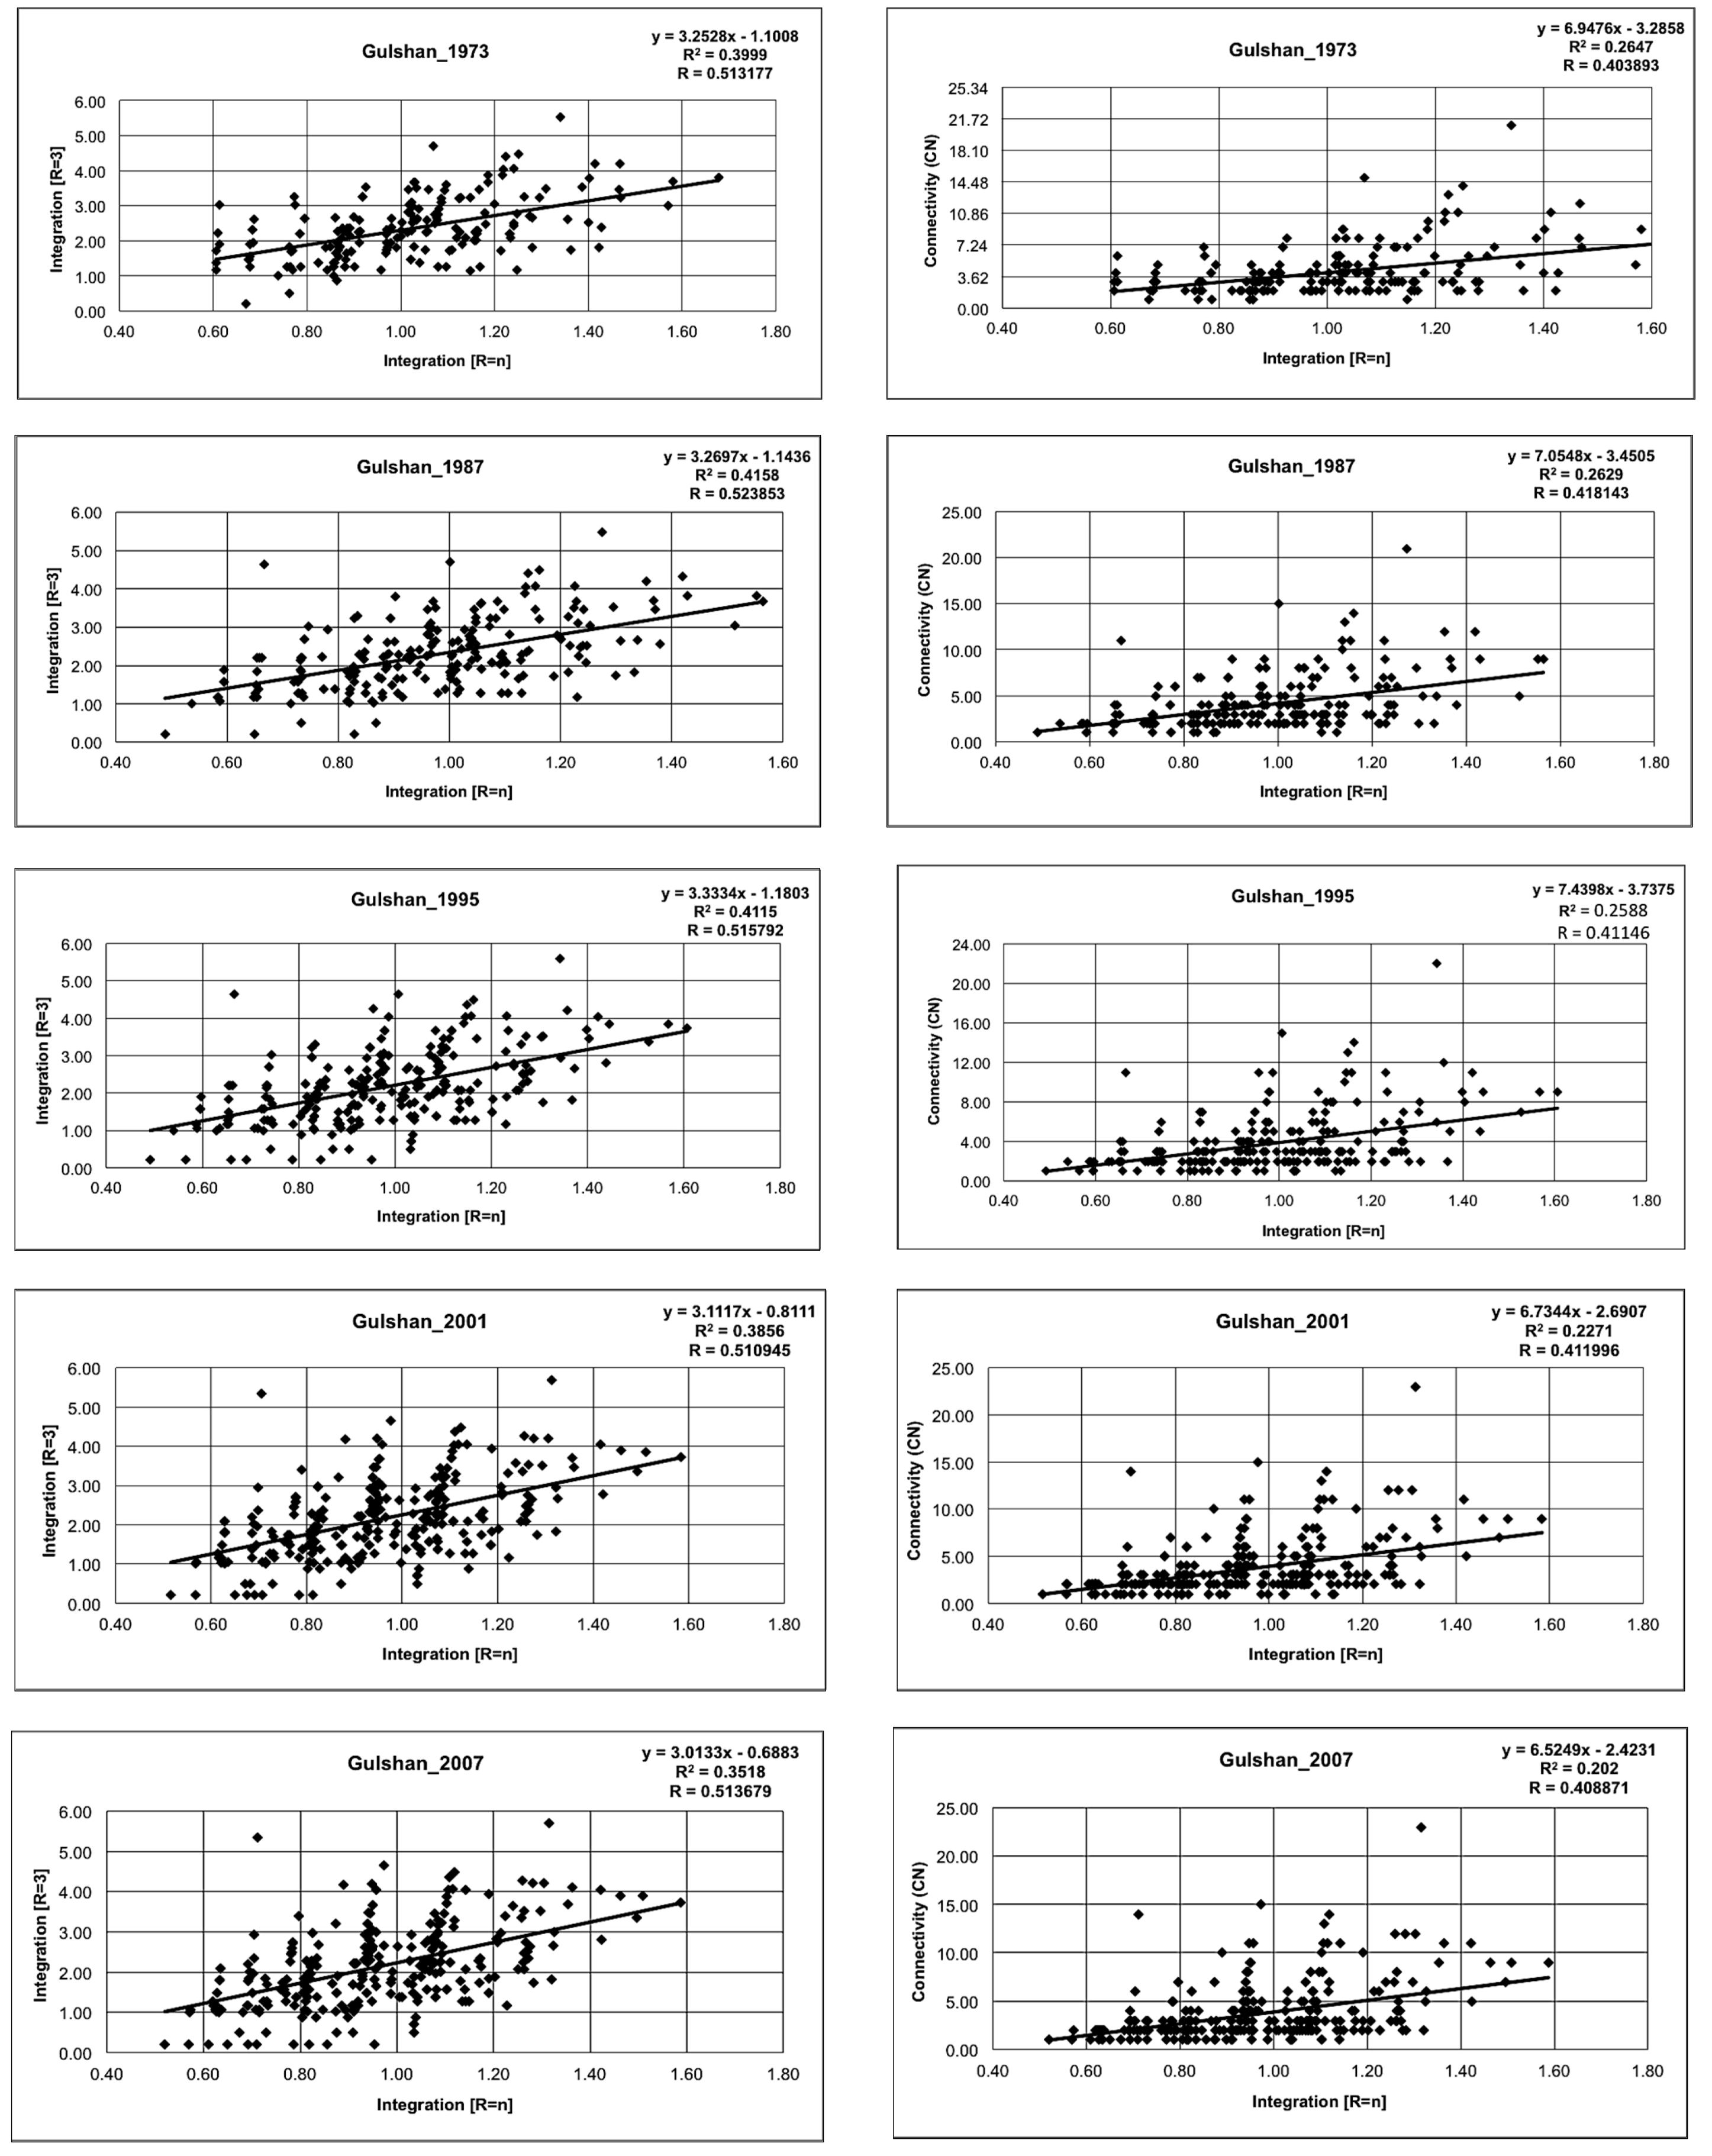
| Time Period | R of Rn-R3/Intelligibility | Equation | R of Rn-CN/Intelligibility | Equation |
|---|---|---|---|---|
| 1973 | 0.6324 | y = 3.2528x − 1.1008 R2 = 0.3999 | 0.5145 | y = 6.9476x − 3.2858 R2 = 0.2647 |
| 1987 | 0.6448 | y = 3.2697x − 1.1436 R2 = 0.4158 | 0.5127 | y = 7.0548x − 3.4505 R2 = 0.2629 |
| 1995 | 0.6415 | y = 3.3334x − 1.1803 R2 = 0.4115 | 0.5087 | y = 7.4398x − 3.7375 R2 = 0.2588 |
| 2001 | 0.6210 | y = 3.1117x − 0.8111 R2 = 0.3856 | 0.4766 | y = 6.7344x − 2.6907 R2 = 0.2271 |
| 2007 | 0.5931 | y = 3.0133x − 0.6883 R2 = 0.3518 | 0.4494 | y = 6.5249x − 2.4231 R2 = 0.2020 |
4.2.2. Summary of Syntactic Analysis of Ward 19
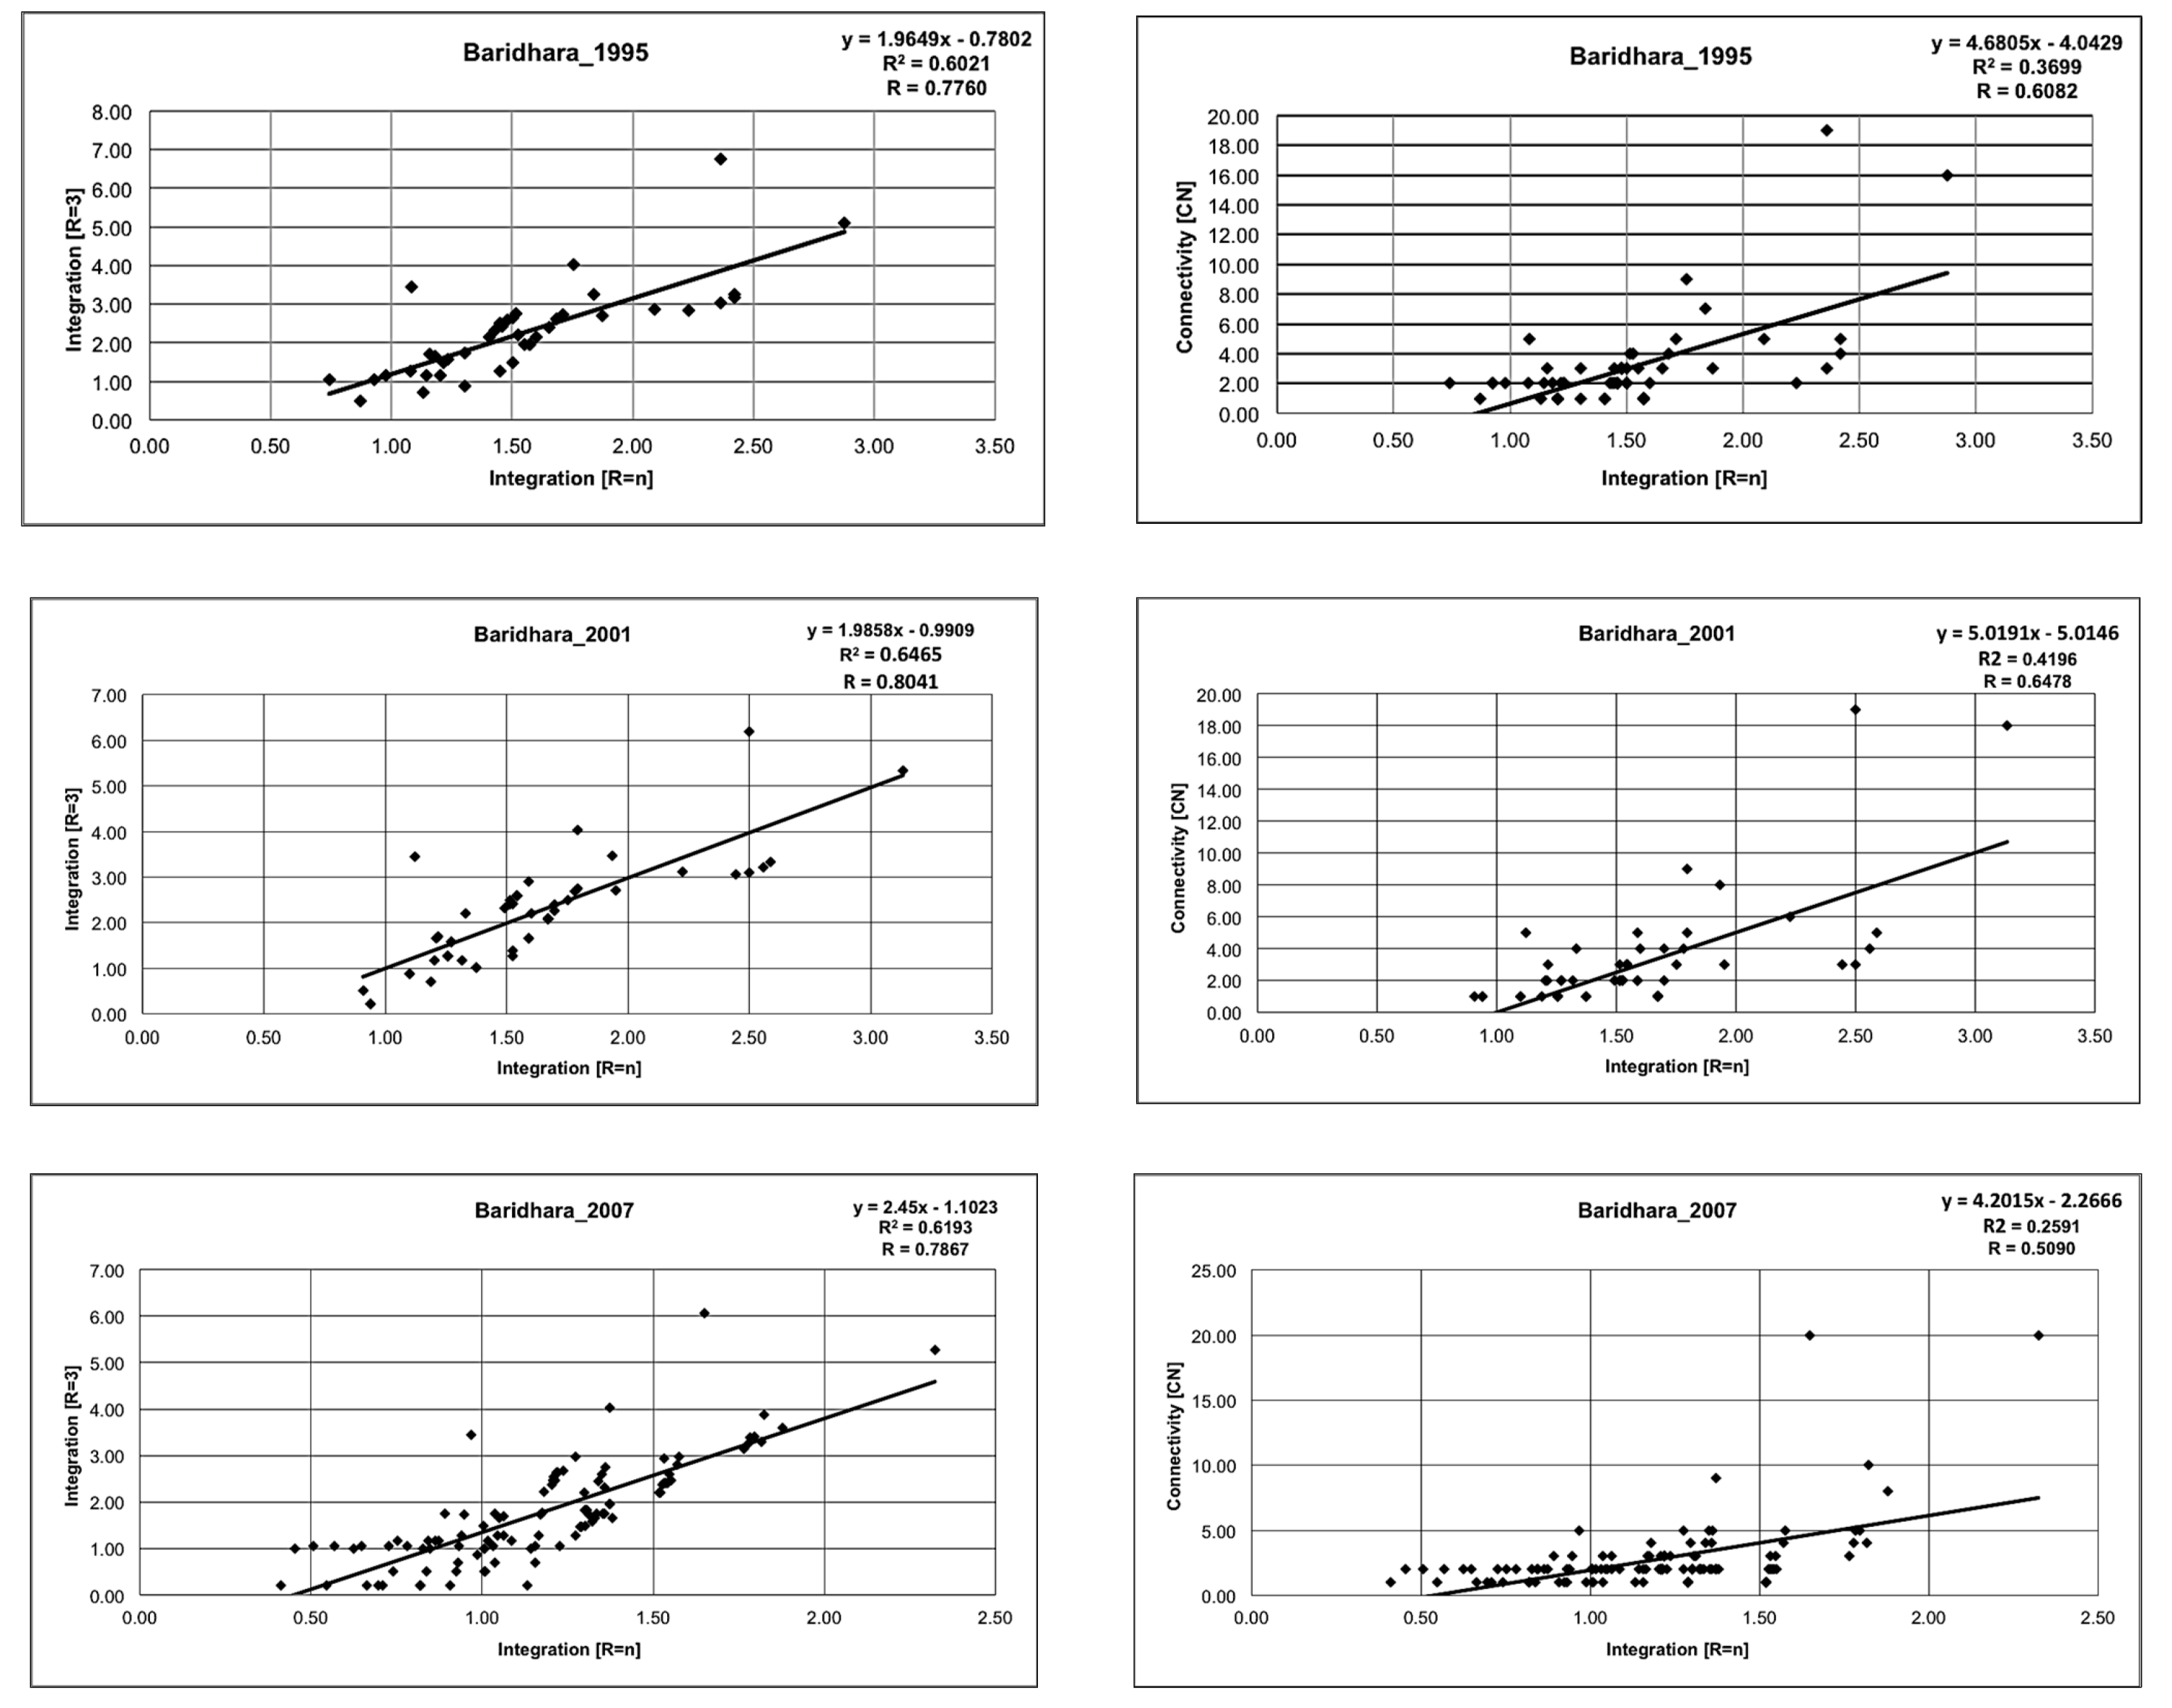
| Time Period | R of Rn-R3/Intelligibility | Equation | R of Rn-CN/Intelligibility | Equation |
|---|---|---|---|---|
| 1995 | 0.7760 | y = 1.9649x − 0.7802 R2 = 0.6021 | 0.6082 | y = 4.6805x − 4.0429 R2 = 0.3699 |
| 2001 | 0.8041 | y = 1.9858x − 0.9909 R2 = 0.6465 | 0.6478 | y = 5.0191x − 5.0146 R2 = 0.4196 |
| 2007 | 0.7867 | y = 2.45x − 1.1023 R2 = 0.6193 | 0.5090 | y = 4.2015x − 2.2666 R2 = 0.2591 |


4.2.3. Summary of Syntactic Analysis of Ward 18
4.2.4. Summary of the Findings of the Syntactic Analyses
5. Discussions
5.1. Nature of Integration Core
5.2. Connectivity of Street Network
5.3. Global-Local Correlation
5.4. Limitations and Future Research
6. Conclusions
Acknowledgments
Author Contributions
Appendix
| Year | Total Population | Approximate Area (Square Miles) |
|---|---|---|
| 1600 | --- | 1 |
| 1640 | 200,000 | --- |
| 1700 | 900,000 | 50 |
| 1800 | 200,000 | 8 |
| 1814 | 200,000 | --- |
| 1824 | 300,000 | --- |
| 1838 | 68,038 | --- |
| 1867 | 51,636 | 8 |
| 1872 | 69,212 | --- |
| 1881 | 80,358 | --- |
| 1891 | 83,358 | --- |
| 1901 | 104,385 | 10 |
| 1911 | 125,733 | 10 |
| 1921 | 137,908 | 12 |
| 1931 | 161,922 | 12 |
| 1941 | 239,728 | 12 |
| 1951 * | 335,928 | 15 |
| 1961 * | 550,143 | 26 |
| 1974 * | 1,679,572 | 40 |
| 1981 * | 3,430,311 | 155.4 |
| 1991 * | 6,950,920 | 522.34 |
| 1981 ** | 2,475,710 | 50 |
| 1991 ** | 3,839,000 | 54.5 |
| 2001 ** | 77,94,086 | 140 |
| 2011 ** | 93,17,043 | 360 |


Conflicts of Interest
References
- Ahmed, B.; Ahmed, R. Modeling urban land cover growth dynamics using multi-temporal satellite images: A case study of Dhaka, Bangladesh. ISPRS Int. J. Geo-Inf. 2012, 1, 3–31. [Google Scholar] [CrossRef]
- Ahmed, B.; Raj, M.R.H.; Maniruzzaman, K.M. Morphological change of Dhaka City over a period of 55 years: A case study of two wards. J. Bangladesh Inst. Plan. 2009, 2, 30–38. [Google Scholar]
- Ahmed, B.; Hasan, R.; Ahmad, S. A Case Study of the Morphological Change of Four Wards of Dhaka City over the Last 60 Years (1947–2007). Undergraduate Thesis, Bangladesh University of Engineering and Technology, Dhaka, Bangladesh, 2008. [Google Scholar]
- Ahmed, B.; Kamruzzaman, M.; Zhu, X.; Rahman, M.S.; Choi, K. Simulating land cover changes and their impacts on land surface temperature in Dhaka, Bangladesh. Remote Sens. 2013, 5, 5969–5998. [Google Scholar] [CrossRef] [Green Version]
- Ahmed, B. Traffic Accident Study in Dhaka City (2007–2011); DCC-S4B; Clean Air and Sustainable Environment Project; Dhaka South City Corporation: Dhaka, Bangladesh, 2012. [Google Scholar]
- Ahmed, S.U. Dhaka Past Present Future, 1st ed.; The Asiatic Society of Bangladesh: Dhaka, Bangladesh, 1991. [Google Scholar]
- Chowdhury, A.M. Dhaka, 2nd ed.; Asiatic Society of Bangladesh: Dhaka, Bangladesh, 2012. [Google Scholar]
- Islam, Z. High-Rise Residential Development in Dhaka City: Evolution of the New Form. Master’s Thesis, Bangladesh University of Engineering and Technology, Dhaka, Bangladesh, 2003. [Google Scholar]
- Nilufar, F. The Spatial and Social Structuring of Local Areas in Dhaka City—A Morphological Study of the Urban Grid with Reference to Neighbourhood Character within Naturally-Grown Areas. Ph.D. Thesis, University College London, London, UK, 1997. [Google Scholar]
- Hashem, M. Trends of Development in Dhanmondi Residential Area of Dhaka City. Master’s Thesis, Bangladesh University of Engineering and Technology, Dhaka, Bangladesh, 2001. [Google Scholar]
- Moudon, A.Y. Urban morphology as an emerging interdisciplinary field. J. Urban Morphol. 1997, 1, 3–10. [Google Scholar]
- Space Syntax Laboratory. Available online: http://www.bartlett.ucl.ac.uk/graduate/research/space/space-syntax (accessed on 9 May 2014).
- Hillier, B.; Hanson, J. The Social Logic of Space, 1st ed.; Cambridge University Press: Cambridge, UK, 1984. [Google Scholar]
- Jiang, B.; Claramunt, C. Integration of space syntax into GIS: New perspectives for urban morphology. Trans. GIS 2002, 6, 295–309. [Google Scholar] [CrossRef]
- Önder, D.E.; Gigi, Y. Reading urban spaces by the space-syntax method: A proposal for the south haliç region. Cities 2010, 27, 260–271. [Google Scholar] [CrossRef]
- Foltête, J.-C.; Piombini, A. Urban layout, landscape features and pedestrian usage. Landsc. Urban Plan. 2007, 81, 225–234. [Google Scholar] [CrossRef]
- Kim, H.-K.; Sohn, D.W. An analysis of the relationship between land use density of office buildings and urban street configuration: Case studies of two areas in Seoul by space syntax analysis. Cities 2002, 19, 409–418. [Google Scholar] [CrossRef]
- Giannopoulou, M.; Roukounis, Y.; Stefanis, V. Traffic network and the urban environment: An adapted space syntax approach. Procedia Soc. Behav. Sci. 2012, 48, 1887–1896. [Google Scholar] [CrossRef]
- Duan, Z.-Y.; Wang, Q. Road network analysis and evaluation of Huizhou city based on space syntax. In Proceedings of the 2009 International Conference on Measuring Technology and Mechatronics Automation, Zhangjiajie, China, 11–12 April 2009; pp. 579–582.
- Zhan, Q.; Zhou, J.; Xiao, Y. Applying space syntax in large polycentric city. In Proceedings of the 2009 IEEE International Conference on Geoinformatics, Fairfax, VA, USA, 12–14 August 2009; pp. 1–6.
- Tariq, T.; Nilufar, F. Integrating the recreational spaces of Rangpur City Corporation, Bangladesh. In Proceedings of the 2013 International Space Syntax Symposium, Seoul, Korea, 31 October–3 November 2013; Kim, Y.O., Park, H.T., Seo, K.W., Eds.; Sejong University Press: Seoul, Korea, 2013. [Google Scholar]
- Karimi, K.; Vaughan, L. An evidence-based approach to designing new cities: The English new towns revisited. In Explorations in Urban Design: An Urban Design Research Primer; Carmona, M., Ed.; Ashgate Publishing: Ashgate, Surrey, UK, 2014; pp. 261–276. [Google Scholar]
- Wang, H.; Shi, S.; Rao, X. A study of urban density in Shenzhen: The relationship between street morphology, building density and land use. In Proceedings of the Ninth International Space Syntax Symposium, Seoul, Korea, 31 October–3 November 2013; Kim, Y.O., Park, H.T., Seo, K.W., Eds.; Sejong University Press: Seoul, Korea, 2013. [Google Scholar]
- Mohamed, A.A.; Nes, A.V.; Salheen, M.A.; Kohlert, C.; Schwander, C. The socio-economic implications of the spatial configuration in greater Cairo metropolitan area. In Proceedings of the 2013 International Space Syntax Symposium, Seoul, Korea, 31 October–3 November 2013; Kim, Y.O., Park, H.T., Seo, K.W., Eds.; Sejong University Press: Seoul, Korea, 2013. [Google Scholar]
- Law, S.; Karimi, K.; Penn, A.; Chiaradia, A. Measuring the influence of spatial configuration on the housing market in metropolitan London. In Proceedings of the 2013 International Space Syntax Symposium, Seoul, Korea, 31 October–3 November 2013; Kim, Y.O., Park, H.T., Seo, K.W., Eds.; Sejong University Press: Seoul, Korea, 2013. [Google Scholar]
- Castillo, M.M. Urban patterns and disaster risk: The informal city on the hills. In Proceedings of the 2013 International Space Syntax Symposium, Seoul, Korea, 31 October–3 November 2013; Kim, Y.O., Park, H.T., Seo, K.W., Eds.; Sejong University Press: Seoul, Korea, 2013. [Google Scholar]
- Ferdous, F. A Morphological Analysis of Indigenous Spatial Pattern in Old Dhaka with Particular Emphasis on Cultural Spaces. Master’s Thesis, Bangladesh University of Engineering and Technology, Dhaka, Bangladesh, 2007. [Google Scholar]
- Kubat, A.S. The morphological history of Istanbul. J. Urban Morphol. 1999, 3, 28–41. [Google Scholar]
- Hillier, B.; Penn, A. Dense civilizations: The shape of cities in the 21st century. J. Appl. Energy 1992, 43, 41–66. [Google Scholar] [CrossRef]
- Jiang, B.; Claramunt, C.; Klarqvist, B. Integration of space syntax into GIS for modelling urban spaces. Int. J. Appl. Earth Obs. Geoinf. 2000, 2, 161–171. [Google Scholar] [CrossRef]
- Hillier, B. Space is the Machine: A Configurational Theory of Architecture; Cambridge University Press: London, UK, 2007. [Google Scholar]
- Ratti, C. Urban texture and space syntax: Some inconsistencies. Environ. Plan. B Plan. Des. 2004, 31, 487–499. [Google Scholar] [CrossRef]
- Hillier, B.; Penn, A. Rejoinder to Carlo Ratti. Environ. Plan. B Plan. Des. 2004, 31, 501–511. [Google Scholar] [CrossRef]
- Ibrahim, R. Community Report: Dhaka Zila. In Population and Housing Census 2011; Ministry of Planning, Ed.; Bangladesh Bureau of Statistics: Dhaka, Bangladesh, 2012; pp. 8–12. [Google Scholar]
- Ahmed, B. Urban Land Cover Change Detection Analysis and Modeling Spatio-Temporal Growth Dynamics Using Remote Sensing and GIS Techniques: A Case Study of Dhaka, Bangladesh. Master’s Thesis, University of New Lisbon, Lisbon, Portugal, 2011. [Google Scholar]
- Ahmed, B. Contemporary issues and priorities in addressing the road safety problems of Dhaka Metropolitan Area, Bangladesh. J. Bangladesh Inst. Plan. 2014, 6, 103–118. [Google Scholar]
© 2014 by the authors; licensee MDPI, Basel, Switzerland. This article is an open access article distributed under the terms and conditions of the Creative Commons Attribution license (http://creativecommons.org/licenses/by/4.0/).
Share and Cite
Ahmed, B.; Hasan, R.; Maniruzzaman, K.M. Urban Morphological Change Analysis of Dhaka City, Bangladesh, Using Space Syntax. ISPRS Int. J. Geo-Inf. 2014, 3, 1412-1444. https://0-doi-org.brum.beds.ac.uk/10.3390/ijgi3041412
Ahmed B, Hasan R, Maniruzzaman KM. Urban Morphological Change Analysis of Dhaka City, Bangladesh, Using Space Syntax. ISPRS International Journal of Geo-Information. 2014; 3(4):1412-1444. https://0-doi-org.brum.beds.ac.uk/10.3390/ijgi3041412
Chicago/Turabian StyleAhmed, Bayes, Rakibul Hasan, and K. M. Maniruzzaman. 2014. "Urban Morphological Change Analysis of Dhaka City, Bangladesh, Using Space Syntax" ISPRS International Journal of Geo-Information 3, no. 4: 1412-1444. https://0-doi-org.brum.beds.ac.uk/10.3390/ijgi3041412