Article

Mapping of Asbestos Cement Roofs and Their Weathering Status Using Hyperspectral Aerial Images

1
Remote Sensing of Environmental Dynamics Laboratory, Department of Earth and Environmental Science (DISAT), University of Milano-Bicocca, Piazza della Scienza 1, Milano 20126, Italy
2
Remote Sensing Department-IREA-National Research Council (CNR), Via Bassini 15, Milano 20133, Italy
*
Author to whom correspondence should be addressed.
ISPRS Int. J. Geo-Inf. 2015, 4(2), 928-941; https://0-doi-org.brum.beds.ac.uk/10.3390/ijgi4020928
Submission received: 19 March 2015 / Revised: 20 May 2015 / Accepted: 21 May 2015 / Published: 1 June 2015

Abstract

:
The aims of this study were: (i) the mapping of asbestos cement roofs in an urban area; and (ii) the development of a spectral index related to the roof weathering status. Aerial images were collected through the Multispectral Infrared and Visible Imaging Spectrometer (MIVIS) sensor, which acquires data in 102 channels from the visible to the thermal infrared spectral range. An image based supervised classification was performed using the Spectral Angle Mapper (SAM) algorithm. The SAM was trained through a set of pixels selected on roofs of different materials. The map showed an average producer’s accuracy (PA) of 86% and a user’s accuracy (UA) of 89% for the asbestos cement class. A novel spectral index, the “Index of Surface Deterioration” (ISD), was defined based on measurements collected with a portable spectroradiometer on asbestos cement roofs that were characterized by different weathering statuses. The ISD was then calculated on the MIVIS images, allowing the distinction of two weathering classes (i.e., high and low). The asbestos cement map was handled in a Geographic Information System (GIS) in order to supply the municipalities with the cadastral references of each property having an asbestos cement roof. This tool can be purposed for municipalities as an aid to prioritize asbestos removal, based on roof weathering status.

Graphical Abstract

1. Introduction

The term “asbestos” is used to refer to a group of fibrous silicate minerals. Regulation is limited to six of these minerals, which only partially account for the existing, naturally-occurring fibers [1]. Among these regulated minerals, chrysotile is part of the serpentines, while actinolite, amosite, anthopyllite, crocidolite and tremolite are part of the amphiboles. All of them are classified as “carcinogenic to humans” by the International Agency for Research on Cancer.
The hazard of asbestos is due to the fibers that are released into the environment and therefore inhalable. In case of asbestos cement (AC) roofs, the release is mainly due to weathering (i.e., rain, ice and wind). Several studies demonstrated that exposure to asbestos fibers causes mesothelioma and lung as well as larynx and ovarian cancers [2,3,4,5], and concluded that no safe level of exposure is predictable [6].
Between the 1970s and the 1990s in Europe, asbestos was largely used in both industrial and domestic contexts, due to its physical and chemical resistance as well as its heat and acoustical insulation properties. Its use was very common for pipes, floor tiles, textiles, and also roofing material in the form of AC. Asbestos is still present worldwide, although an increasing number of countries have already banned it. At the European level the use and marketing of asbestos have been banned since 1 January 2005. In Italy, its production and use were prohibited with the national law “257/92”; however, older buildings containing asbestos remain widespread and constitute a continuous source of asbestos emission, unless it is removed or encapsulated. In Lombardia Region—where the study area is located—the national law was implemented with the regional law “17/2003”, which led to the development of the 2006 regional plan (i.e., PRAL) for removing asbestos by 2016. For the first time, the PRAL required municipalities to perform the census of asbestos materials with the aid of citizen self-declarations. Among the required information (e.g., building type, year the roof was laid, location, quantity, planned restoration interventions) the year the roof was laid plays an important role for the roof deterioration assessment, since older roofs are more likely to be weathered. As a matter of fact, in 2008, the year the roof was laid was introduced in the regional law as variable for the definition of the AC roof conservation status (i.e., Decreto Direzione Generale Sanità “13237/2008”). However, the census is affected by a high degree of uncertainty, due to inspection difficulties by the local authorities and/or omissions in self-declarations. Remote sensing can help in overcoming these omissions by providing maps of AC used as roofing material. Aerial remote sensing techniques have been successfully applied in the recent past for asbestos mapping purposes [7,8,9,10,11]. To the best of our knowledge, only one study [12] deals with the assessment of AC deterioration through spectral diagnostic bands. Diagnostic bands related to the percentage of surfacing fibers are located in the shortwave infrared region at 2.32 µm and in the thermal infrared at 9.44 µm. However, a signal to noise ratio (SNR) of 277 is recommended to discriminate the 2.32 µm asbestos absorption feature. This SNR can be achieved in laboratory using field spectrometers, but these requirements are not met by the MIVIS (Multispectral Infrared and Visible Imaging Spectrometer) sensor used in the mentioned study [12]. Moreover, they suggested that the thermal infrared is promising for the asbestos deterioration assessment, although the separation of emissivity and temperature implies some challenging issues. In our study we propose a novel spectral indicator (i.e., ISD, Index of Surface Deterioration) that is not directly related to the surfacing fibers, but rather related to the abundance of mosses and lichens that are reported to be more developed on older and weathered substrata [13]. In particular, we used the absorption feature in the red wavelengths around 0.68 µm that was found to be related to the presence of photosynthetic pigments of mosses and lichens colonizing the roof.
With the ISD calculated using visible and near infrared spectral regions, we attempted to provide a novel and more operative remotely sensed index for defining the roof weathering status, and thus the priorities for AC removal. Although the presence of mosses and lichens may be a barrier to the fiber detachment [13], we assume that the oldest roofs have a more friable matrix that is more likely to be colonized by the vegetation, and to release fibers from the un-colonized roof portions.
The research project was conducted in five municipalities in Northern Italy (i.e., Monza, Muggiò, Lissone, Seregno, Biassono), spanning an area of about 65 km2 with a population of about 248,000 inhabitants. An airborne overpass was performed with the MIVIS sensor. Ground measurements were also acquired with a portable field spectroradiometer on selected roofs, having different weathering status. The main objectives of the study can be summarized as follows:
  • the mapping of AC roofs;
  • the association of the AC presence to the cadastre in order to provide the cadastral building references to the municipalities;
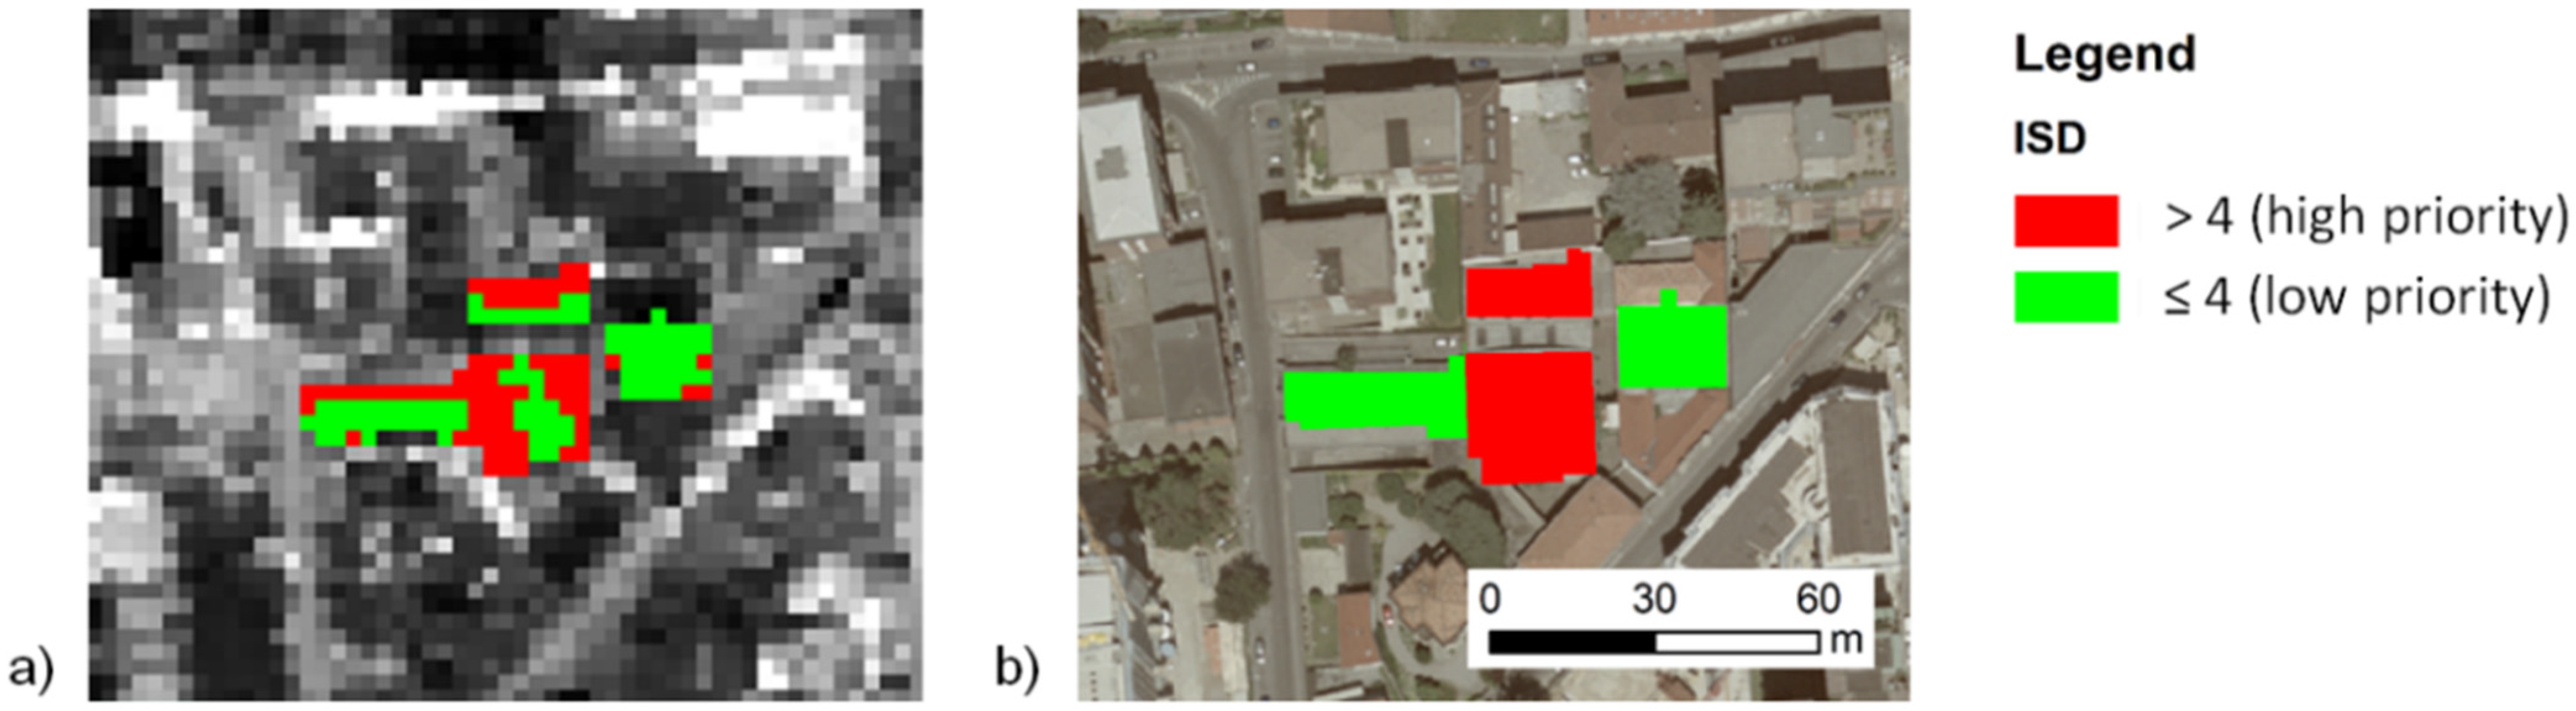
  • the assessment of the weathering status of each AC roof through the definition of a novel operative spectral index (i.e., ISD), which is related to the vegetation component that colonize weathered roofs.

2. Materials and Methods

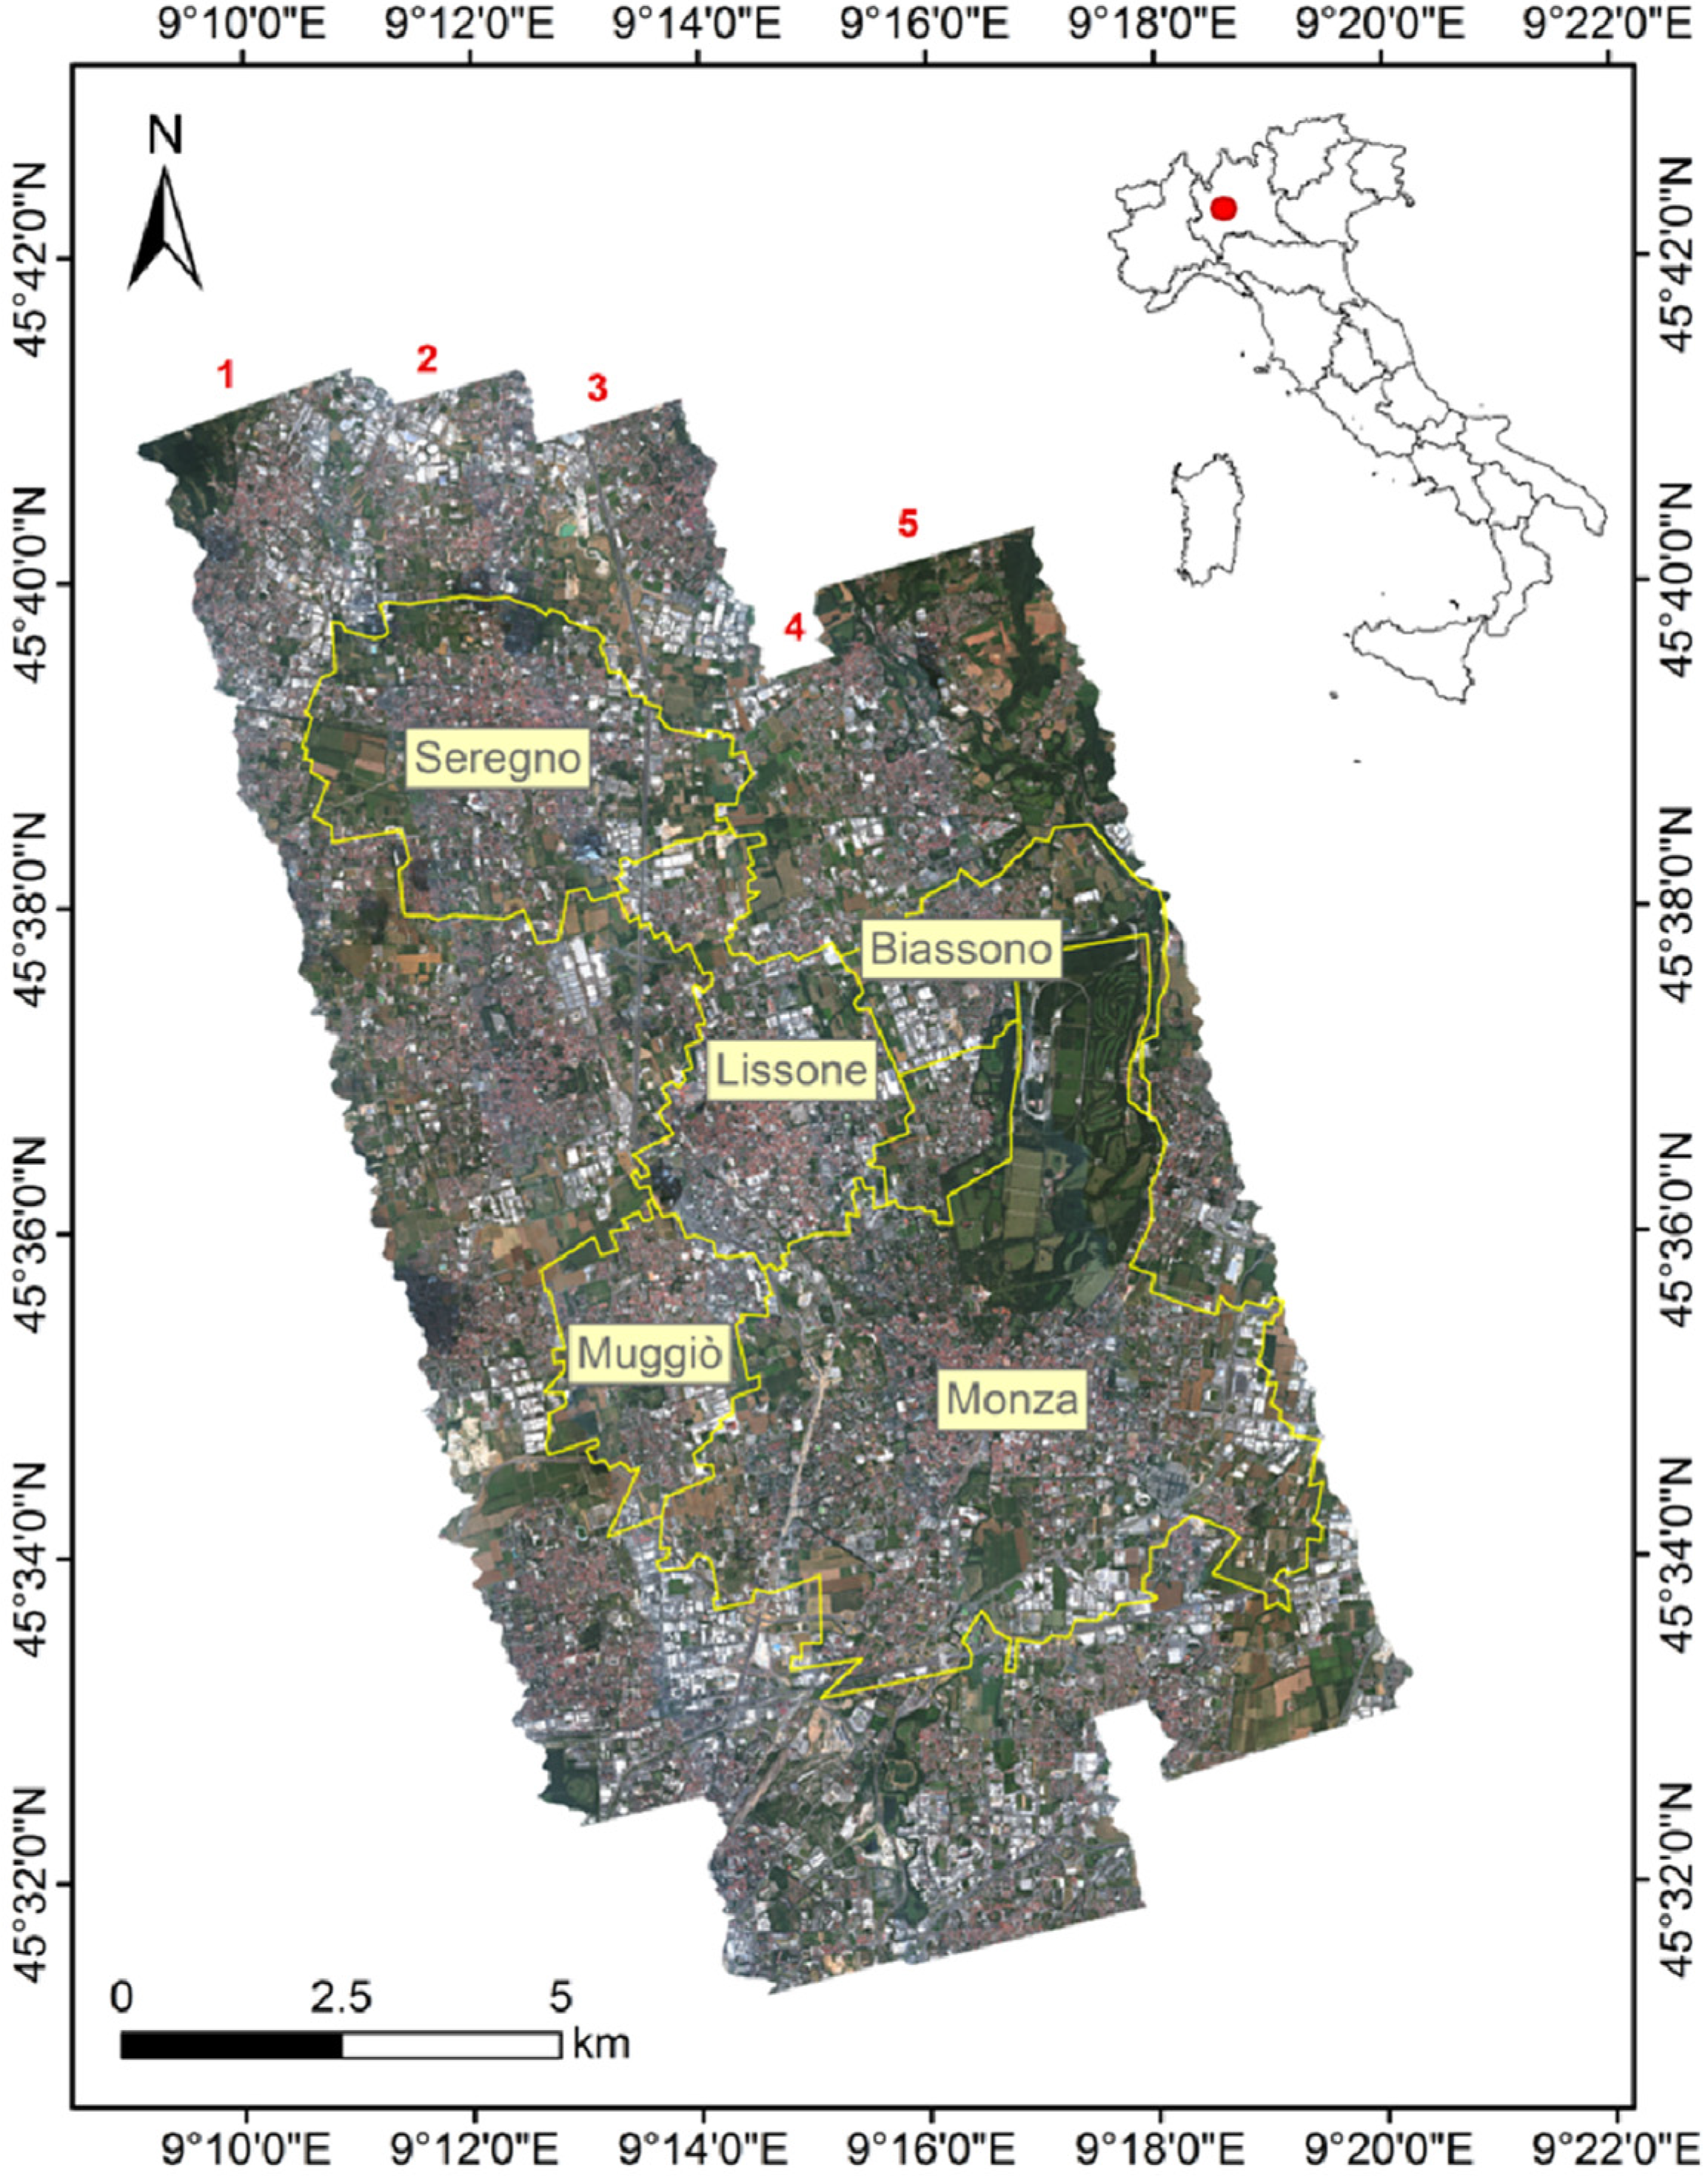
2.1. Airborne Campaign and Ground Data Acquisition

The airborne survey was performed on 5 July 2013 between 12:30 P.M. and 1:15 P.M. (local time) in order to minimize possible shadow effects. Five MIVIS runs were acquired in the solar principal plane, recording data in 92 channels between the visible and shortwave infrared (0.43–2.50 µm) region and in 10 channels in the thermal infrared (8.20–12.70 µm) region, with an instantaneous field of view of 2 mrad. The images were acquired at 1500 m a.s.l. with a swath of 2847 m, a pixel size of 3 m, and an overlap of 35% between adjacent images. The study area showed in Figure 1 is located in a flat region with an average elevation of 200 m a.s.l.. Ground reflectance spectra were collected contemporarily to the image acquisitions with a portable spectroradiometer (Fieldspec FR, Analytical Spectral Devices Inc., Boulder, CO, USA) on nine selected targets: three calibration tarps (white, grey and black Odyssey material from Kayospruce, Fareham, UK), one bare soil, three asphalt and two grass targets, in order to evaluate the atmospheric correction quality performed on the MIVIS data.
Furthermore, the reflectance of eleven asbestos roof portions, visually differing in their weathering status and with different expositions, was measured from an elevated work platform with the same portable spectroradiometer. This dataset and the qualitative visual inspection performed contemporarily to the reflectance acquisition were used to support the definition of the ISD.
Figure 1. Mosaic of the five Multispectral Infrared and Visible Imaging Spectrometer (MIVIS) images (runs) (RGB true color synthesis) recorded on the study area, including five municipalities located in Northern Italy: Biassono, Lissone, Monza, Muggiò and Seregno (MB).
Ijgi 04 00928 g001

2.2. Image Processing

The geometric correction was performed by the data provider with the definition of ground control points, and resulted in a mean accuracy of 2 pixels (6 m).
The software ATCOR (ATmospheric CORrection) [14] was used for the atmospheric correction of data recorded from the visible to the shortwave infrared spectral interval. Atmospheric properties were set as urban aerosol type, water vapor concentration equal to 2.9 g·cm−2 and visibility of 10 km. Regarding the thermal data, the brightness temperature was used. The comparison between the reflectance of the reference targets (measured on the ground with the field spectroradiometer) and the reflectance from the aerial images showed an average error of 6.4%. More specifically, the mean difference was 3.2% in the visible, 6.5% in the near infrared and 9.6% in the shortwave infrared. The comparison between the reflectance of corresponding pixels in the overlapping portions of adjacent images showed an average difference lower than 3%, meaning that the atmospheric correction applied to the single runs returned consistent results.
The signal to noise ratio (SNR) was calculated [15], and bands with SNR lower than 8 were excluded from further data processing. The retained reflectance and temperature bands were then used for the MNF (Minimum Noise Fraction) [16] transformation.
The procedure was applied separately to the bands in the reflected spectral interval (from visible to shortwave infrared), and in the emitted region (thermal infrared), in order to synthetize the main information in a reduced number of MNF components as well as to remove the residual noise in the data. The first 10 MNF components, resulting from reflective bands, and the first 2 MNF components from the thermal bands—accounting for more than 98% of the total variance in the data—were merged into a new image and used for the classification.
The spatial coherency between the MIVIS images and the building shapefile was assessed in order to guarantee a good overlapping of the two layers. The building shapefile was georeferenced on the MIVIS images in ArcMap version 10.1 (ESRI, Redlands, CA, USA) with a mean accuracy of 3 m.
The image processing and classification were performed using ENVI version 5 (Exelis Visual Information Solutions, Boulder, CO, USA).

2.3. Classification Procedure and Accuracy Evaluation

The SAM (Spectral Angle Mapper) classification algorithm [17] was applied to the selected MNF components based on promising results obtained in previous studies [8,10]. The advantage of using this algorithm is that it is not heavily affected by residual variations in scene illumination after correction. The algorithm was trained to classify different materials that are typical of urban areas (i.e., AC, concrete, tiles, aluminum and PVC (vinyl) membrane roofing materials) by using a spectral endmember set defined on the MIVIS images and selecting pure pixels from different roofs. Three spectral endmembers were defined for each material in order to improve the algorithm performances. A value of 0.50 radians was empirically chosen as a threshold for the assignment of classes with a trial and error approach.
The classification accuracy was assessed by computing: (i) the AC producer’s accuracy (PA), that refers to the probability that a roof classified by the algorithm as AC, on the ground reference is labeled as such; and (ii) the AC user’s accuracy (UA), that refers to the probability that a reference roof labeled as AC belongs to the AC class in the map. For the accuracy assessment, the building polygons of the cadastre shapefile were used. Due to the 3 m spatial resolution of the images, we excluded from the analyses all roofs with an area smaller than 36 m2 (i.e., 4 pixels). A subset of 1050 roofs was selected through a stratified random sampling on the different classes represented in the classification: 250 AC roofs, 200 concrete roofs, 200 tiled roofs, 200 aluminum and PVC (vinyl) membrane roofs and 200 not classified roofs. The ground truth was assessed for each roof through high resolution orthophoto visual interpretation coupled with MIVIS reflectance spectra analysis.
A second classification was subsequently performed only on those pixels classified as AC in order to improve the UA of the classification. Using a spectral endmember set consisting of asbestos and concrete roofing materials, the SAM algorithm was applied to the reflectance images. The accuracy of the second classification was calculated using the same procedure described above.

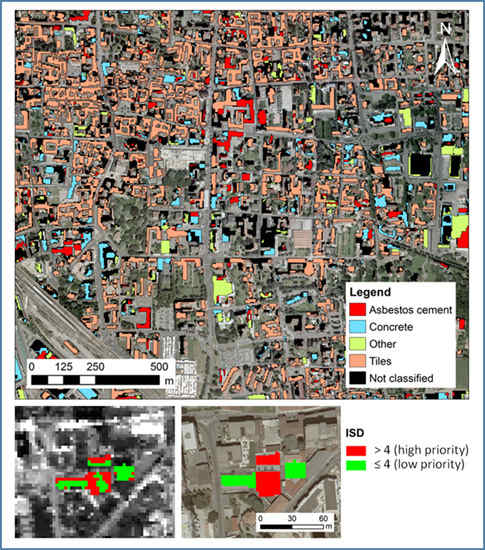
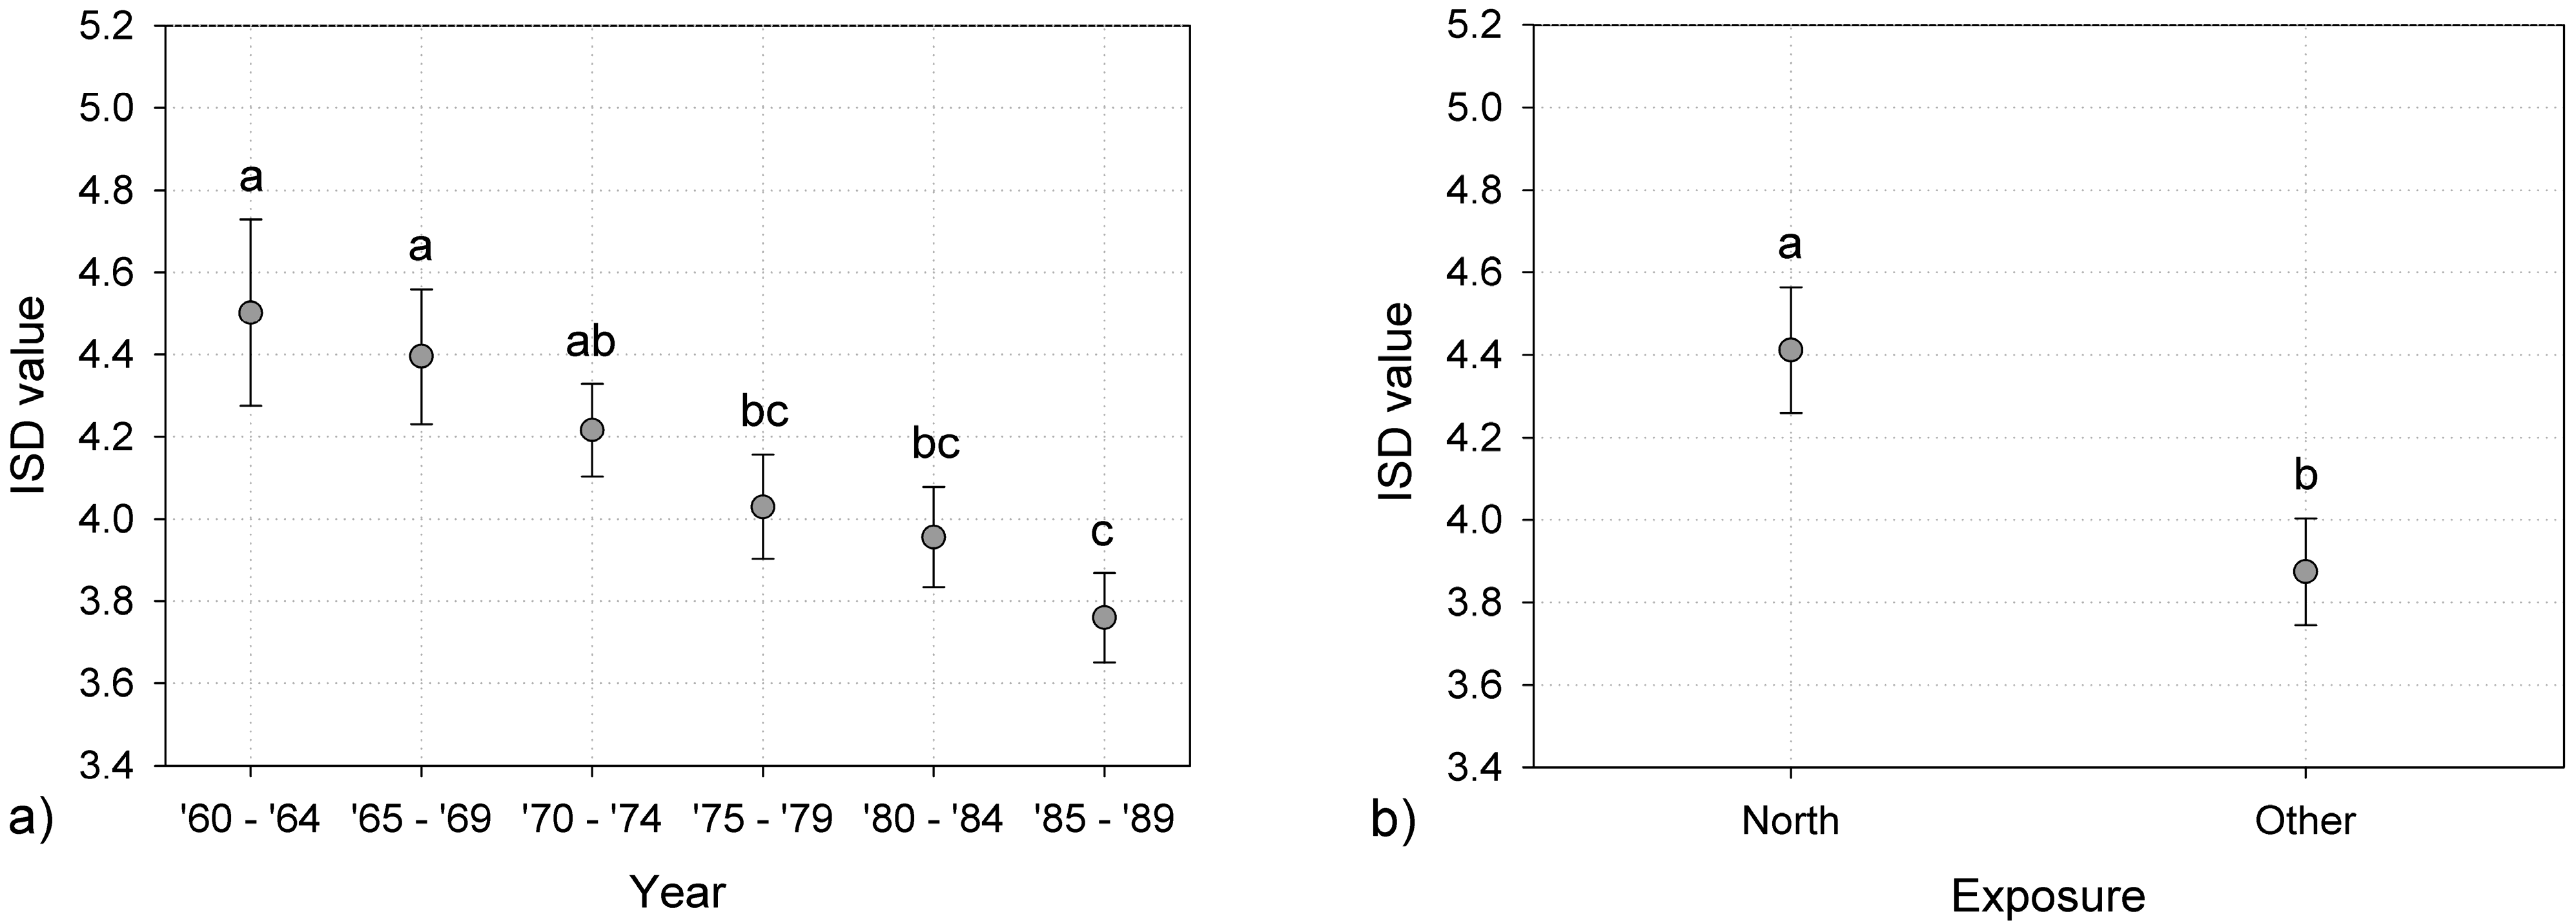
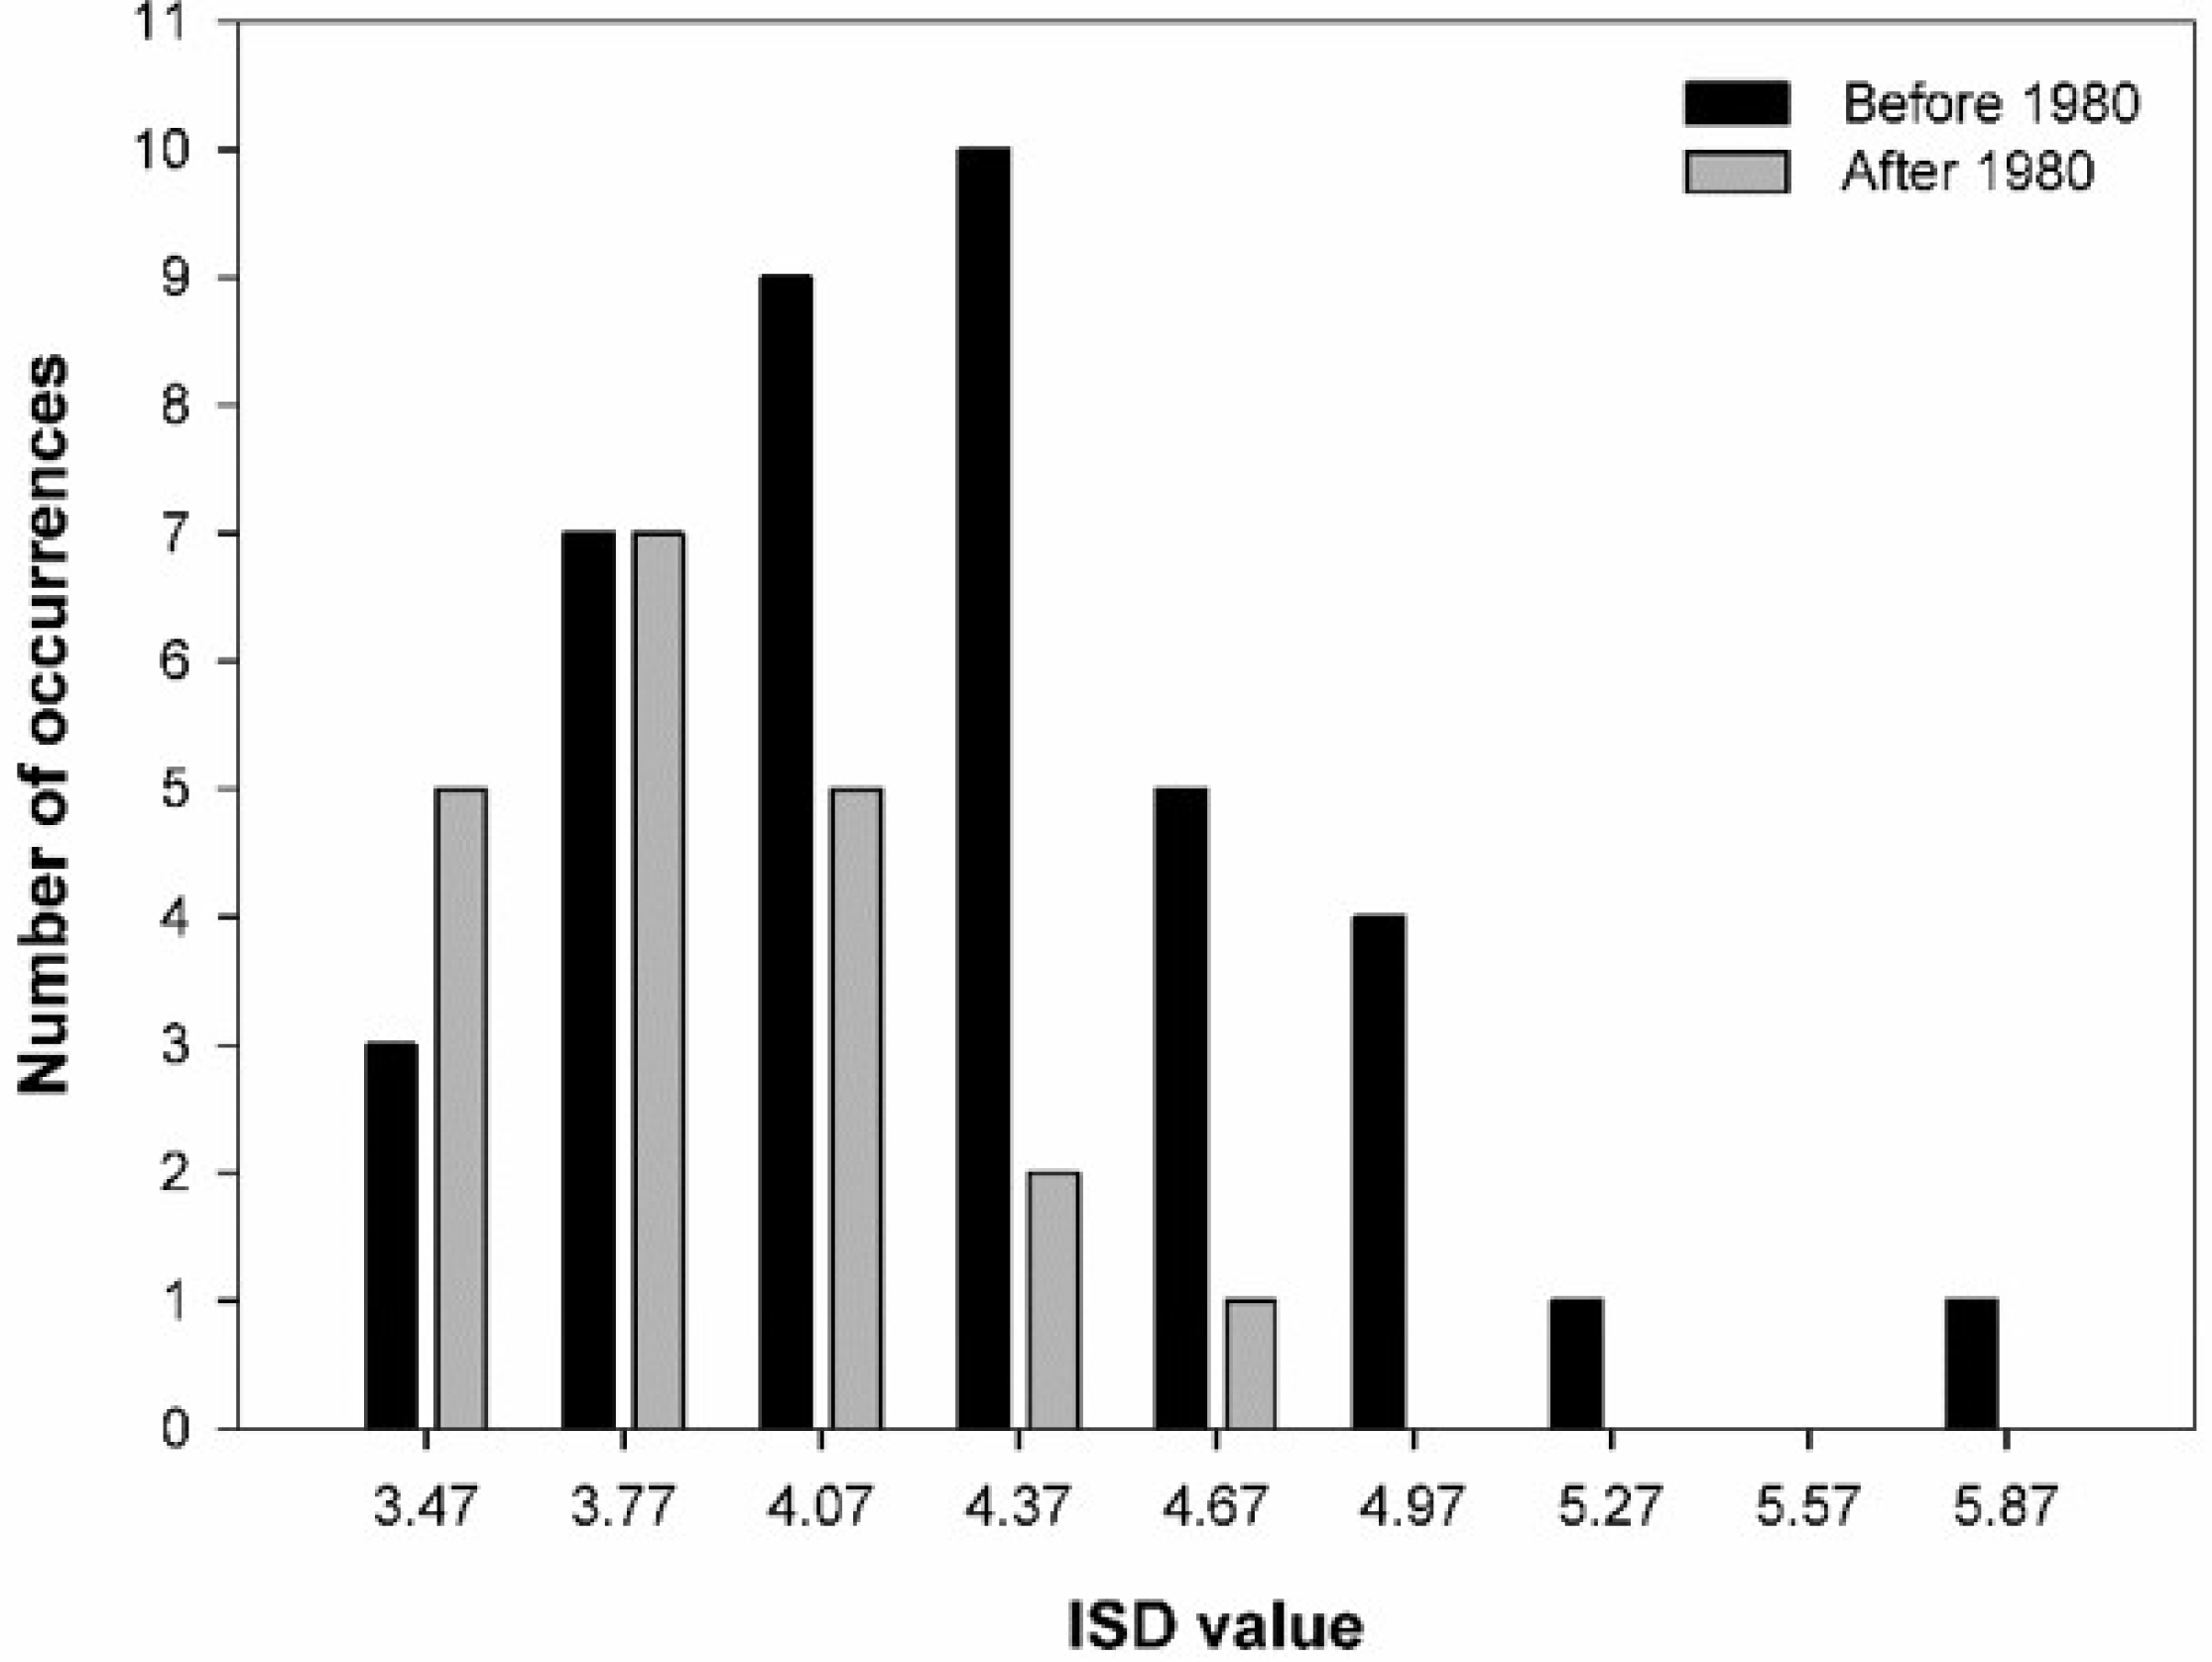
2.4. Index of Surface Deterioration

A novel spectral index was introduced using visible and near infrared bands in order to provide an operative indicator of roof deterioration related to the presence of mosses and lichens, which are more commonly developed on older and weathered substrata [13]. The spectral index accounts for the absorption of the vegetation photosynthetic pigments and for the AC color, generally darker in case of weathered roofs. The spectral index is formulated as follows:
ISD   = C R 0.68 R 0.74
In more detail, CR0.68 is the value of the continuum-removed reflectance at 0.68 µm—the MIVIS band closest to the chlorophyll absorption peak (0.60–0.70 µm) [18]—and R0.74 is the reflectance at 0.74 µm, accounting for the cement matrix brightness level. The continuum removal is a method used to quantify the absorption features at specific wavelengths, normalizing the reflectance spectra to a common baseline [19]. A continuum removal is applied, approximating the continuum by the connection of local spectral maxima through straight-line segments. In this approximation a value of 1 is assigned to the local maxima, and a value between 0 and 1 is obtained in correspondence of the absorption features. We interpolated the reflectance of the MIVIS bands centered at 0.60 and 0.74 µm to build the continuum baseline and compute the depth of the chlorophyll absorption feature at 0.68 µm.
The ISD was calculated on the AC roofs classified by the SAM algorithm. An ANOVA statistical analysis was performed to test, at the image level, the hypothesis that the ISD is related to the AC deterioration level driven by age and roof exposure, as proved from the field survey and the spectral ground measurements. The average ISD value of sixty roofs randomly selected was considered for the analysis as the dependent variable, while year (i.e., year in which the roof was laid, self-declared by the owners) and exposure (i.e., roof exposure defined from the orthophoto) were considered as main categorical predictors. Regarding the year, the data of the sixty randomly selected roofs were grouped in six classes defined on a 5-year basis: (i) 1960–1964; (ii) 1965–1969; (iii) 1970–1974; (iv) 1975–1979; (v) 1980–1984 and (vi) 1985–1989. The exposure was represented, for each roof, by two classes: (i) north exposition (i.e., roofs that do not receive direct solar radiation) and (ii) other exposition (i.e., roofs that receive direct radiation during the day). Differences among the average ISD value of each class were assessed by the Fisher Least Significance Difference (LSD) test.
Finally, a threshold was applied to the ISD values to separate two deterioration classes (i.e., high and low) in order to suggest priorities in asbestos removal interventions.

3. Results and Discussion

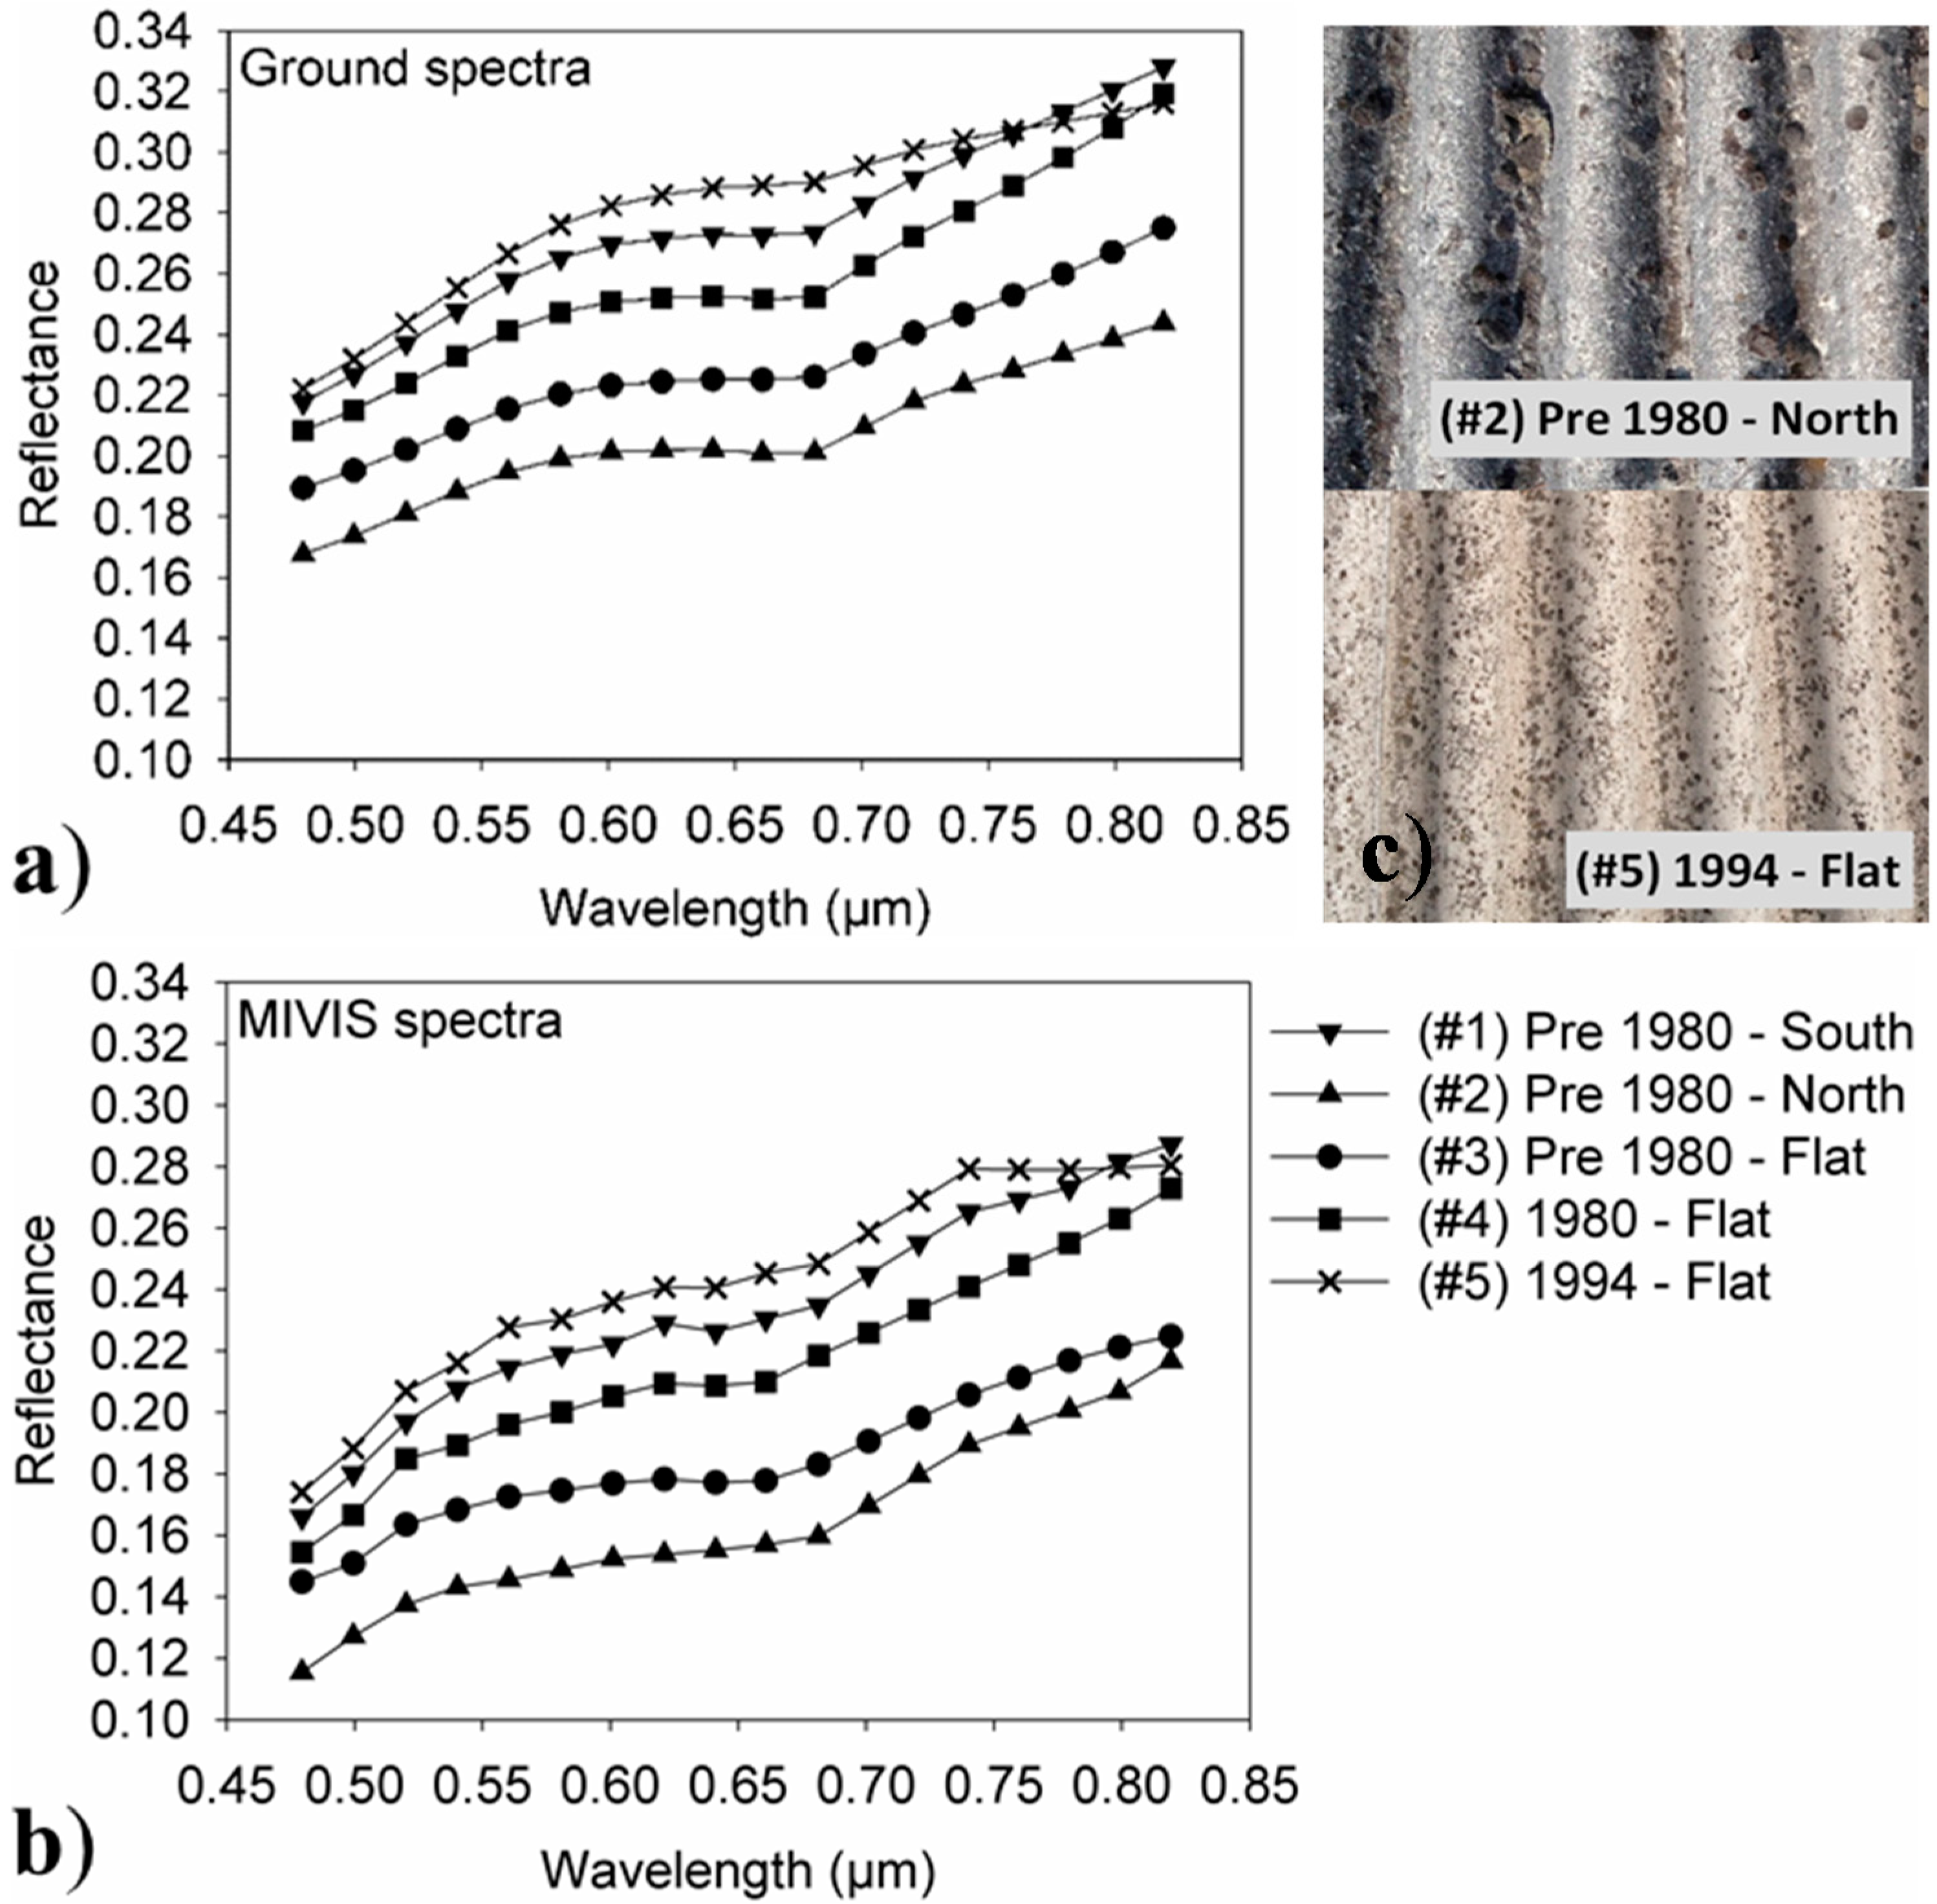
3.1. Asbestos Cement Spectral Analysis

In Figure 2a two roofs laid in different years (1980 and 1994) are shown as examples of different deterioration and weathering status related to the roof age. For the roof laid in 1980, it was observed that: (i) the matrix color was darker and (ii) the vegetation component was more developed. A darker color and greater vegetation presence were also observed in roofs exposed towards north, compared to roofs with a different exposure. The above-mentioned characteristics affected both the spectral properties acquired with: (i) the portable spectroradiometer operated on the elevated work platform and (ii) the MIVIS sensor. Spectra collected on the ground (resampled on the MIVIS bands) and spectra extracted from the corresponding pixels of the MIVIS images are reported in Figure 2a,b respectively. Spectra #2 and #5 correspond to the data acquired on the roofs in Figure 2c laid in 1980 and 1994, respectively. It can be observed that, in general, the ground spectra and the MIVIS spectra are similar and both are affected by the year of laying of the roof and its exposition. In more detail, the matrix color affected the reflectance causing variations in the visible and near infrared wavelengths with a lower brightness in case of older roofs (i.e., spectra #3: pre 1980, #4: 1980, #5: 1994). The vegetation presence caused an absorption in the red wavelengths, as it can be observed especially in spectrum #2 in Figure 2a,b. Moreover, the exposition affected the spectra as well (i.e., spectra #1: south, #2: north, #3 flat): north exposed roofs show lower brightness and higher absorption in the red wavelengths as a result of the darker matrix color and the higher presence of mosses and lichens due to more humid environmental conditions.
Figure 2. (a) Spectral signatures acquired on the roofs with the field spectroradiometer and resampled on the MIVIS sensor bands; (b) spectral signatures extracted from the MIVIS images on the same targets. Visible and near infrared wavelength range (0.48–0.82 µm) is shown; (c) Pictures taken on roofs laid in 1980 and in 1994, showing different levels of vegetation colonization and brightness;
Ijgi 04 00928 g002
In order to enhance variations of the absorption feature in the red wavelengths, the continuum removal was calculated in the 0.60–0.74 µm spectral interval. In Figure 3a the continuum-removed reflectance from the ground spectra resampled on the MIVIS bands is shown: the moss and lichen pigment absorptions are enhanced compared to the reflectance signatures in Figure 2b; old roofs and/or roofs exposed towards north (i.e., spectra #1 to #4) show a higher absorption due to a wider presence of mosses and lichens compared to the roof laid in 1994 (i.e., spectrum #5). Furthermore, the ISD that synthetizes the spectral features of different weathering status of AC roofs, is depicted in Figure 3b: the highest ISD values correspond to the most weathered roofs.
Figure 3. (a) Chlorophyll absorption features from continuum-removed reflectance spectra calculated on the spectra collected on the ground resampled on the MIVIS bands between 0.60 and 0.74 µm and (b) corresponding ISD (Index of Surface Deterioration) values.
Ijgi 04 00928 g003
The ISD calculated from the entire set of ground spectra (ISDASD) collected over eleven roof portions and the ISD calculated from the MIVIS spectra (ISDMIVIS) extracted from the corresponding pixels on the images were plotted against each other, as showed in Figure 4. The good agreement observed (R2 = 0.62, p = 0.004) confirms that ISD may be calculated from the MIVIS airborne data.
Figure 4. Linear regression between the ISD calculated from the ground spectra (ISDASD) and from the MIVIS spectra (ISDMIVIS) (R2 = 0.62) (n = 11).
Ijgi 04 00928 g004

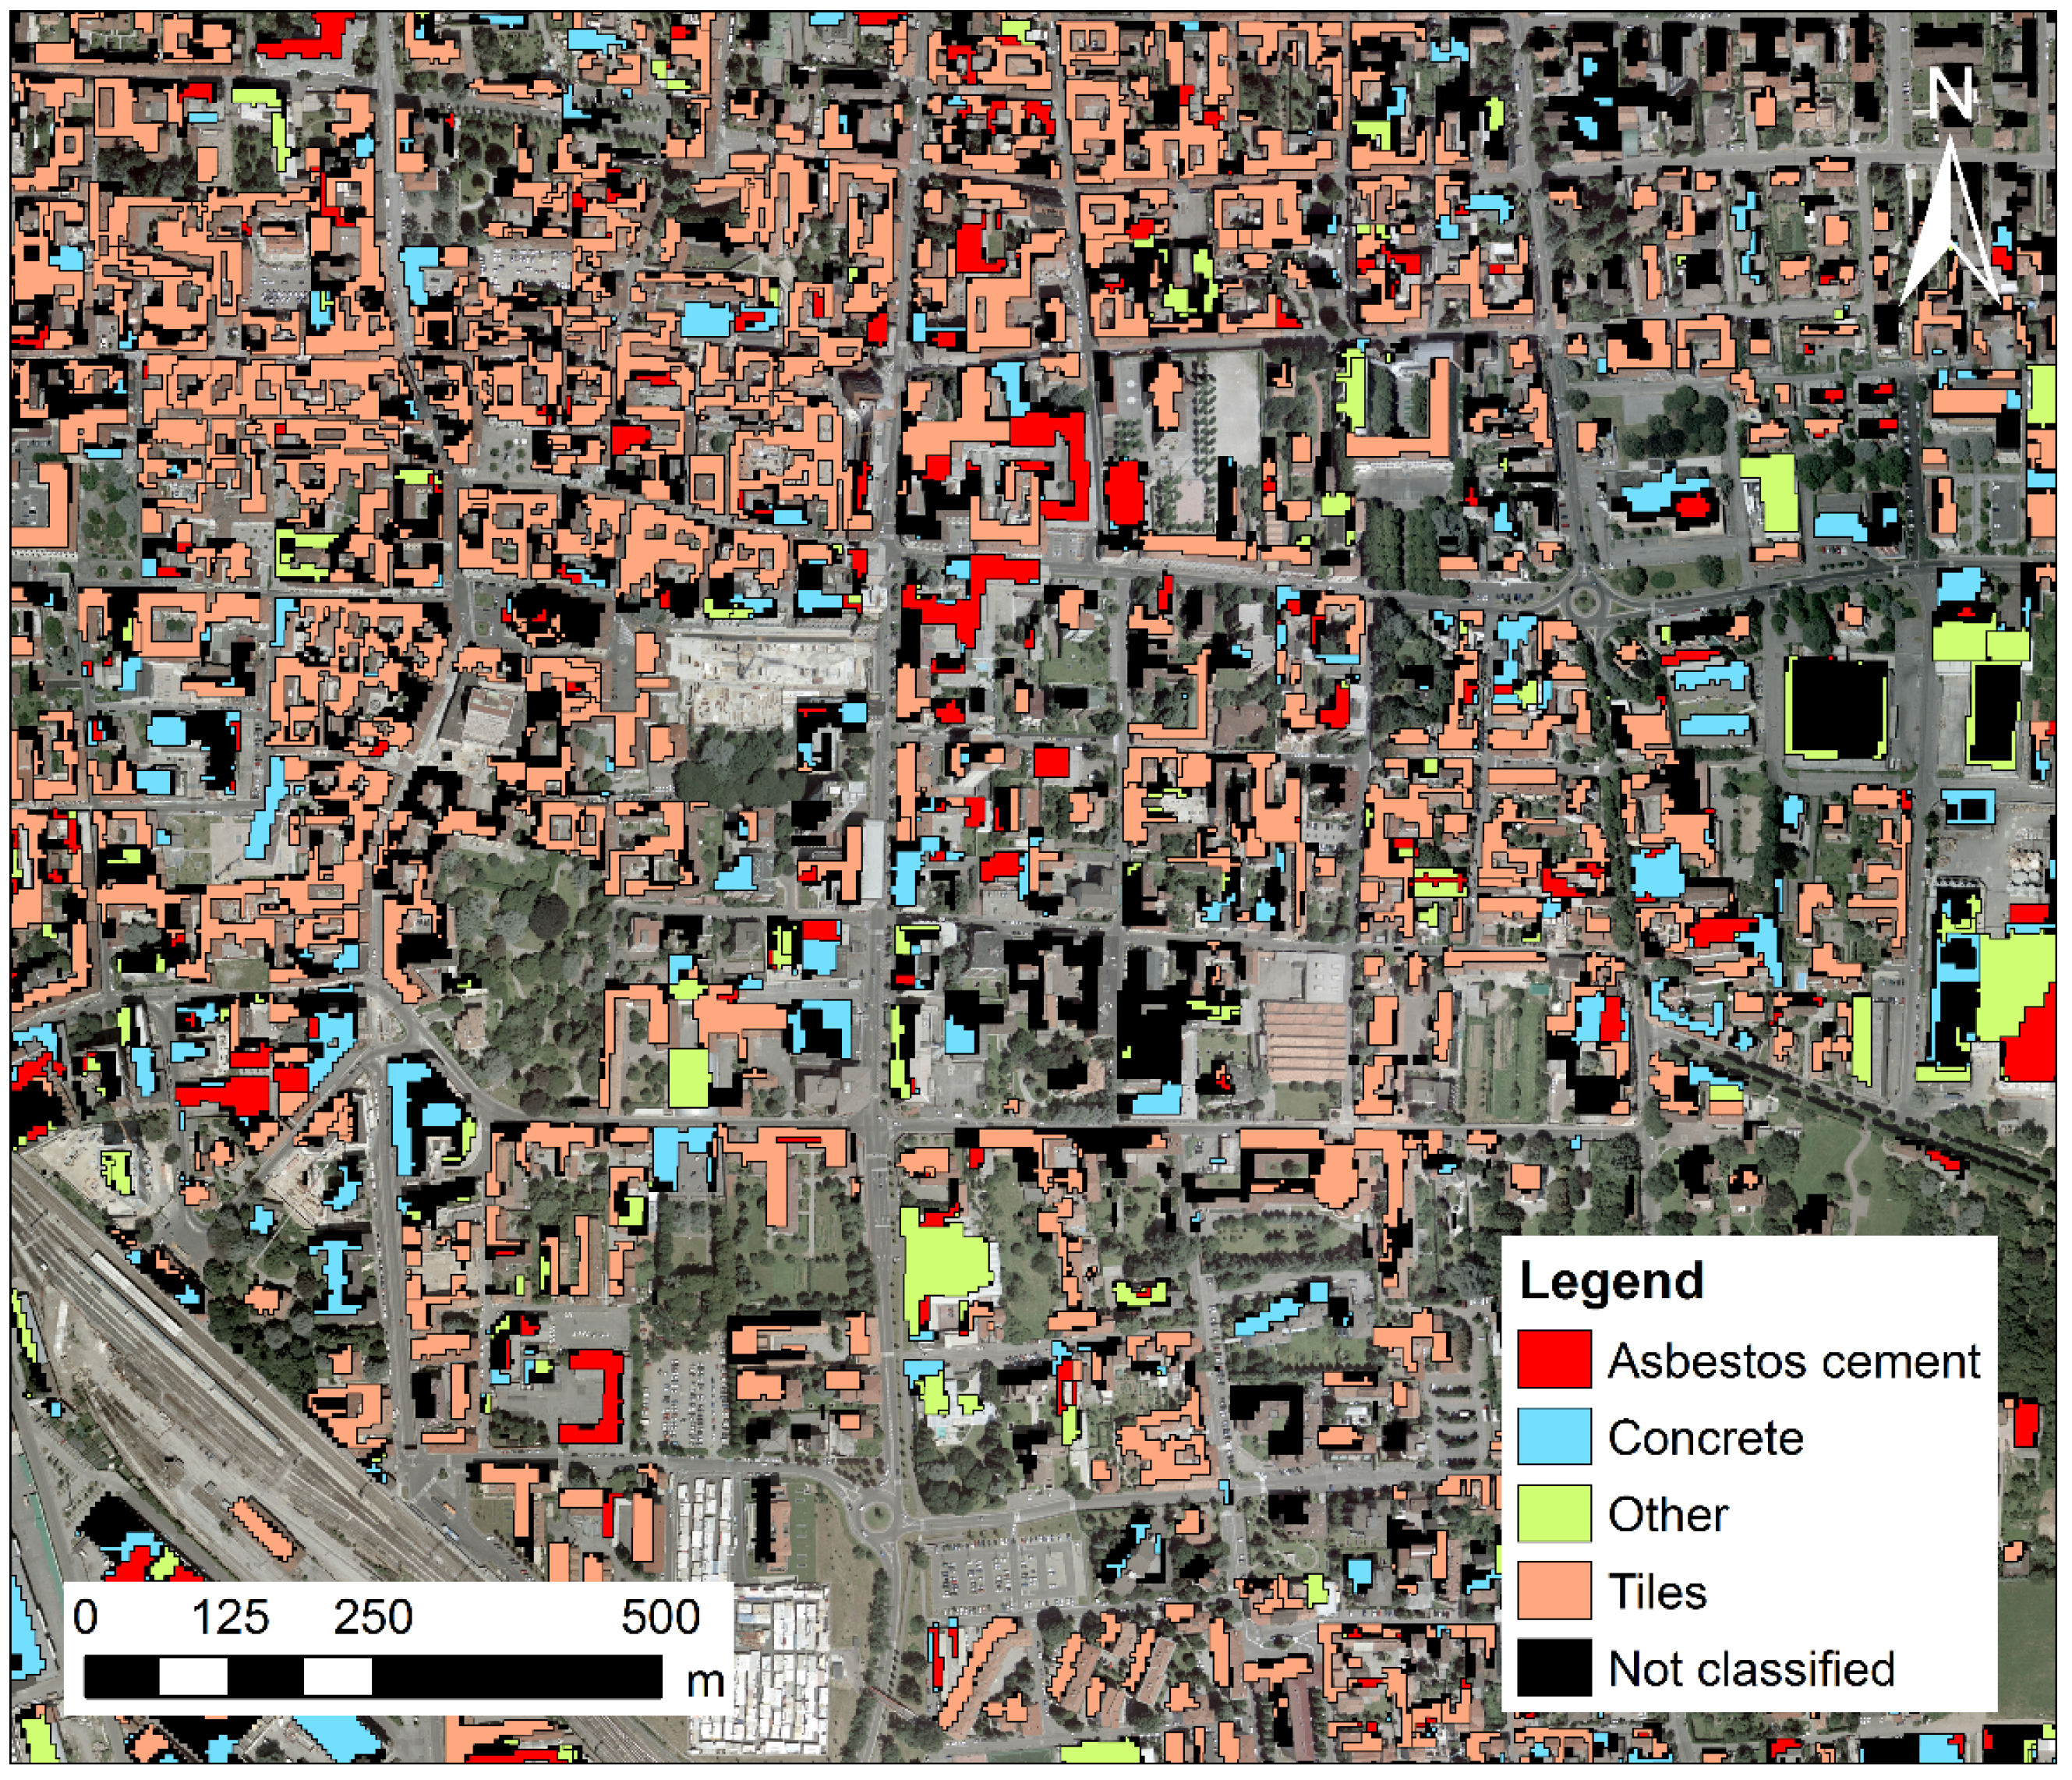
3.2. Asbestos Cement Roof Map and Index of Surface Deterioration Analysis

The roof area classified as AC corresponds to 9% of the total roof area of the five municipalities. The final map was obtained with the SAM algorithm applied in two steps: to the MNF components first and then to the reflectance bands. A view of the classification result is depicted in Figure 5. The PA and UA were calculated for each image separately (i.e., RUN 2–5) after the first and second classification steps. RUN 2 overlapped with RUN 1 in the urban area, so the assessment was limited to RUN 2, which was used for the final map. Results are reported in Table 1 and Table 2. Details on AC roofs (MIVIS classification and reference data) are reported in order to evidence AC omission and commission within the different classes. Results are consistent between the different images showing similar UA and PA as well as similar AC commission and omission between classes. In particular it is evidenced that AC omission errors mainly occur with not classified roofs, often due to the image spatial resolution (3 m) that is not optimal to map roofs of small and narrow shaped buildings (e.g., garages, sheds). The geometric incoherence between the cadastre and the AC roof map (Root Mean Square Error = 3 m) also explains part of the omission errors. The commission errors are mainly due to other materials, such as PVC (vinyl) membrane and aluminum, materials typically used for the roofs of more recent industrial or commercial buildings. This 2-step procedure allowed the improvement of the PA classification from an average of 75% to an average of 86%, significantly reducing the commission errors.
Asbestos cement (AC) classification line shows the number of roofs correctly classified as AC and the number assigned to classes different from AC (commission errors). AC reference line shows the ground truth assigned to randomly selected roofs through visual assessment of high resolution orthophotos and depicts the omission errors. The accuracy is expressed as producer’s accuracy (PA) and user’s accuracy (UA).
Figure 5. An example of classification results obtained through the SAM (Spectral Angle Mapper) algorithm on an urban area (Seregno, MB, Italy).
Ijgi 04 00928 g005
Table 1. Step 1: Classification accuracy assessment for RUN 2, 3, 4 and 5.
Step 1ACConcreteOtherTilesNot ClassifiedTotalAccuracy (%)
RUN 2AC classification7202800100PA = 72.0
AC reference72500279UA = 91.1
RUN 3AC classification380120050PA = 76.0
AC reference38200040UA = 95.0
RUN 4AC classification410120053PA = 77.4
AC reference41500147UA = 87.2
RUN 5AC classification280220050PA = 56.0
AC reference28400032UA = 87.5
Table 2. Step 2: Classification accuracy assessment for RUN 2, 3, 4 and 5.
Step 2ACConcreteOtherTilesNot ClassifiedTotalAccuracy (%)
RUN 2AC classification700120082PA = 85.4
AC reference70500479UA = 88.6
RUN 3AC classification37060043PA = 86.0
AC reference37200140UA = 92.5
RUN 4AC classification39060045PA = 86.7
AC reference39500145UA = 86.2
RUN 5AC classification28040032PA = 87.5
AC reference28400032UA = 87.5
The ISD was calculated, through Equation (1), for each roof classified as AC. In Table 3 the results of the ANOVA analysis performed on sixty roofs, in order to verify the influence of year and exposure on the ISD values, are reported. Both the main categorical predictors, year and exposure, significantly affected the ISD, while exposure over time (year × exposure) did not show any significant influence on the ISD values, hence there is no significant interaction between the two predictors. Their mean values and standard errors are shown in Figure 6. Year and exposure classes with different letter labels were significantly different according to the Fisher LSD test. The highest ISD values were observed for the oldest roofs and for the roofs exposed towards north. The statistical analysis confirmed the ground observations: ISD from MIVIS is related to AC weathering status and is mainly dependent on age and roof exposition.
Table 3. Results of the ANOVA analysis on the effect of year and exposure on the ISD (n = 60). Fisher test and p value are reported.
Categorical PredictorsF Valuep Value
yearF5,48 = 6.038p < 0.001
exposureF1,48 = 33.378p < 0.001
year × exposureF5,48 = 0.366p = 0.869
Figure 6. ISD mean values and standard errors of roofs considered in the ANOVA analysis (n = 60). Data are shown (a) grouped according to the year and (b) grouped according to the exposure. Results of the Fisher LSD test are reported with different letters.
Ijgi 04 00928 g006
In order to provide the municipalities with an operative tool to identify roofs with different weathering status, a threshold on the ISD value was defined. The threshold was chosen based on the fact that year 1980 is the discriminant age indicated in the regional law for the definition of the weathering status of roofs. An ISD of 4 discriminated quite well, as depicted by the two normal distributions representing roofs laid before 1980 and roofs laid after 1980 in Figure 7. Therefore, pixels with ISD equal to or lower than 4 were assigned to the “low deterioration” class and pixels with ISD greater than 4 were assigned to the “high deterioration” class corresponding to low and high removal priority, respectively.
The proposed method of deterioration assessment is not intended to replace traditional methods, which involve the counting of fibers through pull up tests and normally used by authorities according to official protocols. Instead, the method provides—in an expeditious manner—information about the roof weathering status and enables the integration of traditional techniques for the evaluation of the asbestos deterioration level.
Figure 7. ISD frequency histogram representing roofs laid before 1980 and after 1980.
Ijgi 04 00928 g007

3.3. Data Handling in a Geographic Information System

The available vector data (i.e., the cadastre shapefile of each municipality) were overlaid to the raster data (i.e., the AC classification and the ISD map) and further analyzed in ArcMap. The overlapping areas of the AC classification and the building polygons were quantified and the percentage of AC with respect to the whole roof area was calculated. Each building was assigned to the ISD class most represented among the pixels of the roof, as shown in Figure 8. Based on the ISD class, each roof was finally assigned to either high (ISD > 4) or low (ISD ≤ 4) removal priority. The information related to the AC presence and its weathering status were added to the original building shapefile.
Figure 8. (a) Detail of the ISD map on four buildings mapped on the MIVIS image: pixels with ISD > 4 are represented in red, pixels with ISD ≤ 4 in green; (b) Each roof was assigned to one unique ISD class and overlaid to an ortophoto: red roofs correspond to roofs with high removal priority (ISD > 4), green roofs to those with low removal priority (ISD ≤ 4).
Ijgi 04 00928 g008
The number of buildings with AC roof mapped in the study area was 3170, representing the 8% of the total number of buildings. Among the roofs mapped as AC, 1263 were classified as high removal priority (40%) and 1907 as low removal priority (60%).

4. Conclusions

This study demonstrated the potential of using hyperspectral remote sensing data for identifying AC roofs with an image based supervised classification using the Spectral Angle Mapper (SAM) algorithm. The AC roofs were identified with a user’s accuracy of 86% and a producer’s accuracy of 89%. A novel index has been proposed to identify roofs characterized by a different weathering status to suggest different priority-levels for removal interventions. According to the ISD, 40% of the asbestos roofs were classified as high removal priority. The involved municipalities may integrate this information with additional criteria such as the population density, the population distribution and the distance from high sensitive targets (e.g., schools and hospitals), in order to plan a removal strategy. The link between the cadastre building polygons, the AC classification and the ISD map allowed identifying the properties which need interventions so that the owners may be informed. These results are noteworthy because, as discussed in the introduction, asbestos fibers are classified as “carcinogenic to humans” by the International Agency for Research on Cancer.
The traditional monitoring of AC presence by local authorities visual inspection would be quite time consuming, especially in wide survey areas, while owner self-declarations may be imprecise or incomplete. This study confirmed that the mapping from remote sensing constitutes a valuable tool for the estimation of the asbestos still present as roofing material; furthermore, it provided, with the ISD, a novel operative criterion for planning the removal interventions.

Acknowledgments

This research was funded by the Amicabrianza-Agenda21 project. The authors gratefully acknowledge I. Gelmini and T. Fantasia for the collaboration during their bachelor thesis, S. Cogliati, B. Di Mauro, R. Garzonio (DISAT, University of Milano-Bicocca) and the personnel of the Municipality of Seregno for the support during the ground measurements and the personnel of all the municipalities involved for the data supply.

Author Contributions

Chiara Cilia wrote the manuscript supported in both data interpretation and manuscript writing by Cinzia Panigada, Micol Rossini and Roberto Colombo. A significant contribution to the data elaboration and interpretation was also provided by Gabriele Candiani and Monica Pepe. Chiara Cilia, Cinzia Panigada, Micol Rossini and Monica Pepe performed the ground measurements. Cinzia Panigada was the project lead scientist.

Conflicts of Interest

The authors declare no conflict of interest.

References

  1. Favero-Longo, S.E.; Turci, F.; Fubini, B.; Castelli, D.; Piervittori, R. Lichen deterioration of asbestos and asbestiform minerals of serpentinite rocks in Western Alps. Int. Biodeterior. Biodegrad. 2013, 84, 342–350. [Google Scholar] [CrossRef]
  2. Roggli, V.L.; Vollmer, R.T. Twenty-five years of fiber analysis: What have we learned? Hum. Pathol. 2008, 39, 307–315. [Google Scholar] [CrossRef] [PubMed]
  3. Magnani, C.; Ferrante, D.; Barone-Adesi, F.; Bertolotti, M.; Todesco, A.; Mirabelli, D.; Terracini, B. Cancer risk after cessation of asbestos exposure: A cohort study of Italian asbestos cement workers. Occup. Environ. Med. 2008, 65, 164–170. [Google Scholar] [CrossRef] [PubMed]
  4. Ferrante, D.; Bertolotti, M.; Todesco, A.; Mirabelli, D.; Terracini, B.; Magnani, C. Cancer mortality and incidence of mesothelioma in a cohort of wives of asbestos workers in Casale Monferrato, Italy. Environ. Health Perspect. 2007, 115, 1401–1405. [Google Scholar] [CrossRef] [PubMed]
  5. Raffn, E.; Villadsen, E.; Engholm, G.; Lynge, E. Lung cancer in asbestos cement workers in Denmark. Occup. Environ. Med. 1996, 53, 399–402. [Google Scholar] [CrossRef] [PubMed]
  6. Hillerdal, G. Mesothelioma: Cases associated with non-occupational and low dose exposures. Occup. Environ. Med. 1999, 56, 505–513. [Google Scholar] [CrossRef] [PubMed]
  7. Fiumi, L.; Congedo, L.; Meoni, C. Developing expeditious methodology for mapping asbestos-cement roof coverings over the territory of Lazio Region. Appl. Geomat. 2014, 6, 37–48. [Google Scholar] [CrossRef]
  8. Frassy, F.; Candiani, G.; Rusmini, M.; Maianti, P.; Marchesi, A.; Nodari, F.R.; Via, G.D.; Albonico, C.; Gianinetto, M. Mapping asbestos-cement roofing with hyperspectral remote sensing over a large mountain region of the Italian western Alps. Sensors 2014, 14, 15900–15913. [Google Scholar] [CrossRef] [PubMed] [Green Version]
  9. Fiumi, L.; Campopiano, A.; Casciardi, S.; Ramires, D. Method validation for the identification of asbestos-cement roofing. Appl. Geomat. 2012, 4, 55–64. [Google Scholar] [CrossRef]
  10. Marino, C.M.; Panigada, C.; Busetto, L. Airborne hyperspectral remote sensing applications in urban areas: asbestos concrete sheeting identification and mapping. In Proceedings of the Remote Sensing and Data Fusion over Urban Areas, IEEE/ISPRS Joint Workshop 2001, Rome, Italy, 8 November 2001–9 November 2001; pp. 212–216.
  11. Szabo, S.; Burai, P.; Kovacs, Z.; Szabo, G.; Kerenyi, A.; Fazekas, I.; Paladi, M.; Buday, T. Testing algorithms for the identification of asbestos roofing based on hyperspectral data. Environ. Eng. Manag. J. 2014, 13, 2875–2880. [Google Scholar]
  12. Bassani, C.; Cavalli, R.M.; Cavalcante, F.; Cuomo, V.; Palombo, A.; Pascucci, S.; Pignatti, S. Deterioration status of asbestos-cement roofing sheets assessed by analyzing hyperspectral data. Remote Sens. Environ. 2007, 109, 361–378. [Google Scholar] [CrossRef]
  13. Favero-Longo, S.E.; Castelli, D.; Fubini, B.; Piervittori, R. Lichens on asbestos-cement roofs: Bioweathering and biocovering effects. J. Hazard. Mater. 2009, 162, 1300–1308. [Google Scholar] [CrossRef] [PubMed]
  14. Richter, R.; Schläpfer, D. Atmospheric/Topographic Correction for Airborne Imagery; Technical Report; German Aerospace Center (DLR): Wessling, Germany, 2011; p. 194. [Google Scholar]
  15. Gao, B.C. An operational method for estimating signal to noise ratiosfrom data acquired with imaging spectrometers. Remote Sens. Environ. 1993, 43, 23–33. [Google Scholar] [CrossRef]
  16. Green, A.A.; Berman, M.; Switzer, P.; Craig, M.D. A Transformation for ordering multispectral data in terms of image quality with implications for noise removal. IEEE Trans. Geosci. Remote Sens. 1988, 26, 65–74. [Google Scholar] [CrossRef]
  17. Kruse, F.A.; Lefkoff, A.B.; Boardman, J.W.; Heidebrecht, K.B.; Shapiro, A.T.; Barloon, P.J.; Goetz, A.F.H. The Spectral Image-Processing System (SIPS)—Interactive visualization and analysis of imaging spectrometer data. Remote Sens. Environ. 1993, 44, 145–163. [Google Scholar] [CrossRef]
  18. Thomas, J.R.; Gausman, H.W. Leaf reflectance VS. leaf chlorophyll and carotenoid concentrations for eight crops. Agron. J. 1977, 69, 799–802. [Google Scholar] [CrossRef]
  19. Clark, R.N.; Roush, T.L. Reflectance spectroscopy: Quantitative analysis techniques for remote sensing applications. J. Geophys. Res. 1984, 89, 6329–6340. [Google Scholar] [CrossRef]

