Article

Investigation of Travel and Activity Patterns Using Location-based Social Network Data: A Case Study of Active Mobile Social Media Users

GIScience Research Group, Institute of Geography, Heidelberg University, Berliner Straße 48, Heidelberg 69120, Germany
*
Author to whom correspondence should be addressed.
ISPRS Int. J. Geo-Inf. 2015, 4(3), 1512-1529; https://0-doi-org.brum.beds.ac.uk/10.3390/ijgi4031512
Submission received: 4 May 2015 / Revised: 18 July 2015 / Accepted: 31 July 2015 / Published: 20 August 2015

Abstract

:
Due to its relatively high availability and low cost, location-based social network (LBSN) (e.g., Foursquare) data (a popular type of volunteered geographic information) seem to be an alternative or complement to survey data in the study of travel behavior and activity analysis. Illustrating this situation, recently, a number of studies attempted to use LBSN data (e.g., Foursquare check-ins) to investigate patterns of human travel and activity. Of particular note is that compared to other individual-level characteristics of users, such as age, profession, education, income and so forth, gender is relatively highly available in the profiles of Foursquare users. Moreover, considering gender differences in travel and activity analysis is a popular research topic and is helpful in better understanding the changes in women’s roles in family, labor force participation, society and so forth. Therefore, this paper empirically investigates how gender influences the travel and activity patterns of active local Foursquare users in New York City. Empirical investigations of gender differences in travel and activity patterns are conducted at both the individual and aggregate level. The empirical results reveal that there are gender differences in the travel and activity patterns of active local users in New York City at both the individual and aggregate level. Finally, the results of the empirical study and the extent to which LBSN data can be exploited to produce travel diary data are discussed.

1. Introduction

Conventionally, empirical investigations of travel and activity patterns exploit travel diary data collected from surveys. Survey-based travel diary data is not highly available. Survey-based travel diary data is not open-access, or is open with a lack of detailed individual-level information on commuters (e.g., gender, age, etc.), and data collection based on household questionnaires is always a time-consuming task. In the last decade, GPS trace and mobile phone data have paved the way for further studies on travel and activity [1,2,3]. However, like survey data, these two types of data both have limited availability.
More recently, with the development of information and communication technology (ICT), social media is becoming popular and has millions of active users [4]. Specifically, as a popular type of volunteered geographic information (VGI), georeferenced check-in data offered by location-based social networks (LBSNs) (Foursquare, Google Latitude, Facebook Places, etc.) create potential for analyzing human mobility [5,6]. Despite some limitations on representing human mobility, e.g., the bias of age group and place category, check-in data has the ability to uncover human mobility according to certain mechanisms [5,6]. Compared to the aforementioned travel data types, LBSN data are highly available and low cost. Moreover, profiles of LBSN users can offer individual-level characteristics (gender, age, etc.) of travelers. Therefore, it seems that LBSN data create potential for investigating the relationships between travel and activity patterns and individual-level characteristics.
This study aims to explore how gender influences travel and activity patterns using LBSN data. On the one hand, compared to other kinds of individual-level characteristics (age, profession, etc.), gender is relatively frequently specified in user profiles of LBSNs. For instance, 97% of Foursquare users include their gender information [7]. On the other hand, gender difference in travel and activity patterns is a popular research topic in feminist research [8,9,10]. Investigating gender differences in travel and activity patterns helps to better understand the change in women’s roles in family, labor force participation, society and so forth [11,12,13]. Moreover, gender difference is also a relevant research topic in transport research [14,15]. Research on gender and mobility helps with charting paths to sustainable transport [16,17], which is a common objective of urban planning. Traditionally, researchers investigate gender differences in travel distance, travel time, mobility space, travel mode, travel purpose and so forth [11,12,13,14,15,16,17,18,19,20].
There are some studies that utilize LBSN data to analyze travel and activity behavior [21,22,23,24,25,26,27,28,29]. The majority of these studies fail to consider the influences of individual-level characteristics on travel and activity behavior. In contrast, this study attempts to incorporate individual-level characteristics into the analysis of travel and activity behaviors using LBSN data.
The specific goal of this paper is to empirically investigate gender differences in activity patterns using LBSN data. Specifically, first of all, gender differences in activity patterns are investigated at the individual level. Secondly, gender differences in spatial distribution of activities and visited location categories are investigated at the aggregate level. Finally, based on the results of the empirical study, the extent to which LBSN data can be exploited to generate travel diary data is discussed.
The remainder of this paper is organized as follows: Section 2 introduces the LBSN data and empirical data used in this study. Section 3 presents the research methods used in this study. Section 4 presents the empirical study and analyzes its results. Finally, the paper presents a conclusion and future work.

2. Location-Based Social Network Data

Foursquare is the most popular LBSN, with 31% of mobile users active on social networks using it. Therefore, we have chosen Foursquare as a typical example to introduce LBSN data.

2.1. Travel Representation

In LBSNs such as Foursquare, each venue represents a physical location (see Figure 1). Common types of venues include restaurants, offices, apartments, hotels, bus stops, shops and gyms. In Figure 1, for instance, a user checks in at venue A (a house) and venue B (an office) consecutively. We can, therefore, deduce that he or she moves from venue A to venue B, irrespective of the specific route taken by the user between the two venues. In this case, the historical check-ins of the user consist in recording the user’s historical trips among distinct venues. Therefore, a series of consecutive check-ins can record the user’s travel diary. Of note is that unlike GPS traces, check-ins seldom reflect the precise travel routes of users between distinct locations due to a low sampling frequency.
Figure 1. Examples of user mobility.
Ijgi 04 01512 g001

2.2. Representativeness

Compared to travel diary data collected from surveys, travel diary data generated from Foursquare has a relatively low level of representativeness. This results from the heterogeneity in the usage of Foursquare. More specifically, the travel diary data produced from Foursquare check-ins are affected by bias regarding age group, frequency of use and location category. Firstly, the numbers of Foursquare users of different age groups are not proportional to the real population age distribution. Since Foursquare is primarily a young person’s site [30], there is a much greater number of young users than old users. For instance, 40% of Foursquare’s users are aged 18-29, whereas only 5% of Foursquare’s users are aged 54–65. Secondly, active users use social media frequently, while less active users rarely do. A statistical analysis of a Foursquare data set made by [31] reveals that approximately 20% of users generated only one check-in, 40% generated more than 10, whereas approximately 70,000 active users (around 10%) generated more than 100 check-ins. Therefore, the history of active users’ visited venues is more likely to be recorded by Foursquare check-ins than that of less active users. Thirdly, the numbers of check-ins at some categories of venues are not proportional to the numbers of actual visits. The majority of Foursquare users rarely check-in at some categories of venues (e.g., home venues) when they actually visit these venues. Therefore, a certain number of users’ visits to some locations are not recorded by check-ins, resulting in incomplete daily travel diaries being produced from those series of check-ins that failed to record some visits. Intuitively, the more active the users are, the more they are likely to check-in at venue categories that are relatively rarely recorded (e.g., home venues). As a result, we assume that the more active the users are, the more likely they are to record all the venues that they actually visit. Given this whole heterogeneity issue, it seems that Foursquare could be a relevant new data source for generating the travel dairies of active mobile social media users instead of the population as a whole.

2.3. Experimental Data

This section introduces the experimental data used in this study. First of all, New York City (NYC) was chosen as the study area, since it has a large volume of Foursquare check-ins and active users. NYC is composed of five boroughs (counties): Manhattan, Brooklyn, Queens, the Bronx and Staten Island. Manhattan is the central borough of NYC. Within the administrative boundaries of NYC, 148,169 check-ins made at 28,075 distinct venues by 2207 users (1216 male users and 991 female users) within 12 continuous weeks (from March 3, 2014 to April 27, 2014) were collected through the Foursquare application programming interface (API). Foursquare has a strict user policy. If check-ins are sent to public feeds such as Twitter, they are accessible with a Foursquare signature; otherwise, they are only visible to friends [28]. The check-in data set collected is made of check-ins shared on Twitter. A statistical review on Foursquare check-ins conducted by [28] suggests that approximately 10% of the total Foursquare check-ins are published via Twitter feeds and therefore open to public scrutiny.
In the data set used, on average, each venue has approximately 5 check-ins and was visited by approximately 2.5 distinct users. Given the above-mentioned heterogeneity issue, it is necessary to select only active users to constitute the sample of users, in order to ensure a relatively high level of representativeness. Besides, users who are likely to be tourists should be removed from the user sample set, since this study focuses on the activity patterns of residents, and tourists might have distinct activity patterns from NYC residents. In the following steps, we present how we generate daily trajectories from check-in data and how we select daily trajectories of users to ensure a relatively high level of representativeness.
(1) We filter duplicate check-ins. It is normal that when arriving at a location, a user will check in once at the location. However, sometimes the user checks in several times at the same location upon or after arrival. This mainly comes from users that may be bored or have nothing else to do. We need to remove such repeated check-ins. After this step, 109,053 check-ins were kept and 39,116 check-ins were removed.
(2) We produce daily trajectories by connecting the consecutive check-ins made by the same user on the same day. A daily trajectory should connect at least 2 distinct locations. After this step, 38,052 daily trajectories were produced.
(3) We filter daily trajectories containing “unreliable” trips. There are two types of “unreliable” trips:
(a)
“fake” trips: If the speed of the trip, i.e., (distance from previous check-in to next check-in)/(time lapse between previous check-in and next check-in), is greater than 200 km/h, that means the user is traveling at an extremely high speed. Such a speed is greater than all urban transportation modes, including bus, subway, car, etc. Such trips are considered fake trips.
(b)
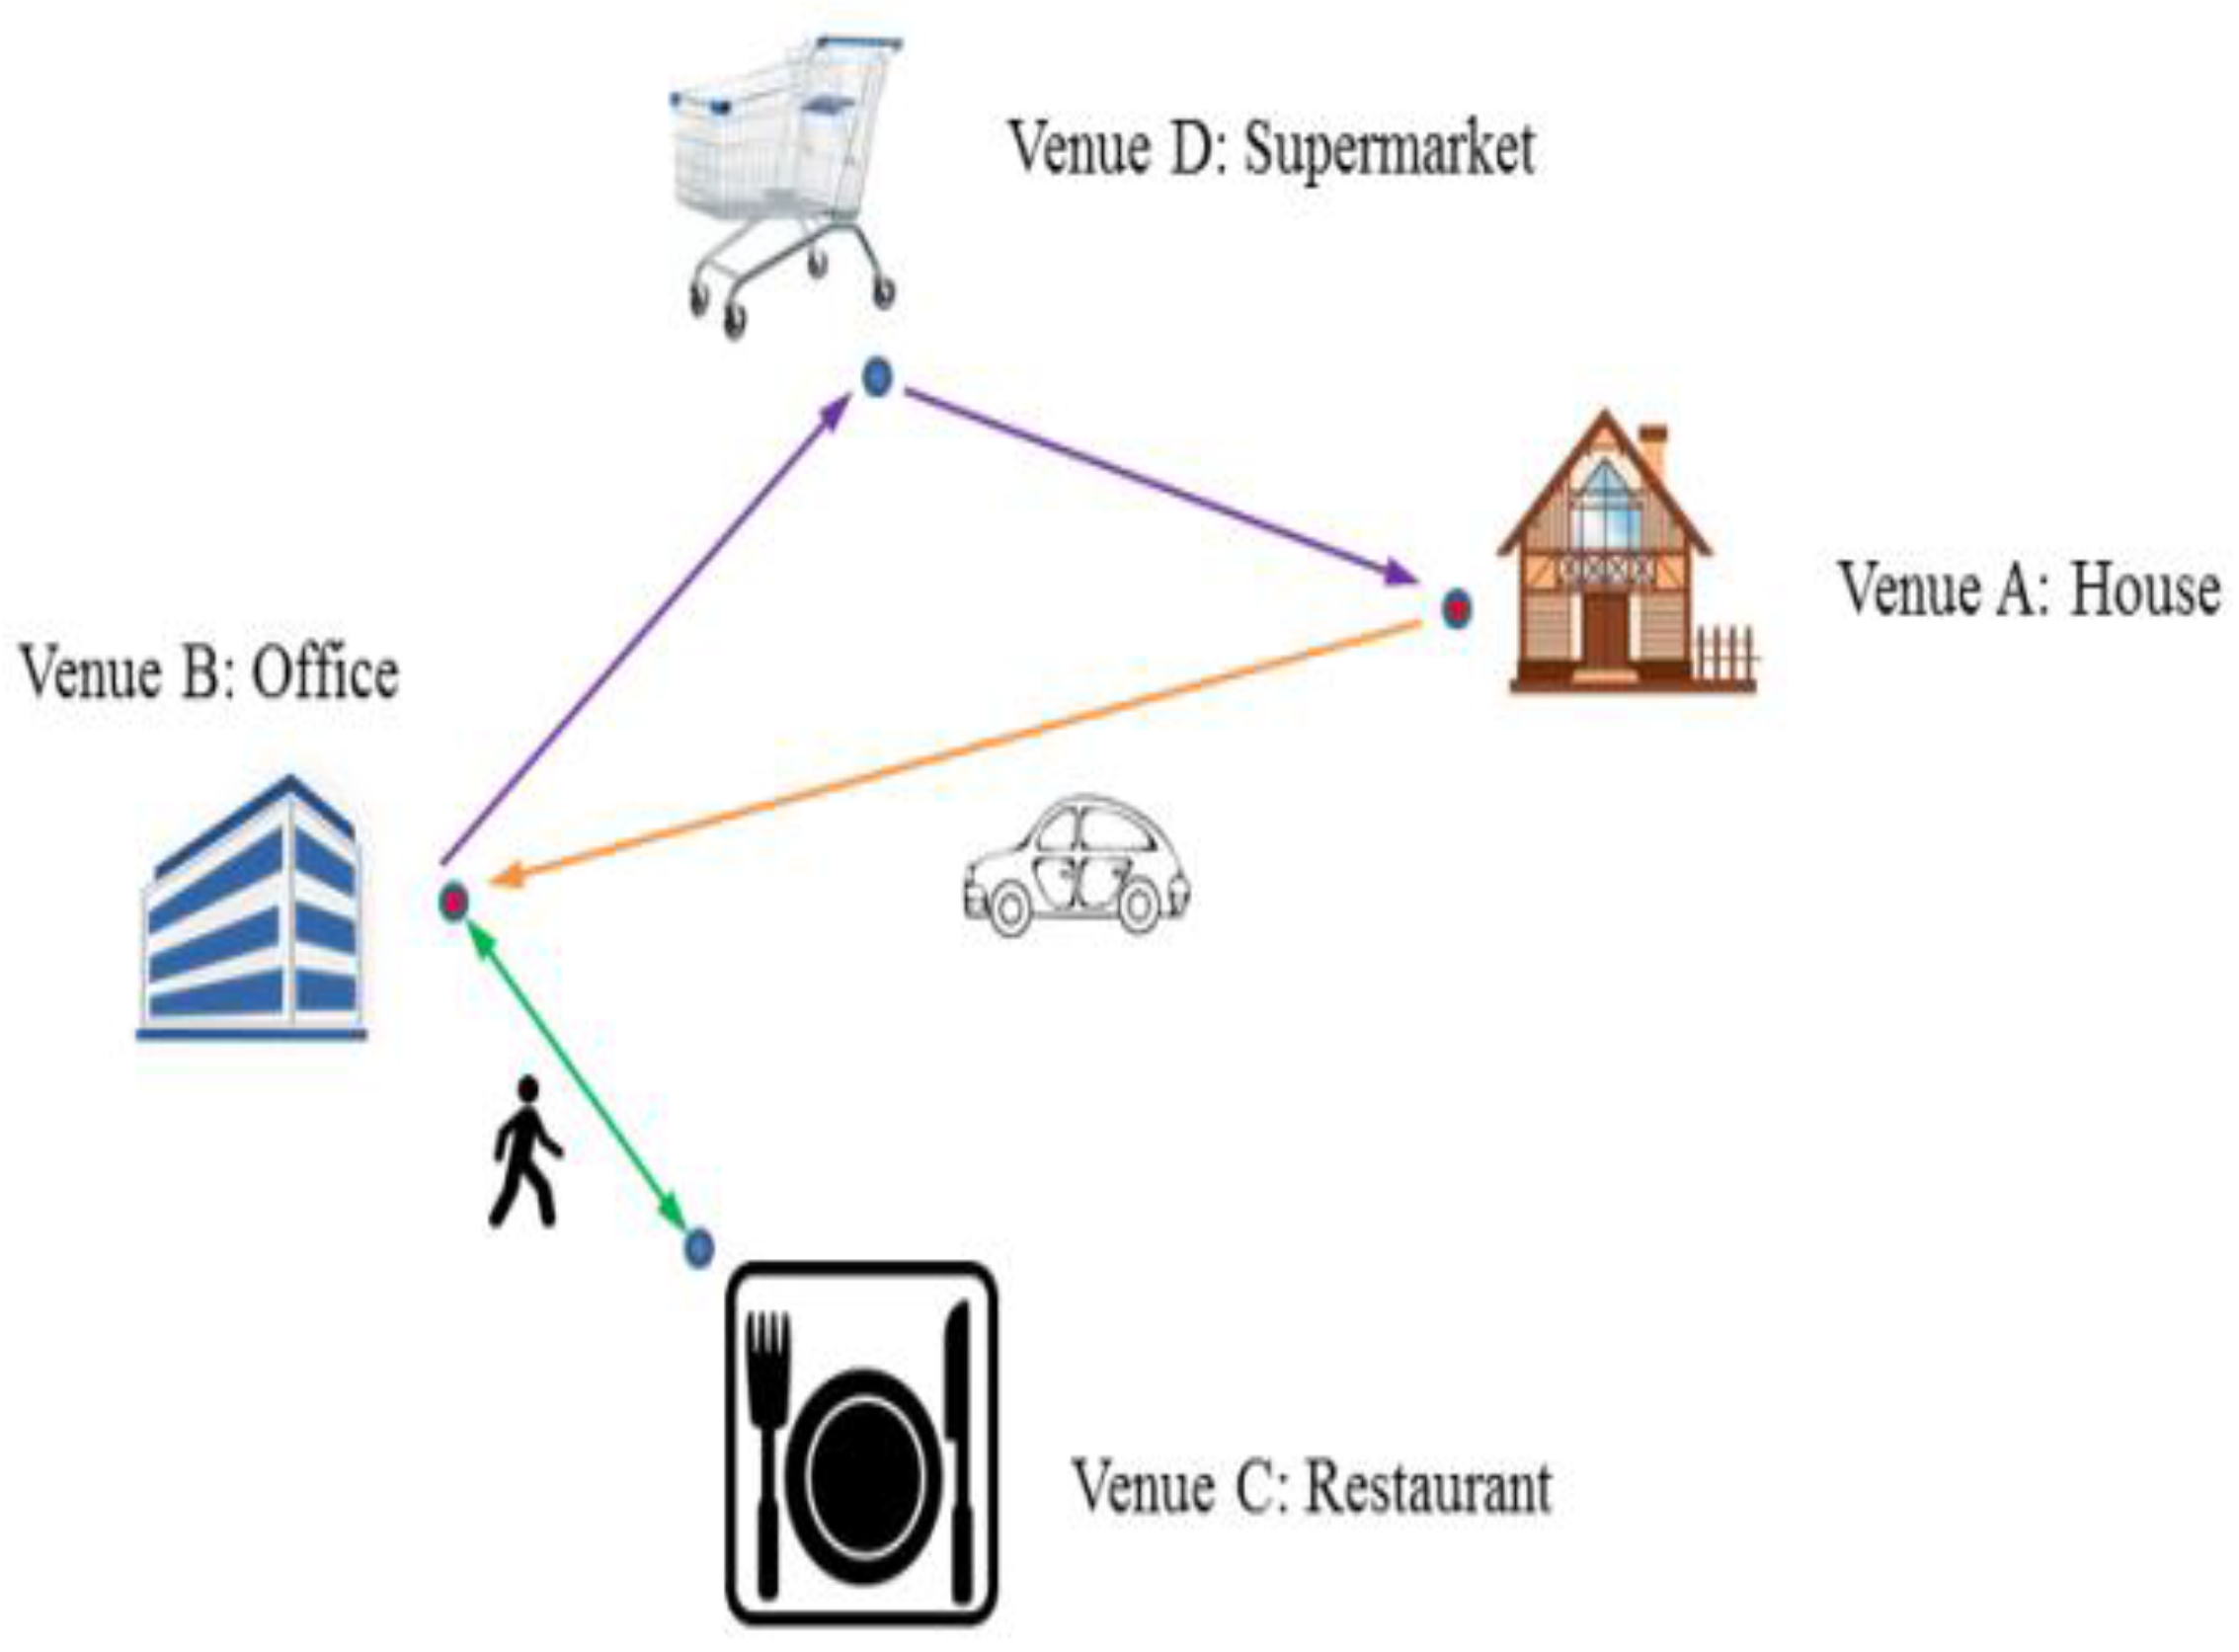
“incomplete” trips: If the trip time, i.e., time lapse between previous check-in and next check-in, is more than 8h, this means that some visits to some locations are very likely to be missing. For instance, a person checks-in at his or her office at 09:00 and further checks-in at his or her apartment at 19:00. The time period between the two consecutive check-ins is 10 hours. Such a pair of check-ins could only reveal a trip from the office to the apartment, implying that the person works or stays in the office for about 10 hours. This is not very reasonable, since a person is not very likely to work or stay in the office for 10 hours. He or she is very likely to visit other places apart from the office and home in the meantime. It is more likely for an individual to leave the office at 17:00 and go to a supermarket before going back home at 19:00. However, the person may not check-in at the supermarket, so his or her visit to the supermarket is not recorded in his or her historical check-ins.
After this step, 29,057 trajectories were kept and 8,995 trajectories containing “unreliable” trips were removed.
(4) We select daily trajectories with a higher level of representativeness. For this, we remove the daily trajectories that contain 2 distinct visited locations but only 1 trip. Similarly, daily trajectories with only 2 distinct visited locations but only 1 trip are likely to be “incomplete,” since they are likely to omit visits to further locations. For instance, a person checks in at his or her office at 09:00 and later checks in at his or her apartment at 19:00. In this case, although he or she has visited two distinct locations, there is only one trip from the office to the apartment being revealed by the historical check-ins. This trip constitutes a daily trajectory. Obviously, the trip from the apartment to the office, which should have happened earlier (e.g., in the morning), is not revealed by the daily trajectory generated from the check-ins. After this step, 13,162 daily trajectories with a relatively high level of representativeness and taken by 1835 users were kept.
(5) We further select users with a high level of representativeness. It is very important to select active local users. Here, we regard active local users as users who (1) are likely to check-in at locations as much as possible whenever they actually visit these locations, and who (2) are likely to have daily trajectories for a sufficient number of days. More specifically, we selected users who have at least 28 daily trajectories, i.e., those who have daily trajectories for at least 28 days (4 weeks). From the aforementioned 1,835 users, we have selected 96 active local users who have daily trajectories on 28–56 distinct days (i.e., 4–8 weeks).
(6) Finally, we kept the daily trajectories of the selected active local users.
As a result, 96 sampled users (50 male users and 46 female users) were selected to constitute the user samples and their 3734 daily trajectories made of 18,815 check-ins were selected as trajectory samples. The numbers of daily trajectories and check-ins contributed by male and female users are listed in Table 1. These 96 sampled users are very likely to be local active users since (1) they have daily trajectories on 28–56 distinct days (i.e., 4–8 weeks), and (2) 78 of them (about 81%) check in at home venues (private houses, apartments, etc.). Each of the selected daily trajectories is made of at least 3 distinct locations and a selected user makes, on average, 5.2 check-ins per day. Moreover, more than 80% of the selected users check in at home venues, which belong to venue categories relatively rarely visited, somewhat indicating these users are likely to check-in at most or all the venues that they actually visit. Given the usage habits of Foursquare users, the data set (i.e., the 3734 daily trajectories and 18,815 check-ins) used in the empirical study can be considered samples for establishing daily travel diaries of active local users in NYC.
Since the age of Foursquare users in NYC is difficult to acquire, we have tried to use the age distribution of Foursquare users in other cities, regions or countries to approximately represent the age structure of our user samples for NYC. To the best of our knowledge, there is no statistical review of the structure of Foursquare users in academic research publications. Meanwhile, we found a statistical review of the age structure of Foursquare users throughout the world that is made available by a social media agency named Ignite Social Media Agency (http://www.ignitesocialmedia.com/). According to this statistical review, approximately 80% of Foursquare users are aged between 25–54 [32]. Based on the assumption that the age structure of Foursquare users in NYC is similar to that of the whole world, we assume that the majority of the sampled users are likely to be aged 25–54.
Table 1. Description of the empirical data set used in this study.
GenderNumber of
UsersCheck-insDaily trajectories
Male5090161944
Female4697991790
Total9618,8153734

3. Methodology

In this section, the approach used to investigate gender differences in activity patterns of LBSN users is presented. Firstly, at the individual level, gender differences in activity patterns are investigated. Specifically, ellipse-based measures are used to characterize activities of individuals. Secondly, at the aggregate level, gender differences in the spatial distribution of activities and visited location categories are investigated. The spatial distributions of male and female users’ activities are compared by using a spatial analysis method. Furthermore, the association between land use characteristics and gender differences in the spatial distribution of activities at the aggregate level is explored. Then, the gender differences in visited location categories are investigated by comparing the percentages of male and female users’ visits to different location categories.

3.1. Characteristics of Individual Activity

First of all, at the individual level, this study uses ellipse-based measures to characterize daily activities of individuals. Ellipse-based measures such as the standard deviational ellipse (SDE) have been used to compare not only the size of activity spaces, but also the dispersion of activity spaces between travelers [33,34,35]. To characterize daily activities of individuals, we use four ellipse-based indicators in this study. Figure 2 maps the locations visited by an individual during one day, which represents the daily travel diary of the individual. An SDE is generated from the visited locations, which covers all the locations visited by the individual during that day. In Figure 2, the ellipse represents the SDE and the two lines are the X- and Y-axis representing the long and short axis of the ellipse. The four indicators that we use are defined as follows:
(1) Area of SDE is used to represent the size of the activity space [35].
(2) Ratio of long to short axis indicates the fullness of the ellipse representing the relative extent to which the traveler deviates from the area of the main travel route [35].
(3) Distinct location count (DLC) is the number of distinct locations visited by a user within one day.
(4) Distinct location category count (DLCC) is the number of distinct location categories visited by a user within one day.
Figure 2. SDE of an individual’s daily activities.
Ijgi 04 01512 g002

3.2. Characteristics of Activities at the Aggregate Level

In this sub-section, we briefly introduce how we have investigated gender differences in the spatial distribution of activities and visited location categories at the aggregate level.
Firstly, the spatial distributions of male and female users’ activities is compared by using the bivariate local Moran’s I method. The bivariate local Moran’s I statistic method [36] is widely used to measure the spatial association of two distinct attributes. It is used here to measure the spatial autocorrelation of activities between male and female users. More details about the interpretations of the bivariate local Moran’s I statistic method are presented with an empirical study in Section 4.2.1.
Secondly, the gender difference in visited location categories is investigated by comparing the percentages of male users’ check-ins (visits) to different location categories and those of female users. To better measure the gender difference in percentage, we use a relative difference instead of an absolute difference. The relative difference is expressed as follows:
Relative difference = 2×|PmPf| / (Pm + Pf),
where Pm and Pf represent respectively the percentage of male and female users’ visits to a certain location category.

4. Empirical Study

In this section, the results of the empirical investigation of gender differences in activity patterns are presented and discussed. Specifically, gender differences in individual activity patterns are empirically investigated. Gender differences in the spatial distribution of activities and visited location categories at the aggregate level are empirically investigated separately and presented later. Furthermore, the empirical results are discussed and as a consequence, some findings are derived.

4.1. Gender Differences in Individual Activity Patterns

In this sub-section, gender differences in individual activity patterns are empirically discussed. 3794 daily SDEs were produced, and afterward, the four individual indicators for the 3794 daily trajectories were calculated.
Firstly, we look at the distributions of the four indicators for male and female users. Figure 3 shows the complementary cumulative distribution functions (CCDFs) of the four indicators for male and female users. Intuitively, the distributions of the four indicators for male and female users follow similar laws. For instance, the distributions of ratio of long to short axis for male and female users both seem to approximately follow a power law (see Figure 3b), whereas the distributions of DLC for male and female users both seem to approximately follow an exponential law (see Figure 3c). Figure 3 further reveals that intuitively, there are relatively large gaps in area of SDE, DLC and DLCC between male and female users, whereas there is a relatively small gap in ratio of long to short axis between male and female users.
Secondly, the Wilcoxon test is used to statistically test whether the gaps observed when measuring the four indicators for male and female users are substantial. The Wilcoxon test is always used as an alternative to the T-test when the population cannot be assumed to be normally distributed. Table 2 shows the average area of SDE, ratio of long to short axis, DLC and DLCC values for male and female users and the results of the Wilcoxon test. In the results of the Wilcoxon test, the p-values corresponding to area of SDE, DLC and DLCC are all less than 0.01. This means that the average area of SDE value for male users is statistically significantly larger than that for female users, whereas the average DLC and DLCC values for male users are both statistically significantly smaller than those for female users at the 0.01 level. However, the p-value corresponding to ratio of long to short axis is 0.25, meaning that the average ratio of long to short axis value for male users is not statistically significantly larger than that for female users.
The results of the empirical analysis reveal three findings, which are that in NYC, (1) male users have a larger daily activity space; (2) female users visit more distinct locations and more distinct location categories within one day; and (3) there is no substantial gender difference in the relative extent to which the traveler deviates from the area of the main travel route.
The first finding is consistent with a previous finding revealed by some literature, whereby men are more likely to have a long trip than women [11,17,18,19]. This finding is possibly rooted in that women are likely to work at places closer to their homes [12,13,18]. The second finding derived from this empirical analysis is a new one. This might result from the fact that participation in activities is different between men and women. Some existing research [19,20] reveals that women undertake fewer work activities but more non-work activities than men. Participation in more non-work activities is likely to result in visits to more distinct locations and more distinct location categories. The third finding derived from this study is a new one as well.
Figure 3. CCDFs of the four indicators for male and female users in log-linear plots and log-log plots. (a) Area of SDE; (b) ratio of long to short axis; (c) DLC; (d) DLCC.
Ijgi 04 01512 g003

4.2. Gender Differences in Activity Patterns at the Aggregate Level

In this sub-section, gender differences in activity patterns are empirically discussed at the aggregate level. Specifically, we empirically investigate gender differences in the spatial distribution of activities and in the visited location categories separately.
Table 2. Average area of SDE, ratio of long to short axis, DLC and DLCC values for male and female users and the results of the Wilcoxon test.
IndicatorMeanWilcoxon Test
MaleFemalep-value
Area of SDE (km2)13585<0.01
Ratio of long to short axis59530.25
DLC4.65.5<0.01
DLCC4.04.3<0.01

4.2.1. Gender Differences in the Spatial Distribution of Activities at the Aggregate Level

First of all, gender differences in the spatial distribution of activities are empirically explored at the aggregate level. Furthermore, the association between land use characteristics and gender differences in the spatial distribution of aggregate activities is empirically explored.
Neighborhood Tabulation Area (NTA) data, where NTAs are aggregations of census tracts in NYC, are used to represent spatial divisions of NYC in this study, since several types of demographics are made based on these divisions. The most up-to-date NTA and land use data in NYC are all downloaded from the Department of City Planning (DCP), NYC [37]. The NTA and land use data used in this empirical study were both collected in 2010. Of note is that some NTAs are composed of more than one non-adjacent polygon; such NTAs need to be further divided into spatially-separate polygons, called sub-NTAs. As a consequence, the 195 NTAs of NYC were transformed into 352 sub-NTAs (see Figure 4). In this empirical study, sub-NTAs were used as the basic spatial features in the analysis of spatial distribution.

(1) Spatial distribution of male and female users’ activities at the aggregate level

To investigate gender differences in the spatial distribution of activities, the bivariate local Moran’s I statistic method was used. Sub-NTA was selected as the spatial feature in the implementation of the bivariate local Moran’s I statistic method. The numbers of male and female users’ check-ins within a spatial feature (sub-NTA) constitute the two attributes, representing the aggregated number of activities for male and female users, respectively, within this spatial feature. 10 km was chosen as the neighboring distance threshold. In this case, each spatial feature (sub-NTA) has approximately 80 neighbors. There are approximately 350 spatial features (sub-NTAs), thus 80 spatial features represent more than 20% of the total number of spatial features.
After 999 Monte Carlo simulations, statistically significant clusters and outliers of activities were generated. Figure 4 displays the clusters and outliers of activities detected in NYC. In Figure 4, a High-High cluster indicates spatial clustering of high values of both male and female users’ activity counts, whereas a Low-Low cluster indicates spatial clustering of low values of both male and female users’ activity counts. Similarly, a Low-High outlier implies that low values of male users’ activity counts are associated with high neighboring values of female users’ activity counts, whereas a High-Low outlier implies that high values of male users’ activity counts are associated with low neighboring values of female users’ activity counts. Finally, the category Not Significant means that there is no statistically significant spatial dependence or association of male and female users’ activity counts.
Figure 4. Clusters and outliers of male and female users’ activity counts in NYC.
Ijgi 04 01512 g004

(2) Association of clusters and outliers with land use characteristics

We further attempt to uncover associations between, on the one hand, the clusters and outliers, and, on the other hand, land use characteristics, by analyzing the proportions of land use categories within the clusters and outliers (see Table 3). Results of the association analysis are interpreted as follows:
Firstly, High-High clusters are mainly located in areas that either (1) have a higher proportion of commercial and industrial land (i.e., 14% and 14%) compared to the areas covered by other three types of clusters and outliers; (2) have a lower proportion of residential land (i.e., 26%) compared to the areas covered by the other three types; and (3) are likely to be Central Business Districts (CBDs) or sub-CBDs (e.g., Lower Manhattan, Downtown Brooklyn and Hudson Yards).
Secondly, Low-Low clusters are mainly located in areas that either (1) have a high proportion of residential land (i.e., 49%); (2) have a relatively low proportion of commercial and industrial land; and

(3) are distant from CBD or sub-CBDs.

Thirdly, Low-High outliers are mainly located in areas that either (1) have a relatively low proportion of residential land (i.e., 36%); (2) have a relatively high proportion of commercial land (i.e., 12%); and (3) are close to CBDs or sub-CBDs (e.g., Harlem and Long Island City).
Fourthly, High-Low outliers are mainly located in areas which either (1) have the highest proportion of residential land (i.e., 53%); (2) have the highest proportion of outdoor recreational land (i.e., 18%); and (3) have the lowest proportion of commercial and industrial land; and (4) are distant from CBD or sub-CBDs.
Finally, comparing land use characteristics of the areas covered by Low-High and by High-Low outliers suggests that (1) female users are more likely to visit commercial lands that are close to CBD or sub-CBD, whereas (2) male users are more likely to visit outdoor recreational lands that are distant from CBD or sub-CBD. This implies that male users are more likely to visit places distant from CBD than female users. Compared to traveling from places close to CBD to places in other types of regions, traveling from places on the fringe to places in other types of regions could result in a relatively large activity space given the geometry of the urban sprawl.
In summary, in NYC, female users are more likely to visit commercial lands that are close to CBD or sub-CBD, whereas male users are more likely to visit outdoor recreational lands that are distant from CBD or sub-CBD. This finding somewhat explains why male users have a larger activity space than female users. In NYC, the spatial distribution of the venues that female users often visit might constrain the activity spaces of female users.
Table 3. Percentages of land use categories within clusters and outliers.
Land Use CategoryCluster and Outlier (Male-Female)
High-High (%)Low-Low (%)Low-High (%)High-Low (%)
Residential Land26493653
Mixed Residential & Commercial Land108211
Commercial & Office Land147124
Industrial & Manufacturing Land14342
Transportation & Utility7435
Public Facilities & Institutions613156
Open Space & Outdoor Recreation189418
Parking Facilities3421
Vacant Land2329

4.2.2. Gender Differences in Visited Location Categories

In this sub-section, gender differences in visited location categories are empirically explored at the aggregate level. First, we list the gender differences in the percentages of aggregated visit numbers to distinct location categories. Table 4 lists the 10 most visited location categories and their associated relative difference values calculated using the equation provided in Section 3.2. In Table 4, the relative difference values for the last three location categories (i.e., bus stop, clothing, shoes & accessories, and office) are significantly larger than those associated with the other categories. More specifically, the relative difference values associated with the last three location categories are over 0.4, while the relative difference values for the other categories do not exceed 0.25. This indicates that at the aggregate level, there are relatively large gender differences in the number of visits to some location categories (mainly bus stop, clothing, shoes & accessories and office) visited by active local users in NYC. More specifically, male users are more likely to visit bus stops and offices, whereas female users are more likely to visit clothing, shoes & accessories places. Moreover, as revealed above, High-High clusters (spatial clustering of high values of both male and female users’ activity counts) are located in areas that have a higher proportion of commercial and industrial land. Considering these additional results, the findings regarding the gender differences in the visited location categories seem to further imply that, considering commercial and industrial lands, male users are more likely to visit offices generally found in industrial lands, whereas female users are more likely to visit clothing, shoes & accessories generally found in commercial lands.
Table 4. Gender differences in percentages of aggregated numbers of visits to distinct location categories.
Location CategoryVisit (check-in) PercentageRelative Difference
Male Female
Restaurant9.84%9.73%0.01
Home6.78%6.57%0.03
Subway station5.56%5.49%0.01
Food store4.29%5.31%0.21
Café5.47%4.27%0.25
Sports site4.22%4.49%0.06
Bar4.60%3.79%0.19
Bus stop4.52%2.60%0.54
Clothing, shoes & accessories2.48%3.84%0.43
Office4.59%2.40%0.62

4.3. Validity of Investigations

In this sub-section, to discuss the validity of the investigations that we have conducted, we further attempt to validate some of the empirical results produced from Foursquare check-ins. The reference data that we have used for this purpose is the daily travel diary data from a travel survey called the Regional Household Travel Survey [38]. This survey was sponsored by the New York Metropolitan Transportation Council (NYMTC) and the North Jersey Transportation Planning Authority (NJTPA). A user manual available on the website explains how the data was collected and provides an overview of the data set [39]. Here, we cite selected key information from the manual to briefly report on the collection of the data. According to the manual, random recruitment of households was conducted by telephone through a recruitment interview. Participating households were assigned a specific “travel day” (typically 10 days after the recruitment interview) to record their travel. Each household member was asked to record their travel information in a travel diary for the specified 24-hour period. The latest survey was conducted from September 2010 through November 2011. The overall data set pertains to 18,965 households and 43,558 persons in the New York metropolitan area. There are 4923 participants (1) who are aged 25–54; (2) who shared their gender information and (3) whose home address is within NYC. Accordingly, these participants (2129 men and 2730 women) were selected as the reference user samples, since they are NYC residents and are likely to have a similar age structure to that of the Foursquare users sample. They provided 34,536 records of their visits to locations with detailed activity types.
Since the released survey data set has a relatively low positional accuracy level (less accurate than the street level), the daily travel diaries of the participants are mainly exploited to investigate gender differences in the indicators relevant to the number of activities (e.g., DLC and DLCC) rather than to investigate gender differences in the indicators relevant to precise positions of activities (e.g., Area of SDE and Ratio of long to short axis). More specifically, we have used two other indicators (i.e., visited location count and distinct activity count) as alternatives to DLC and DLCC in order to accurately characterize individual activity when using the survey data. This is mainly because in the survey data, there is a lack of information about the visited locations’ uniqueness, while the types of activities are clearly indicated. In this case, visited location count might count re-visits of participants to some locations (e.g., apartments) within one day. Due to the lack of uniqueness in location identification, we were not able to calculate DLC for participants involved in the survey. Instead, we have used visited location count as an alternative to DLC, with the assumption that re-visits of participants to some locations do not represent a large portion of the total number of visits.
Table 5 lists the average visited location count and distinct activity count values for the selected male and female survey participants and the results of the Wilcoxon test. It can easily be observed that the average visited location count and distinct activity count values for male participants are both statistically significantly smaller than those for female participants at the 0.01 level. This indicates that female participants visit more locations and are involved in more distinct activities than male participants within one day in NYC. This finding about gender differences is consistent with the one derived from Foursquare check-ins where “female users visit more distinct locations and more distinct location categories within one day” (see Section 4.1). Besides, of note is that the average visited location count values for both selected male and female survey participants are larger than the average DLC values for both male and female Foursquare users sampled (see Table 2 and Table 5). This is probably because visited location count might count re-visits within one day. Moreover, average distinct activity count values for both selected male and female survey participants are close to average DLCC values for both male and female Foursquare users sampled. This somewhat indicates that the users sampled have a relatively high level of representativeness.
Table 5. Average visited location count and distinct activity count values for the selected male and female survey participants and results of the Wilcoxon test.
IndicatorMeanWilcoxon Test
MaleFemalep-value
Visited location count6.97.1<0.01
Distinct activity count3.23.4<0.01

5. Conclusion and Future Work

This paper reports on the empirical investigation, using Foursquare check-in data, of how gender influences travel and activity patterns of active social media users. The empirical results reveal that there are gender differences in travel and activity patterns of active local users in NYC at both the individual and aggregate level. More specifically, (1) male users generally have a larger activity space, whereas female users generally visit more distinct locations and more distinct location categories; (2) there is no substantial gender difference in the relative extent to which the traveler deviates from the area surrounding the main travel route; (3) at the aggregate level, female users are more likely to visit commercial lands that are close to CBD or sub-CBD, whereas male users are more likely to visit outdoor recreational lands that are distant to CBD or sub-CBD; and (4) male users are more likely to visit bus stops and offices, whereas female users are more likely to visit clothing, shoes & accessories locations.
Based on the results of the empirical study, we discuss here to which extent LBSN data can be exploited to generate daily travel diaries. More specifically, we list the advantages and disadvantages of LBSN data with regard to this task. Compared to other travel diary sources (such as surveys, GPS traces and mobile phone records), LBSN check-in data have some advantages, such as low cost and high spatial precision. However, check-in data also has some limitations, such as bias of age group, a low sampling frequency and bias of location category. In summary, LBSN data is more likely to be a complement to than a substitute for travel diary data collected through surveys.
Apart from the inherent limitations of LBSN data, some limitations uncovered during the empirical study need to be noted. Firstly, the sample size of the empirical data set used in this study is not very large. The number of males and females are both no more than 50. Secondly, sampled users of the empirical data set are likely to be travelers who are relatively young. Therefore, the results of the empirical study should be interpreted with some caution. Thirdly, although more findings might be obtained if this study could also integrate the temporal dimension (weekend vs. weekdays, morning vs. evening, etc.), it was not possible to do so due to a relatively small-sized data set. Finally, in the existing research on the analysis of the relationships between travel behaviors and individual-level factors, it is more common to look at how distinct individual-level factors (e.g., age, gender, profession, income and education) together influence travel behavior than to look at how a specific factor influences it independently. However, apart from gender, other individual-level factors have extremely limited availability in LBSNs. With the empirical data set used in this study, we were not able to take more individual-level factors into account.
In future work, some improvements could be made. First of all, an investigation of gender differences in the spatio-temporal distribution of users' activities could be implemented once a relatively large-sized data set is collected over a longer time period (e.g., one year). Second of all, this study is a preliminary examination of the influences of individual-level factors (age, gender, profession, income, education, marital status, etc.) on travel behavior. In addition to gender, other individual-level factors, e.g., age, education and profession, could be incorporated to investigate how distinct factors together influence travel behavior. To obtain other individual-level factors (e.g., age, gender, profession, income and car ownership) that are not always available in social media user profiles, questionnaires communicated through email, telephone or social media could be employed. More specifically, we could invite a number of active Foursquare users to participate in a project dedicated to collecting daily travel diaries of users with detailed individual-level characteristics (e.g., age, gender, profession, income and car ownership). The invited participants would check in when arriving at a new location and would offer their detailed individual-level characteristics. This could also improve the data quality of the users’ daily trajectories.

Acknowledgments

The authors are thankful to the China Scholarship Council (CSC) for financial support with a PhD scholarship. The authors acknowledge the financial support of the Deutsche Forschungsgemeinschaft (DFG) and Ruprecht-Karls-Universität Heidelberg (Heidelberg University) within the funding programme Open Access Publishing.

Author Contributions

Yeran Sun implemented the experiments and wrote the paper. Yeran Sun and Ming Li revised the paper and responded to the comments from the referees.

Conflicts of Interest

The authors declare no conflict of interest.

References

  1. González, M.C.; Hidalgo, C.; Barabási, A.L. Understanding individual human mobility patterns. Nature 2008, 453, 779–782. [Google Scholar] [CrossRef] [PubMed]
  2. Liu, L.; Andris, C.; Ratti, C. Uncovering cabdrivers’ behavior patterns from their digital traces. Comput. Environ. Urban Syst. 2010, 34, 541–548. [Google Scholar]
  3. Song, C.; Qu, Z.; Blumm, N.; Barabási, A.L. Limits of predictability in human mobility. Science 2010, 327, 1018–1021. [Google Scholar] [CrossRef] [PubMed]
  4. Roick, O.; Heuser, S. Location based social networks—Definition, current state of the art and research agenda. Trans. GIS 2013, 17, 763–784. [Google Scholar] [CrossRef]
  5. Cheng, Z.; Caverlee, J.; Lee, K.; Sui, D. Exploring millions of footprints in location sharing services. In Proceedings of the Fifth International Conference on Weblogs and Social Media, Barcelona, Spain, 17–21 July 2011.
  6. Wu, L.; Zhi, Y.; Sui, Z.; Liu, Y. Intra-urban human mobility and activity transition: Evidence from social media check-in data. PLos ONE 2014, 9. [Google Scholar] [CrossRef] [PubMed]
  7. Factbrowser: The Research Discovery Engine. Available online: http://www.factbrowser.com/tags/foursquare/ (accessed on 07 July 2010).
  8. Kwan, M.P. Feminist visualization: Re-envisioning GIS as a method in feminist geographic research. Ann. Assoc. Am.Geogr. 2002, 92, 645–661. [Google Scholar] [CrossRef]
  9. Kwan, M.P. Gender and individual access to urban opportunities: a study using space—Time measures. Prof. Geogr. 1999, 51, 210–227. [Google Scholar] [CrossRef]
  10. Kwan, M.P. Affecting geospatial technologies: Toward a feminist politics of emotion. Prof. Geogr. 2007, 59, 22–34. [Google Scholar] [CrossRef]
  11. Hanson, S.; Johnston, I. Gender differences in work-trip length: Explanations and implications. Urban Geogr. 1985, 6, 193–219. [Google Scholar] [CrossRef]
  12. Singell, L.D.; Lillydahl, J.H. An empirical analysis of the commute to work patterns of males and females in two-earner households. Urban Stud. 1986, 2, 119–129. [Google Scholar] [CrossRef]
  13. Blumen, O. Gender differences in the journey to work. Urban Geogr. 1994, 15, 223–245. [Google Scholar] [CrossRef]
  14. Law, R. Beyond “women and transport”: Towards new geographies of gender and daily mobility. Prog. Hum. Geogr. 1999, 23, 567–588. [Google Scholar]
  15. Frändberg, L.; Vilhelmson, B. More or less travel: personal mobility trends in the Swedish population focusing gender and cohort. J. Transp. Geogr. 2011, 19, 1235–1244. [Google Scholar] [CrossRef]
  16. Root, A. Women, travel, and the idea of “sustainable transport”. Transp. Rev. 2000, 20, 369–383. [Google Scholar] [CrossRef]
  17. Hanson, S. Gender and mobility: new approaches for informing sustainability. Gend. Place Cult. 2010, 17, 5–23. [Google Scholar] [CrossRef]
  18. Blumen, O.; Kellerman, A. Gender differences in commuting distance, residence, and employment location: Metropolitan Haifa, 1972–1983. Prof. Geogr. 1990, 42, 54–71. [Google Scholar] [CrossRef]
  19. Gordon, P.; Kumar, A.; Richardson, H.W. Gender differences in metropolitan travel behavior. Reg. Stud. 1989, 23, 499–510. [Google Scholar] [CrossRef]
  20. Kwan, M.P. Gender differences in space-time constraints. Area 2000, 32, 145–156. [Google Scholar] [CrossRef]
  21. Bao, J.; Zheng, Y.; Mokbel, M. Location-based and preference-aware recommendation using sparse geo-social networking data. In Proceedings of the 20th International Conference on Advances in Geographic Information Systems, Redondo Beach, CA, USA, 7–9 November 2012.
  22. Bao, J.; Zheng, Y.; Wilkie, D.; Mokbel, M. Recommendations in location-based social networks: A survey. GeoInformatica 2015, 19, 525–565. [Google Scholar] [CrossRef]
  23. Zheng, Y. Location-based social networks: Users. In Computing with Spatial Trajectories; Zheng, Y., Zhou, X., Eds.; Springer: New York, NY, 2011; pp. 243–276. [Google Scholar]
  24. Zheng, Y.; Xie, X. Location-based social networks: Locations. In Computing with Spatial Trajectories; Zheng, Y., Zhou, X., Eds.; Springer: New York, NY, 2011; pp. 277–308. [Google Scholar]
  25. Cho, E.; Myers, S.A.; Leskovec, J. Friendship and mobility: User movement in location-based social networks. In Proceedings of the 17th ACM Sigkdd International Conference on Knowledge Discovery and Data Mining, San Diego, CA, USA, 21–24 August 2011.
  26. Noulas, A.; Scellato, S.; Lambiotte, R.; Pontil, M.; Mascolo, C. A tale of many cities: Universal patterns in human urban mobility. PLoS ONE 2012, 7. [Google Scholar] [CrossRef]
  27. Noulas, A.; Scellato, S.; Lathia, N.; Mascolo, C. Mining user mobility features for next place prediction in location-based services. In Proceedings of the 12th IEEE International Conference on Data Mining, Brussels, Belgium, 10–13 December 2012.
  28. Li, M.; Sun, Y.; Fan, H. Contextualized relevance evaluation of geographic information for mobile users in location-based social networks. ISPRS Int. J. Geo-Inf. 2015, 4, 799–814. [Google Scholar] [CrossRef]
  29. Cranshaw, J.; Schwartz, R.; Hong, JI.; Sadeh, N. The livehoods project: Utilizing social media to understand the dynamics of a city. In Proceedings of the 6th International AAAI Conference on Weblogs and Social Media, Dublin, Ireland, 4–7 June 2012; The AAAI Press: Menlo Park, CA, USA, 2012. [Google Scholar]
  30. Brandon Gaille. 26 Great Foursquare Demographics. Available online: http://brandongaille.com/26-great-foursquare-demographics/ (accessed on 13 January 13 2015).
  31. Noulas, A.; Scellato, S.; Mascolo, C.; Pontil, M. An empirical study of geographic user activity patterns in foursquare. In Proceedings of the Fifth International AAAI Conference on Weblogs and Social Media, Barcelona, Spain, 17–21 July 2011.
  32. Chappell, Brian. 2012 Social Network Analysis Report—Demographic—Geographic and Search Data Revealed. Available online: http://www.ignitesocialmedia.com/social-media-stats/2012-social-network-analysis-report/#Foursquare/ (accessed on 31 July 2012).
  33. Buliung, R.N.; Kanaroglou, P.S. A GIS toolkit for exploring geographies of household activity/travel behavior. J. Transp. Geogr. 2006, 14, 35–51. [Google Scholar]
  34. Buliung, R.N.; Roorda, M.J.; Remmel, T.K. Exploring spatial variety in patterns of activity—Travel behaviour: initial results from the Toronto Travel–Activity Panel Survey (TTAPS). Transportation 2008, 35, 697–722. [Google Scholar] [CrossRef]
  35. Kamruzzaman, M.; Hine, J. Analysis of rural activity spaces and transport disadvantage using a multi-method approach. Transp. Policy 2012, 19, 105–120. [Google Scholar] [CrossRef] [Green Version]
  36. Anselin, L. Local indicators of spatial association—LISA. Geogr. Anal. 1995, 27, 93–115. [Google Scholar] [CrossRef]
  37. Department of City Planning (DCP) City of New York. Neighborhood Tabulation Areas. Available online: http://www.nyc.gov/html/dcp/ (accessed on 05 May 2015).
  38. New York Metropolitan Transportation Council (NYMTC); North Jersey Transportation Planning Authority (NJTPA). The 2010/2011 Regional Household Travel Survey (RHTS). Available online: http://www.nymtc.org/project/surveys/survey2010_2011RTHS.html (accessed on 13 August 2013).
  39. New York Metropolitan Transportation Council (NYMTC); North Jersey Transportation Planning Authority (NJTPA). Public Use Data Set and the Data User’s Manual. Available online: http://www.nymtc.org/project/surveys/Travel%20survey/Task%209%202%20Final%20Users%20Manual_2013-11-04_for%20Public_Use_Data_Set.pdf (accessed on November 2013).

