Article

Analysis of Attraction Features of Tourism Destinations in a Mega-City Based on Check-in Data Mining—A Case Study of Shenzhen, China

1
College of Architecture and Urban Planning, Shenzhen University, Shenzhen 518060, China
2
Shenzhen Key Laboratory for Optimizing Design of Built Environment, Shenzhen 518060, China
3
Shenzhen Key Laboratory of Spatial Smart and Services, Shenzhen 518060, China
*
Author to whom correspondence should be addressed.
ISPRS Int. J. Geo-Inf. 2016, 5(11), 210; https://0-doi-org.brum.beds.ac.uk/10.3390/ijgi5110210
Submission received: 21 September 2016 / Revised: 4 November 2016 / Accepted: 7 November 2016 / Published: 10 November 2016
(This article belongs to the Special Issue Spatiotemporal Computing for Sustainable Ecosystem)

Abstract

:
Location-based service information, provided by social networks, provides new data sources and perspectives to research tourism activities, especially in highly populated mega-cities. Based on three years (2012–2014) of approximately 340,000 check-in records collected from Sina micro-blog at 86 tourist attractions in Shenzhen, a first-tier city in southern China, we conducted a comprehensive study of the attraction features involving different aspects, such as tourist source, duration of stay, check-in activity index, and attraction correlation degree. The results showed that (1) theme parks established in the early 1990s were the most popular tourist attractions in Shenzhen, but a negative trend was detected in the check-in population; (2) compared with check-in times from surrounding activities and the kernel density of tourists, most destinations in Shenzhen showed a lack of attraction, failing to make the most of their geographic accessibility; and (3) the homogeneity and inconvenient traffic conditions of major tourist destinations leading to the construction of a tourism tour chain has become a challenge. The results of this study demonstrate the potential of big-data mining and provide valuable insights into tourism market design and management in mega-cities.

1. Introduction

Over the past six decades, tourism has experienced continued expansion and diversification and has become one of the largest and fastest growing economic sectors in the world, contributing 10% to worldwide gross domestic product [1]. Many mega-cities are tourist destinations, distribution centres, and key tourism sources because of their large population and unique environment as well as important status and function in the national urban system [2]. Given this situation, mega-cities must create awareness and brand image for their tourism resources to effectively segment, target, and attract potential customers.
Attention has been given to the considerable demand for research on smart tourism [3,4], with many smart tourism studies stressing that the real sense of smart tourism is to focus on tourists' needs in order to maximize tourist satisfaction as well as improve the effectiveness of resource management [5,6]. As traditional methods used to collect data about tourists on a large scale are often labour intensive and expensive, empirical studies of the spatial and temporal activities of tourists are rather limited. Recently, however, the rapid evolution of information and positioning technologies has made it possible to accurately track the paths tourists are taking and to collect a large amount of geographical information on users’ activities cheaply and easily. Both public and private entities interested in developing the tourism sector have realized the considerable importance of adequately segmenting the tourist market and efficiently using online techniques for marketing tourism destinations and products [7]. The application of geographical information can not only help people make efficient and economic travel decisions [8] but also effectively explore attractive features of tourist destinations, providing new ideas and methods for the management and planning of tourist destinations.
Characterized by low cost, wide coverage, rapid spread, and strong interactivity, media data from social network are becoming “strong media” in the big-data era, and they play an important role in tourism destination market research [9]. With an increasing number of tourists sharing check-in behaviour and travel notes with geographic information data online, data mining [10] technologies are widely applied to extract information from massive online contents automatically and consistently. Information about tourism sites mined from online multimedia, such as travel photos [11,12], check-in data [13,14,15], and textual contents [16,17], has been extensively used for studying the socio-spatial behaviour of tourists at regional scales [13] as well as at local levels [15].
The 36th China Internet Network Development Statistics Report stated that Chinese Internet users had reached 668 million as of June 2015, and the utilization rate of comprehensive social applications was 69.7% [18]. Sina micro-blog is a large social network website in China, like Twitter or Flickr. If people confirmed their location properties on a Sina micro-blog when engaging in activities at that location, check-in behaviour occurred [19]. Unlike traditional official statistics or questionnaire survey data, these check-in data recorded by users have advantages in that huge amounts of data are diverse, accurate, and specific, thus providing a more scalable and objective way to gauge tourist preferences in tourism destination. Acknowledging this large segment of the population and learning about its tourism consumption choices are crucial in marketing tourism products, for effectively marketing tourism destinations and products implies segmentation [20]. Tourism destinations cannot target all tourists similarly [21]. As the market is heterogeneous, one of the prerequisites in marketing tourism is market segmentation. Tracking the information of different tourist groups would summarize the overall intention and problems of tourist destinations, and explore the possibility of enhancing the attractiveness and competitiveness of tourism. Furthermore, it could provide a basis and reference for tourism planning and development.
Based on Sina micro-blog location-based service (LBS) check-in data, this paper conducted tourist market segmentation for tourist users of scenic spots, tracked and understood relevant information of scenic spot selection and other activities in Shenzhen of different customer groups, and conducted an empirical analysis of the attraction features of Shenzhen tourist destinations. In doing so, the study answered the following three questions: (1) In actual tourism behaviour and activities, how attractive were Shenzhen tourism destinations? (2) Did relevant tourism orientation and product development comply with the activity choice of tourists? (3) What were the complete intentions and problems of Shenzhen as a tourist destination? On the basis of the findings, we discuss possible future directions for Shenzhen in improving tourist attraction and competitiveness and ideas for its tourism planning and development.

2. Study Area and Data
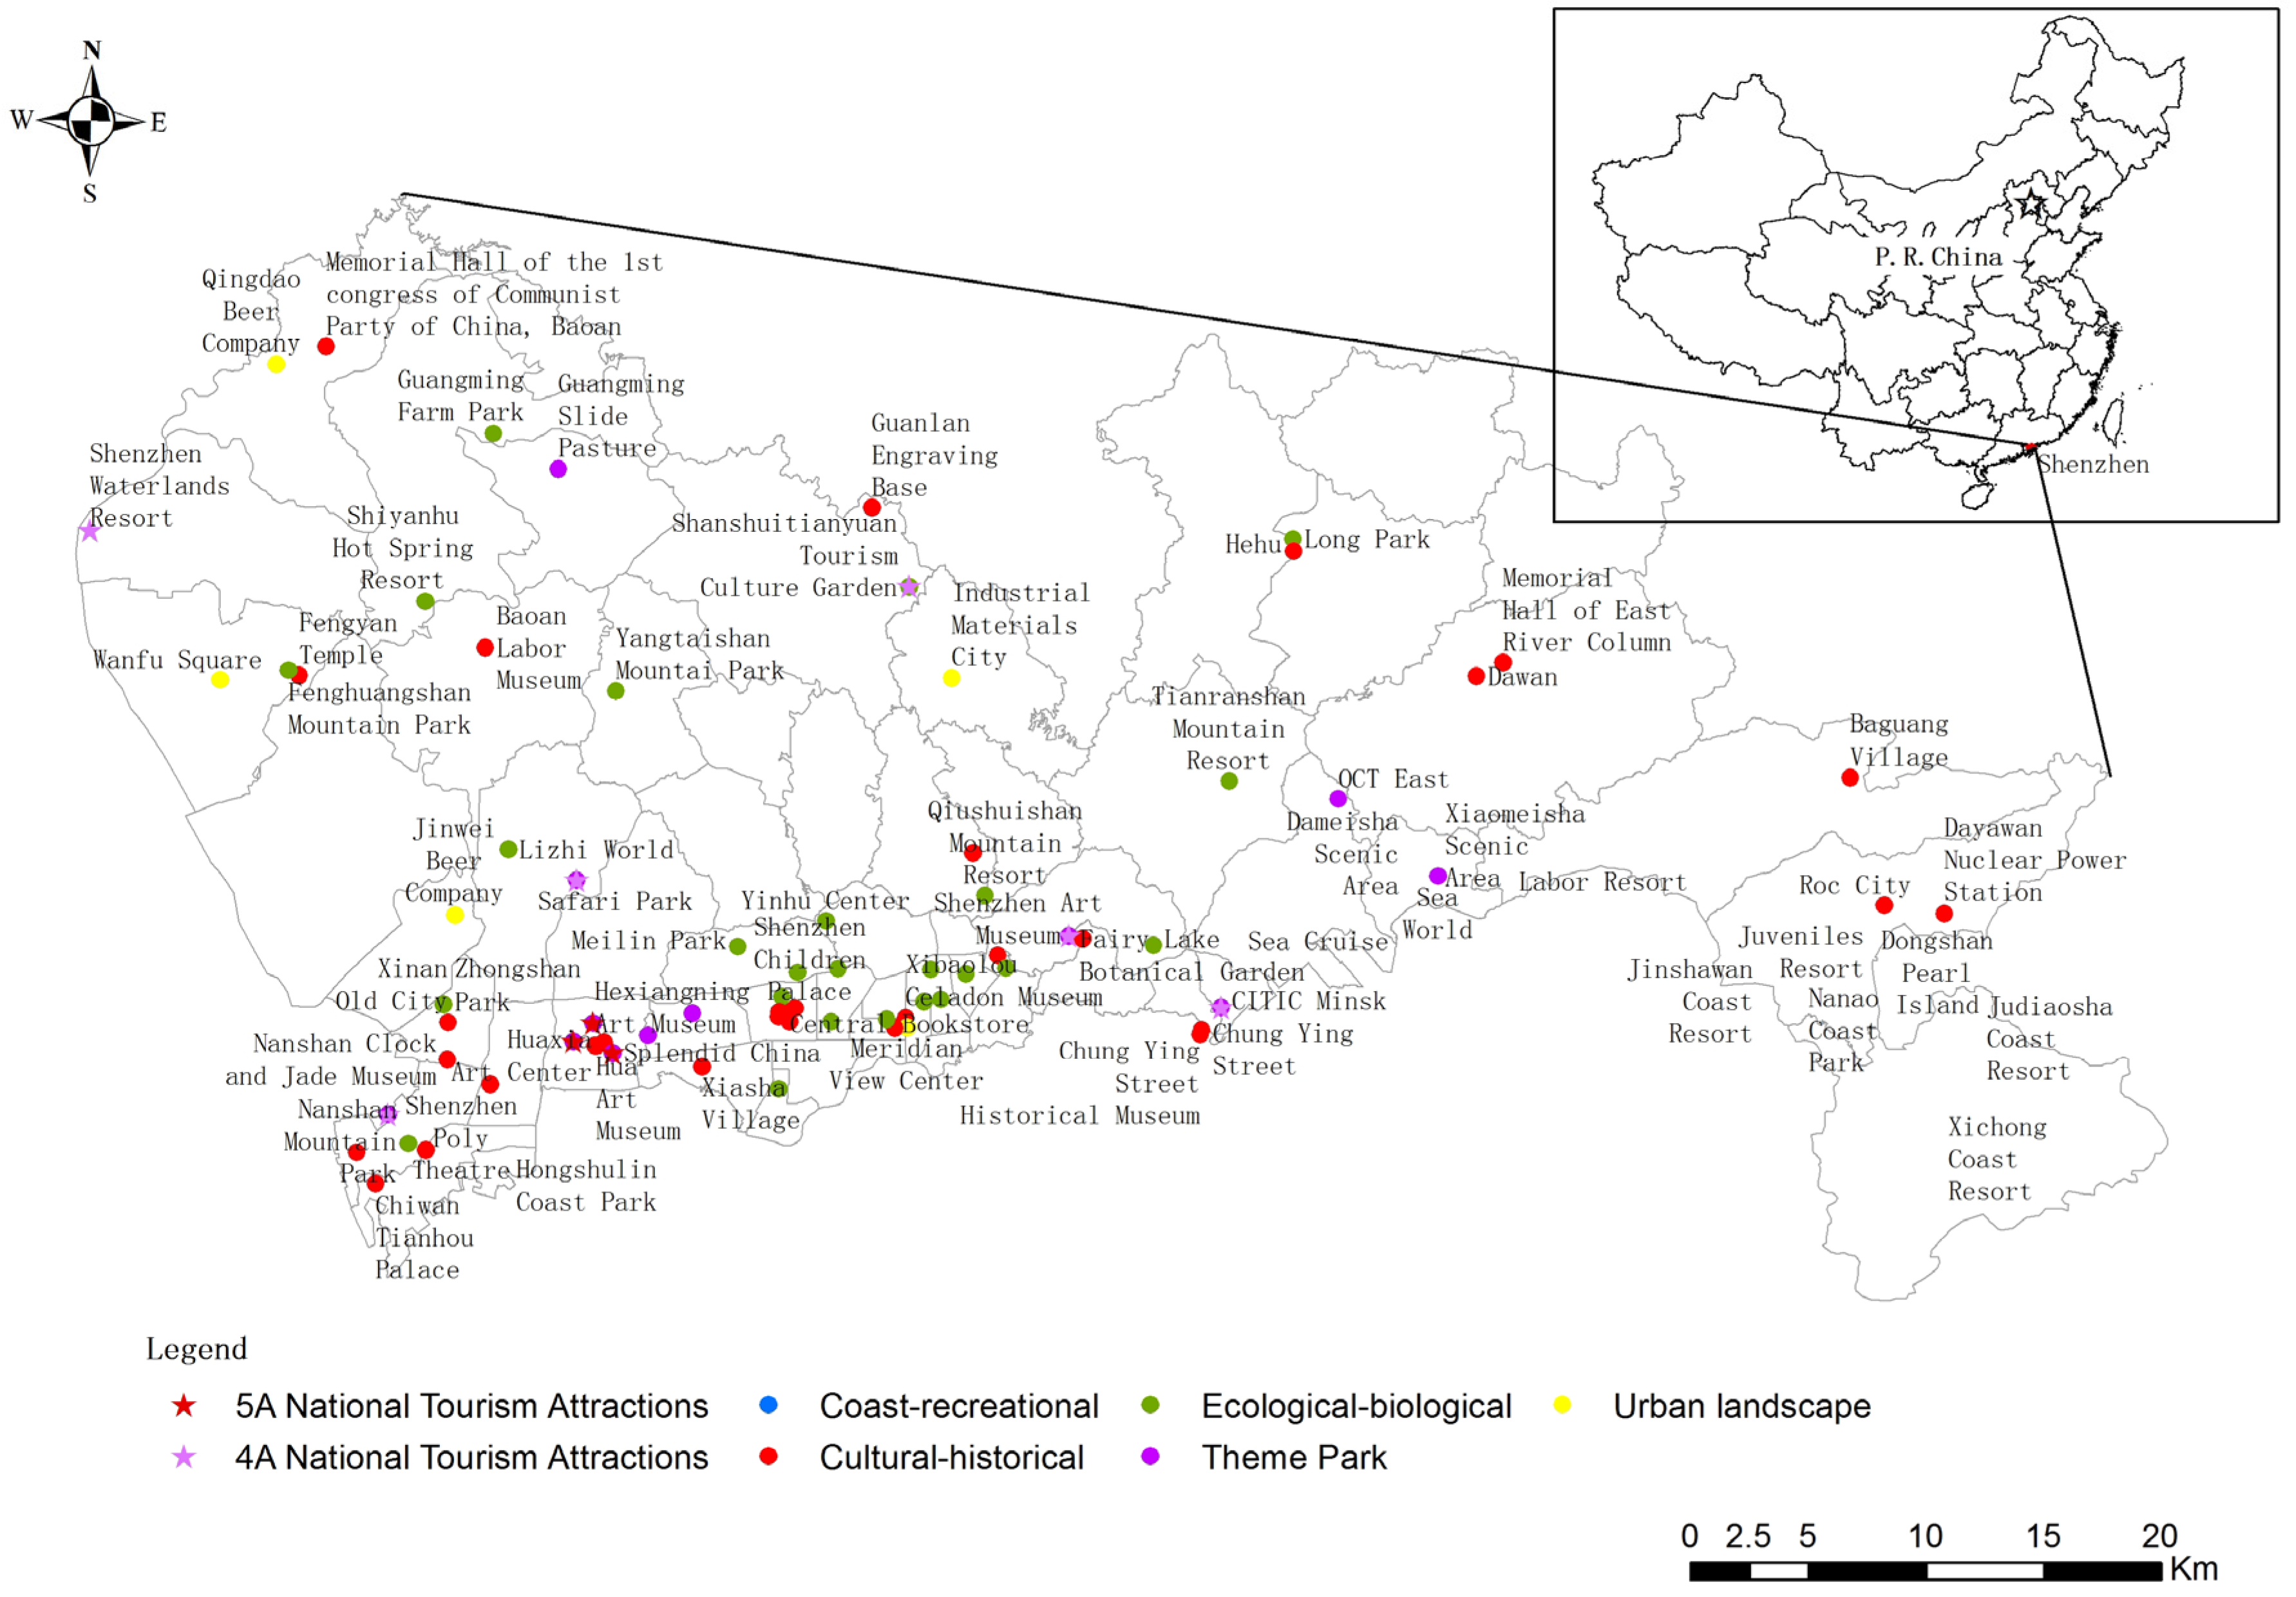
2.1. Study Area

Shenzhen is located in southern Guangdong Province in China, adjacent to Hong Kong. It is one of the wealthiest, yet youngest cities in China. Over 10 million people have lived in this city since 2010. Shenzhen is also one of the top tourist destinations in the country, attracting millions of travellers yearly. In 2014, Shenzhen received 116.3 million tourists with a total tourism income of 124.48 billion yuan [22]. Focusing on the 86 tourist scenic spots that were identified as main research objects on the official website of Shenzhen Culture, Sports, and Tourism Bureau, we extracted attribute information of these tourist scenic spots, such as location, scale, rating, and other factors, for conducting related statistical analysis and spatial analysis. These 86 tourist scenic spots were classified into five types: coast-recreational, cultural-historical, ecological-biological, urban landscape, and theme park [23]. Among the 86 tourist scenic spots, OCT (Overseas Chinese Town) Tourist Holiday Zone, which consists of Window of the World, Splendid China, and Happy Valley Theme Park, is the only national 5A travel attraction in Shenzhen, making it the highest quality of attraction relative to its peers in terms of safety, cleanliness, sanitation, and transportation in China. Fairy Lake Botanical Garden, Safari Park, CITIC Minsk, Water-lands Resort, Evergreen Resort and Shanshuitianyuan Tourism Culture Garden are national 4A scenic spots, representing second-tier attractions across the country. Figure 1 illustrates the spatial distribution and type features of each scenic spot.

2.2. Data and Analysis Setting

Check-in data used in this study were provided by Sina micro-blog users with location information. Sina micro-blog had approximately 212 million monthly activated-users in 2015. When users posted to the micro-blog, they could choose whether to share their locations. Through an open API (Application Programming Interface), we obtained check-in information for these users, including anonymous ID, registration location, registration time, check-in time, and check-in location. From 1 January 2012 to 31 December 2014, approximately 1 million Sina micro-blog users had checked in at a location in Shenzhen. Approximately 160,000 users had checked in at 86 tourist scenic spots during this period. We explored the attraction features of Shenzhen tourist destinations based on a statistical analysis of ID attribute information and check-in information of scenic-spot tourist users.
According to tourist attraction theory [24,25], the choice of a tourist for scenic spots depends both on the attractions of the tourist destination and tourist demand. The former can be divided into resource value and supporting services in different dimensions, and the latter is mainly related to a tourist’s motivation driven by personal internal factors. Based on the content characteristics of available relevant data, this study conducted relevant research, and the settings were as follows:
(1) Tourist Segmentation
With growing popularization of tourism demand, the tourism and leisure industries have integrated gradually, and tourist systems of tourist scenic spots attract not only nonlocal tourists but also a large number of local residents visiting for leisure activities [26,27]. Relevant research showed a substantial difference in tourism leisure activities between local residents and nonlocal tourists. Wentong et al. showed that what local residents of Hong Kong are looking for was related to social equity of tourism product development, public transport facilities, advertising and marketing, and tourism development in tourist consumption [28]. To learn what features attracted different tourists, we initially conducted a tourist market and type segmentation analysis.
The duration that each user ID spent in Shenzhen was calculated based on the creation location of the user ID and their first and last check-in time. The origin of users was identified based on the creation location of the ID and were classified as follows (Table 1):
(A) Local users created in Shenzhen. These users were registered in Shenzhen and identified as local tourists, and their scenic spot check-in behaviours were identified as leisure tourism of local residents.
(B) Nonlocal users were registered outside of Shenzhen and were classified as nonlocal tourists. They were further divided into three groups: Guangdong users with IDs created out of Shenzhen, mainland but non-Guangdong users, and overseas users. Their scenic spot check-in behaviours were divided into different tourist types based on check-in duration: (a) A check-in duration of ≤3 days was regarded as a short-term tour by nonlocal tourists. (b) A check-in duration period of 4–15 days was regarded as a long-term tour by nonlocal tourists. (c) A check-in duration period of >15 days was also considered. Such a tour could be taken by nonlocal tourists who travelled to Shenzhen several times per year or nonlocal tourists who resided in Shenzhen, similar to the leisure tourism of Shenzhen local residents. This type cannot be distinguished clearly with the existing data.
(2) Rank of Tourist Choices
A tourism area is the organic combination of tourism resources in a certain geographic space and tourism facilities, infrastructure, and other relevant conditions, becoming a destination for tourists who stayed and carried out activities [29]. In this sense, the choice of a tourist for a single scenic spot is considered from two major dimensions: one is the resource endowment advantages of scenic spots, and the other is advantages determined by tourism facilities, infrastructure, and other relevant conditions, including transport accessibility and supporting services, which are collectively called external regional advantages. Resource endowment advantages are the foundation and core of scenic-spot attraction. Similar to resource endowment, favourable external regional advantages can help to strengthen the attraction of tourist scenic spots and expand the tourism market. To distinguish the influence of these two types of advantages on the choice by tourists of a scenic spot, this research considered two design indicators: scenic spot check-in times D p and user activity kernel density D k .
(A) Attraction check-in times D p . The check-in times and population of scenic spots users indicate the attraction of scenic spots to tourists. In theory, a larger number of check-in times indicates a greater resource endowment advantage and higher attraction to tourists.
(B) User activity kernel density D k . Considering that the attraction of scenic spots is not only related to its own resource endowment but is also significantly affected by location, traffic conditions, and other external factors, we further extracted all check-in behaviours of each user ID in Shenzhen, conducted a kernel density estimation of all check-in locations of users within Shenzhen using a 100 × 100 m grid, and obtained their activity kernel-density maps in Shenzhen. Kernel-density estimation was calculated as follows:
D k ( x ) = 1 n h i = 1 n K ( x x i h )
where K is the classic Gaussian kernel function and h is the bandwidth. The closer x is to x i , the more closely will x x i h approach 0, and the influence on estimates will also be greater. Kernel density is different from pure point density statistics (i.e., the total number of grids); it considers the point distribution of adjacent domains (within h bandwidth), gives different weights according to their distance from a central point, and finally conducts smoothing for density of output. The results of which reflect the influence of peripheral point distribution on a central point. Therefore, kernel density was used as an activity heat indicator of scenic spot users in Shenzhen in this study.
Check-in activity index (R), the ratio of scenic spot check-in times ( D p ) to activity kernel density ( D k ), was obtained as another indicator for measuring scenic spot attraction. When R > 1, the number of check-in times was greater than the surrounding activity kernel density, indicating that under the same locational conditions, the endowment advantage of the scenic spot was obvious and its attraction for tourists was strong. When R < 1, the number of check-in times was smaller than the surrounding activity kernel density, implying that the scenic spot did not exhibit an endowment advantage and its attraction for tourists was weak.

3. Results

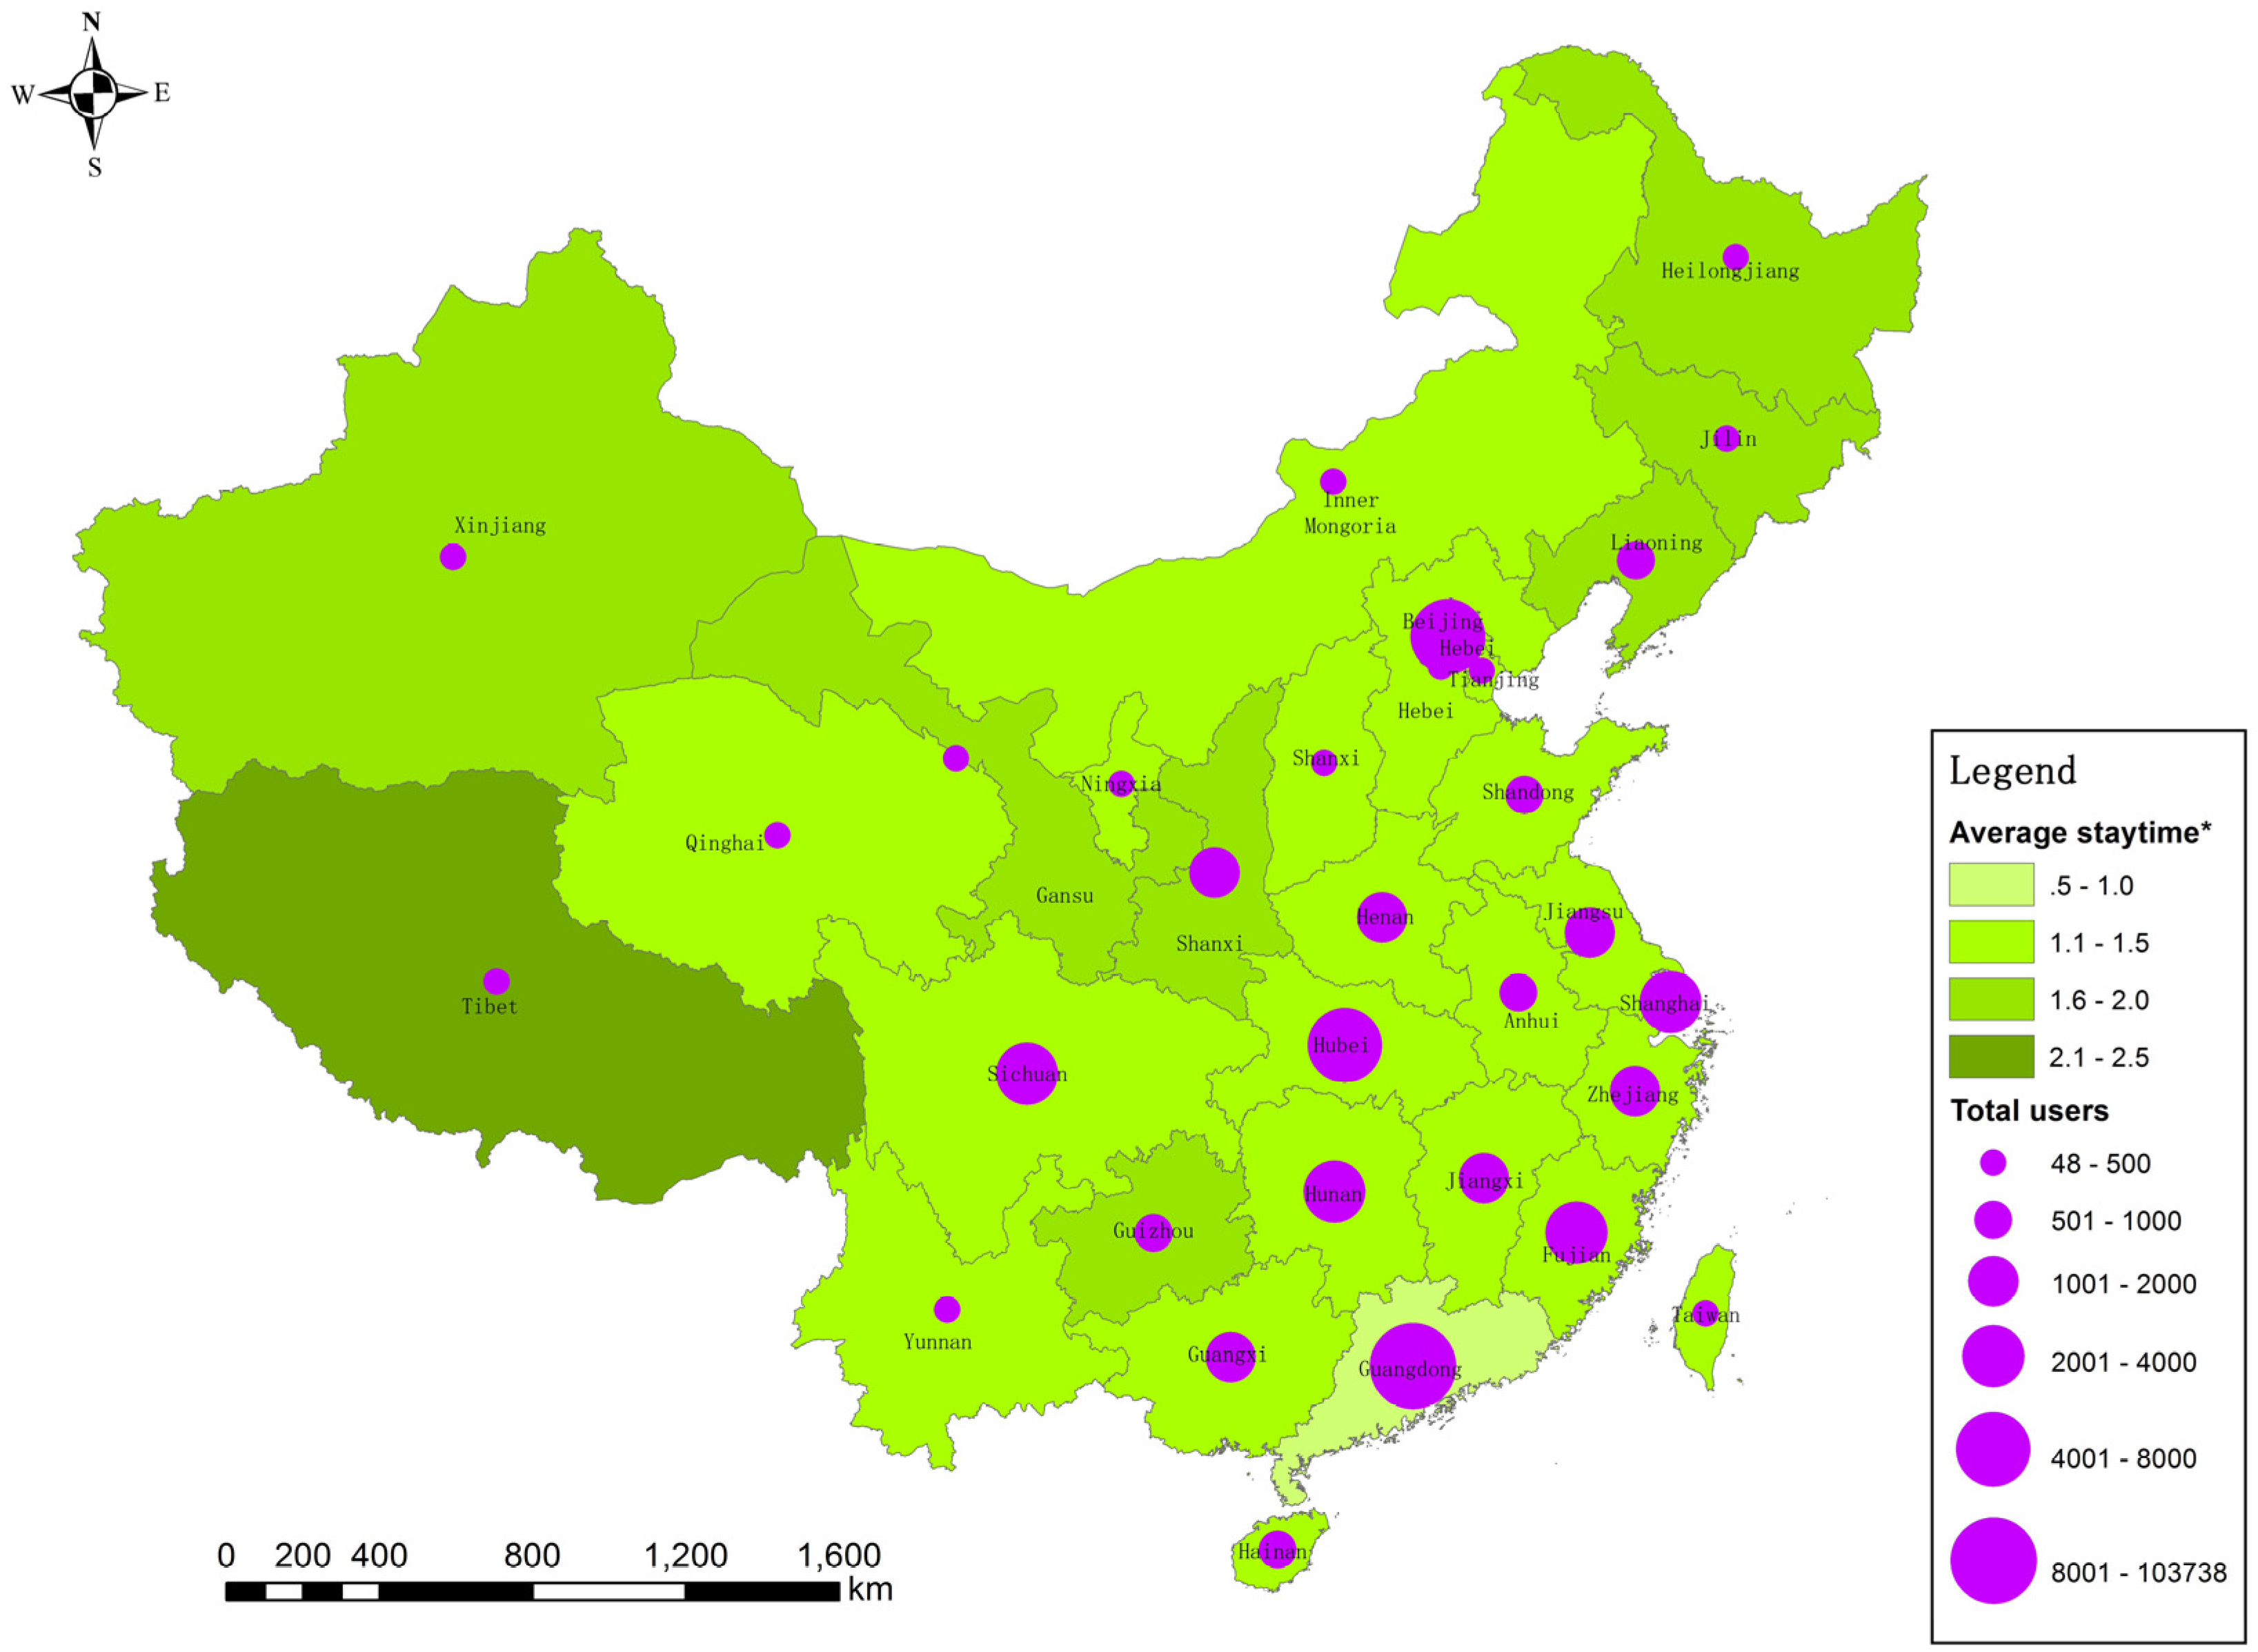
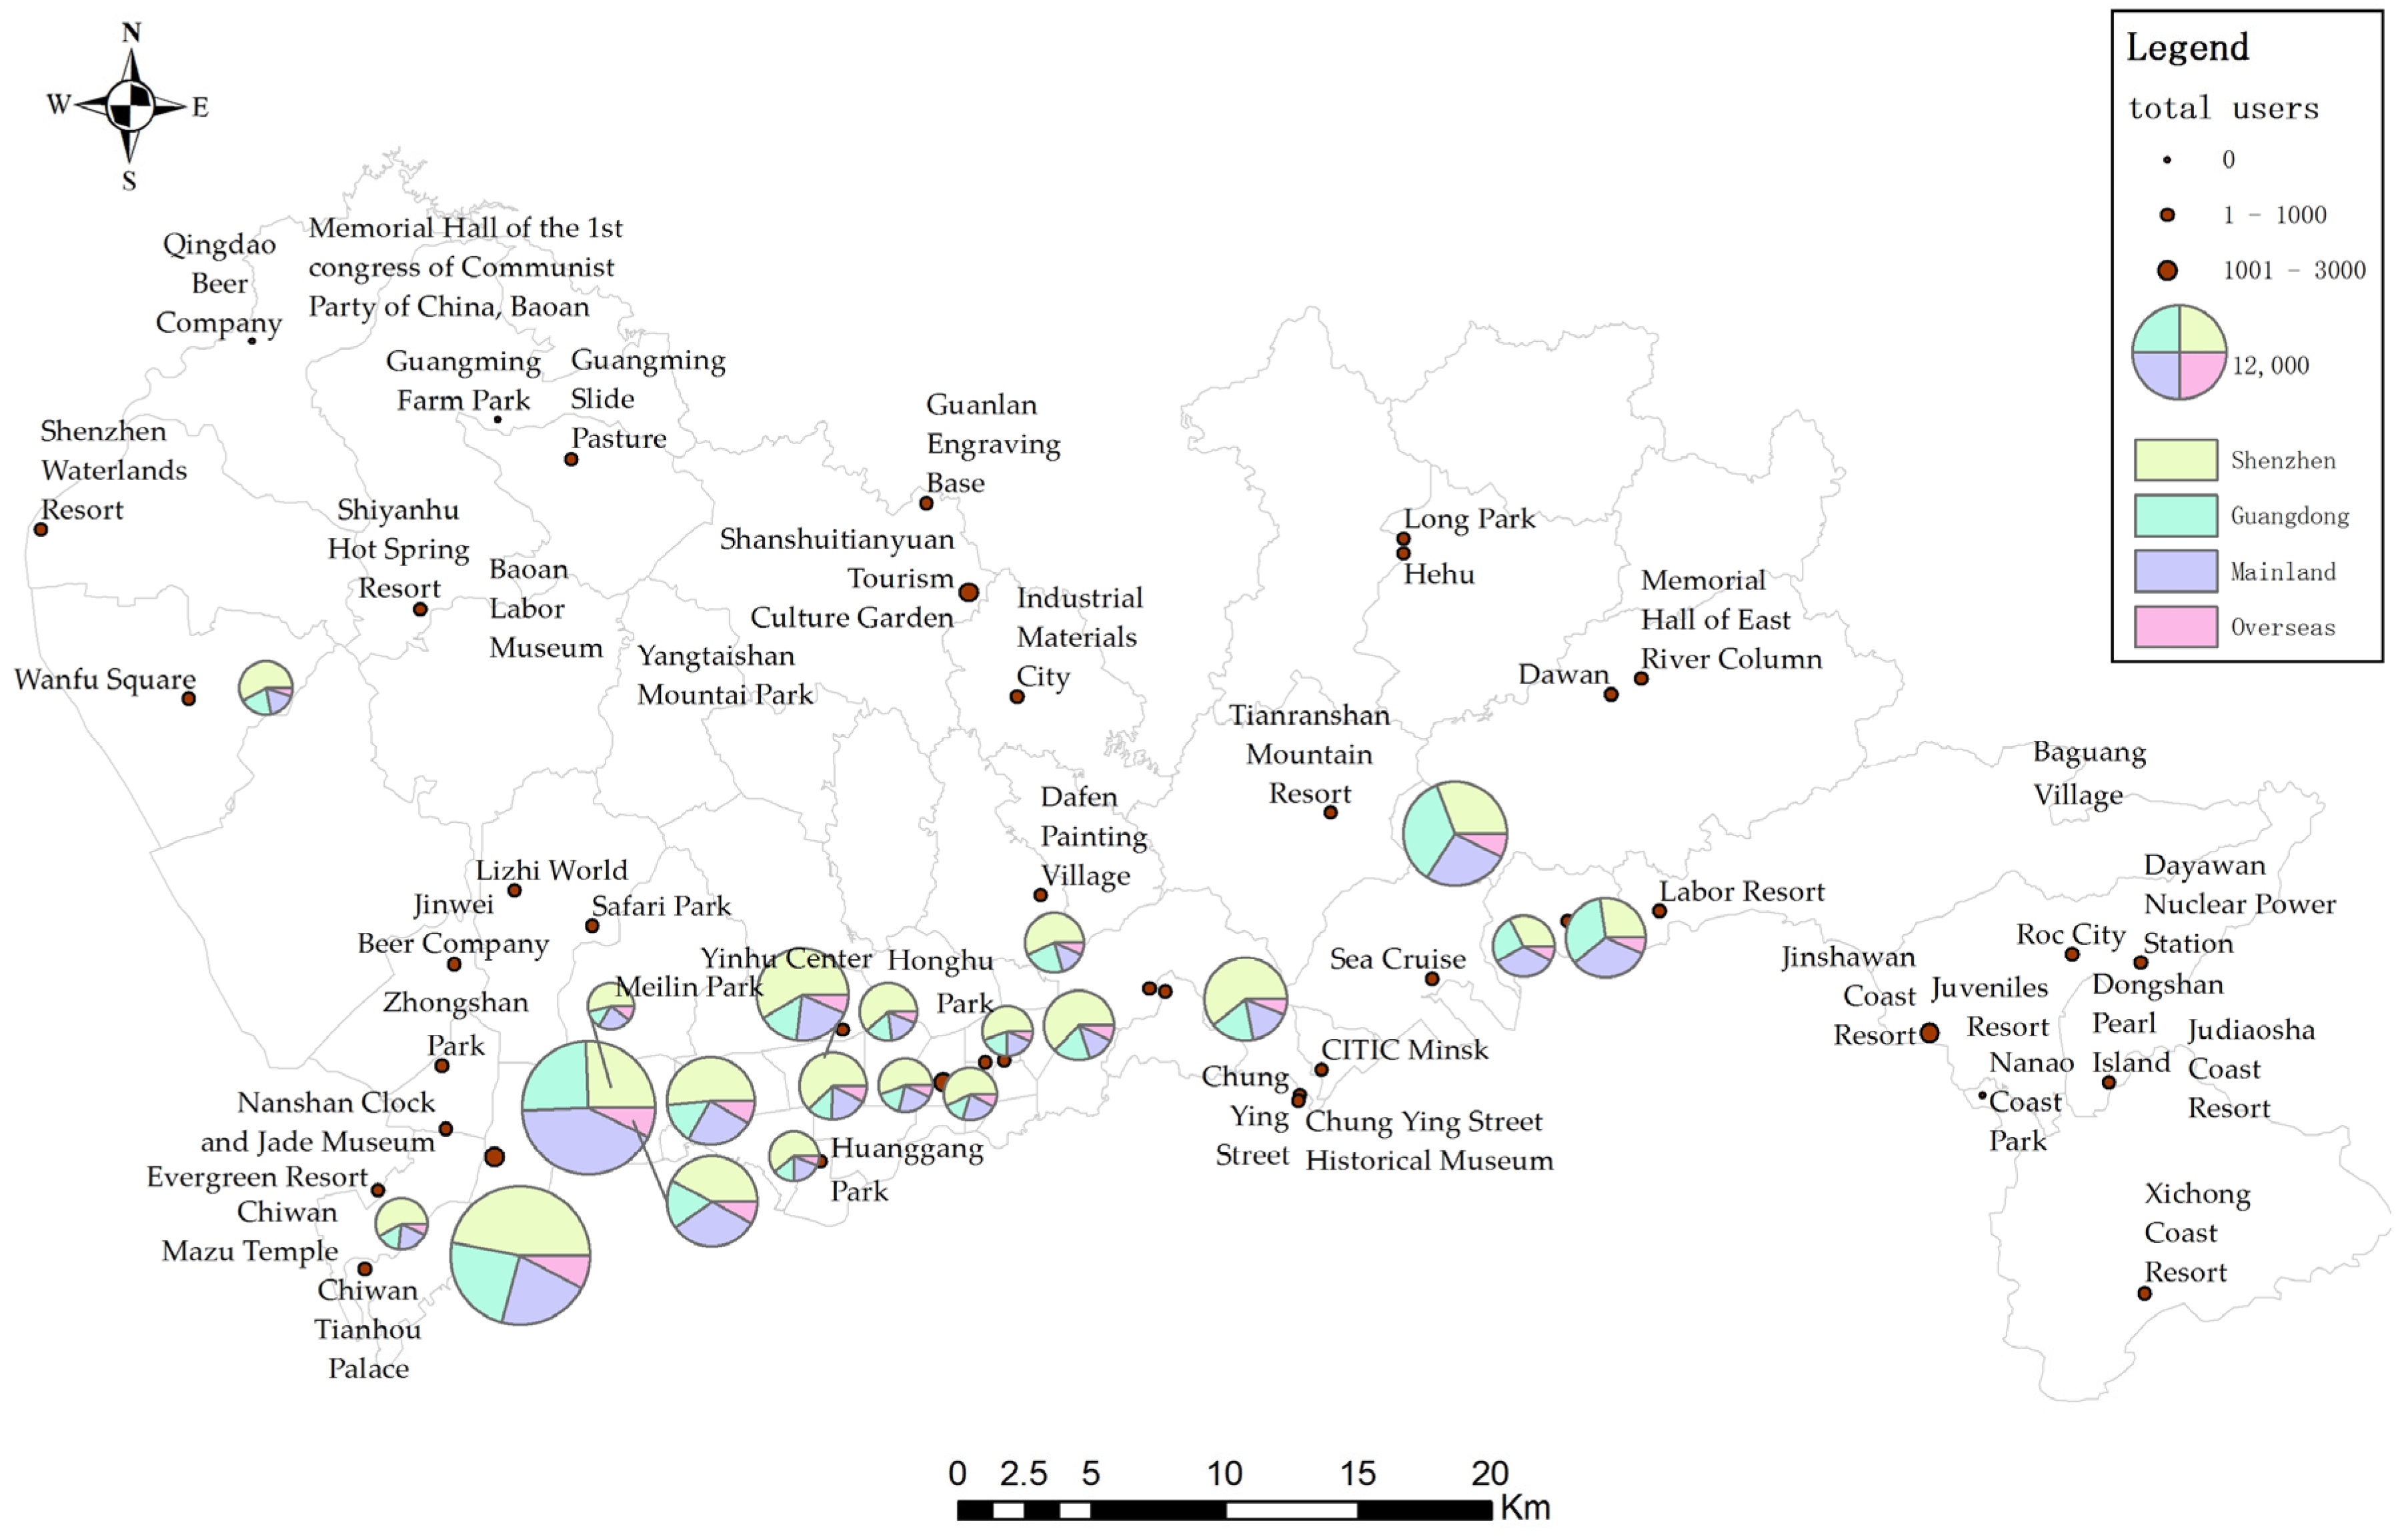
3.1. Scenic Spot Popularity and User Characteristics Analysis

According to users’ registration locations, 38.9% of approximately 160,000 tourists were local users and 61.1% were nonlocal tourists, for a total of 98,231 people. The proportion of Guangdong users, mainland users, and overseas users was approximately 3:3:1. In light of the definition of tourist behaviours (Table 1), 59,944 nonlocal tourists remained in Shenzhen for less than 15 days, accounting for 61%. We gathered the registration locations and average residence time of tourists from outside the city (i.e., those whose check-in time in Shenzhen lasted ≤15 days), whose tourist type could be distinguished according to their provinces (Figure 2). The data showed that nonlocal tourists came from all over the country and abroad (4898). Guangdong Province and neighbouring provinces, Hubei, Jiangsu, Beijing, and Shanghai, were the major origins. Tourists from faraway places stayed longer than tourists from nearby.
Approximately 160,000 tourists checked in at scenic spots, 11 of which had more than 5000 checked-in users, and 20 scenic spots had more than 3000 check-ins. No national 4A scenic spots were included in these 20 scenic spots in addition to the original 5A scenic spots. Figure 3 depicts the user sources of 20 scenic spots with over 3000 check-ins. (1) Based on location, nearly all scenic spots with active check-ins were located in the original special zone, and Fenghuang Mountain Forest Park was the only spot from outside the original special zone. (2) According to types, five were theme park scenic spots, nine were natural ecology scenic spots, three were seashore leisure scenic spots, one was a city sightseeing scenic spot, and two were human history park scenic spots. (3) Based on tourist resources, tourists inside the city preferred natural ecological leisure parks, especially parks with mountains. Six of the nine natural ecological leisure parks related to mountains. Tourists inside the province preferred seashore leisure, accounting for one-third of seashore leisure tourists. Tourists outside the province and from abroad preferred theme parks in 5A scenic spots and seashore leisure scenic spots, as shown clearly in the user source of the five scenic spots with the highest check-in times: Hongshulin Coast Park, Window of the World, Lotus Hill, OCT East, and Garden Expo Park.
With regard to the selection frequency of tourists from different tourist markets (Table 2), differences were observed between tourists inside and outside the city. The first choice of tourists inside the city was Hongshulin Coast Park, the second was Lianhuashan Park, and the third was Window of the World, which are seashore leisure scenic spots, natural ecology scenic spots, and theme park scenic spots, respectively. By contrast, tourists outside the city did not choose Lianhuashan Park as one of the top three; they chose OCT East, an emerging theme park. Through further subdivision, the first choice for tourists outside the city whose check-in duration lasted ≤15 days was the older theme scenic spot, Window of the World. A high proportion of tourists outside the city whose check-in duration lasted >15 days chose Hongshulin Coast Park first.

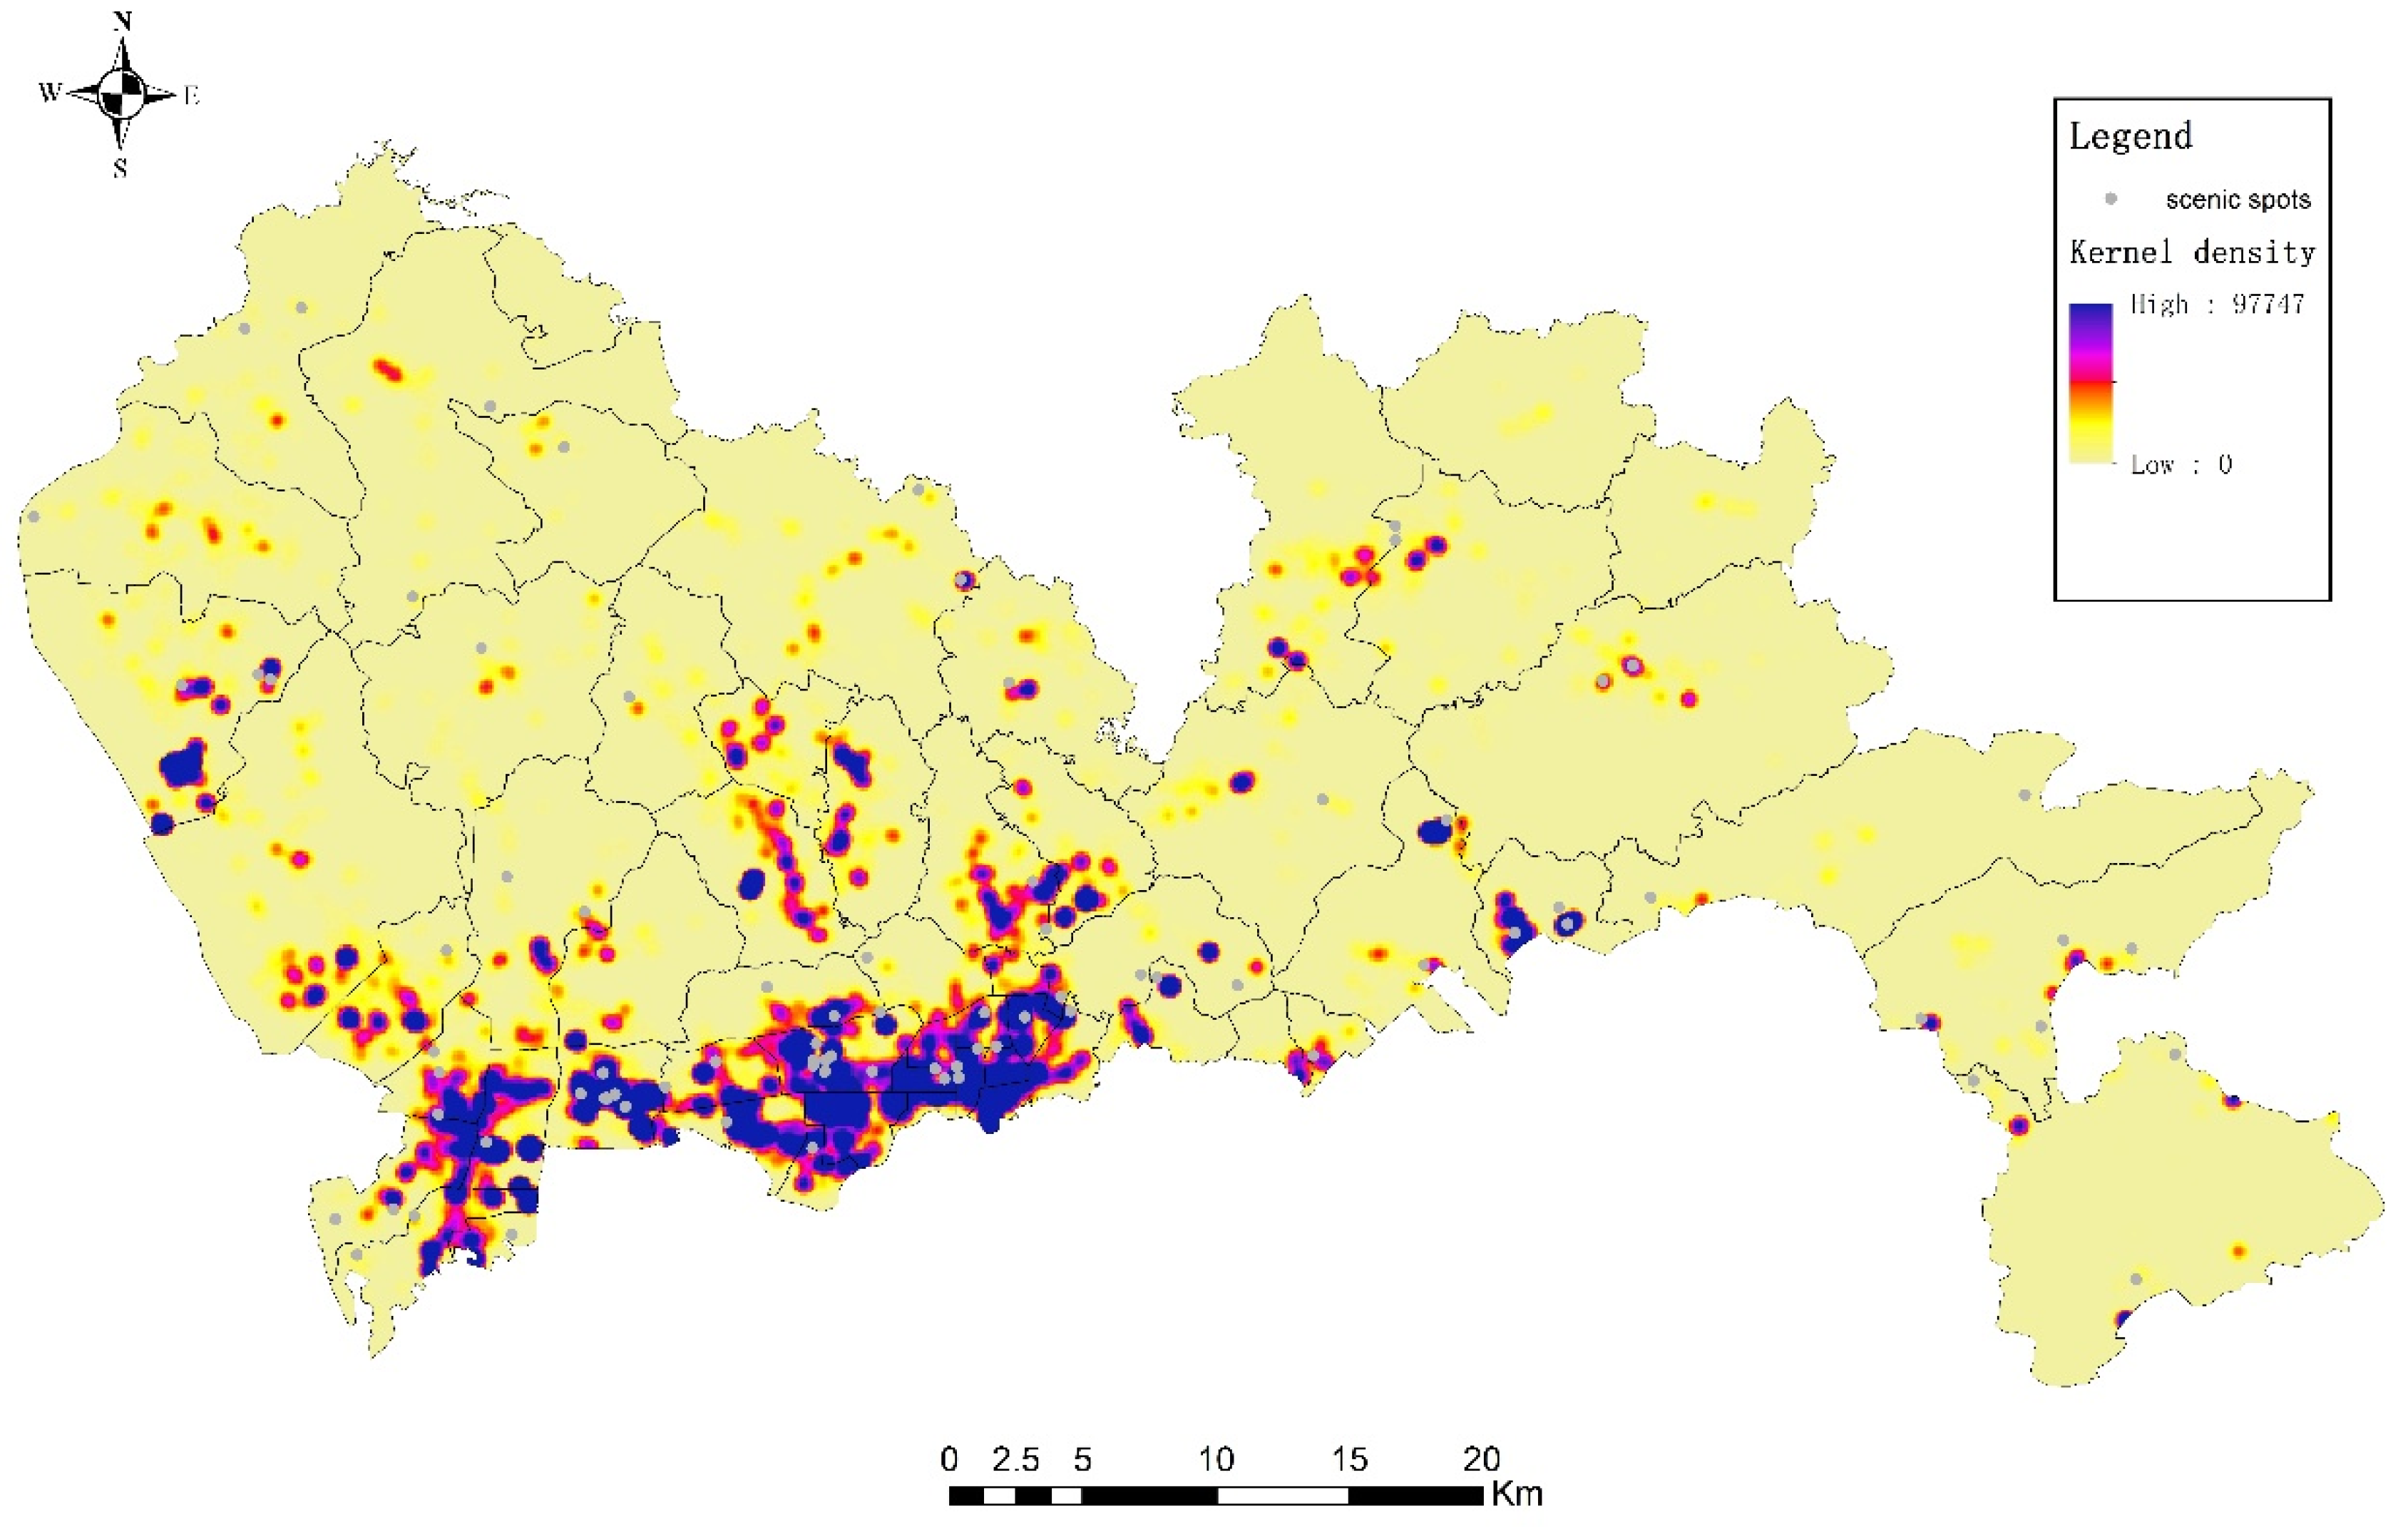
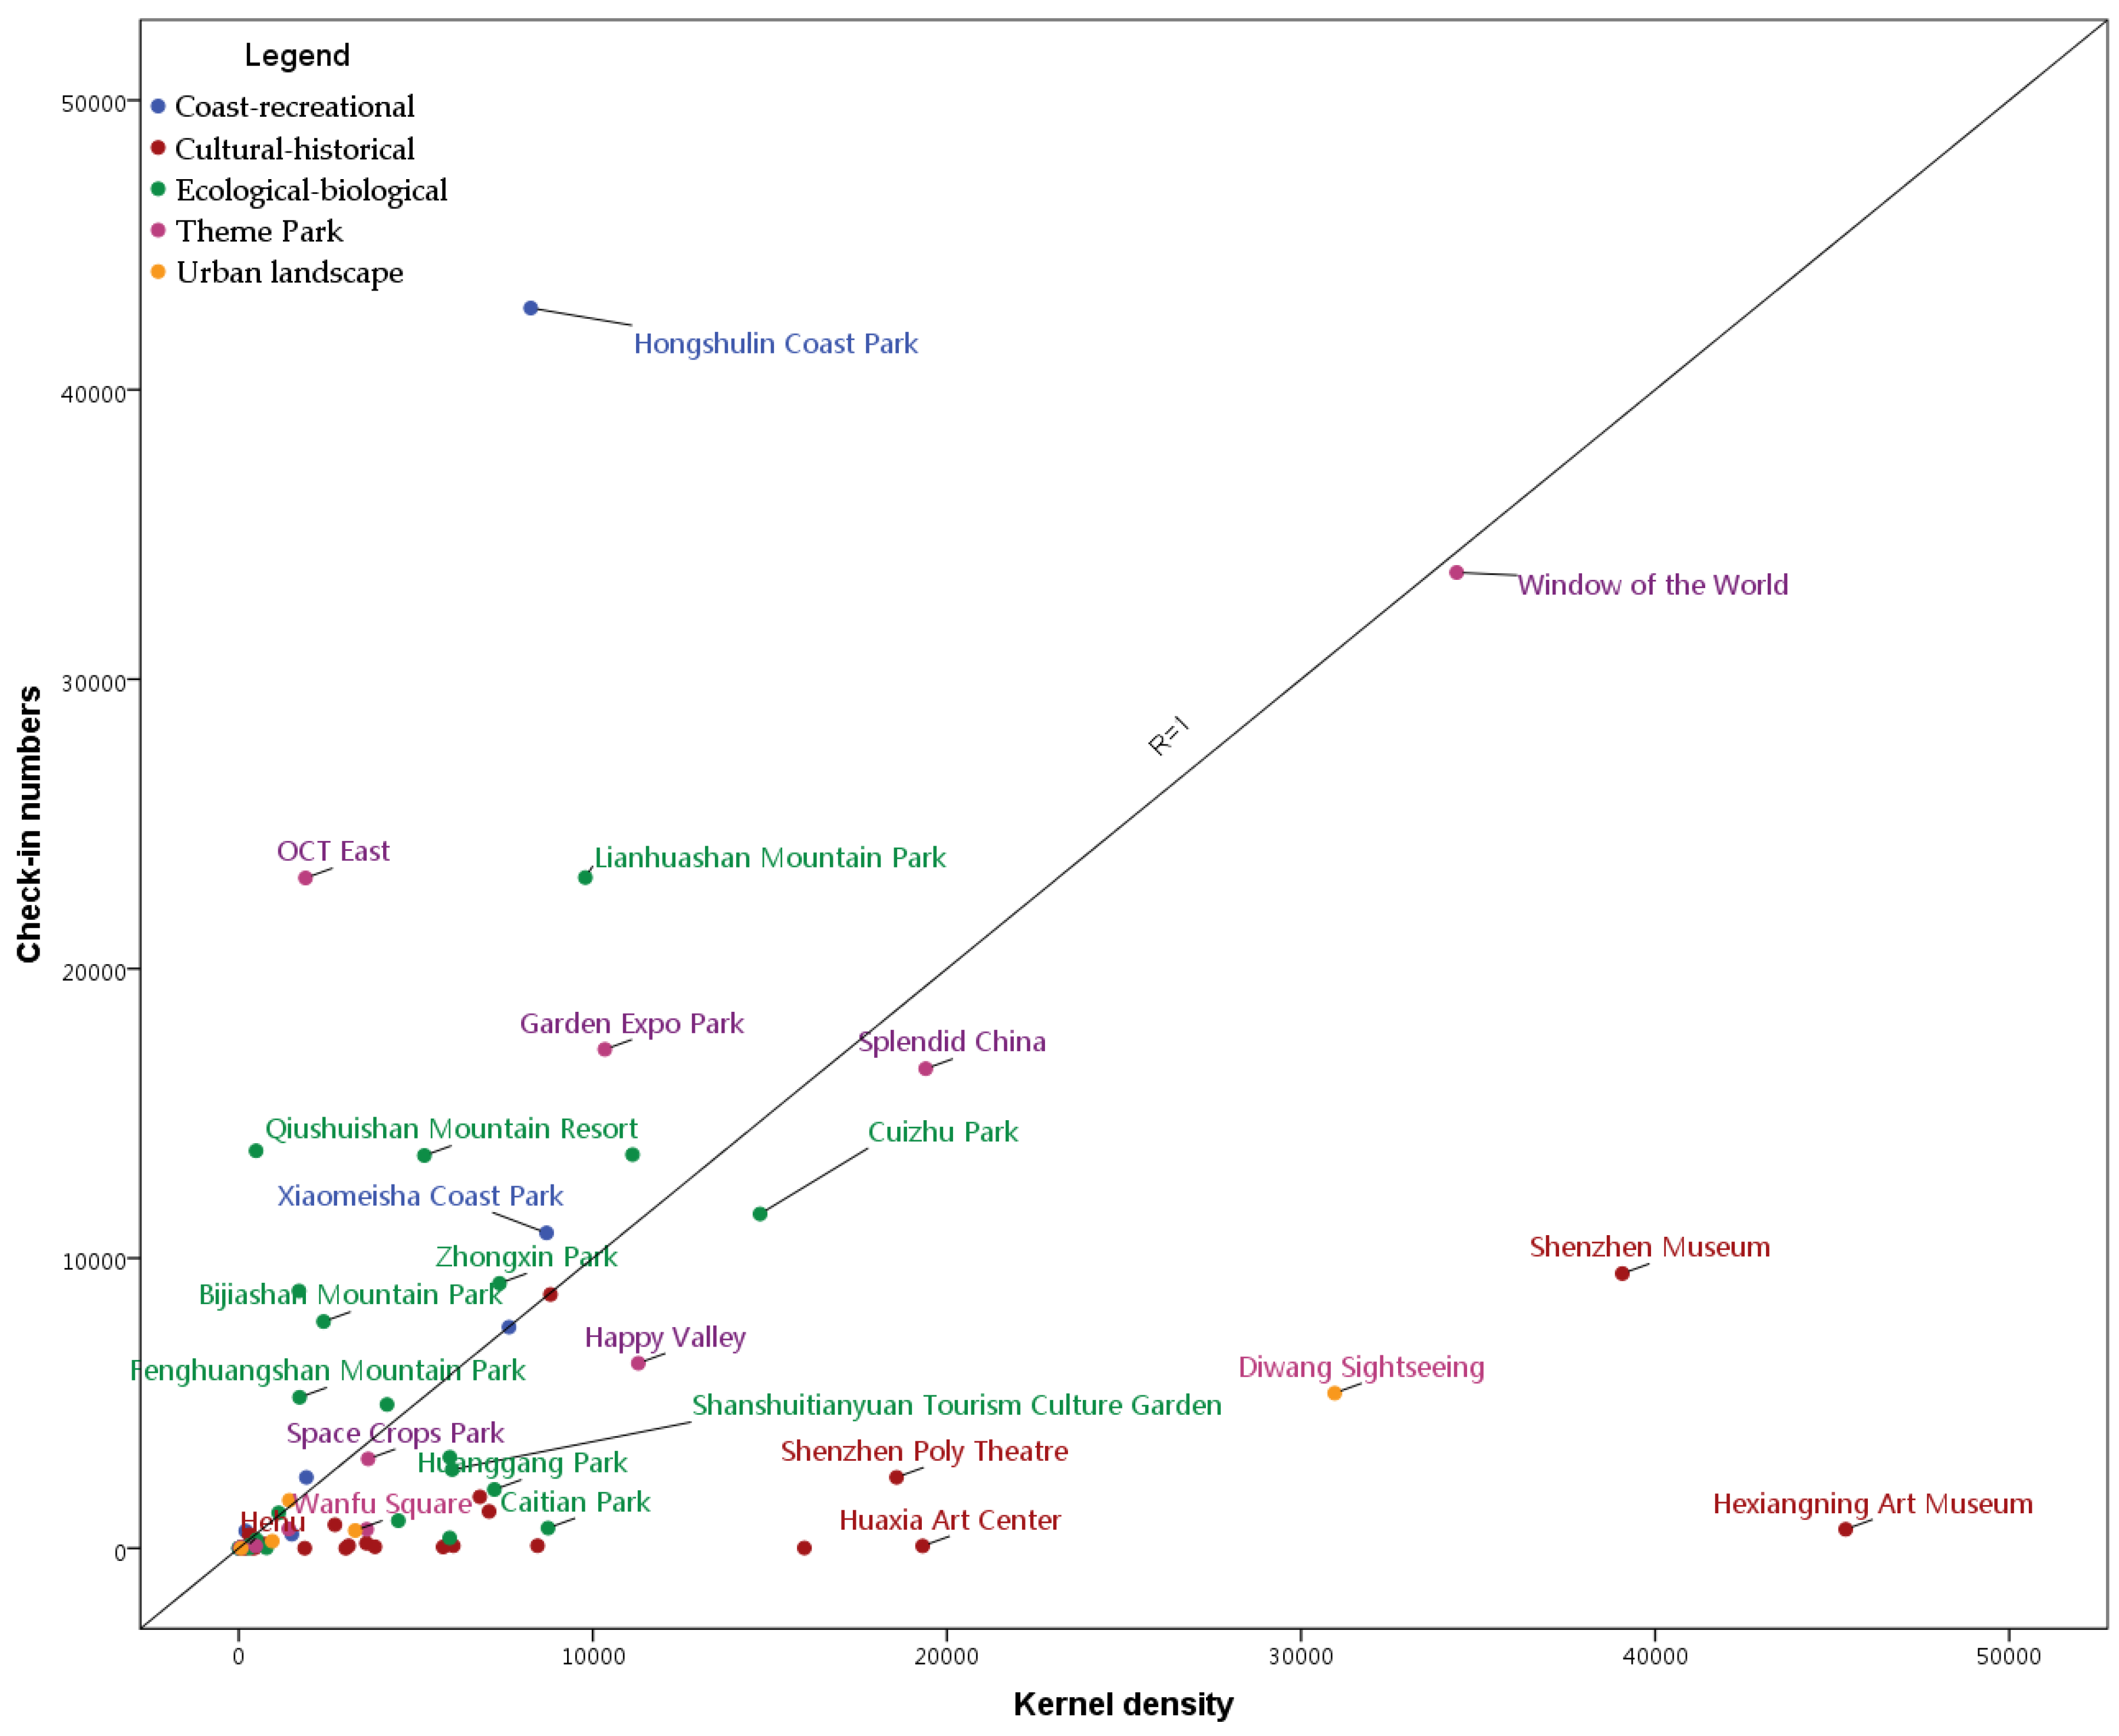
3.2. Analysis of the Check-in Activity Index of Scenic Spots

We conducted a kernel-density analysis of the activity locations of users who checked in at scenic spots and found that hot spots visited by these tourists mainly include (1) external transportation junctions, such as Shenzhen Airport, Shenzhen North Railway Station, and Luohu Railway Station; (2) popular tourist attractions, such as Window of the World, Splendid China Folk Culture Village, OCT East, Dameisha and Xiaomeisha Scenic Area; and (3) CBD, such as Nanshan CBD, Futian CBD, and Luohu CBD (Figure 4).
From the kernel density analysis (Figure 5) of different types of users, local users had higher activity kernel density with a wider range. By contrast, nonlocal users with check-in duration of ≤3 days and check-in duration from 4 to 15 days had lower kernel density in activities inside the city and a limited activity range, which is consistent with the distribution of external transportation junctions and popular scenic spots. By comparison, users with a check-in duration of between 4 and 15 days had lower activity kernel density, but their activity range extended to beyond the Shenzhen special zone. Nonlocal users with a check-in duration lasting >15 days had a similar activity kernel density to that of local users. Although their overall kernel density was slightly lower than that of local users, their activity range and activity hot spots were identical to those of local users.
A further comparison of the scenic spots’ check-in numbers and kernel density (Figure 6) of users’ activity revealed that most scenic spots’ check-in numbers were lower than the kernel density of their surrounding activities, such as Safari Park, Happy Valley, and Hua Art Museum, which had fewer check-ins. When the surrounding activities had a high kernel density, activity locations around the scenic spots exhibited high attraction, but the tourist attraction of the scenic spots was normal. Some scenic spots’ check-in numbers paralleled their users’ activity kernel density. For example, Window of the World and Mangrove Lin Haibin Park, which have high active check-in numbers and, at the same time, high activity kernel density in the surrounding areas. This type of scenic spot, as well as its surrounding hotspots, has high tourist attraction. Tourist attractions with low activity and low check-in numbers also exist, such as Fenghuangshan Mountain Park, which exhibits low check-in numbers, with an equally low kernel density of the surrounding activity. The tourist attraction to this type of scenic spot and the surrounding activity locations are all relatively weak. Only a few scenic spots present low kernel density but high check-in numbers, such as Lianhuashan Park and Qiushuishan Resort. This type of scenic spot features high tourist attraction, but the attraction of the surrounding activity locations is relatively weak.
Overall, theme park scenic spots displayed high activity Kernel density and correspondingly high check-in numbers. Although seashore leisure and natural ecological scenic spots have high check-in numbers, they exhibited low activity kernel density. In contrast, scenic spots of urban activities and human history showed high kernel density but low check-in numbers.

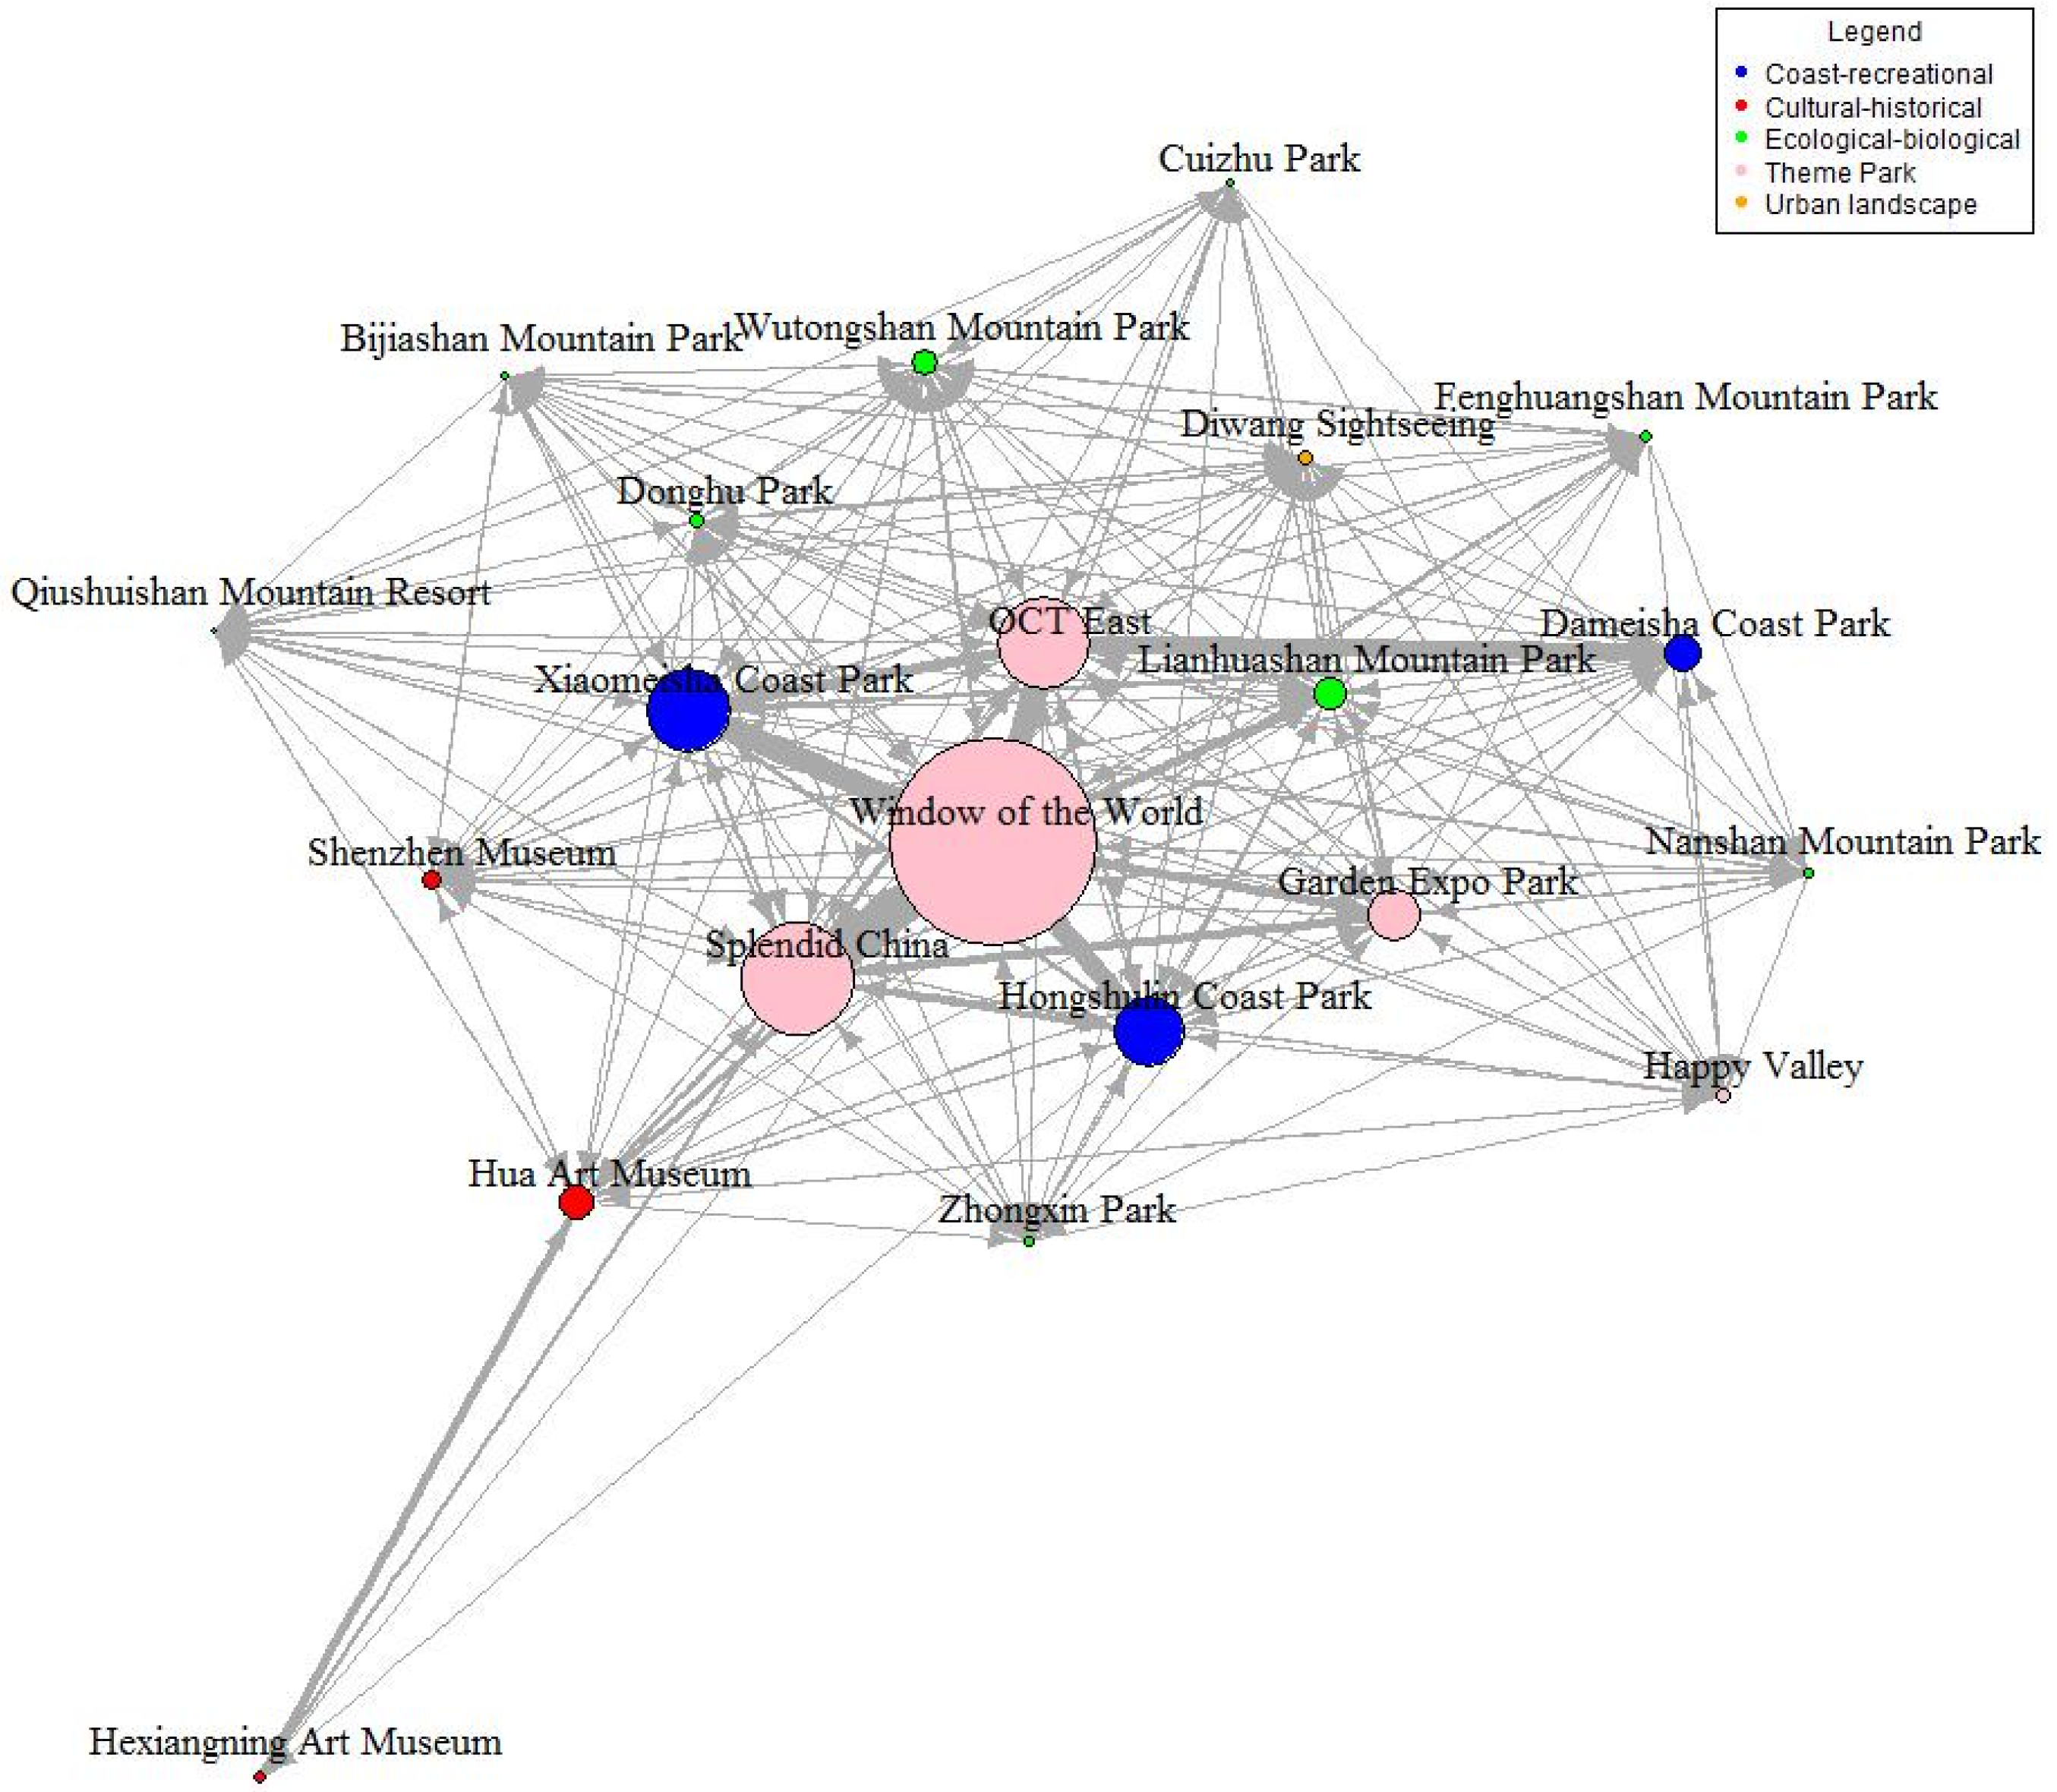
3.3. Scenic Spot Relevance

To identify the tourism chain of the scenic spots where tourists visit, we collected and classified statistics based on the numbers of users of scenic spots (Table 3). Among 160,000 tourists, the proportion of tourists who only visited one scenic spot was 85.8%; the proportion of tourists outside the city who only visited one scenic spot reached 90.1%. For tourists who travelled less than 15 days, the proportion of those visiting one scenic spot reached 96%. Such high visit ratios for a single scenic spot indicate that scenic spots in Shenzhen are relatively weak in linked attraction. We selected 59,944 users whose check-in duration in Shenzhen lasted ≤15 days to conduct a correlation analysis of scenic spots and found that users who visited two or more scenic spots accounted for less than 4%.
Through an analysis of user travel chains of short duration between different scenic spots (Figure 7), we found the core status of Window of the World. In terms of type, the main combination is “theme park + theme park,” followed by “theme park + seashore leisure”; others are mainly neighbouring combinations. In terms of space, neighbouring combinations, such as “Window of the World + Splendid China Folk Culture Village” and “Window of the World + Hongshulin Coast Park”, as well as cross-region combinations, such as “Window of the World + OCT East” and “Window of the World + Dameisha Scenic Area”, were noted. The formation of a tourism chain in a tourist destination is, on the one hand, due to spatial proximity and, on the other hand, to variations among different scenic spots. In Shenzhen, 5A scenic spots feature close spatial proximity but high homogeneity; thus, their age leads to a short distance of the tourism chain. The new generation of scenic spots and new construction of coastal scenic spots become new attractions, but they are distant from the old attractions, leading to the difficult completion of tourism chains.

4. Discussion

As an emerging city with rapid growth, nearly no high-level places of interest or historical sites existed in Shenzhen City. During the 1990s, Shenzhen built small theme parks as core attractions, represented by Splendid China Folk Culture Village and Window of the World. This development greatly satisfied people’s demand for learning about the world and created the theme park-oriented system of Shenzhen’s tourism industry. China’s construction wave of theme parks began here. Themed scenic spots remain competitive products of the tourism industry in Shenzhen. Window of the World and OCT East represent the old and new generations of theme parks, respectively, taking core positions as tourist scenic spot destinations, especially for tourists from outside the city. Nevertheless, theme park scenic spots are characterized by a short lifecycle. Together with the development of similar tourism products in surrounding areas, the competitive advantages of theme park scenic spots, such as Window of the World and OCT East, have been declining year after year. In the long term, Shenzhen must expand its diversified tourism products, reduce its dependence on theme park tourism products, and remain active and attractive in the fierce competition of the tourist market.
Eleven of 86 scenic spots recommended by the official website of the Shenzhen Culture, Sports, and Tourism Bureau had not had users checked in during three years; none of the six national 4A scenic spots entered the list of the most active checked-in attractions. A certain mismatch exists between tourists’ perception of Shenzhen’s tourism destination images and official marketing. Determining how to face different tourist markets by tapping the potential of existing scenic spots is a challenge for Shenzhen tourist development. For scenic spots with high heat and low check-in times, Shenzhen must take full advantage of its external location advantage, with an emphasis on improving scenic spots’ value. For scenic spots with low kernel density and high check-in times, enhancing tourism infrastructure gradually would be useful. For scenic spots with low kernel density and low check-in times, gradually improving the attractions’ quality and external environment would help to build interest in new attractions.
As modern tourism develops from simply considering scenic spots as individual units to considering tourist destination as a unit, the improvement of tourism attraction is reflected not only in the development of a single scenic spot but also in building the overall image of tourist destinations. In the future, tourism planning and product development in Shenzhen should need focus on enhancing its interest among tourists. Considering the overall image of tourist destinations and improving the design of tourism chains would enhance tourism development. On one hand, in terms of tour route design, Shenzhen could enhance the linkage development of scenic spots with the same or different themes through special subject tourism, comprehensive tourism, and other forms of tourism to create diversified product combinations. On the other hand, tourism organization could be flexible and diverse and could develop a “one-day tour” through tickets and favourable packages of multi-day tours to encourage tourists to visit many scenic spots. Sets of different tickets for various scenic spots would meet the various demands of different tourists.

5. Conclusions

With the popularization of social networking and the development of information and communication technology, the fusion of research on big data and urban problems has become a trend. This research introduced a new approach using micro-blog LBS check-in data to analyse attraction features of tourist destinations. This study is limited to micro-blog users who checked into tourist spots during 2012–2014. However, unlike more traditional data acquisition methods in tourism research, the data used in this study feature the advantages of big data size and the ability to reflect tourist destinations’ attractiveness to tourists in an objective, realistic, and comprehensive manner. Future related studies could consider additional characteristics of tourists, pictures, and other visit “footprint” information. If these multi-type, non-structured big data can be discovered and analysed, the space-time activity characteristics of tourists can be effectively simulated, enabling an interactive feedback between the virtual social network and real geographic space.

Acknowledgments

The paper was subsidized by The National Natural Science Foundation of China (Grants No. #51308341, #51008268) and China Postdoctoral Foundation (2015M572364).

Author Contributions

Yu Chen and Xiaomeng Chang conceived and designed the experiments; Zhihui Gu and Yan Zhang analysed the data and wrote the paper.

Conflicts of Interest

The authors declare no conflict of interest. The founding sponsors had no role in the design of the study; in the collection, analyses, or interpretation of data; in the writing of the manuscript, and in the decision to publish the results.

References

  1. Tourism Highlights, 2016 Edition ed. Available online: http://www.unwto.org (accessed on 8 October 2016).
  2. Gan, M.; Bao, J. Primary study on the urban tourism competitiveness. Mod. Urban Res. 2003, 4, 22–25. (In Chinese) [Google Scholar]
  3. Gretzel, U.; Sigala, M.; Xiang, Z.; Koo, C. Smart tourism: Foundations and developments. Electron. Mark. 2015, 25, 179–188. [Google Scholar] [CrossRef]
  4. Sultana, L.A.; Dale, M.; Syed, M.U.R. Crowdsourcing travel experience: A case study of user participation on the tourism Australia Facebook page. In Proceedings of the Mediterranean Conference on Information Systems 2012, Guimaraes, Portugal, 8–10 September 2012.
  5. Koo, C.; Joun, Y.; Han, H.; Chung, N. The impact of potential travellers’ media cultural experiences. In Information and Communication Technologies in Tourism 2014; Xiang, Z., Tussyadiah, L., Eds.; Springer: Berlin, Germany, 2014; pp. 579–592. [Google Scholar]
  6. Huang, X.; Yuan, J.; Shi, M. Condition and key issues analysis on the smarter tourism construction in China. In Multimedia and Signal Processing; Springer: Berlin, Germany, 2012; pp. 444–450. [Google Scholar]
  7. Ovidiu, I.M. Tourism preferences and choices of young Romanian Facebook users: Travel frequency, seasons and types of destinations. In Proceedings of the International Conference Marketing—From Information to Decision 2012, Cluj Napoca, Romania, 26–27 October 2012.
  8. Majid, A.; Chen, L.; Chen, G.; Mirza, H.T.; Hussain, I.; Woodward, J. A context-aware personalized travel recommendation system based on geotagged social media data mining. Int. J. Geogr. Inf. Sci. 2013, 27, 662–684. [Google Scholar] [CrossRef]
  9. Chinese Academy of Social Sciences Chinese Public Sentiment Survey Lab Media Survey Center. White Papers of Micro-Blog Tourism in 2015; Chinese Academy of Social Sciences: Beijing, China, 2015. (In Chinese) [Google Scholar]
  10. Olmeda, I.; Sheldon, P.J. Data mining techniques and applications for tourism internet marketing. J. Travel Tour. Mark. 2002, 11, 1–20. [Google Scholar] [CrossRef]
  11. Lu, X.; Wang, C.; Yang, J.M.; Pang, Y.; Zhang, L. Photo2trip: Generating travel routes from geo-tagged photos for trip planning. In Proceedings of the International Conference on Multimedia 2010, Florence, Italy, 25–29 October 2010.
  12. Vu, H.Q.; Li, G.; Law, R.; Ye, B.H. Exploring the travel behaviors of inbound tourists to Hong Kong using geotagged photos. Tour. Manag. 2015, 46, 222–232. [Google Scholar] [CrossRef]
  13. Liu, Y.; Sui, Z.; Kang, C.; Gao, Y. Uncovering patterns of inter-urban trip and spatial interaction from social media check-in data. PLoS One 2014, 9. [Google Scholar] [CrossRef] [PubMed]
  14. Zhang, Z.A.; Huang, Z.T.; Jin, C.; Guan, J.; Cao, F.D. Research on spatial-temporal characteristics of scenic region tourist activity based on check-in data in micro-blog- a case study of Nanjing Zhongshan Mountain National Park. Geogr. Geo-Inf. Sci. 2015, 31, 121–126. (In Chinese) [Google Scholar]
  15. Sui, Z.W.; Wu, L.; Liu, Y. Study on interactive network among chinese cities based on the check-in data. Geogr. Geo-Inf. Sci. 2013, 29, l–6. (In Chinese) [Google Scholar]
  16. Yuan, H.; Xu, H.; Qian, Y.; Li, Y. Make your travel smarter: Summarizing urban tourism information from massive blog data. Int. J. Inf. Manag. 2016, 36, 1306–1319. [Google Scholar] [CrossRef]
  17. Pan, B.; MacLaurin, T.; Crotts, J.C. Travel blogs and the implications for destination marketing. J. Travel Res. 2007, 46, 35–45. [Google Scholar] [CrossRef]
  18. China Internet Network Information Center. Research Report on 2015 China Social App Users’ Behavior; China Internet Network Information Center: Beijing, China, 2015. (In Chinese) [Google Scholar]
  19. Todd, A.W.; Campbell, A.L.; Meyer, G.G.; Horner, R.H. The effects of a targeted intervention to reduce problem behaviors elementary school implementation of check in–check out. J. Posit. Behav. Int. 2008. [Google Scholar] [CrossRef]
  20. Pike, S. Destination Marketing: An Integrated Marketing Communication Approach; Elsevier, Butterworth-Heinemann: Oxford, UK, 2008. [Google Scholar]
  21. Middleton, V.T.; Clarke, J. Marketing in Travel and Tourism, 3rd ed.; Elsevier, Butterworth-Heinemann: Oxford, UK, 2001. [Google Scholar]
  22. Shenzhen Statistical Bureau. Shenzhen Statistical Yearbook 2014; China Statistics Press: Beijing, China, 2015. (In Chinese)
  23. Shenzhen Culture, Sports and Tourism Bureau (Broadcasting and TV Office and Cultural Relics Bureau of Press and Publishing) Work Summary of 2015. Available online: http://www.szwtl.gov.cn/showPinfoPage.action?guid=4bdbadb65201768c015277a2caac0095 (accessed on 8 November 2016).
  24. Mayo, E.; Jarvis, L.P. The Psychology of Leisure Travel: Effective Marketing and Selling of Travel Services; CBI: Boston, MA, USA, 1981. [Google Scholar]
  25. Richards, G. Tourism attraction systems-exploring. Ann. Tourism Res. 2002, 29, 1048–1064. [Google Scholar] [CrossRef]
  26. Huang, H.; Wang, J.; Ming, Q.-Z.; Wang, F. Reconstruction on the spatial system in tourist destinations driven by local tourist. Tour. Trib. 2012, 27, 40–44. (In Chinese) [Google Scholar]
  27. Wu, B.H.; Wu, J.; Dang, N. Local residents’ recreation preference around urban area in a tourism city—A case study in Hangzhou. Human Geogr. 2007, 22, 27–31. (In Chinese) [Google Scholar]
  28. Wen, T.; Jin, X.H. The development of tourism destination based on local market—A case study in Hong Kong. Areal Res. Dev. 2011, 30, 81–84. (In Chinese) [Google Scholar]
  29. Bao, J.G.; Chu, Y.F. Tourism Geography; Higher Education Press: Beijing, China, 1999. (In Chinese) [Google Scholar]
Figure 1. Spatial distribution of 86 tourist attractions in Shenzhen. Data source: Drawn by adding relevant information from the official website of Shenzhen Culture, Sports, and Tourism Bureau to a GIS database [23].
Ijgi 05 00210 g001
Figure 2. Origin and number of nonlocal tourists who remained in Shenzhen for ≤15 days. Background green shades represent the average duration of tourists whose check-in duration was less three days.
Ijgi 05 00210 g002
Figure 3. Distribution and statistics of user origin at tourist attraction with >3000 check-ins.
Ijgi 05 00210 g003
Figure 4. Kernel density of activity locations of users who visited tourist attractions.
Ijgi 05 00210 g004
Figure 5. Activity kernel density of different users.
Ijgi 05 00210 g005
Figure 6. Matrix of check-in numbers and kernel density of 86 tourist attractions.
Ijgi 05 00210 g006
Figure 7. Space diagram of scenic spot combinations of tourists from outside Shenzhen who visited many attractions in 15 days.
Ijgi 05 00210 g007
Table 1. Tourist source and formation based on ID creation place and check-in duration in Shenzhen.
ID Registration PlaceTourist OriginCheck-in Duration in ShenzhenTourist Type Definition
localShenzhenlocal leisure tourism
NonlocalOutside of Shenzhen≤3 daysshort-term tour by nonlocal tourists in Shenzhen
4–15 dayslong-term tour by nonlocal tourists in Shenzhen
>15 daysnonlocal tourists who travelled to Shenzhen several times per year or nonlocal tourists who resided in Shenzhen; this tourist behaviour is similar to the leisure tourism of Shenzhen local residents
Table 2. Tourists’ choice of scenic spots from different tourist markets.
First ChoiceSecond ChoiceThird Choice
Local tourist
(62,528)
Hongshulin Coast Park (11,665)
18.7%
Lianhuashan Park (5970)
9.5%
Window of the World (5821)
9.3%
Nonlocal tourists≤15 days
(59,944)
Window of the World (14,870)
24.8%
Hongshulin Coast Park (11,616)
19.4%
OCT East (10,124)
16.9%
>15 days
(38,287)
Hongshulin Coast Park (10,982)
28.4%
Window of the World (8995)
23.5%
Lianhuashan Park (6768)
17.7%
In total
(98,231)
Window of the World (23,865)
24.3%
Hongshulin Coast Park (22,598)
23%
OCT East (16,002)
16.3%
Table 3. Statistics of numbers of scenic spots visited.
Number of Scenic SpotsNumber of UsersPercentage (%)
Check-in Duration of ≤3 daysCheck-in Duration of 4–15 daysTotal
One52,577495357,53096%
Two152759721243.5%
Three and above1831072900.5%
In total54,287565759,944100%

