1. Introduction
The arrangement of urban space is of paramount importance to effective management and governance of cities. City planners would propose planning schemes for urban spatial configurations and administrators would establish guiding and regulatory measures accordingly. In recent decades, more cities are transforming towards a polycentric spatial structure from the traditional monocentric urban form [
1,
2,
3]. While the hope is for the urban residents to conduct daily activities in accordance with the planning schemes and therefore maintaining a balanced structure in terms of the spatial interactions among different urban zones, the actual situation of urban spatial interactions and the resultant spatial divisions is difficult to measure. Such knowledge and information is desired in order to evaluate the existing schemes as well as to modify future planning.
Human movements in urban space are an ideal representation of spatial interaction, as they are perceived as a major physical carrier of the materials, resources, and information that travel through places [
4]. With knowledge on how these movements are distributed, one could have a better grasp of the spatial organization in a city. Conventionally, information on human movements and urban travels at large scale and with the coverage representative of urban population is virtually not accessible. Thus, exploration on urban structure based on spatial interactions has been largely limited. Moreover, collective human mobility patterns change periodically within a day [
5]. The distribution of movements and interactions is thereby constantly changing as well. As a result, interaction-based structure is also time-varying and dynamic as opposed to the planned structure and administrative zoning which are static in the short term.
Emerging large-scale mobility data have shown great potential in characterizing human movements and relevant patterns. Data from various sources, e.g., mobile phone positioning data, smart card transaction records, and social media footprints, have been utilized by scholars to investigate different aspects related to human mobility in urban areas and findings have suggested a high level of regularity and predictability of daily human movements [
6,
7,
8,
9]. There are also significant efforts devoted to the analysis of cities as complex systems using large-scale datasets. Cities, in both streams of studies, are usually modeled as spatially-embedded networks [
10] and complex network theories are introduced to handle the construction, manipulation, and analysis of these abstract networks that are generated to depict physical realities in cities. Community detection, in particular, is a widely applied technique in network theory that has been used to analyze the structure of networks and has been adopted by researchers for the study on urban structure. While many studies have focused on using large-scale data and network theory to analyze macroscopic boundary divisions at national level [
11], comparative analysis of spatial interaction between countries [
12], sub-region partitioning [
13], hierarchical urban structure [
14], and long-term evolution of community structure in urban space [
15], less attention has been paid to the temporal variations of interaction-based urban spatial divisions and component partitioning on a daily basis.
This study aims at characterizing the dynamics of urban spatial structure by identifying the diurnal variations in spatial division. Here, interaction-based urban structure refers to the city-wide composition of spatial components identified through the collective spatial interactions by movements of urban residents. A large-scale mobile phone positioning dataset from Shenzhen, China is utilized to construct the spatially embedded networks on a typical weekday and at different times of the day. Community detection technique is applied to identify the spatial structure represented by the resultant communities. Several indicators adopted from network and graph theories are calculated to quantify the temporal variations in spatial structure and exemplary scenarios with prominent variation are further elaborated on and interpreted. The urban structure planning scheme from the master plan of Shenzhen Municipality is used as a reference and comparisons show a certain level of expansion in the central urban area and fragmentation in a typical industrial region. Results also indicate a high level of variability in the partitioning of urban space over the course of a day and the variation is typically evident before and after peak hours. It indicates how transitions between commuting-dominant travel patterns and features of trips with other purposes influence the underlying spatial structure. Findings of this study would benefit intelligent decision making in urban planning and management with a detailed perspective, both spatially and temporally, on urban spatial structure dynamics.
The remainder of this paper is organized as follows.
Section 2 summarizes several related studies with highlights and limitations.
Section 3 describes the study area and data used in the analysis.
Section 4 elaborates on the analytical process and
Section 5 demonstrates the results. In
Section 6, discussion of the results is included with some concluding remarks.
2. Related Works
Numerous works have been done in regard to the analysis of urban systems based on large-scale mobility data and complex network methods. This section reviews several relevant studies in order to highlight the contributions of this research.
2.1. Network Analysis on Urban Systems
In urban areas, there are many complex systems with inherent network topologies. Examples include underground system, road and highway network, and electricity power grids [
16,
17]. Such intrinsic characters make them ideal study candidates using network analysis. Many of these analyses focus on the system facilities themselves in static form thus do not require large-scale dynamic data. Nevertheless, there are several studies with interesting results and insightful findings.
Transportation networks are the most studied systems in urban space regarding their network characteristics. Fundamental network features such as centrality and clustering coefficient have been investigated for road and public transit networks in different cities. For example, Derrible [
18] analyzed the betweenness centrality index of various metro systems around the world and found a negative relationship between betweenness share and network size. Similarly, Wang et al. [
19] investigated the centrality of streets in Baton Rouge, Louisiana and they further compared the centrality index to the land use intensity in the urban areas. Seaton and Hackett [
20] calculated various indicators including clustering coefficient, path length and average degree vertex of the rail systems in Boston and Vienna. Robustness is a major concern in the network analysis of urban systems as they are critical to the urban functioning and disruption of them may compromise their capabilities. Applying network analysis methods, researchers have focused on the robustness of metro networks [
21], road networks [
22], as well as power grids [
23].
The abovementioned studies generally relied on the static network configurations of urban systems. There are also researches that included traffic or flow data in the analysis with network layouts. For example, congestion caused by automobile traffic in road networks has been analyzed based on complex network theory [
24,
25]. In addition, large-scale mobile phone data have been concurrently utilized with road network data to explore patterns in road use [
26] and urban traffic rhythms [
27].
2.2. Community Structure of Urban Space
Another stream of studies on the analysis of urban space with complex network theory mainly focuses on the community structure. A community in complex network analysis refers to a component within the network composed of nodes with substantially denser internal connections than external links to outside elements [
28]. Community detection has been extensively applied to a variety of networks regarding their structure properties [
28,
29,
30,
31,
32,
33,
34,
35].
Due to the merits in depicting structural components, the concept of community has been used by researchers in urban structure studies to represent substructures in urban areas defined by spatial units and spatial interactions in between which could be conceptualized as directed and weighted complex networks. Data from different sources and different community detection algorithms have been employed for a various research topics. Before adopting community detection methods at city level, many studies have been conducted at macroscopic and national level. National administrative boundaries have been analyzed and validated by comparing the existing specifications with community structures from interaction-based networks [
11,
36]. Comparative analysis on the interaction-based urban structure with different countries has been conducted as well [
12].
As for the studies at regional or city level, theme, data, and method vary from one another. For instance, using traditional survey-based Origin–Destination (OD) data, de Montis et al. [
13] identified the community structure in an island region in Italy and provided suggestions for sub-regional planning. Using the regional commuting data in the same region in Italy and an additional dataset in Atlanta, US, De Leo et al. [
37] tested their algorithm to identify the community core within the substructures of urban space. In other related studies, large-scale mobility data have been utilized. For example, Liu et al. [
14] employed taxi GPS trajectories to reveal the hierarchical structure of the urban areas in Shanghai, China. They identified a two-level hierarchical polycentric city structure and different patterns implied by short and long distance taxi trips. Smart card data have also been used for the analysis on the community structure of urban space including changes of structure over several years [
4] and long-term evolution with influence of newly established infrastructure [
15].
A variety of subjects have been touched upon in regard to the network characteristics and interaction-based community structure of urban space. However, less attention has been paid to the daily variations in the interaction-based spatial division and component structure which could potentially facilitate urban planning and management with detailed short-term dynamics in urban structure. In addition, data used in the analysis might suffer from either low coverage and coarse aggregation (survey-based and commuting data) or possible demographical bias (smart card data only contain information about public transit users and taxi GPS traces only show patterns of taxi passengers and drivers). In light of these issues, this study exploits the high level of temporal resolution and population representativeness of mobile phone data as an attempt to address these gaps. Findings of this study would shed light on a more insightful understanding on the dynamics in urban space with frequent interactions and fast pace of urban lives.
3. Study Area and Data
In this section, the study area and data used for analysis are briefly introduced. Shenzhen, a metropolitan city in South China, is selected as the area of study and a large-scale mobile phone dataset containing all user positioning records on a typical weekday is utilized.
3.1. Study Area
Shenzhen is located in the Pearl River Delta, adjacent to Hong Kong Special Administrative Region and north of South China Sea. Since its establishment in 1979 as a Special Economic Zone (SEZ), Shenzhen has become one of the largest and most developed cities in China. The population of Shenzhen has reached 10 million in 2010 according to census [
38] and it is estimated it will be over 15 million in a few years [
39]. As shown in
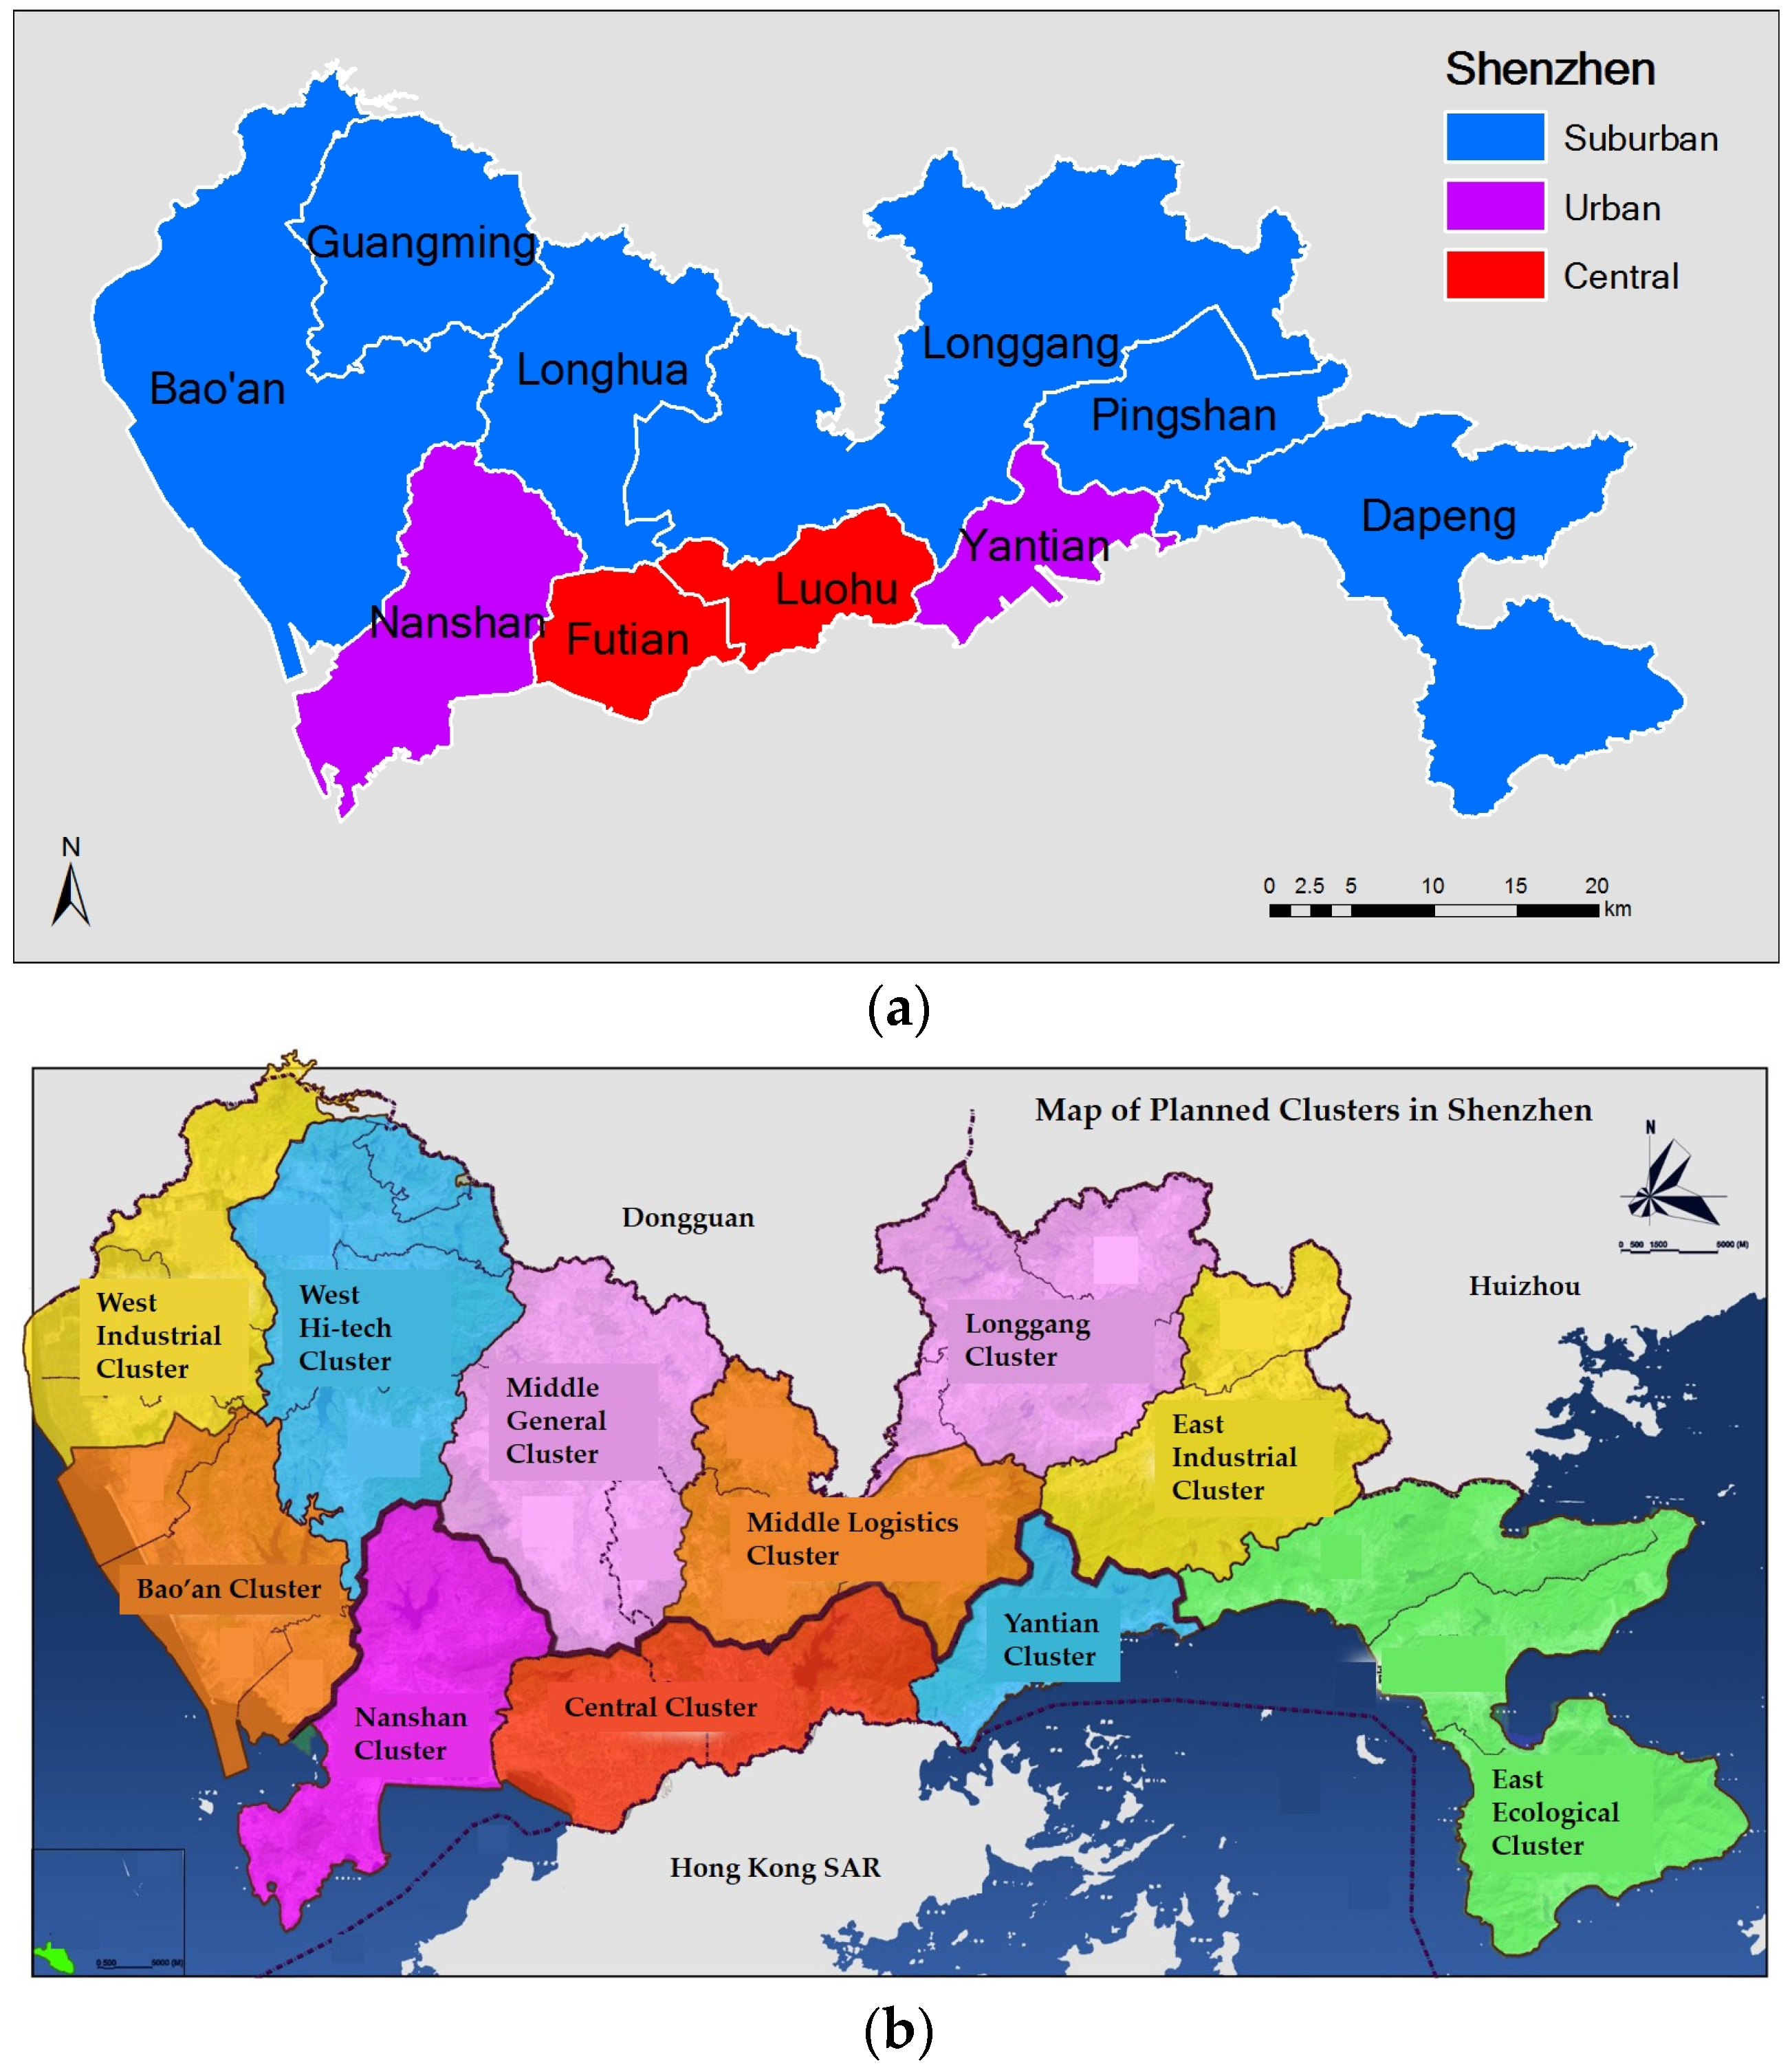
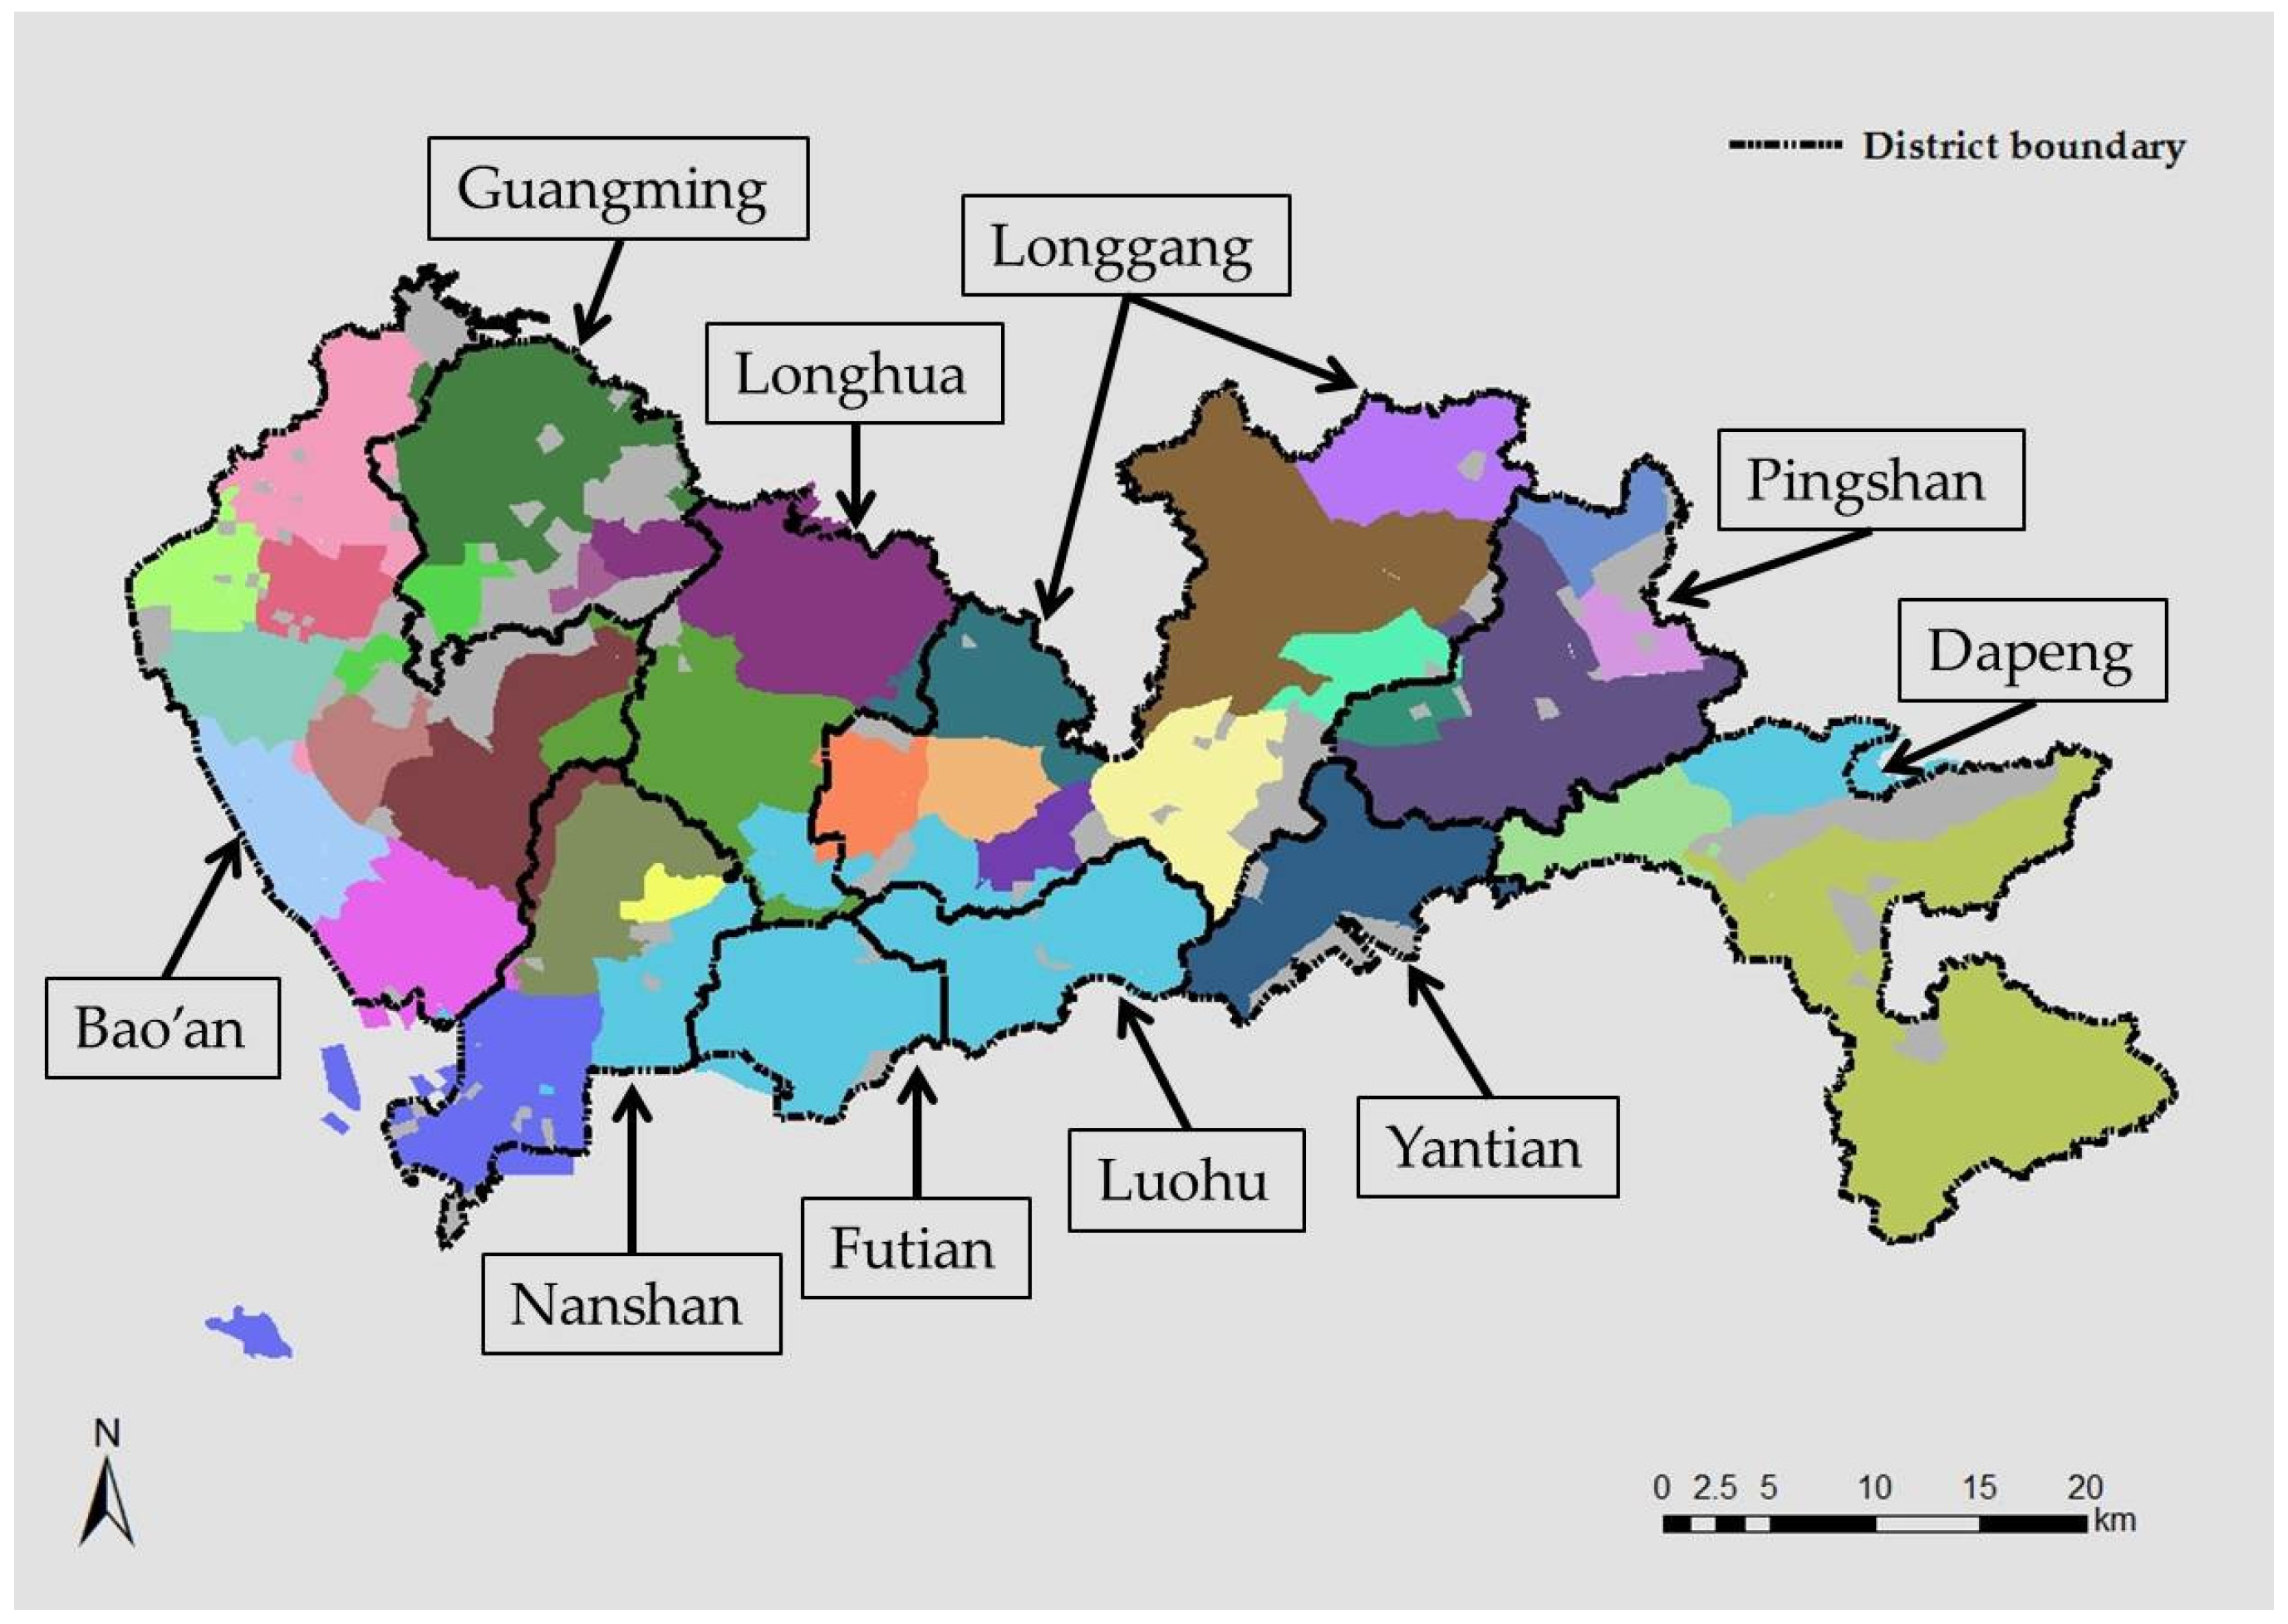
Figure 1a, there are a total of six administrative districts under Shenzhen’s jurisdiction. Luohu and Futian are the central urban districts with the earliest development. Nanshan and Yantian are two other urban districts. These four areas formed the original SEZ up until 2010 when all districts were included. Bao’an and Longgang are the two suburban districts outside the above four districts and four New Districts are subordinate to them including Guangming and Longhua to Bao’an and Pingshan and Dapeng to Longgang. Luohu is the old town area which is among the first regions in terms of economic development. It is still a major central part of the urban areas where many business hubs are located. Futian is the current central district of the city where most government offices are situated. It is also the financial center with many corporate headquarters. Nanshan is the center for higher education as well as technological advancement. A number of high-tech companies including Tencent, the biggest online social media giant in China, have their headquarters in Nanshan. In addition, universities, both local ones and those from other cities, have campuses set up in Nanshan. Yantian is another urban area within the old SEZ territory. There is a major cargo port, Yantian Port, along the coastline in this district and many tourist attractions lie within Yantian. Bao’an is a major suburban district and the center for manufacturing industries. It also has a few major transportation hubs including the International Airport as well as the High Speed Rail Station, which is located in one of the New Districts, Longhua. Longgang is the other suburban district in the northeast of the city. There are also many manufacturing and other forms of industries in Longgang and also Pingshan, a New District subordinate to Longgang. The other New District in this area, Dapeng, is famous for its ecological landscape and coastline scenery and is favored by many as a vacation choice.
The city of Shenzhen is highly mobile and dynamic. With a young and large population of immigrant workers, the demand for mobility and activity is constantly significant. Such high level of mobility would be reflected in a massive volume of spatial interactions and also a vibrant structure of urban space. Moreover, as a new and young city, the planning scheme for Shenzhen has always been encouraging a polycentric form for sustainable and balanced development. In recent decades, the city’s planners have been promoting a “functional grouping” style of urban spatial planning scheme that assembles the geographically adjacent but also functionally compatible regions into a district-like spatial component. This approach attempts to break the constraints of static district boundaries which may be outdated and provide a plan that is more practical and rational. According to the Long-term Master Plan [
40], the whole city was divided into 11 functional clusters, as shown in
Figure 1b (names directly translated from Chinese and not to be taken literally). It is clear that the division in central urban areas is more consistent with administrative zoning while the suburban and new regions are partitioned more differently. The two spatial partitioning schemes of Shenzhen, namely administrative zoning and functional grouping, serve ideally as a background reference to the analysis on urban spatial structure in this study.
3.2. Data Description
The mobile phone positioning data used in this study are actively tracked positioning records of mobile phone users. The dataset was acquired from China Mobile (CM), one of the biggest mobile service providers in China, through research collaboration and it was collected on 23 March 2012, a Friday. It contains the tracked records of all anonymized mobile users in the city of Shenzhen on that day except for the hour from 11:00 p.m. to 12:00 a.m. (i.e., the last hour of the day). Thus, the timespan of the dataset covers the 23 h of that day. There are over 16 million subscribers with recorded information in the dataset and a previous study using the same dataset has shown that the distribution of users correlate with the census-based population distribution quite well, with a Pearson correlation coefficient of 0.99 [
41]. Locations recorded in the dataset are those of the cell towers to which users were subscribed and each user was tracked for their tower affiliation once every hour. Densities of cell towers vary in different areas and in total there are 5908 cell towers managed by CM in Shenzhen and the average nearest distance among towers is around 0.45 km.
4. Analytical Approach
This study relies on the sophisticated community detection and network analysis methods as primary analytical measures. The general procedure goes as follow. Firstly, conceptualized networks are constructed based on the interactions among spatial units during the whole day as well as at different hours. Then, applying community detection, the divisions within networks are determined and the spatial components are identified. By means of several measures borrowed from graph theory, the temporal dynamics of the spatial division structure are quantified. The transitions of the structure through the day are laid out and scenes with the most prominent changes are then selected for further interpretation.
4.1. Constructing Interaction-Based Networks
The first step is to construct a series of interaction-based networks at various times of day as well as for the whole day. These networks are composed of individual nodes and connecting edges. A set of geographical units covering the whole study area are perceived as network nodes while the spatial interactions (movements) among these nodes/units form the edges. The outcomes are a set of weighted and directed networks. Here, the spatial unit used is Traffic Analysis Zones (TAZs) for the ease of comparison as their boundaries fit those of administrative zoning and there are totally 936 units under this scheme. The 5908 cell towers are assigned to the TAZs based on the maximum overlap criterion. In addition, the study area is divided into cell grids with 1 km of side length and networks are constructed again in a similar manner. Subsequent analyses are conducted to both sets of networks in different units to address the potential effect of Modifiable Areal Unit Problem (MAUP) [
42].
Since mobile phone data record individual locations, movements need to be extracted based on certain rules. Here, the point-of-stay based method [
43] is adopted for the identification of movements from mobile phone data. This method imposes spatiotemporal constraints on the recorded locations of mobile users to identify spatiotemporal points that the users “stayed” for a particular activity, as opposed to the “en-route” points, and identifies sequential traces connecting points-of-stay as movements. Specifically, constraints include an upper limit for the distance between two subsequent recorded locations and a lower limit for the timespan between two subsequent records. In other words, a spatiotemporal record needs to have neighboring records in space that are distant from itself enough in time in order to qualify as a point-of-stay. Moreover, another upper limit constraint for the continuity between movements is imposed after extracting all points-of-stay. A movement is identified between any two subsequent points-of-stay with the exception of those who violate the continuity constraint. In that case, the former point is only the ending point of a former movement and the latter is only the starting point of a latter movement with no definitive movement in between. The choice for these thresholds should be based on the specific status of the data at hand [
44]. Based on the density of cell towers and the distribution of elapsing times between subsequent records, the spatial threshold is set to 0.5 km, the temporal threshold is set to 60 min, and the continuity limit is set to 70 min.
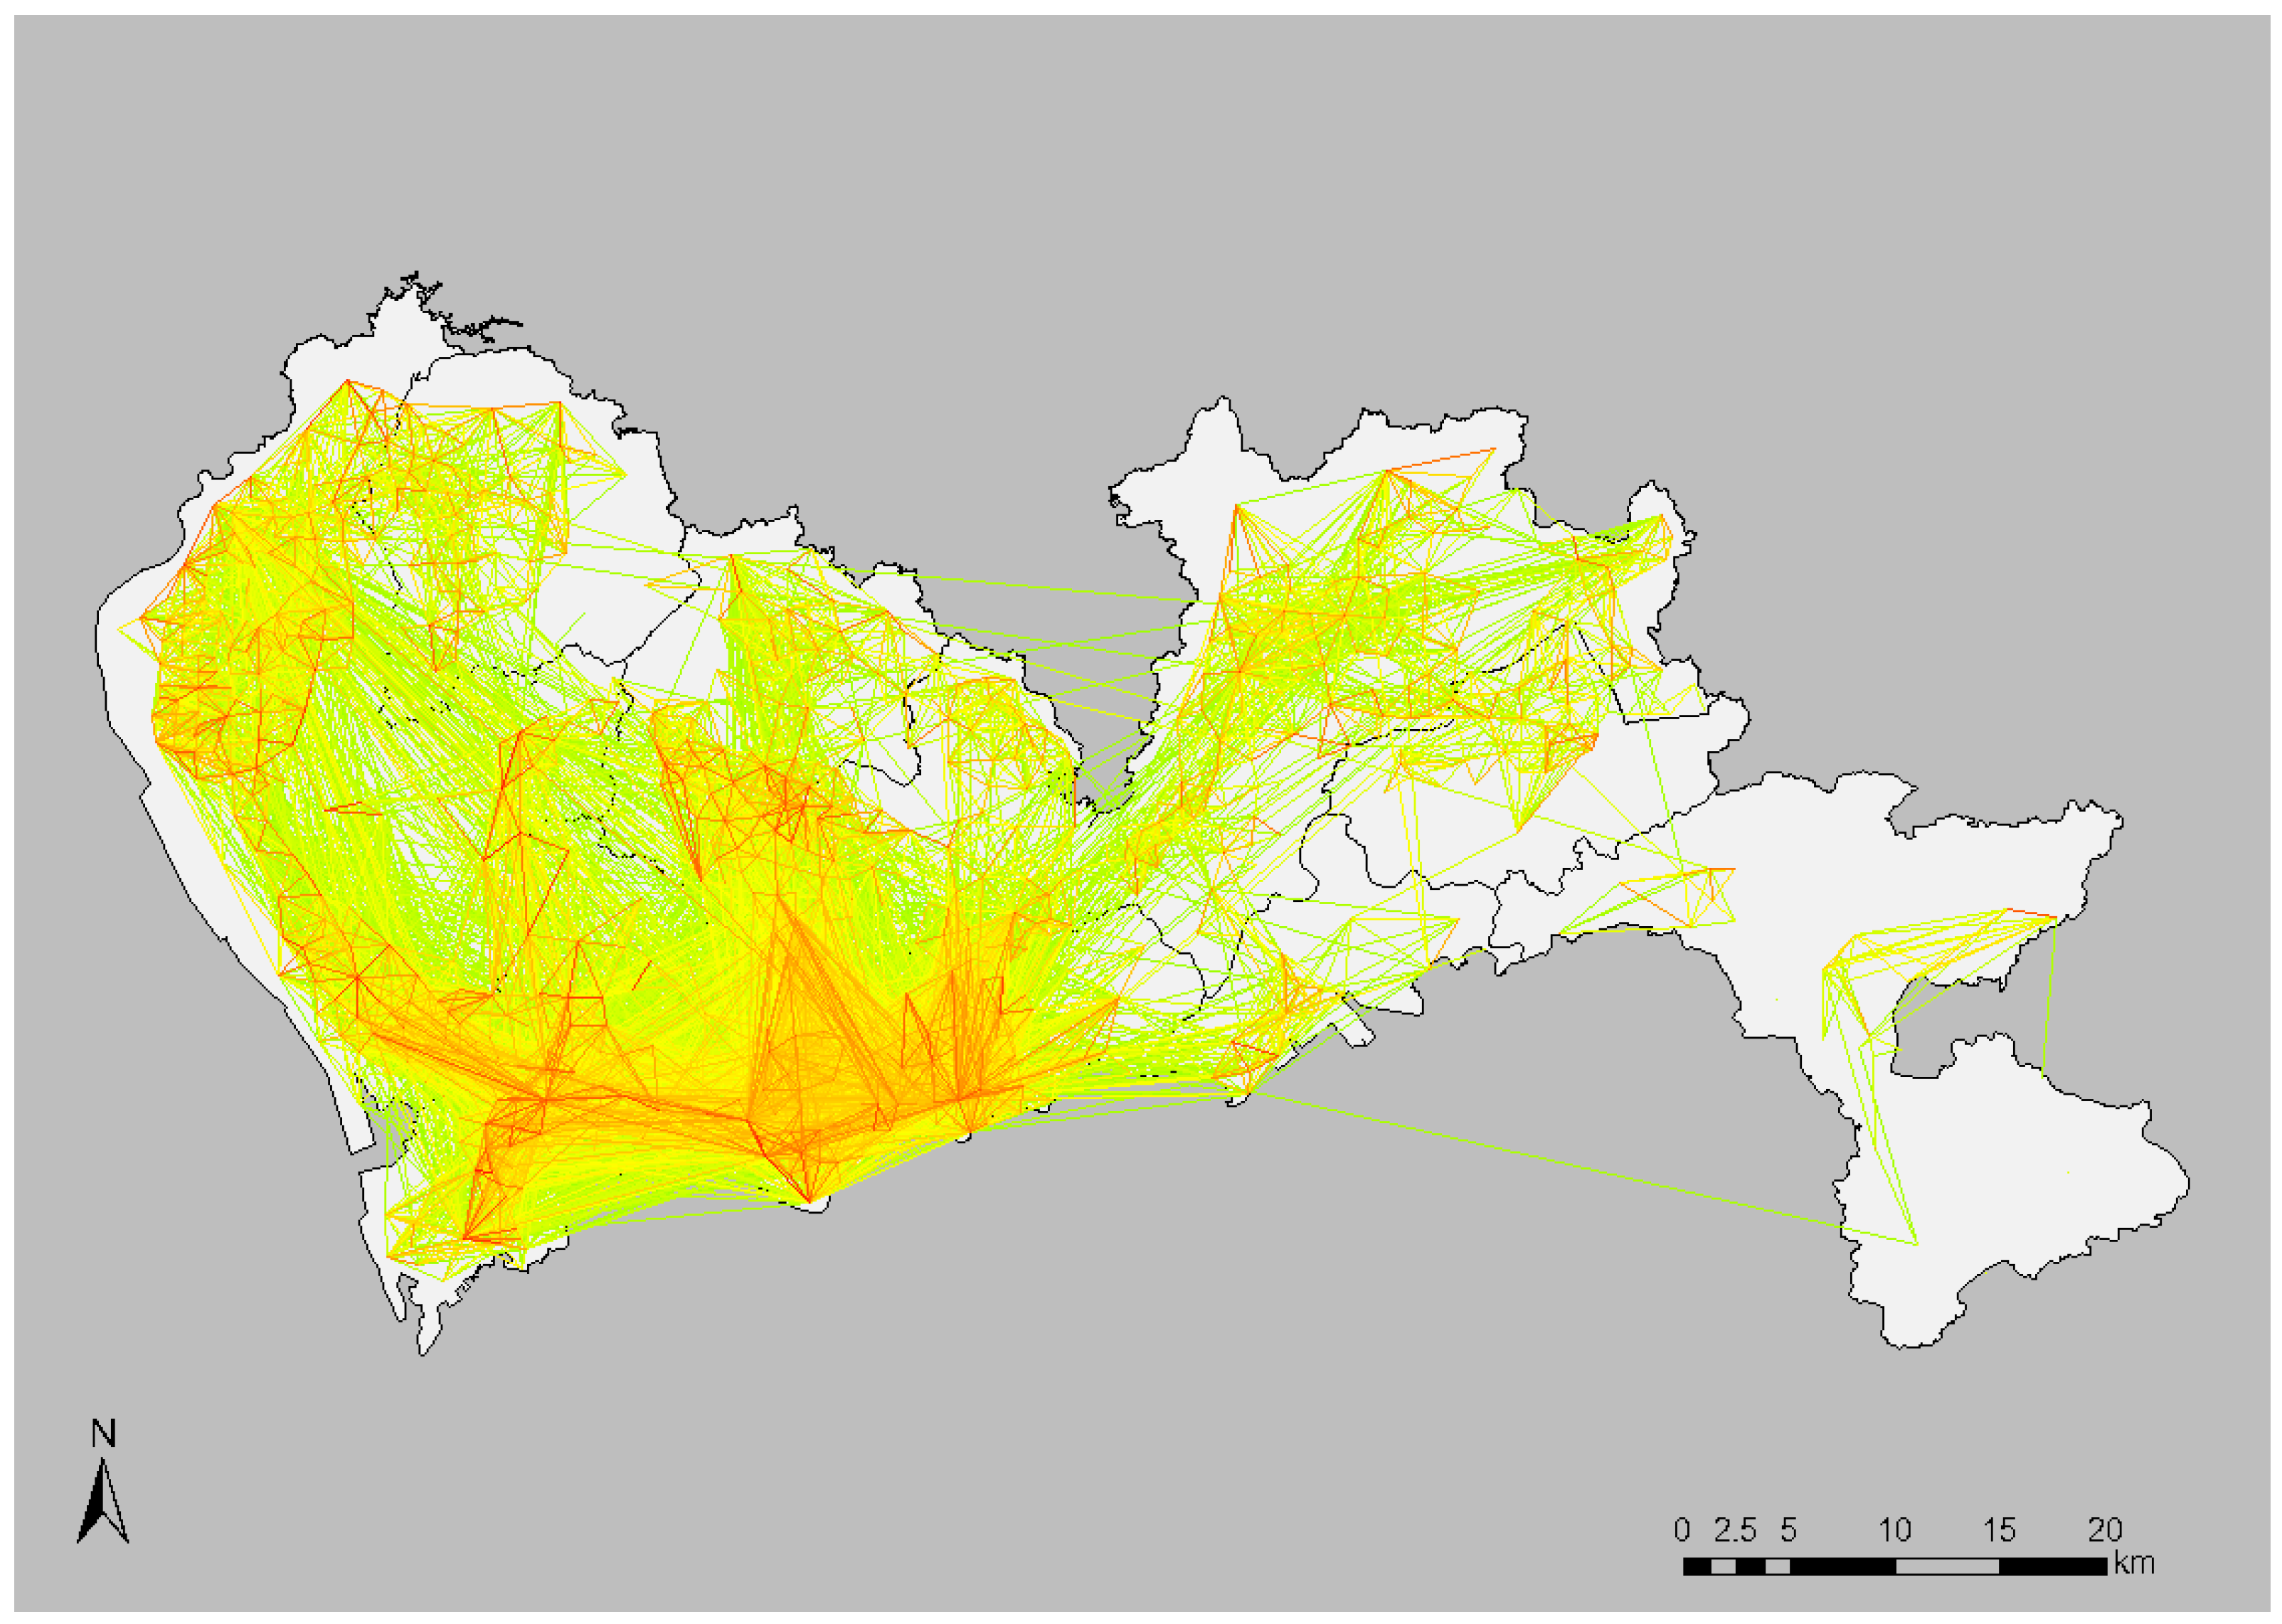
A total of 23,474,337 movements are extracted based on the above rules and the average number of movements per user is around 1.5. The mean distance of movement is 3.9 km and over 90% of the movements are within 10 km. These figures align well with the statistics reported by the latest Travel Characteristics Survey in Shenzhen [
45]. As an example, the distribution of the extracted movements at morning peak hour, at TAZ level, is as shown in
Figure 2.
4.2. Identifying Spatial Divisions
In order to identify the spatial structure based on each interaction-based network, the community detection technique is applied. In essence, the aim is to divide the urban space into several components with significantly stronger internal interactions than external interactions. The division of the space is mutually exclusive as in that the identified communities are non-overlapping.
Compared to the popular modularity based methods [
33,
35], the Infomap algorithm, proposed by Rosvall and Bergstrom [
46], includes the flow in the networks into account and is adopted for the analysis because of its strength in dealing with directed networks efficiently and accurately. This algorithm takes a network and denotes all nodes with unique binary codes. Then, a random walk is performed with edge weights as the probabilities that the walk traverses the edge. The aim is to minimize the total code length of the random walk by Huffman coding that uses a common code word prefix to describe a set of nodes within a significant structure and therefore shortens the code length for each node in the set. Essentially, the significant structures identified with minimum total code length are considered the optimal partitioning and the nodes with the same denoted prefix form a community entity. The minimization process follows an entropy based procedure. The criterion for the optimum solution is the minimized entropy sum of component level entropy and within component entropy.
This algorithm proceeds in a bottom-up agglomerative manner in that it firstly assigns each node to its own stand-alone component and then gradually combines them into larger components in the direction of entropy reduction. The process stops when no further decrease in entropy could be achieved and the resultant component division is considered optimal. Simulated annealing is applied in order to achieve global optimum in entropy reduction.
The Infomap algorithm is realized to extract the community structure in the conceptualized interaction-based networks and therefore identify the spatial division in urban space. Structures at different times are identified separately for the analysis in next steps that evaluates and quantifies their temporal dynamics.
4.3. Evaluating Properties and Quantifying Temporal Dynamics
After the identification of spatial divisions at different times, some critical properties of the conceptualized networks are evaluated and the temporal dynamics of the structure are quantified and demonstrated through geographical mapping.
Basic global network features are obtained and analyzed including network density, clustering coefficient, and degree/strength distribution. These features indicate the principle topologies of the urban spatial networks as well as their temporal variations. Following that, the salience of community structure, measured by the code length from the Infomap algorithm and the classical modularity by [
33], is presented at different times. It lays the groundwork for the subsequent analysis on the temporal dynamics of the spatial structure in detail.
The temporal dynamics of the spatial structure are elaborated on by firstly quantifying the degree and the form of variations through time and then mapping the spatial structure in geographical layouts and comparatively analyzing the layouts with the most prominent variations. The quantification of variations between any two structure compositions is achieved by measuring two indicators between any two partitioning results at two different hours, namely normalized mutual information and projection number. Normalized mutual information (NMI) is a common measure in information theory for the dependency of a random variable on another variable. It has been used to measure the similarity between clustering results or classifications in place of the traditional Rand Index [
47]. It has also been widely adopted in complex network analysis to compare the identified community structure with the ground truth [
48,
49,
50]. The NMI index for community structure comparison, as proposed by Danon et al. [
48], is as shown below.
Here, m and n stand for the number of communities identified in the two partitioning results, A and B, respectively. Nij is the number of items in community i of partitioning A that are also in community j of partitioning B. Ni and Nj, then, represent the total number of items in community i of partitioning A and the total number of items in community j of partitioning B, respectively, and N is the total number of items in the network. The value of NMI varies from 0 to 1 with 0 indicating total independency and 1 meaning identicalness.
The projection number or “split-join” distance, on the other hand, is proposed by van Dongen [
51]. Originally designed to compare different clustering results of a digital graph, the projection number of partitioning
A onto partitioning
B is as defined below.
Here, a and b are the members of any subset based on A and B respectively. denotes the number of common members (overlap) in both a and b. Note that, according to Equation (2) above, the summation loops through A and the maximum overlap finding loops through B when calculating the projection number of A onto B. It means that the projection number is, in contrast to NMI, directed in the sense that the projection number of A onto B does not necessarily equal to that of B onto A. The directionality of this measure facilitates the identification of both the magnitude and form of the variation. The latter-termed “split-join” distance, then, is defined as n-pA (B), where n is the total number of elements in the overall set. Given A and B, smaller the n-pA (B), the more likely that A is a sub-partitioning (partitioning to a finer scale) of B. If distances in both directions (A onto B and B onto A) are small, then the two partitioning results are likely to be identical. The value of “split-join” distance varies from 0 to n − 1.
Besides the pairwise comparisons, the successive variations in chronological order are calculated to represent the sequential pattern of the identified interaction-based spatial structure. For the symmetric NMI, the “sub-diagonal” array above or below the main diagonal represents the chronological variations. For the directed “split-join” distance, the two sub-diagonal arrays are different due to asymmetry so the difference values between the two demonstrate the successive temporal variation. In this case, the “split-join” distance from the partition at a former hour to that at the immediate next hour is the subtrahend while the “split-join” distance at the opposite direction is the minuend, as shown in the equation below.
Here, i denotes an hour of the day and is the projection number of partitioning at hour i onto partitioning at hour j. n is the total number of spatial units and h is the total hours of day (i.e., total number of divisions). Therefore, a positive value indicates an agglomerative variation and a negative value suggest a divisive process. Values close to zero then indicate insignificant changes.
The pairwise similarity between the identified spatial structures at any two hours is calculated based on both NMI and “split-join” distance and the sequential variation along the course of time is typically focused on. Based on these measures, times with the most prominent variations could be identified as well as the forms of variation. The identified variable structures are then demonstrated and mapped for further interpretation.
5. Results and Findings
In this section, results from the analysis using one-day mobile phone data and applying the procedure described above are presented in detail. Basic network statistics are presented first and the overall spatial structure using the totality of data as a whole is demonstrated and compared with the administrative zoning and officially planned functional clusters in
Figure 1. Dynamics over the course of the day are then displayed in terms of the salience and variation of structure. Hours with the most visually prominent fluctuations are identified and structures around these hours are mapped and illustrated graphically in order to interpret the underlying implications. Finally, the similar process is conducted using the same data and algorithms but in a different spatial unit to inspect the effect of MAUP.
5.1. Basic Statistics and Overall Spatial Structure
As mentioned in a previous section, a total of 23,474,337 movement traces are constructed to form the conceptualized networks at TAZ level. The mean distance of movement, defined as the geodesic distance between recorded cell towers, is around 3.9 km. The temporal distribution of movements at hourly interval is as shown in
Figure 3a. It shows a typical two-peak trend that emerges usually on weekdays.
Figure 3b shows the temporal distribution of two major global network properties, i.e., network density (in blue) and clustering coefficient (in red). They both show a high level of resemblance to the distribution of movements as the increase in movement volume indicates more interactions (more connected edges or larger edge weights), which leads to denser networks.
Firstly, the whole-day aggregated network constructed from the totality of movement dataset is analyzed in terms of its community structure. The result is then mapped back onto geographical space and is as shown in
Figure 4. Here, different components are colored differently and the boundaries in black are administrative divisions at district level. Hollow areas are unclassified units, most of which are natural reserves, hilly areas, or water reservoirs. As shown in this figure and also referring to
Figure 1b, several distinct features emerge in terms of the difference between the interaction-based and planned structures.
First of all, a certain level of expansion is detected in the central urban areas. Originally, the central functional cluster is planned to contain exactly the two central districts, Futian and Luohu, with administrative boundaries as separators. The interaction-based component in central areas, however, expands significantly to the west into the Nanshan territory where a large number of high-tech headquarters and hence new jobs are located. As for the Nanshan area, the original planned cluster is the exact and total district region while the interaction-based structure in this region shows a clear separation roughly in the middle. The southern part, near the Shenzhen Bay, is home to many high-tech enterprises. The northern part, on the other hand, is less populated and is occupied by a few manufacturers and a satellite campus for universities and research institutes. In addition, components in the western districts, namely Bao’an and Guangming, are largely fragmented. Many major manufacturing campuses are located in these districts and many of their employers are provided with accommodation in the nearby company apartments which significantly reduces their needs to travel to faraway places. Components in the east part of the city, on the contrary, are largely consistent with the administrative division and planned clustering. Areas on the eastern Dapeng Peninsula are much less populated than urban regions and western suburbs and are mostly consisted of ecological conservation spots and natural tourism resources.
All in all, the identified structure based on the interaction-based network could reflect the characteristics in functioning and general development schemes of the corresponding geographical areas at district level. Various urban regions show distinct scopes and/or organizations of components that match the current general functionality of the occupied lands. The diurnal dynamics, however, are not reflected in the overall structure and they are explored in the next subsection.
5.2. Temporal Dynamics of Interaction-Based Structure
The temporal dynamics of the identified structures are presented in this subsection. A total of 23 networks at different hours of the day (except for the last one) are constructed and analyzed. Their network properties (as shown in
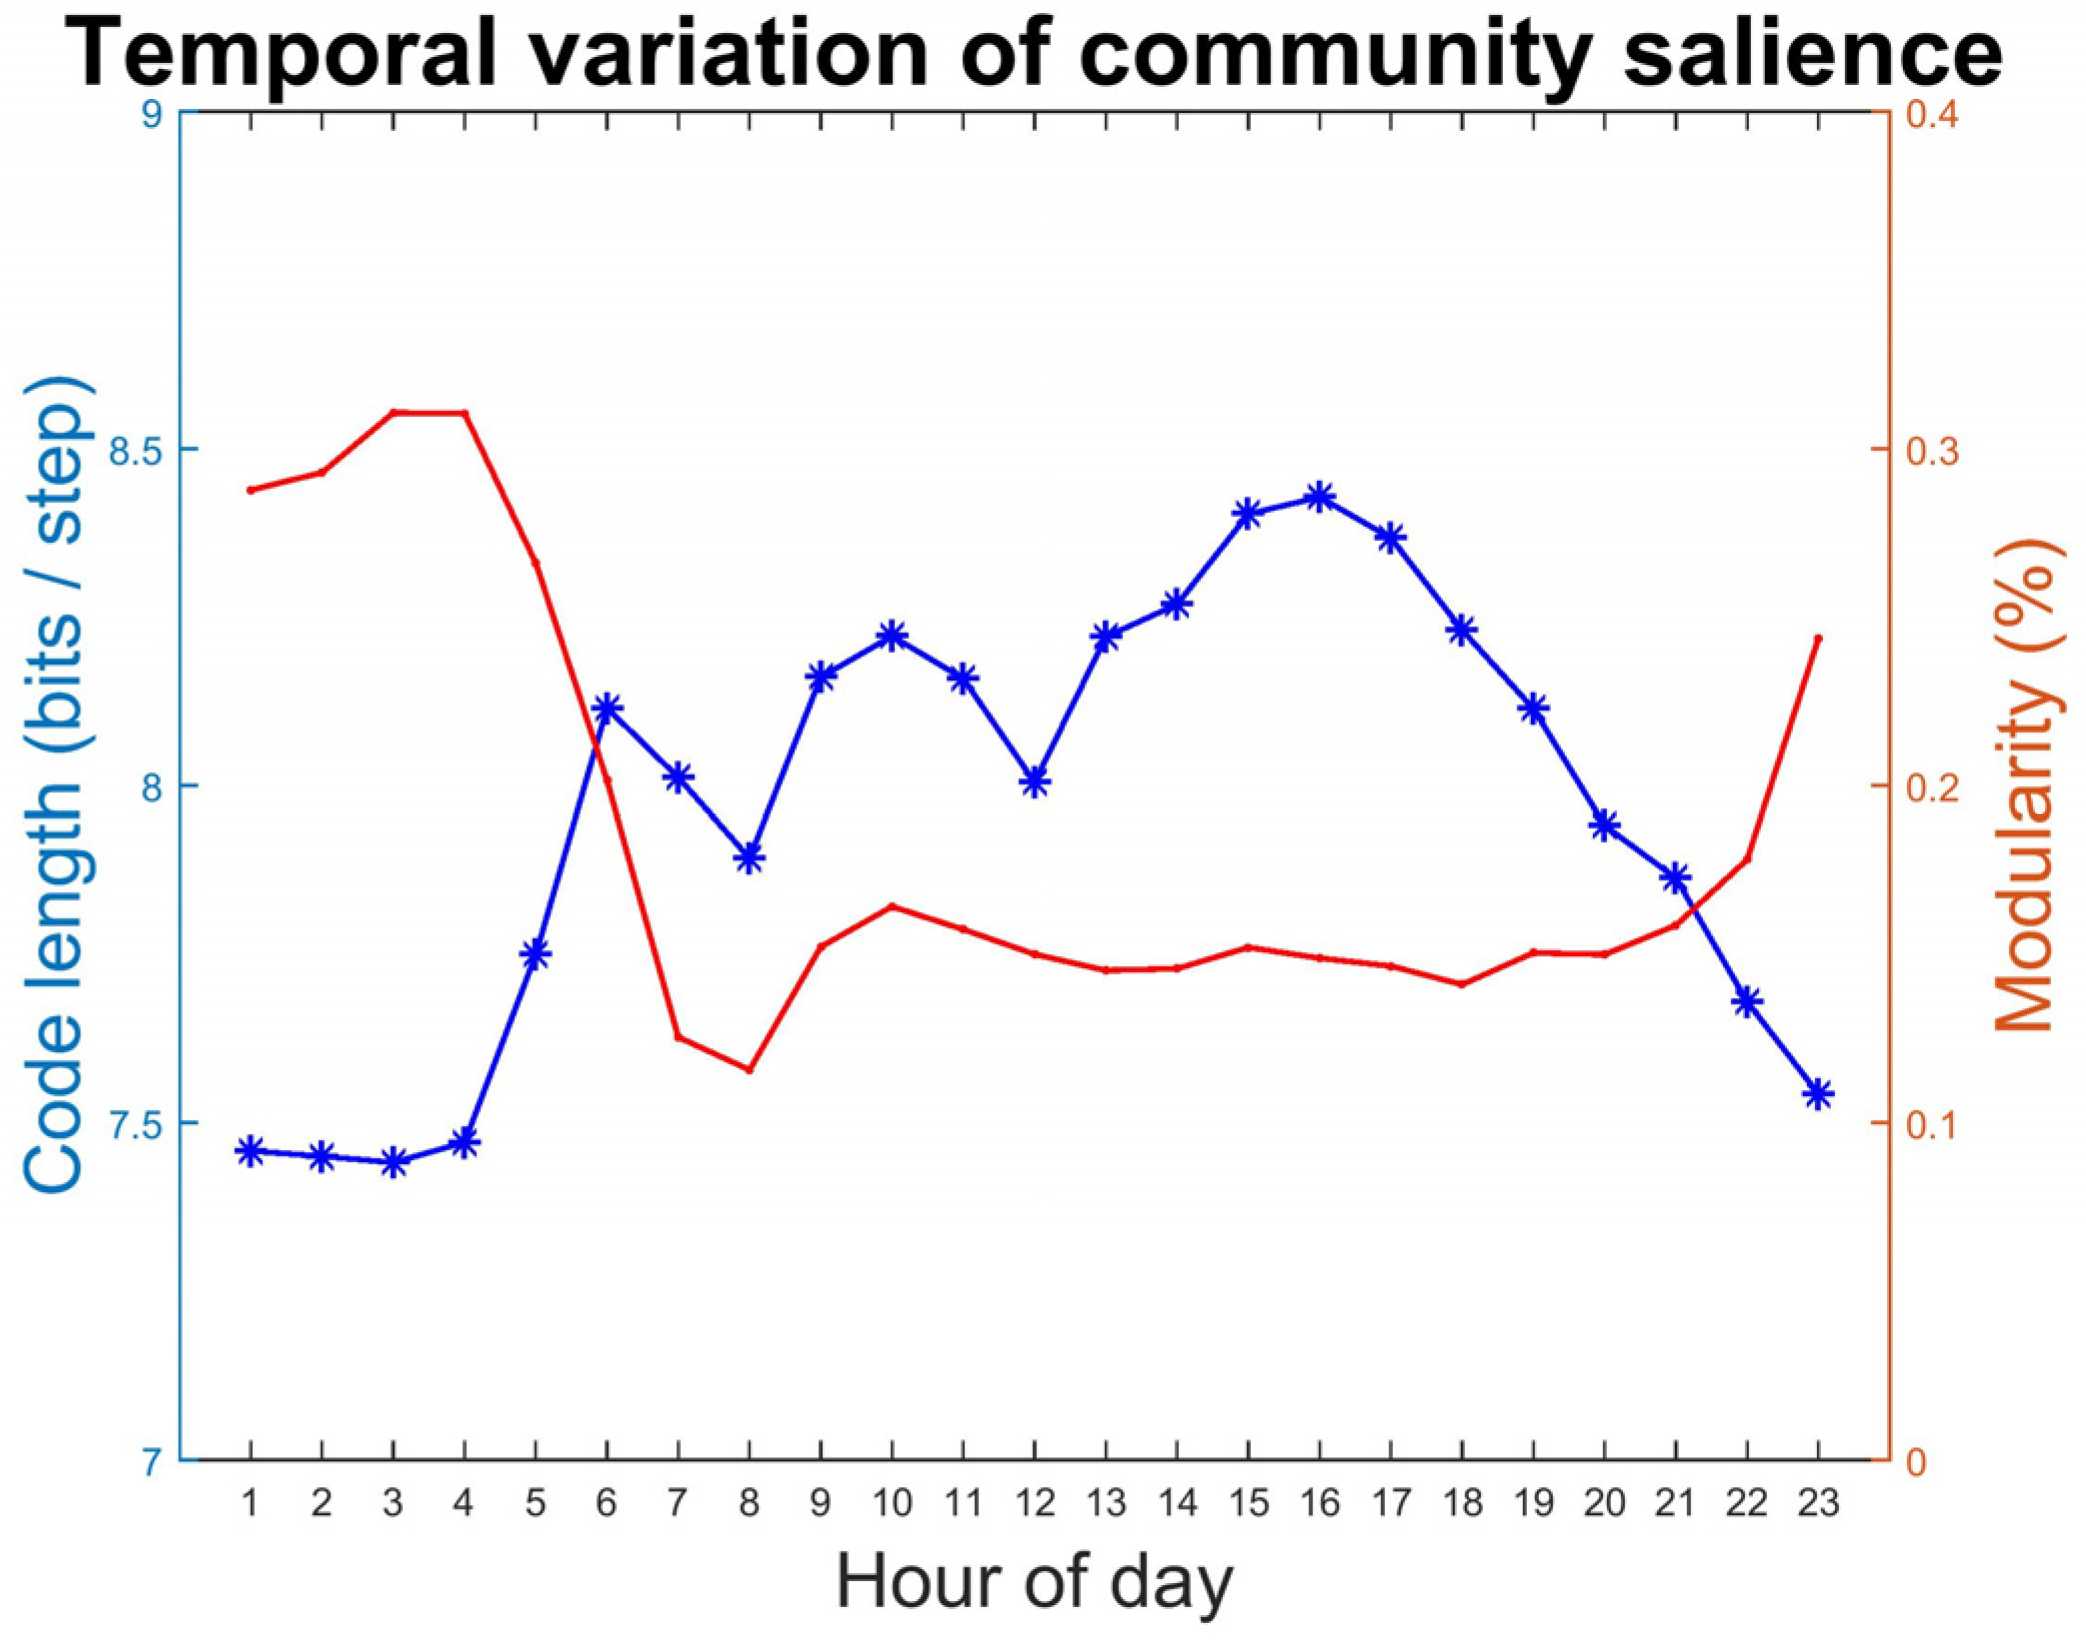
Figure 3b above) are obtained as well as the salience of the community structure. The temporal variation of the saliences is as shown in
Figure 5. The curve in blue represents code length from Infomap while the red curve represents classical modularity. The two indicators are significantly and negatively correlated with a correlation coefficient of −0.82 and a p-value that is much smaller than 0.01. It is clear that code length/modularity reaches minimum/maximum during early morning, indicating the community division is the most salient during these hours. Given that the total amount of movements is relatively low and most of the trips made in early morning are short-distance, it is reasonable that a series of unit nodes are (comparatively) closely connected with many few outside interactions. In the daytime, on the other hand, the cold length/modularity is larger/smaller, indicating a weaker community structure and a higher degree of connectivity throughout the whole network (urban space).
The component compositions at different hours are all mapped onto geographical space and demonstrated for visual inspection. The complete list of maps is not included in the main text due to space limit and instead is appended to the
Appendix A (
Figure A1). To quantify the variations through time, the two measures described in
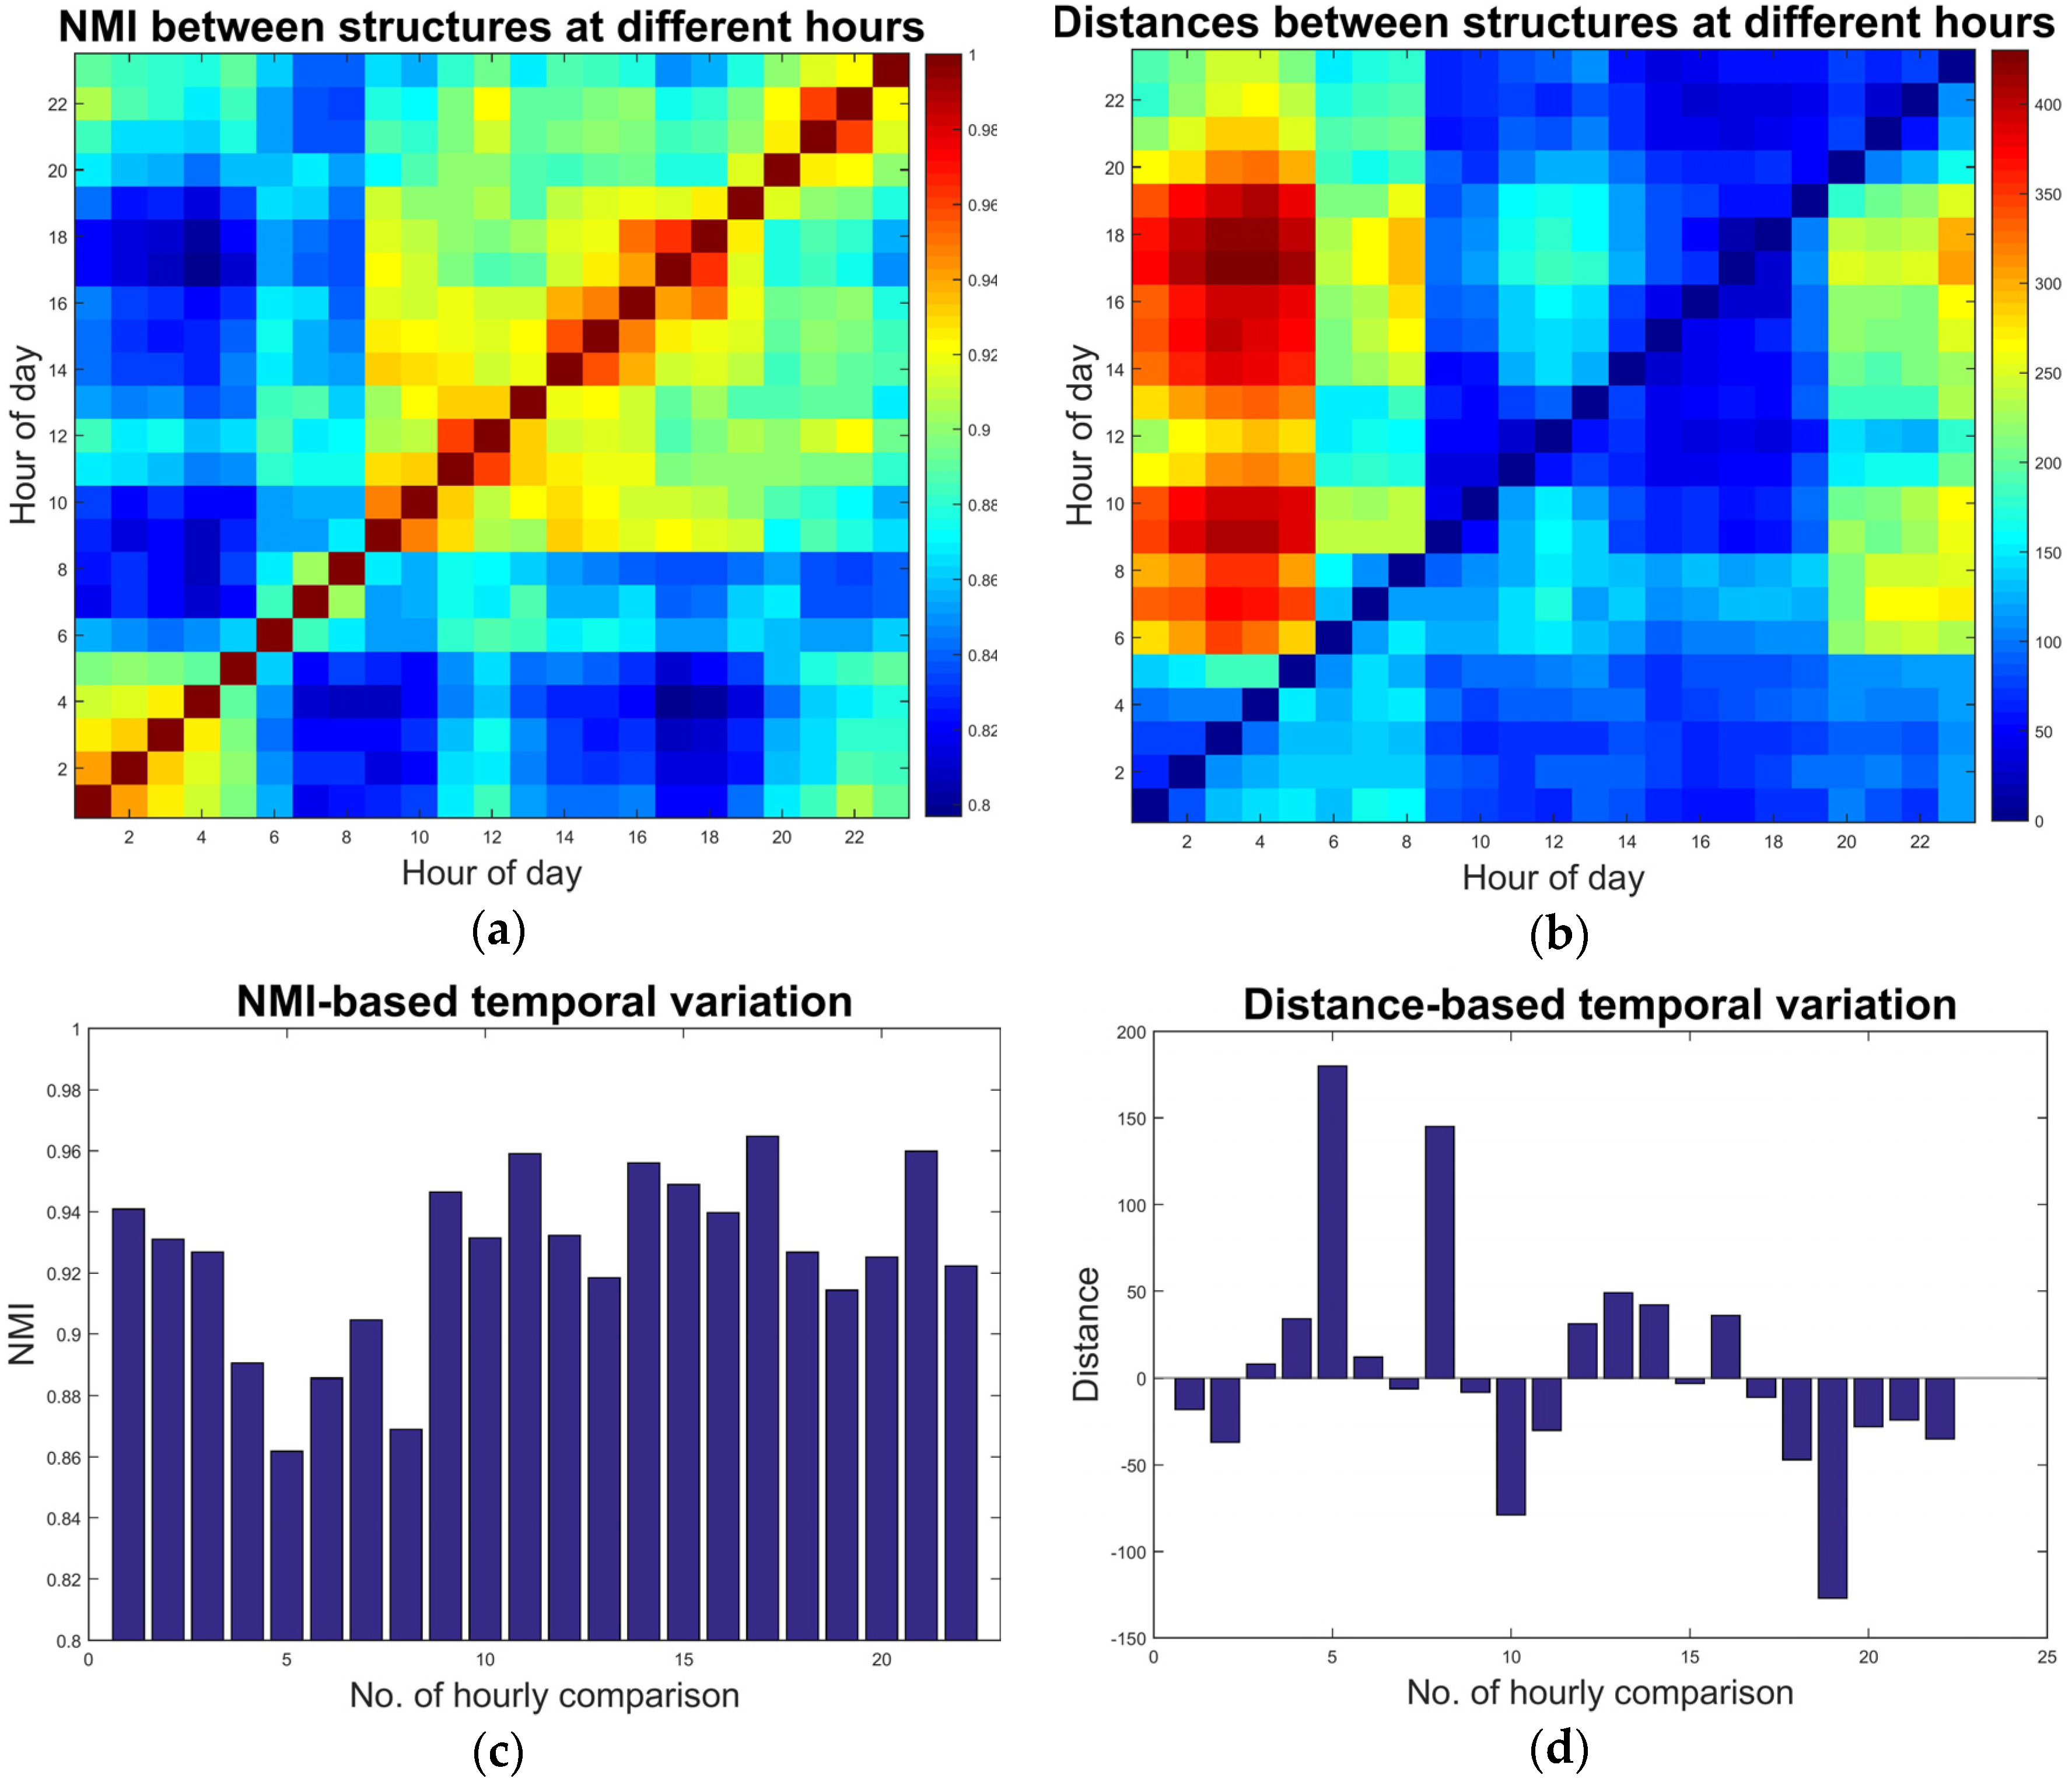
Section 4.3, i.e., NMI and distance, are calculated for every pair of partitions at any two hours. The results are two 23-by-23 matrices, plotted as heat maps in
Figure 6a,b. In any of the two matrices, the row/column number represents the partitioning at a given hour (chronological order from left/bottom to right/top) and the entry is the (dis)similarity between the two partitions. In both plots, warm colors indicate large values while cool colors denote small values.
According to
Figure 6a, the structures during early morning hours (before 6:00 a.m.) are significantly different from those at later hours (note the blue blocks at the left and bottom parts), although the similarity by NMI between any two hours is generally high (minimum around 0.8). It is reasonable that the interaction-based urban structure would not undergo earthshaking alterations since it is still partly constrained by zoning and planning schemes. The directed distance measure, as shown in
Figure 6b, gives a slightly different image. The discrepancy emerges also between early-morning hours and later daytimes but the figure shows more details on how they are different. Distances from partitions at early hours to those at later hours are small (blue blocks at the middle-to-right bottom) while distances are large at the opposite direction (red regions on the left side). It indicates, according to the definition of the distance measure, partitions at early-morning hours are sub-partitions of those at later hours. In a spatial term, the structures at early morning hours are more fragmented compared to those during daytimes. As mentioned above, the maps of the structures at early hours could be found in
Figure A1 along with maps at other hours.
Figure 6c,d illustrates the successive temporal variations based on NMI and distance respectively. Note that, since NMI measures similarity while the distance measures dissimilarity, significant NMI-based variations (
Figure 6c) are presented by graphical valleys or local minimums and prominent distance-based variations (
Figure 6d) are shown as peaks (both positively and negatively). From
Figure 6c, it is clear that the most significant variation took place at the 5th (4:00–5:00 a.m. vs. 5:00–6:00 a.m.) and 8th (7:00–8:00 a.m. vs. 8:00–9:00 a.m.) hourly comparison. The first time period is the one before morning peak and the latter one is around and during the peak hour. Another valley appears at hours after evening peak (19th, 6:00–7:00 p.m. vs. 7:00–8:00 p.m.), though not as prominent.
Figure 6d presents a clearer picture as to the form of temporal variations. Two visible positive peaks appear at the very same spots that are significant in
Figure 6c. On top of the spotted prominence of the variation, the positivity indicates that the community structure underwent aggregative changes during these hours. In other words, some fragmented and smaller (amount of spatial unit members) components merged into larger ones during these hours because of changes in the distribution of movements/interactions. A significant negative peak emerges for the 19th pair after the evening peak hour. It indicates a segmenting process where previously larger components split into several ones, possibly due to the localization or confinement of movements.
In this subsection, the temporal characteristics of the interaction-based urban structure are explored and demonstrated through a series of measures for temporal variations. Notable changes are identified at pre-/post-peak hours and the manner of variation, both in terms of direction and magnitude, is quantified and visualized via graphs. In the following subsection, cases where these prominent changes take place are emphasized on with spatial mapping for further interpretation.
5.3. Peak-Hour Variations
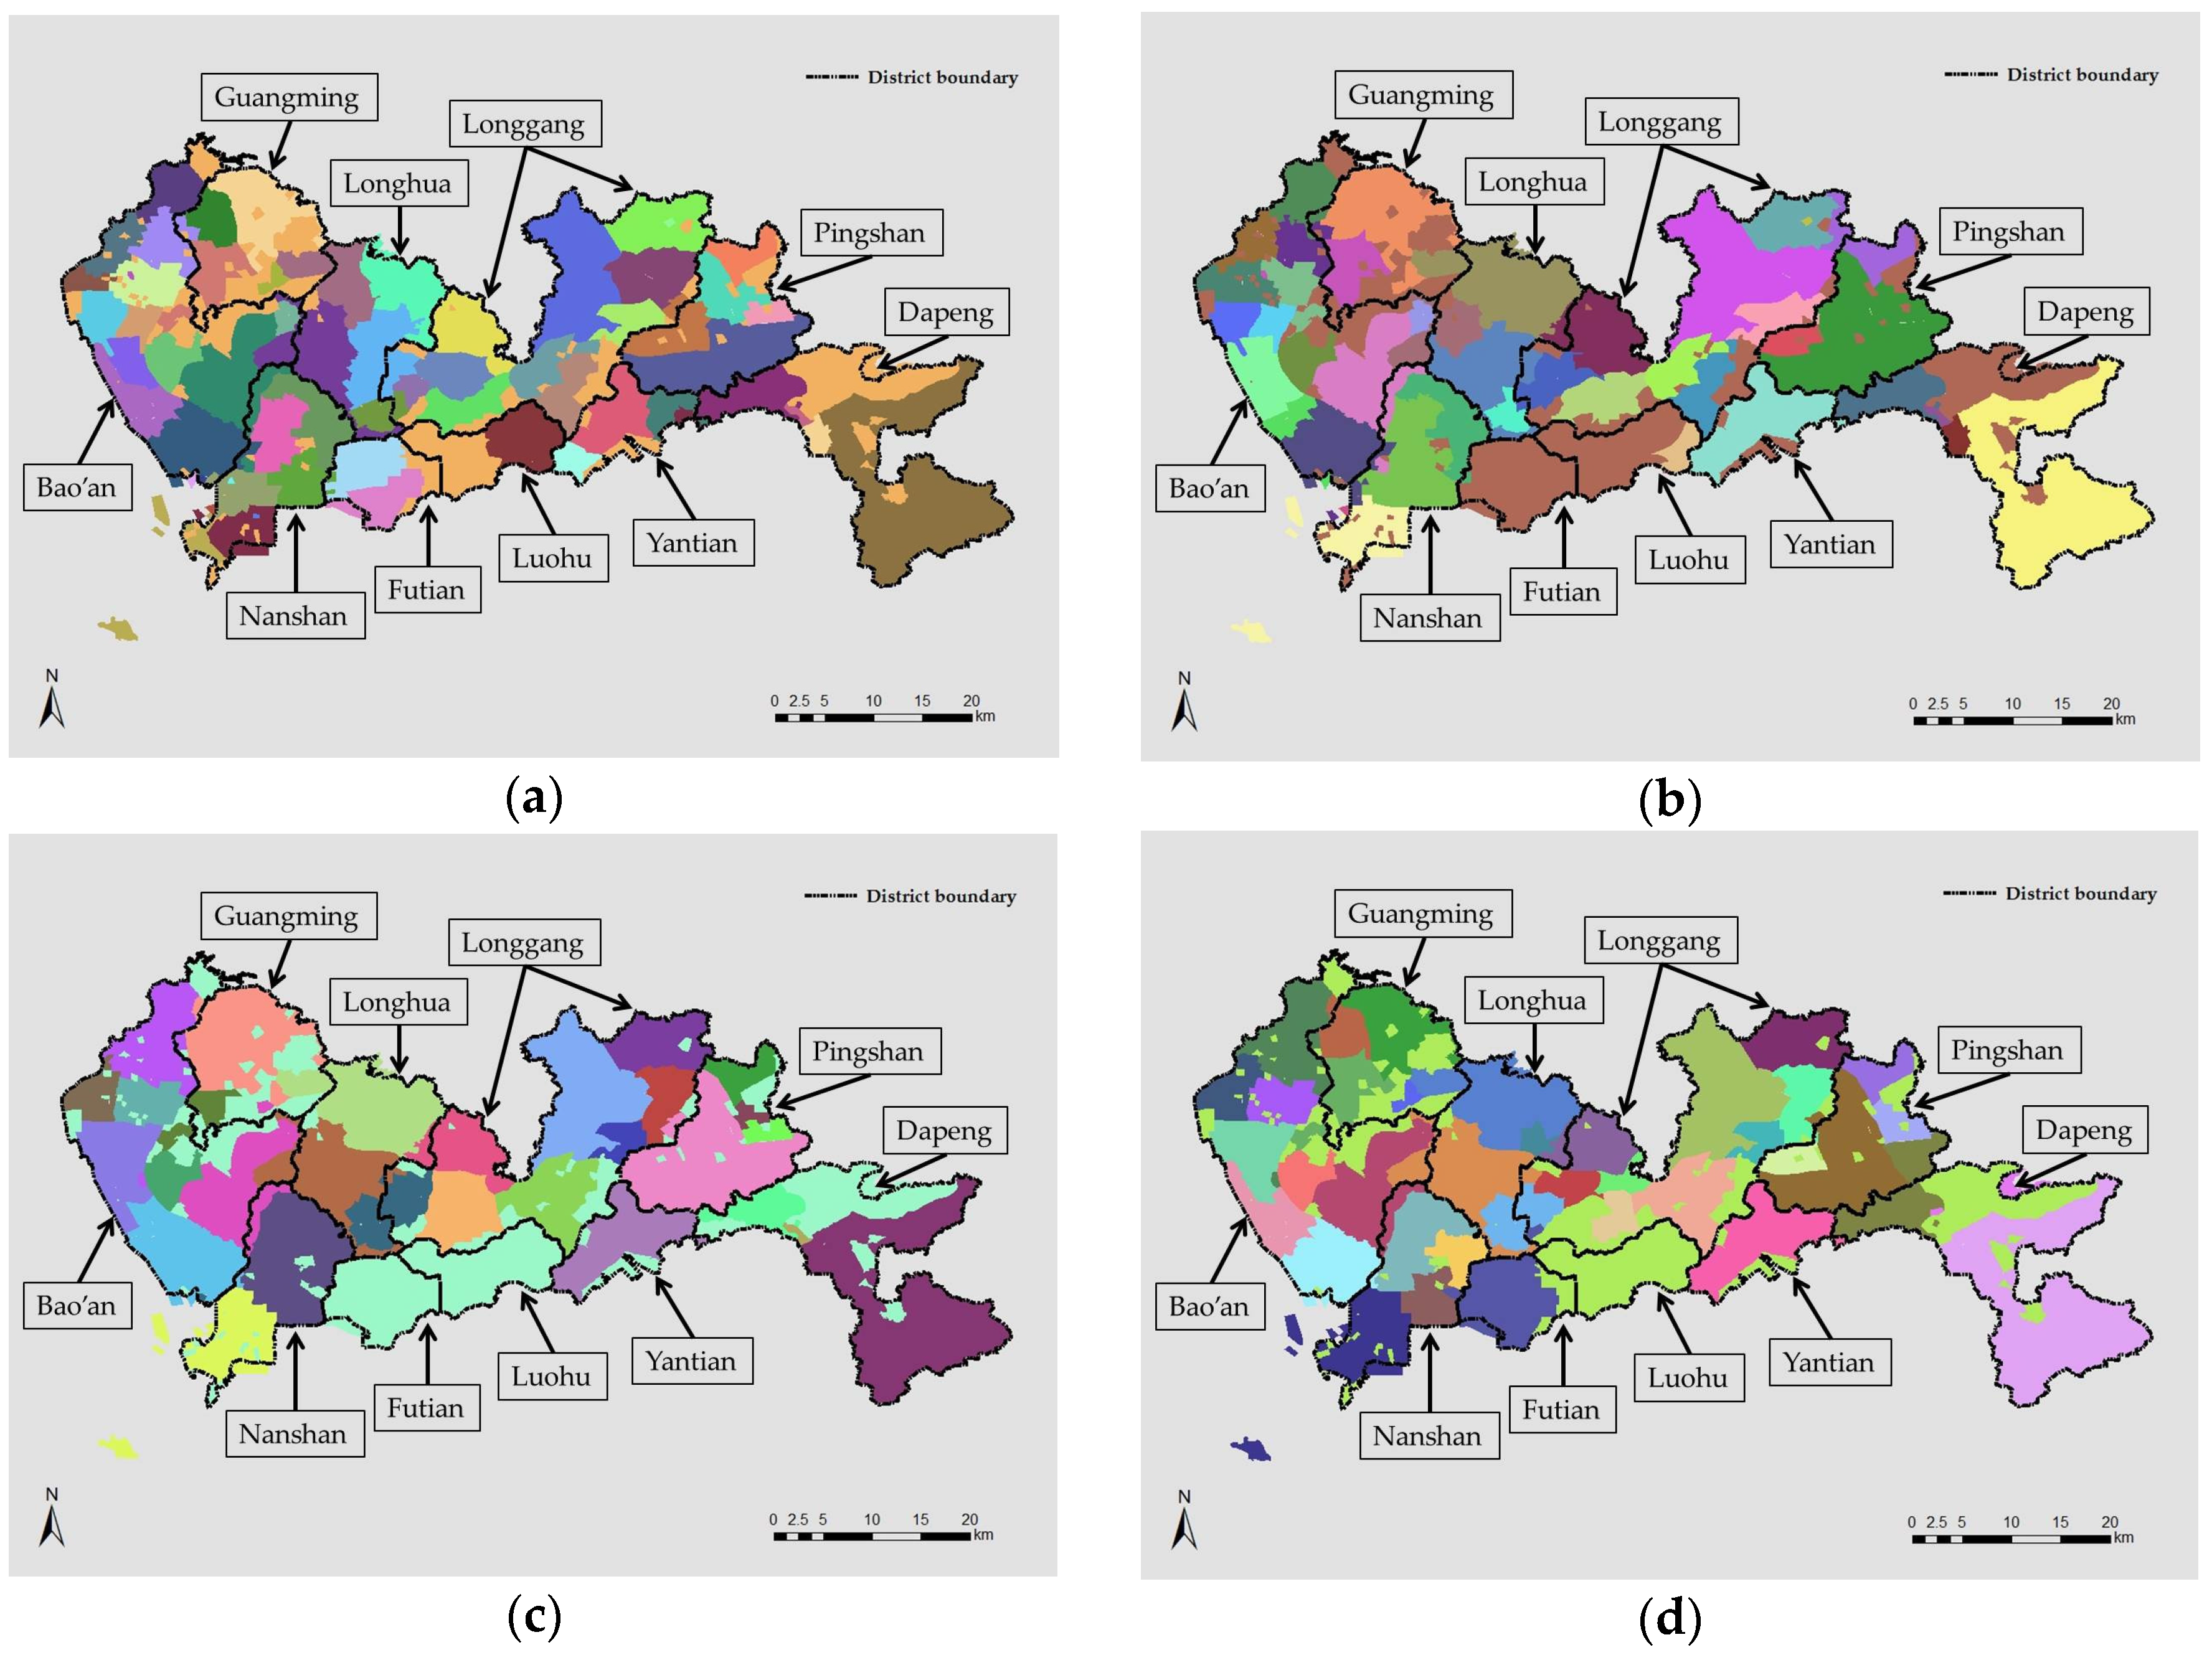
Results from the last subsection suggest the presence of prominent variations before/after morning/evening peak hours as well as during the morning peak. The nature of the variations is also explored and, in this part, the spatial layouts of components at corresponding hours are demonstrated to provide a detailed picture spatially on where did the variation take place, as shown in
Figure 7 below.
The first case is the agglomerative variation at pre-morning peak hours (from 4:00–5:00 a.m. to 5:00–6:00 a.m.) and the maps of the spatial community structure are as comparatively illustrated in
Figure 7a,b. According to the figures, prominent agglomerations occurred mostly at central urban areas, namely Futian, Luohu, and Nanshan. These are all urban districts with dense population and a large number of jobs. The expansion and agglomeration of interaction-based communities indicate the forthcoming peak hours of commuting where people begin to move to locations beyond the neighboring regions of homes. Communities in Bao’an, Guangming, and Longhua are, on the other hand, basically unchanged during this period (they are relatively static throughout the day, see
Figure A1 in
Appendix A). As described in
Section 5.1, the job–housing distance in these districts is generally short with on-campus living quarters for manufacturing employees. Components in the area of Longgang district were agglomerated, but to a lesser degree than central urban components did. The structure on the Dapeng Peninsula basically remained unchanged and stable.
On the contrary, the variation at post-evening peak hours (from 6:00–7:00 p.m. to 7:00–8:00 p.m.) is a divisive process, as shown in
Figure 7c,d. Again, noticeable split occurred in central urban areas where the agglomeration took place in
Figure 7a,b. More specifically, the large community component covering both Luohu and Futian, which was formed during 5:00–6:00 a.m. (
Figure 7b) and maintained its territory throughout the timespan (see
Figure A1 in
Appendix A) until 6:00–7:00 p.m. (
Figure 7c), broke up into two separate components, each covering roughly the area of one district. Similar divisions arose in Nashan, Guangming New District, as well as the part of Longgang that is near downtown districts. Structure in Dapeng, Yantian, and the majority of Bao’an remained relatively stable as they did at earlier hours.
The two illustrated cases depict how spatial interactions change before/after peak hours of a typical weekday. The interaction-based structure changes through the day with a few key periods of significant variation. At the end of the early morning and before morning peak hours, the previously fragmented structure starts to merge and components with larger sizes are formed from the agglomeration of smaller ones. This structure maintains relatively stable for most of the working hours until it collapses into a more scattered form after the evening peak and remains stable again till the end of the day. Such variability trends indicate that changes in travel characteristics and movement patterns of individuals greatly influence the interaction-based structure. Nighttime/early morning movements and trips tend to be shorter and constrained within a tighter area while peak-hour movements, among which commuting takes up a dominant proportion, could be in a range of distance. Collectively, these movements define how the spatial structure is shaped at different times of the day and in these cases, a significant agglomeration marks the emergence of longer commuting before morning peaks while a prominent division gives a hint of the end of a busy working day after evening peaks. In terms of the locations of significant variations, central urban areas are where components have greater variability and account for the overall variation the most. Suburban regions and manufacturing centers are less variable compared to urban centers. Coastline areas with tourist scenery and a sparse population density are the most stable regions by interaction-based structure. The results provide a typical scenario of the different characters in the city: vibrant urban centers with strong, constantly changing, and cross-boundary connections of people and items; stable suburban areas with manufacturing and industrial campuses with fragmented spatial divisions; and static outer-ring peripheries with agglomerated structure that has very little variations. These results demonstrate how the features in land-use planning and functional zoning affect movement patterns in different areas and how this difference in movements influence the urban structure based on spatial interaction.
5.4. Results in Different Spatial Units Compared
Due to the fact that individual movement traces were aggregated to a certain geographical unit (TAZ in this study) in order for a meaningful exploration, inevitable concerns would be raised on the potential effect of the Modifiable Areal Unit Problem (MAUP) [
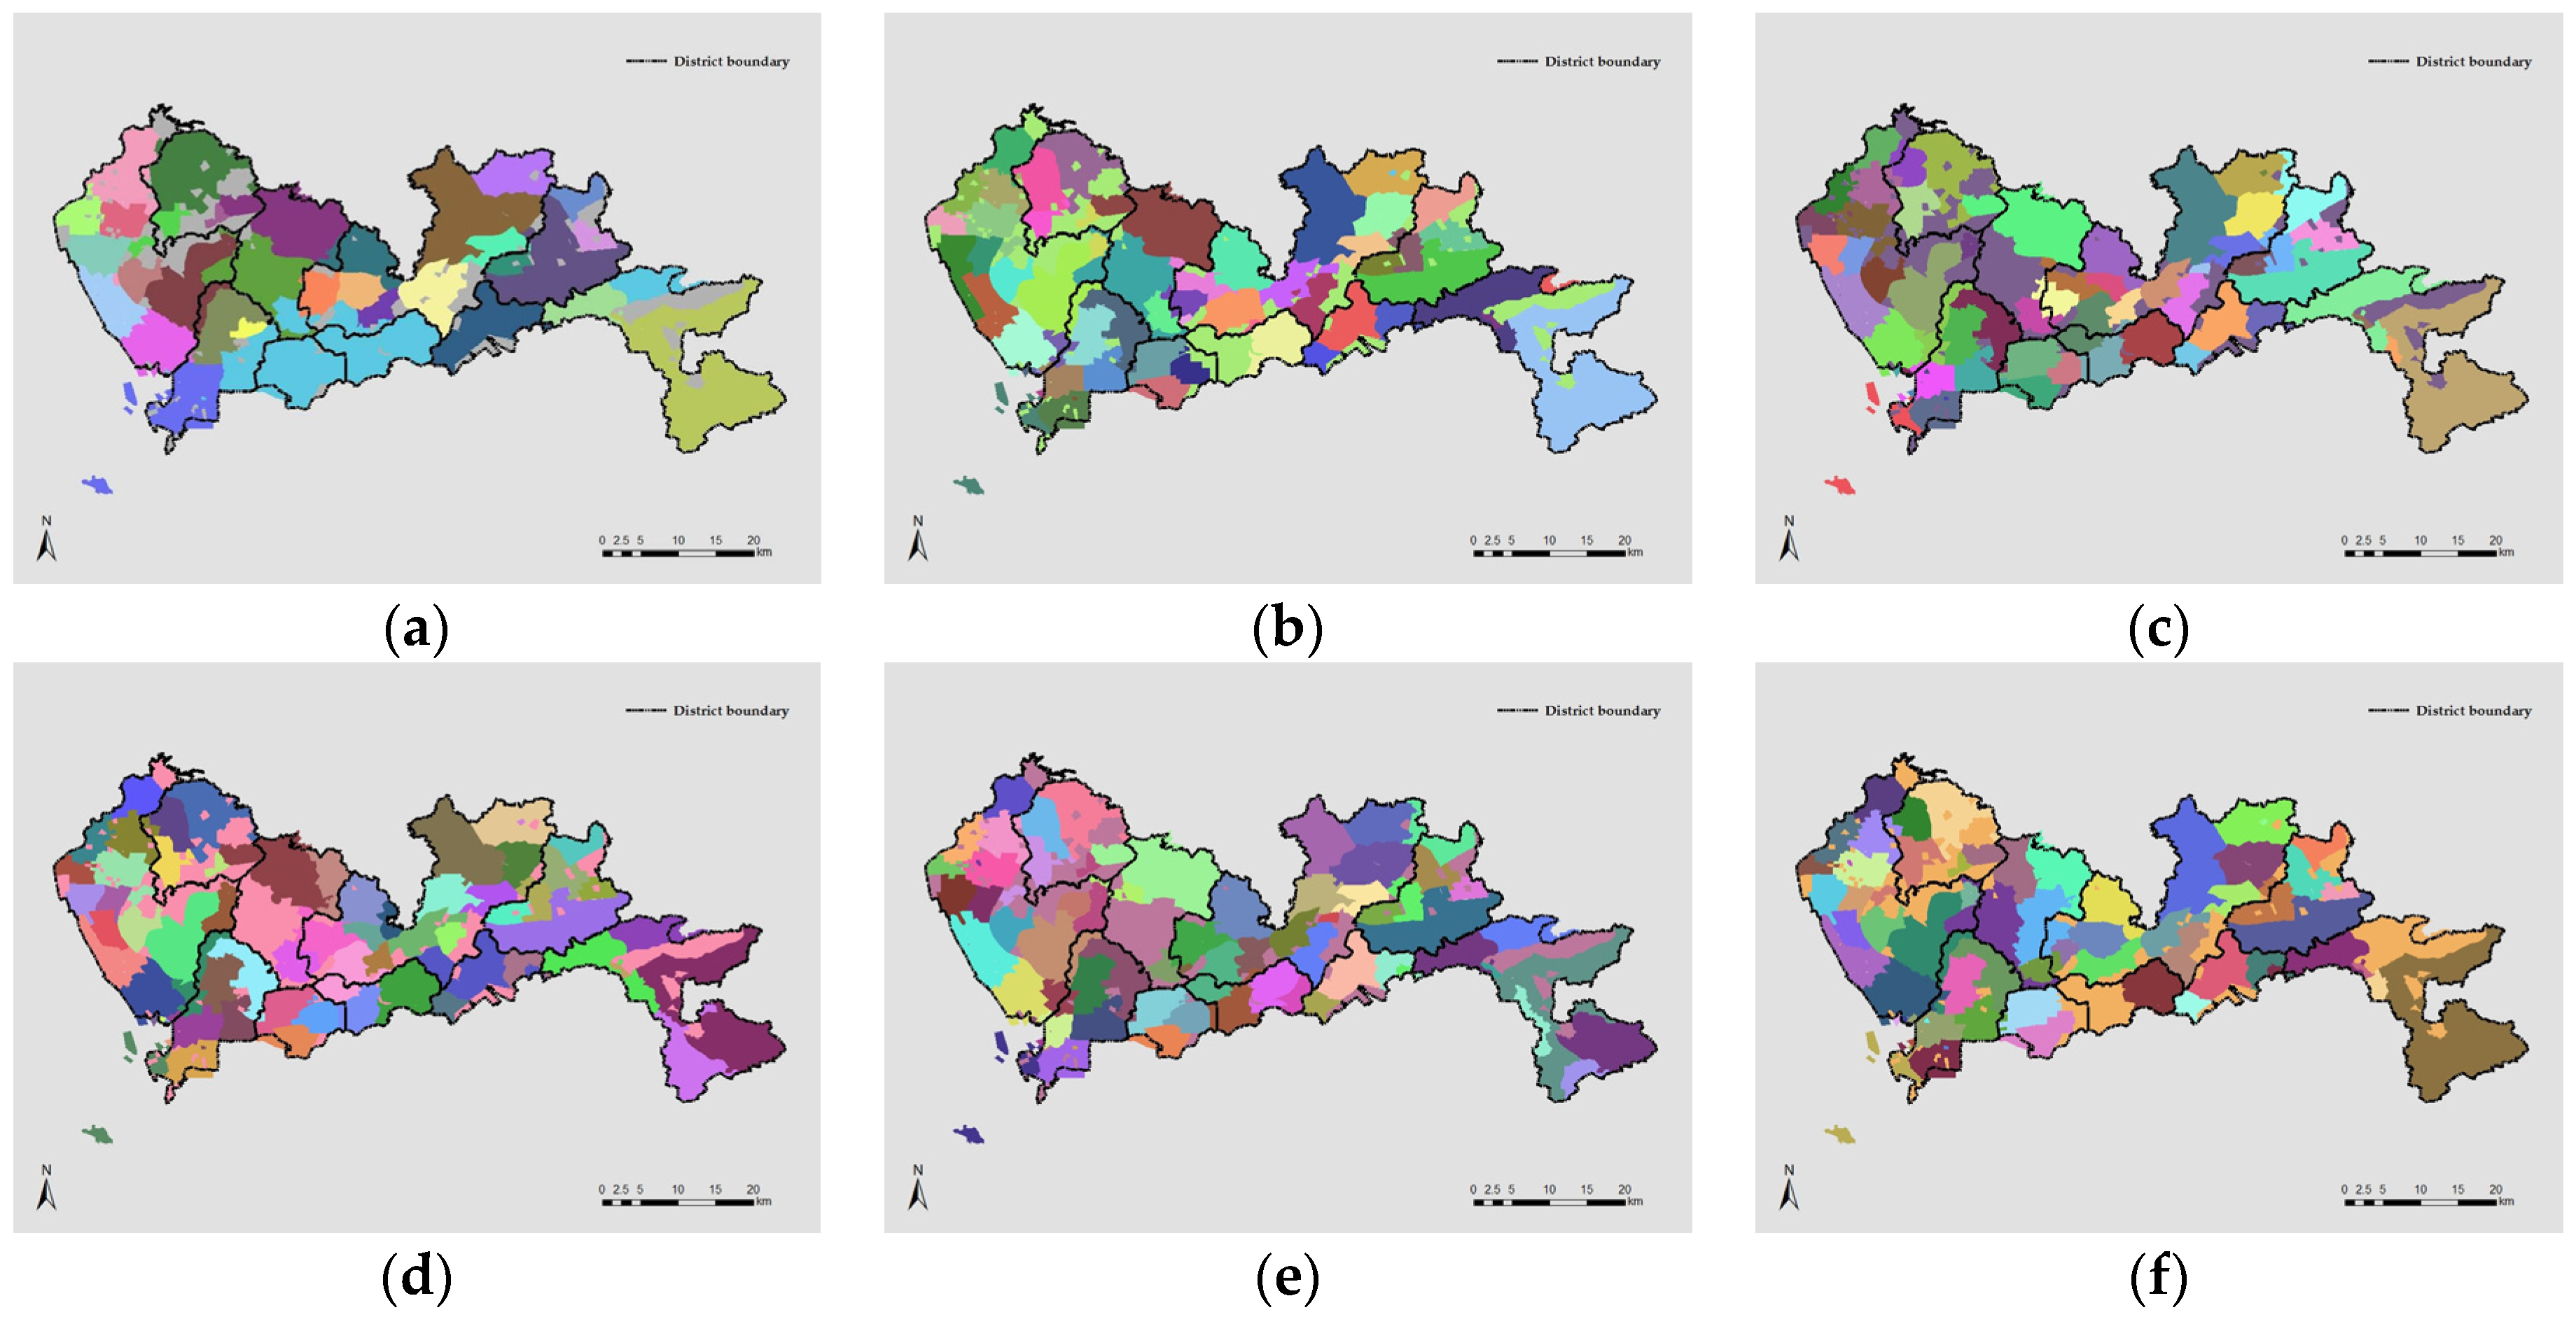
42]. To address this issue by evaluating the difference in results using different spatial unit to construct the conceptualized networks, two different units are selected and the resultant networks underwent the exact same process for identifying interaction-based structure as well as its temporal variations. The first unit used is the 1 km-by-1 km grids while the other one is the at the most disaggregated level, i.e., the cell towers themselves. The grid based aggregation resulted in a total of 1204 units while there were, as mentioned previously, 5908 cell towers in Shenzhen.
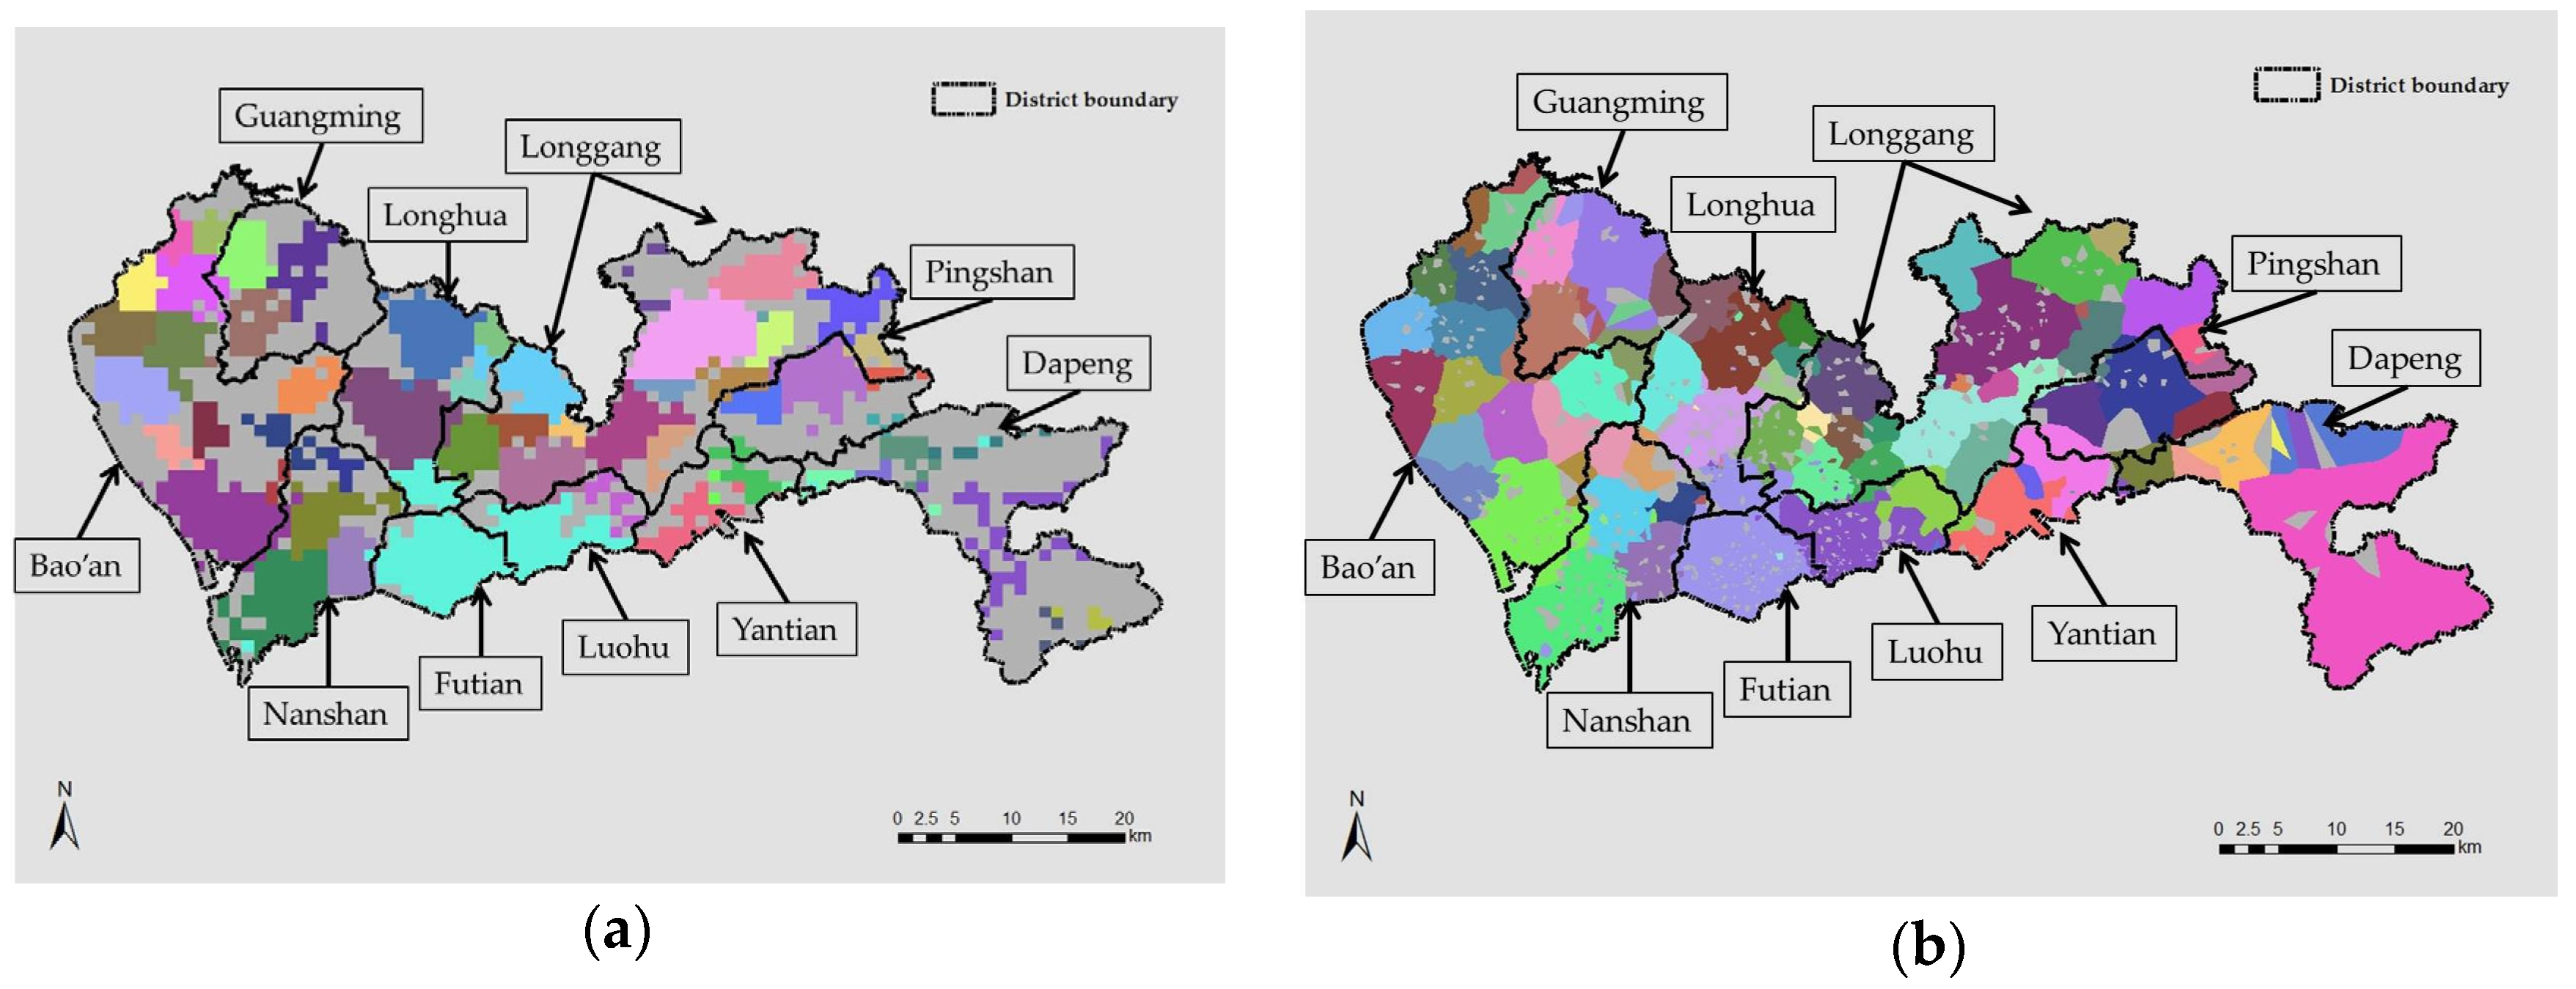
Figure 8 below presents the identified overall spatial structure under the two spatial units. For mapping purposes, results by cell towers (
Figure 8b) are mapped using their Thiessen polygons.
From
Figure 8a and referring to
Figure 4, it is clear that the structure partitioning schemes using grid unit and TAZ aggregations are, to a large extent, consistent with each other. Similarity typically emerges in central urban areas as well as the western suburbs. There are notably more unclassified units (in blank) in the eastern suburbs (typically on the Dapeng Peninsula) in the structure identified with grid unit than that with TAZ unit. Since this area is sparsely populated, TAZs in this region are generally larger in size while grids are in a uniformed size, resulting in more unpopulated units. From
Figure 8b and also referring to
Figure 4, it is shown that the structure using disaggregated tower unit is more fragmented to a certain degree. The most notable difference appears at the downtown areas. With TAZ (and grid) aggregation, the two central districts, Luohu and Futian, jointly formed a component while two components could be identified using cell tower unit, with a dividing border largely resembling the administrative boundary lines.
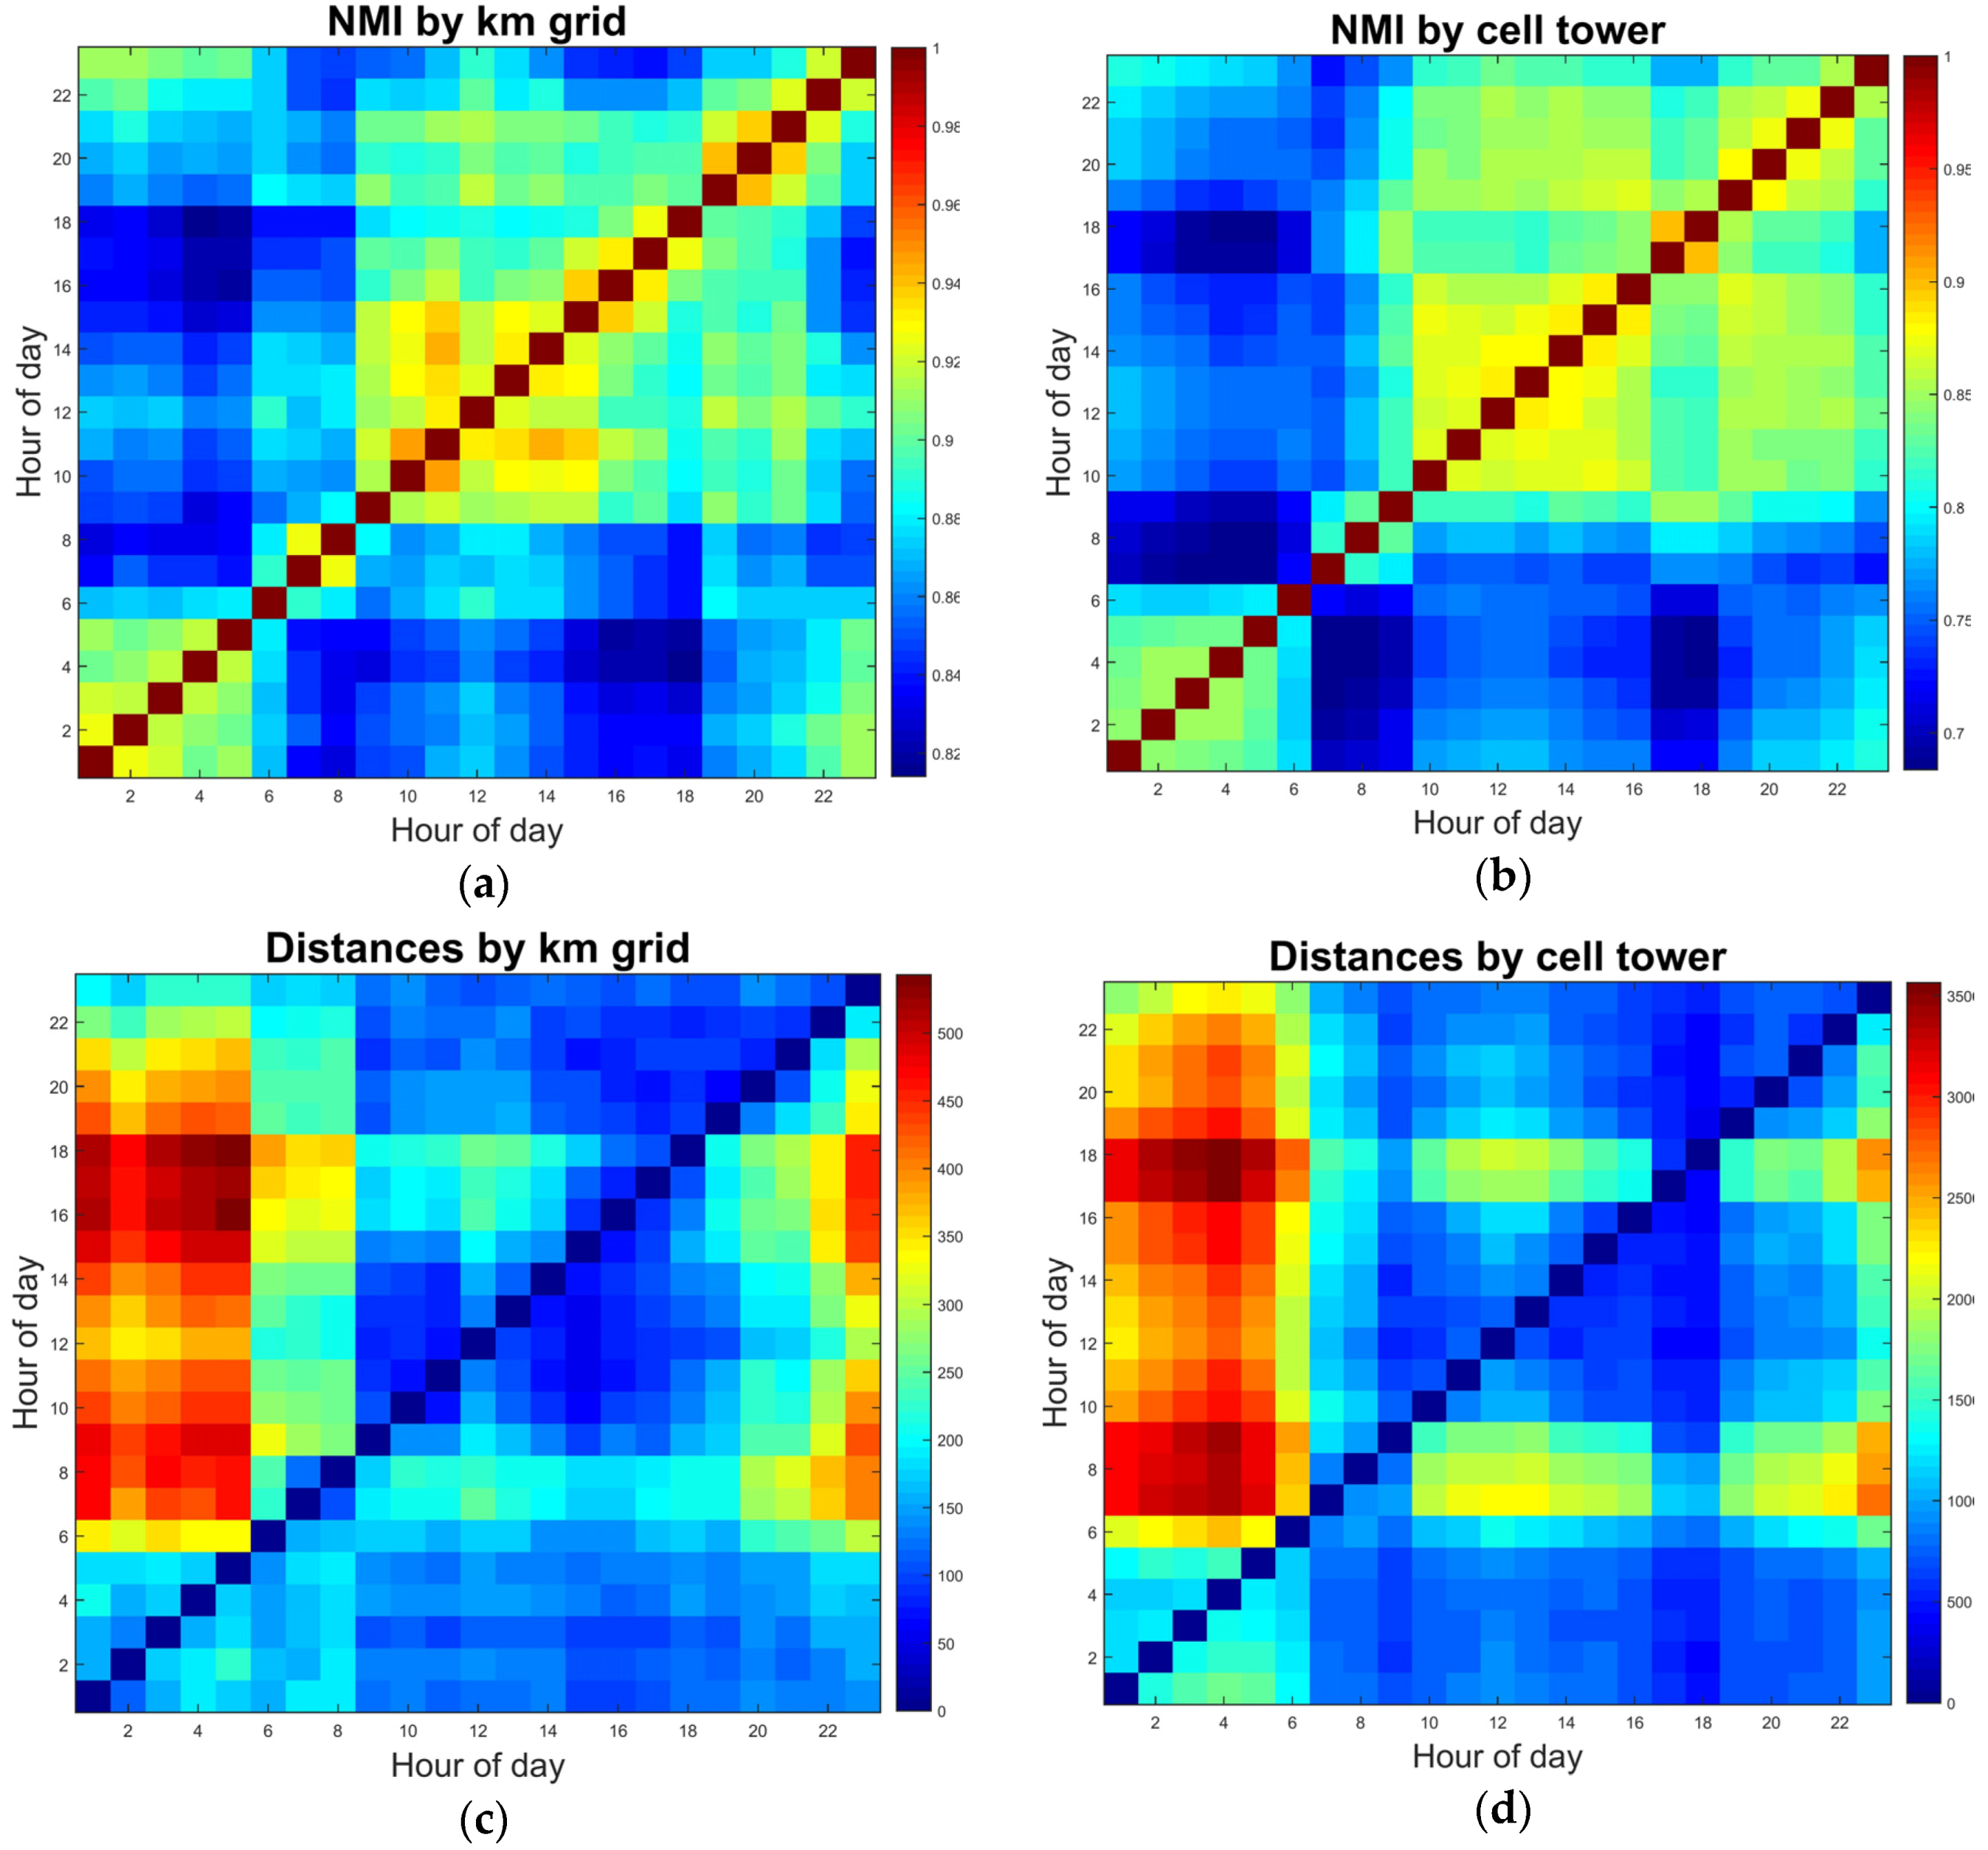
In terms of the temporal variation, on the other hand, the consistency among different schemes is quite high, as shown in
Figure 9 and
Figure 10 below.
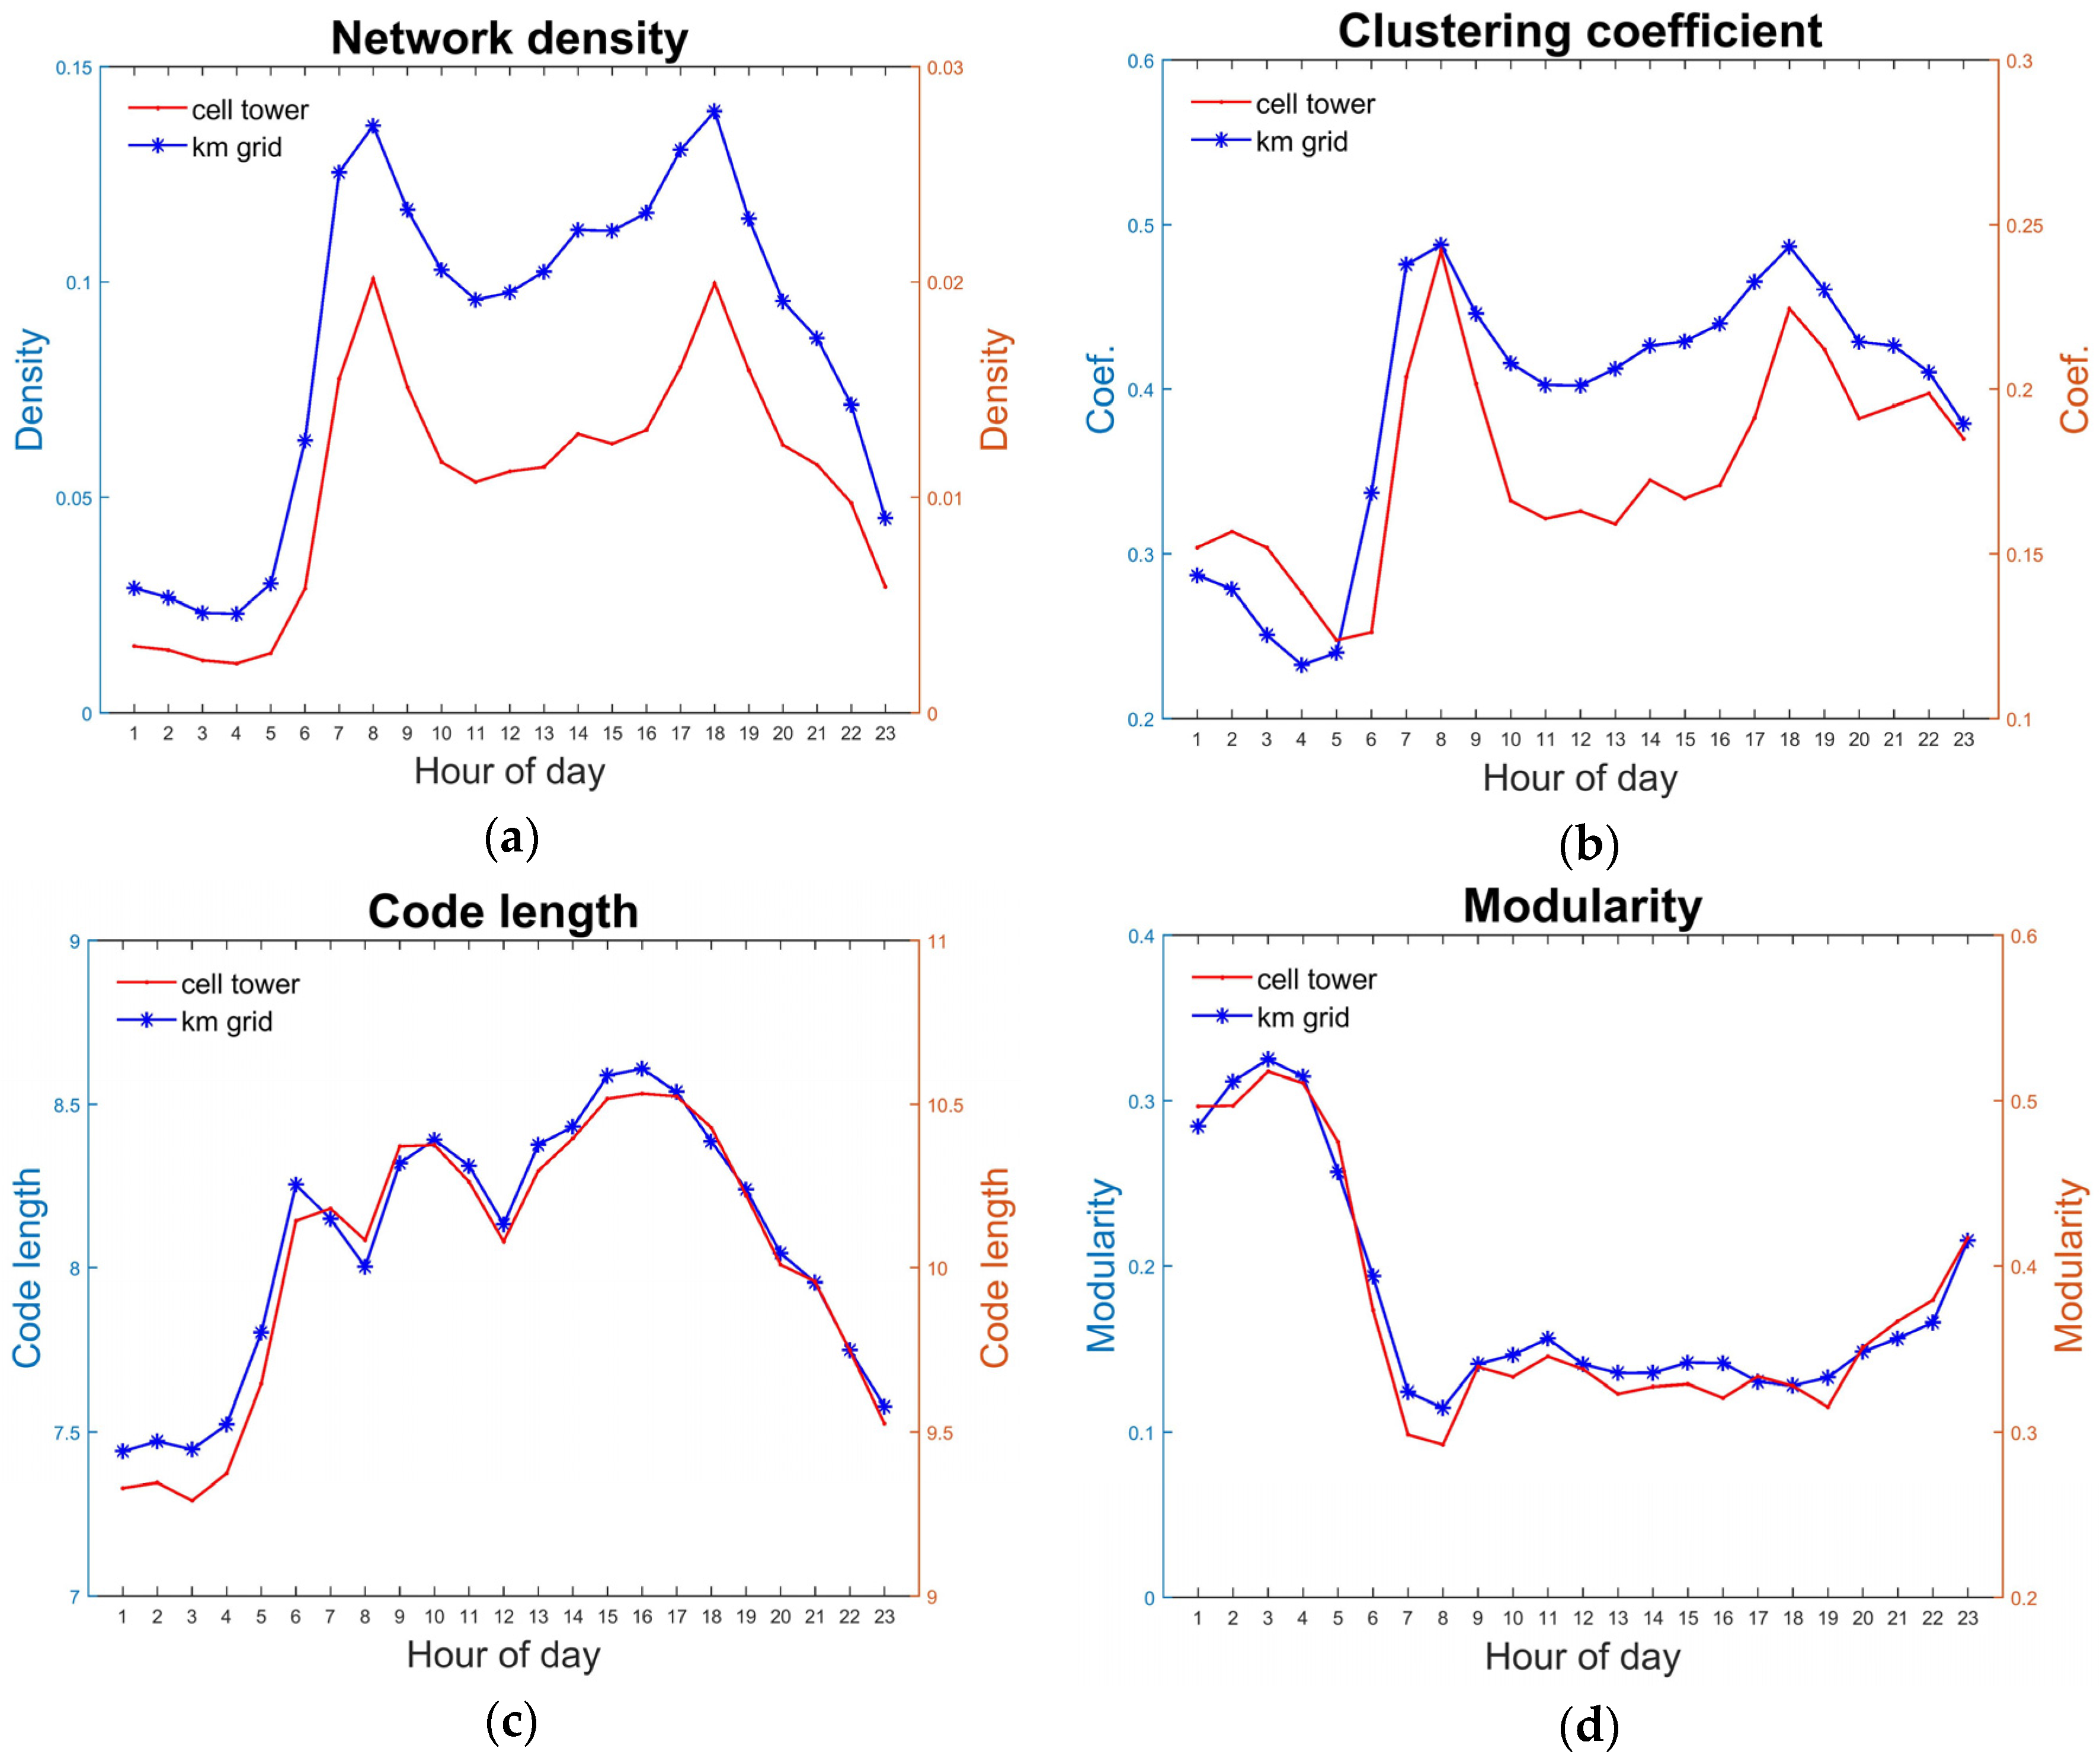
Figure 9 presents the temporal variations in the network properties and community structure salience using the two alternative spatial units, which could be compared to
Figure 3b and
Figure 5.
Figure 10 shows the two indicators for the temporal dynamics in structure composition also using the two units, which could be compared to
Figure 6a,b. Similarly, warm colors indicate large values while cool colors denote small values.
The temporal curves from the results using two units are highly similar to each other and also, by referring to
Figure 3 and
Figure 5, to that with TAZ aggregation. The same goes for the temporal dynamics of structure composition according to
Figure 6a,b and
Figure 10. Statistical comparisons between the grid-based/cell tower-based results and the TAZ-based result also demonstrates a high level of correlation, with 0.99/0.98 for network density; 0.99/0.78 for clustering coefficient; 0.99/0.99 for both the code length and modularity; 0.93/0.92 for NMI; and 0.96/0.90 for the “split-join” distance. All correlations are significant at the 0.00 level. Therefore, no serious effect of MAUP is detected in regard to the temporal dynamics of the structure as results using various spatial units demonstrate a high level of resemblance.
6. Discussion and Limitations
This study makes use of a large set of mobile phone positioning data in the city of Shenzhen, China to explore the interaction-based structure of the urban space. By exploiting the large volume and the high level of temporal granularity of the data, this study further evaluates the temporal dynamics of the structure composition within a diurnal cycle. Movements are extracted from positioning data and networks are constructed by those movements. Network theories and state-of-the-art community detection methods are applied to identify the interaction-based structure of urban space. Quantitative indicators are used to evaluate the temporal dynamics of the structure. Geographical layouts of the structures at different times of the day are compared to illustrate the dynamics. In addition, the common MAUP issue is addressed by using alternative geographical units for network construction and structure identification and then comparing the results.
A total of 23,474,337 movement traces are extracted and 24 conceptualized networks are constructed for the overall day as well as each of the 23 h of the day studied. Structures are identified with distinct features compared to the administrative zoning or the planned clustering. Specifically, the overall structure indicates a certain level of expansion in central areas towards inner suburbs and a clear separation between high-tech concentrated areas and traditional industry areas. In contrast, a fragmented structure emerges in suburban districts where major manufacturing industries are located with near-work accommodations. Variations in network properties and community salience show that the structure during nighttime is the most salient and the urban space is more interconnected during peak hours. In terms of the form of the variations, prominent agglomerations are identified around morning peaks and significant divisions emerge after evening peaks, suggesting transitions between commuting-dominated travel characteristics and features of other travels. According to the geographical mapping, urban districts are found to be associated with noticeable variations while components in suburban areas are more stable. In addition, results by different spatial units suggest that there are certain discrepancies in the interaction-based structure between the cell tower unit and the aggregate (TAZ and grid) units while no significant difference is found in the temporal variations of properties using different spatial units.
The general interaction-based structure is able to reflect the basic and broad characteristics of the urban functioning through the interactions between residents and space. The temporal dynamics of the structure illustrates how the organization of spatial interactions changes within a working day. Results suggest the configuration of urban space is largely shaped by human movements and activities and the collective characteristics of human mobility changes at different times of the day which, in turn, results in the dynamic structures. The large volume and detailed temporal resolution of the mobile phone dataset as well as the high level of population coverage enable a comprehensive and relatively unbiased investigation on the dynamics in interaction-based spatial structure. Comparisons to the administrative and planning divisions, though not quantitatively, demonstrate how the interaction-based structure represents the “status quo” of urban spatial organization and how it echoes or differs from planning schemes. Findings of this study could facilitate urban planning with more detailed knowledge. For example, with the knowledge of the agglomeration or division in the structures of collective human movements (travel), officials in the transport sectors could focus on managing a few corridors for cross-boundary (component) trips during specific hours. In addition, existing planning schemes could be evaluated with more in-depth knowledge on the arrangement of human activities within the urban space at different times of day (e.g., levels of self-containment at different hours) and future planning could be improved with the assistance of the provided information as well.
There are some limitations to the current study that could be improved in the future. Firstly, mobile phone positioning data suffer from a relatively low spatial accuracy at cell tower level. It is assumed that this would not be a major hindering effect in collective analysis but it might be problematic in individual analysis. In addition, the utilized dataset only has the coverage of one weekday and the results may be partially subject to temporal uncertainty. It would be beneficial to acquire data on different days for the analysis to have a more comprehensive and determinate result. Secondly, trajectories are extracted from the raw data with certain extraction methods. The thresholds adopted to extract trajectories, despite being based on specific spatiotemporal distributions, are still arbitrarily selected to a certain degree. In future studies, it would be better to set a series of parameters for sensitivity test before selecting a set of thresholds for the extraction operation. Moreover, apart from broad and basic demographical, industrial, and land-use characteristics, specific context is lacking for the identified spatial components. If data with detailed demographical and/or land-use compositions would be made available, a comparative analysis between the two would immensely enhance the understanding on the mechanism in the formation of interaction-based structures. Lastly, the lack of and the practical difficulty to a “ground truth” Origin–Destination data hinder a definitive validation. Therefore, this study is to be treated as an exploratory effort and the results serve to deliver an indication, instead of a determination, of the dynamic structures in urban space.
7. Conclusions
The interrelationship between urban space and human mobility has attracted much research attention. By applying complex network analysis to large scale positioning data, this study contributes to current findings on urban structure with new perspectives about the variable dynamics in the structure of urban space resulted from the collective interactions of human movements. Empirical results in a major metropolis city demonstrate how collective human movements shape the urban structure and how this structure evolves over time. Comparisons to administrative zoning and planning schemes with broad demographical and land-use context provide some knowledge of interest to planners and administrators and the test with varying spatial units indicate a high robustness of the results.
Findings of this study would benefit intelligent decision making in urban planning and management with a detailed perspective, both spatially and temporally, on urban spatial structure dynamics. The temporally vibrant structure of the urban space could provide insights on the urban structure in much more details than the static planning.
To sum up, this study advances the understanding of the dynamics in urban structure characterized by human mobility in a major metropolis. The proposed analytical approach could be applied to data at different times and from different sources as a valuable assistance to the intelligent spatial decision making in urban planning and management.


