2. Interactive Map Case Studies
Different approaches to mapping PoIs are illustrated below through the analysis of the interfaces and architectures of the interactive maps of Cyprus, Malta, and Japan. A comparative table of their features—including our map—is also presented.
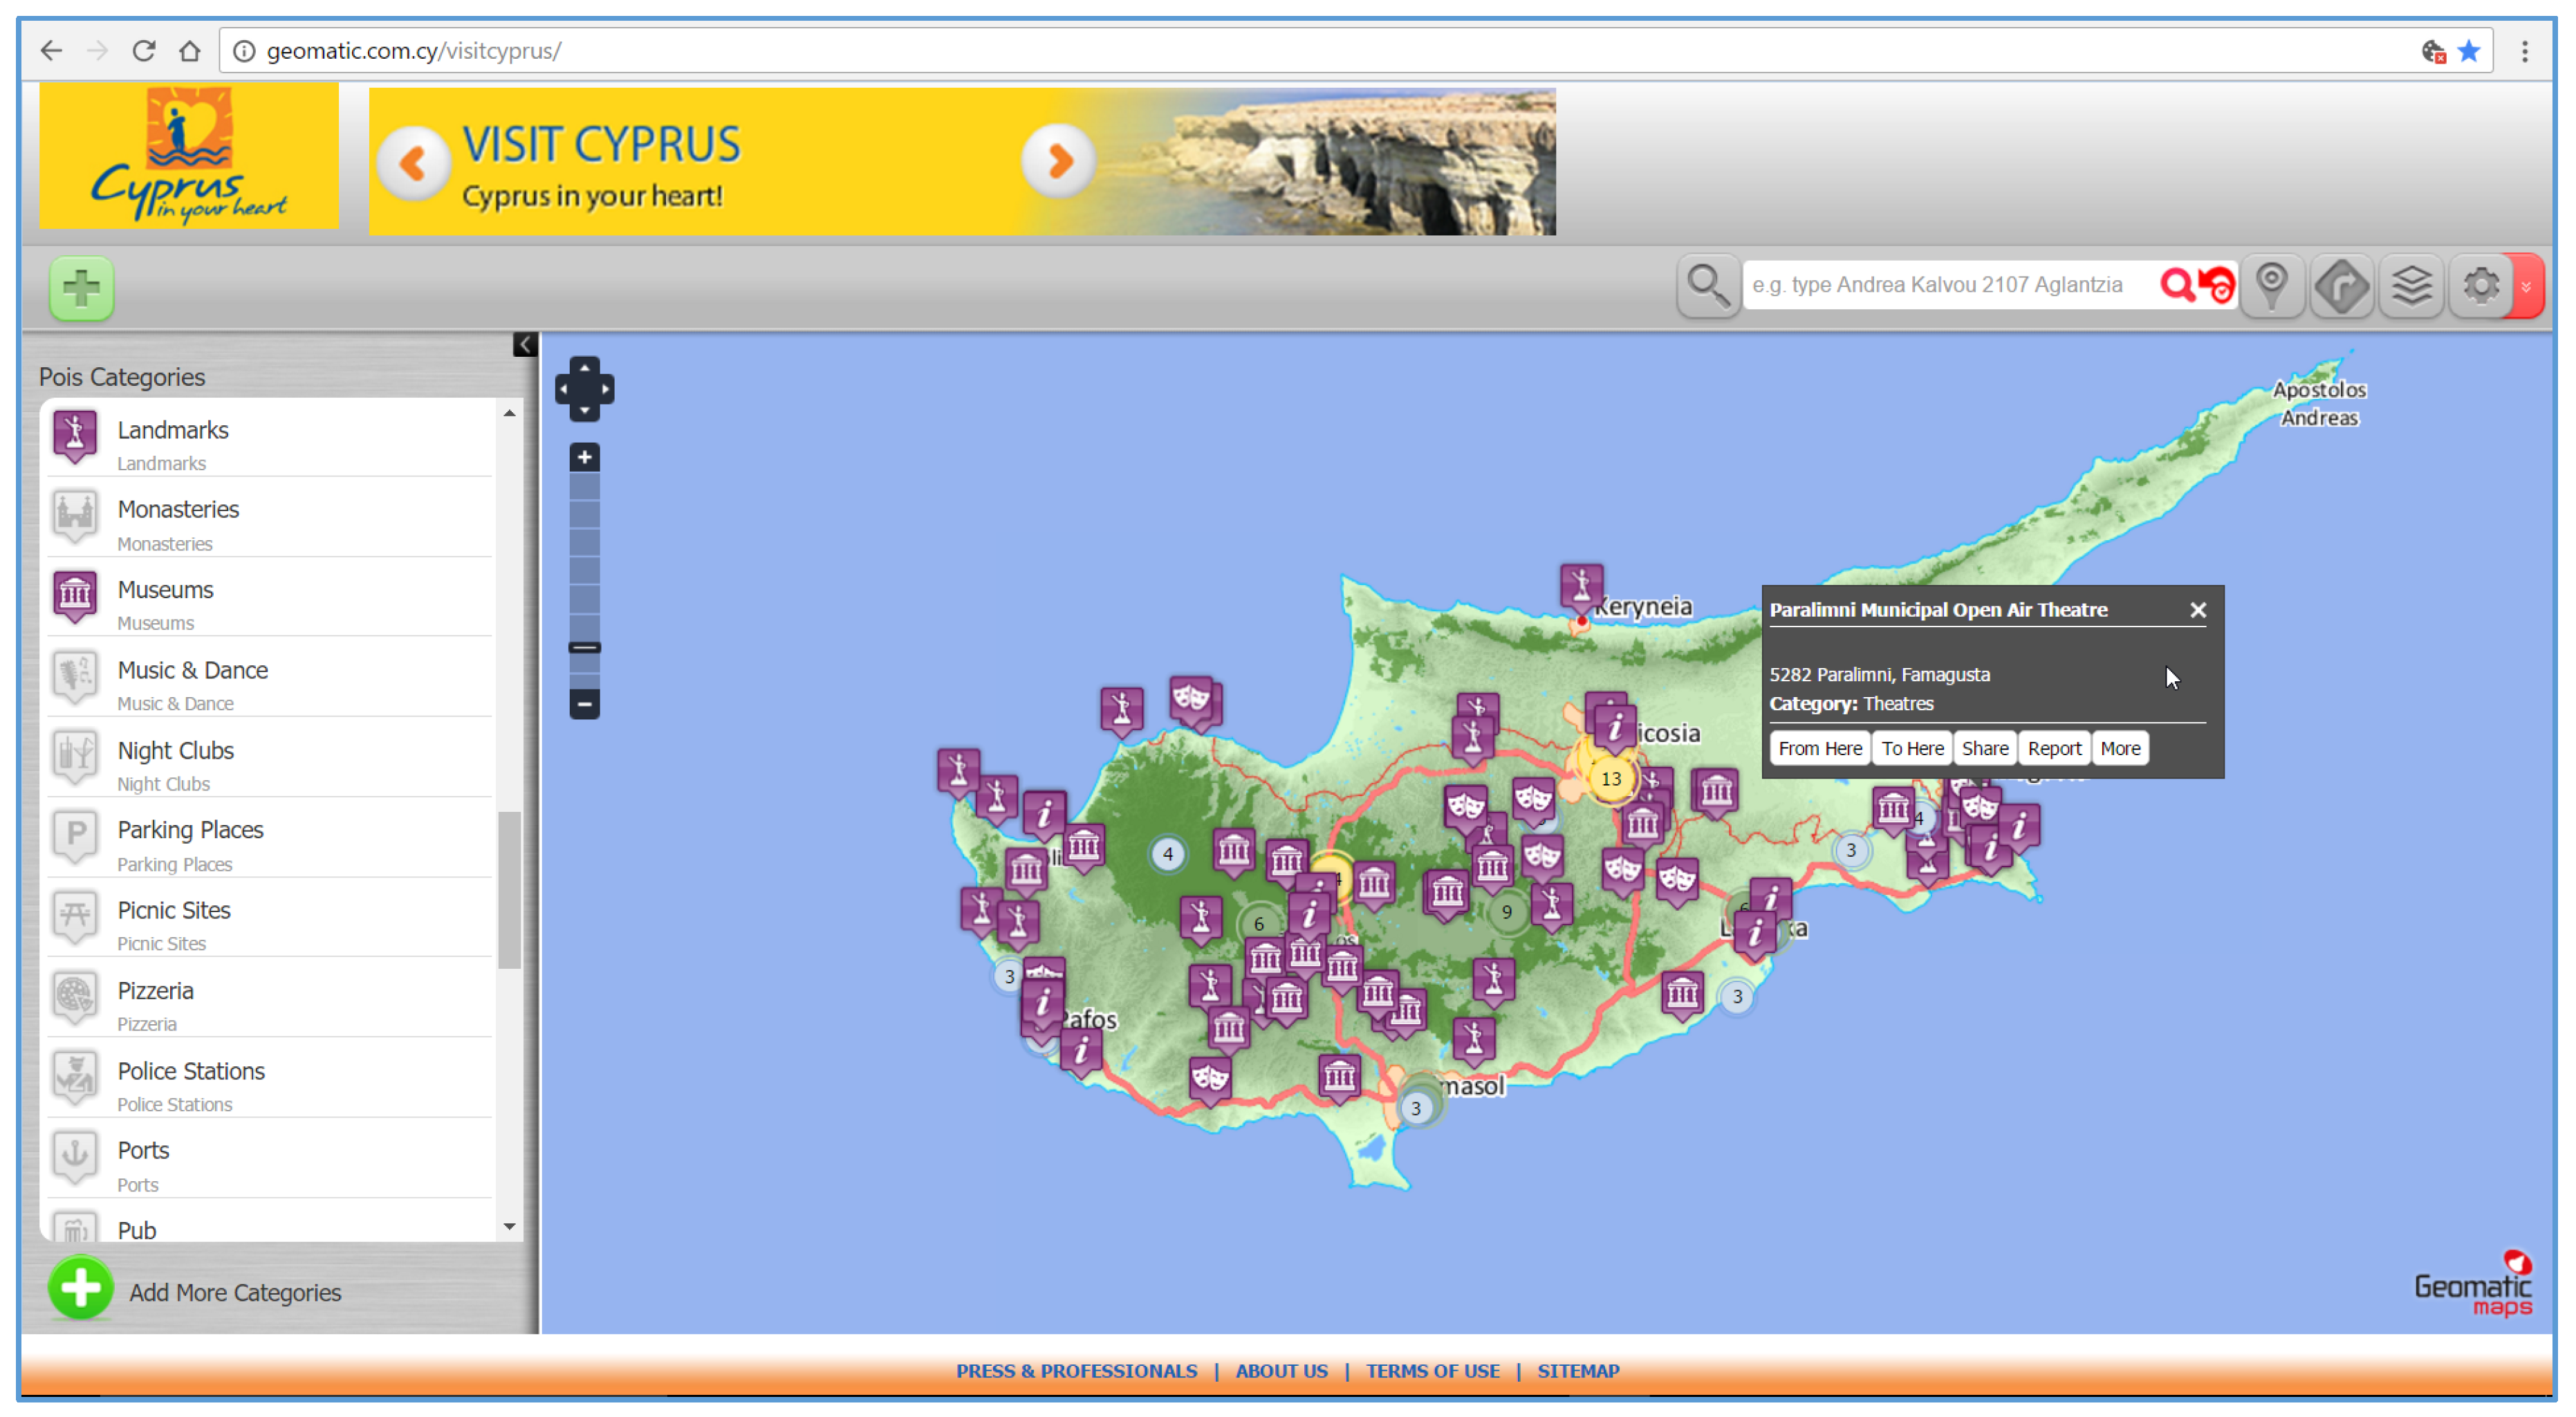
2.1. The Interactive Map of Cyprus
Interface. The interactive map of Cyprus (
Figure 1) starts without displaying markers; the user selects/deselects PoIs categories to show on the map by clicking on their markers from a list in the window “PoIs Categories” (located on the left side of the window), which is committed to user interface interactions. The markers have the same shape (a shield) with different background colours and different foreground images. The colours are not very useful because different categories sometime have the same background colour (for example, violet, in “Landmarks”, “Museums”, “Theatres”, and “Info” types). Overlapping markers are replaced with a special circular marker with colour and diameter proportional to the overlapped PoI’s number. Clicking on a marker in the map opens a callout with the PoI’s name, address, and category; there are five function keys:
“From Here” and “To Here” replace the “PoIs Categories” window with the “Navigation” window, allowing the reception of directions to/from the PoI and another PoI or an address.
“Share” opens a pop-up window to send the PoI’s location and a message between two emails.
“Report” sends a comment and the user’s email address to the developer.
“More” opens another window with additional info (such as telephone number, if available) and a small zoomable map with the PoI’s location.
The other user interface interaction windows are “Search”, to show the PoI selected in the text search box (it works irrespective of the activated categories); “Layers”, to select the base map (Geomatic/Satellite), the language (GR/EN) and overlays (Nicosia Bike Routes); “Print”; and “Clear Map”.
Architecture. The interactive map is a rich web-based Geographic Information System (GIS)—platform (gmapi.js). Based on the OpenLayers application programming interface (API), it uses “iframes” to load content from different servers. Today, most interactive maps use iframes (to display a web page within a web page) and most implementations require the use of JavaScript, Cascading Style Sheets (CSS), and HTML5 to build a responsive iframes-based website. However, there are disadvantages to using iframes, for example:
iframes can make the development of a website complicated.
It is easy to create badly constructed websites using iframes. The most common mistake is including a link that creates duplicate web pages displayed within an iframe.
Search engines that reference a web page only give the address of that specific document. This means that search engines might link directly to a page that was intended to be displayed within a frameset.
Users have become so familiar with normal navigation using tables, the back button, and so on, that navigating through a site that uses iframes can be problematic.
The use of too many iframes can put a high workload on the server.
The main advantages of HTML5 iframes are the possibility to view multiple documents within a single web page and ability to load pages from different servers in a single frameset. This solution, although evolving with the adoption of new attributes and deprecation of others, might hinder evolution and upgrades of the application and its responsiveness. As an alternative, our application uses jQuery with CSS3 lightening for the user interface (for example, in order to simplify the manipulation of elements as the navigation menu; see
Section 4.1), and AJAX (Asynchronous JavaScript and XML) for expediting the user interaction (for example, in order to update the web page without reloading it).
2.2. The Interactive Map of Malta
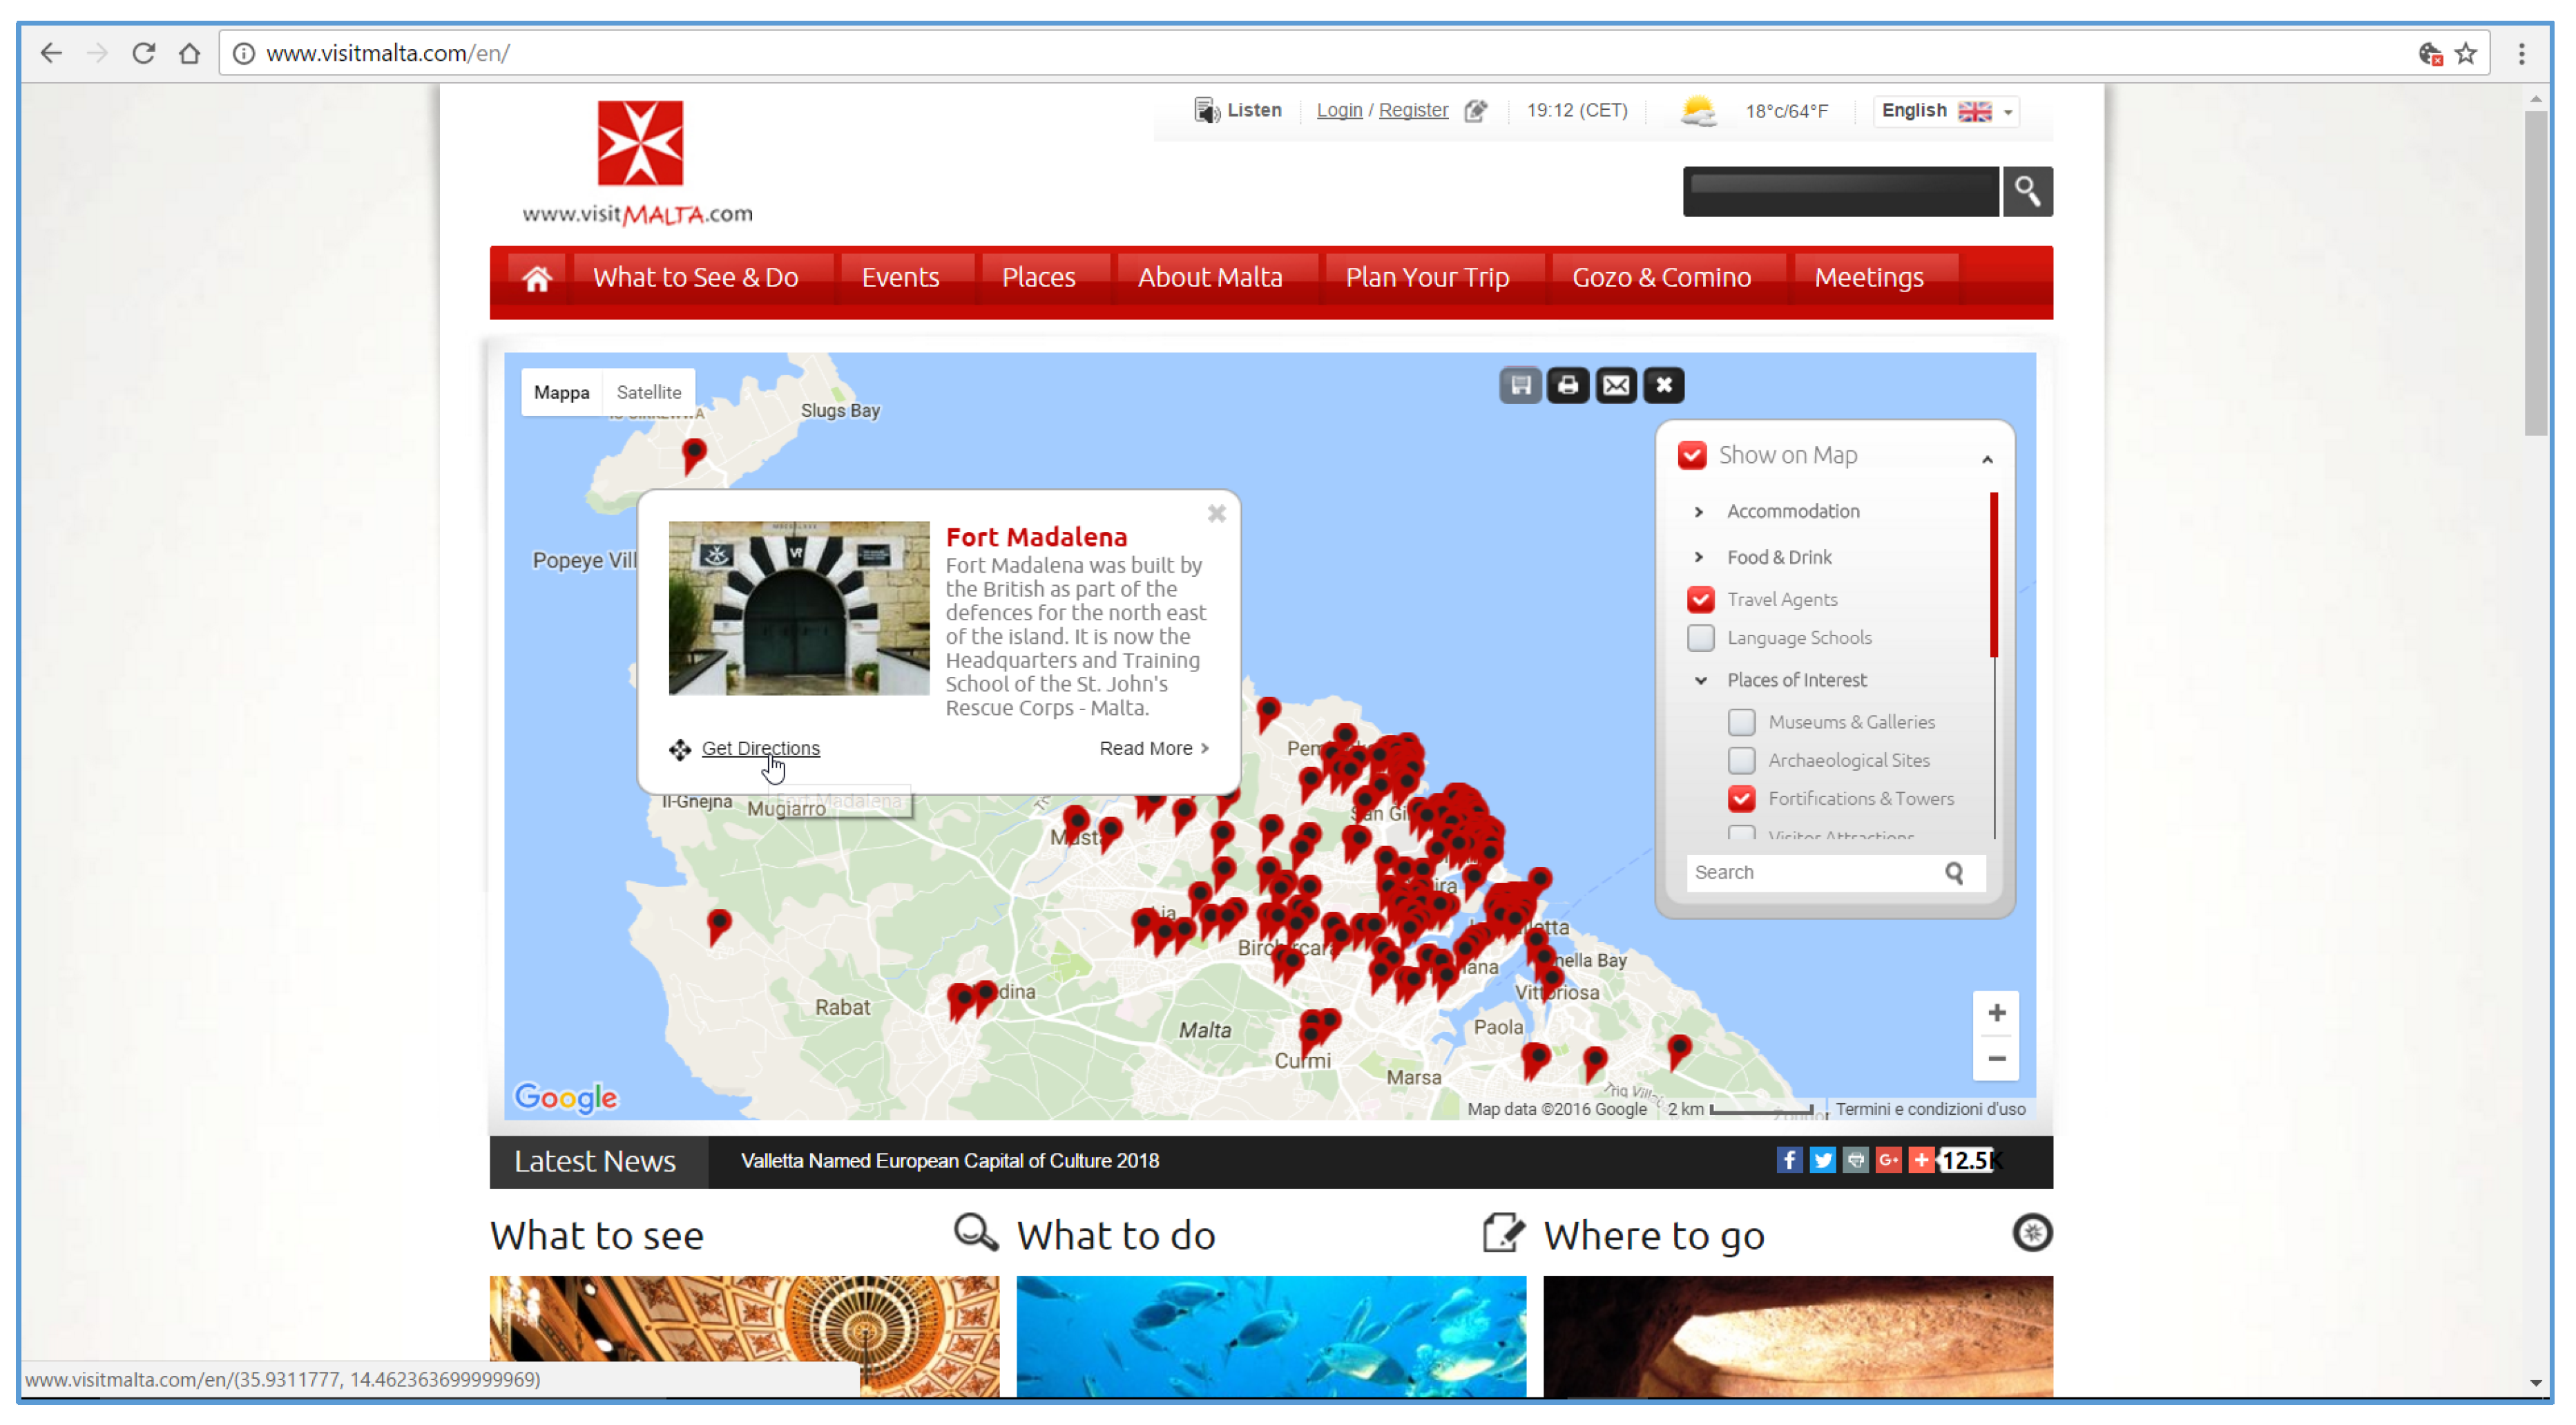
Interface. The interactive map of Malta (
Figure 2) is able to produce optimal results because of a good design. It starts without markers; the user selects/deselects PoIs types (grouped by categories) to show on the map by checking items from a list, without connection to the coloured markers on the map. The markers have the same shape (an upturned and tilted red drop) with a coloured core. Sometimes different types in the same category and in different categories have the same colour in the core (for example, black, in “Travel Agents” and “Fortification and Towers”).
Moreover, the list of categories and types is only given alphabetically, making it impossible to associate the markers with the types they represent. Clicking on a marker in the map opens a callout with the name, image, and short description of the PoI, with a “Read more” link (all links load a page with a zooming satellite map without contents). There is also a “Get Directions” non-functional link. Twelve languages are available for the interface, but categories and types often remain in English.
Architecture. The interactive map uses a “REpresentational State Transfer” (REST) web service and all of the features that the “.net” framework provides. REST uses the HyperText Transfer Protocol (HTTP) for all four CRUD (Create/Read/Update/Delete) operations; consequently, this application runs on almost any “online” device or application, but the Malta application is not a responsive web page.
As an alternative, our application is not only conformed to the REST constraints (RESTful) but also responsive, having adopted the leading framework in this category, jQuery, which provides not only a uniform Ajax API, but also a large number of cross-browser helper functions.
Responsive website design is a well-noted approach for website design that caters optimal viewing experience to users while browsing, with easy reading, navigation, simple scrolling, minimal browser resizing, and cross-device compatibility. Website responsiveness has become a transcendent search engine-ranking factor and significantly influences Google search results. The primary goal of responsive web design is to cater a consistent browsing experience to everyone, regardless of what sort of device is being used. It fluidly adapts to almost all the resolutions and screen sizes and works smoothly on each device. With seamless experience, content and media are easily digestible while browsing on multiple devices including iPhone, smartphone, laptop, and desktop.
Responsive websites are becoming the future of website design, as they eliminate the need to have multiple designs for desktop, mobile, and tablets. Moreover, they are more suitable, with respect to mobile websites, for the application of “Search Engine Optimisation” (SEO) methodology—strategies, techniques, and tactics used to increase the amount of visitors to a website by obtaining a high-ranking placement in the search results page of a search engine—including Google, Bing, Yahoo, and other search engines.
2.3. The Interactive Map of Japan
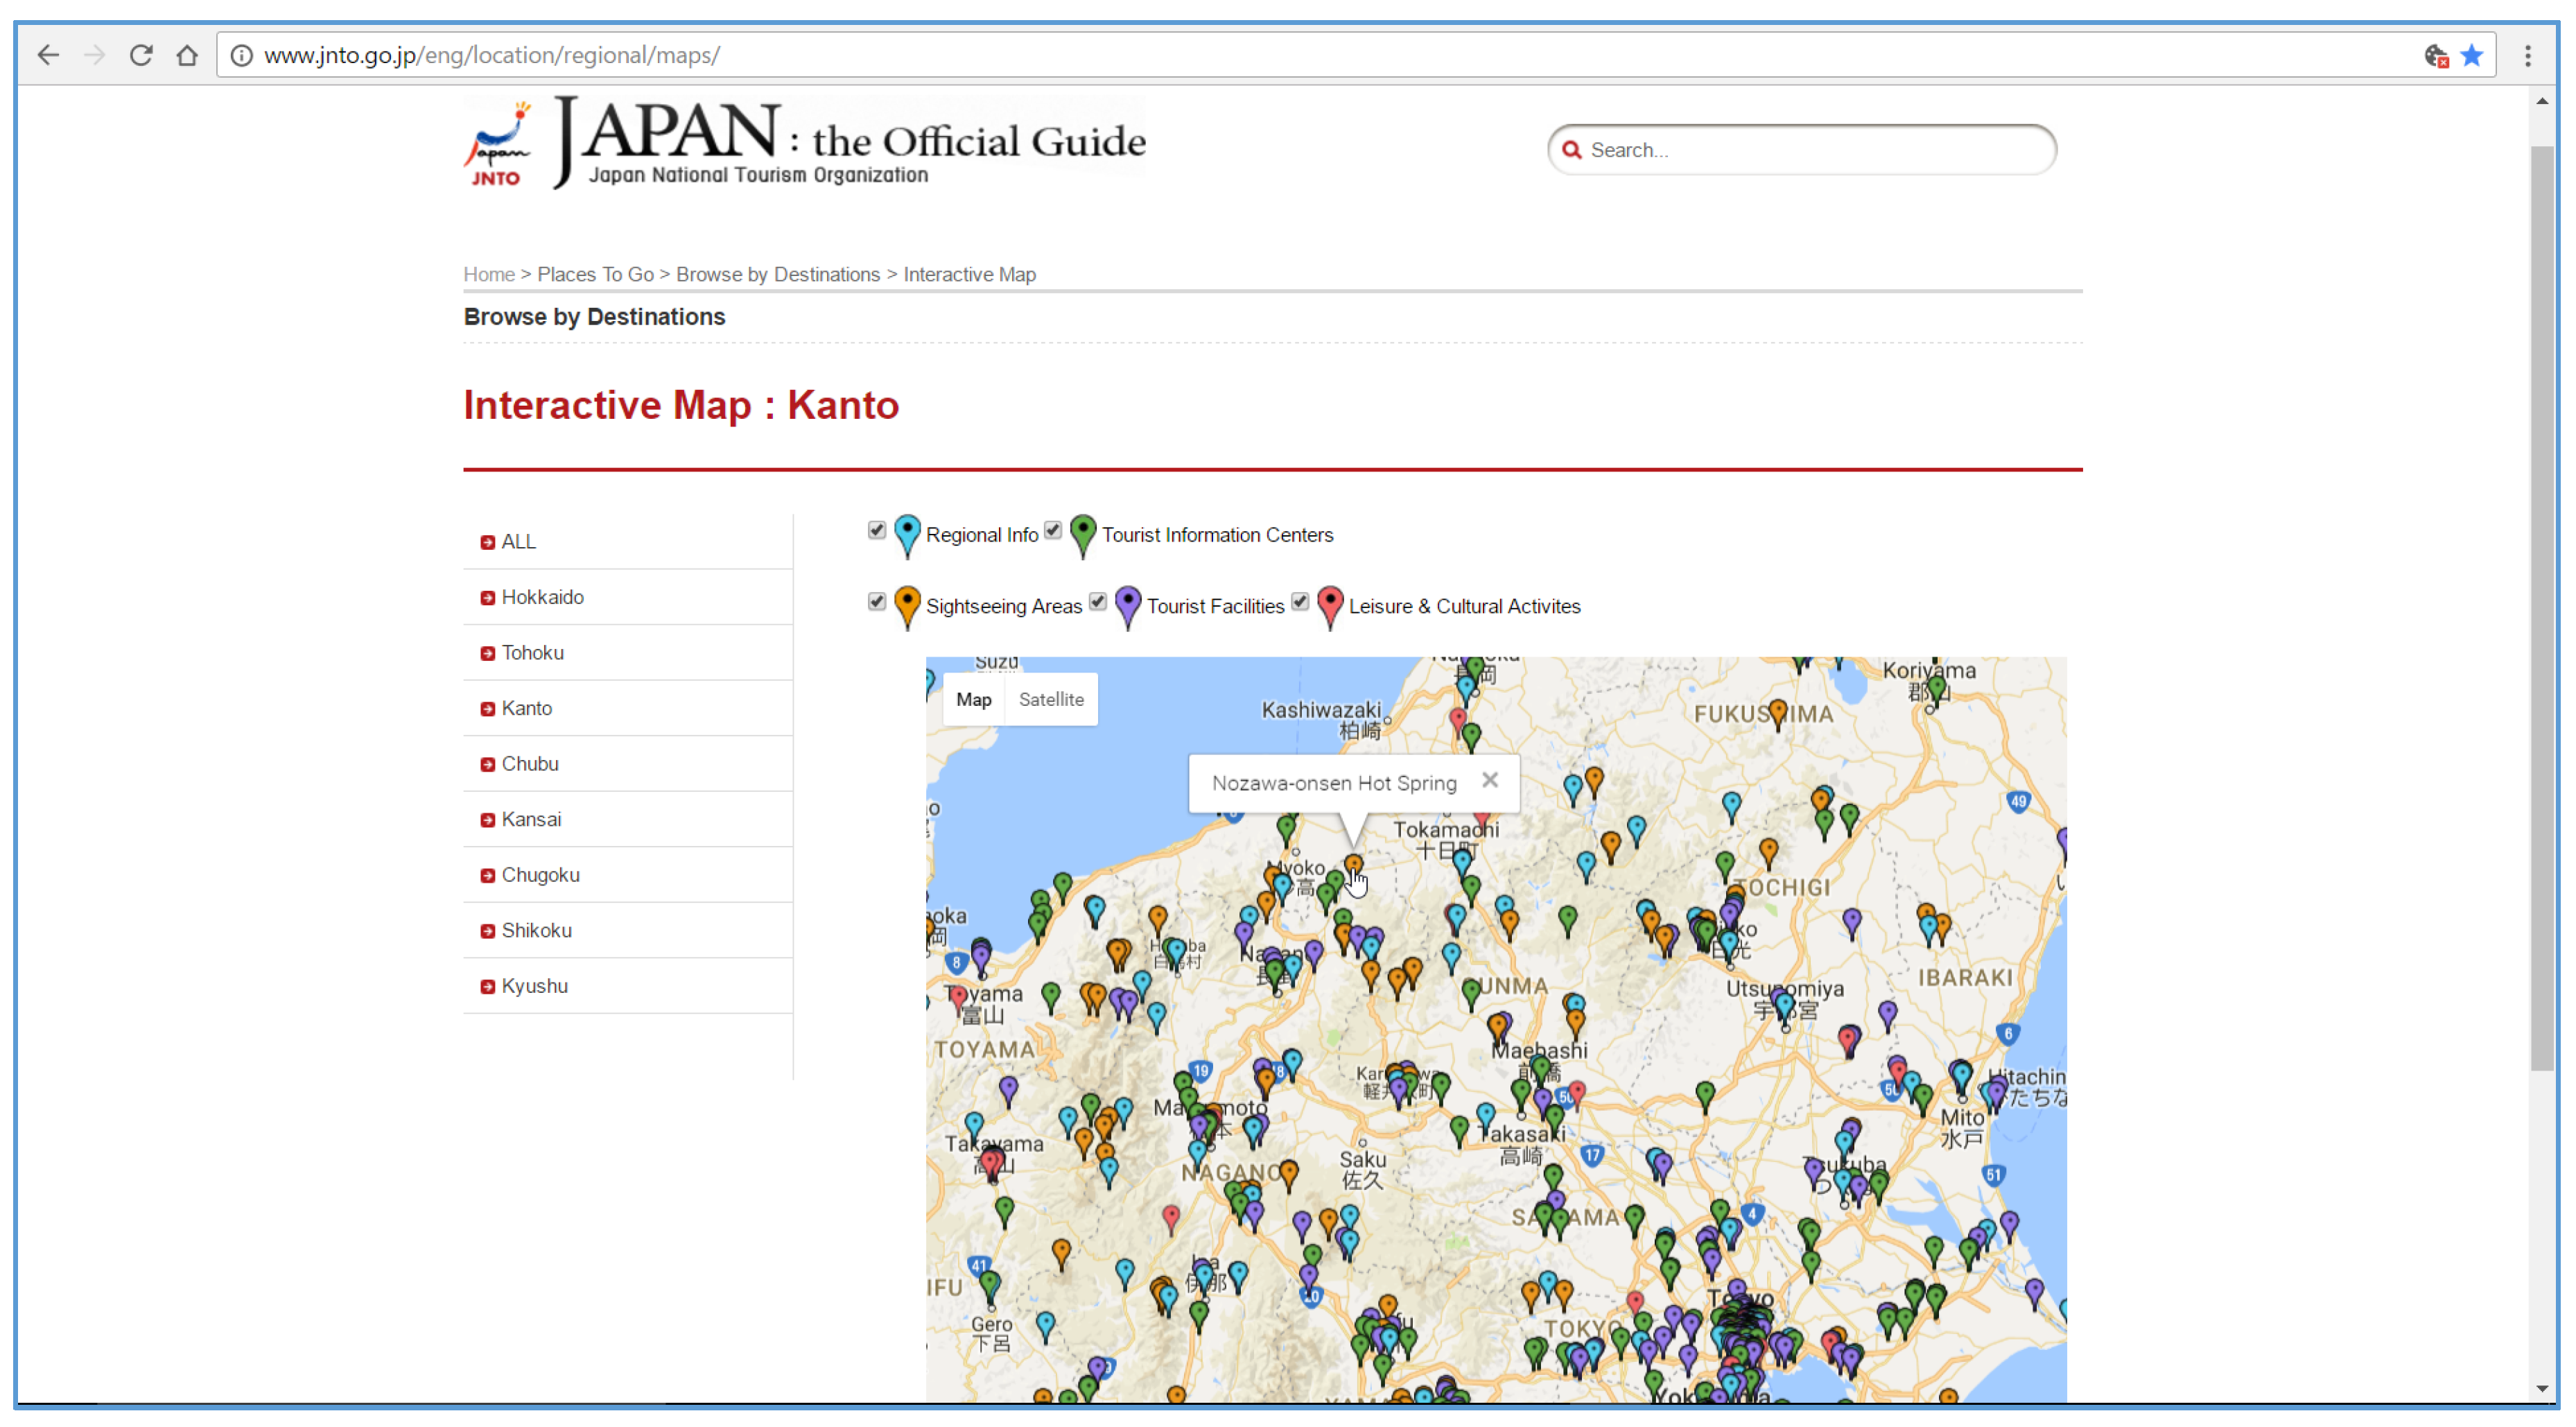
Interface. The interactive map of Japan (
Figure 3) provides five categories, using markers with the same shape and different colours. A clustering marker is not provided and the callout contains only the PoI’s name. The map can be visualised by region.
Architecture. The interactive map uses a web service to retrieve a “comma separated value” (CSV) file available at a given Uniform Resource Locator (URL), using an HTTP GET request. It parses data in a file and next visualizes on the map the data stored in that file; some URL parameters customize and filter the CSV content to be returned.
However, this solution could be limiting. When dealing with large volumes of data or adopting data that contain hierarchical information (e.g., multiple media for a single PoI), the “JavaScript Object Notation” (JSON) data format is used instead of CSV.
Moreover, most modern APIs are RESTful, and therefore natively support JSON input and output. Several database technologies support it and it is significantly easier to use it in most programming languages as well.
2.4. Comparison of Features
The applications discussed above have different interfaces and similar architecture (JSON, REST API, AJAX, jQuery, CSS), but they are not as functionally complete as our interactive map (
Table 1), extensively illustrated in the
Section 4 and
Section 5.
In a traditional web application, every time the application calls the server, it renders a new HyperText Markup Language (HTML) page, triggering a page refresh in the browser. This does not happen in our application, showing basic contents in an initial page, which is static for SEO reasons. Later, all UI (User Interface) interactions occur on the client side, through jQuery and CSS, and after the initial page is loaded, the server acts purely as a service layer, through AJAX which calls return data (not markups) in a particular JSON format called GeoJSON, dynamically updating the map without reloading it.
Sending the application data as GeoJSON creates a separation between the presentation (HTML5 markup and CSS3) and the application logic (AJAX requests and GeoJSON responses), making it easier to design and evolve each layer. In a well-architected “Single-Page Application” (SPA; RESTful) application, we can change the HTML5 markup and CSS3 style without modifying the code that implements the application logic.
Moreover, in all the maps used in the case studies, it is not easy to recognise the categories and types of PoIs because they adopt a unique shape and sometimes use the same colours for different categories/types.
The above examples, mainly centred on PoI mapping, show the need to improve the interface in order to give users better instruments to find results according to their needs. With this objective, a procedure has been designed to simplify the presentation of Cultural Heritage (CH) contents belonging to geo-referenced PoIs through a multimedia map available on the Web with advanced functionalities. It was developed in the framework of the Must See Advisor (Mu.S.A.) project, which aims to give visibility to communities by valuing knowledge from selected stakeholders.
3. Knowledge Collecting
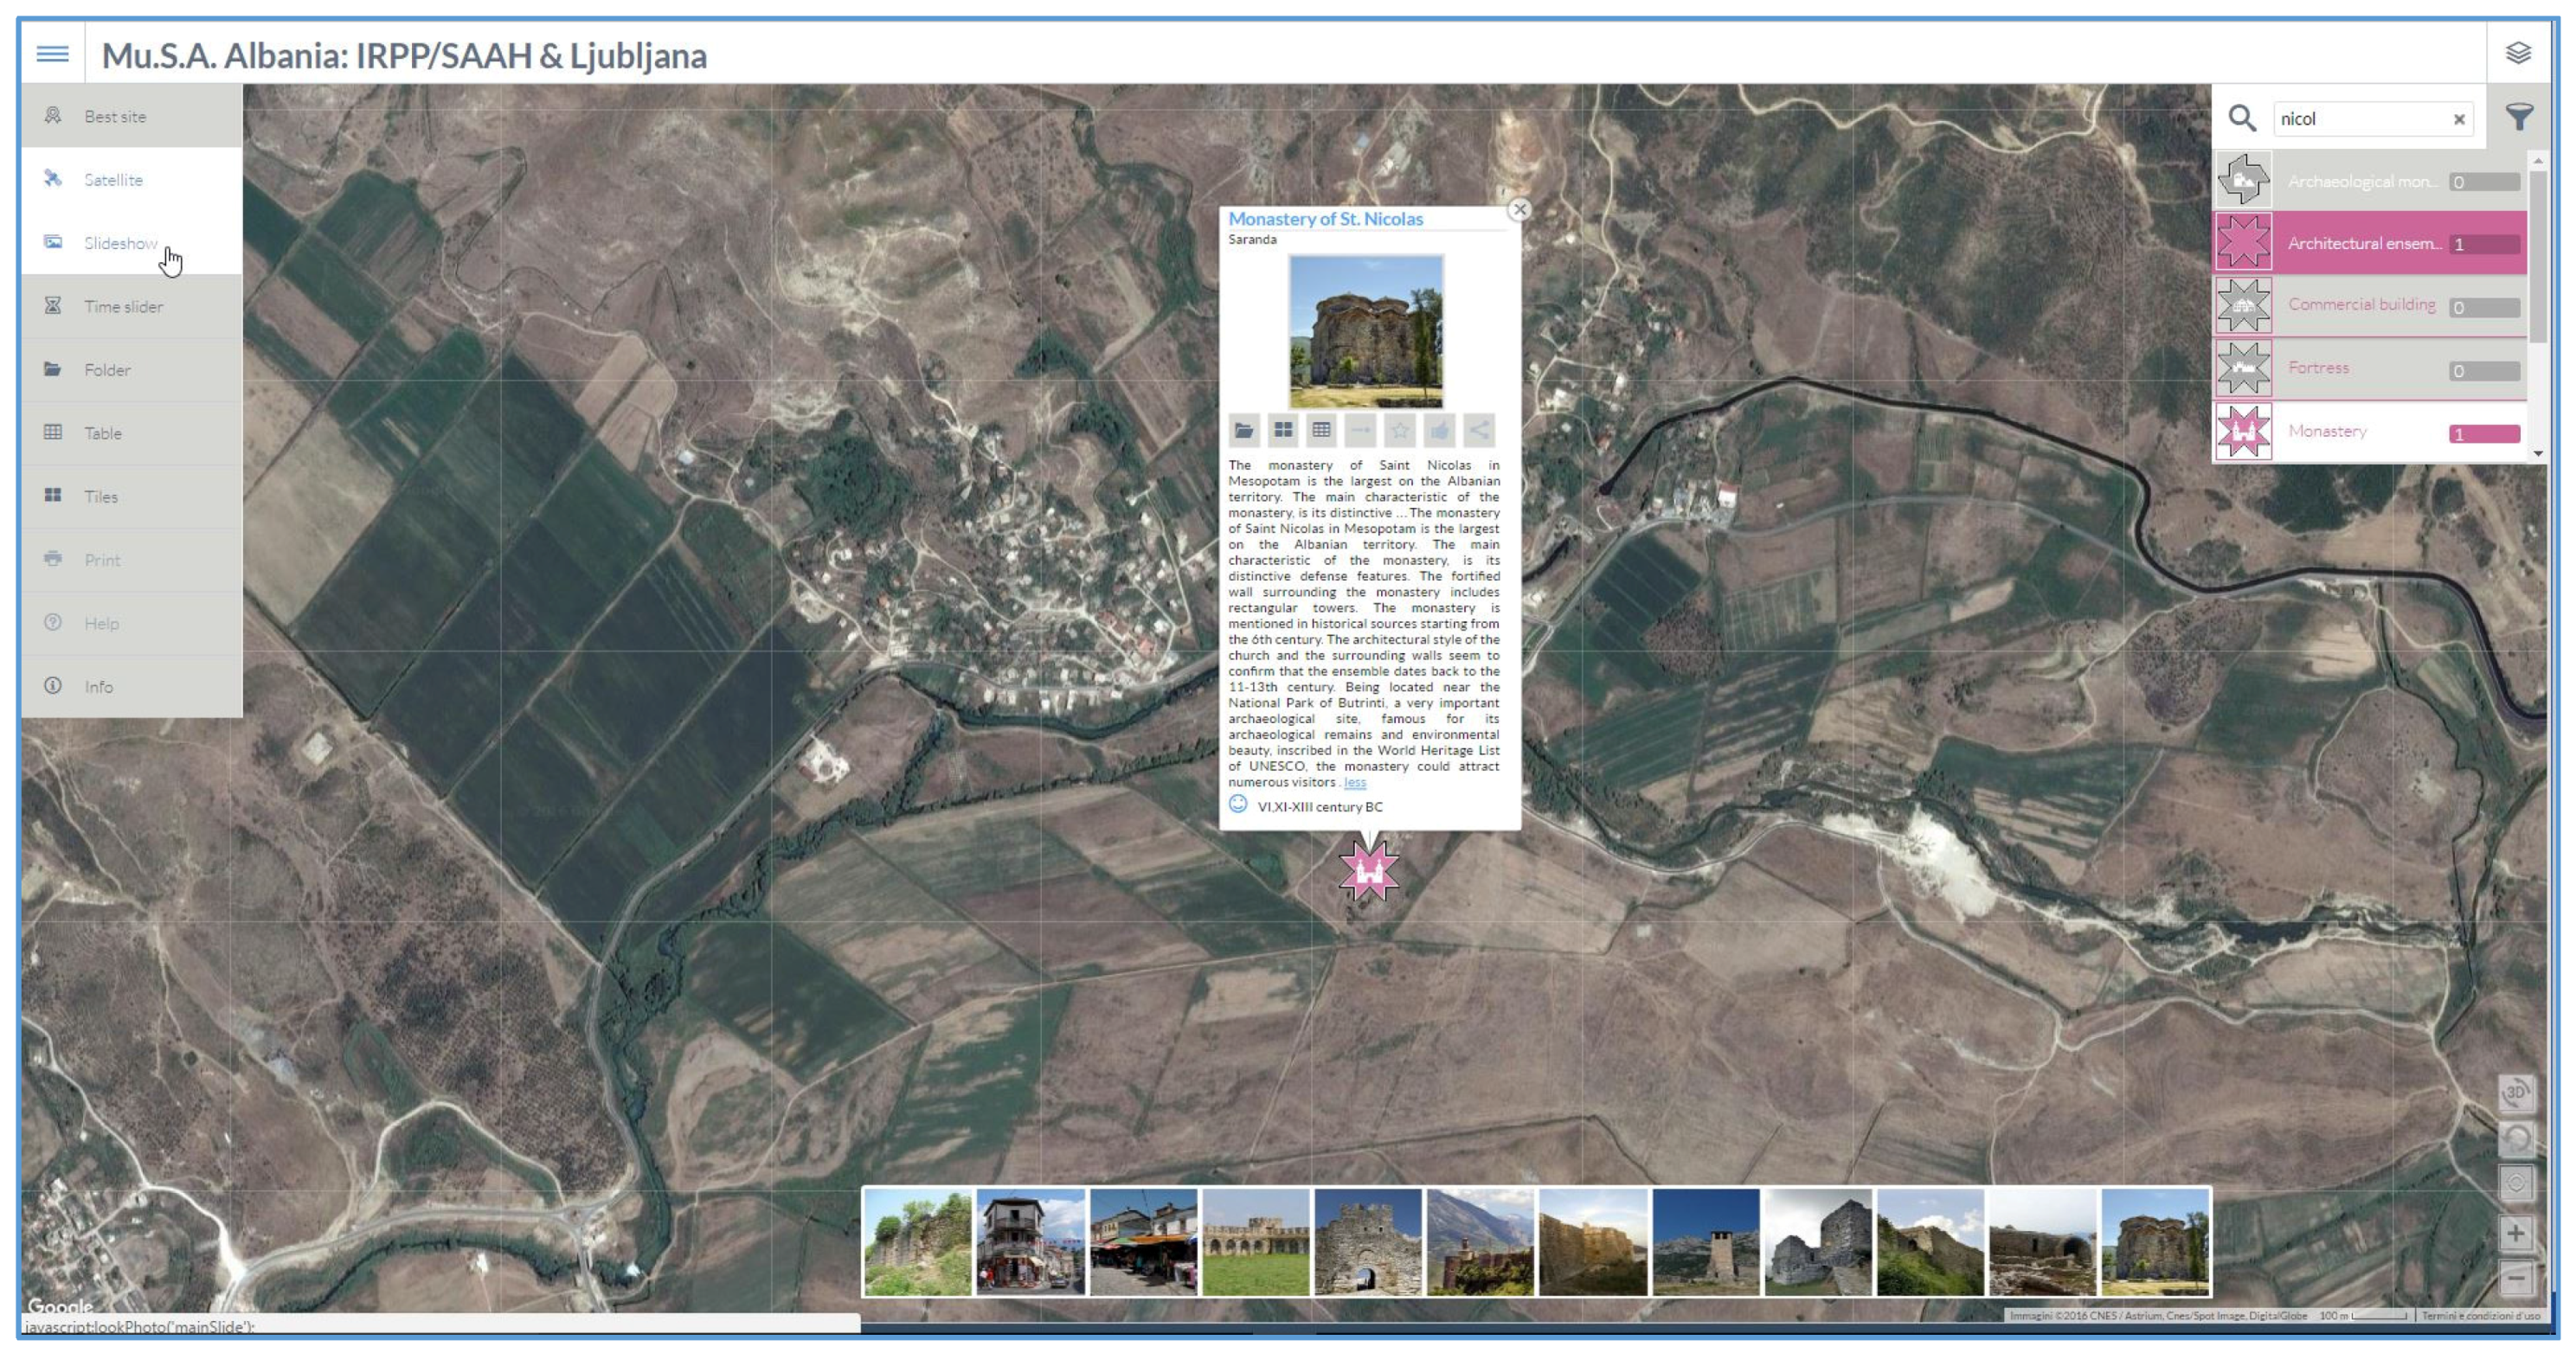
The Mu.S.A. Project began with the aim to give visibility to lesser-known sites by valuing knowledge from selected communities such as municipality teams, cultural associations, and secondary schools.
Applications have been developed for Tirana in Albania [
8] and Syracuse in Italy [
9], progressively strengthening the interconnections between knowledge—expressed through multimedia objects—and places.
More recently, an experimental activity was carried out to test the application in collaboration with the “Ricciotto Canudo” secondary school in the city of Gioia del Colle (a small town in the hinterland of south Italy).
The students working in the “The European Traveller Guide” Comenius project aim to develop, among other things, an awareness of the Township’s heritage. Engagement of the youth is necessary to ensure that these residents will be committed to the township in the future. As children are more involved in their community, it also entices the parents to stay involved as well [
10].
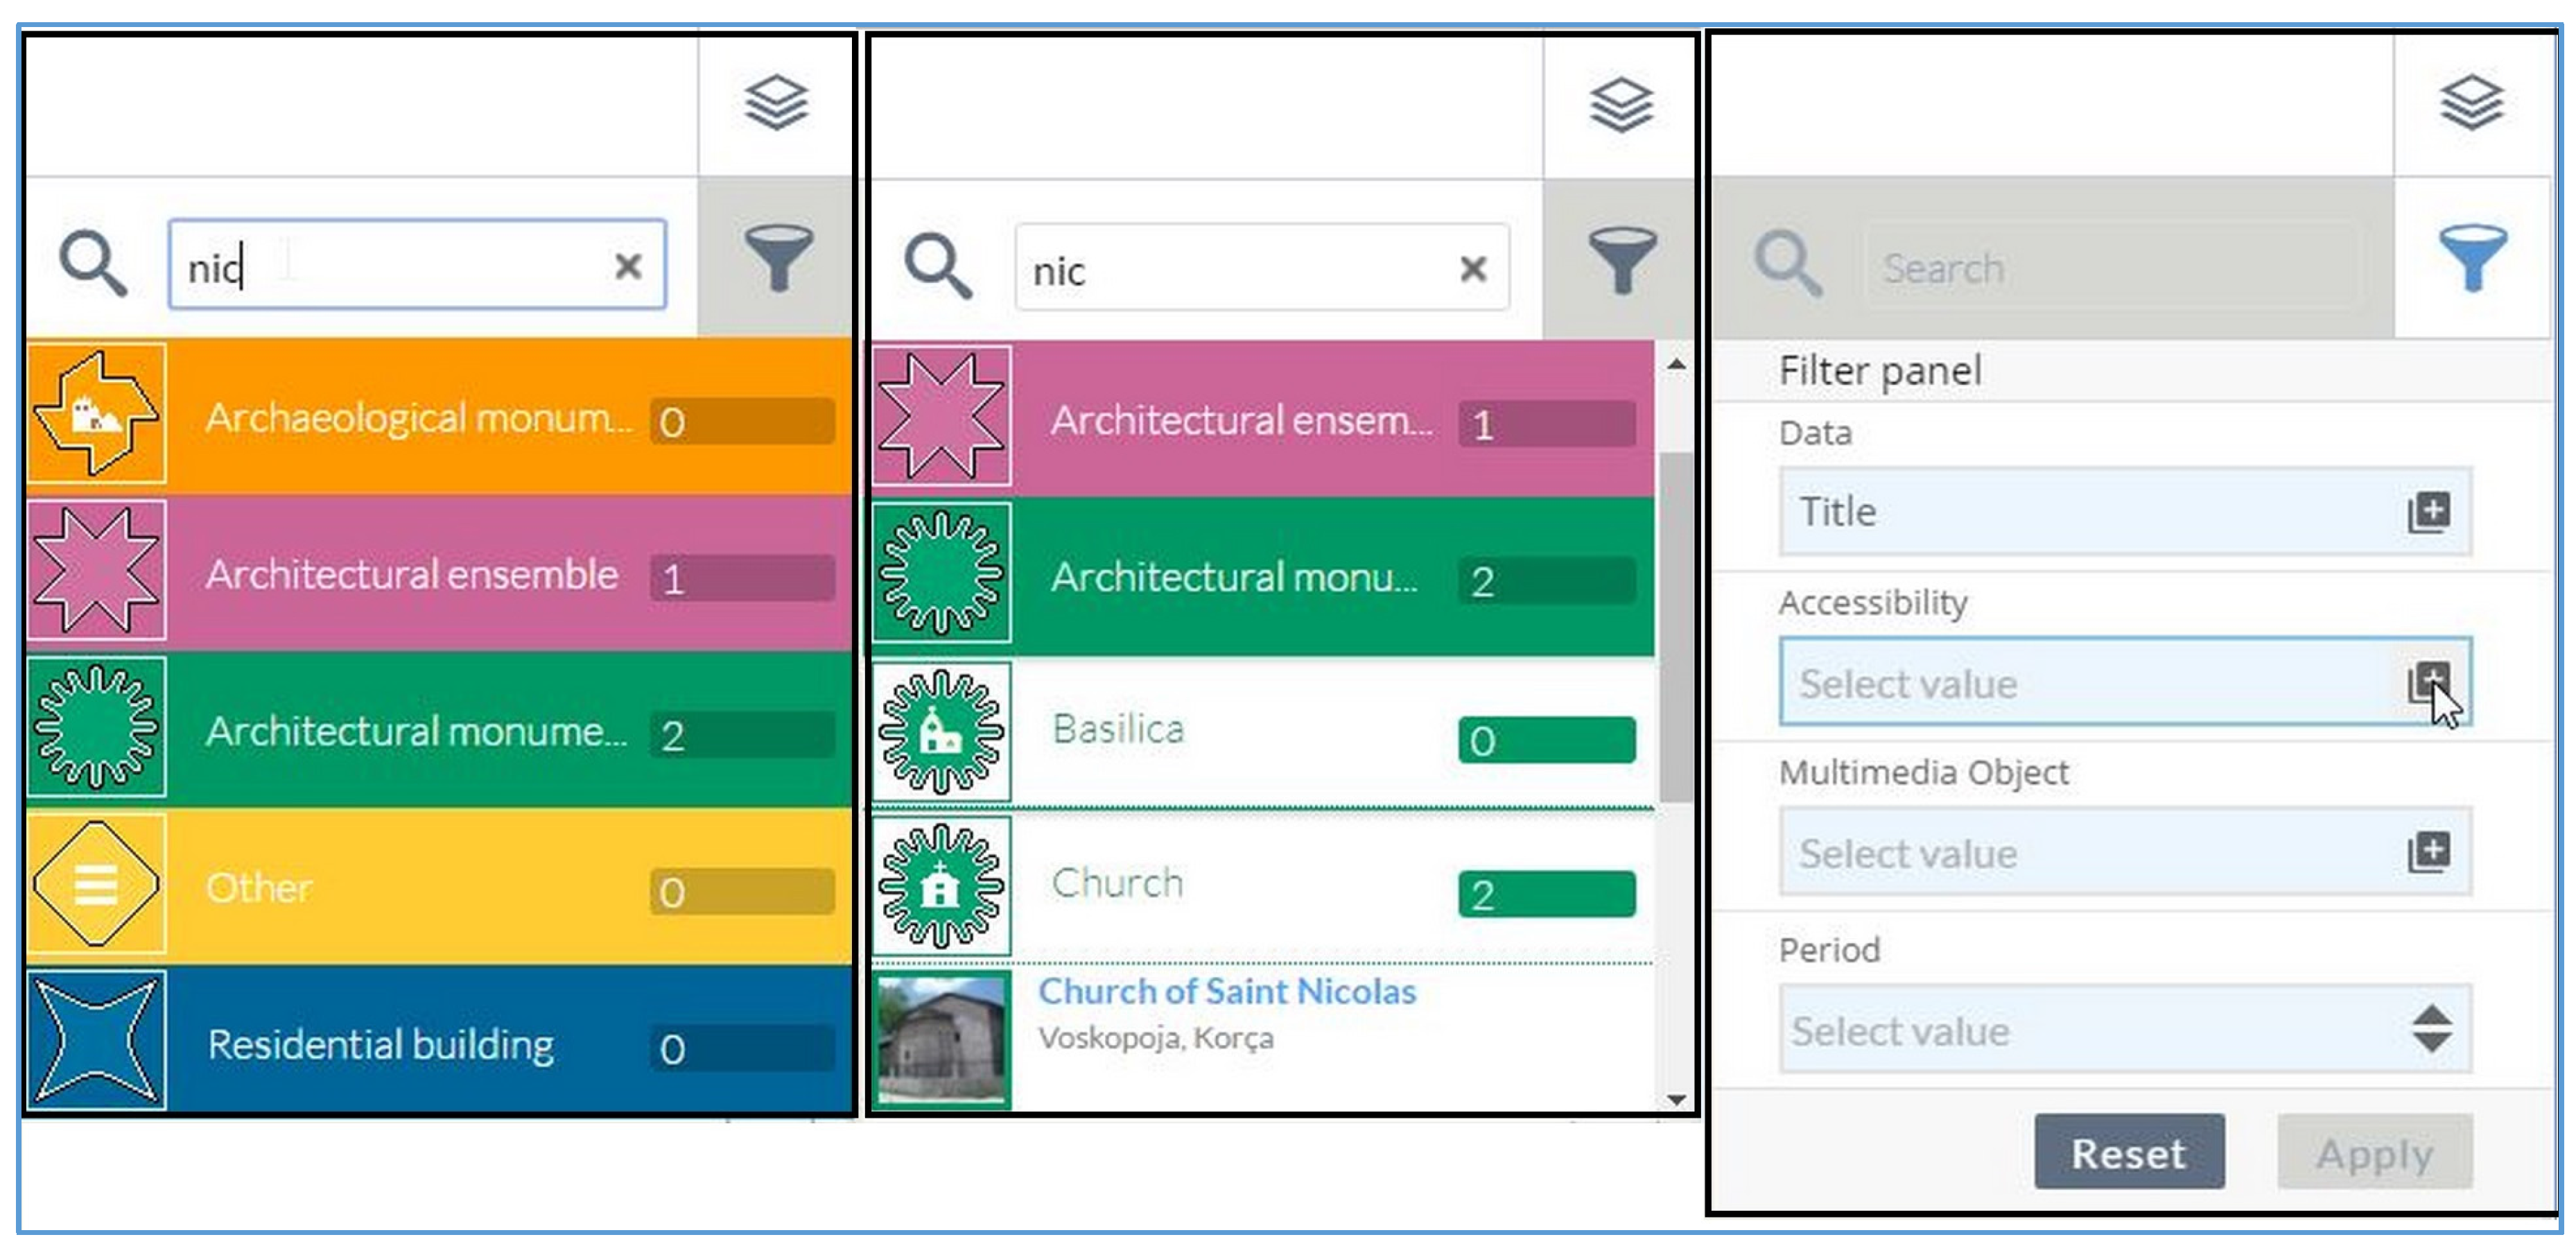
The activity of the students involved collecting for each PoI selected in the Comenius project, a number of attributes: name, location (longitude and latitude; address), and category, with a thumbnail of a representative photo, physical accessibility status, century, age, and short and extended description.
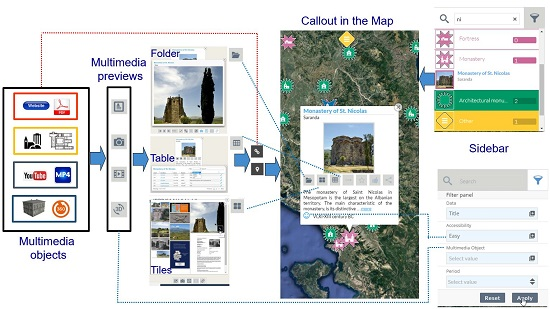
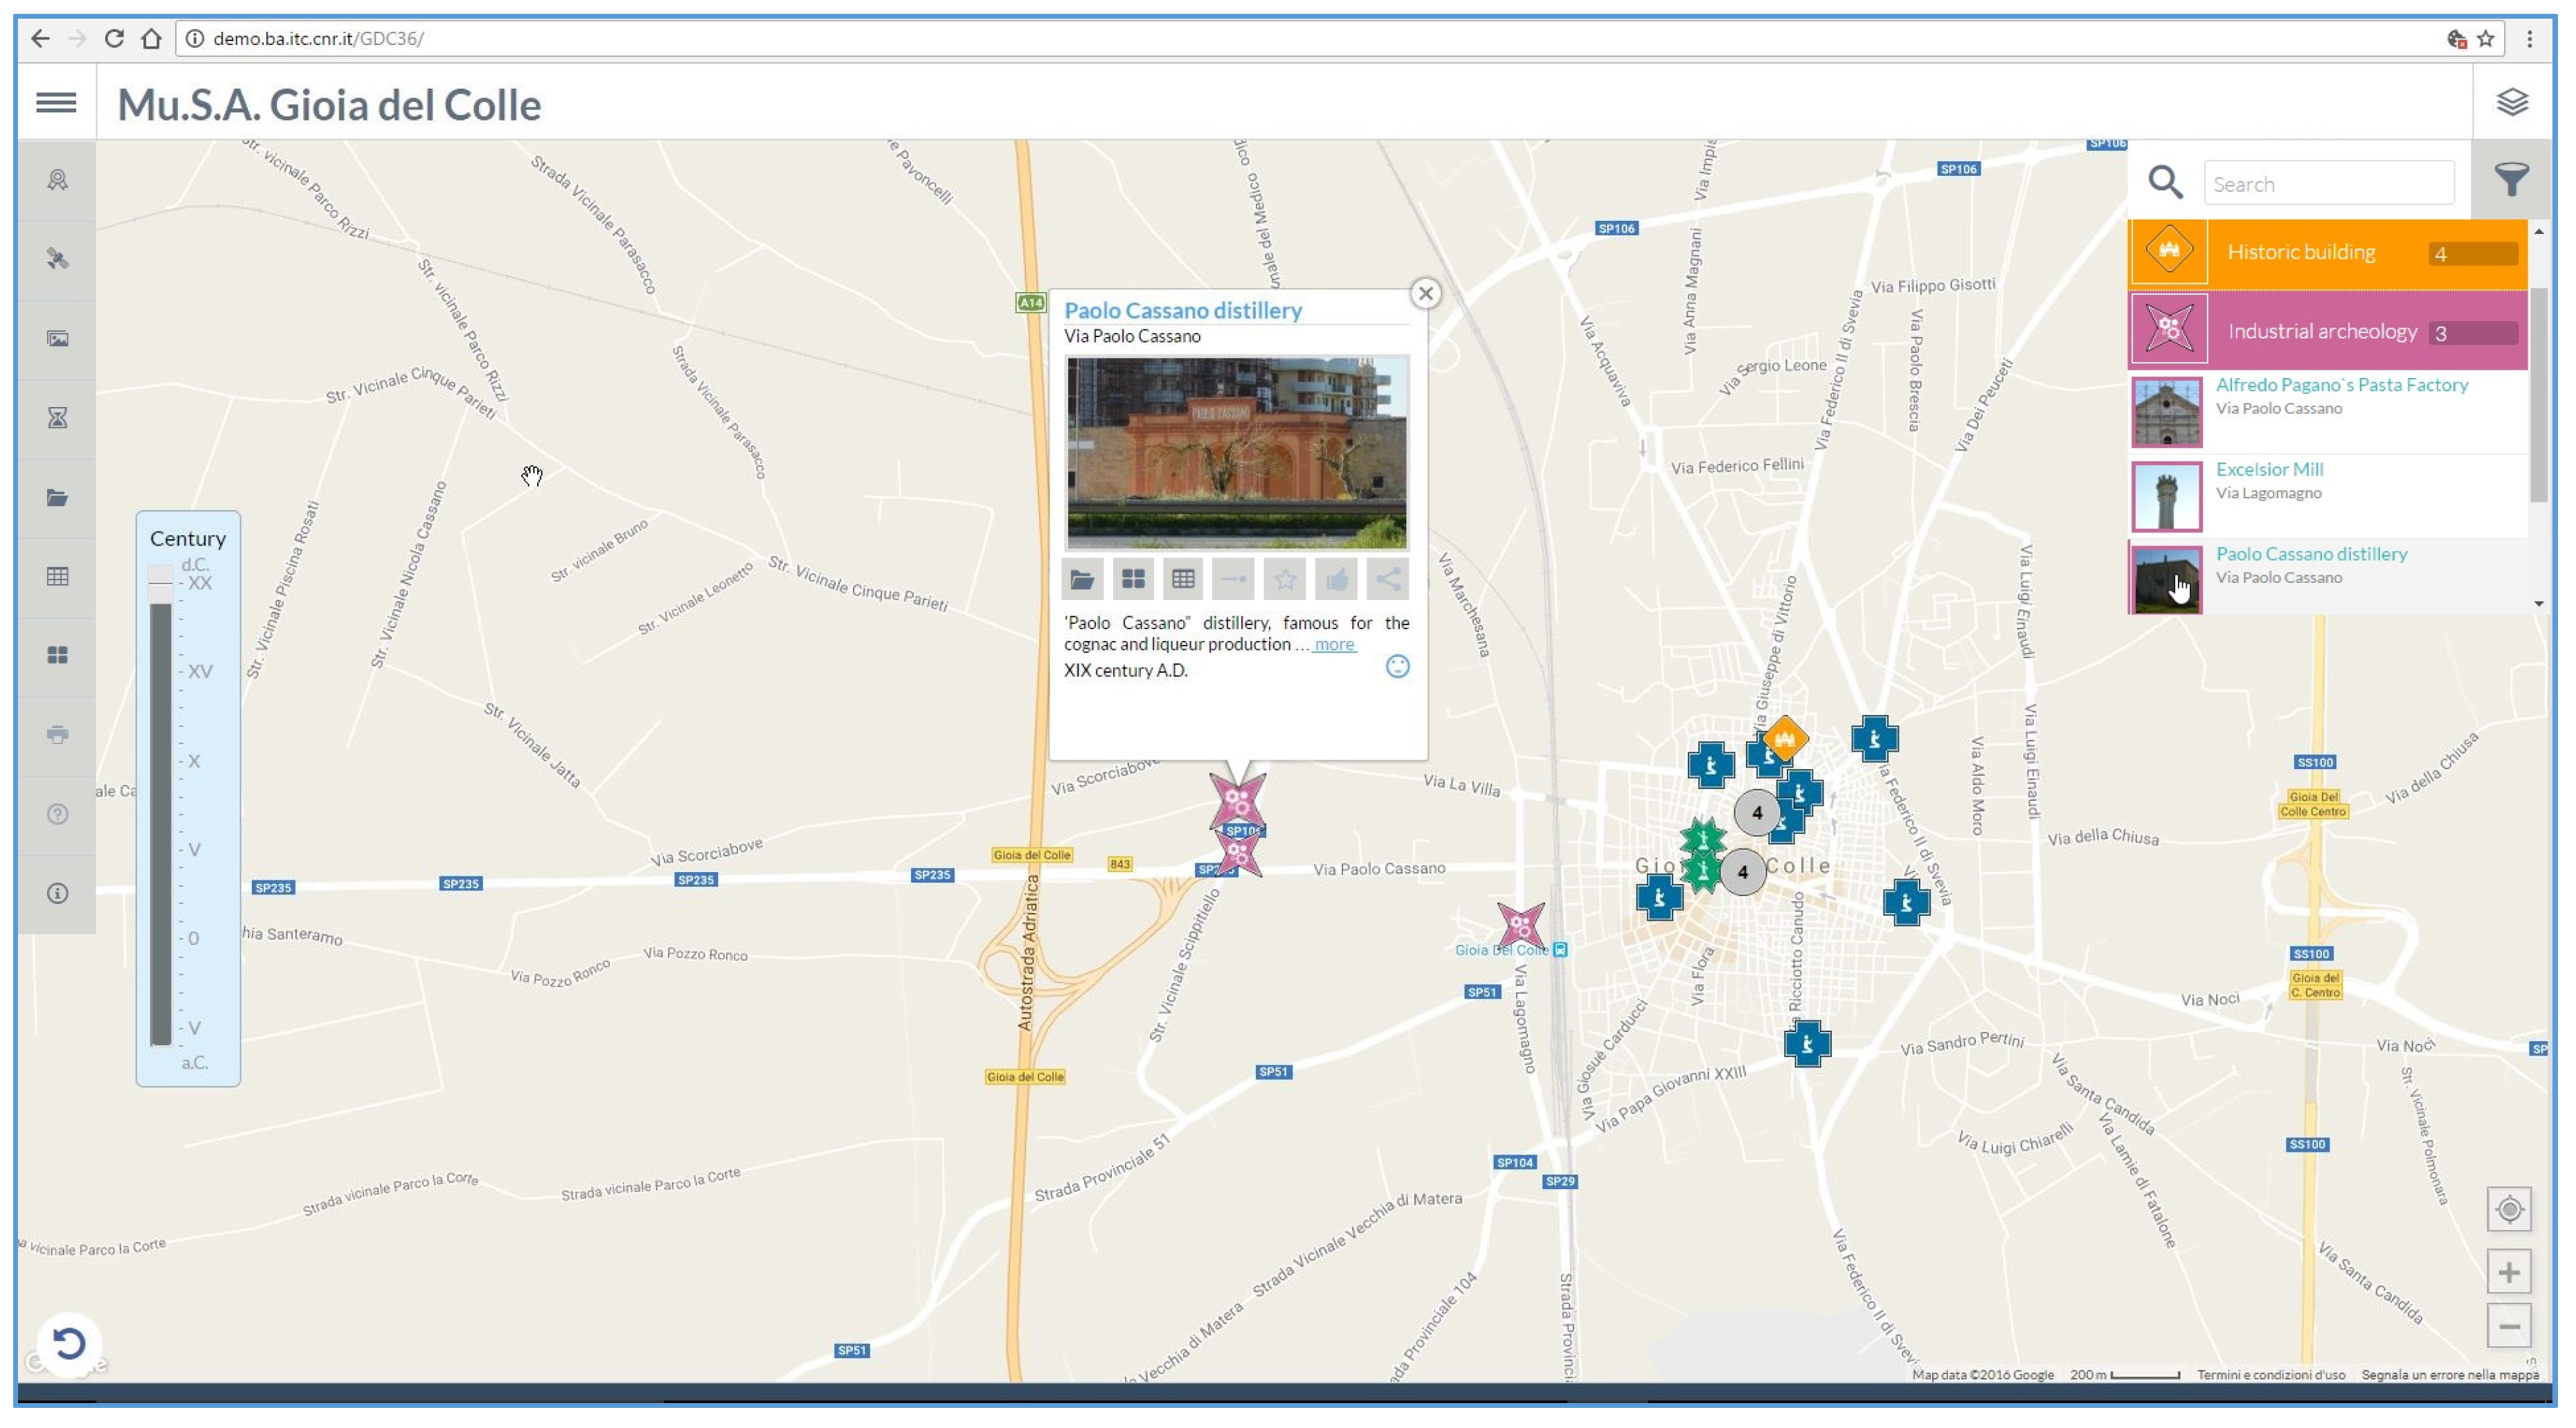
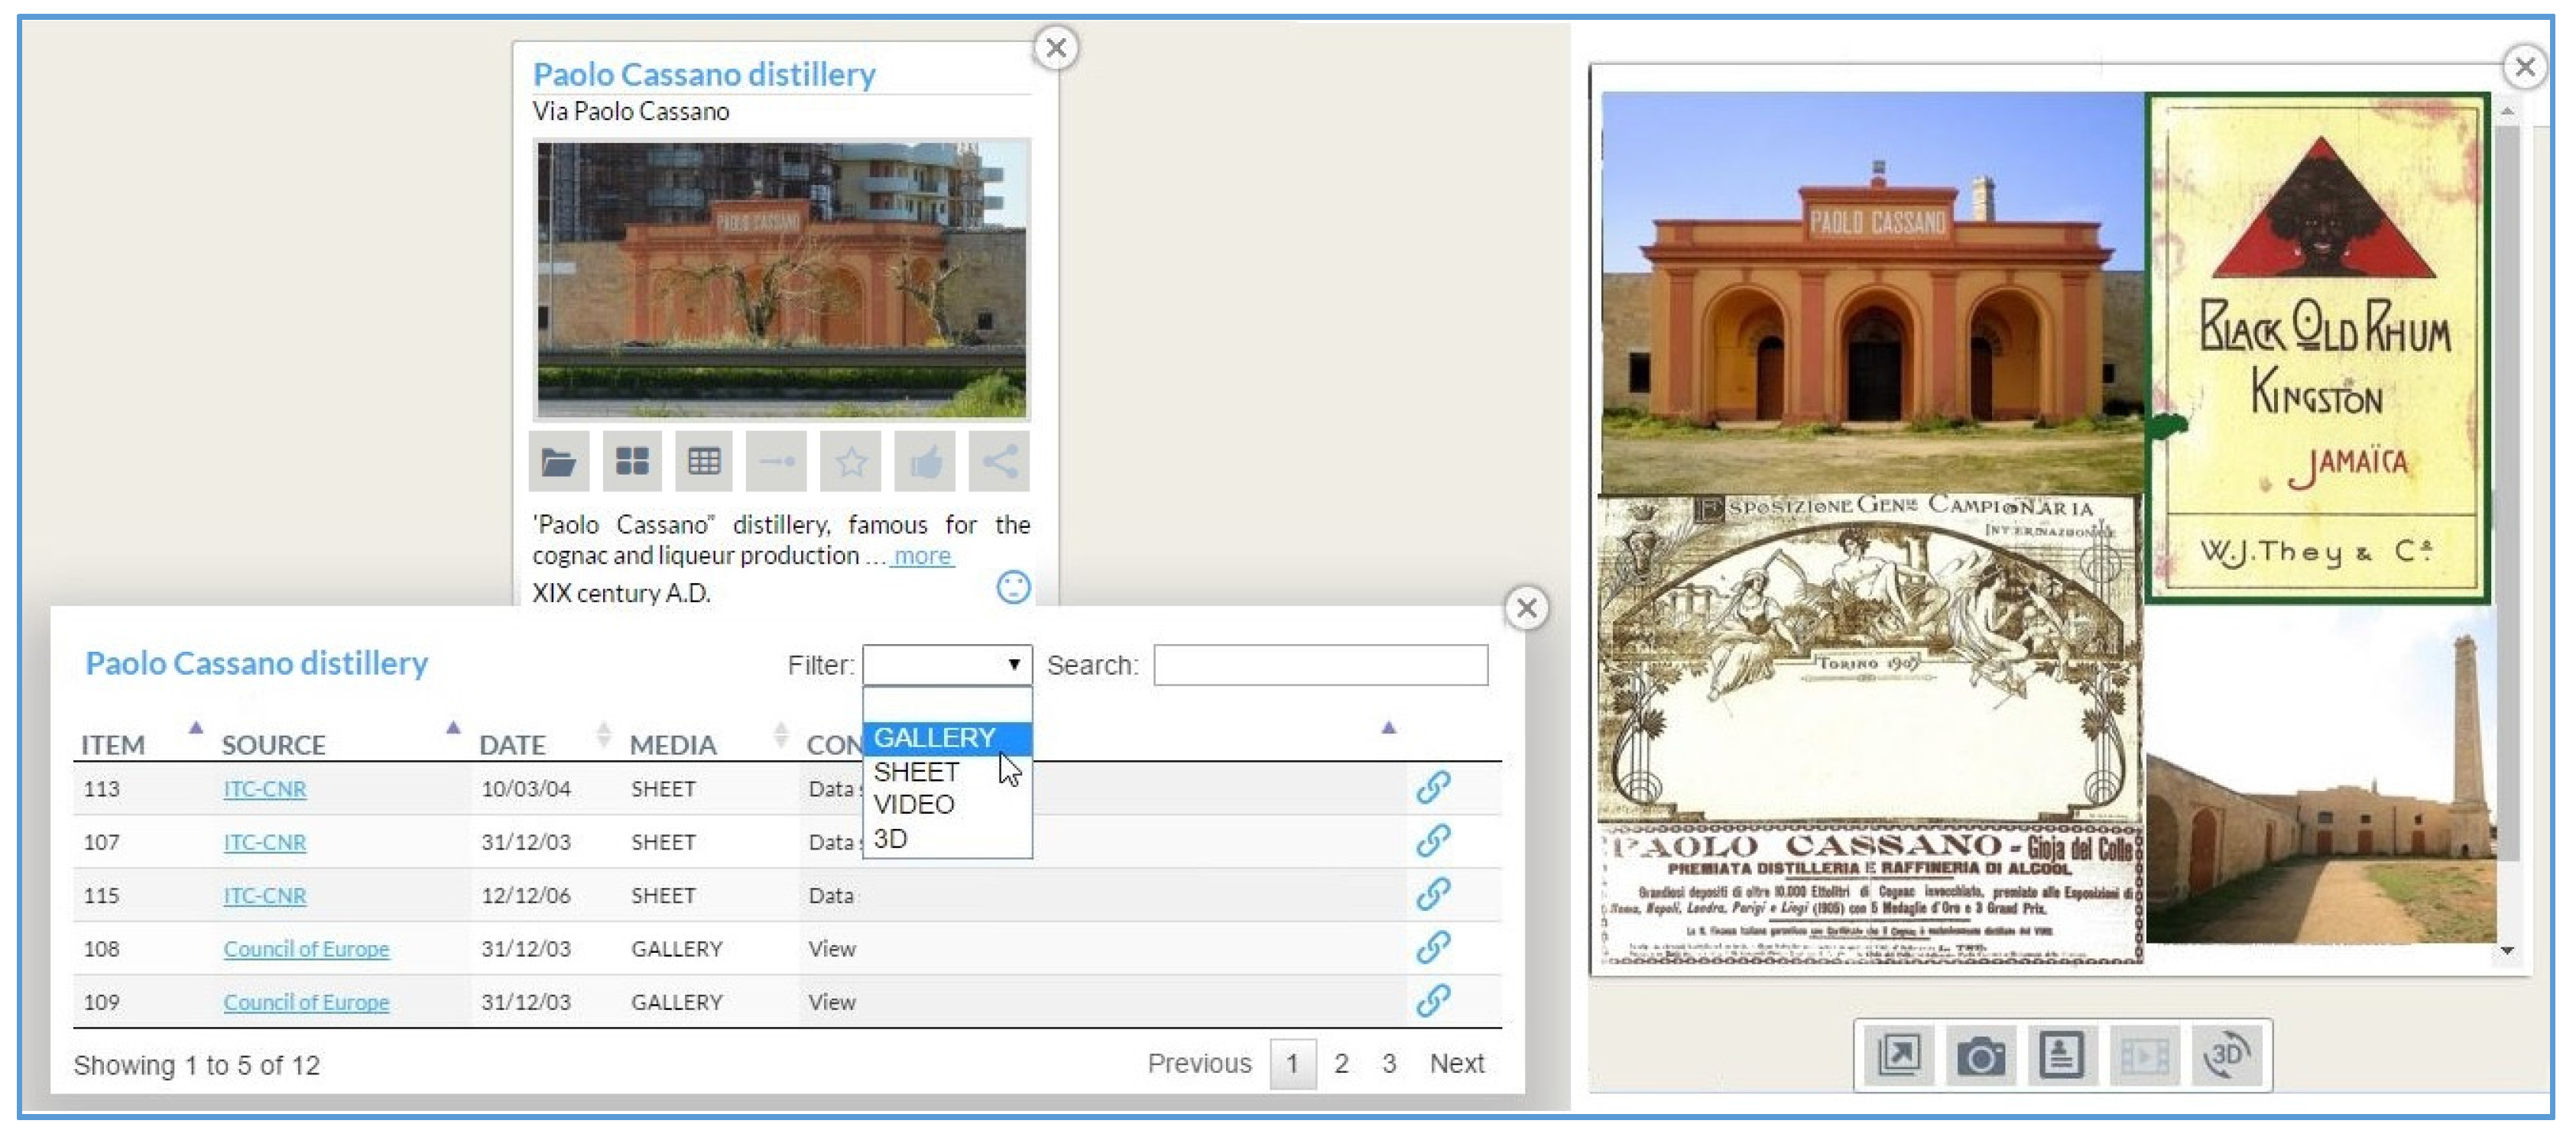
In the second phase, the multimedia documents pertaining to each PoI are collected, and the following data stored in another excel file: reference PoI, document name, description, category (sheet, image, video, and 3D multimedia object), source and its URL, with a preview image. These data are stored in an excel file and used to generate the one-page multimedia interactive map (
Figure 4) through an authorware environment.
Among others, three industrial archaeology PoIs were located, with the aim of overcoming the often negative associations of neglected or abandoned industrial sites, which are often demolished, resulting in the loss of an important piece of our history.
The examples reported in the figures refer to “Distilleria Cassano”, one of the most important monuments of industrial archaeology in Apulia, and included on the list of monumental and environmental heritage.
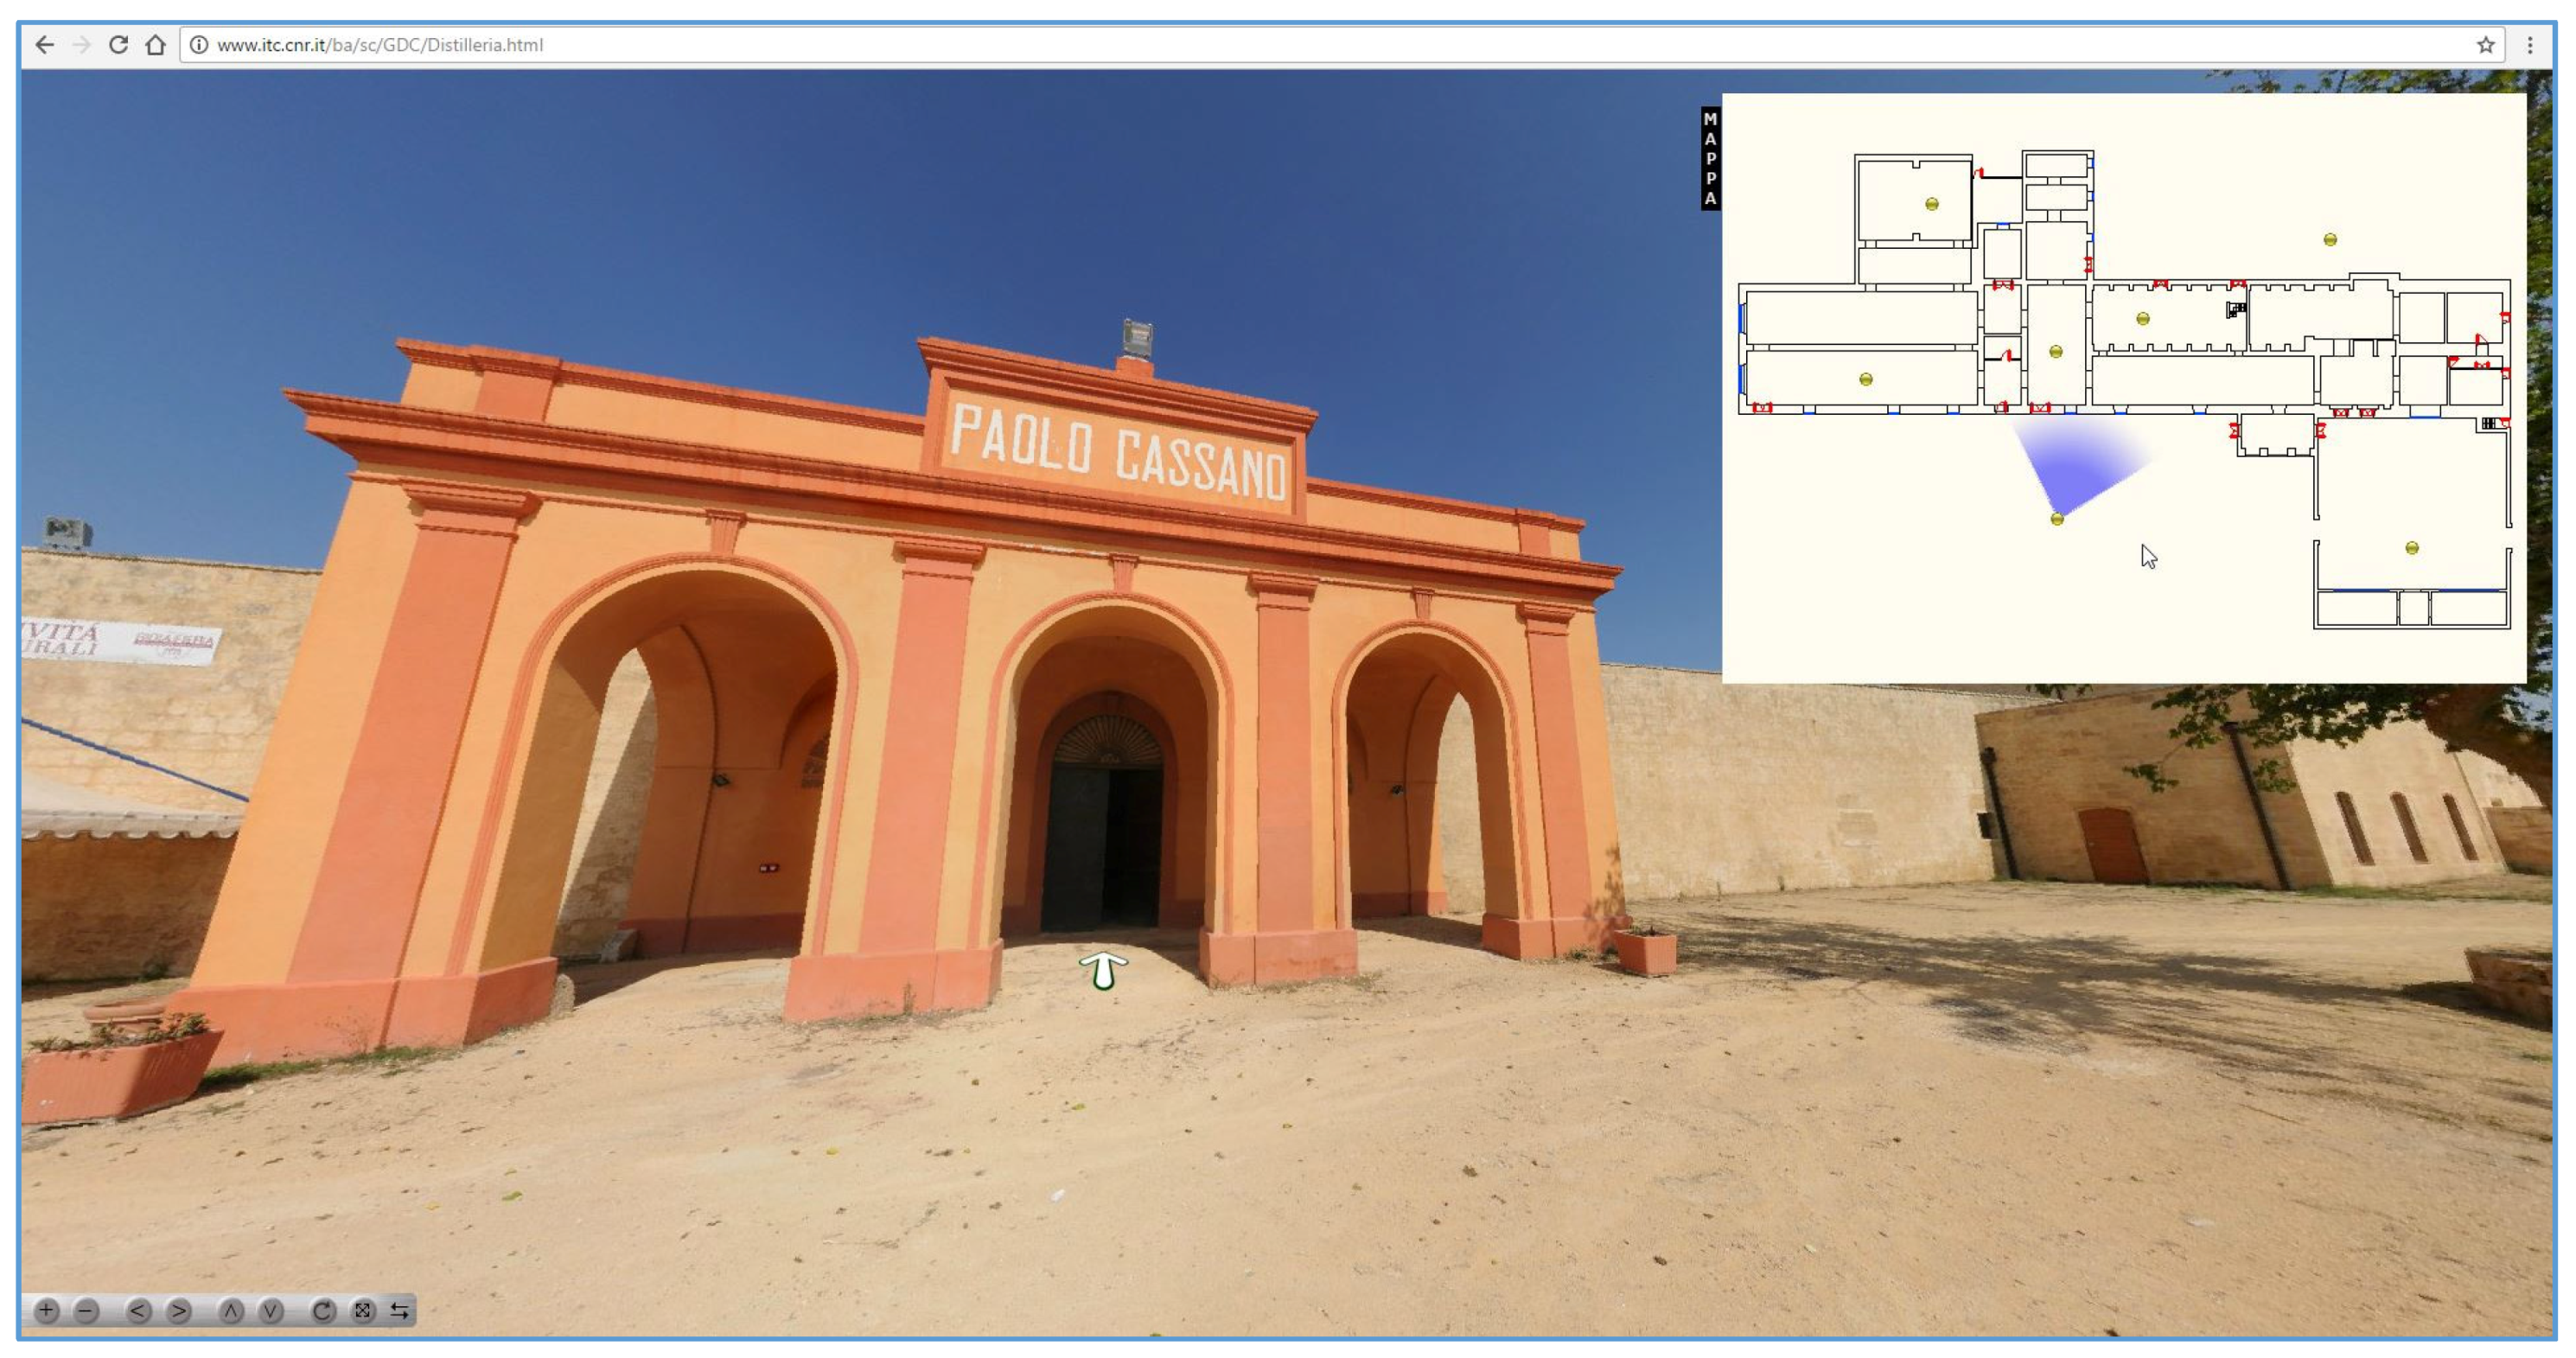
Upon its renovation, it hosts events. For that PoI, the interactive map has a link to a 3D multimedia object: a virtual tour of the building (
Figure 5).
5. The Architecture
Every software system has its own architecture, but not every software architecture is defined. This is what can make the difference as to whether a system works and how it is received by stakeholders. Sometimes the technology decisions mistakenly shape the architecture. The application must support a variety of different clients including desktop browsers, mobile browsers, and native mobile applications. It might also integrate with other applications via either web services or a message broker. Large complex software goes through a series of deconstructions at different levels.
At the higher (abstract) level, the architectural pattern used successfully is “Model View Controller” (MVC) [
13], which is concerned with the subsystems of an application’s relationships and collaborations with each other. It provides a strategy for large-scale components, the global properties, and mechanisms of a system. Specifically, our application is an example of a “Single-Page Application” (SPA), which is a different way of building HTML5 applications from traditional web page development.
In traditional web applications, the client initiates the communication with the server by requesting a page; the server then processes the request and sends the HTML of the page to the client. In ulterior interactions with the page, for example, the user navigates to a link or submits a form with data, a new request is sent to the server, and the flow starts again: the server processes the request and sends a new page to the browser in response to the new action requested by the client. In Single-Page Applications (SPAs) the entire page, usually, is loaded in the browser after the initial request, but subsequent interactions take place through AJAX (Asynchronous JavaScript and XML or JSON, often used in the AJAJ variant) requests. This means that the browser has to update only the portion of the page that has changed; there is no need to reload the entire page.
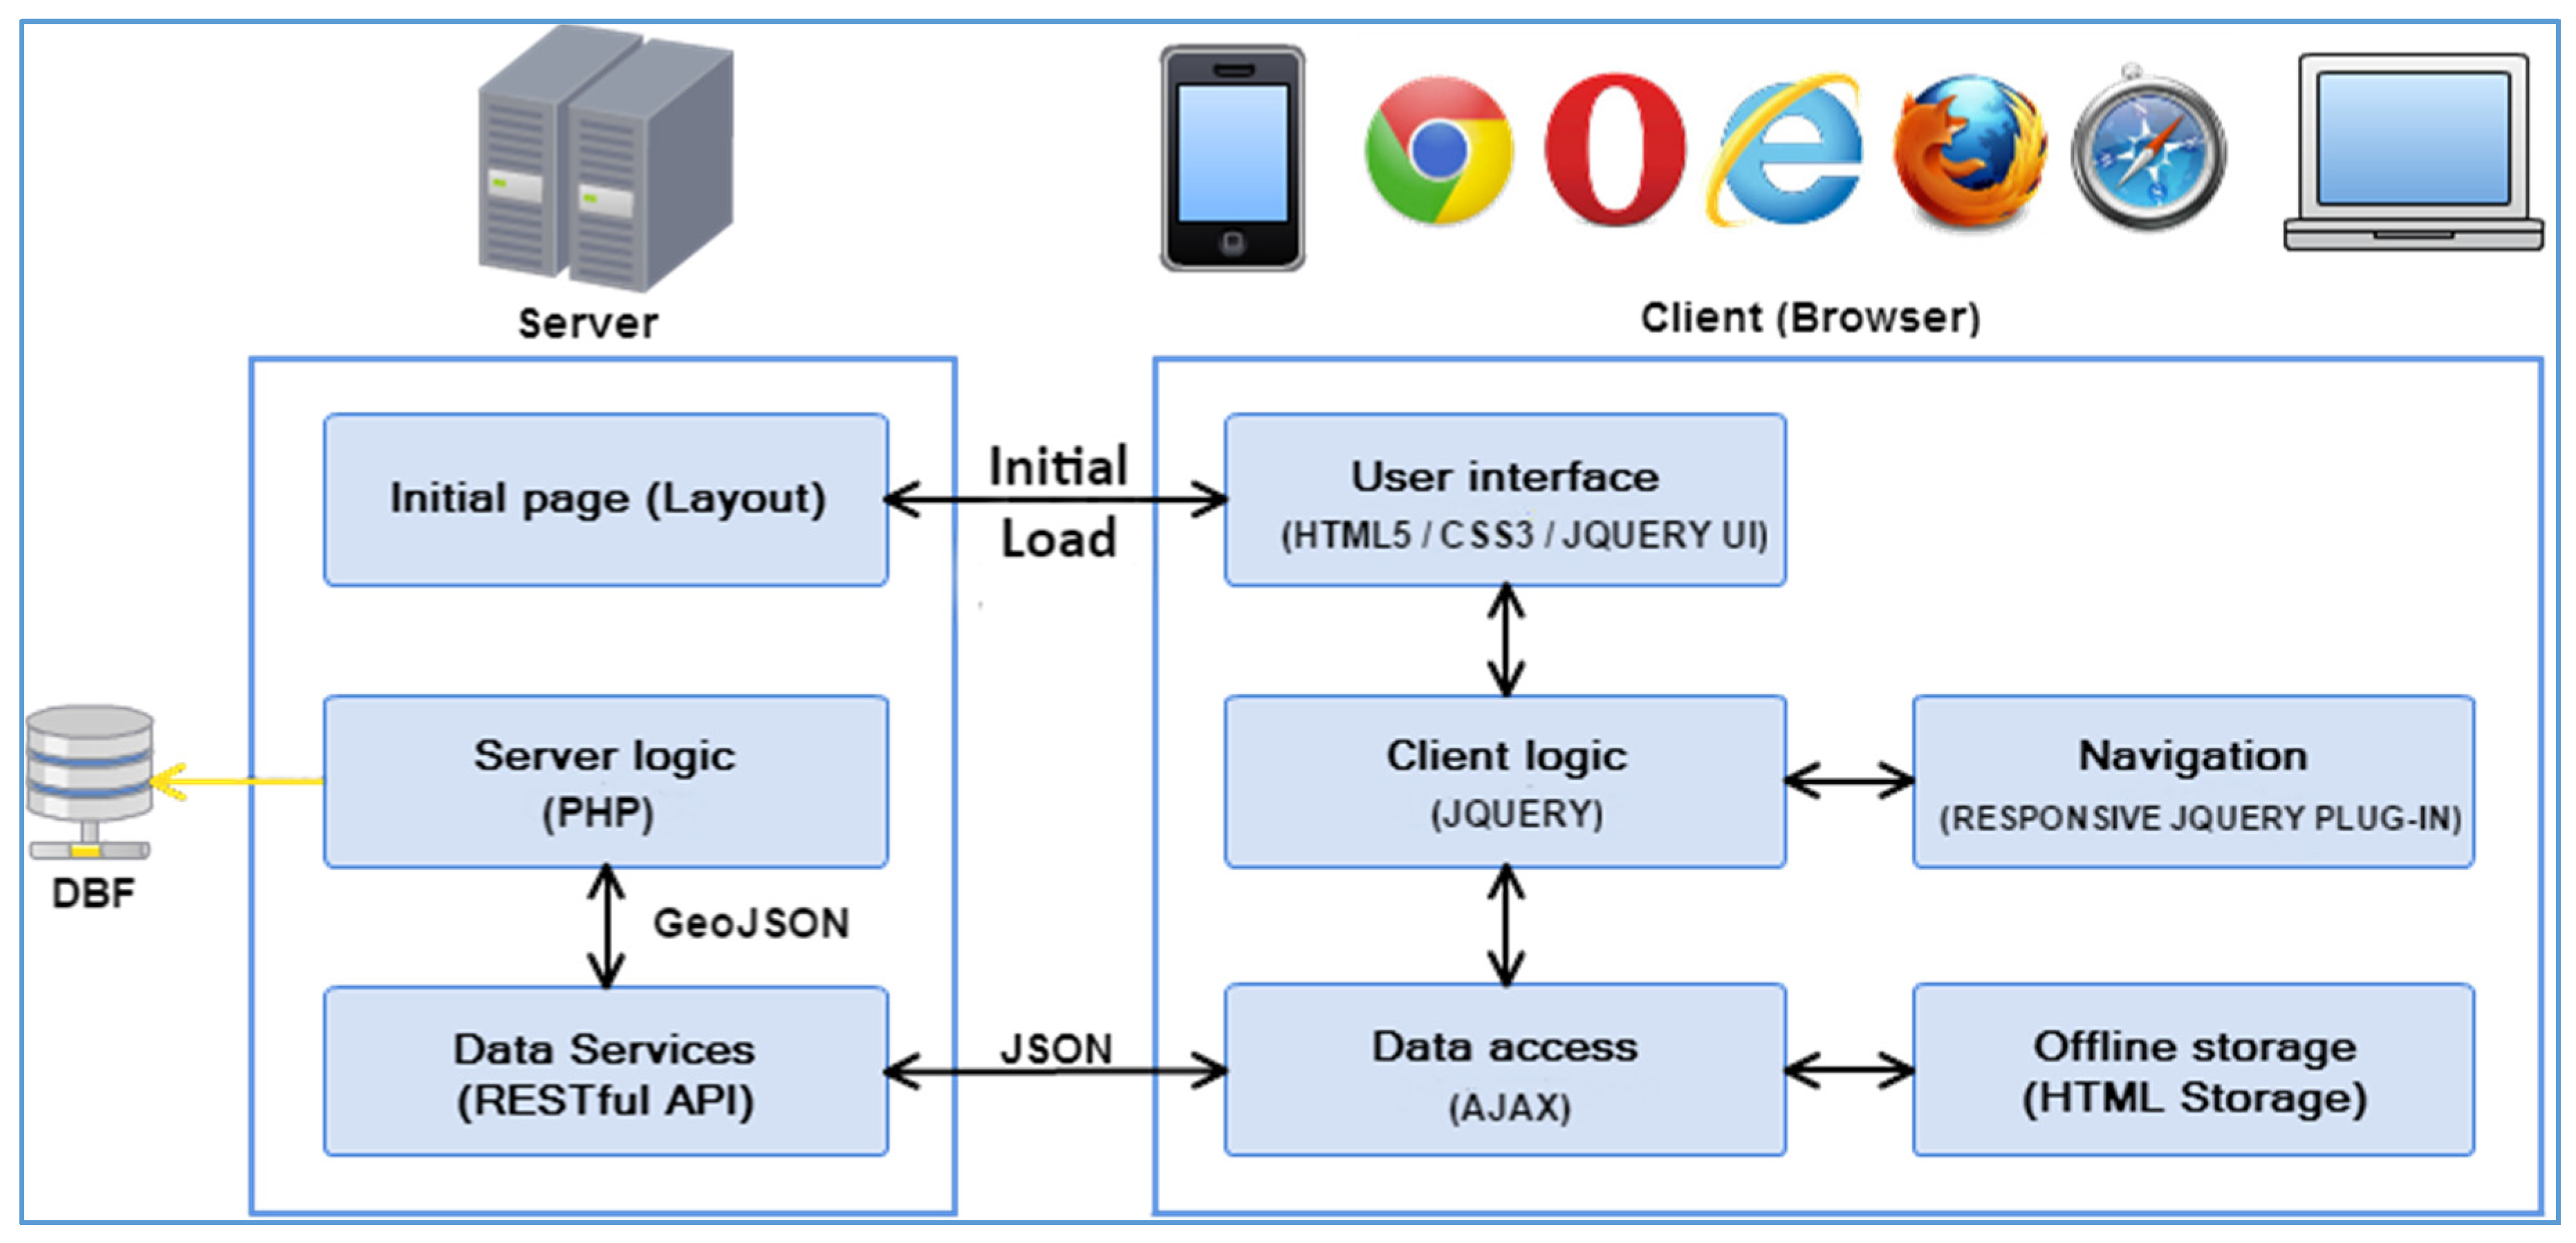
At the lower level, various schemes are provided for refining and building smaller subsystems. The MVC pattern defines not only the roles (Model, View, or Controller) objects play in the application, but it defines the way objects communicate with each other. The benefits of adopting this pattern are numerous. An application implemented using MVC can be RESTful or not; the application was designed to be RESTful. Many objects in this application tend to be more reusable, and their interfaces tend to be better defined. Further, the application is more easily extensible than other applications. The multimedia interactive map has a layered architecture (three layers) and consists of different types of components (
Figure 11, from the bottom upwards):
Data Source (Data services, Data access, Offline storage): Models/Collections of Models;
Interaction with the application (Server logic - PHP: Hypertext Preprocessor, Client logic—JQUERY), state capturing and navigation (Navigation): Events, Routing;
Markup for presenting data (Initial page, User interface): Templates.
Technically, SPA design and the initial development of SPAs were complex. It was necessary to find solutions to overcome the long waiting time, allowing SPAs to grow to optimal size. In this approach, the system client consists of HTML, jQuery, and CSS files that are partially or entirely rendered by the server, and sent to the web browser in real time. In this SPA, after the first page loads, all interaction with the server happens through AJAX calls. These AJAX calls return data in JSON format, specifically GeoJSON data structure.
The application uses the JSON data to update the page dynamically, without reloading the page, and separates the user interface (UI) library and the data (GeoJSON). It communicates with the server only through the JSON REST API (send/receive JSON using AJAX), allowing both parts to be independently developed and tested. This separation makes it easier to design and evolve each layer.
In addition, the application was designed to fit into an ordinary processing environment that includes structured programs and libraries (utilities, widgets, and plug-in), the most important of which is Google Maps API [
14].
5.1. The SPA Approach (at the Higher Level)
SPAs are web apps that load a single HTML page and dynamically update that page as the user interacts with the app. Instead of spreading the functionality of the multimedia interactive map across a collection of separate web pages with hyperlinks between them, it is possible to define a single root page on which the users will land and never leave as long as they are using the application.
This is a type of client-side logic that switches out the data and chunks of content within that page, allowing the users to navigate logical screens without leaving the page. This means that users never see a full-page refresh while using the application; instead, they see a change in a portion of the screen based on their interaction, and those changes can be done in a more fluid way with transitions to enhance the user experience. SPAs are fast, as most resources such as HTML pages, CSS files, and scripts are only loaded once throughout the life span of the application and only data are transmitted back and forth, reducing the bandwidth usage, which is also a plus. SPAs can use caching and local storage effectively. It is easy to scale and to cache resources. SPAs operate and feel more like an application than a web page. A major architectural advantage of an SPA is the huge reduction in the “chattiness” of the application. It was designed properly to handle most processing on the client and to reduce the number of requests to the server. In fact, an SPA makes it possible to do entirely offline processing, which is huge in this context. A “chatty” application has, as an important performance characteristic, a large number of remote requests and corresponding replies (“application turns” or “app turns” in Transaction Trace terminology). These are also often referred to as network round-trips, especially in developer documentation.
The negative performance impact of these application turns increases with path latency, making remote access a challenge for chatty applications. Note that chattiness is not inherently bad, only when coupled with network latency does it become a performance problem. Other advantages include the following:
“Easier state tracking”—an SPA does not need to use cookies, form submission, local storage, session storage, etc. to remember state between two page loads;
SPA boilerplate content, which is on every page (header, footer, logo, copyright banner, etc.), only loads once per typical browser session. This application is performed without additional overhead latency caused by switching “pages”.
SPAs are distinguished by their ability to redraw any part of the UI without requiring a server roundtrip request to retrieve HTML. This is achieved by separating the data from the presentation of data via a model layer that handles data and a view layer that reads from the models.
If an SPA grows to a significant size, loading the entire application on page load may be detrimental to the experience because this is akin to loading all pages of a website when only the home page was requested. The main advantage of this solution is that each component of the template may be included dynamically based on the inclusion and substitution of template fragments. Page content is downloaded first, along with any CSS and JQuery that may be required for its initial display, ensuring that the user gets the quickest apparent response during the page loading. Any dynamic features that require the page to complete loading before being used are initially disabled, and then only enabled after the page has loaded. This causes the jQuery to be loaded after the page contents, which improves the overall appearance of the page load.
The view layer is the most complex part of modern SPAs. After all, this is the whole point of an SPA—to make it easy to have awesomely rich and interactive views. Views have several tasks to perform:
Rendering a template. A method that takes data and maps it/outputs it as HTML5 is needed.
Updating views in response to change events. When model data changes, we need to update the related view(s) to reflect the new data.
Binding behaviour to HTML5 via event handlers. When the user interacts with the view HTML5, a method that triggers behaviour (code) is needed.
For the implementation of the editing environment, characterised by a high degree of interaction, we adopted the jQuery UI library, a jQuery-based library that provides a high level of abstraction for programming interaction and animation, advanced graphic effects, and customisable event handling.
The Model layer’s job is to represent the problem domain, maintain state, and provide methods for accessing and mutating the state of the application. This layer (in particular, data services RESTful API components) is responsible for reading from the backend using a simplified and more powerful API. It accepts JSON data, and returns JSON objects that are converted into Models, from the data store/cache and also queries the backend as well. Lookups by ID can be fetched directly from the cache, but queries that are more complicated need to be sent to the backend in order to search the full set of data.
The data services were built using the lighter RESTful architecture, and JSON has become a de facto standard data exchange format for REST web services.
5.2. The RESTful Approach (at the Lower Level)
In this architected SPA, we can change the HTML markup without touching the code that implements the application logic and all UI interaction occurs on the client side, through jQuery and CSS. In computing, REST is an architectural style defined by a set of six constraints, which are intended to promote performance, scalability, simplicity, modifiability, visibility, portability, and reliability [
15]. REST consists of a coordinated set of components, connectors, and data elements within a distributed hypermedia system, where the focus is on component roles and a specific set of interactions between data elements rather than on implementation details.
The adoption of the REST architectural style is aimed at obtaining a “stateless” solution software in which each request from a client to the server contains all of the information necessary to process the request and the server does not store any session data on behalf of the client; instead, the client must store all session data. Indeed, the reliance of SPA on REST is perhaps the most immediately apparent characteristic of SPA. Furthermore, SPA is easy to debug with “Google Chrome”, which allows monitoring of network operations and investigation of page elements and the data associated with them. All the major mobile platforms, including Apple’s iOS, Google’s Android, and Palm’s WebOS, use similar webKit-based browsers. Hence, technologies like HTML5 and CSS3 will continue to be improved and supported. The application works for the majority of mobile platforms and also works on any HTML5-compliant web browser. A browser compatibility test conducted saw the application rendering without any errors on “Google Chrome”, the only web browser on which we tested the application because of its widespread usage.
HTML5 enables developers to write truly “responsive” applications that resize automatically according to the browser and the screen size, automatically detecting and changing the UI in compliance with the running platform and the orientation of the device. The combination of SPA and “responsive web design” [
16] pattern appears to have established itself as a significant trend for efficient web application development. SPA’s inherent separation of UI and application logic creates an opportunity to share common application logic and testing assets through a shared RESTful API. This allows browser-based web applications and native mobile applications to share the same application code on the “backend”.
5.3. The “GeoJSON” Data Type
To simplify the publication of geo-referenced information, the application stores all the data in a GeoJSON (Geographic JavaScript Object Notation) file rather than in a database, which would require the installation of a DBMS if it was not already present on the server hosting the system. GeoJSON is a specialisation of the JSON data interchange format that can manage geo-referenced data using a subset of instructions provided by the JavaScript language.
GeoJSON supports cartographic visualisations by facilitating the display of lines, polygons, and other geometry objects. Developed as an open standard and widely adopted, it can be used to create map layers as the storage format.
There are several development platforms aiming to represent complex datasets; the best is probably GitHub, a web-based Git repository hosting service used by over 12 million people, rendering any file with the “.geojson” suffix as a map.
GeoJSON gives users a number of advantages. They are as follows:
It standardises the method used to pass information. Multiple vendors have subsequently adopted this method, which enables us to have APIs that all operate in the same manner. This can help us to discard Google Maps APIs and switch to OpenLayers or future GIS platforms; the operation would be the same, thereby preserving the integrity of the data.
Relative to the client-server computing model, the backend can serve multiple clients in the same manner or, conversely, the client can render maps regardless of how the backend is implemented—as long as it uses GeoJSON. This enables the client to be independent of the map server and simply become a consumer of GeoJSON, irrespective of how it was generated.
It can be used with modern programming languages and is readily available to run using JavaScript without further parsing. The geo-data is easily browsable because it is a regular JavaScript object. This easily facilitates further processing.
It is easy to read and write. A complete GeoJSON data structure is always an object (in JSON terms). In GeoJSON, an object consists of a collection of name/value pairs, also called members.
5.4. The Client Logic of Our Application
The multimedia interactive map uses AJAX, with a client-side control mechanism that utilises jQuery to interact with users and controls. The advantage of this control mechanism is that a specific section or a simple object can be updated without reloading the entire page to prevent the invocation of unnecessary page life cycle events, with the following effects:
Reduction in network latency to minimise the response time.
Web applications with the feel of desktop applications.
Updating of data behind the scene.
Low bandwidth utilisation.
Asynchronous interaction.
Most current SPAs still use the term “Controller layer”. However, we believe that SPAs require a better term, because they have more complex state transitions than a server-side application. We clearly need a model to hold data and a view to deal with UI changes, but the glue layer consists of several independent problems: global state changes, like going offline in a real time application or delayed results from AJAX that get returned at some point from backend operations and more.
The solutions used each have their own terms, such as event bindings, change events, and initialisers. Google Maps API is integrated in the application for rendering geospatial data within a web browser and for accessing rich mapping features. It is “optimised” for smartphones, with a set of APIs developed by Google, which allow communication with Google Services and their integration to numerous other services. Another advantage of this is that not all data have to be transferred.
Only the data one wishes to transfer are transferred; the less data transferred, the faster the transfer and the less likelihood of breakdown. The Client logic component automatically synchronises data from your UI (view) with the JSON objects (model) through two-way data binding: from server (server storage) or from client (HTML storage-client-side storage). jQuery fits well in this model because the whole end-user interaction experience is handled with logic on the client as well as on the server in varying percentages per page.
There are several reasons to use client-side storage:
The multimedia interactive map is available when the user is offline, possibly synchronising data back once the network is reconnected.
It is a performance booster. Consequently, it is possible to show a large corpus of data as soon as the user clicks on the application objects (slideshow, tile, table, etc.), instead of waiting for it to download again.
It is an easy programming model, with no server infrastructure required. Of course, the data are more vulnerable and the user cannot access these data from multiple clients. Therefore, it should only be used for non-critical data, particularly cached versions of data that are also “in the cloud”.
6. Conclusions and Future Work
This paper presented a project report about the design and implementation of a multimedia interactive map loaded in a single HTML page, tested in collaboration with the “Ricciotto Canudo” secondary school in the city of Gioia del Colle.
At present, the tool provides advanced functionality to easily deal with the manipulation of multimedia objects via a graphical UI, but it will be necessary to enhance the application in several ways.
Interface. The interface will be improved to allow users to share the popularity of each PoI using a simple “yay/nay” approach because it is unambiguous (everyone generally either likes or dislikes something). The ranking formula will be Rank = (Like + 1)/(Dislike + 1) × LOG10(Like + 1) to avoid the division by zero and rank PoIs with more likes more highly than PoIs with fewer likes [
17].
Moreover, an authorware environment for producing the interactive map will be developed. It will have a live preview of the data assigned and multimedia objects uploaded, giving the user a direct feedback means.
Architecture. We have developed a medium tablet version and a large desktop version for the interactive map; a small mobile version will soon be completed. Up to this point, we have focused our attention on a specific responsiveness strategy, optimising the process that delivers the output by eliminating time-wasting and using idle time to prepare for the operations a user might do next. The interactive map delivers intermediate results, before the operation is finished (before all images are loaded) without the user noticing.
Appropriate mechanisms needed to ensure quality [
18], and detect and remove errors have been developed and assessed. However, establishing some sort of trust in the collected VGI dataset is an important factor to avoid incorrect or malicious geographic annotations.
Up to now, we checked positional accuracy by comparison (a manual approach preferred over an automated approach to avoid any processing errors [
19]). Moreover, “Keep Right”, “Osmose”, or “OSM Inspector” can be used to visualize detected errors in the map.
To ensure the usability of the web application under different situations, test cases will be written covering the different scenarios, of not only functional usage, but also technical considerations such as network speeds and screen resolution. We will utilise a questionnaire that measures five components: content, accuracy, format, ease of use, and timeliness [
20].


