Using Eye Tracking to Explore Differences in Map-Based Spatial Ability between Geographers and Non-Geographers


Abstract
:1. Introduction
2. Background and Related Work
2.1. Spatial Ability
2.2. Eye-Tracking Methods to Evaluate Map-Based Spatial Cognition
3. Empirical Study
3.1. Participants
3.2. Apparatus
3.3. Materials
3.4. Procedure
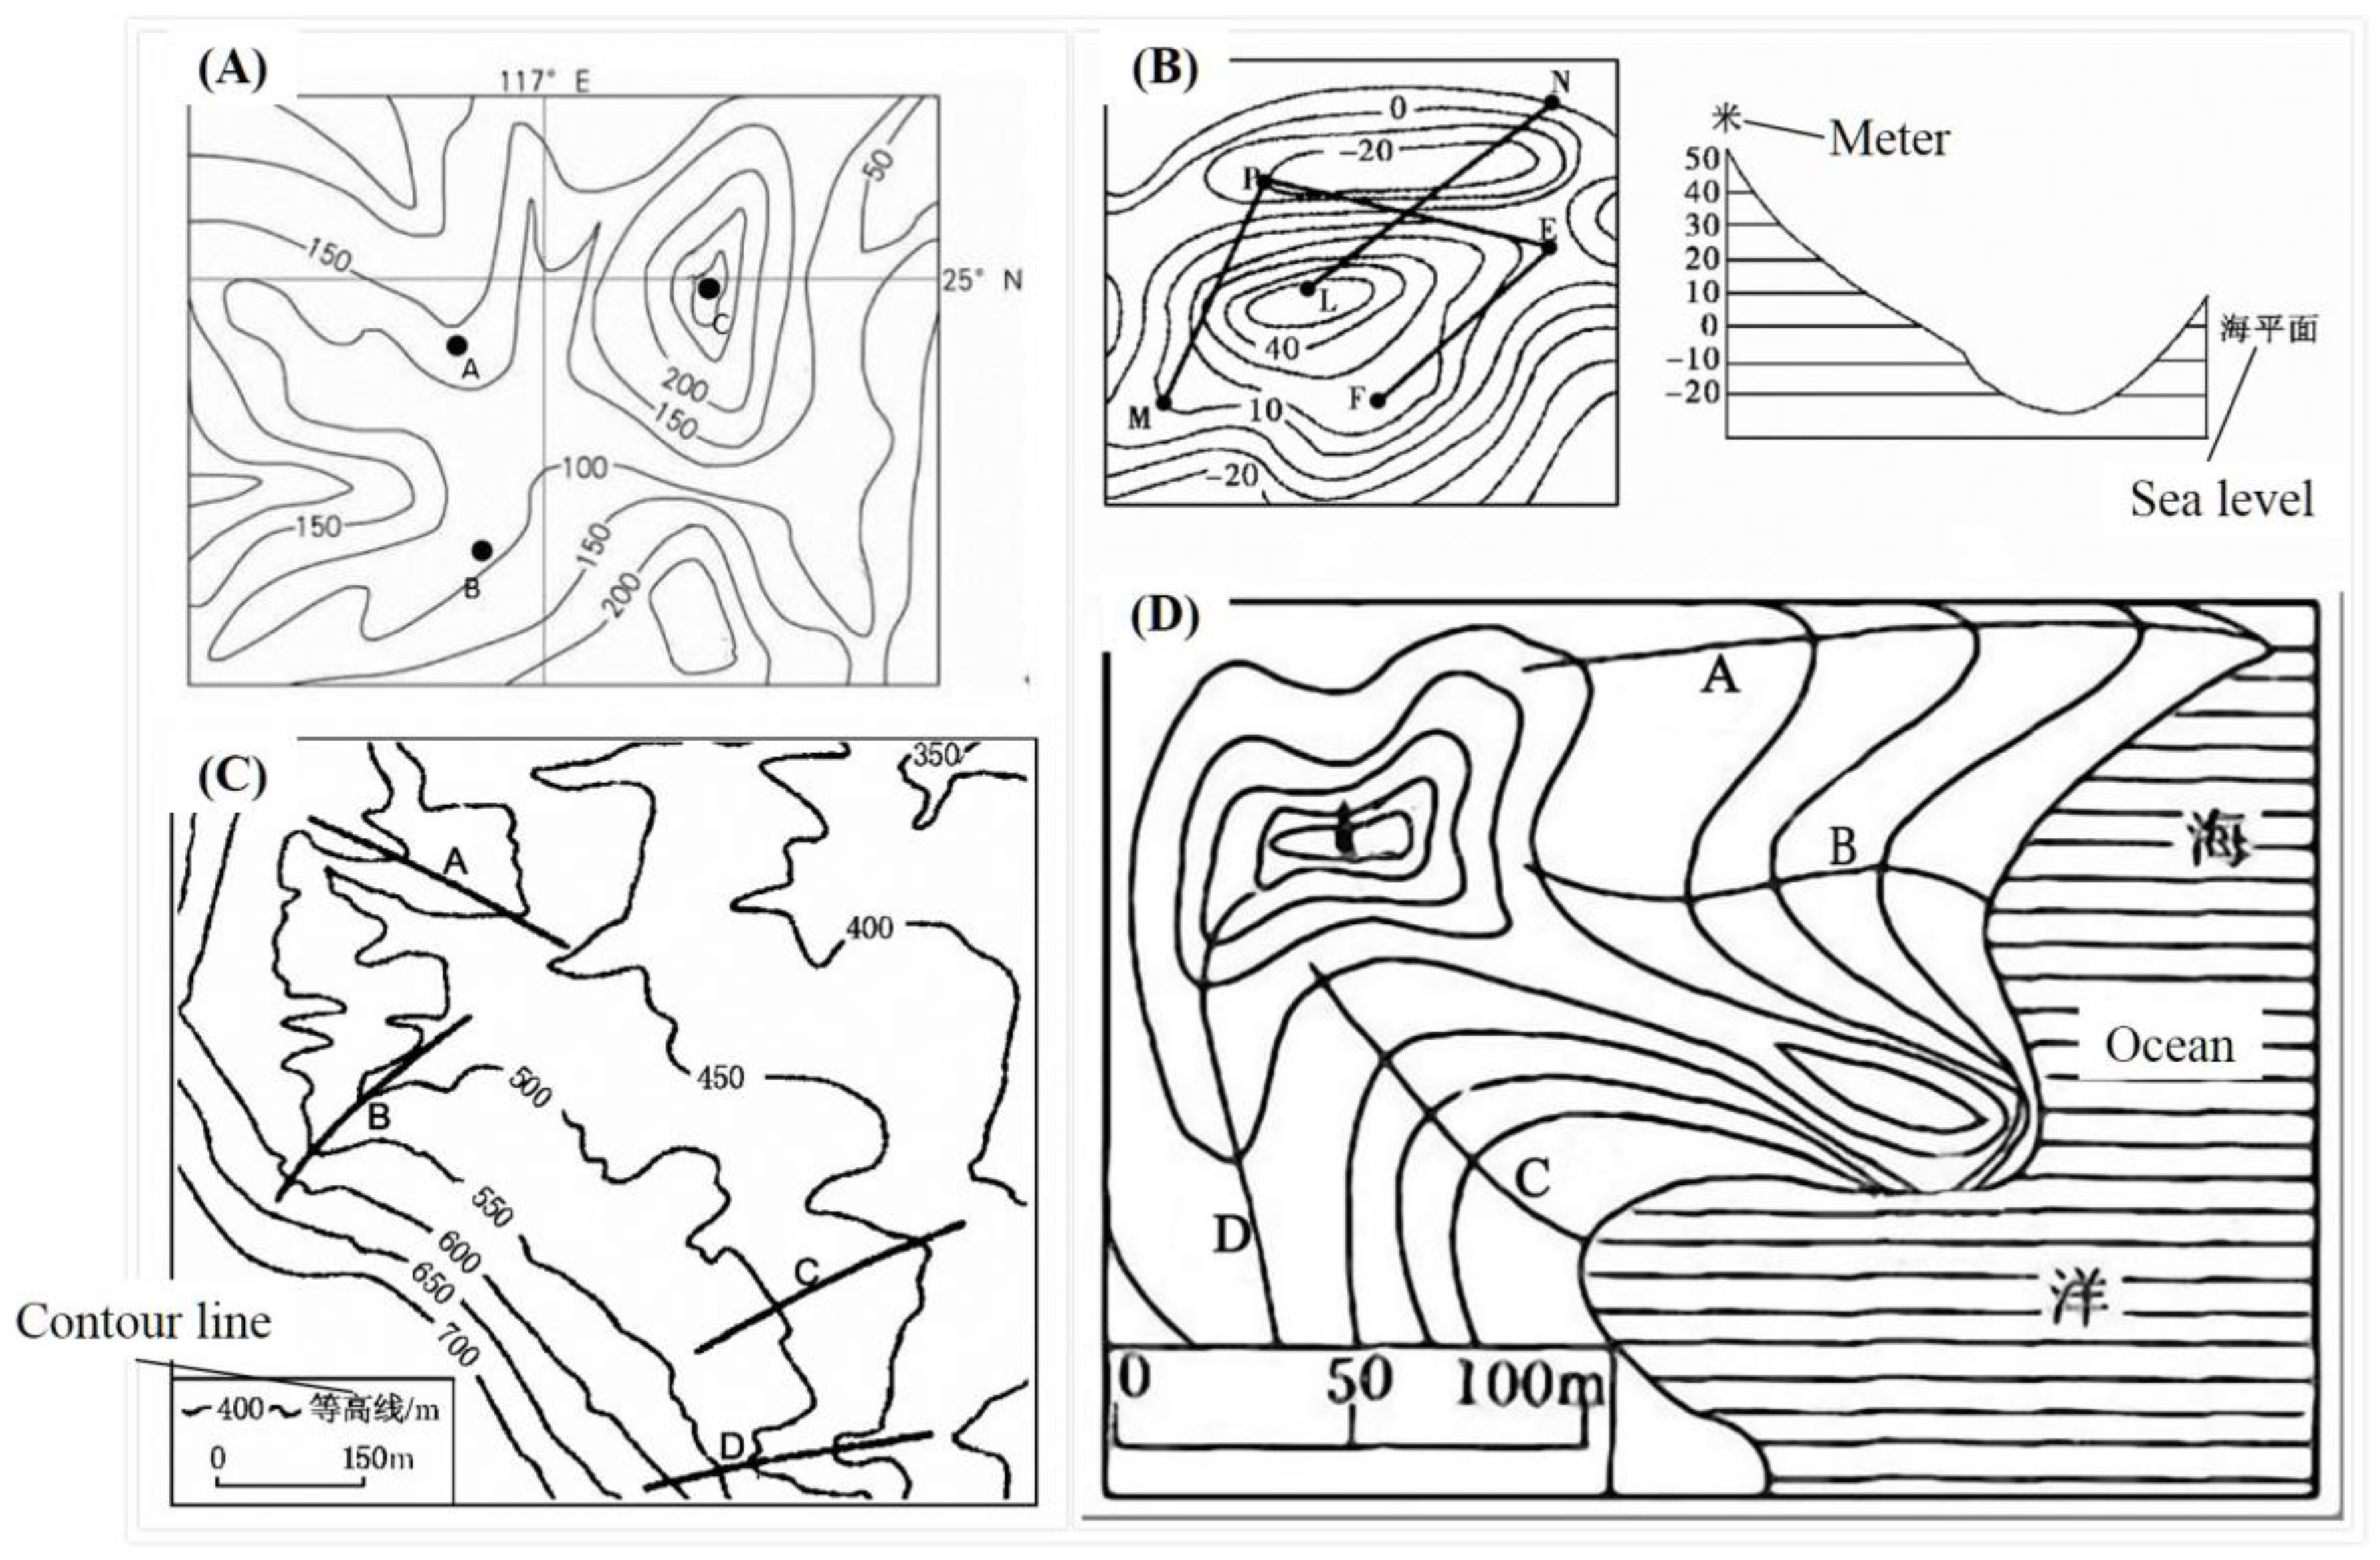
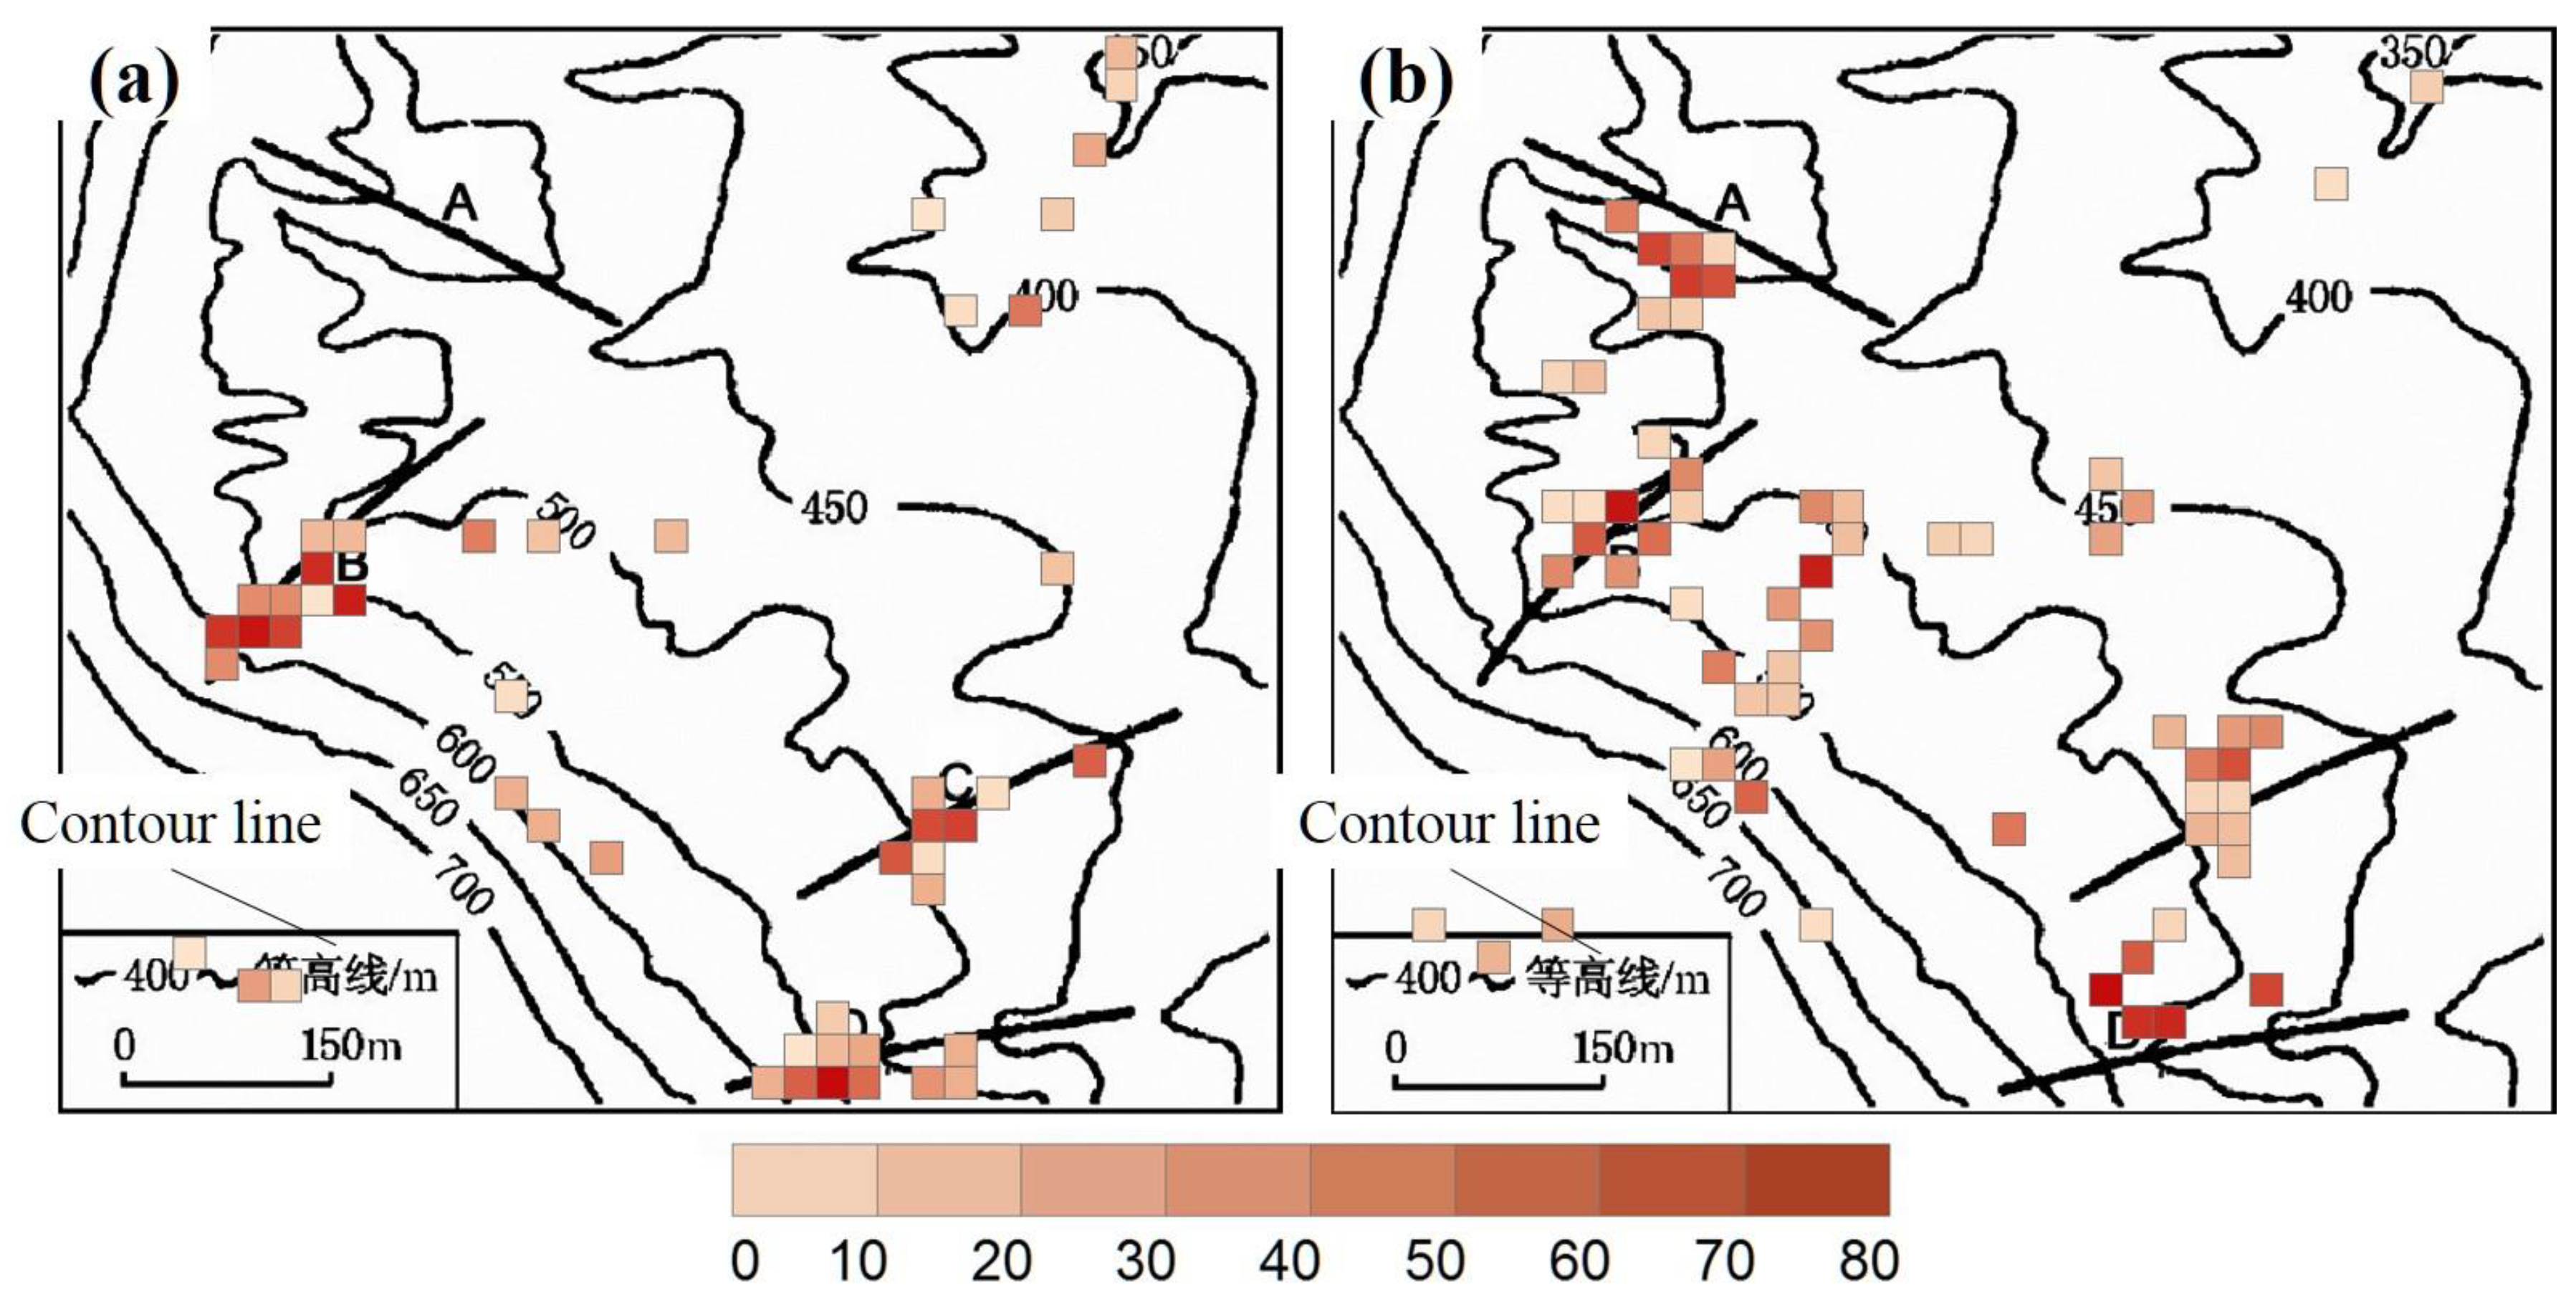
- Task #1 (Point localization with contour lines): Imagine you are in a topographic map-reading test. There are several points marked with letters on the map. Please tell the experimenter which marked point has the highest altitude as soon as you come up with an answer. When you have finished answering the question, please click the left mouse button.
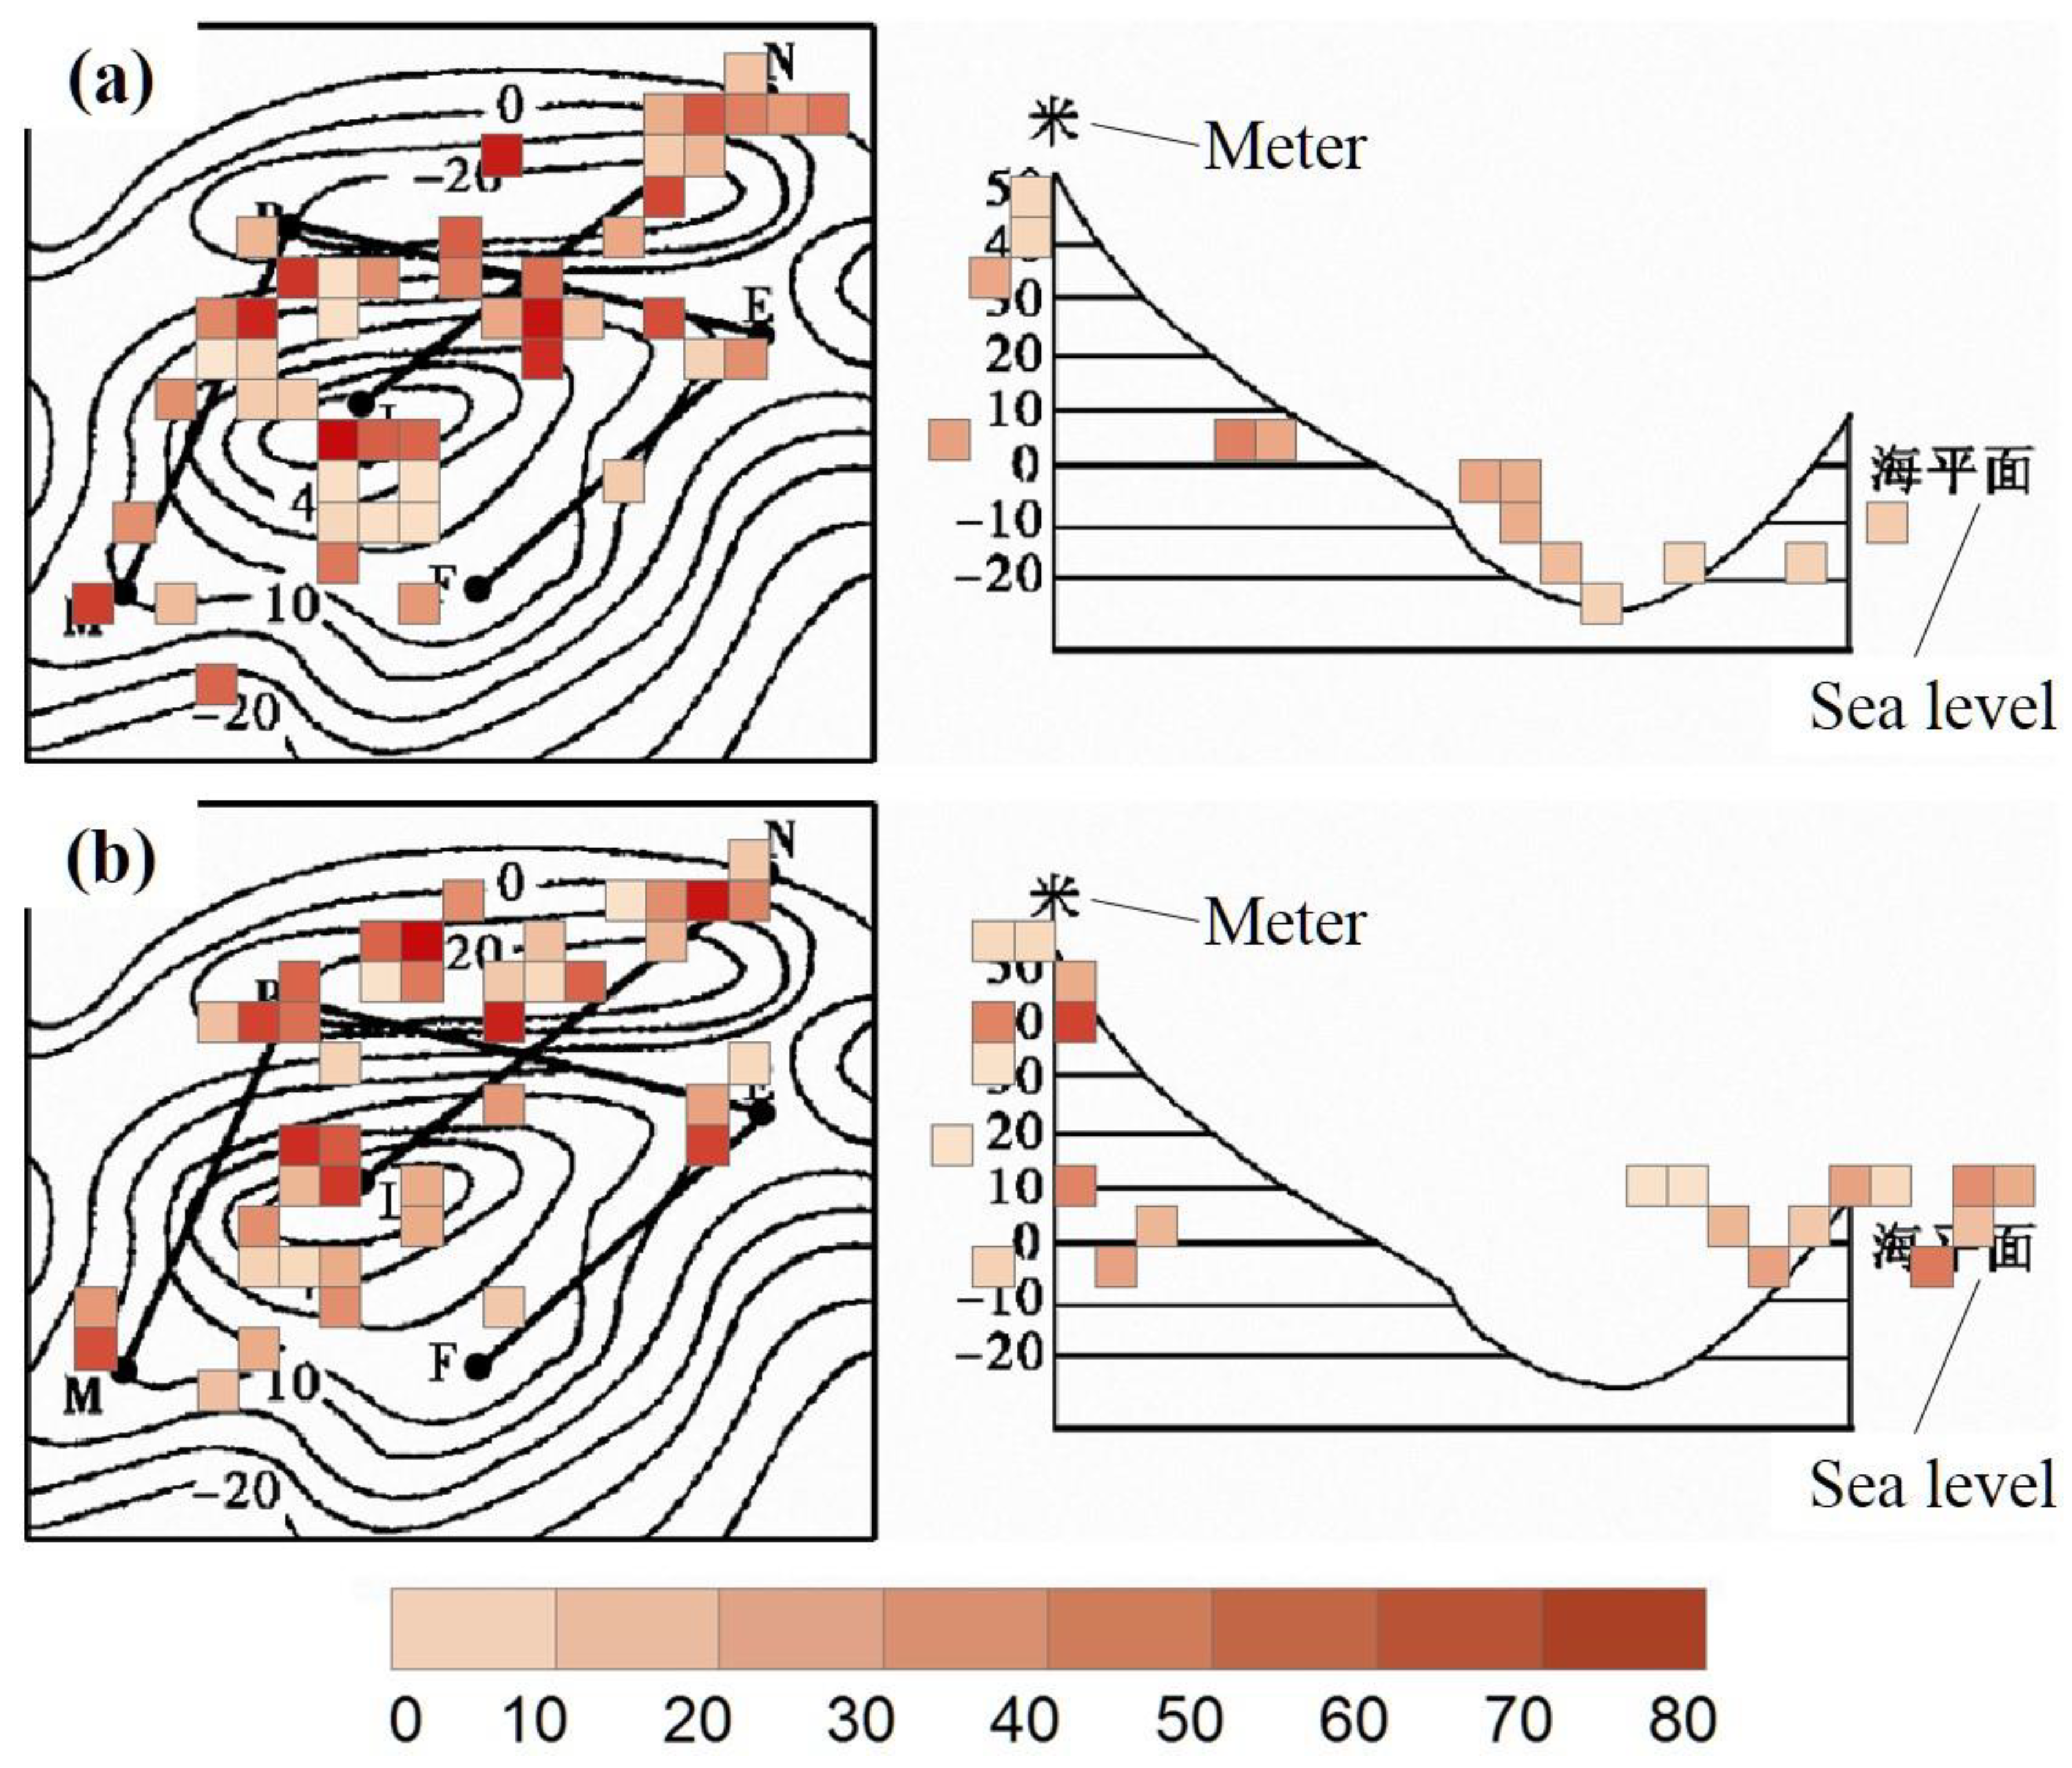
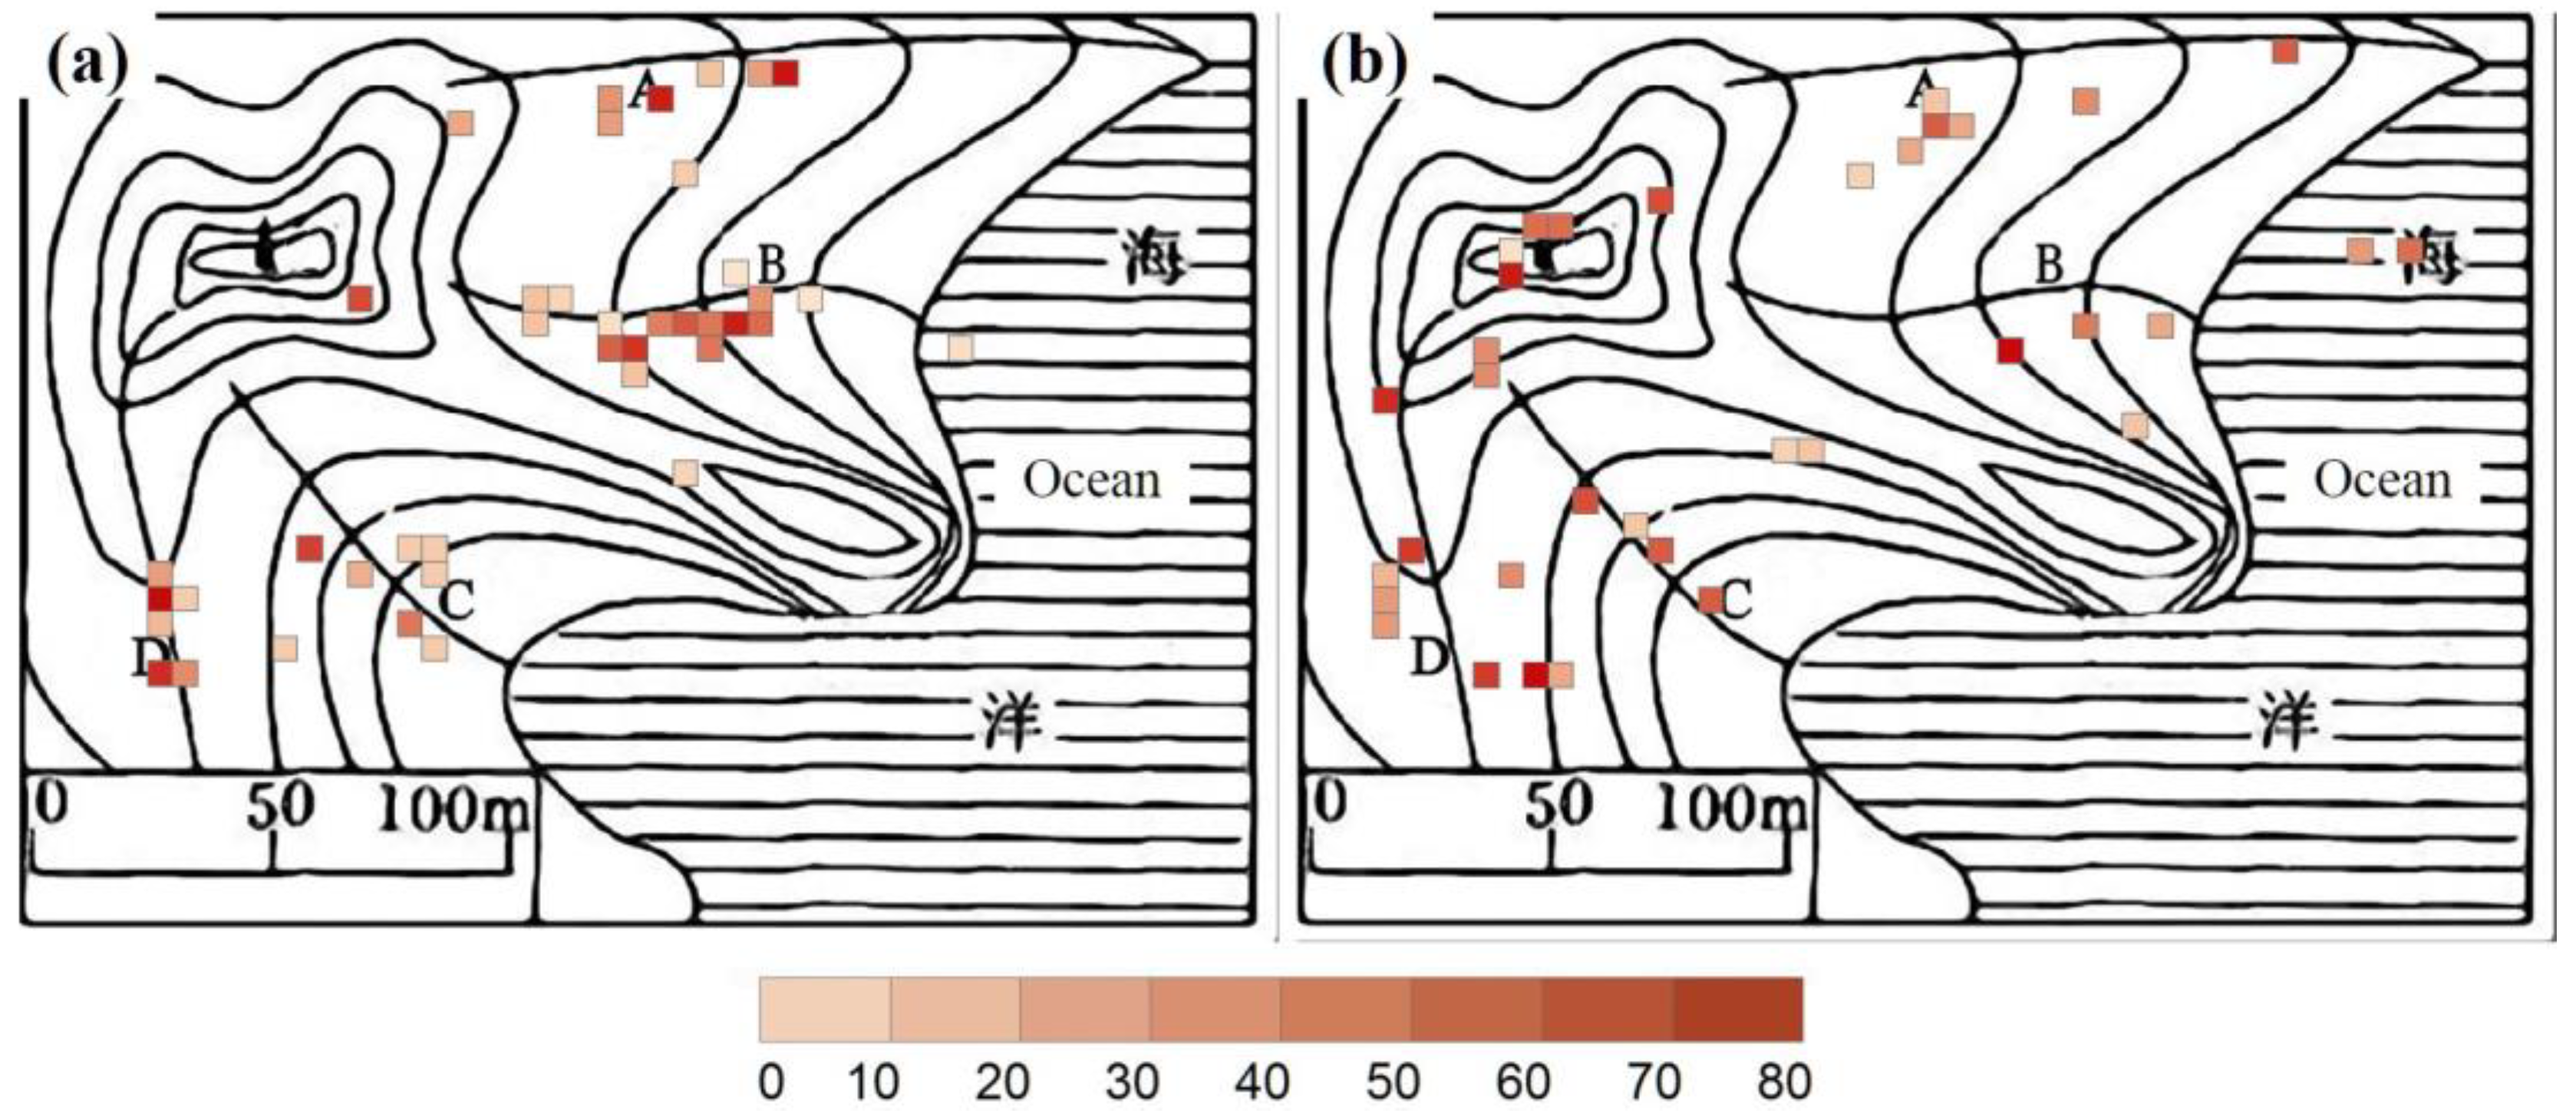
- Task #2 (Section line orientation based on contour map): Imagine you are in a topographic map-reading test. There are several lines marked on the left side map, and the ends of each line are marked with a letter. There is also a sectional view on the right side. Please tell the experimenter which of the marked lines matches the sectional view as soon as you come up with an answer. You should also tell the experimenter which end of the line matches the left side of the sectional view. When you have finished answering the question, please click the left mouse button.
- Task #3 (Slope visualization from contour map): Imagine you are in a topographic map-reading test. There are several lines marked with letters on the map. Please tell the experimenter which marked line has the steepest slope as soon as you come up with an answer. When you have finished answering the question, please click the left mouse button.
- Task #4 (Terrain determination by visualizing contour map): Imagine you are in a topographic map-reading test. There are several regions marked with letters on the map. Please describe to the experimenter the terrain of each marked region as soon as you come up with an answer. When you have finished answering the question, please click the left mouse button.
3.5. Analysis Framework
4. Results and Discussion
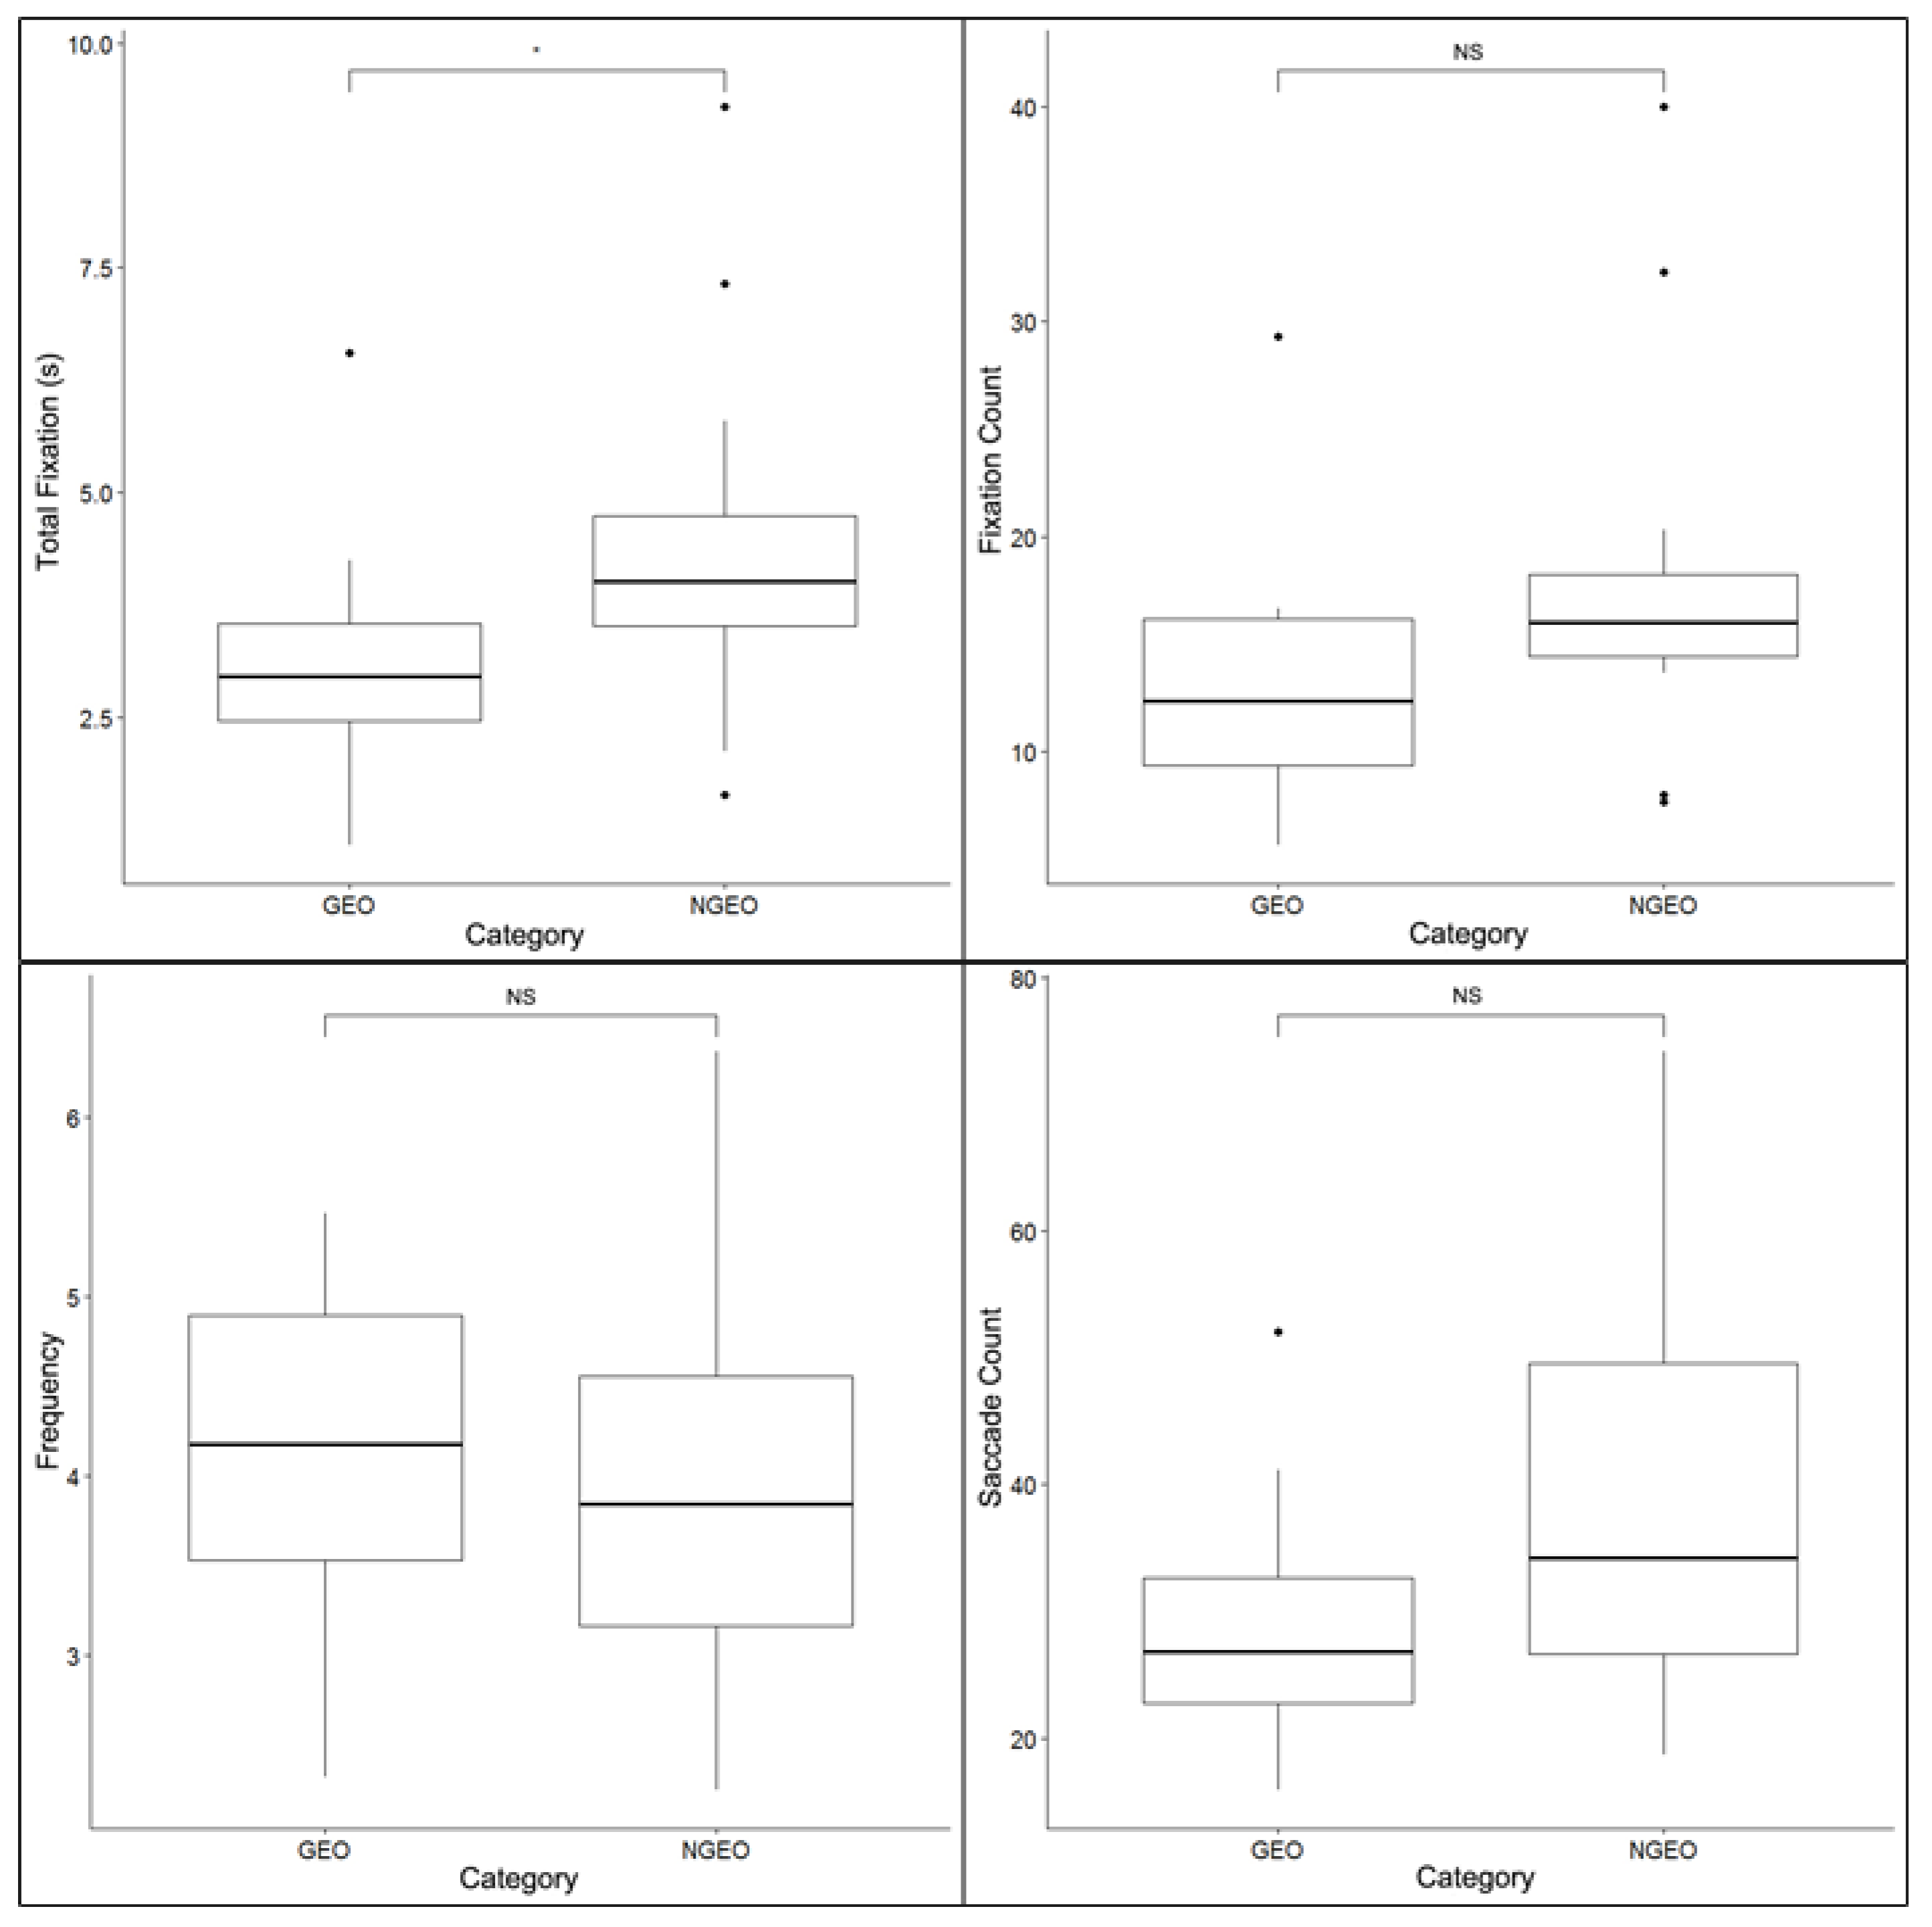
4.1. Map-Based Spatial Localization Ability
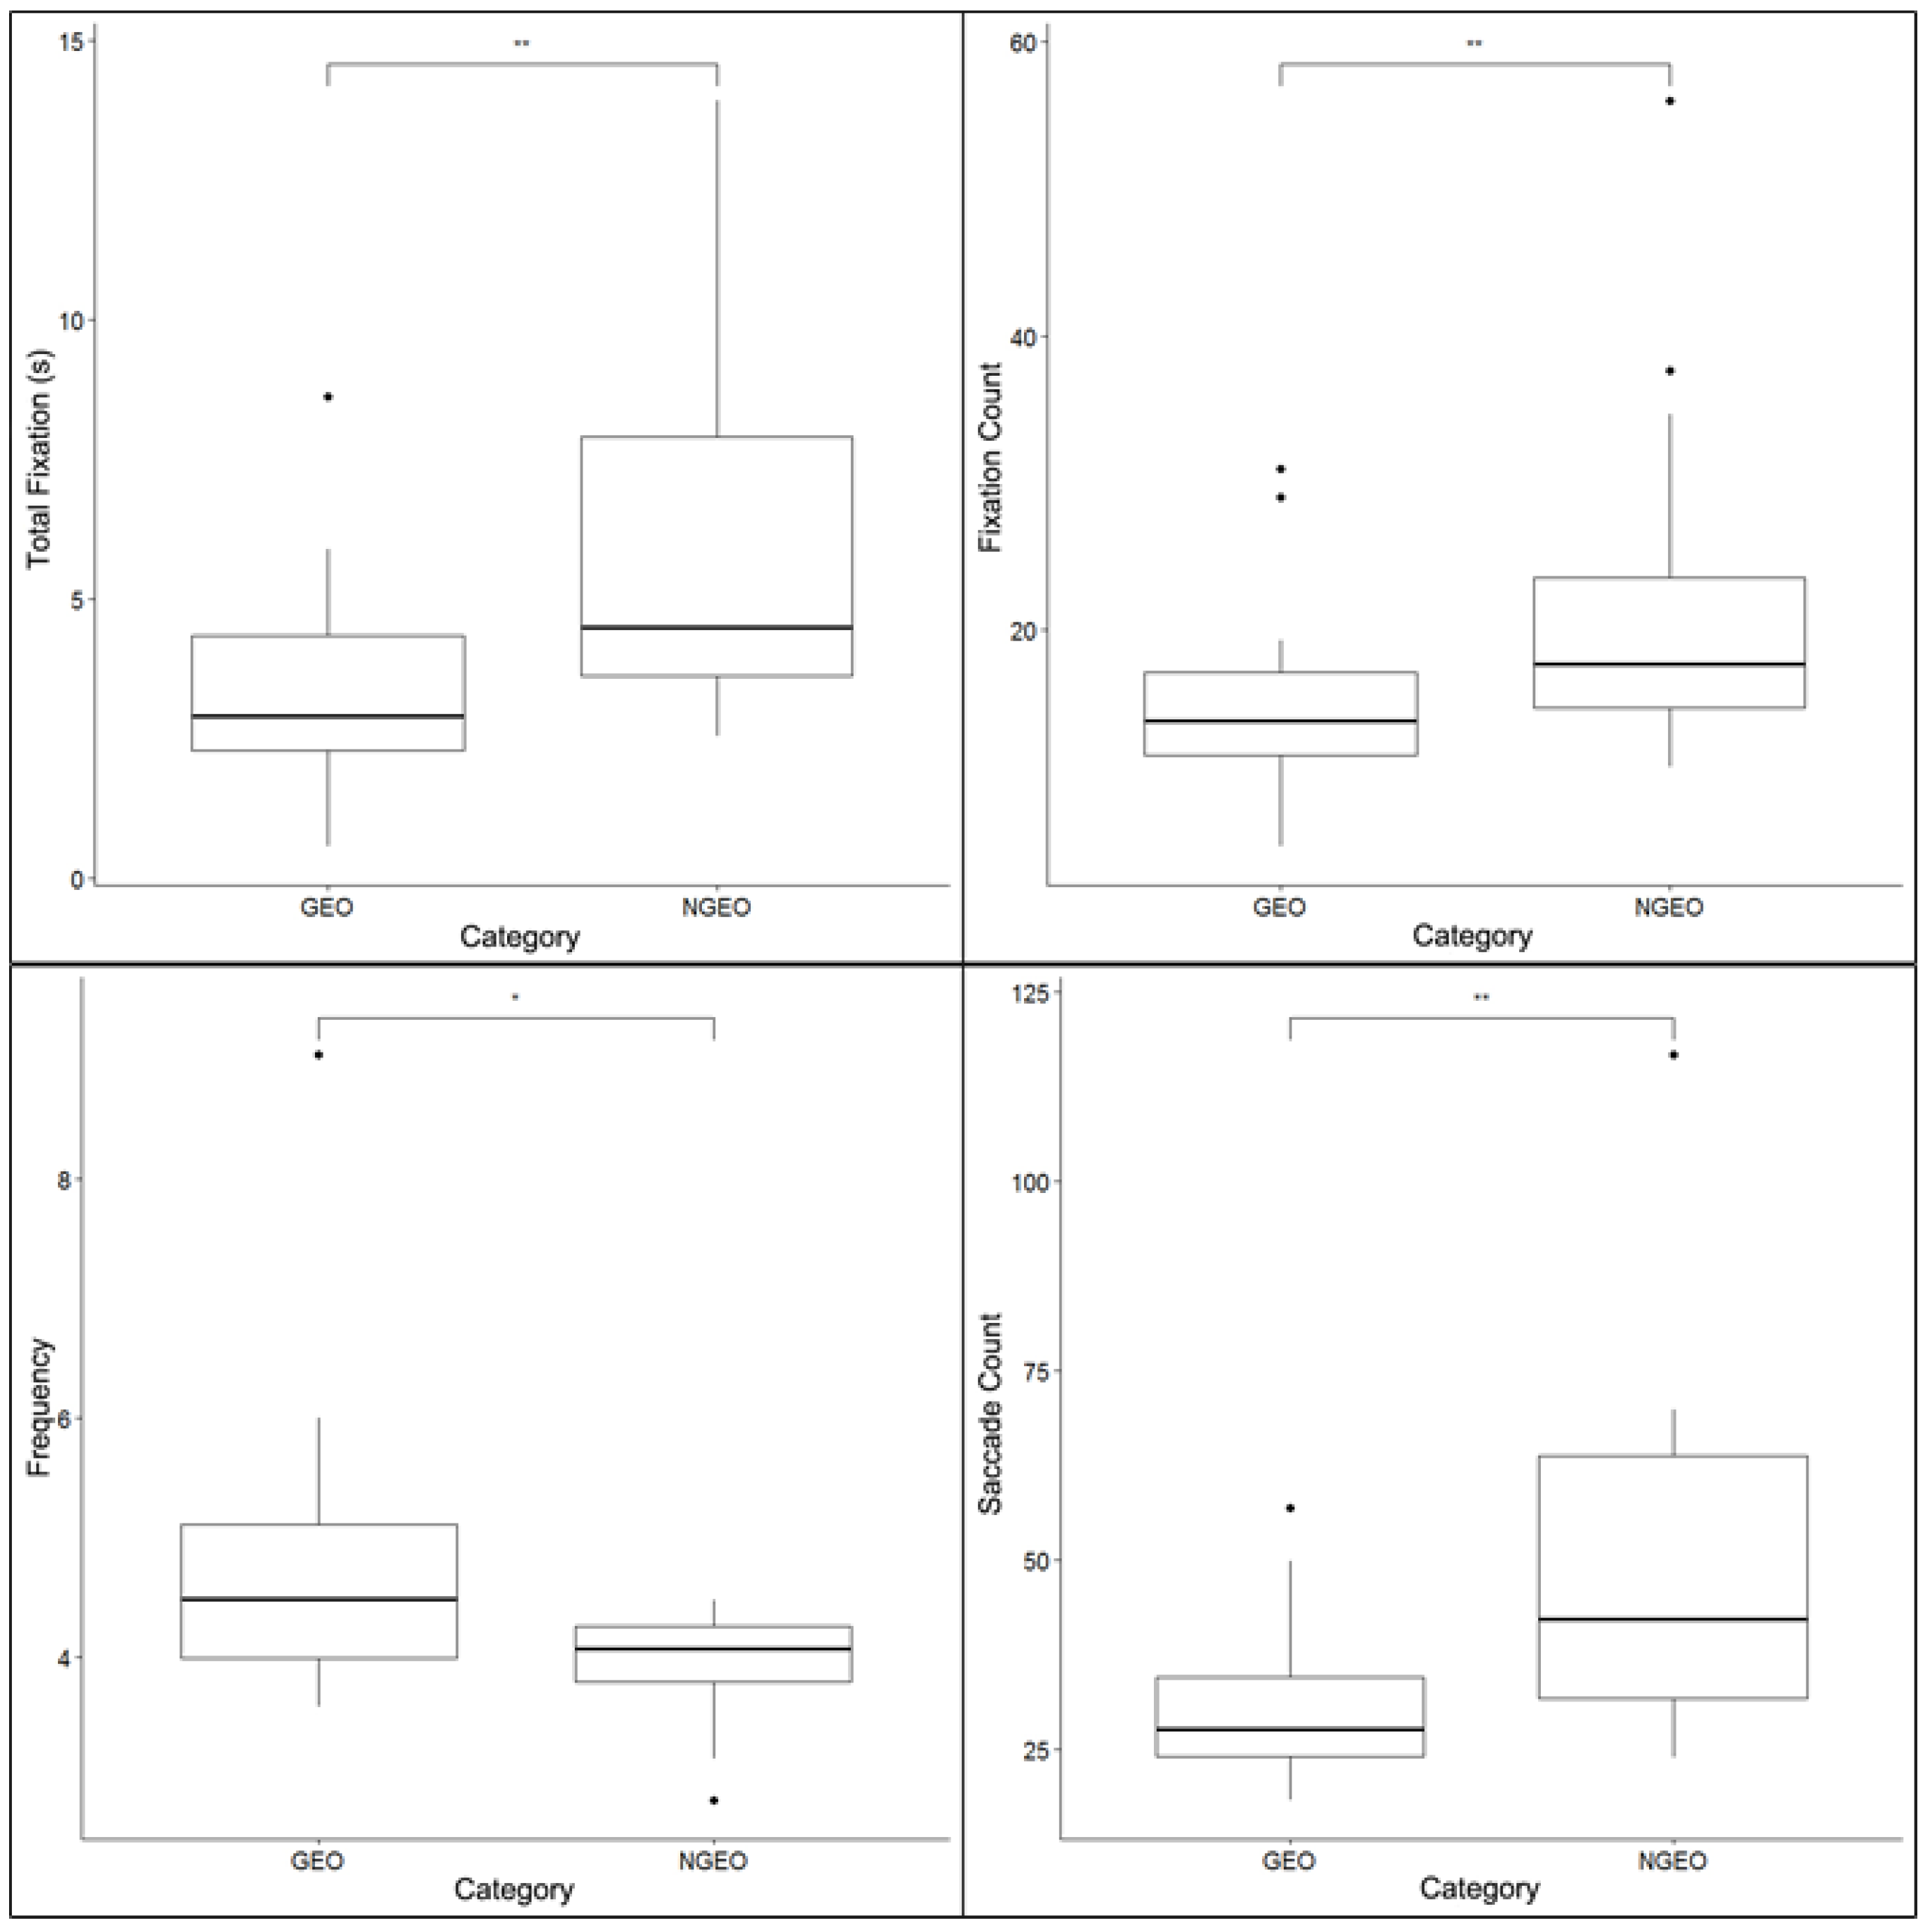
4.2. Map-Based Spatial Orientation Ability
4.3. Map-Based Spatial Visualization Ability
4.4. General Discussion
5. Conclusions and Further Work
Author Contributions
Funding
Acknowledgments
Conflicts of Interest
References
- Tolman, E.C. Cognitive maps in rats and men. Psychol. Rev. 1948, 55, 189–208. [Google Scholar] [CrossRef] [PubMed]
- Kitchin, R.M. Cognitive maps: What are they and why study them. J. Environ. Psychol. 1994, 14, 1–19. [Google Scholar] [CrossRef]
- Self, C.M.; Golledge, R.G. Sex-related Differences in Spatial Ability: What Every Geography Educator Should Know. J. Geogr. 1994, 93, 234–243. [Google Scholar] [CrossRef]
- Garlandini, S.; Fabrikant, S.I. Evaluating the Effectiveness and Efficiency of Visual Variables for Geographic Information Visualization Spatial Information Theory. In Proceedings of the International Conference on Spatial Information Theory, Brittany, France, 21–25 September 2009; Springer: Berlin, Germany, 2009; pp. 195–211. [Google Scholar]
- Jacobs, L.F.; Schenk, F. Unpacking the cognitive map: The parallel map theory of hippocampal function. Psychol. Rev. 2003, 110, 285–315. [Google Scholar] [CrossRef] [PubMed]
- Hegarty, M.; Waller, D. A dissociation between mental rotation and perspective-taking spatial abilities. Intelligence 2004, 32, 175–191. [Google Scholar] [CrossRef]
- Golledge, R.G.; Dougherty, V.; Bell, S. Acquiring Spatial Knowledge: Survey Versus Route-Based Knowledge in Unfamiliar Environments. Ann. Assoc. Am. Geogr. 1995, 85, 134–158. [Google Scholar]
- Uttal, D.H.; Meadow, N.G.; Tipton, E.; Hand, L.L.; Alden, A.R.; Warren, C.; Newcombe, N.S. The malleability of spatial skills: A meta-analysis of training studies. Psychol. Bull. 2013, 139, 352–402. [Google Scholar] [CrossRef] [PubMed]
- Ooms, K.; Maeyer, P.D.; Fack, V.; Assche, E.V.; Witlox, F. Interpreting maps through the eyes of expert and novice users. Int. J. Geogr. Inf. Sci. 2012, 26, 1773–1788. [Google Scholar] [CrossRef] [Green Version]
- Maccoby, E.E.; Jacklin, C.N. The Psychology of Sex Differences; Stanford University Press: Stanford, CA, USA, 1974. [Google Scholar]
- Ooms, K.; Maeyer, P.D.; Fack, V. Listen to the Map User: Cognition, Memory, and Expertise. Cartogr. J. 2013, 52, 3–19. [Google Scholar] [CrossRef] [Green Version]
- Downs, R.M.; Liben, L.S. The Development of Expertise in Geography: A Cognitive-Developmental Approach to Geographic Education. Ann. Assoc. Am. Geogr. 1991, 81, 304–327. [Google Scholar] [CrossRef]
- Jarodzka, H.; Scheiter, K.; Gerjets, P.; van Gog, T. In the eyes of the beholder: How experts and novices interpret dynamic stimuli. Learn. Instr. 2010, 20, 146–154. [Google Scholar] [CrossRef] [Green Version]
- Anderson, K.C.; Leinhardt, G. Maps as Representations: Expert Novice Comparison of Projection Understanding. Cogn. Instruct. 2010, 20, 283–321. [Google Scholar] [CrossRef]
- Stofer, K.; Che, X. Comparing Experts and Novices on Scaffolded Data Visualizations using Eye-tracking. J. Eye Mov. Res. 2014, 7. [Google Scholar] [CrossRef]
- Ishikawa, T. Spatial Thinking in Geographic Information Science: Students’ Geospatial Conceptions, Map-Based Reasoning, and Spatial Visualization Ability. Ann. Assoc. Am. Geogr. 2016, 106, 76–95. [Google Scholar] [CrossRef]
- Lee, J.; Bednarz, R. Effect of GIS Learning on Spatial Thinking. J. Geogr. High. Educ. 2009, 33, 183–198. [Google Scholar] [CrossRef]
- Lee, J.; Bednarz, R. Components of Spatial Thinking: Evidence from a Spatial Thinking Ability Test. J. Geogr. 2012, 111, 15–26. [Google Scholar] [CrossRef]
- Metoyer, S.K.; Bednarz, S.W.; Bednarz, R.S. Spatial Thinking in Education: Concepts, Development, and Assessment. In Geospatial Technologies and Geography Education in a Changing World; Springer: Tokyo, Japan, 2015; pp. 21–33. [Google Scholar]
- Wang, J.; Ni, H.; Rui, Y.; Cui, C.; Cheng, L. A WebGIS-based teaching assistant system for geography field practice (TASGFP). Br. J. Educ. Technol. 2016, 47, 279–293. [Google Scholar] [CrossRef]
- Hegarty, M.; Richardson, A.E.; Montello, D.R.; Lovelacea, K.; Subbiah, I. Development of a self-report measure of environmental spatial ability. Intelligence 2002, 30, 425–447. [Google Scholar] [CrossRef] [Green Version]
- Hegarty, M.; Montello, D.R.; Richardson, A.E.; Ishikawa, T.; Lovelace, K. Spatial abilities at different scales: Individual differences in aptitude-test performance and spatial-layout learning. Intelligence 2006, 34, 151–176. [Google Scholar] [CrossRef] [Green Version]
- Ishikawa, T.; Montello, D.R. Spatial knowledge acquisition from direct experience in the environment: Individual differences in the development of metric knowledge and the integration of separately learned places. Cogn. Psychol. 2006, 52, 93–129. [Google Scholar] [CrossRef] [PubMed]
- Goldberg, J.H.; Stimson, M.J.; Lewenstein, M.; Scott, N.; Wichansky, A.M. Eye tracking in web search tasks: Design implications. In Proceedings of the 2002 Symposium on Eye Tracking Research & Applications, New Orleans, LA, USA, 25–27 March 2002; pp. 51–58. [Google Scholar]
- Duchowski, A. Eye Tracking Methodology: Theory and Practice; Springer: Berlin/Heidelberg, Germany, 2007. [Google Scholar]
- Henderson, J.M.; Hollingworth, A. Eye movements during scene viewing: An overview. In Eye Guidance in Reading and Scene Perception; Elsevier Science Ltd.: Oxford, UK, 1998; pp. 269–293. [Google Scholar]
- Liversedge, S.P.; Findlay, J.M. Saccadic eye movements and cognition. Trends Cogn. Sci. 2000, 4, 6–14. [Google Scholar] [CrossRef]
- Wang, S.; Chen, Y.; Yuan, Y.; Ye, H.; Zheng, S. Visualizing the Intellectual Structure of Eye Movement Research in Cartography. ISPRS J. Photogramm. Remote Sens. 2016, 5, 1–22. [Google Scholar] [CrossRef]
- Kiefer, P.; Giannopoulos, I.; Raubal, M. Where Am I? Investigating map matching during self-localization with mobile eye tracking in an urban environment. Trans. GIS 2014, 18, 660–686. [Google Scholar] [CrossRef]
- Ooms, K.; Maeyer, P.D.; Fack, V. Study of the attentive behavior of novice and expert map users using eye tracking. Cartogr. Geogr. Inf. Sci. 2014, 41, 37–54. [Google Scholar] [CrossRef] [Green Version]
- Dong, W.; Liao, H. Eye Tracking to Explore the Impacts of Photorealistic 3D Representations in Pedstrian Navigation Performance. In Proceedings of the XXIII ISPRSA Congress, Prague, Czech Republic, 12–19 July 2016; Volume XLI-B2, pp. 641–645. [Google Scholar]
- Liao, H.; Dong, W.; Peng, C.; Liu, H. Exploring differences of visual attention in pedestrian navigation when using 2D maps and 3D geo-browsers. Cartogr. Geogr. Inf. Sci. 2017, 44, 474–490. [Google Scholar] [CrossRef]
- Çöltekin, A.; Heil, B.; Garlandini, S.; Fabrikant, S.I. Evaluating the Effectiveness of Interactive Map Interface Designs: A Case Study Integrating Usability Metrics with Eye-Movement Analysis. Cartogr. Geogr. Inf. Sci 2009, 36, 5–17. [Google Scholar] [CrossRef] [Green Version]
- Ooms, K.; Maeyer, P.D.; Fack, V. Analysing Analyzing Eye Movement Patterns to Improve Map Design. In Proceedings of the 18th International Research Symposium on Computer-Based Cartography and GIScience (AutoCarto 2010), Orlando, FL, USA, 14–16 November 2010. [Google Scholar]
- Radach, R.; Hyönä, J.; Deubel, H. The Mind’s Eye: Cognitive and Applied Aspects of Eye Movement Research; Elsevier: Amsterdam, The Netherlands, 2003. [Google Scholar]
- Rayner, K. Eye movements in reading and information processing: 20 years of research. Psychol. Bull. 1998, 124, 372–422. [Google Scholar] [CrossRef] [PubMed]
- Antes, J.R.; Chang, K.; Mullis, C. The Visual Effect of Map Design: An Eye-Movement Analysis. Cartogr. Geogr. Inf. Sci. 1985, 12, 143–155. [Google Scholar] [CrossRef]
- MacEachren, A.M.; Kraak, M. Research Challenges in Geovisualization. Cartogr. Geogr. Inf. Sci. 2001, 28, 3–12. [Google Scholar] [CrossRef]
- Morimoto, C.H.; Mimica, M.R.M. Eye gaze tracking techniques for interactive applications. Comput. Vis. Image Underst. 2005, 98, 4–24. [Google Scholar] [CrossRef]
- Dogusoy, B. Experts’ & Novices’ Concept Map Formation Process: An Eye-Tracking Study. CEUR-WS 2010, 709, 25–30. [Google Scholar]
- Larkin, J.; McDermott, J.; Simon, D.P.; Simon, H.A. Expert and Novice Performance in Solving Physics Problems. Science 1980, 208, 1335–1342. [Google Scholar] [CrossRef] [PubMed]
- Kiefer, P.; Giannopoulos, I.; Raubal, M.; Duchowski, A.T. Eye Tracking for Spatial Research: Cognition, Computation, Challenges. Spat. Cogn. Comput. 2017, 17, 1–19. [Google Scholar] [CrossRef]
- Koláčný, A. Cartographic information—A fundamental concept and term in modern cartography. Cartogr. J. 1969, 6, 47–49. [Google Scholar] [CrossRef]
- Montello, D.R. Cognitive research in GIScience: Recent achievements and future prospects. Geogr. Compass 2009, 3, 1824–1840. [Google Scholar] [CrossRef]
- Newcombe, N.S.; Weisberg, S.M.; Atit, K.; Jacovina, M.E.; Ormand, C.J.; Shipley, T.E. The lay of the land: Sensing and representing topography. Balt. Int. Yearbook Cogn. Logic. Commun. 2015, 10. [Google Scholar] [CrossRef]
- Just, M.A.; Carpenter, P.A. Eye fixations and cognitive processes. Cogn. Psychol. 1976, 8, 441–480. [Google Scholar] [CrossRef]
- Goldberg, J.H.; Kotval, X.P. Computer interface evaluation using eye movements: Methods and constructs. Int. J. Ind. Ergon. 1999, 24, 631–645. [Google Scholar] [CrossRef]
- Reingold, E.M.; Charness, N.; Pomplun, M.; Stampe, D.M. Visual span in expert chess players: Evidence from eye movements. Psychol. Sci. 2001, 12, 48–55. [Google Scholar] [CrossRef] [PubMed]
- Charness, N.; Reingold, E.M.; Pomplun, M.; Stampe, D.M. The perceptual aspect of skilled performance in chess: Evidence from eye movements. Mem. Cogn. 2001, 29, 1146–1152. [Google Scholar] [CrossRef] [Green Version]
- Hegarty, M.; Canham, M.S.; Fabrikant, S.I. Thinking about the weather: How display salience and knowledge affect performance in a graphic inference task. J. Exp. Psychol. Learn. Mem. Cogn. 2010, 36, 37–53. [Google Scholar] [CrossRef] [PubMed]
- Koh, R.Y.I.; Park, T.; Wickens, C.D.; Ong, L.T.; Chia, S.N. Differences in attentional strategies by novice and experienced operating theatre scrub nurses. J. Exp. Psychol. Appl. 2011, 17, 233–246. [Google Scholar] [CrossRef] [PubMed]
- Liu, X.; Gale, A. Air passengers’ luggage screening: What is the difference between naïve people and airport screeners? In Engineering Psychology and Cognitive Ergonomics; Springer: Berlin, Germany, 2011; pp. 424–431. [Google Scholar]
- St Clair-Thompson, H.L.; Gathercole, S.E. Executive functions and achievements in school: Shifting, updating, inhibition, and working memory. Q. J. Exp. Psychol. 2006, 59, 745–759. [Google Scholar] [CrossRef] [PubMed]
- Cheung, Y.; Pang, M.; Lin, H.; Chi, K.J.L. Enable spatial thinking using GIS and satellite remote sensing—A teacher-friendly approach. Procedia Soc. Behav. Sci. 2011, 21, 130–138. [Google Scholar] [CrossRef]


| General Performance | Measures of Processing | Measure of Search |
|---|---|---|
| Response time (seconds) | Fixation Count Fixation frequency (fixation per second) | Saccades |
| Descriptive | Inferential | |||||||||
|---|---|---|---|---|---|---|---|---|---|---|
| GEO (M ± SD) | NGEO (M ± SD) | t-Test | ||||||||
| t | p | |||||||||
| Total time (s) | 188.000 ± 53.086 | 245.140 ± 7.168 | −2.50 | 0.019 * | ||||||
| Accuracy (%) | 89.881 ± 6.682 | 77.976 ± 10.645 | −3.14 | 0.002 ** | ||||||
| Task #1 (M ± SD) | Task #2 (M ± SD) | Task #3 (M ± SD) | Task #4 (M ± SD) | t-Test | ||||||
| GEO | NGEO | GEO | NGEO | GEO | NGEO | GEO | NGEO | t | p | |
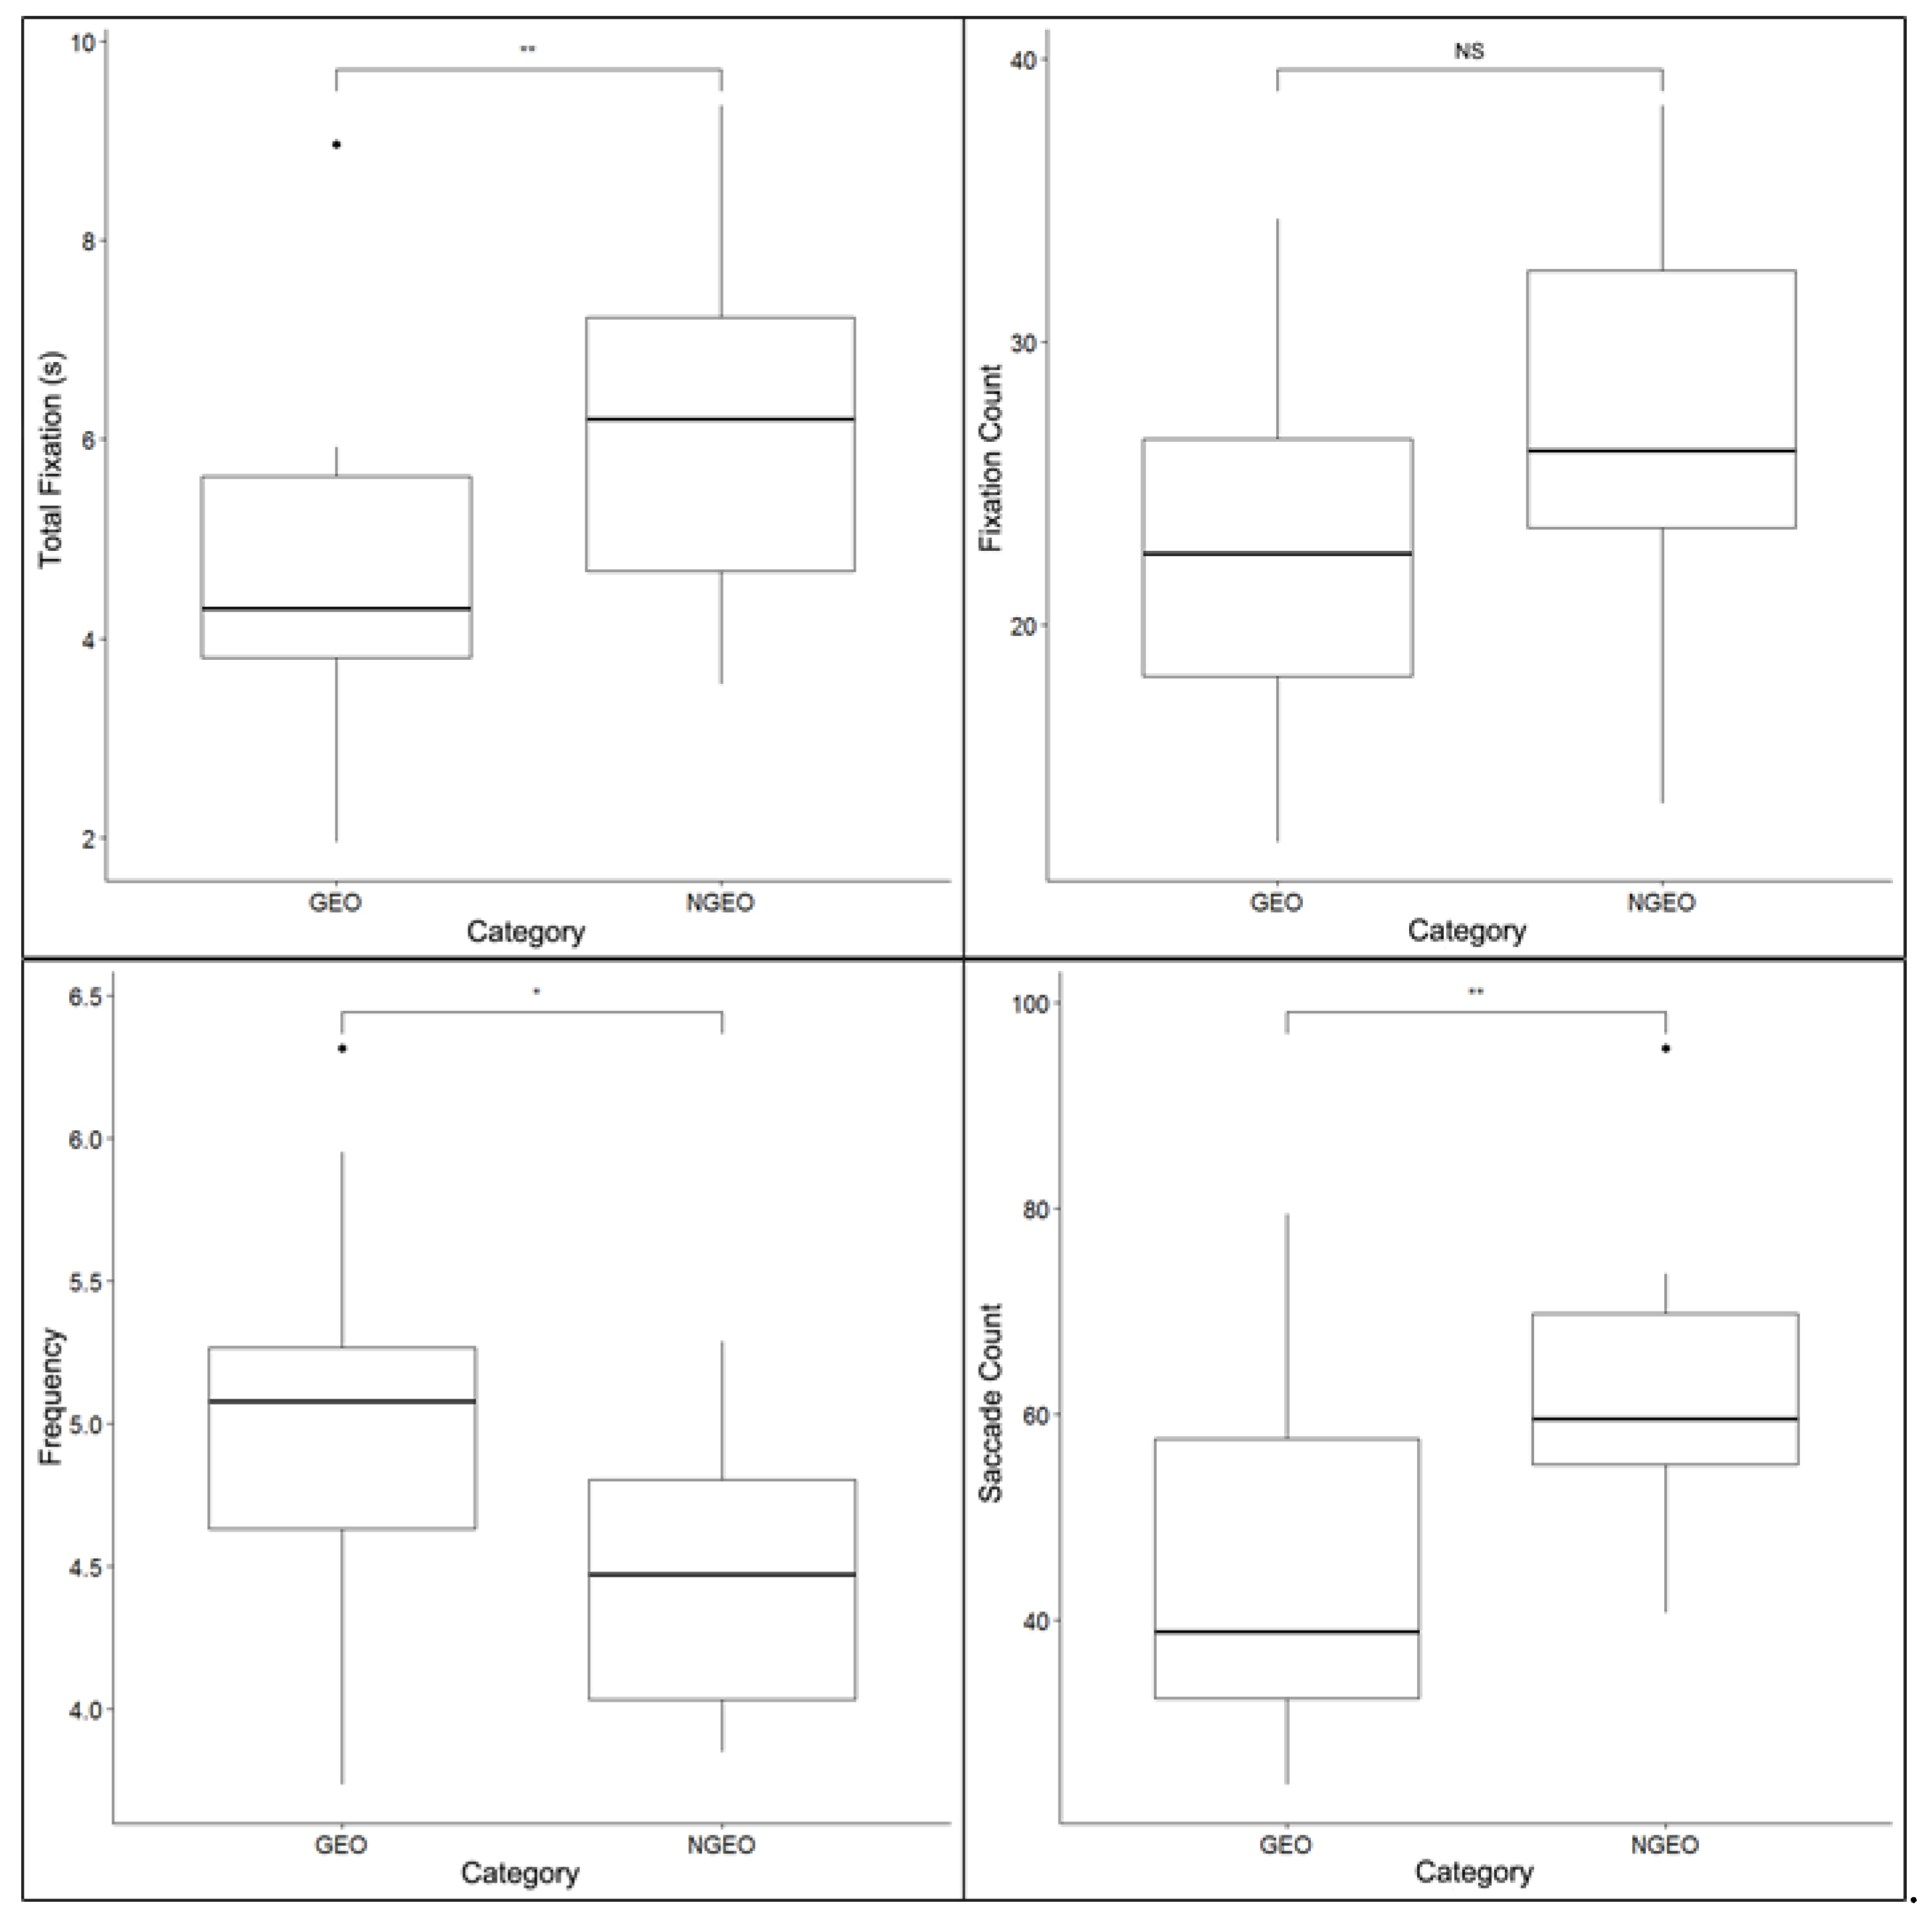
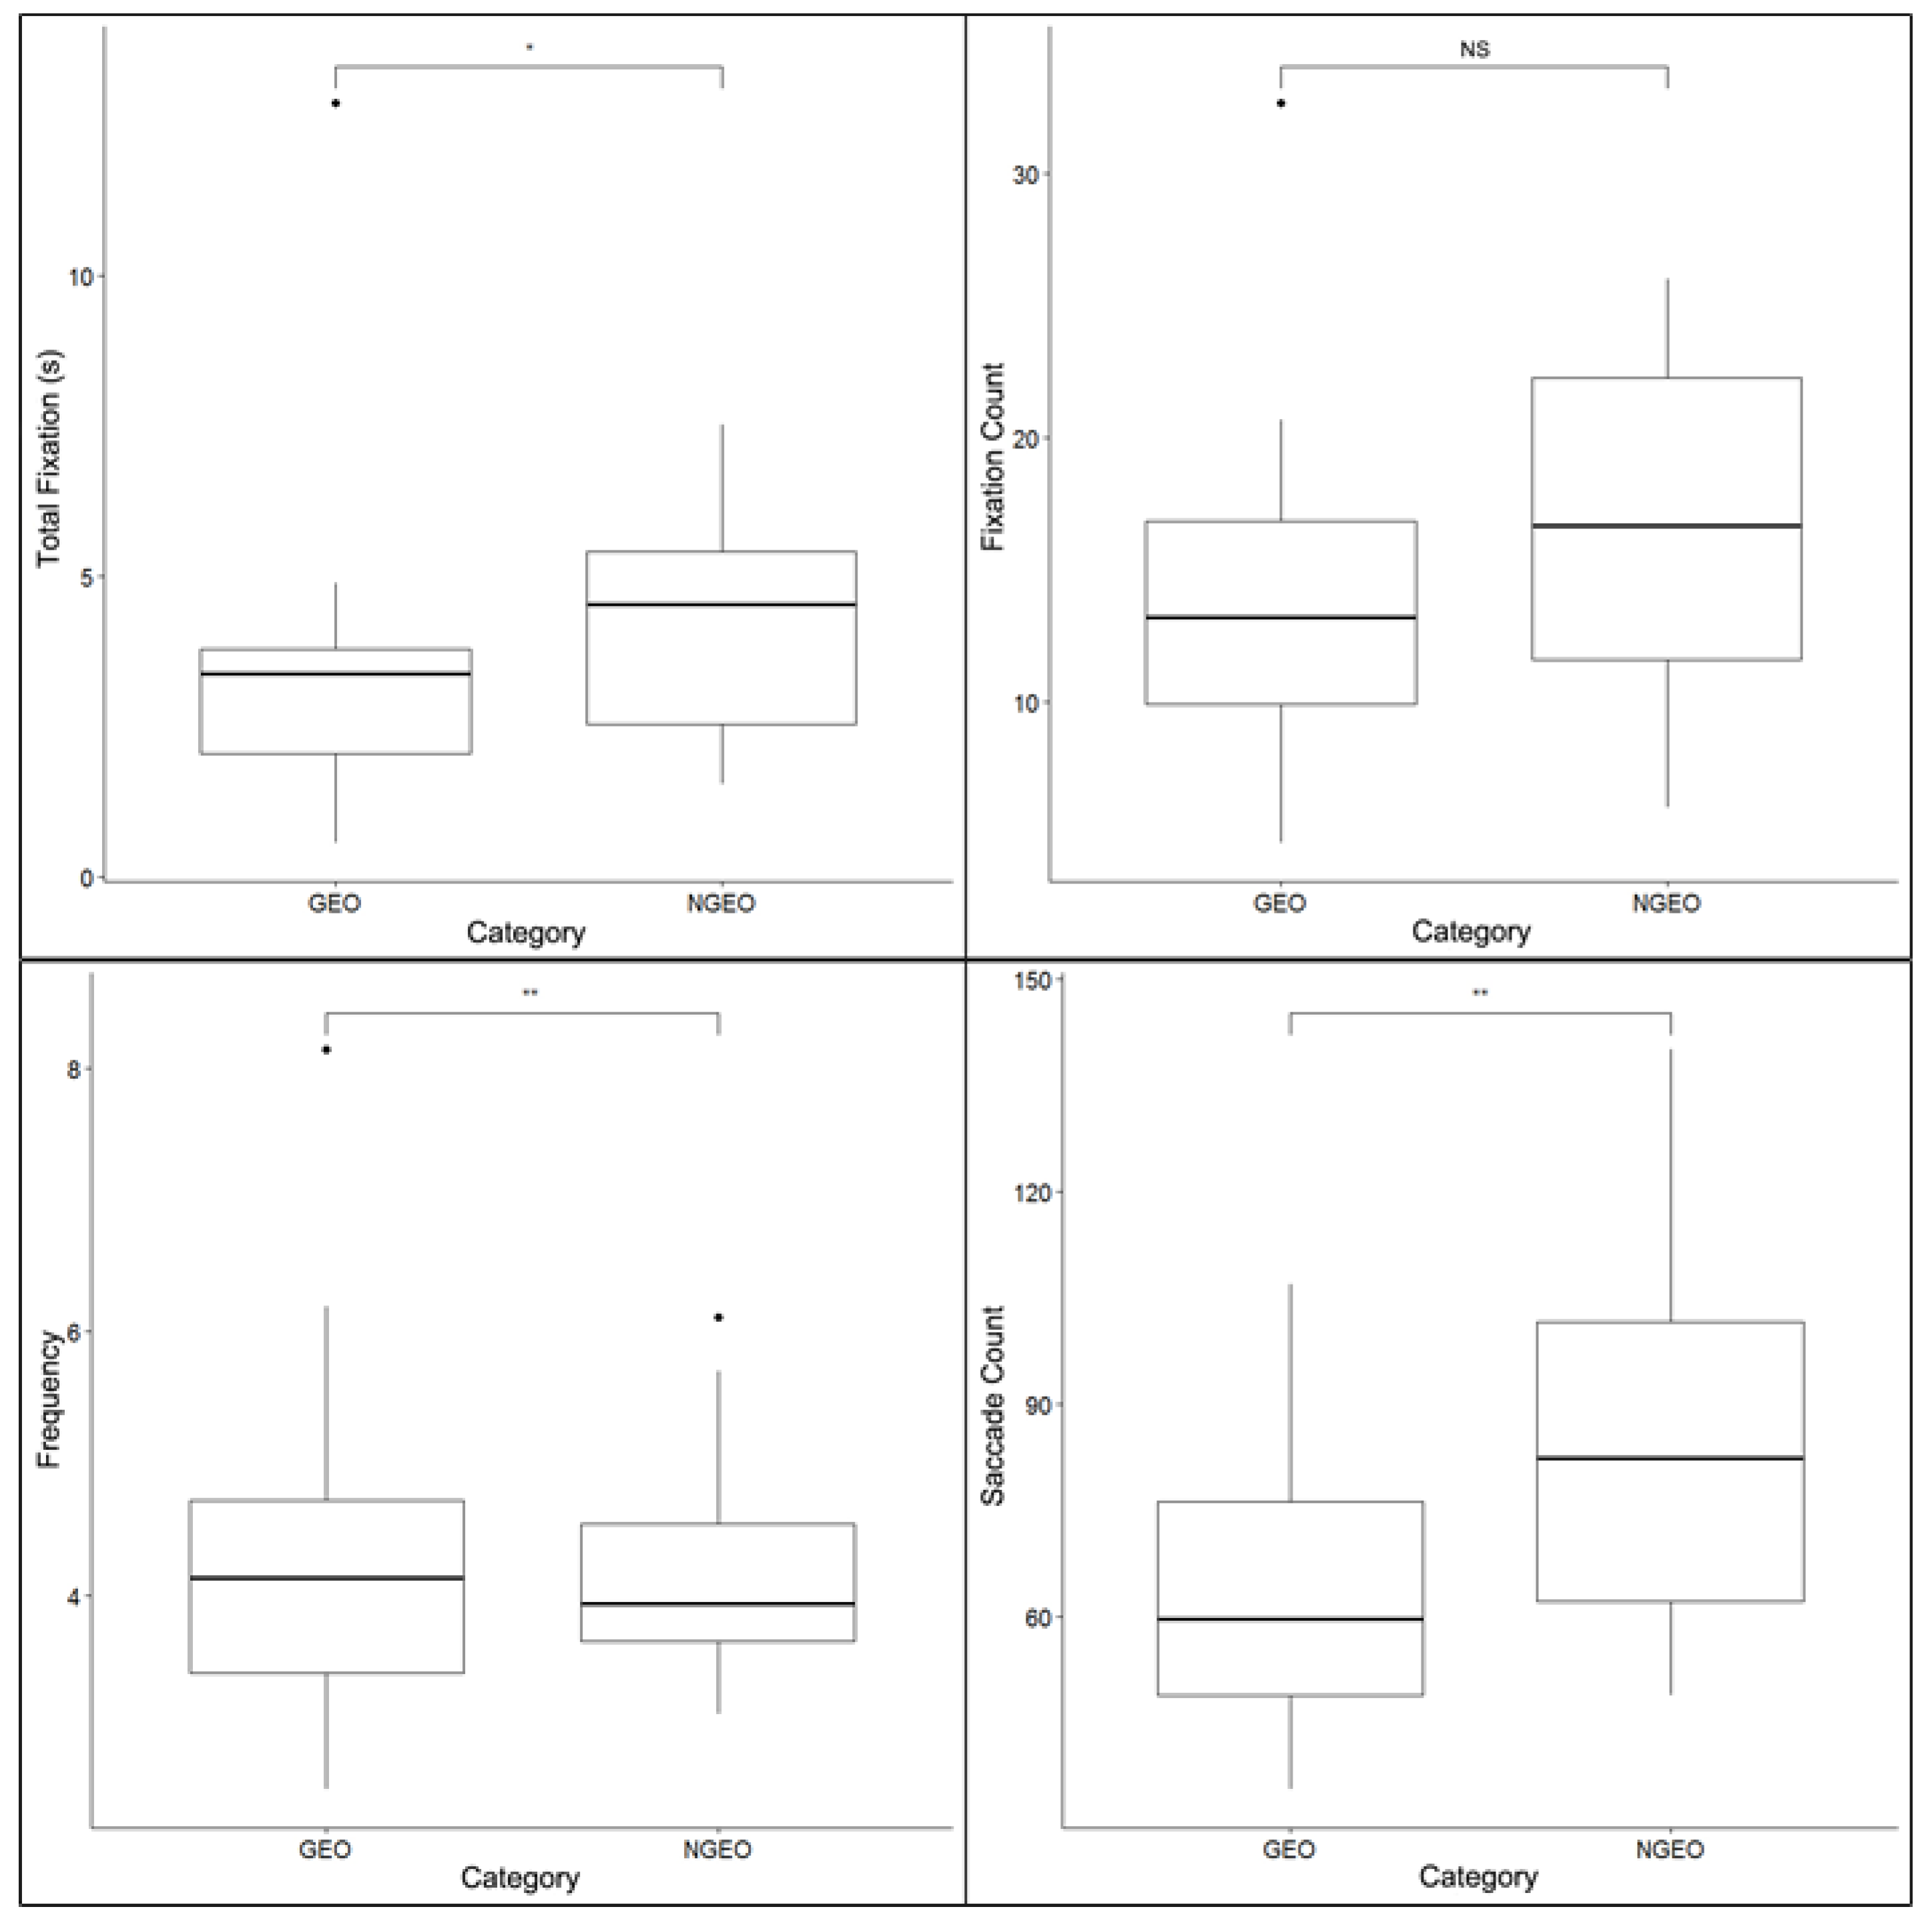
| Response time (s) | 12.992 ± 10.379 | 18.335 ± 16.271 | 8.906 ± 11.221 | 12.561 ± 15.870 | 8.359 ± 8.656 | 11.327 ± 10.162 | 6.326 ± 12.622 | 17.696 ± 30.493 | −2.52 | 0.022 * |
| Fixation count | 67.214 ± 55.182 | 81.286 ± 65.118 | 38.039 ± 46.574 | 50.500 ± 56.540 | 40.000 ± 52.068 | 44.583 ± 34.025 | 42.923 ± 51.139 | 59.083 ± 76.040 | −2.64 | 0.008 ** |
| Fixation frequency (fix/s) | 14.875 ± 6.727 | 13.438 ± 4.420 | 13.210 ± 12.821 | 12.549 ± 7.837 | 12.698 ± 8.306 | 12.063 ± 10.788 | 13.696 ± 6.903 | 11.736 ± 4.657 | 2.61 | 0.015 * |
| Saccades | 28.431 ± 9.639 | 39.217 ± 18.313 | 62.766 ± 19.891 | 85.029 ± 26.829 | 31.085 ± 11.029 | 50.004 ± 24.593 | 45.824 ± 17.787 | 61.244 ± 14.336 | −2.76 | 0.006 ** |
© 2018 by the authors. Licensee MDPI, Basel, Switzerland. This article is an open access article distributed under the terms and conditions of the Creative Commons Attribution (CC BY) license (http://creativecommons.org/licenses/by/4.0/).
Share and Cite
Dong, W.; Zheng, L.; Liu, B.; Meng, L. Using Eye Tracking to Explore Differences in Map-Based Spatial Ability between Geographers and Non-Geographers. ISPRS Int. J. Geo-Inf. 2018, 7, 337. https://0-doi-org.brum.beds.ac.uk/10.3390/ijgi7090337
Dong W, Zheng L, Liu B, Meng L. Using Eye Tracking to Explore Differences in Map-Based Spatial Ability between Geographers and Non-Geographers. ISPRS International Journal of Geo-Information. 2018; 7(9):337. https://0-doi-org.brum.beds.ac.uk/10.3390/ijgi7090337
Chicago/Turabian StyleDong, Weihua, Liangyu Zheng, Bing Liu, and Liqiu Meng. 2018. "Using Eye Tracking to Explore Differences in Map-Based Spatial Ability between Geographers and Non-Geographers" ISPRS International Journal of Geo-Information 7, no. 9: 337. https://0-doi-org.brum.beds.ac.uk/10.3390/ijgi7090337