Semi-Automatic 3D City Model Generation from Large-Format Aerial Images


1
Department of Geomatics Engineering, Hacettepe University, Ankara 06800, Turkey
2
Department of Informatics, Mimar Sinan Fine Arts University, Istanbul 34427, Turkey
*
Author to whom correspondence should be addressed.
ISPRS Int. J. Geo-Inf. 2018, 7(9), 339; https://0-doi-org.brum.beds.ac.uk/10.3390/ijgi7090339
Submission received: 28 June 2018
/
Revised: 1 August 2018
/
Accepted: 20 August 2018
/
Published: 22 August 2018
Abstract
:3D city models have become crucial for better city management, and can be used for various purposes such as disaster management, navigation, solar potential computation and planning simulations. 3D city models are not only visual models, and they can also be used for thematic queries and analyzes with the help of semantic data. The models can be produced using different data sources and methods. In this study, vector basemaps and large-format aerial images, which are regularly produced in accordance with the large scale map production regulations in Turkey, have been used to develop a workflow for semi-automatic 3D city model generation. The aim of this study is to propose a procedure for the production of 3D city models from existing aerial photogrammetric datasets without additional data acquisition efforts and/or costly manual editing. To prove the methodology, a 3D city model has been generated with semi-automatic methods at LoD2 (Level of Detail 2) of CityGML (City Geographic Markup Language) using the data of the study area over Cesme Town of Izmir Province, Turkey. The generated model is automatically textured and additional developments have been performed for 3D visualization of the model on the web. The problems encountered throughout the study and approaches to solve them are presented here. Consequently, the approach introduced in this study yields promising results for low-cost 3D city model production with the data at hand.
1. Introduction
According to United Nations World Urbanization Prospects [1], more than half of the world’s population (54%) are currently living in cities, and this number will increase to 66% by 2050. For efficient management of large cities and urban population, new technologies must be developed so that higher living standards can be obtained. Geographical Information Systems (GIS) are inevitable platforms for the efficient management of cities, and 3D modeling and visualization have become a crucial component of GIS. A 3D city model is a digital representation of the building and objects in the urban area, as well as the terrain model [2]. 3D city models usually consist of digital terrain models (DTMs), building models, street-space models, and green space models [3]. They can also be used to perform simulations in different scenarios in virtual environments [4]. The focus in 3D GIS lies in the management of more comprehensive and exhaustive 3D models of the construction, management of domains, architectural, engineering, construction and facility management, and wide area and georeferenced 3D models. 3D city models are becoming important tools for urban decision-making processes and information systems, especially planning, simulation, documentation, heritage planning, mobile networking planning, and navigation. 3D city models are being produced and developed in many countries nationwide. Berlin [5], Vienna [6], and Konya [7] city models can be shown as examples of pioneer models.
3D city model reconstruction can be performed from different data resources, such as LiDAR point clouds [8], airborne images [9,10], satellite images [11,12], UAV (unmanned air vehicle) images or combination of DSM (digital surface model) data with cadastral maps [13]. The buildings are the base elements of such models, and the building reconstruction can mainly be done in three process steps: building detection, extraction, and reconstruction [14]. The reconstruction of the buildings is a process for generating a model using features obtained from building detection and extraction. With the use of photogrammetric methods, building rooftops can be measured manually from stereo pairs or extracted by edge detection methods with their radiometric characteristics or classification methods can be applied. They can be also extracted from point clouds generated from photogrammetric image matching methods [15] or LiDAR sensors. Additionally, combining different data resources is a popular approach [16,17].
CityGML is an XML-based open-source data format for storing and exchanging 3D city models [18]. This format is adopted by Open Geospatial Consortium [18] as an international standard format [19]. CityGML has a structure suitable for presenting city models with semantic data. These semantic features allows users to perform functions that are not possible without the metadata provided by CityGML. Modules in CityGML reflect the appearance, spatial and theme characteristics of an object [19]. In addition to the geometric information of the city model, CityGML contains semantic and thematic information. These data enable users to make new simulations and queries and analyzes of 3D city models [20]. There are five different levels of detail (LoD) defined in the CityGML data schema. As the LoD level icnreases, it has a more detailed architecture with the complexity of the structures, so different levels of detail can be used for different purposes. CityGML allows the same objects to be visualized at different levels of detail. Thus, analysis can be performed at different LoDs [20]. A building in LoD0 is represented by 2.5D polygons either at the roof level height or at the ground level height [21]. LoD0 can also be called building footprints. In LoD1, the building is represented as a solid model or a multi-faced block model without any roof structures. The building can be separated into different building surfaces called “BuildingParts”. LoD2 adds generalized roof structures to LoD1. In addition, thematic details can be used to represent the boundary surfaces of a building. The main difference between LoD1 and LoD2 is that the outer walls and roof of a building can be represented by more than one face and the curved geometry of the building can be represented in the model structure [22]. LoD3 is generated by expanding LoD2 with openings (windows, doors), detailed roof structures (roof windows, chimneys, roof tops) and detailed façade constructions. LoD4 is the highest level of detail and adds interior architecture to the building. At this level of detail, all interior details, such as furniture and rooms, are represented with textures.
The building reconstruction methods can be divided into two categories: model-driven and data-driven [23]. In data-driven methods, the algorithm reconstructs buildings by using the DSM as the main data source and analyzes it as a whole without associating it to any set of parameters [24]. The aim of the model-driven method is to match the DSM generated roof geometry with the roof types that it has in its library [8] and uses the best-matched roof type with preliminary assumptions made of the roof [24]. This approach guarantees that the reconstructed roof model is topologically correct, though problems may occur if the roof shapes do not have any match in the roof library [23]. Other studies using the model-driven building reconstruction can be found in [24,25,26]. The method proposed here uses model-driven approach.
Manual mensuration of building geometries, especially in large cities, requires a great deal of time, money, and labor. Photogrammetric approaches are widely used for 3D extraction of surfaces and features, and it is one of the most preferred technologies in data production for 3D city models [27]. With the help of photogrammetric methods, feature geometries and digital elevation models (DEM) can be extracted automatically from stereo images [28]. Semi-automatic reconstruction of buildings can be done by combining DSMs with the cadastral footprints so that manual production time and labor can be reduced. Such DSMs are mostly obtained by stereo and/or multi-image matching approaches and by using aerial LiDAR sensors. So far it is not possible to reconstruct building geometries fully automatically with high accuracy and level of detail (i.e., resolution). Fully-automatic 3D city model generation is still an active agenda which attracts the attention of many researchers and there are studies on automation of the production and reliability improvements [29].
One of the main criteria for 3D city model production is to create models that are close to reality both in geometry and also in appearance (visual fidelity). Textures obtained from optical images are used for providing visually correct models quickly and economically. There are also cases where untextured building models are in use, however, 3D city models should be textured where the visualization is the front planer and the user needs to have an idea of the area at first sight. Regardless of the level of detail in their geometries, untextured 3D city models will always be visually incomplete.
With the development of aerial photogrammetric systems equipped with nadir and oblique camera systems, automatic texturing of 3D city models became quite possible. Nadir cameras are the most ideal for texturing roofs of the buildings whereas the oblique cameras are better at texturing the building façades. Similarly, for automatic texturing of 3D city models, the best strategy is to select the rooftop textures from the nadir images and building façades from the oblique images. The view of the façades can be obtained clearly with this approach and the spatial resolution would also be higher. Similar to the nadir image acquisition, the season and the time of the flight would affect the radiometric quality of the oblique images. Früh et al. [30] have used an approach which combines 3D city model obtained from aerial and ground-based laser scans with oblique aerial imagery for texture mapping. Früh and Zakhor [31] presented a method that merges ground-based and airborne laser scans and images. Additional terrestrial data used in the method naturally leads to more detailed models, but also increases the size of the datasets considerably. A more effective technique to model the façades is to extract textures from terrestrial images and locate them on the polygonal models. This process is done in a manual fashion, however, texturing of a single building is a tedious task and can easily take up to several hours. For a large number of building façades, such an approach is not efficient and usually not applicable. Kada et al. [32] presented a new approach that automatically extracts façade textures from terrestrial photographs and maps them to geo-referenced 3D building models. In contrast to the application of standard viewers, this technique allows to model even complex geometric effects, like self-occlusion or lens distortion. This allows for a very fast and flexible on-the-fly generation of façade textures using real-world imagery.
Aerial photogrammetry for map production is a widely used approach throughout the world. Aerial LiDAR sensors are not yet commonly used for point cloud acquisition as it has high initial costs [33]. In addition, although LiDAR sensors can provide highly accurate and dense elevation data, the spectral and radiometric resolutions of the intensity images are quite low in comparison to large-format aerial cameras, thus, not suitable for feature extraction for basemap production purposes. Stereo data acquisition with large format aerial cameras is still the most suitable approach for 3D city model generation, as point clouds and other types of information can be extracted from those with sufficient density, accuracy, and resolution (level of detail, feature types, etc.) at the city scale. It is possible to produce a point cloud with 100 points per square meter density from stereo aerial images with a resolution of 10 cm (image matching per pixel). Such a point cloud is denser than most LiDAR datasets in practical projects [29].
Nowadays large cities are composed of hundreds of thousands of buildings and manual extraction of their geometries for city model generation purposes is very costly in terms of time and money. Considering the amount and variety of the data obtained with aerial photogrammetric methods for over decades, the possibility of using these datasets for automatic or semi-automatic 3D city model generation without additional data acquisition is discussed in this study. A new approach is introduced for this purpose and applied using the data of photogrammetric flight mission carried out over Cesme town near Izmir in 2016. The speed, accuracy and capacity of existing technologies have been investigated within the study to analyze the challenges and open issues in the overall city model generation process. The generated model is then used to create a 3D GIS environment on a web platform. Queries, analysis, or different simulations can be performed on this model with the help of semantic data. The building reconstruction approach has been validated using reference data, and the problems encountered during the processing and the potential improvements to the process have been investigated. Suitability of the basemaps and aerial imagery and the outputs have also been analyzed and the results are presented here. In addition, using the proposed method, it is possible to reconstruct the cities of the past with little effort using the datasets obtained from aerial photogrammetric missions.
2. Materials and Methods
2.1. Study Area and Dataset
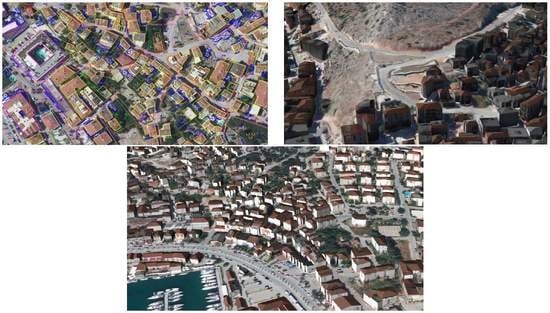
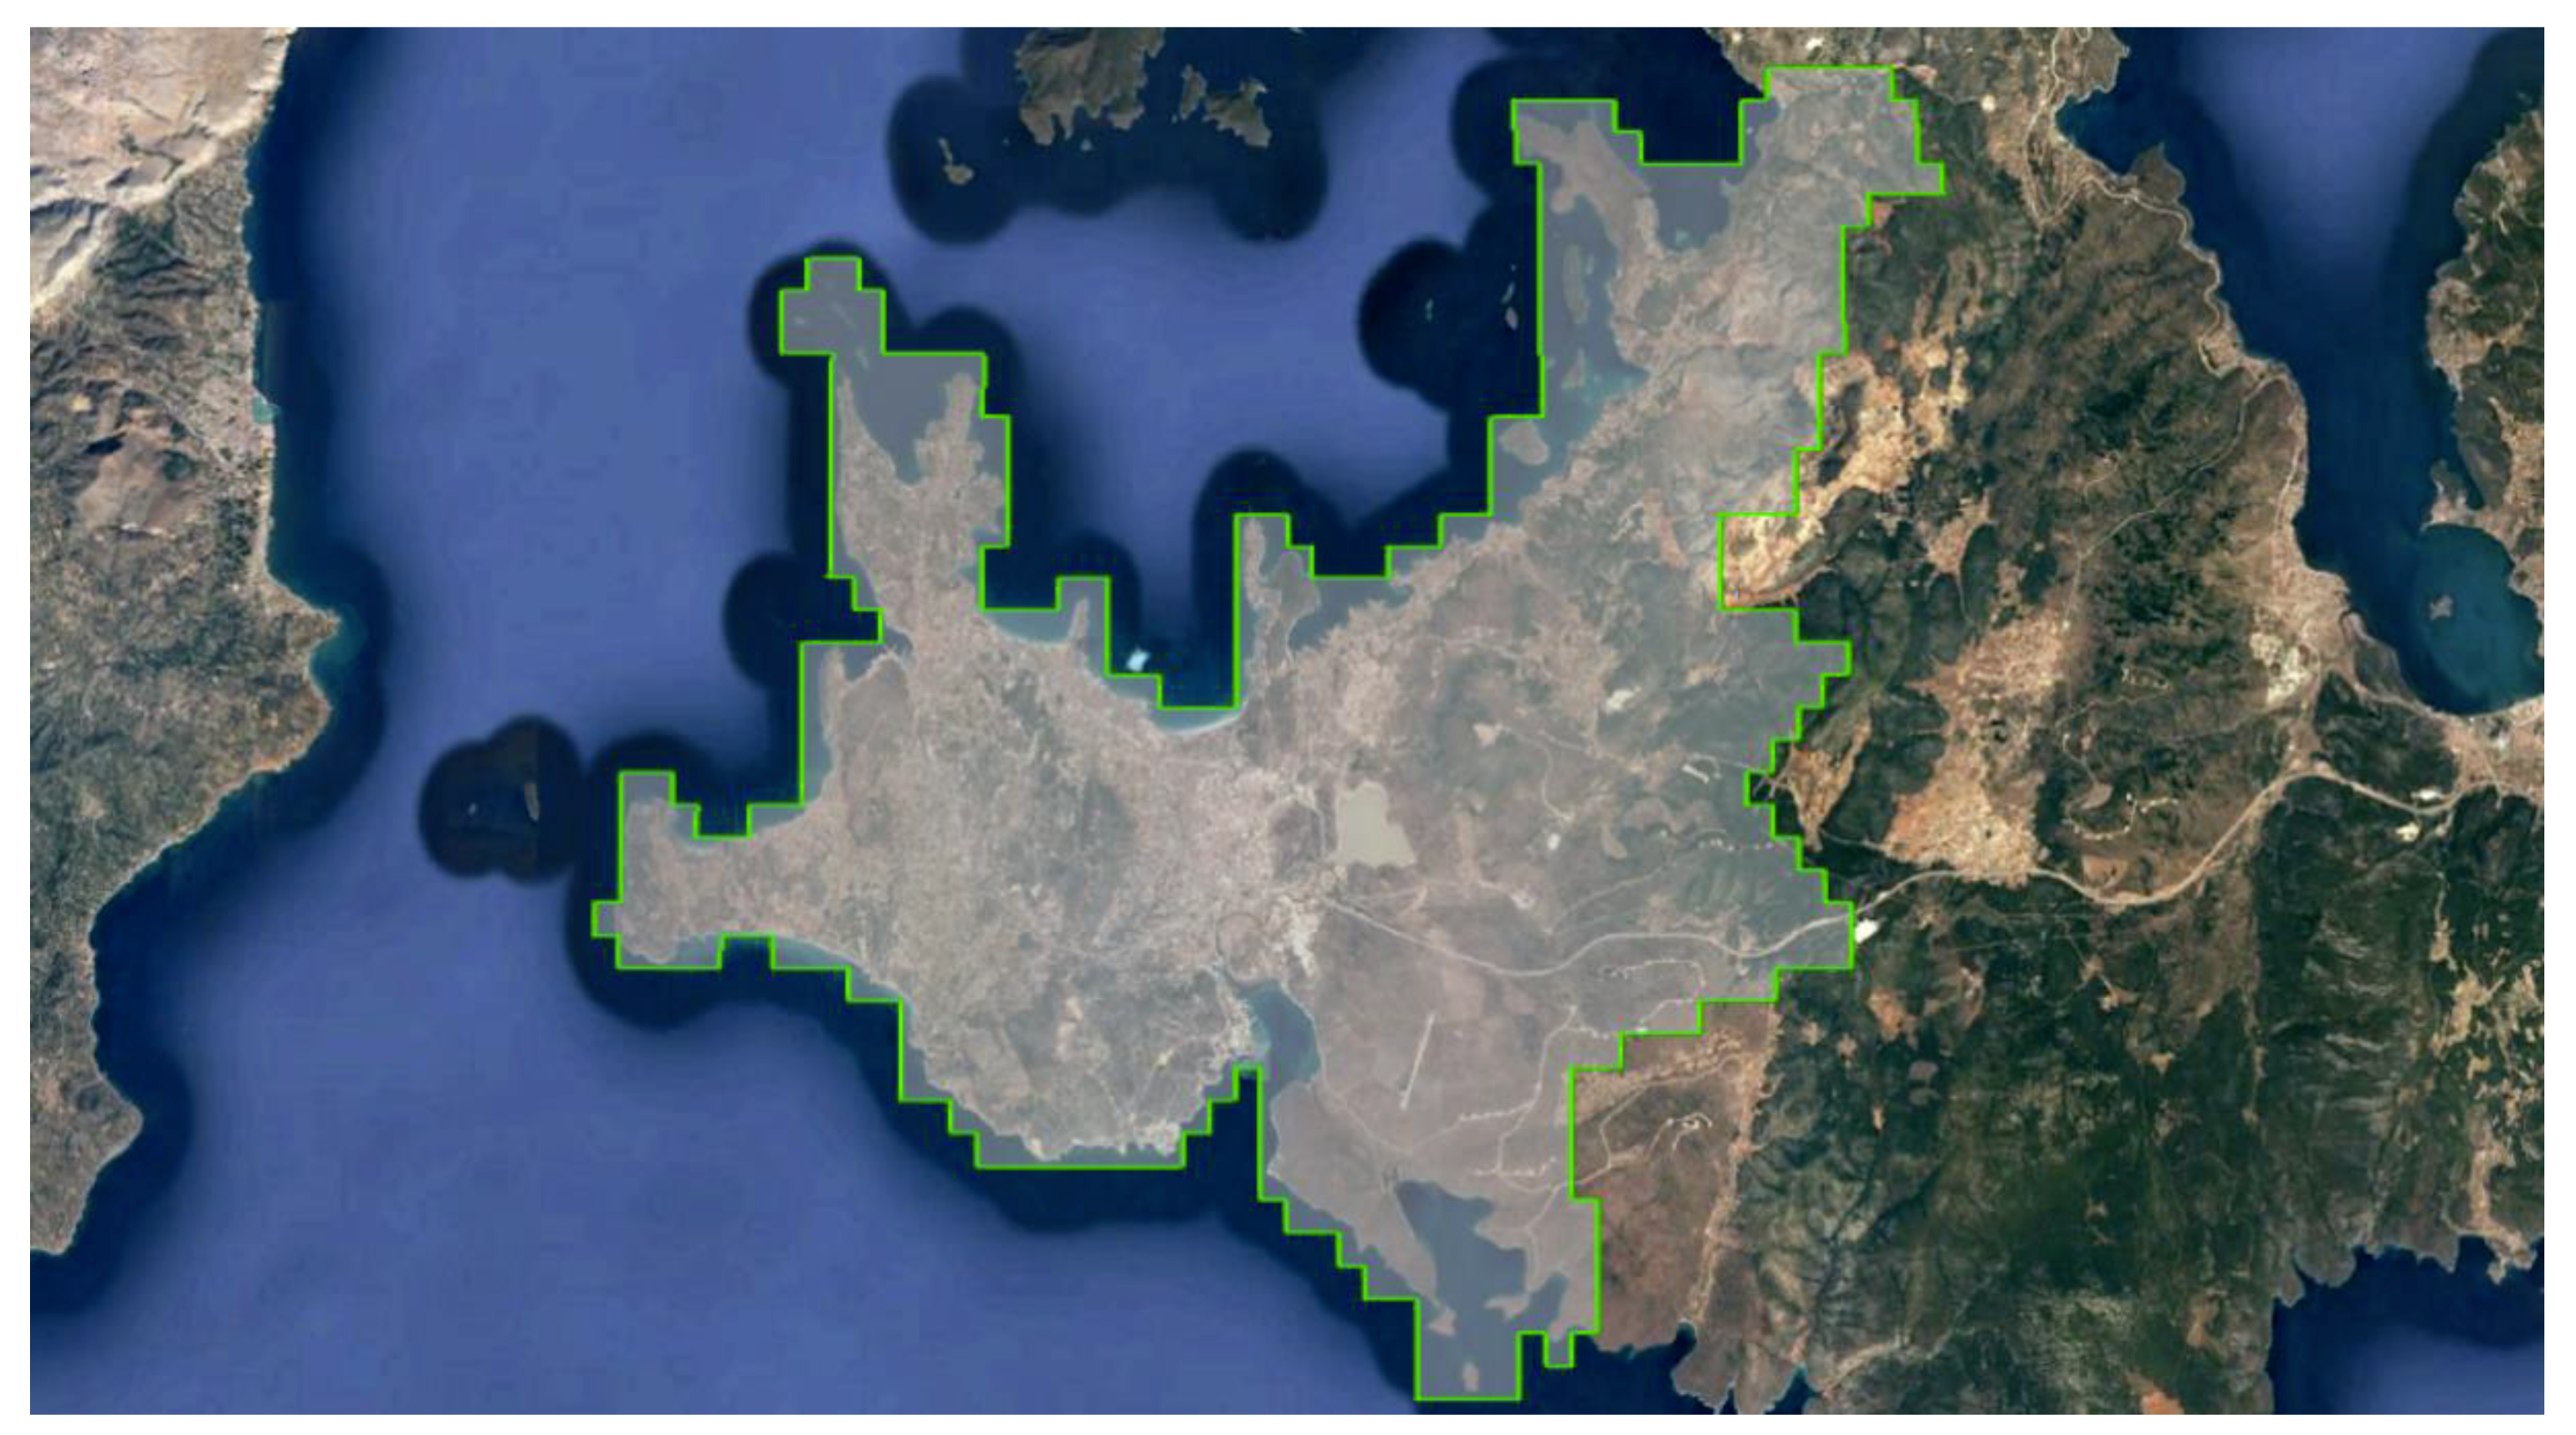
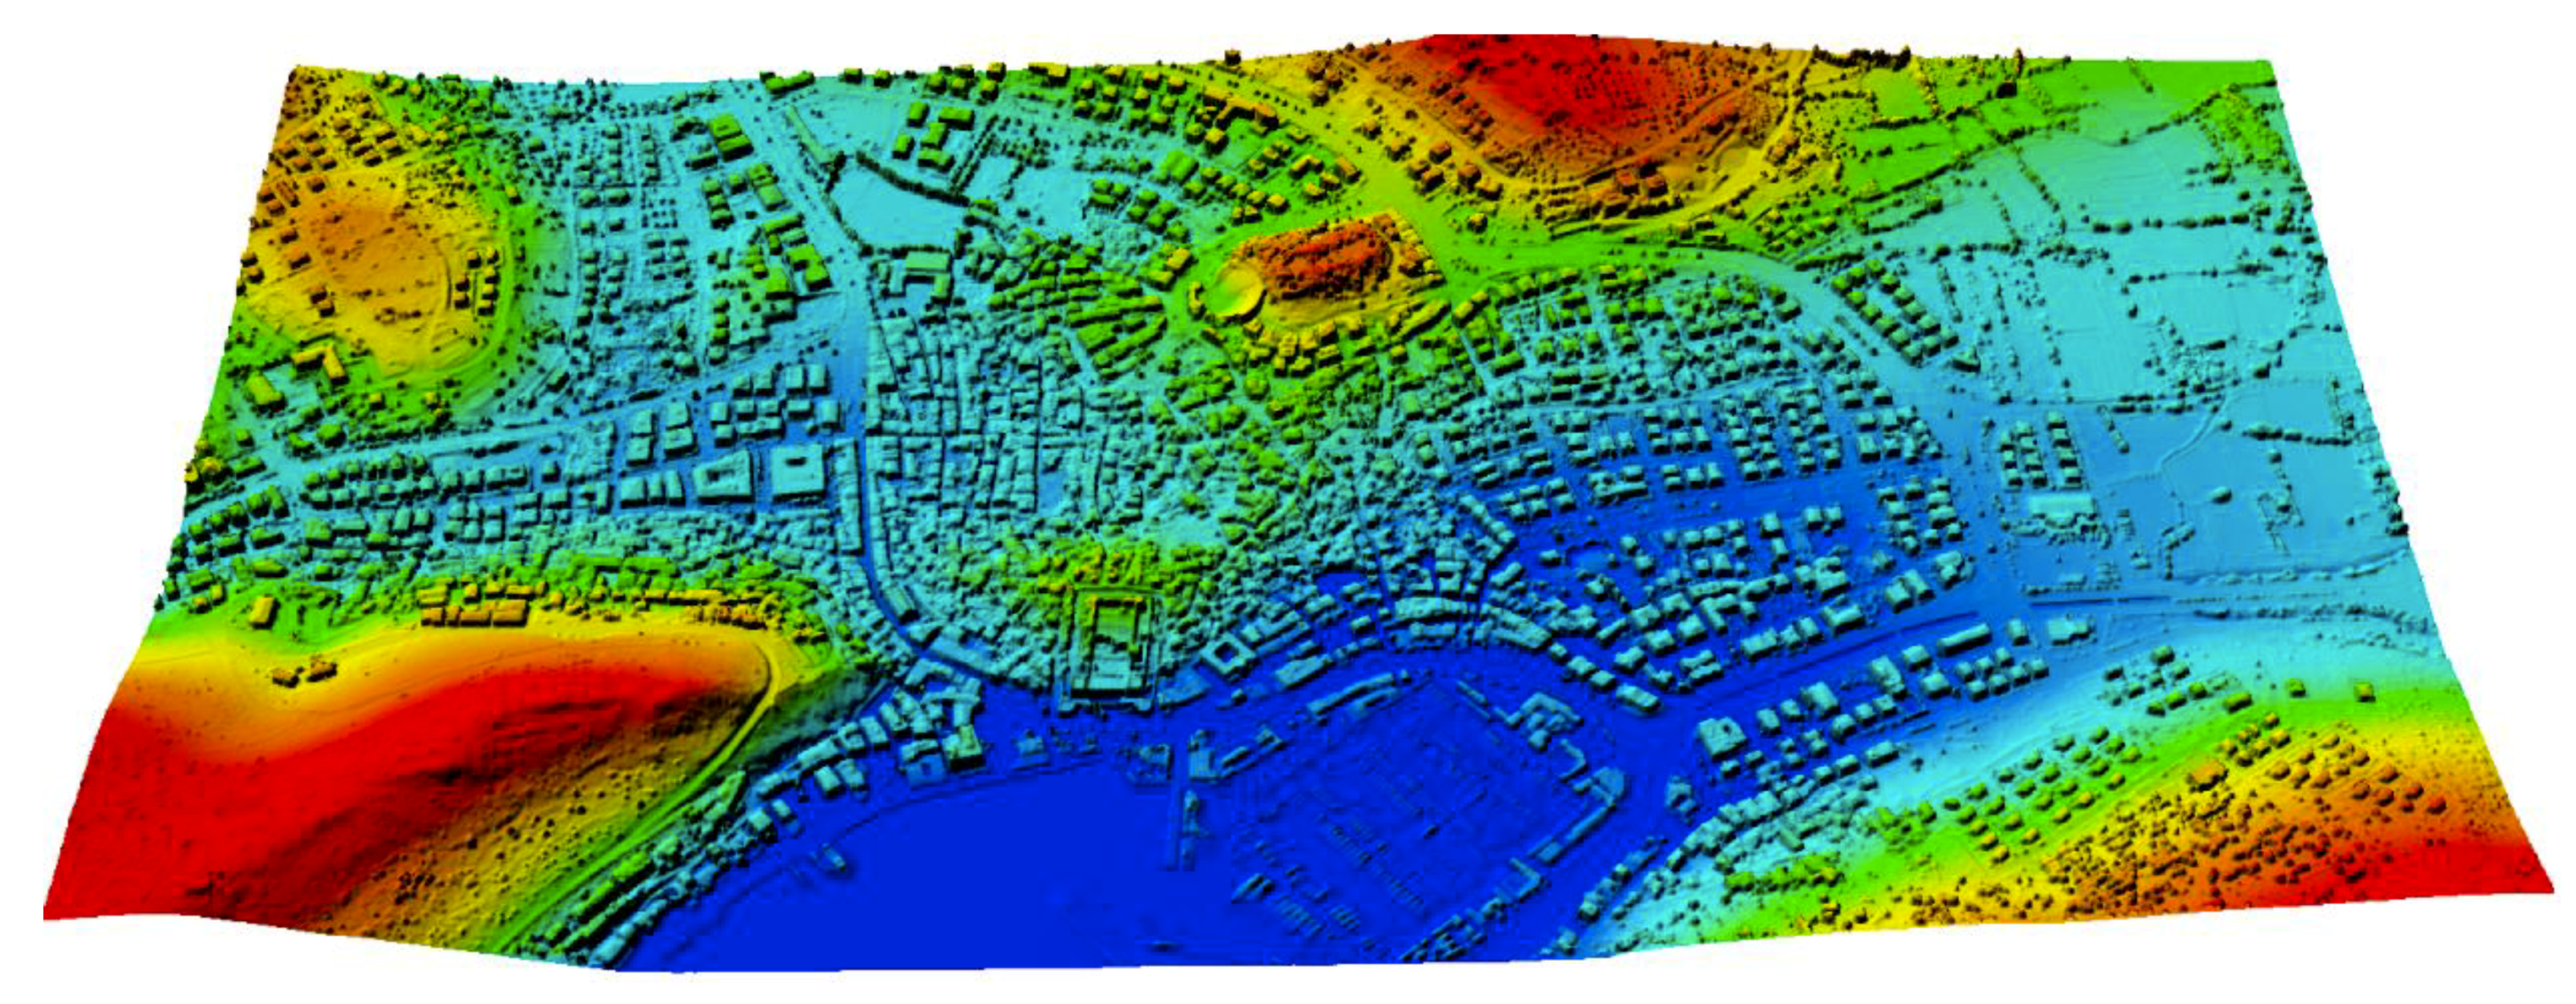
Izmir is the largest metropolitan city in Turkey’s Aegean Region. Cesme is a coastal town located 85 km west of Izmir and also a very popular holiday resort with several historical sites. A large majority of the structures in the Cesme area are in the Aegean architecture style and most of the buildings are located on the coastline and are usually at low elevations. The highest building in Cesme has a height of approximately 45 m. A general view of the study area is given in Figure 1.
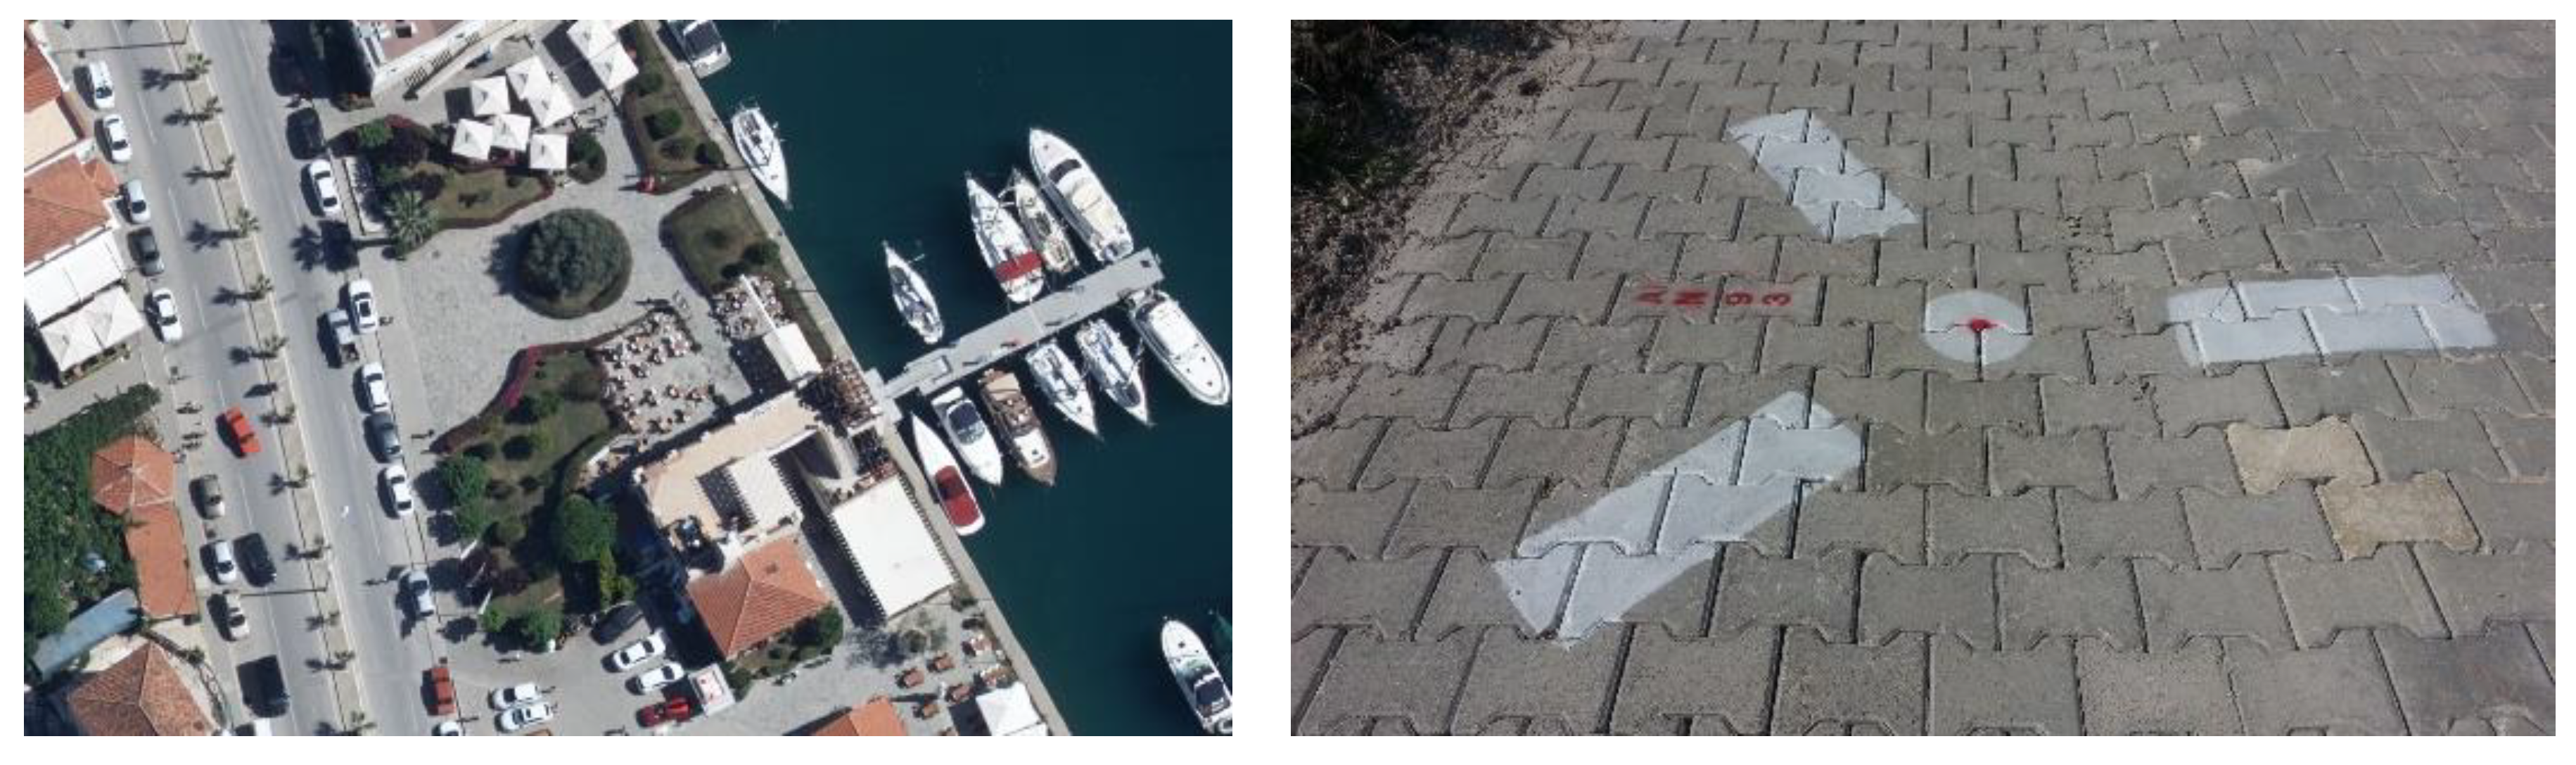
The study area covers the whole Cesme region with a size of 260 km2. Within the project, a total of 4468 aerial photos were taken in May 2016 with 80% forward overlap and 60% lateral overlap using UltraCam Falcon large-format digital camera from Vexcel Imaging, Graz, Austria [34]. The photos have been taken from an average altitude of 1500 m from mean sea level and have an average GSD (ground sampling distance) of 8 cm and a footprint of 1400 m × 900 m. A total of 306 ground control points (GCPs) have been established prior to the flight with an interval of 1.5 km. Figure 2 shows the level of detail in the images and the ground signalization of one control point. The block configuration is provided in Figure 3. Orthometric heights have been measured by a leveling method and planimetric coordinates have been measured using Global Navigation Satellite System (GNSS) devices. The GCPs have been used in the photogrammetric bundle block adjustment process.
Manual feature extraction for basemap production from stereo aerial images has been done by photogrammetry operators. Contour lines (1 m, 2 m, 5 m, 10 m), slopes, and breaklines have been measured along with the generated photogrammetric height points, which have later been converted to a TIN (triangular irregular network) dataset and used for grid DTM generation. Lastly, orthophotos with 10 cm pixel size have been generated for the whole area.
2.2. The Overall Workflow
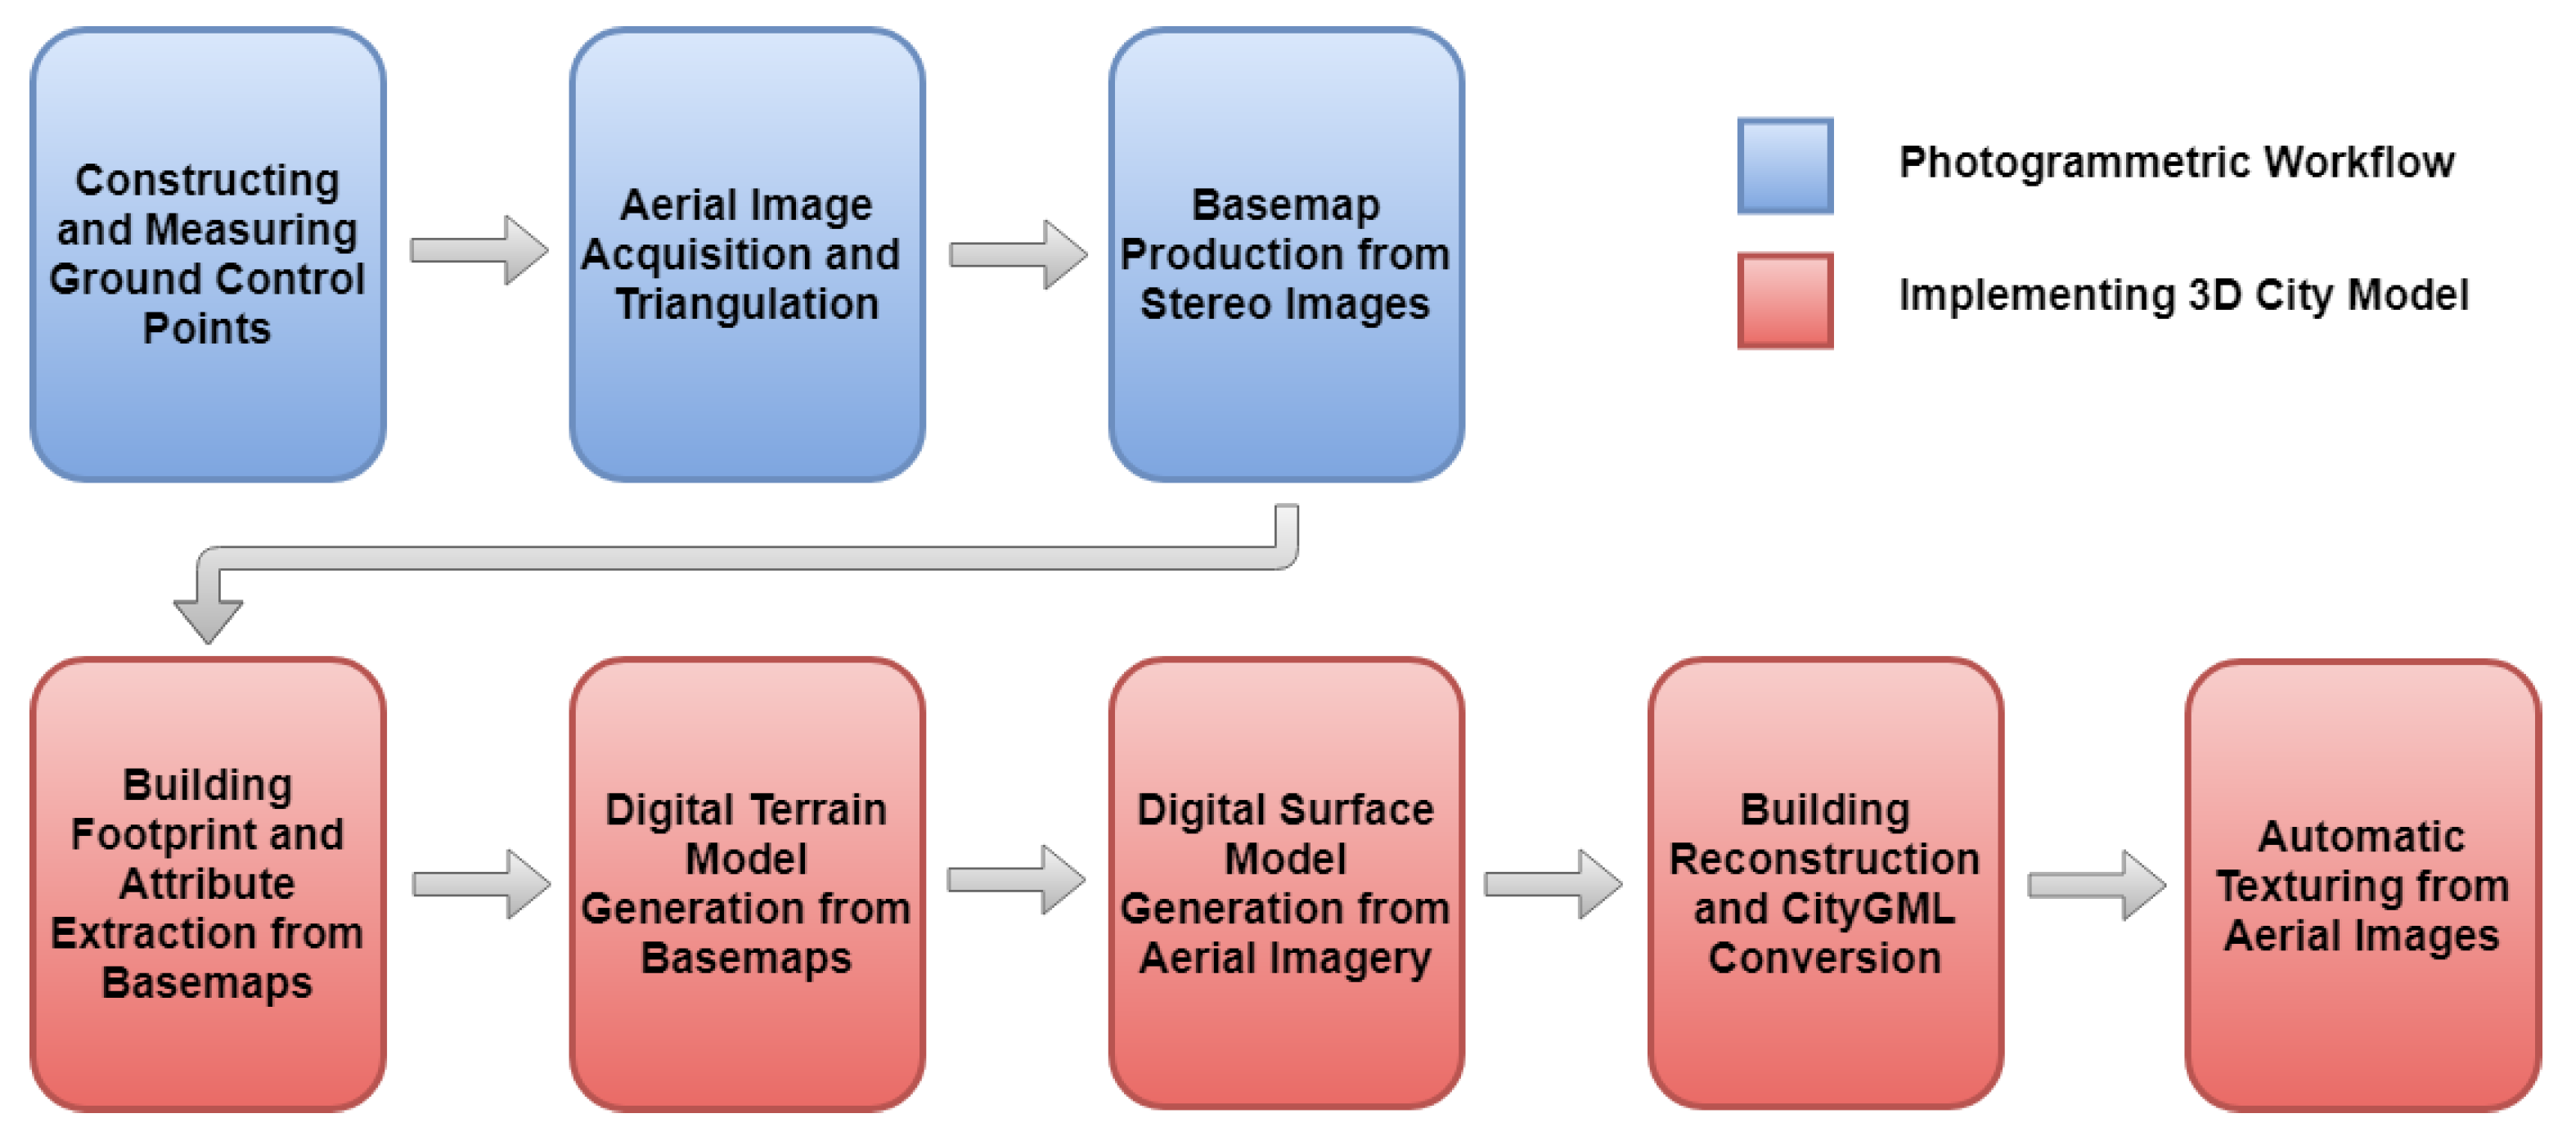
The overall workflow of the study involves photogrammetric data production and building reconstruction together with texturing as depicted in Figure 4. The photogrammetric processing mainly includes flight planning, GCP signalization on the ground, image acquisition and triangulation, and manual feature extraction for basemap production in CAD (computer aided design) format. The buildings have been reconstructed automatically using the CAD data. A post photogrammetric data collection process has been performed to generate a dense DSM of the area with a 30 cm grid interval using Agisoft Photoscan Pro, St. Petersburg, Russia [35]. All contour lines, breaklines, and photogrammetric height points measured in Microstation from Bentley Systems, Exton, PA, USA [36] and saved in CAD format (Microstation DGN) have been converted into TIN datasets and grid DTMs using FME Workbenches developed by Safe Software, St Surrey, BC, Canada [37]. The buildings have been reconstructed using BuildingReconstruction (BREC) software from VirtualCity Systems GmbH, Berlin, Germany [38] and the generated models have been converted into CityGML format as output. The texturing has been done automatically using the CityGRID Texturizer software from UVM Systems, Klosterneuburg, Austria [39]. As a last step, textured models have been converted into the CityGML format to ensure data interoperability between different systems.
3. Implementation of the 3D City Model
3.1. Image Georeferencing with a Photogrammetric Bundle Block Adjustment
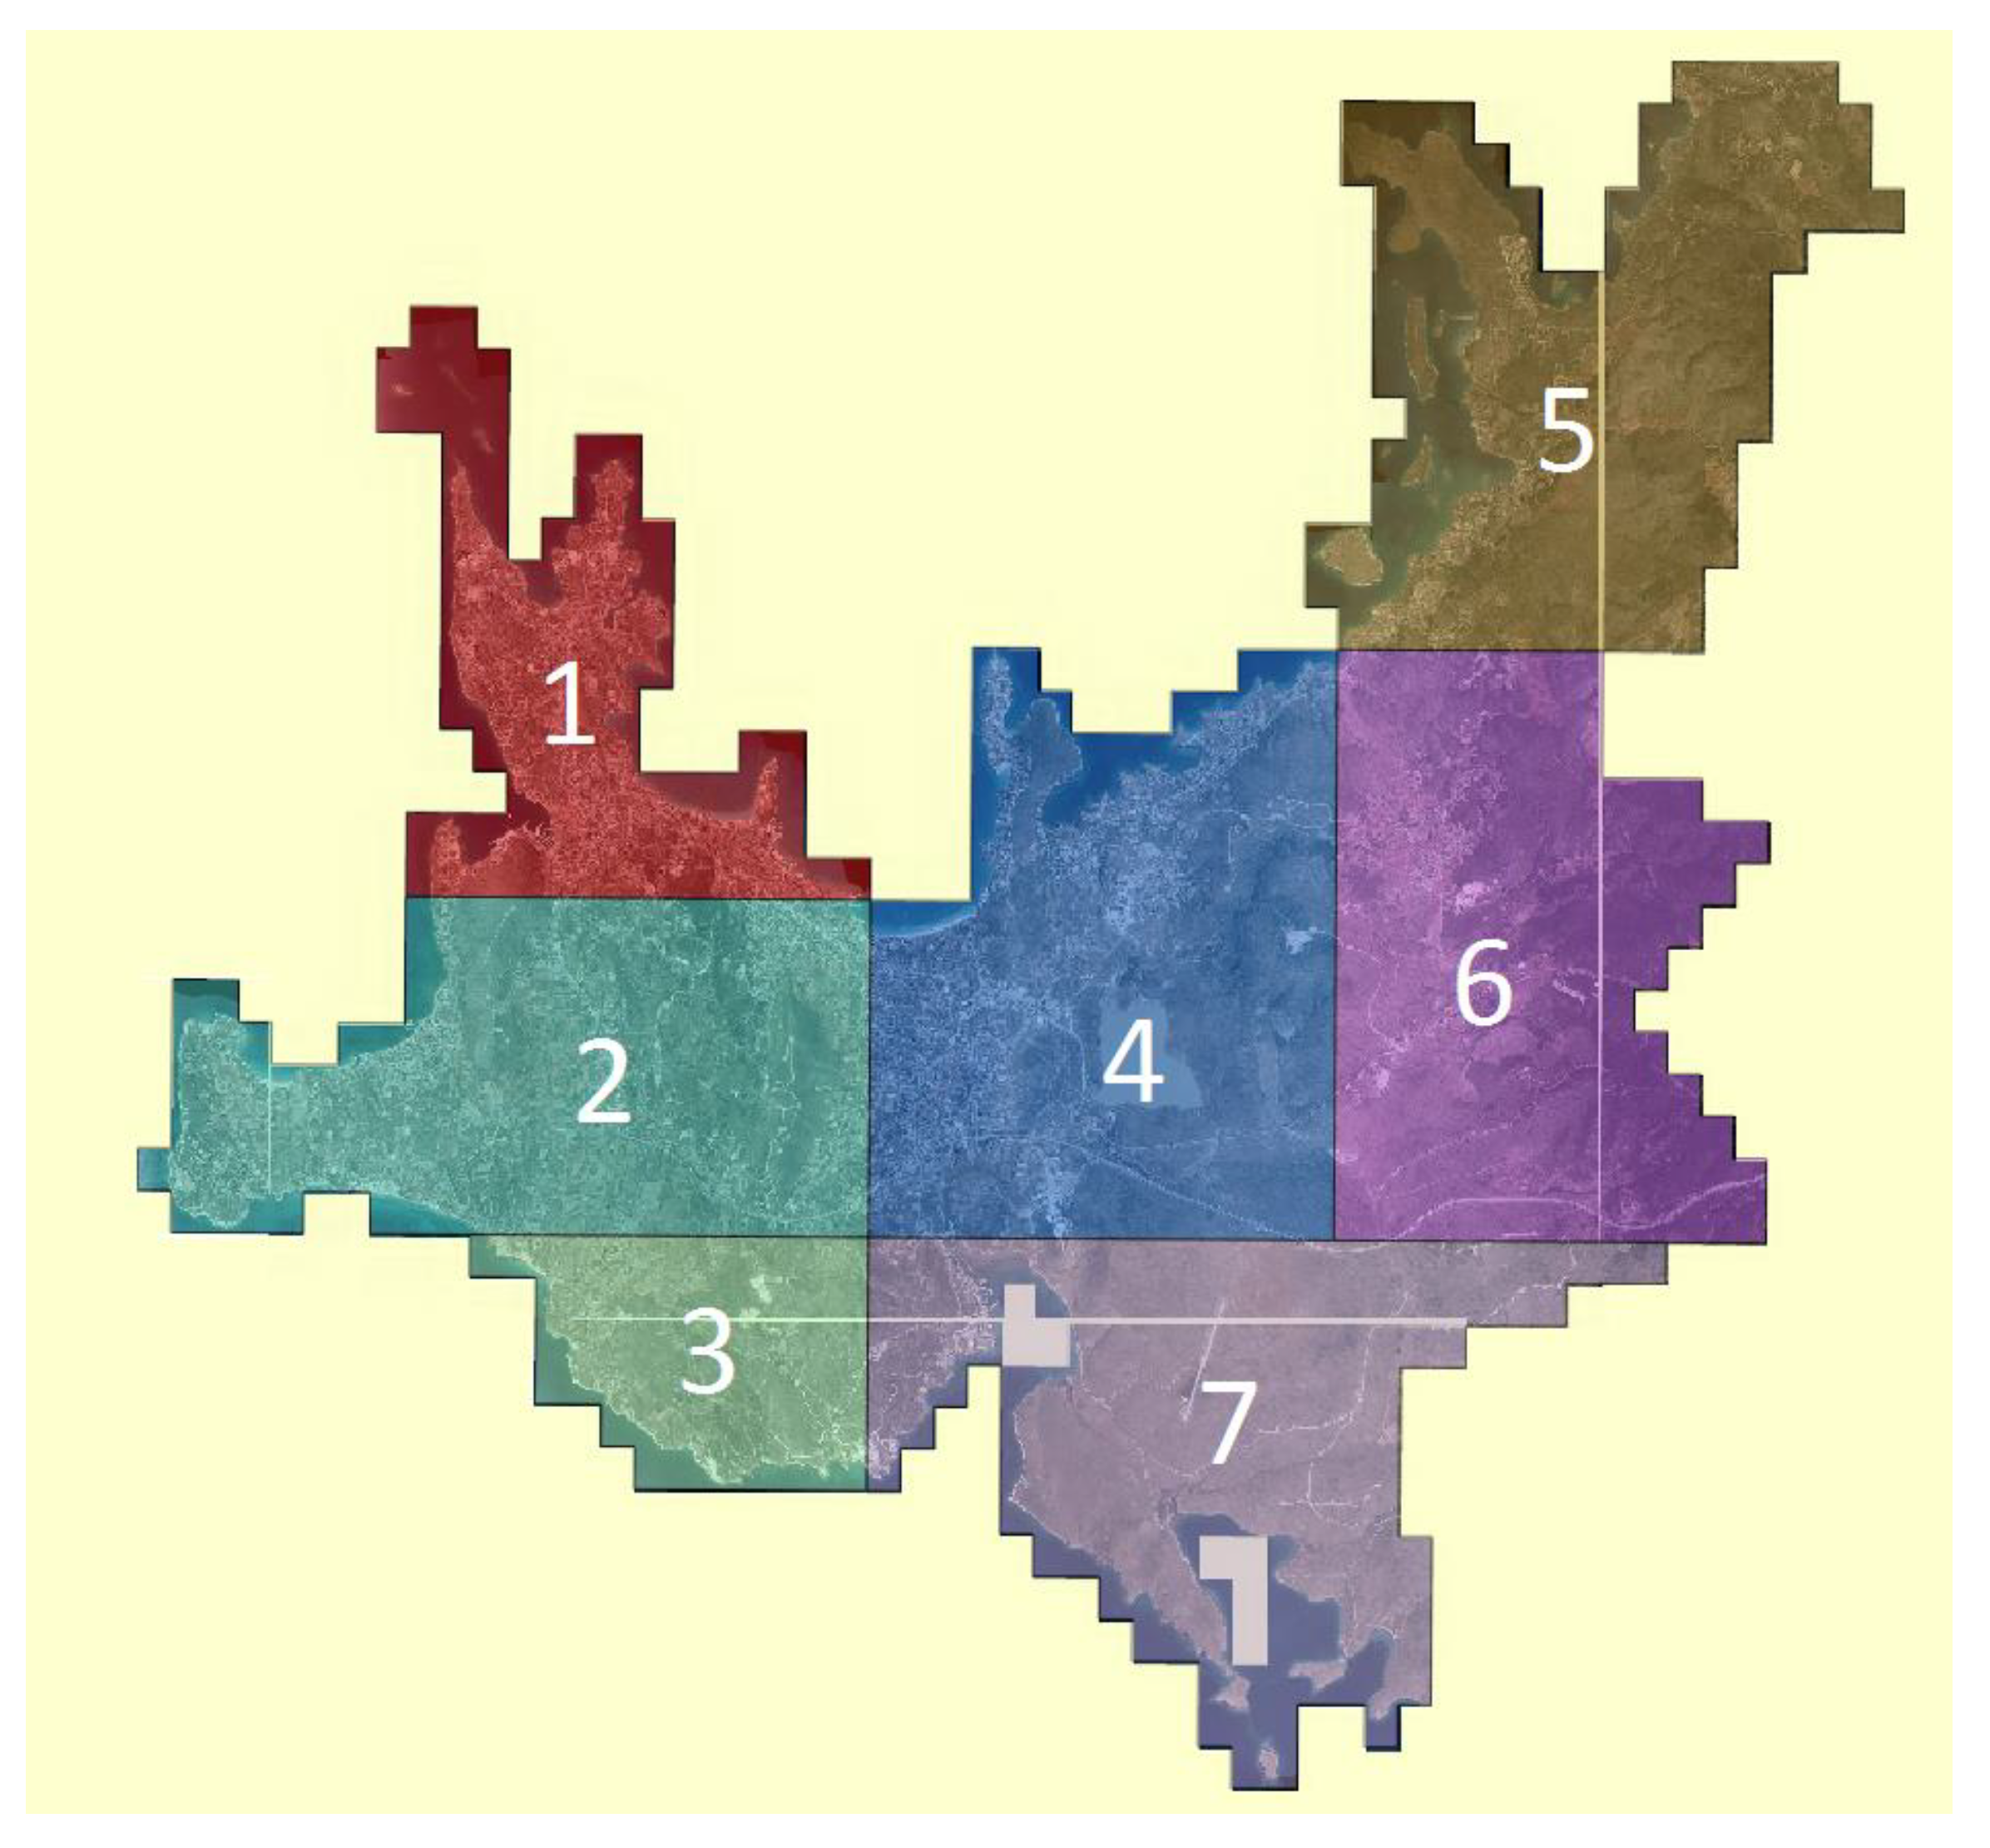
Exterior orientation parameters (EOPs) of the aerial photos have already been measured during the photogrammetric flight mission using GNSS antenna and INS (inertial navigation system). In order to achieve sub-pixel accuracy, a photogrammetric triangulation process with self-calibration has been applied using GCPs and tie points, and the existing GNSS and INS measurements have been used as weighted observations in the adjustment. The project area has been split into seven sub-blocks for optimization of the bundle block adjustment process (Figure 5). The image measurement of the GCPs and initial tie points in strip and cross-strip directions have been done manually by operators, and further tie points have been extracted automatically with the Intergraph Z/I automatic triangulation module [40]. The bundle adjustment has been performed using the same software with self-calibration and blunder removal by statistical analysis. The systematic error modeling with additional parameters include atmospheric refraction, Earth curvature, and camera distortion (radial and de-centering). The number of images in each block, the numbers and properties of the GCPs, size of the block area and the accuracy measures (sigma naught of the adjustment and the standard deviations of GCPs in image space) are shown in Table 1.
3.2. Building Footprint and Attribute Generation from Basemaps
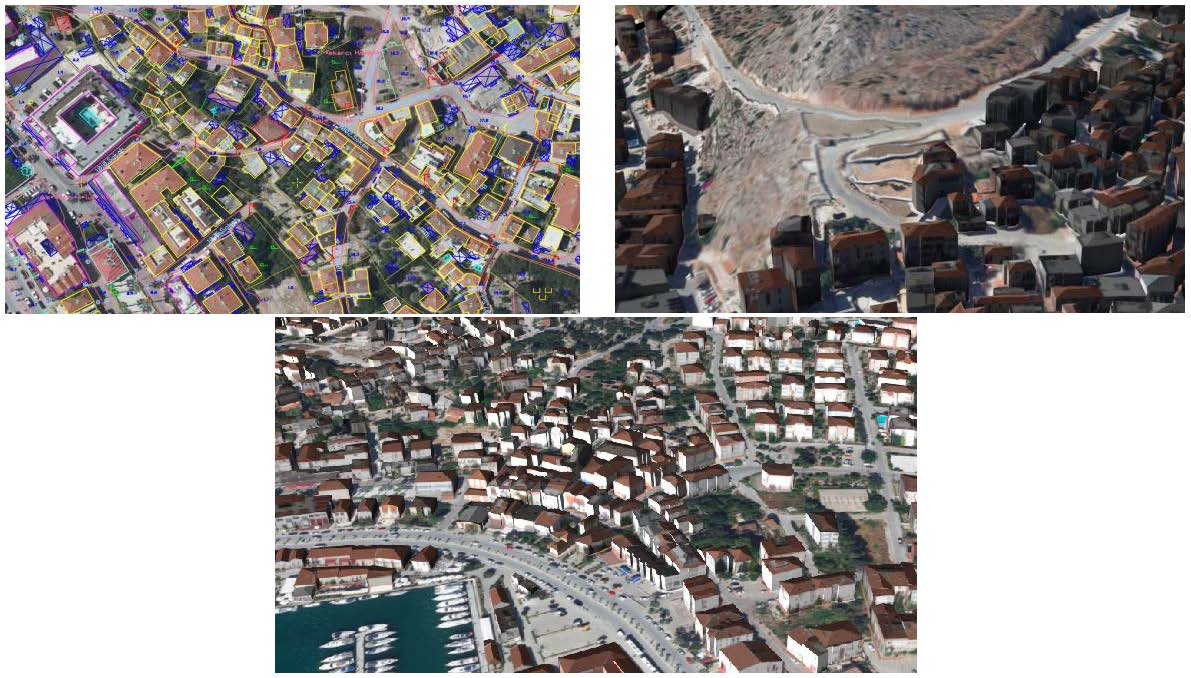
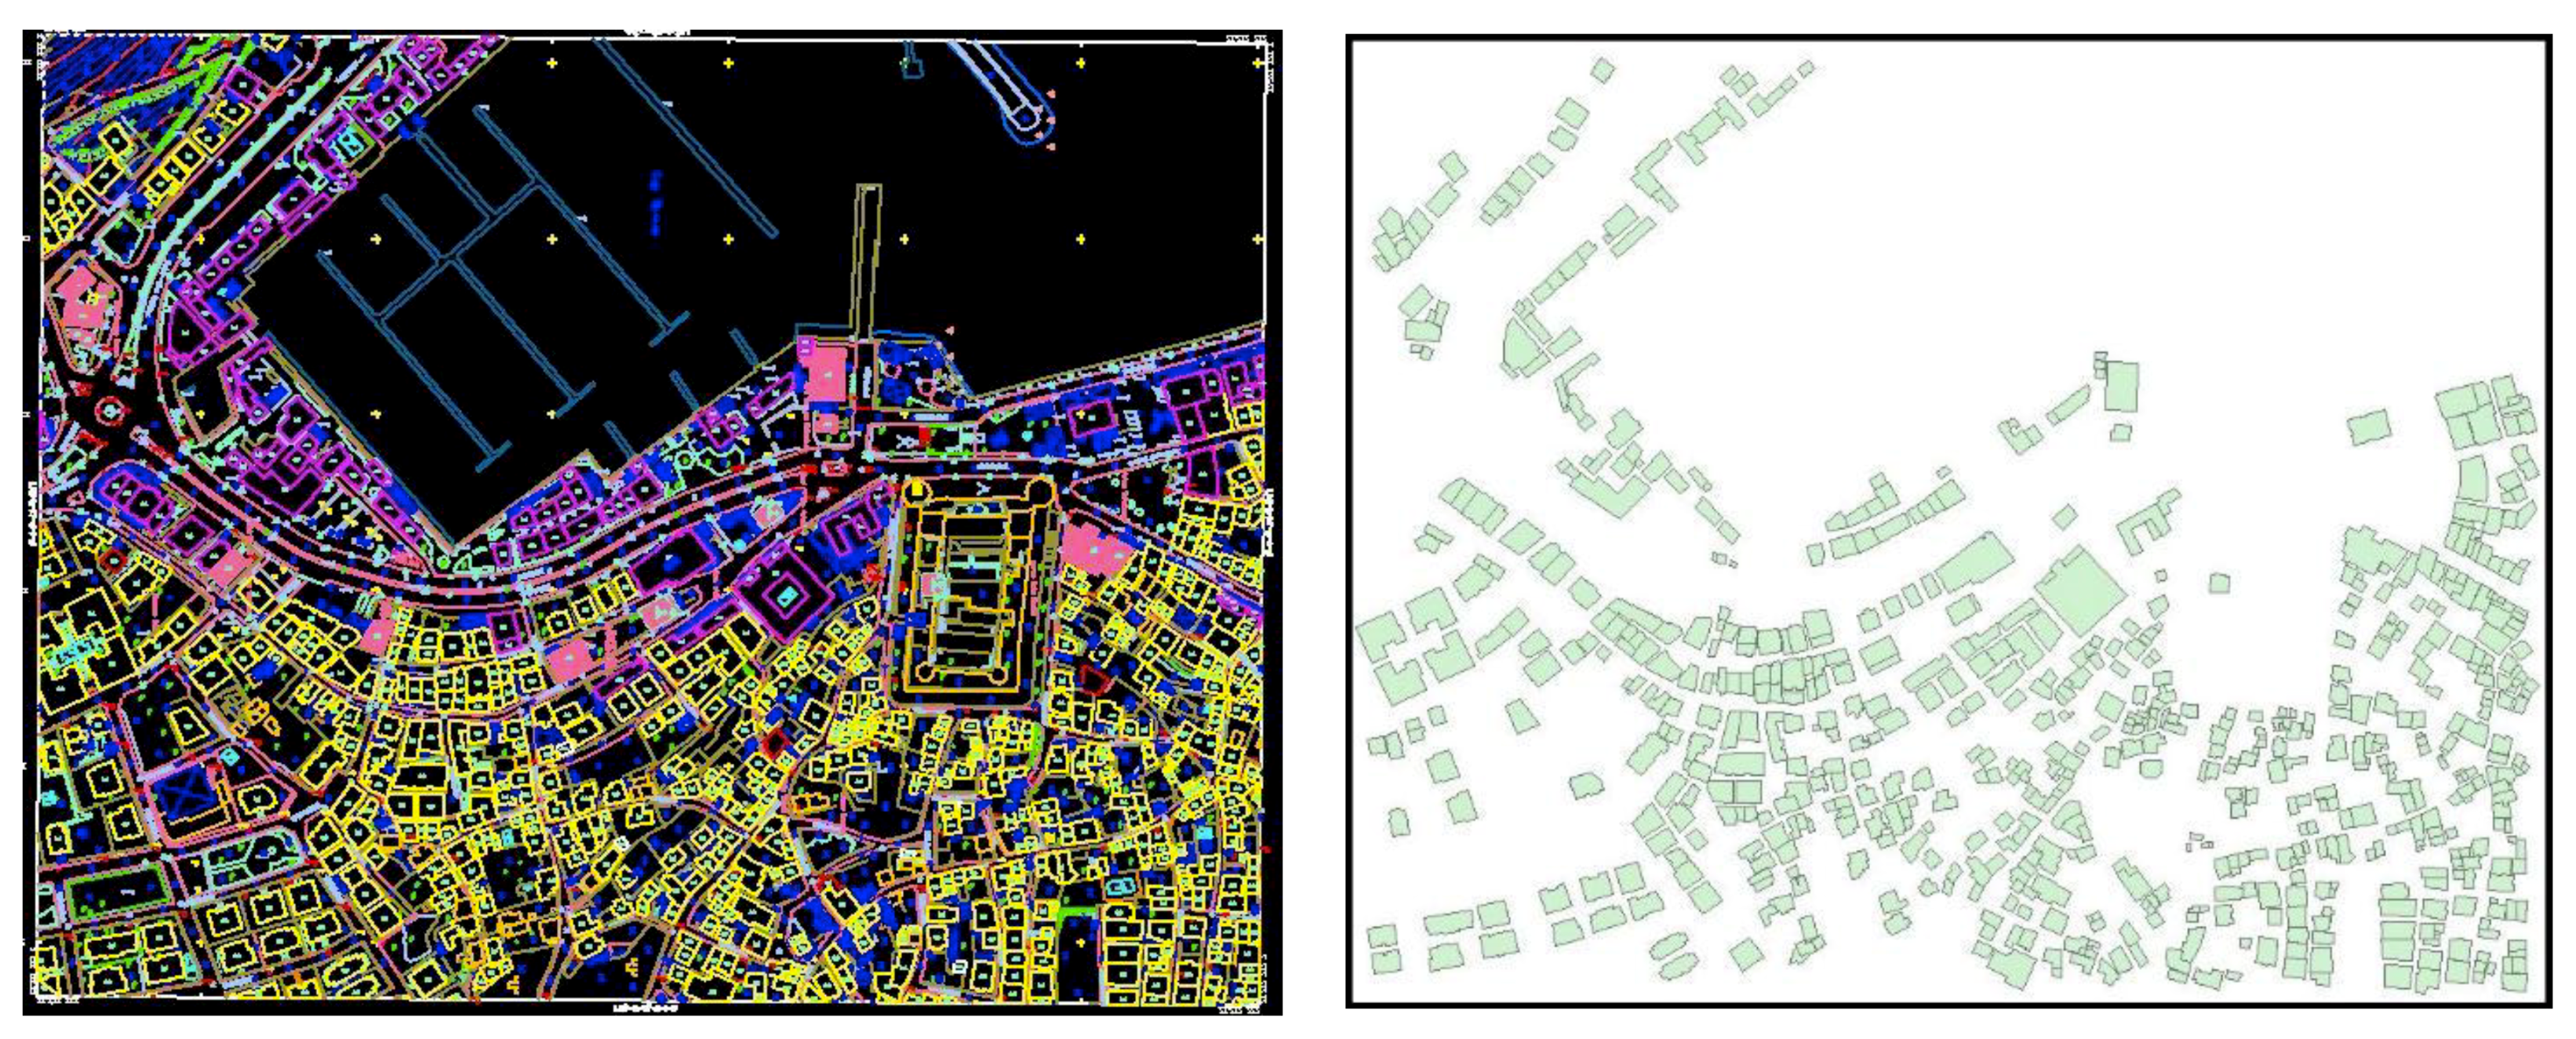
Although aerial photographs contain almost all visible information related to the surface of the project area, they cannot be compared to traditional vector maps before they are interpreted by humans or computers. Any good map user can hardly understand and interpret aerial photographs directly and image interpretation for map production is still an expert task. A vector map is an abstraction of selected details of the scene/project area. Figure 6 shows an overlay of an aerial orthoimage and manually extracted features stored as vectors. In addition, maps contain symbols and text as further information. Interpretation, analysis, implementation, and use of vector map information are easier than orthophotos. Details and attribute information in vector maps are gathered by models from the stereo analysis so that they are clearer, understandable, and interpretable. Feature points and lines showing the terrain characteristics (e.g., creeks, ridges, etc.) are also produced manually or semi-automatically during the processing of aerial photos, such as contour lines, DTM grid points, break-lines and steep slopes. In addition, information stored in vector maps have been extracted to create an attribute scheme for buildings in this study.
BuildingReconstruction, which is used for 3D city model generation in this study, requires building footprints and attributes as input in ESRI Shapefile (.shp) format. The basemaps produced in aerial photogrammetric projects are often stored in CAD formats as standard and every mapping project generally contains more than 200 layers. The data and information stored in these layers are usually adequate for extracting the building footprints and a few types of attributes. The building footprints used here can be considered as roof boundaries since it is usually not possible to see the building footprints on the ground in aerial images. The buildings are collected and stored in different CAD layers such as residential, commercial, public, school, etc., according to their use types. In addition to the buildings, other structures, such as sundries, lighting poles, or roads, are also measured by photogrammetry operators.
In BuildingReconstruction it is required to store the building geometries and attributes in a single ESRI shapefile. These geometries and attributes are later converted into CityGML format while exporting the building geometry after the reconstruction is completed. The attributes can be used to implement queries on the reconstructed city model. However, the CAD files contain just vector data and don’t include the attributes as text assigned to geometries. While converting the CAD data into shapefile format, some implicit attributes about the buildings have been extracted generated using ETL (extract-transform-load) transformers of the FME software. As an example, the number of building floors is stored in a different CAD layer as text (also vector unit) and their location fall inside the building polygons as can be seen in Figure 6. A spatial transformer (i.e., “SpatialFilter” of FME) is used to transform these numbers into “number of floors” attribute of every building. The transformer compares two sets of features to see if their spatial relationships meet the selected test conditions (i.e., filter is within candidate) and if a number (i.e., text) is located inside a polygon, it is assigned as attribute to that polygon (i.e., building). In addition, center coordinates of building footprints have been extracted and saved as new attributes using another spatial operation (i.e., CenterPointExtractor). A total of eight attributes have been extracted from the CAD layers using the spatial ETLs and become ready to be input into BuildingReconstruction. A part of the project area with all CAD layers and the building footprints extracted thereof are given in Figure 7.
3.3. Digital Terrain Model (DTM) Extraction
DTMs are 3D representations of the terrain elevations found on the bare Earth’s surface. In this study, DTMs are required to make sure that buildings are located exactly on the terrain, not under or above of it. It is also used to calculate the base height of a building from the terrain. The resolution requirements for the DTMs are substantially lower than DSMs in the methodology proposed here. A grid resolution between 1–5 m is usually sufficient. A general recommendation from BuildingReconstruction is to use a grid interval of 1 m. The software works best with the tile-based raster data since raw point clouds data can be very massive and difficult to process. Figure 8 shows an overview of the manually extracted terrain features and a zoomed view of it.
Within the photogrammetric flight project, contour lines with different intervals (i.e., 1 m, 2 m, 5 m, 10 m), breaklines and grid DTM points have been manually measured using Bentley MicroStation software by photogrammetry operators. More than 1.2 million height points, and thousands of contour lines and break lines have been merged and converted into a TIN dataset and a single DTM with 1-m grid interval (Figure 9).
3.4. Digital Surface Model (DSM) Generation
For the DSM generation, a number of different software has been investigated to obtain an optimum balance between the DSM quality (completeness, density, and accuracy) and the production speed. Finally several high-density DSMs have been generated using Agisoft Photoscan Pro software, since it allows parallel processing by allowing GPU (graphics processing unit) usage along with the CPU (central processing unit) during the DSM generation. The DSM of the project area has been generated in seven sub-blocks as these blocks have already been formed for the triangulation (Figure 5). Since BuildingReconstruction can reconstruct a maximum of a couple of thousand buildings in a single process, the larger blocks have again been divided into more sub-blocks to decrease the processing area and time. While selecting the aerial photographs in every sub-block for building reconstruction step, it has been taken consideration that buildings near the outer boundary of the project area should be visible at least in six or more photographs for better reconstruction. Adjusted EOPs and camera calibration parameters have been used as input in Photoscan to provide the georeferencing of the images. However, the images have been re-oriented by generating tie points and re-measuring GCPs due to software requirements. Based on the established camera orientations, the software generates a dense point cloud (i.e., DSM). Figure 10 depicts the tie points and the dense point cloud generated in one part.
Although a DSM with a resolution of 25 cm is already considered to be sufficient for the BuildingReconstruction software to generate building models with optimum accuracy, five point clouds in Agisoft Photoscan have been generated with different densities (at 1, 2, 4, 8, and 16 pixels intervals) for test purposes. The optimal results with BuildingReconstruction have been achieved using DSMs with 25–50 cm resolutions for LoD2 buildings. Considering this fact, the DSMs have been generated at a resolution of 30 cm for the whole project area. An overview and a zoomed view of the generated DSMs from one sub-block is shown in Figure 11.
3.5. Automated Building Reconstruction
In this study, BuildingReconstruction 2018 software has been used for automatic reconstruction of buildings and conversion into the CityGML format. The software enables automatic generation and manual editing of building models in LoD1 and LoD2 based on DSMs and building footprints. As described in [38], the DSM is analyzed for each building outline to detect the roof shape. The following algorithms are employed for this purpose:
- Rectangle intersection: Simple geometries are processed with rectangular intersections. Intersecting rectangles and squares from the basis of the footprint are created to construct the building in 3D.
- Cell decomposition. The cell decomposition algorithm is used for buildings with multiple roof forms and/or with different heights [8]. A built-in library of more than 32 main and connecting roof types is used to detect the best fitting roof type for each generated cell.
- Footprint extrusion: This algorithm is used to create LoD1 models of large areas and also flat LoD2 buildings.
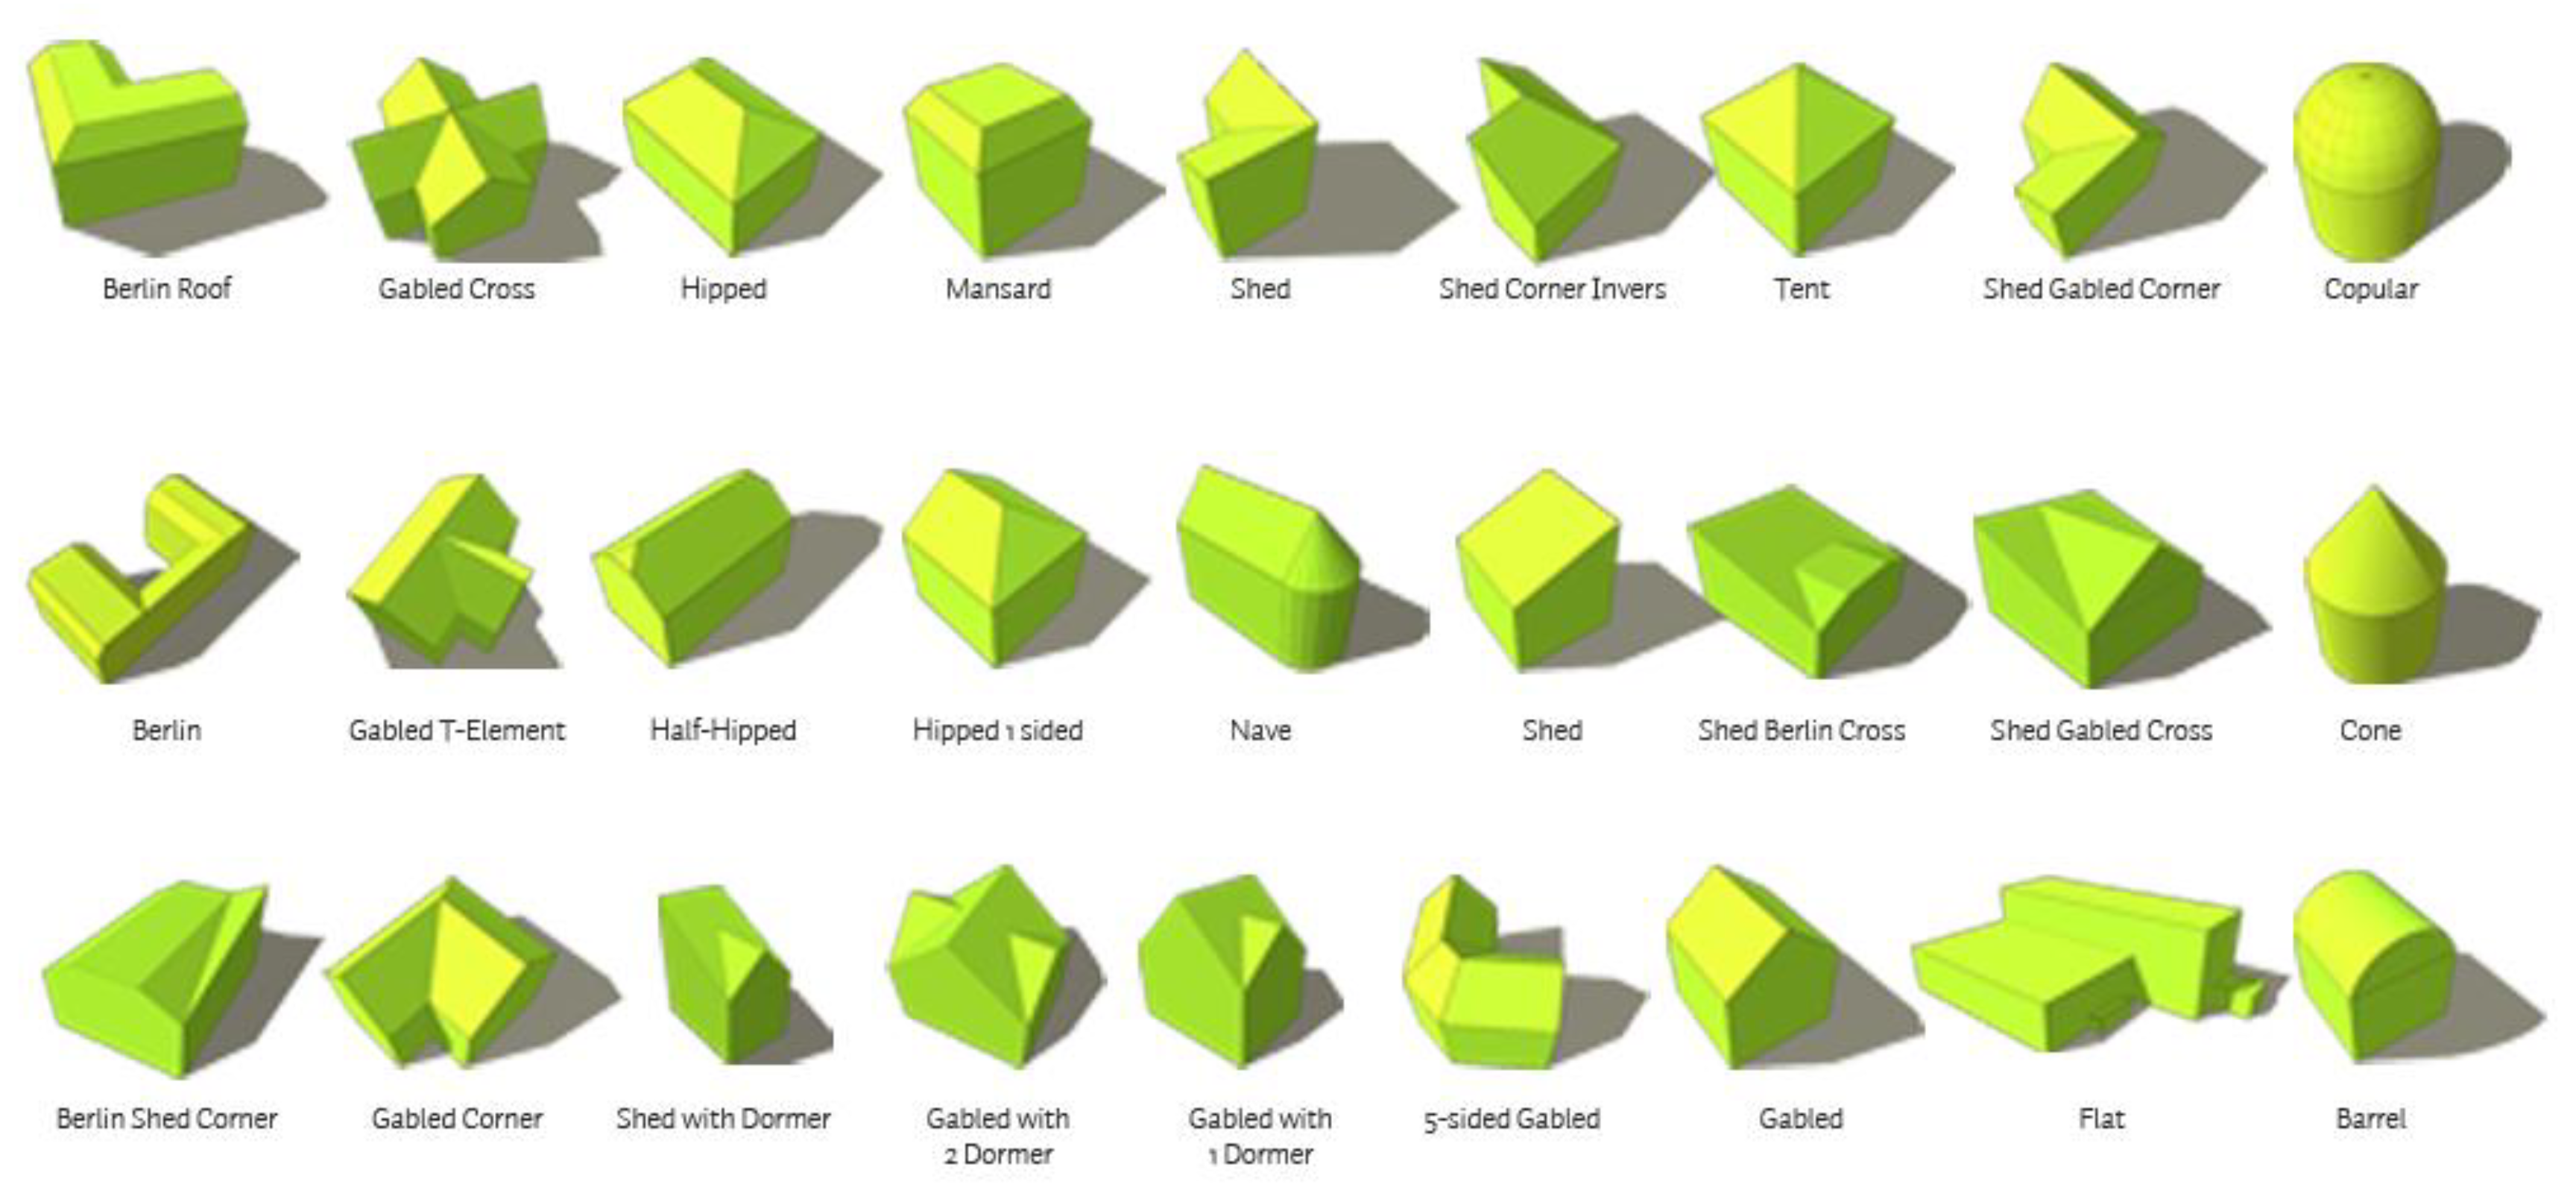
The main advantage of this method is automatic reconstruction of the 3D city models along with the rich semantic information and thematic attributes of the buildings. It works best with tile-based input files. If a large region is required to be reconstructed, the users need to generate tiles with 1 km2 or smaller sizes with the footprint data, laser data and orthophotos. A model-driven approach is used in BuildingReconstruction to detect and reconstruct the general roof geometry and type using a library containing 32 types of roof geometry popularly used in urban areas around the world (Figure 12). For every given polygon in input footprint shapefile, a discrete 3D building geometry is reconstructed. The reconstructed geometry is ensured to be fully closed without any holes or gaps between surfaces, and also be fully compatible with given building footprint. Along with the automated reconstruction, the software offers an interactive editor for manual editing on the building geometries.
The input data requirements for the BuildingReconstruction software are as follows:
- A grid DSM with 25–50 cm grid interval, optimally
- A DTM with 1-m grid interval, optimally
- 2D building footprints with attributes (each building polygon must have a unique ID)
- An orthophoto for visual checks
Figure 13 shows screenshots of the DSM and the DTM from one sub-block. The DSMs are used to determine the roof geometry and characteristics, whereas the DTMs are used to calculate the height and the ground geometry (footprint) of the building. Footprints are also used to determine the geometric structures of the walls in the building model. The software also supports processing without a DTM, and if no terrain model is available, the base height of a building is determined from a buffer in which the lowest point around a building is determined. However, this approach is successful only in areas where building density is low.
The buildings with the simple roof types and roof heights can in general be reconstructed more accurately than the complex ones. This problem arises because the software cannot match the complex roof types with the roof models in its library. Additionally, small parts on the roofs are mostly ignored by the software. The main advantage of the model-driven method is reconstructing models without any gaps or holes between surfaces with correct geometry. In addition, the production speed is slightly better than other methods. The main disadvantage is the requirement of a very comprehensive roof library for comparing roof geometries generated from given DSM.
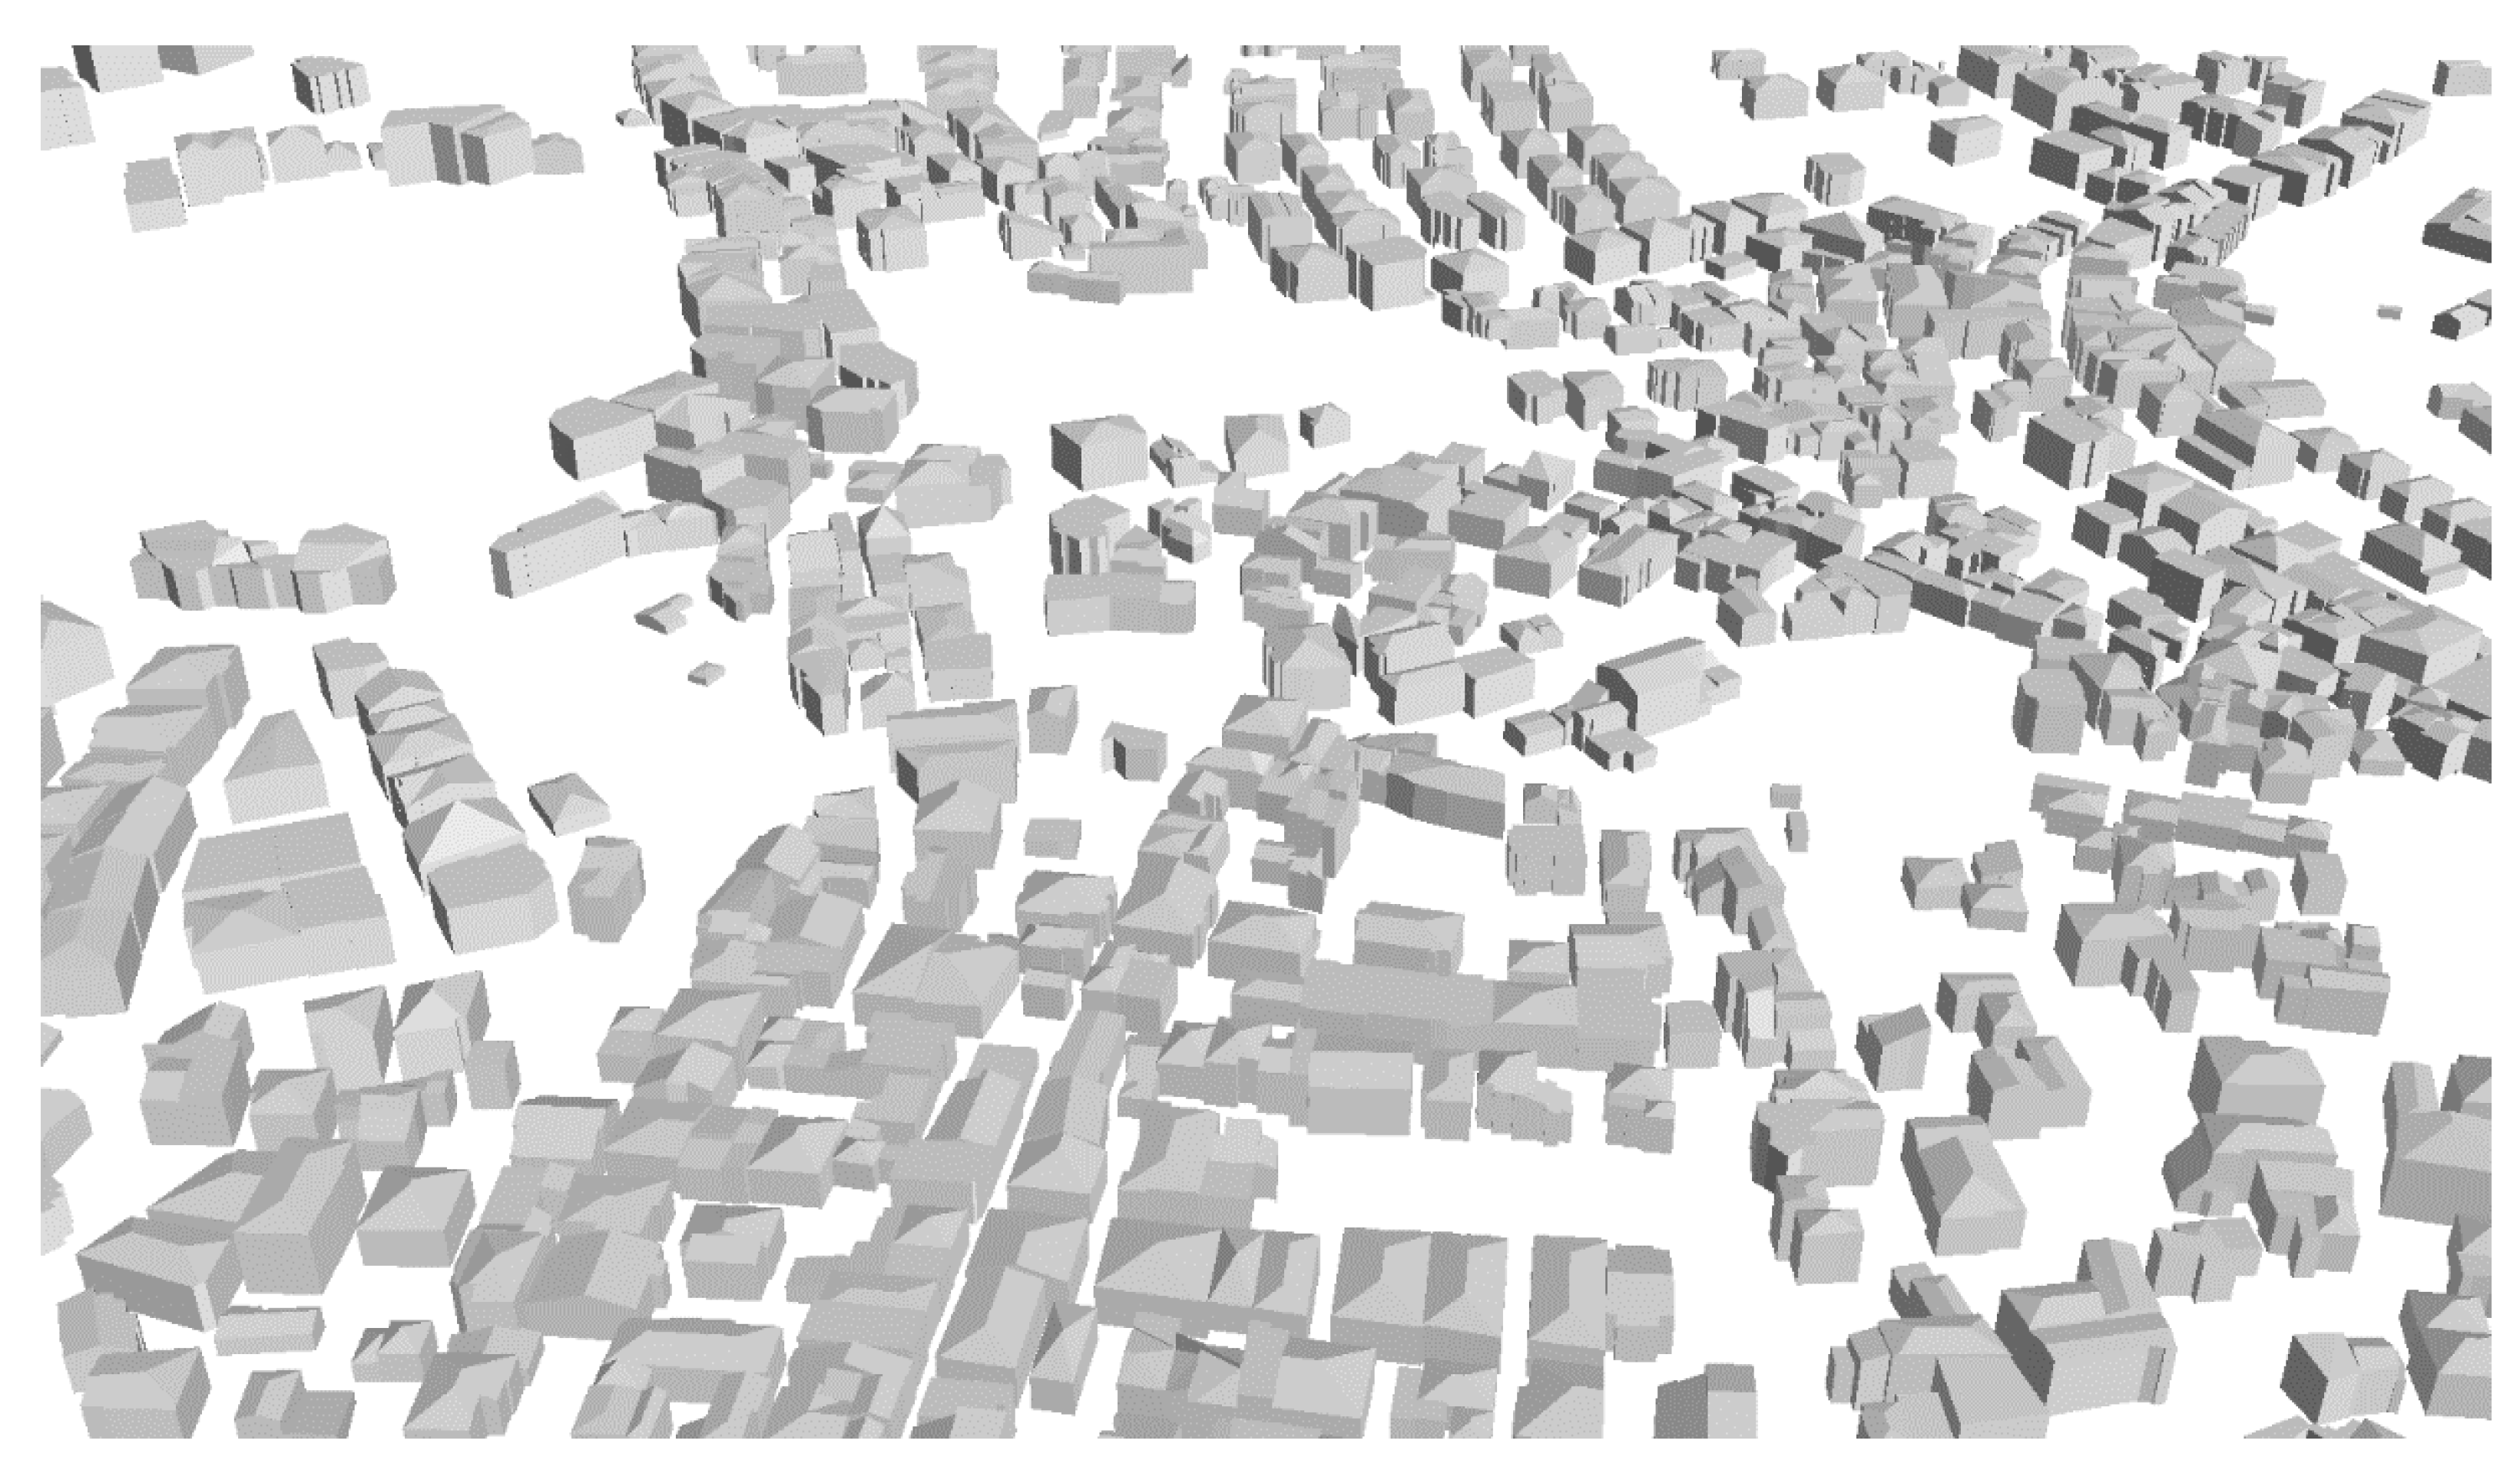
Figure 14 shows an example from the automatically generated buildings with BuildingReconstruction 2018 software from the project area.
Figure 15 shows a part of the automatically generated roof geometries overlaid on the orthophoto with 10 cm GSD. The reconstruction accuracy has been analyzed by visual checks on 1000 buildings and the results are provided in Table 2. During the visual assessments, the roof structures smaller than the DSM grid interval have been excluded and if the main roof structure is modeled correctly, it is considered as true.
Based on the investigations performed in this study, the advantages and the disadvantages of the BuildingReconstruction software can be listed as follows:
- +
- Large-area reconstruction of LoD1 and LoD2 building models is possible.
- +
- Building geometries are suitable for texturing with nadir/oblique aerial images.
- +
- Direct export to CityGML format with automatic and flexible attribute mapping is possible.
- +
- Fast processing of 3D Buildings with semantic information is possible.
- +
- High geometric accuracy can be obtained with a ground plan-based reconstruction.
- −
- Reconstruction is limited to existing roof library and complex roof types cannot be reconstructed.
- −
- Smaller roof parts are neglected during the reconstruction.
- −
- The manual editing interface is not user-friendly.
3.6. Automatic Building Texturing
Existing 3D city models can be textured from oriented images to increase the attractiveness of the digital city models. Building and terrain models can be textured automatically if the images of the models with accurate orientation parameters exist. Automatic-texturing of the models generated in this study has been carried out with CityGRID Texturizer software by UVM Systems GmbH [39]. Automatic texturing workflow of CityGRID Texturizer is given in Figure 16. Oriented aerial photographs can be used for the texturing of roofs and façades, as well as mobile mapping data for the high-resolution texturing of street-side façades in CityGRID Texturizer. The façade texture is assigned interactively or fully automatic from oriented images. Terrain texture is always calculated dynamically, whereas roof and façade textures need to be pre-calculated and saved for each building unit. Orthophotos of the façades can be generated by simple affine transformation in the texture tool. More details on the texturing process are elaborated in the following sub-sections.
3.6.1. Image Acquisition Requirements and the Radiometric Pre-Processing for Texturing
There are several criteria for the acquisition of airborne images for automatic texturing. The optimal resolution for automatic texturing is usually 10 cm or better and the flight altitude to obtain this resolution with large-format cameras is usually between 800 and 2500 m from terrain, but these values can range depending on different factors, such as airport restrictions in the area, building heights, terrain elevation, camera type (e.g., camera format), camera parameters (in particular focal length), image acquisition method (vertical or oblique) and the other factors of image GSD requirements. In this project, the images have been acquired from an altitude of 1500 m with 8 cm resolution with the aim of production of basemaps for Cesme City. In this type of acquisition, the vividness of the colors is not considered as an important aspect in the “Basemap” generation process, however, in order to generate a fine texture, the sharpness of images together with the vividness of colors is of a great importance. In order to obtain a more vivid and impressive texture, the images have been pre-processed for improving the realistic look of color tones and the image sharpness. Figure 17 shows an example from the original and the enhanced images.
3.6.2. Image and Model Orientation
A basic requirement of model texturing is to ensure that the model coordinates and the image EOPs are defined in the same reference coordinate system. In addition, the camera calibration data should be provided for the accurate orientation of the images. If no errors are detected in the orientation validation, the database setup and load is carried out to establish a project space, which contains the orthophotos, DTMs, building models, and aerial photographs of the project. The pre-defined project (texturing) area is enlarged with a buffer zone so that the buildings near the outer border can be included completely. After importing all data into a database, aerial photographs and adjusted exterior orientation parameters are matched with buildings, DTMs and orthophotos in the database. Consistency checks between aerial photographs, interior and exterior orientation parameters, and buildings are performed and the texturing process is started if there are no errors.
3.6.3. Texture Mapping Process
A pre-selection of the photos for the texturing area would result in faster processing. To find the most suitable photos for a building, the algorithm splits the building into sub-parts and assigns each of them to different classes. The buildings are usually split into four different objects, such as roof, façade, base, and fringe. This object structure is similar to the object structure in CityGML specification. The software can directly use CityGML object structure in the automatic-texturing process. The parts of the buildings that will be used in the texturing process can also be selected by the user. For example, only roofs can be textured in a project and other parts of the building can be left un-textured. The nadir (vertical) stereo images in this study have been taken with 80% forward and 60% lateral overlap, which is sufficient for texturing both the roofs and the façades.
The most important factor in texturing roofs is the selection of the best image for each roof, as every object appear in multiple photos due to the high overlap ratio. The central part of the photos has the best radiometric appearance for buildings as no relief displacement occurs in this part. The best texture for each roof exists basically in the photo where the building is located close to the image center. In other words, the principal axis of the image should intersect the roof top perpendicularly, if possible. For example, in the application dataset, the same roof can be found in nine or ten different photos due to high overlap. The software finds the most suitable photograph for the texturing roof by comparing the center point coordinates of the roof and the aerial photographs. After the comparison, the photo with the closest center point to the roof center is used for texturing.
Façade texturing is done with a different approach from the roof texturing. This approach is flexible and affected mainly by the camera system and city structure. Other parameters are whether the camera is large- or medium-format, how high the buildings in the city are, how the vegetation is covered, whether there is fringe in the buildings, and topographical characteristics. Image orientation angles along with center coordinates are of great importance for the façade texturing. The façades appear to be better for texturing in the regions closer to the outer border of the photograph. In terms of the viewing angle, the building has clearer outward appearance, but the camera distortions should also be taken into account in this case.
The software cuts out the chosen photos for all façades and saves them in separate image files. While cutting out the aerial photos, a predefined buffer zone is kept at the peripherals. Thus, if any editing is needed to be done in the building geometry, gaps in the building envelope can be prevented. Each texture is then used in that part of the building according to the CityGML data structure. The extracted image is not directly textured to the façade, but it is related one-to-one based on file names. In other words, the texture parts cut out from each aerial photograph is unique and can only be used for one façade belonging to one building. Every texture image is used only for one building or façade. A part of textured city model area is presented in Figure 18.
4. Conclusions
In this study, a workflow has been introduced for the production of 3D city models, which have now become a necessity for better management of cities. Large-format aerial imagery and vector maps manually produced from this data have been used for this purpose. 3D city models in LoD2 and DSMs can be produced using existing aerial photogrammetric datasets and their project outputs without additional cost and effort as shown here. With the proposed method, it is possible to produce the model of Cesme Town (260 km2) within one week by one trained person using a desktop PC. Figure 19 shows views of the resulting product of this study. The created 3D model is automatically textured from aerial images and published online on the web at www.cesme3d.com.
Some of the problems encountered during the work and suggestions for their solutions are as follows:
- Excessive amount of preprocessing for file format conversion: Most of the data used in this study was not in the formats that the software requires, and need to be pre-processed. Most of the manual interaction has been performed for this purpose.
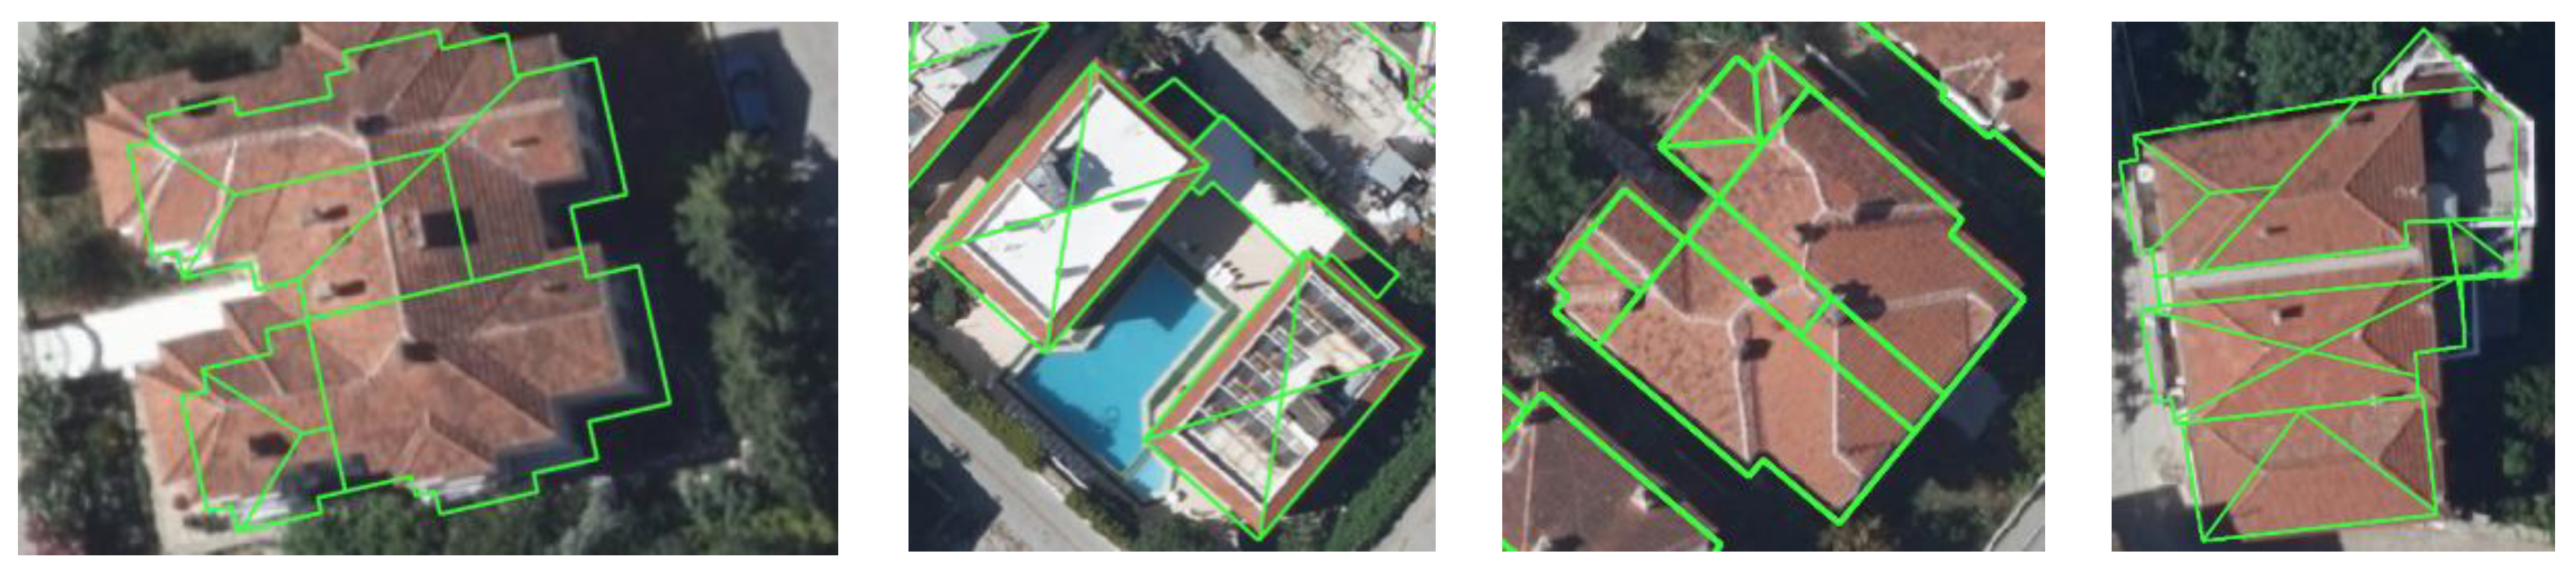
- Incorrect building roof models: The automatic reconstruction of buildings has the limitation of existing roof types in the library. In addition, occluded buildings which are partially covered by trees or other objects have been reconstructed incorrectly from DSMs. In order to fix these problems, visual checks and manual editing have been required. Examples to the false roof reconstructions are provided in Figure 20.
- Software limitations in processing the data of large regions: A significant example to this problem is the BuildingReconstruction software, which can only reconstruct buildings in areas less than 1 km2. In this study 43,158 buildings have been reconstructed automatically in an area of 270 km2. In order to be able to perform an automatic reconstruction on such a large area, the working area is divided into small parts and then divided into folders by producing DSM, DTM, and building footprint for each area. The segments were separately produced and exported as CityGML, and these separate files have been later converted into a single CityGML file to cover the entire city.
As a final recommendation, an automatic quality control and quality assessment (QC and QA) should be implemented for the 3D city models. Such methods are especially crucial for the QC and QA of large datasets. More research on the production of 3D city models should be conducted and their results should be discussed in the literature, since more results would help to open new horizons for higher-quality city models.
Author Contributions
This article is produced from the Master of Science (M.Sc.) thesis of Mehmet Buyukdemircioglu under the supervision of Sultan Kocaman (principle supervisor) and Umit Isikdag (co-supervisor).
Funding
This research received no external funding.
Acknowledgments
The authors gratefully acknowledge the support of Alpaslan Tutuneken for provision and training of CityGRID Texturizer software.
Conflicts of Interest
The authors declare no conflicts of interest.
References
- United Nations. World Urbanization Prospects Highlights; United Nations: New York, NY, USA, 2014. [Google Scholar]
- Stadler, A.; Kolbe, T.H. Spatio-semantic coherence in the integration of 3D city models. In Proceedings of the 5th International Symposium on Spatial Data Quality, Enschede, The Netherlands, 13–15 June 2007. [Google Scholar]
- Döllner, J.; Kolbe, T.H.; Liecke, F.; Sgouros, T.; Teichmann, K. The virtual 3D city model of Berlin-managing, integrating, and communicating complex urban information. In Proceedings of the 25th Urban Data Management Symposium Udms, Aalborg, Denmark, 15–17 May 2006. [Google Scholar]
- Kolbe, T.; Gröger, G.; Plümer, L. CityGML: Interoperable access to 3D city models. In Geo-İnformation for Disaster Management; Springer: Berlin, Germany, 2005; pp. 883–899. [Google Scholar]
- Kada, M. The 3D berlin project. In Photogrammetric Week’09; Wichmann Verlag: Heidelberg, Germany, 2009. [Google Scholar]
- Agugiaro, G. First steps towards an integrated CityGML-based 3d model of Vienna. ISPRS Ann. Photogramm. Remote Sens. Spat. Inf. Sci. 2016, III-4, 139–146. [Google Scholar] [CrossRef]
- Ozerbil, T.; Gokten, E.; Onder, M.; Selcuk, O.; Sarilar, N.C.; Tekgul, A.; Yilmaz, E.; Tutuneken, A. Konya buyuksehir belediyesi egik (oblique) goruntu alimi, 3 boyutlu kent modeli ve 3 boyutlu kent rehberi projesi. In Proceedings of the V. Uzaktan Algılama ve Cografi Bilgi Sistemleri Sempozyumu (UZAL-CBS 2014), Istanbul, Turkey, 14–17 October 2014; Available online: http://uzalcbs.org/wp-content/uploads/2016/11/2014_013.pdf (accessed on 21 August 2018).
- Kada, M.; McKinley, L. 3D building reconstruction from lidar based on a cell decomposition approach. Int. Arch. Photogramm. Remote Sens. 2009, 38, 47–52. [Google Scholar]
- Haala, N.; Kada, M. An update on automatic 3D building reconstruction. ISPRS J. Photogramm. Remote Sens. 2010, 65, 570–580. [Google Scholar] [CrossRef]
- Haala, N.; Rothermel, M.; Cavegn, S. Extracting 3D urban models from oblique aerial images. In Proceedings of the 2015 Joint Urban Remote Sensing Event (JURSE), Lausanne, Switzerland, 30 March–1 April 2015; pp. 1–4. [Google Scholar]
- Kocaman, S.; Zhang, L.; Gruen, A.; Poli, D. 3D city modeling from high-resolution satellite images. In Proceedings of the ISPRS Workshop Topographic Mapping from Space (withSpecial Emphasis on Small Satellites), Ankara, Turkey, 14–16 February 2006. [Google Scholar]
- Kraus, T.; Lehner, M.; Reinartz, P. Modeling of urban areas form high resolution stereo satellite images. In Proceedings of the ISPRS Hannover Workshop 2007 High-Resolution Earth Imaging for Geospatial Information, Hannover, Germany, 29 May–1 June 2007. [Google Scholar]
- Flamanc, D.; Maillet, G.; Jibrini, H. 3D city models: An operational approach using aerial images and cadastral maps. In Proceedings of the Photogrammetric Image Analysis, Munich, Germany, 17–19 September 2003. [Google Scholar]
- Kabolizade, M.; Ebadi, H.; Mohammadzadeh, A. Design and implementation of an algorithm for automatic 3D reconstruction of building models using genetic algorithm. Int. J. Appl. Earth Obs. Geoinf. 2012, 19, 104–114. [Google Scholar] [CrossRef]
- El Garouani, A.; Alobeid, A.; El Garouani, S. Digital surface model based on aerial image stereo pairs for 3D building. Int. J. Sustain. Built Environ. 2014, 3, 119–126. [Google Scholar] [CrossRef]
- Haala, N.; Brenner, C. Extraction of buildings and trees in urban environments. ISPRS J. Photogramm. Remote Sens. 1999, 54, 130–137. [Google Scholar] [CrossRef] [Green Version]
- Suveg, I.; Vosselman, G. Reconstruction of 3D building models from aerial images and maps. ISPRS J. Photogramm. Remote Sens. 2004, 58, 202–224. [Google Scholar] [CrossRef] [Green Version]
- Open Geospatial Consortium. City Geography Markup Language (Citygml) Encoding Standard Version 2.0.0. Available online: http://www.opengis.net/spec/citygml/2.0 (accessed on 21 August 2018).
- Buyuksalih, I.; Isikdag, U.; Zlatanova, S. Exploring the processes of generating lod (0-2) citygml models in greater municipality of Istanbul. In Proceedings of the 8th 3DGeoInfo Conference & WG II/2 Workshop, Istanbul, Turkey, 27–29 November 2013. [Google Scholar]
- Kolbe, T.H. Representing and exchanging 3D city models with citygml. In 3D Geo-İnformation Sciences; Springer: Berlin, Germany, 2009; pp. 15–31. [Google Scholar]
- Arefi, H.; Engels, J.; Hahn, M.; Mayer, H. Level of detail in 3D building reconstruction from lidar data. Int. Arch. Photogramm. Remote Sens. Spat. Inf. Sci. 2008, 37, 485–490. [Google Scholar]
- Gröger, G.; Plümer, L. Citygml—İnteroperable semantic 3D city models. ISPRS J. Photogramm. Remote Sens. 2012, 71, 12–33. [Google Scholar] [CrossRef]
- Dorninger, P.; Pfeifer, N. A comprehensive automated 3D approach for building extraction, reconstruction, and regularization from airborne laser scanning point clouds. Sensors 2008, 8, 7323–7343. [Google Scholar] [CrossRef] [PubMed]
- Tarsha-Kurdi, F.; Landes, T.; Grussenmeyer, P.; Koehl, M. Model-driven and data-driven approaches using lidar data: Analysis and comparison. Int. Arch. Photogramm. Remote Sens. Spat. Inf. Sci. 2007, 36, 87–92. [Google Scholar]
- Huang, H.; Brenner, C.; Sester, M. A generative statistical approach to automatic 3D building roof reconstruction from laser scanning data. ISPRS J. Photogramm. Remote Sens. 2013, 79, 29–43. [Google Scholar] [CrossRef]
- Taillandier, F. Automatic building reconstruction from cadastral maps and aerial images. Int. Arch. Photogramm. Remote Sens. 2005, 36, 105–110. [Google Scholar]
- Şengül, A. Extracting semantic building models from aerial stereo images and conversion to CityGML. Int. Arch. Photogramm. Remote Sens. Spat. Inf. Sci. 2012, 41, 321–324. [Google Scholar] [CrossRef]
- Kobayashi, Y. Photogrammetry and 3D city modeling. Proc. Digit. Archit. 2006, 90, 209. [Google Scholar]
- Nex, F.; Remondino, F. Automatic roof outlines reconstruction from photogrammetric DSM. ISPRS Ann. Photogramm. Remote Sens. Spat. Inf. Sci. 2012, I-3, 257–262. [Google Scholar] [CrossRef]
- Früh, C.; Sammon, R.; Zakhor, A. Automated texture mapping of 3D city models with oblique aerial imagery. In Proceedings of the 2nd International Symposium on 3D Data Processing, Visualization and Transmission, 3DPVT 2004, Thessaloniki, Greece, 6–9 September 2004; pp. 396–403. [Google Scholar]
- Früh, C.; Zakhor, A. Constructing 3D city models by merging aerial and ground views. IEEE Comput. Soc. 2003, 23, 52–61. [Google Scholar] [CrossRef]
- Kada, M.; Klinec, D.; Haala, N. Façade texturing for rendering 3D city models. In Proceedings of the ASPRS 2005 Annual Conference, Baltimore, MD, UDA, 7–11 March 2005. [Google Scholar]
- Novel, C.; Keriven, R.; Poux, E.; Graindorge, P. Comparing aerial photogrammetry and 3D laser scanning methods for creating 3D models of complex objects. In Proceedings of the Capturing Reality Forum, Bentley Systems, Salzburg, Austria, 2015; p. 15. [Google Scholar]
- Vexcel İmaging Ultracam Falcon. Available online: http://www.vexcel-imaging.com/ultracam-falcon/ (accessed on 31 July 2018).
- Agisoft Photoscan Pro. Available online: http://www.agisoft.com/features/professional-edition/ (accessed on 31 July 2018).
- Bentley Microstation. Available online: https://www.bentley.com/en/products/product-line/modeling-and-visualization-software/microstation (accessed on 31 July 2018).
- Safe Software Fme. Available online: https://www.safe.com/ (accessed on 31 July 2018).
- Virtualcity Systems Building Reconstruction. Available online: http://www.virtualcitysystems.de/en/products/buildingreconstruction (accessed on 31 July 2018).
- Uvm Systems Gmbh. Available online: http://www.uvmsystems.com/index.php/en/software/soft-city (accessed on 31 July 2018).
- Intergraph Corporation. Available online: http://www.intergraph.com/ (accessed on 31 July 2018).
Figure 1.
A general view of the study area in Cesme, Izmir on the Google Earth image.

Figure 2.
Level of detail in one image (left) and the ground signalization of one GCP (right).

Figure 3.
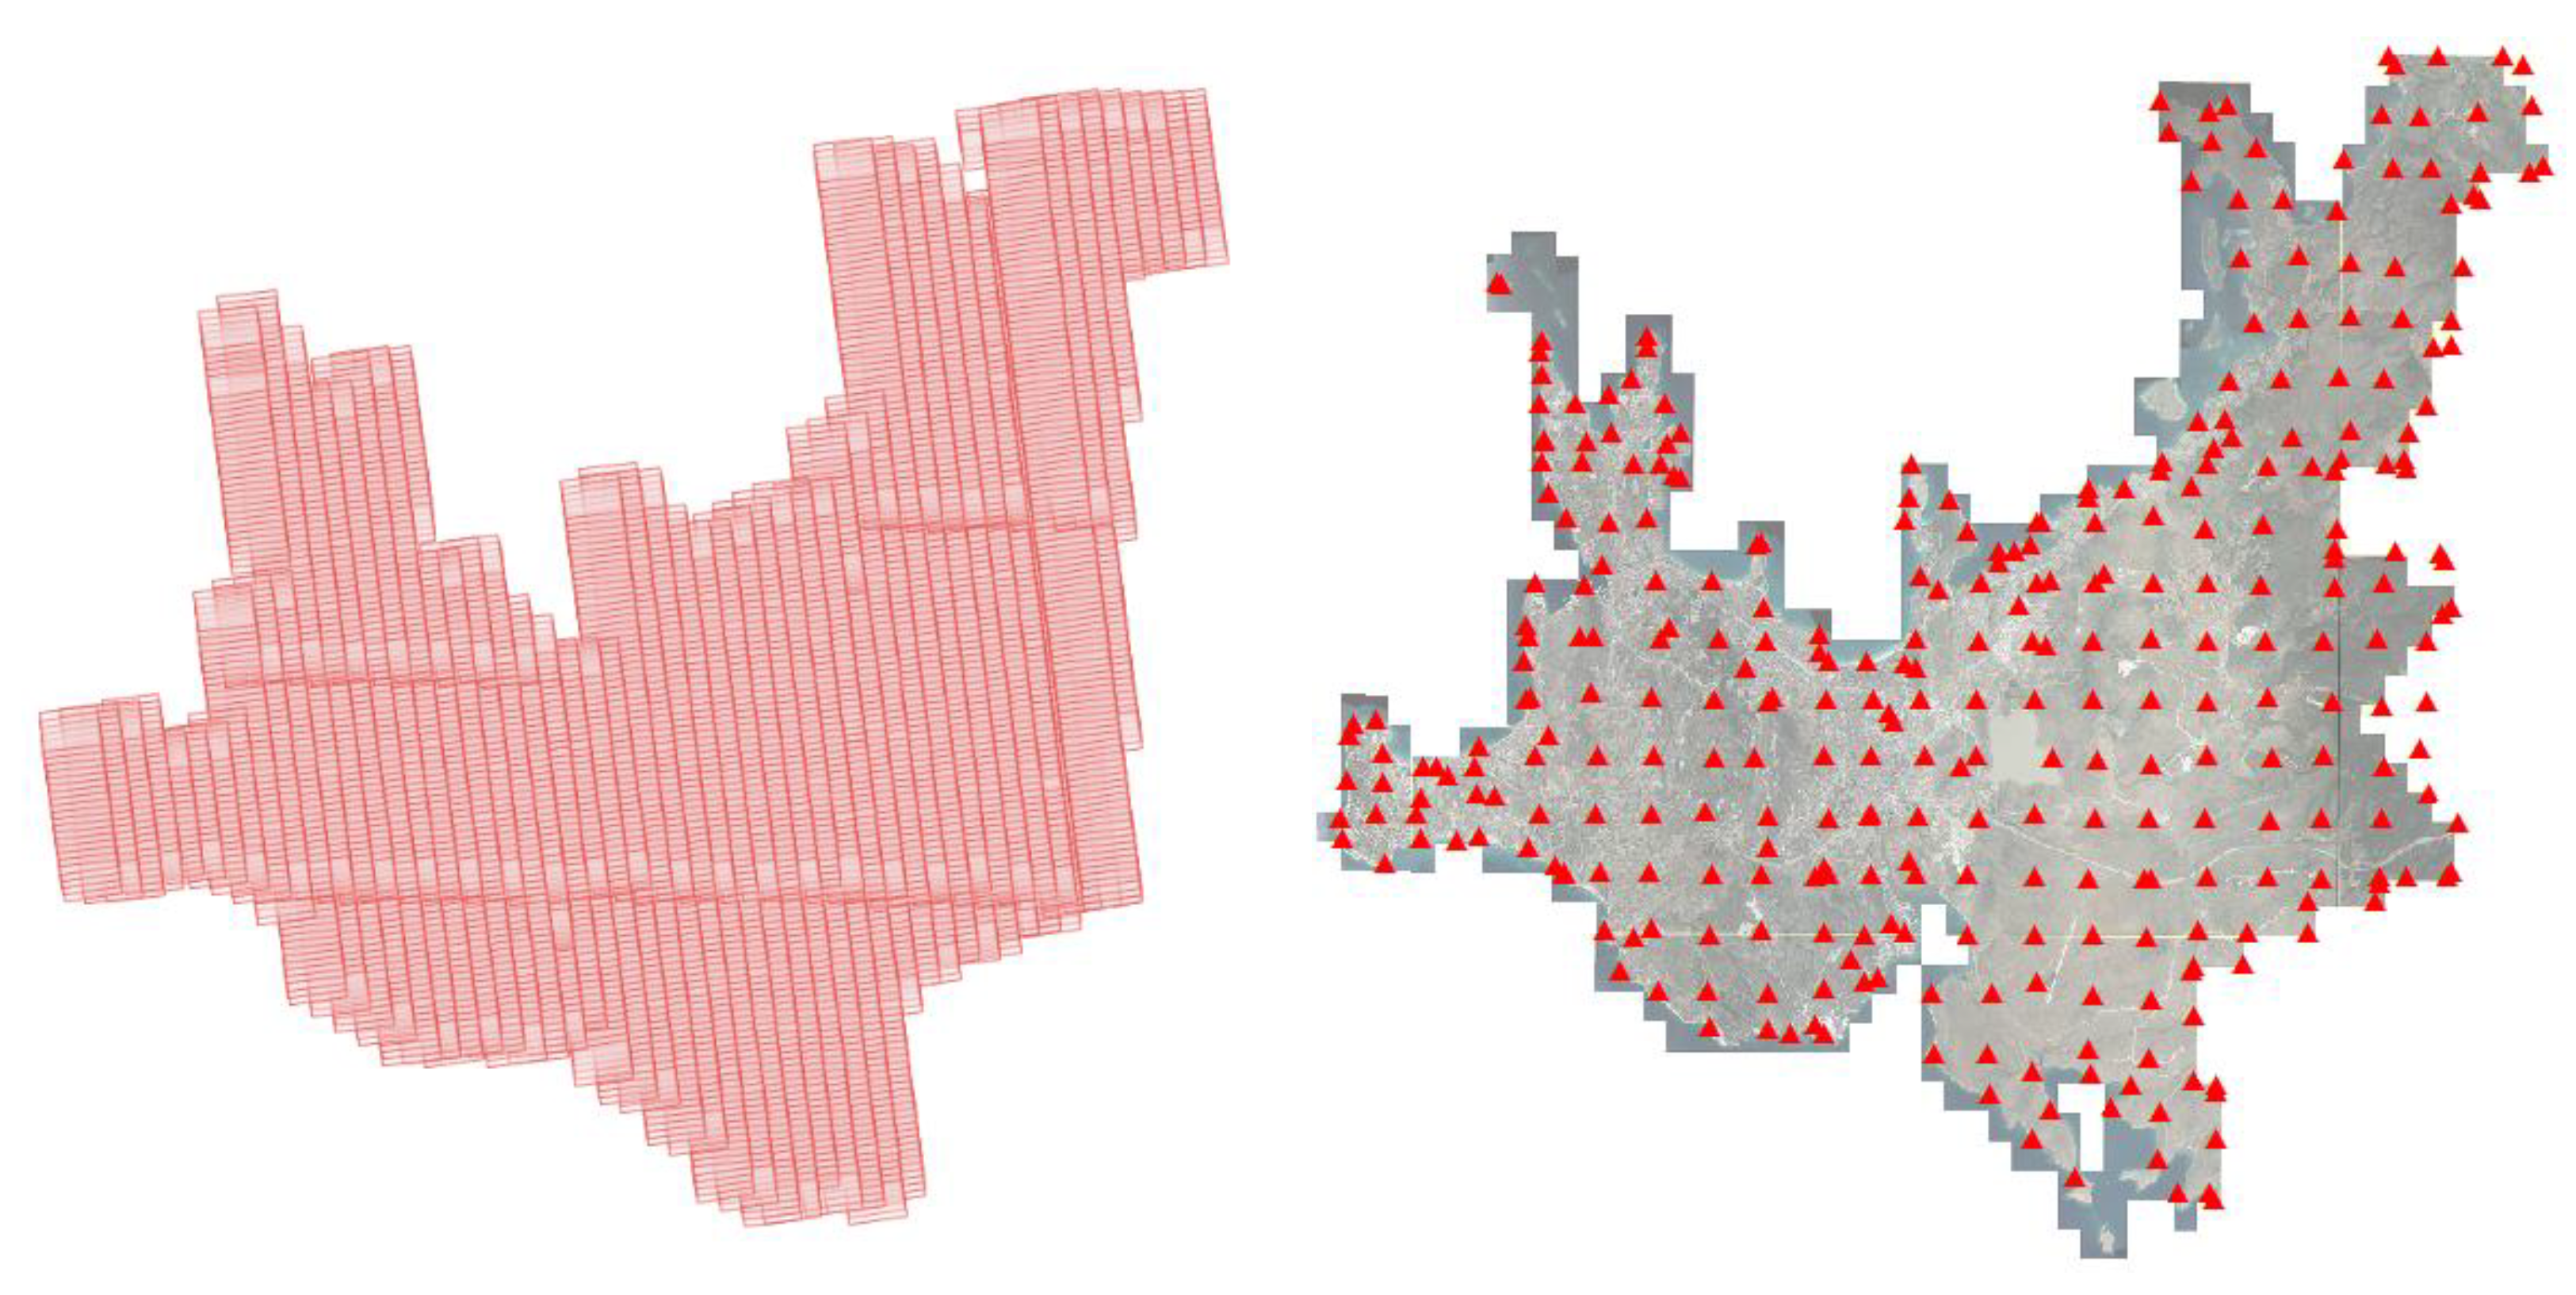
Aerial photogrammetric image block (left) and the GCP distribution (right) over the study area in Cesme, Izmir.
Figure 3.
Aerial photogrammetric image block (left) and the GCP distribution (right) over the study area in Cesme, Izmir.

Figure 4.
Overall workflow of 3D city model implementation.

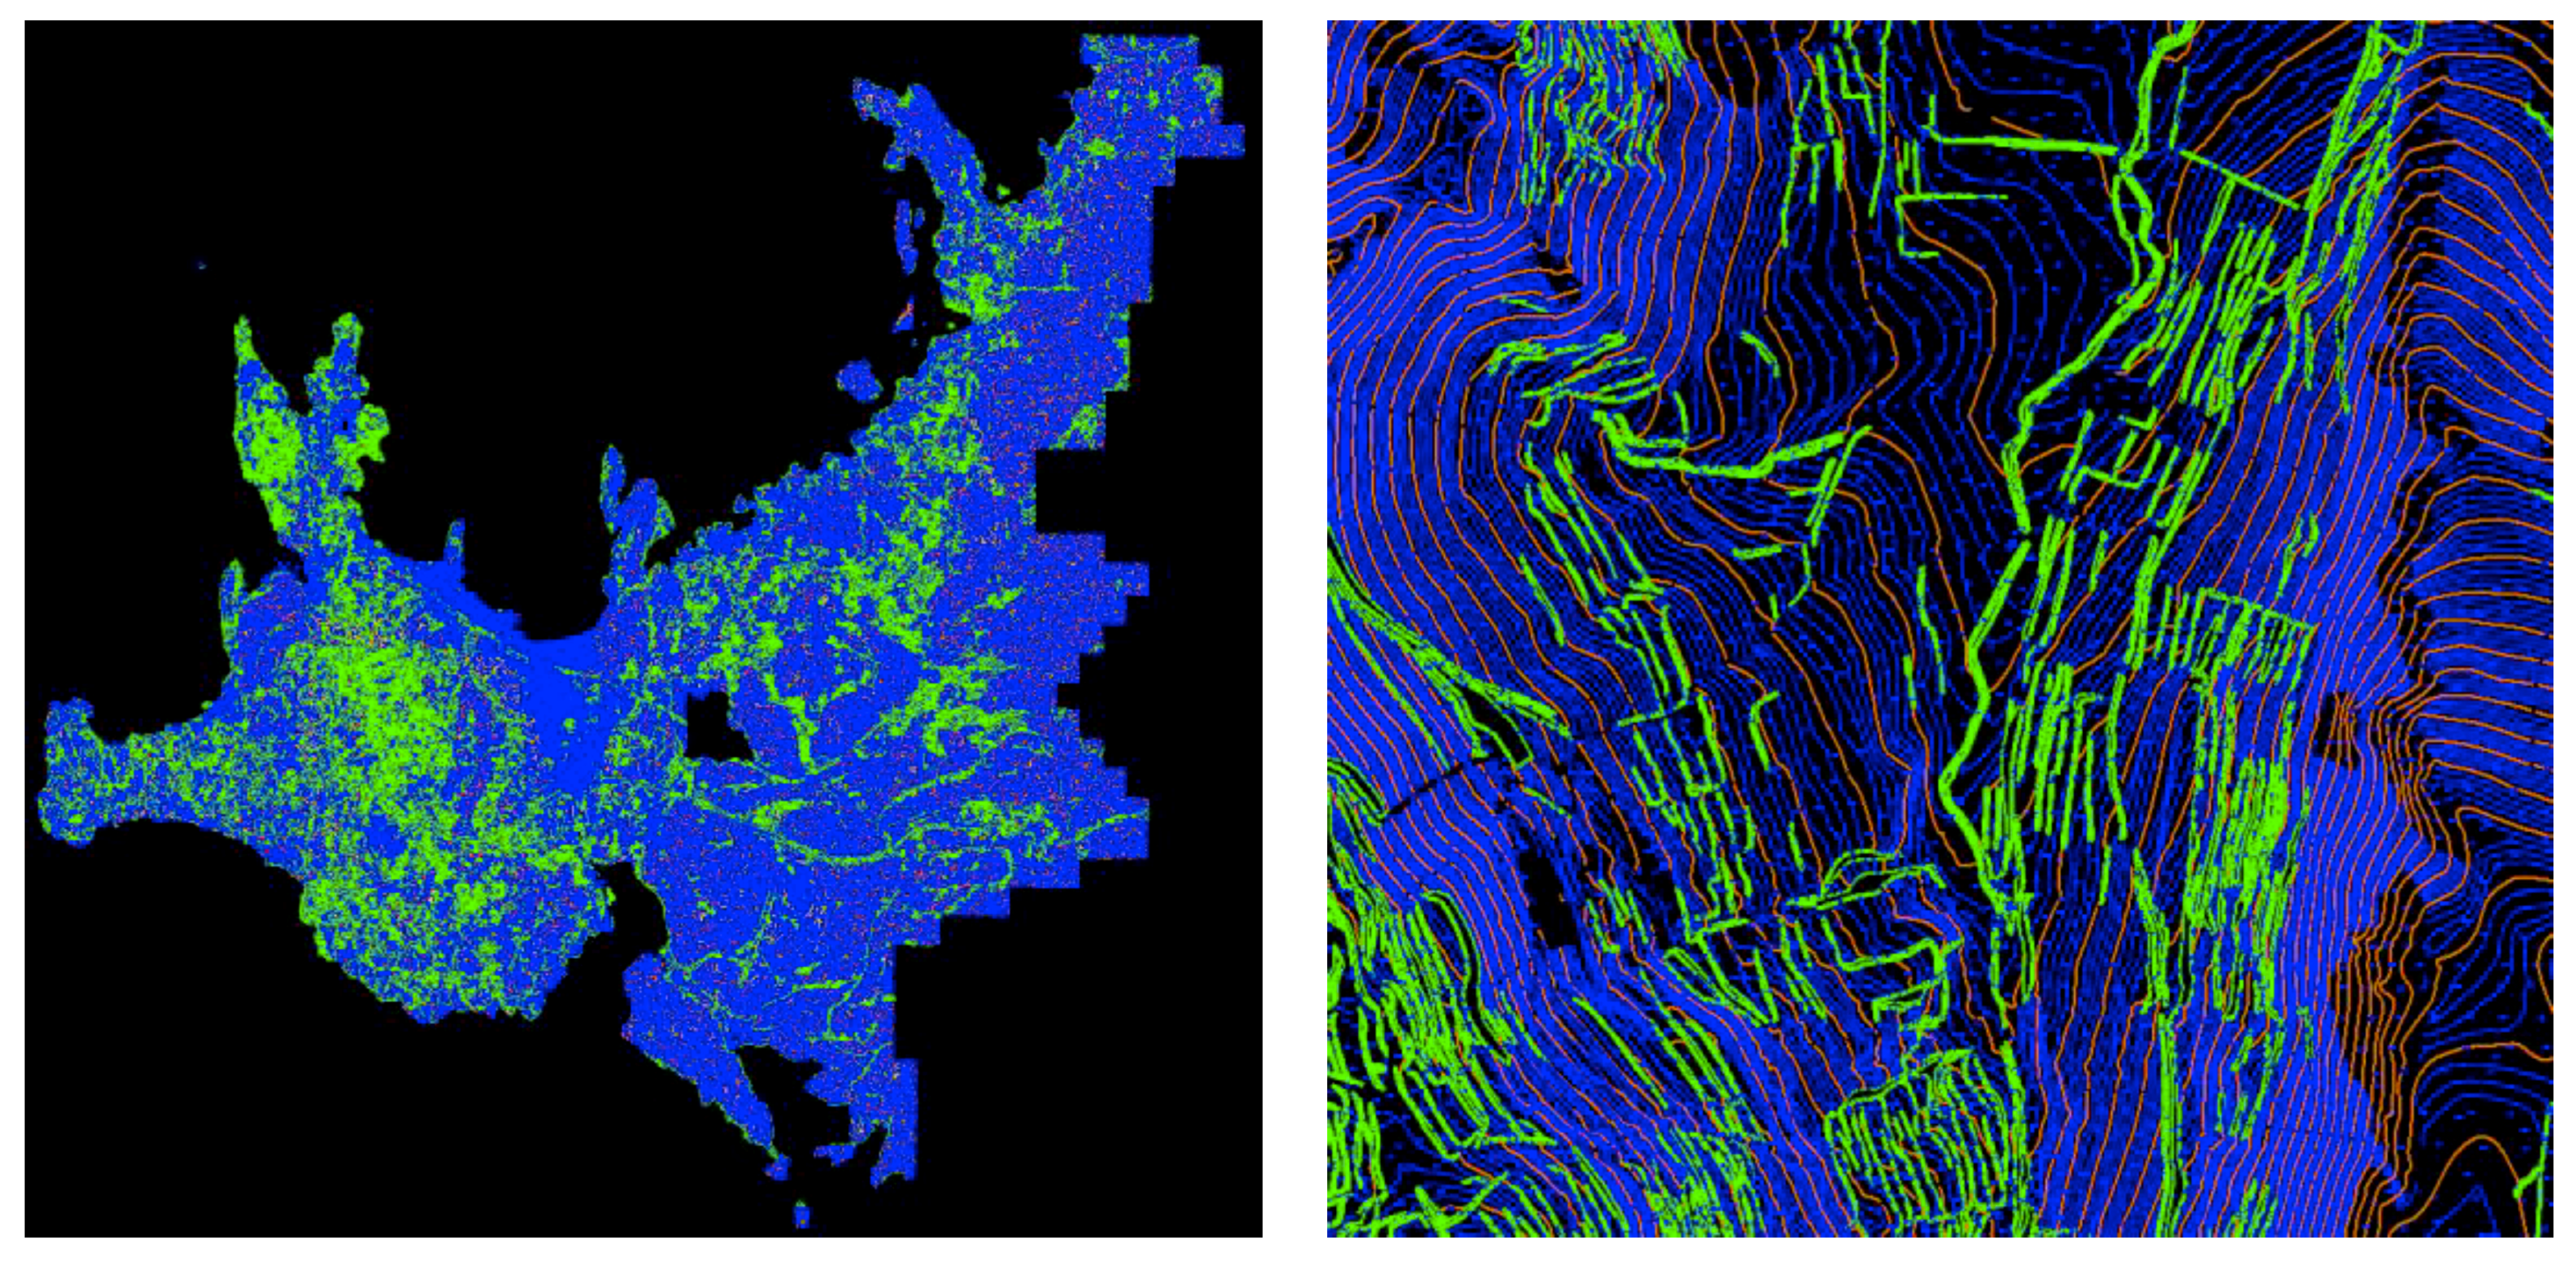
Figure 5.
Photogrammetric blocks generated for the area.

Figure 6.
Manual feature extraction from stereo aerial images.

Figure 7.
A part of the basemap with all CAD layers (left) and the building footprints extracted from a set of them (right).
Figure 7.
A part of the basemap with all CAD layers (left) and the building footprints extracted from a set of them (right).

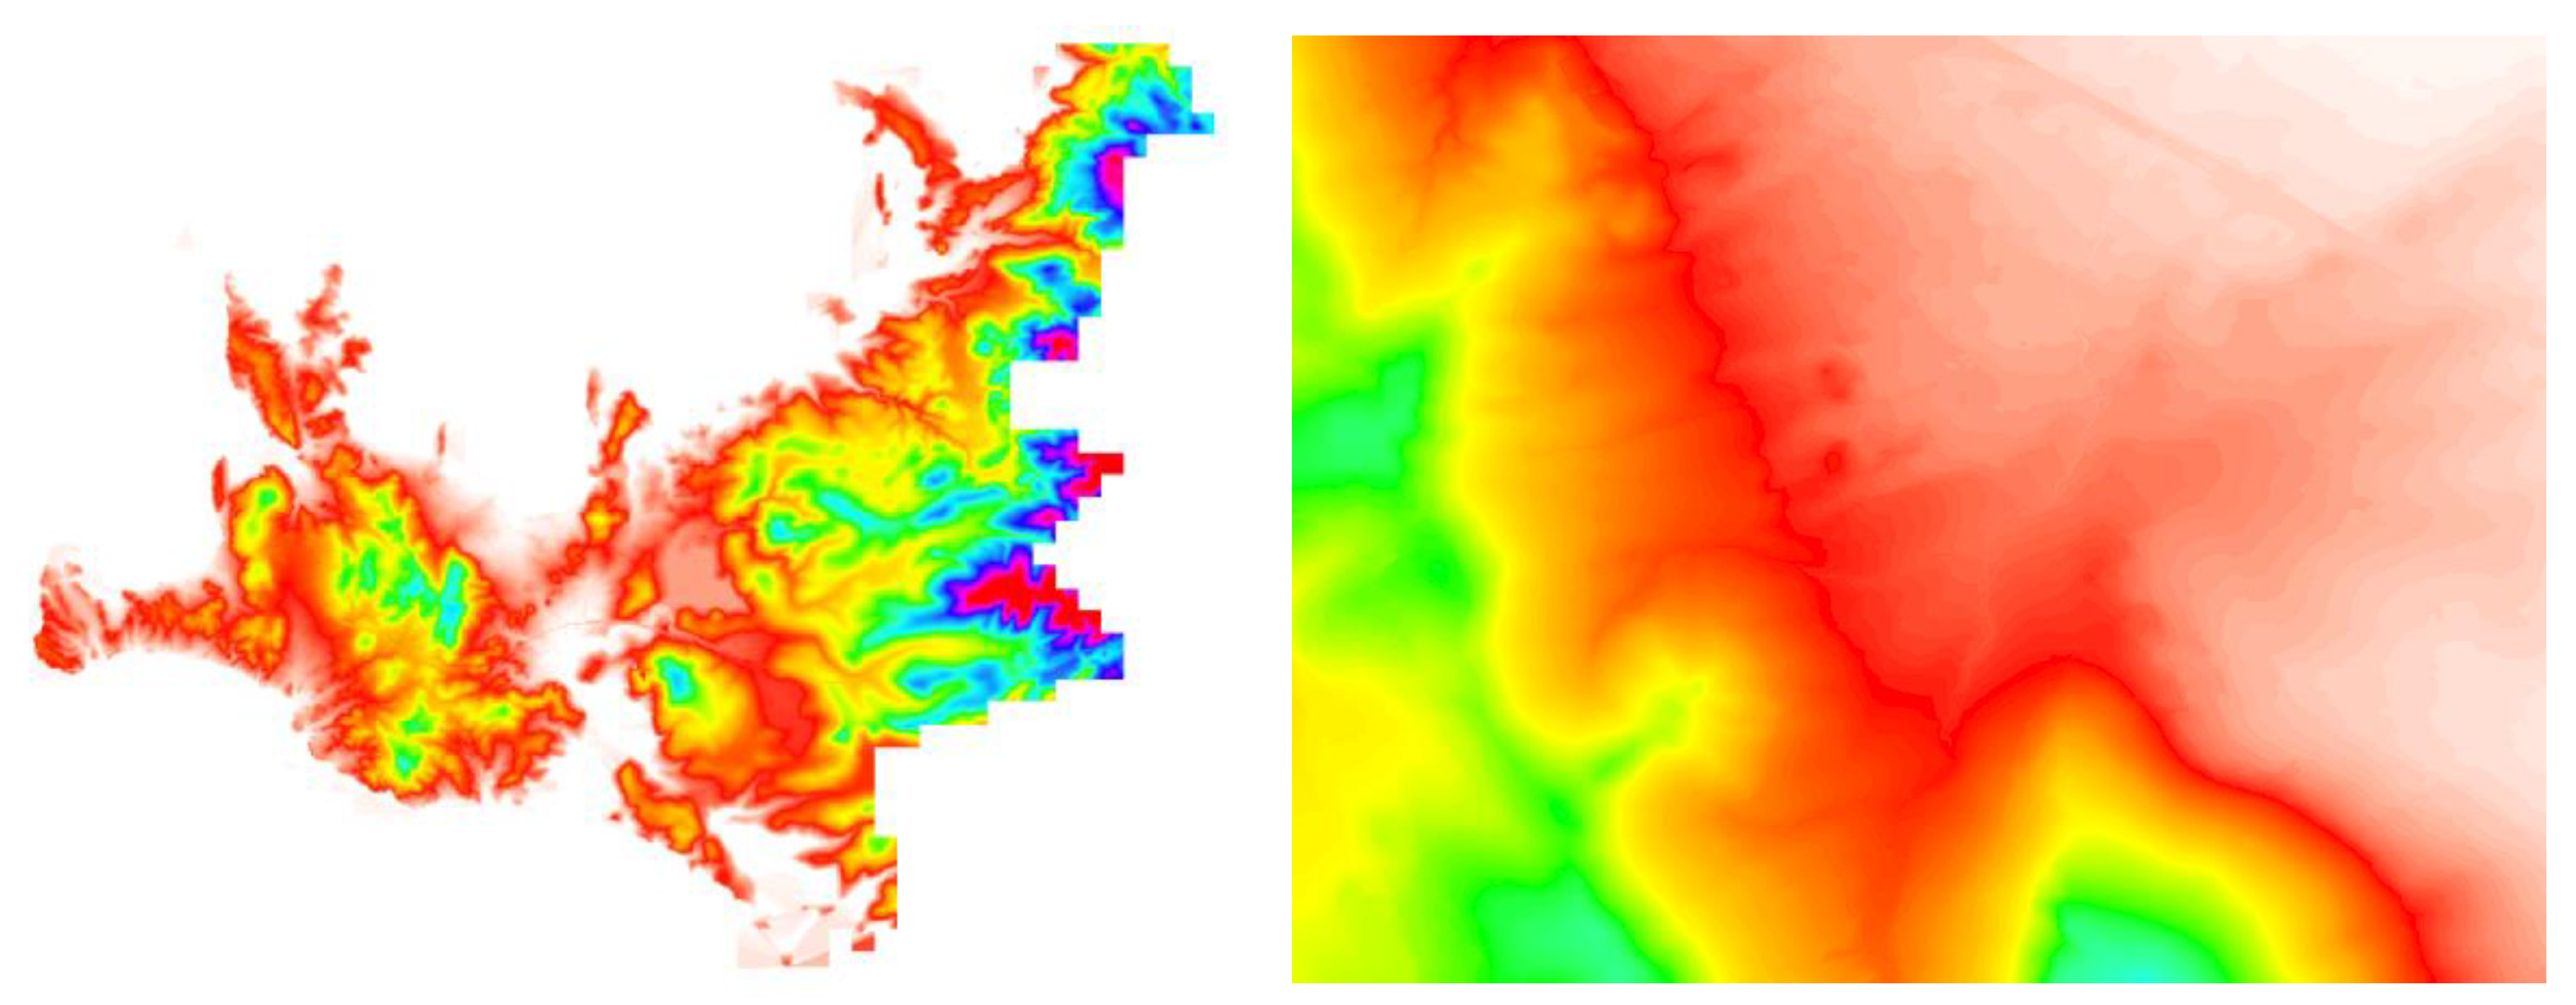
Figure 8.
General view of the manually extracted terrain features (left) and close view (right).

Figure 9.
Overview of the generated grid DTM from manually measured terrain data of the whole Cesme area (left) and a zoomed view (right).
Figure 9.
Overview of the generated grid DTM from manually measured terrain data of the whole Cesme area (left) and a zoomed view (right).

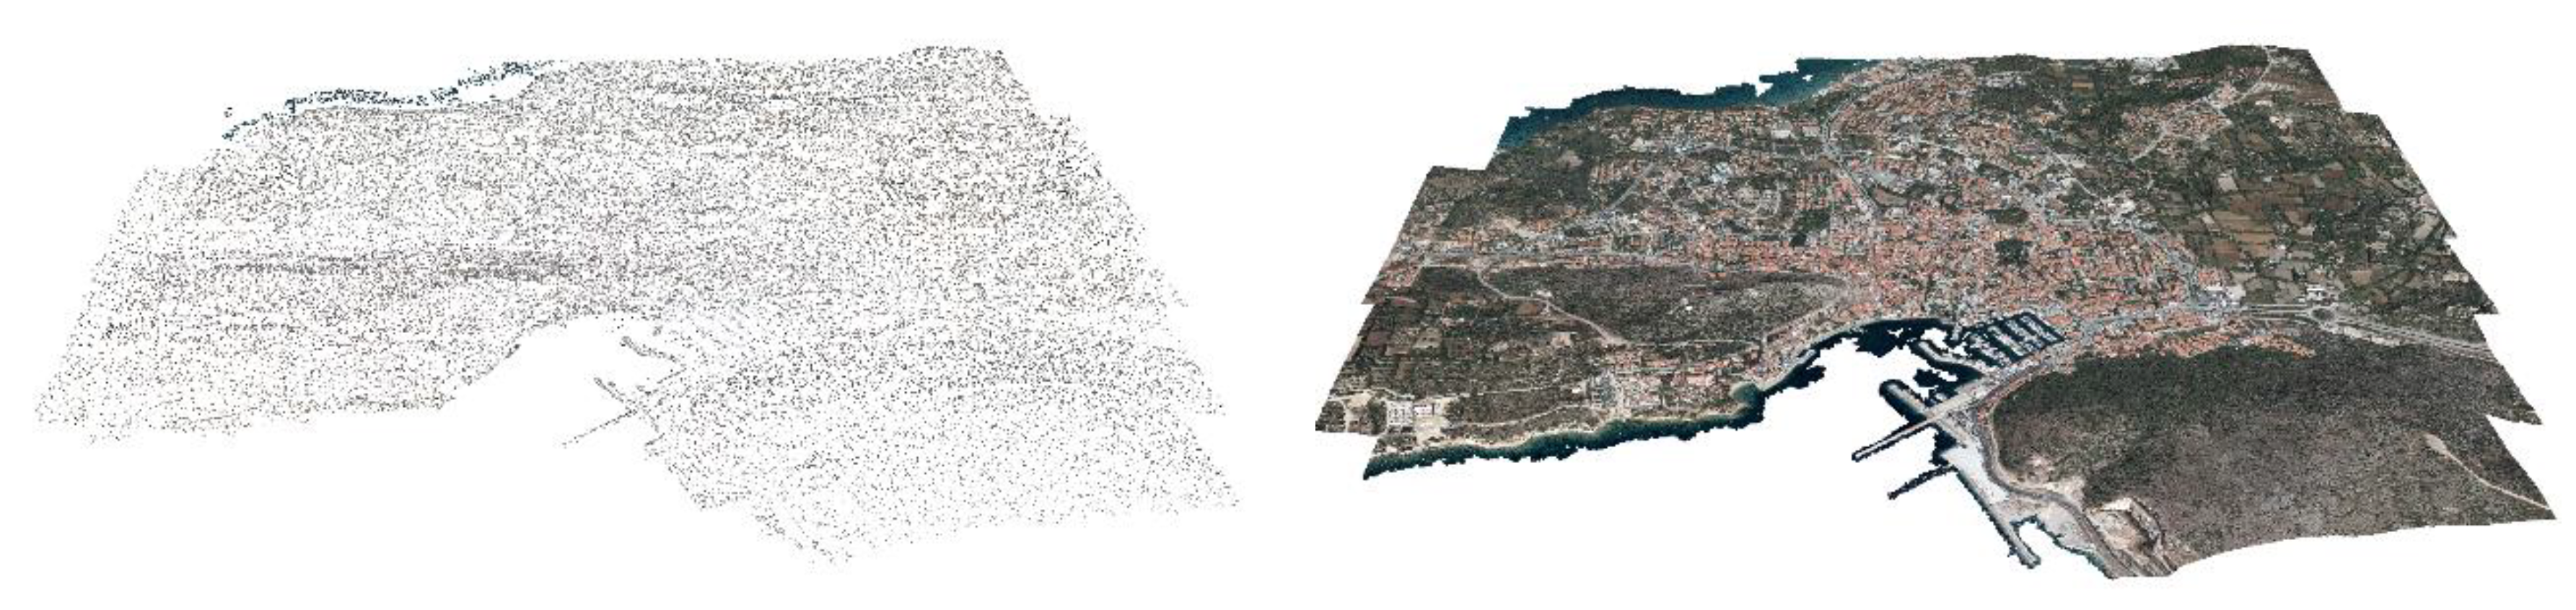
Figure 10.
Generated tie points (left) and dense point cloud (right) using Agisoft Photoscan.

Figure 11.
An overview (left) and a close view (right) of the generated DSM.

Figure 12.
BuildingReconstruction 2018 software roof library [38].
Figure 12.
BuildingReconstruction 2018 software roof library [38].

Figure 13.
25 cm resolution DSM and 1 m resolution DTM input for BuildingReconstruction software.


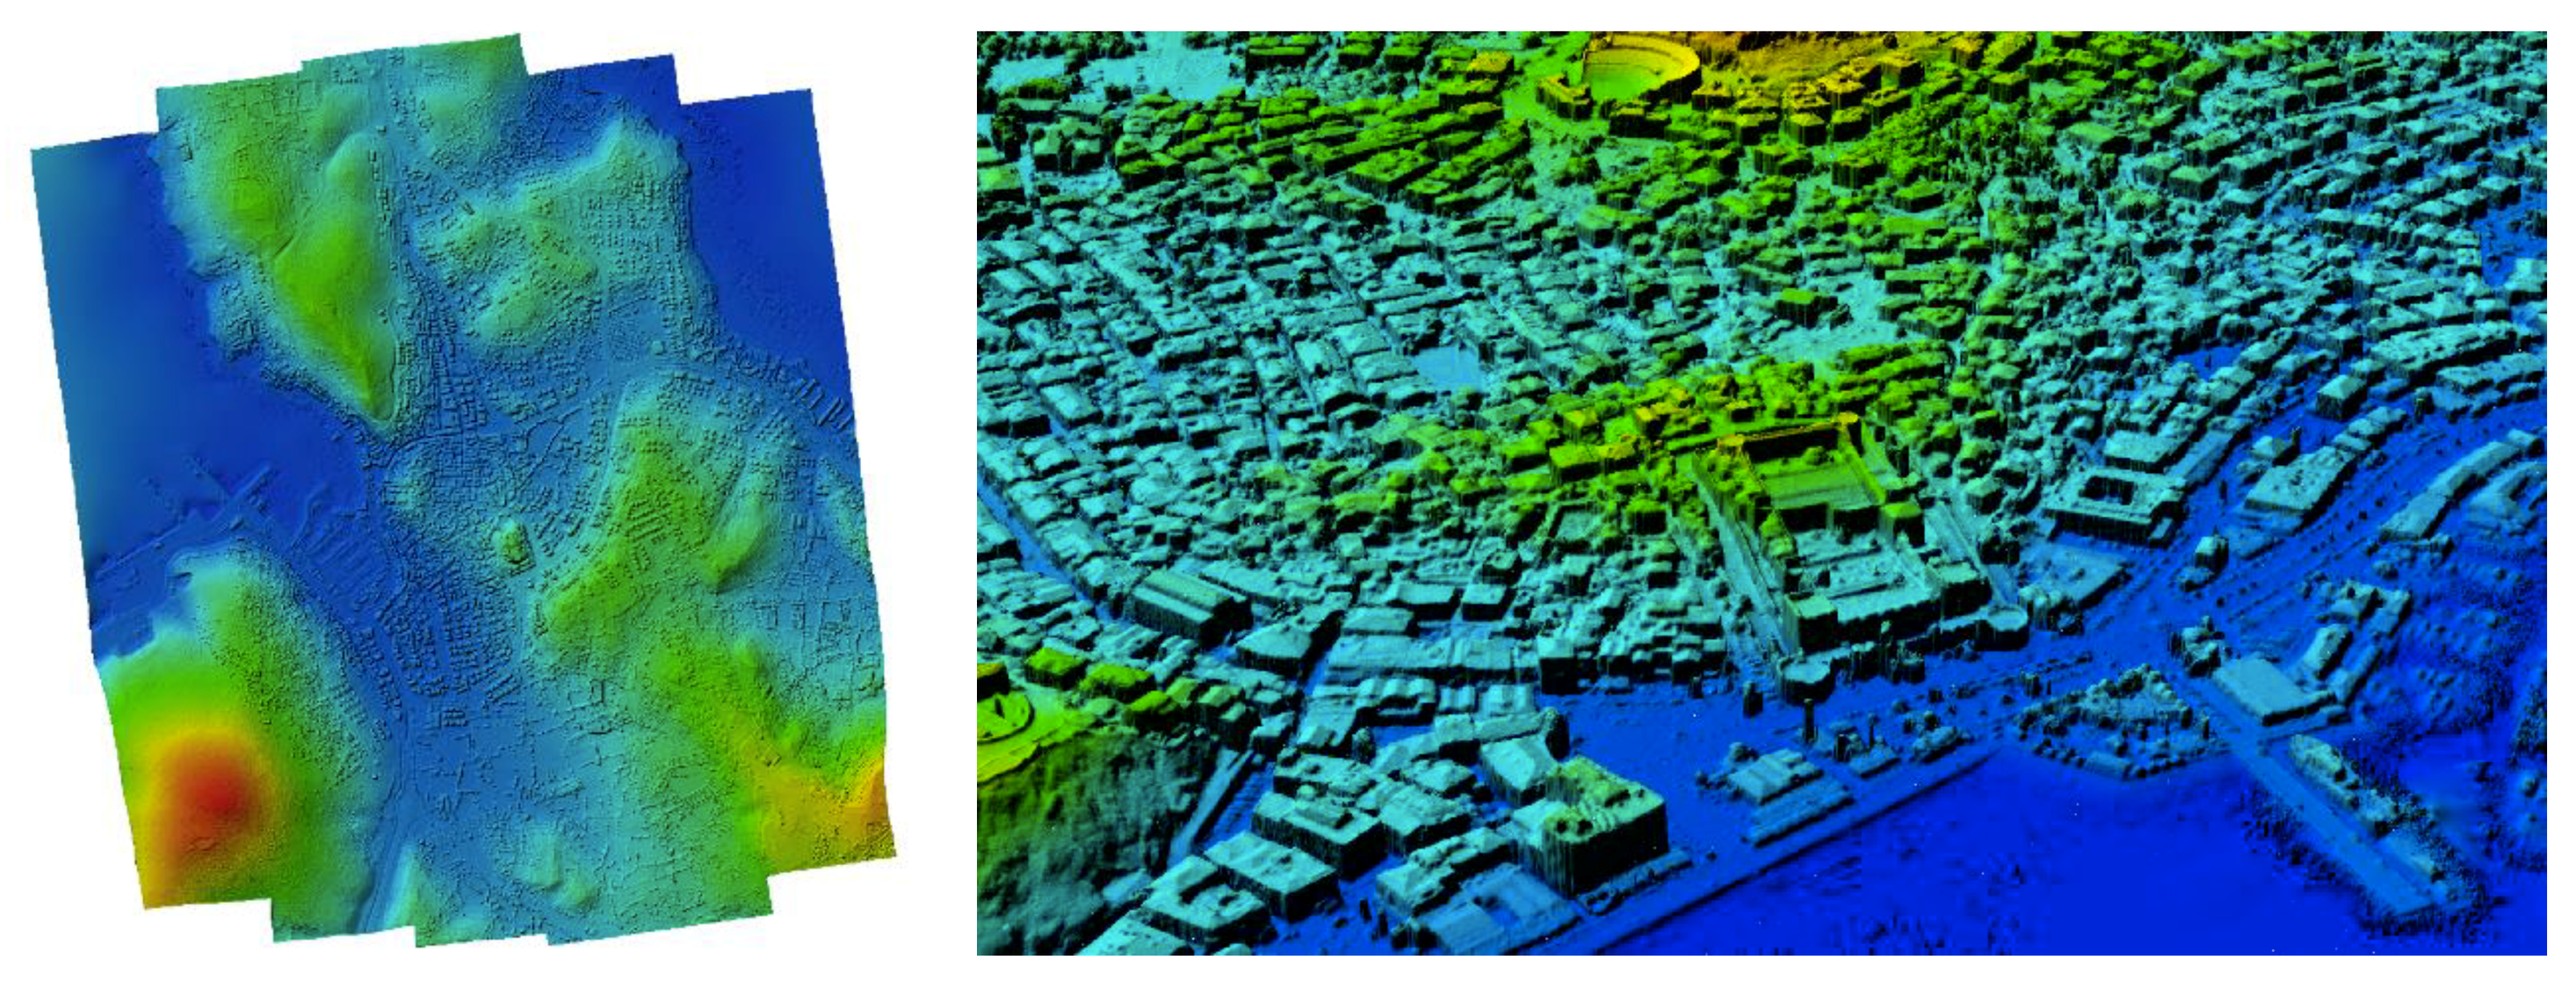
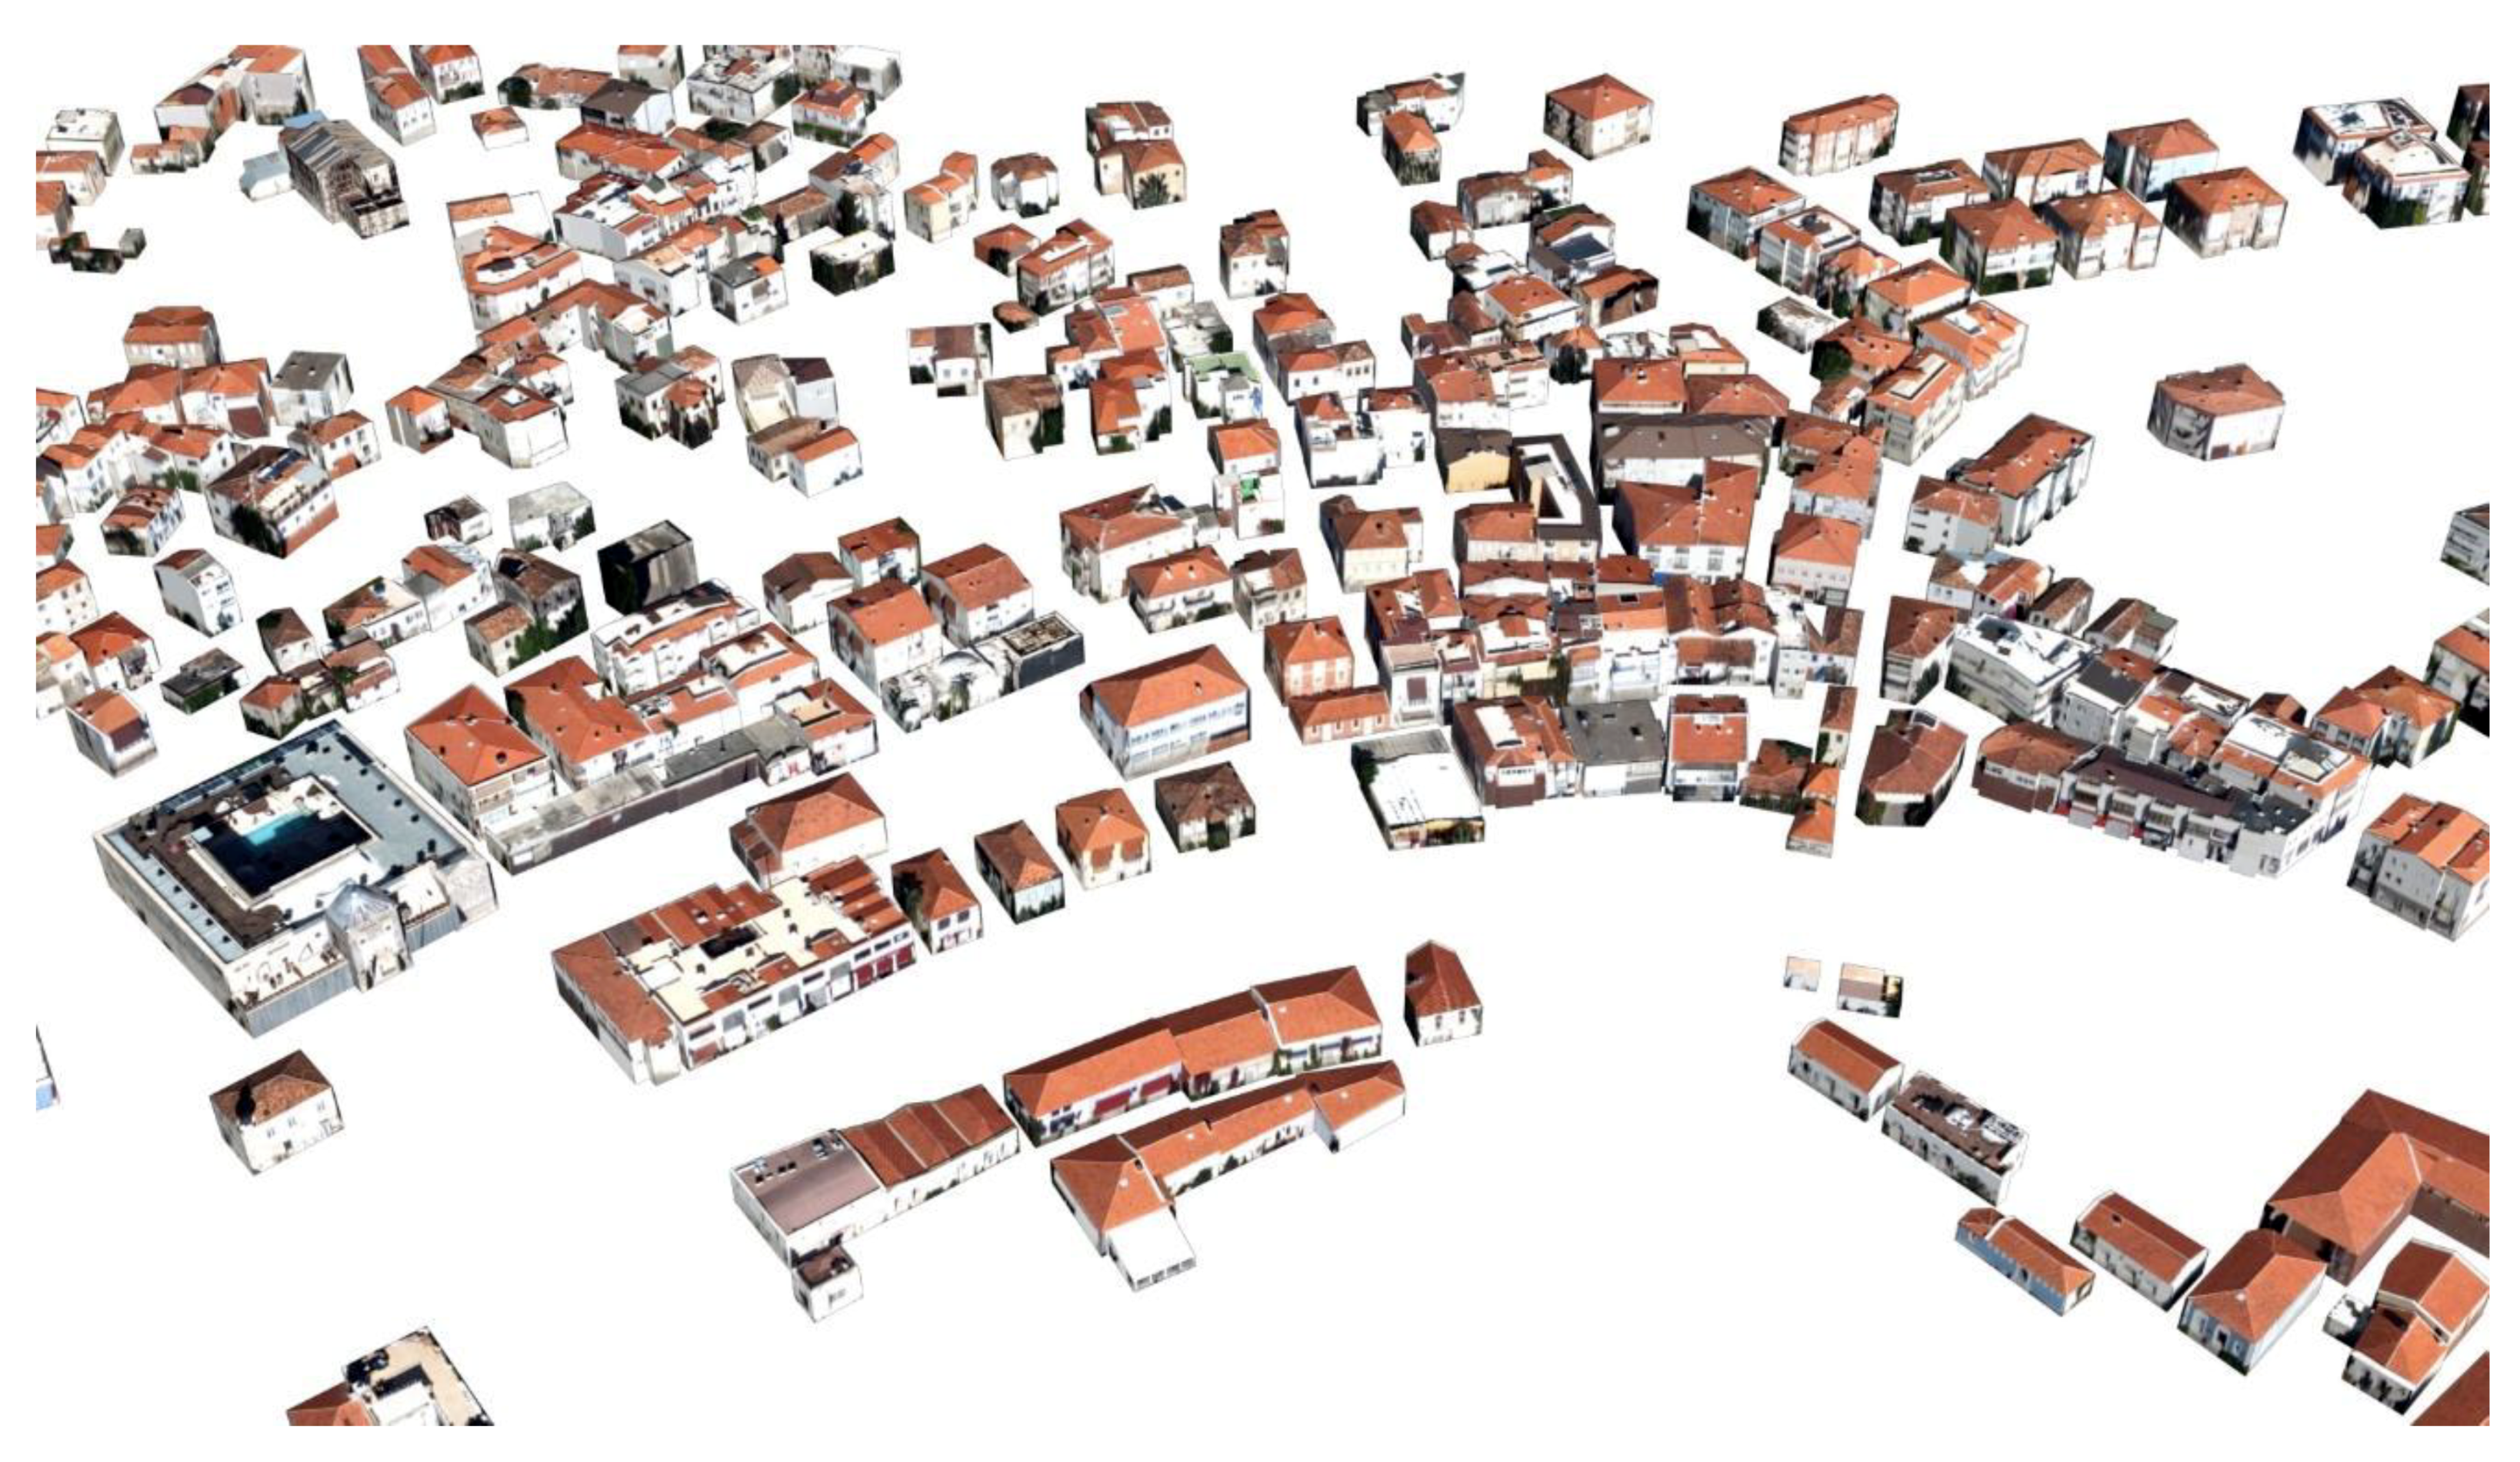
Figure 14.
Automatically generated buildings with BuildingReconstruction 2018 software in Cesme Town.
Figure 14.
Automatically generated buildings with BuildingReconstruction 2018 software in Cesme Town.

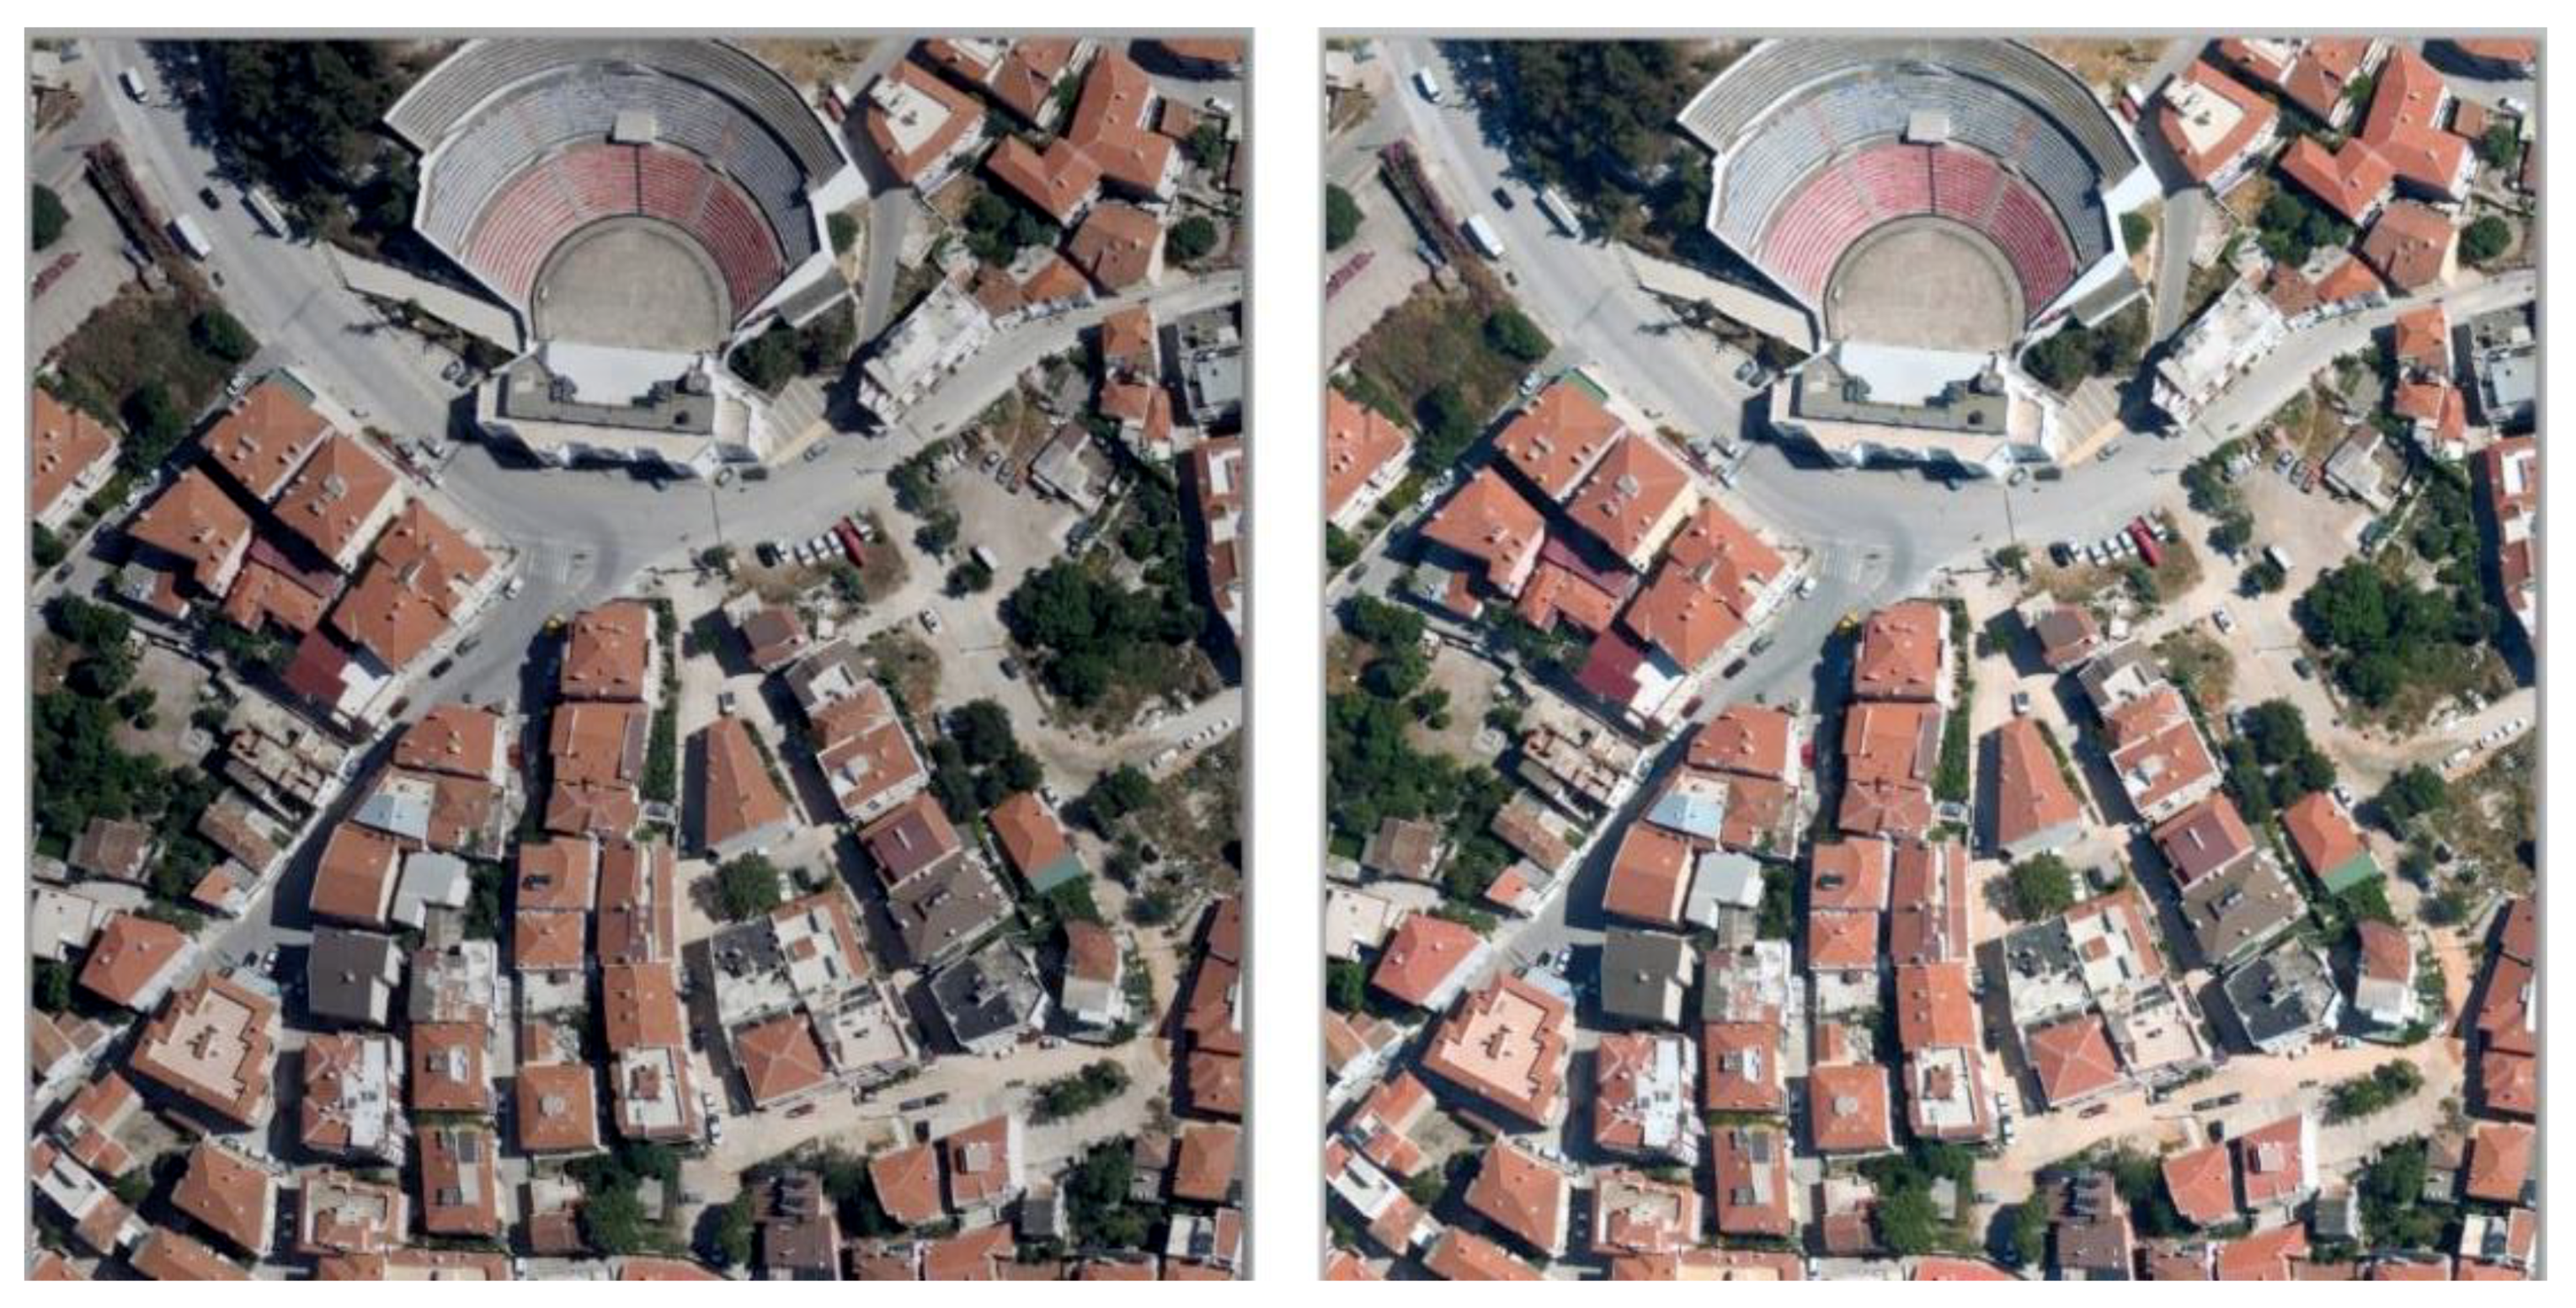
Figure 15.
Automatically generated roof geometries overlaid on the orthophoto with 10 cm resolution.
Figure 15.
Automatically generated roof geometries overlaid on the orthophoto with 10 cm resolution.

Figure 16.
CityGRID Texturizer automatic texturing workflow [39].
Figure 16.
CityGRID Texturizer automatic texturing workflow [39].

Figure 17.
Raw aerial image (left) and pre-processed (color-enhanced) image (right) of Cesme Town.

Figure 18.
Exported CityGML buildings with textures.

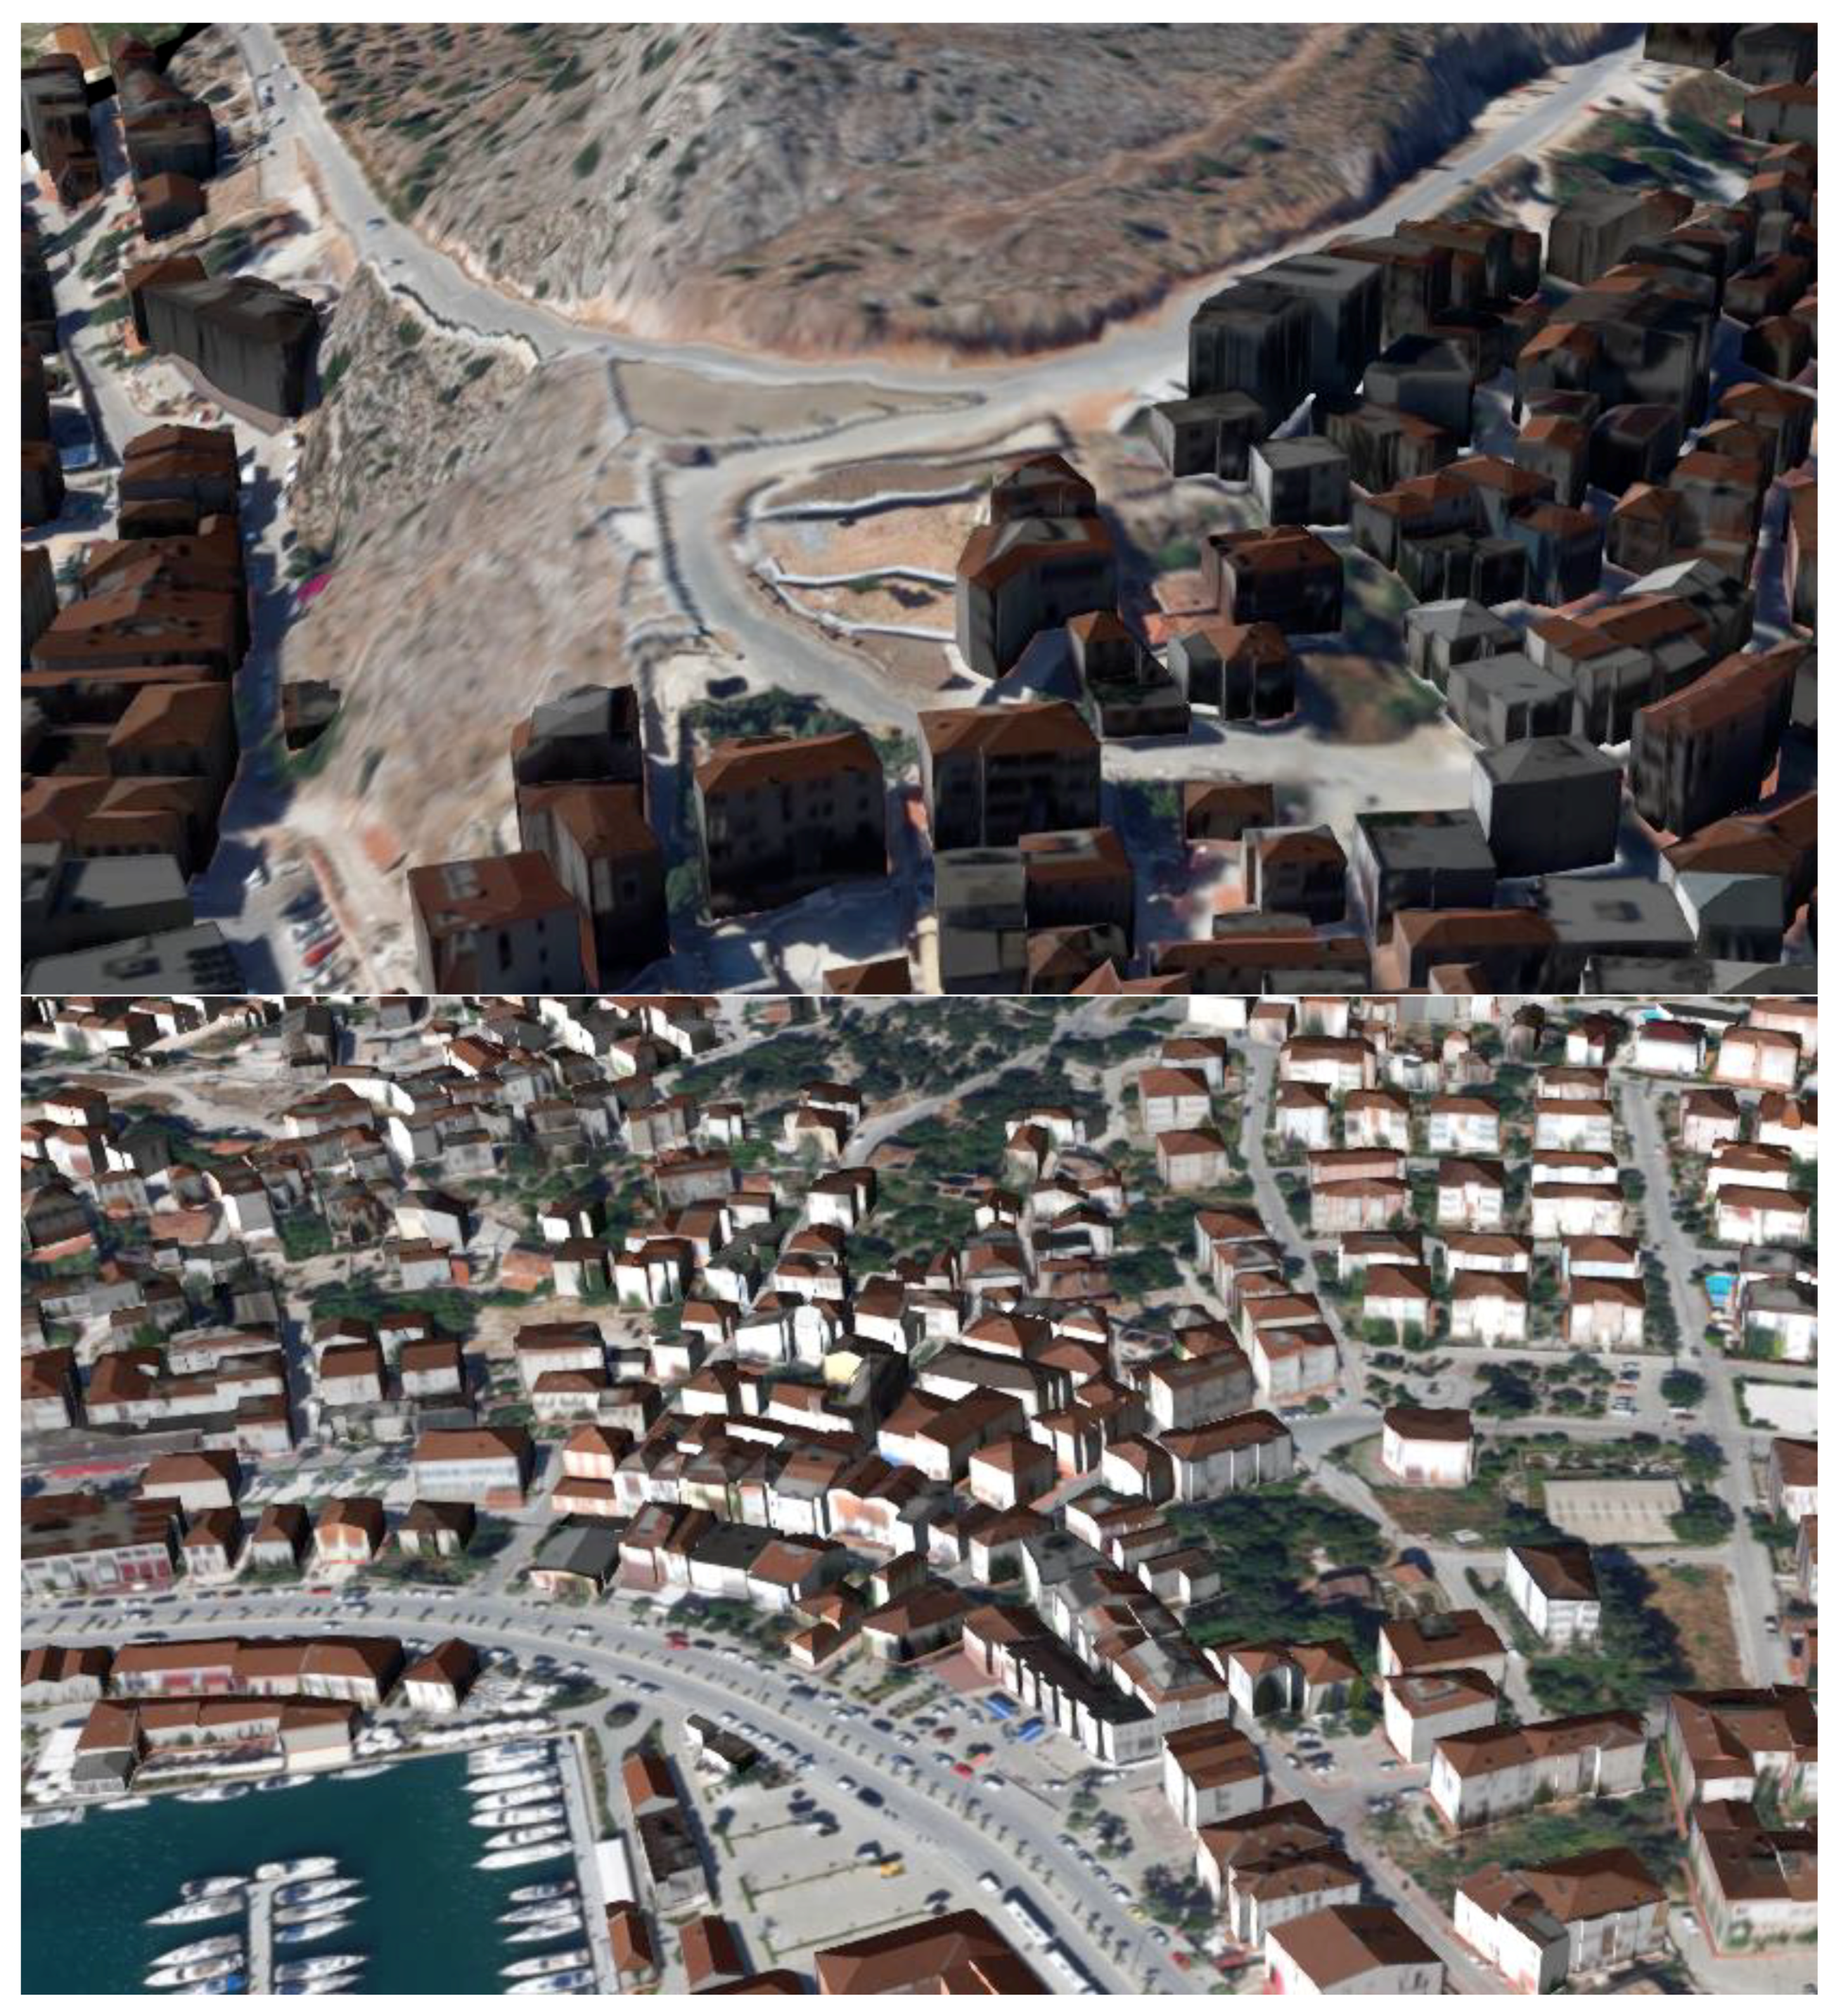
Figure 19.
Different parts of the resulting 3D city model of Cesme.

Figure 20.
Examples to the false reconstructions of the roofs.


Table 1.
Photogrammetric block properties and triangulation results.
| Sub-Block No | No. of Images | Number and Features of GCPs | Sigma Naught (microns) | GCP Image σx (microns) | GCP Image σy (microns) | ||
|---|---|---|---|---|---|---|---|
| Full (XYZ) | Planimetric (XY) | Height (Z) | |||||
| 1 | 424 | 34 | - | - | 1.9 | 1.3 | 1.0 |
| 2 | 661 | 51 | - | 1 | 1.7 | 1.1 | 0.8 |
| 3 | 287 | 22 | - | - | 1.5 | 0.9 | 0.7 |
| 4 | 745 | 55 | 3 | - | 1.6 | 1.0 | 0.8 |
| 5 | 751 | 61 | - | - | 1.8 | 1.1 | 0.9 |
| 6 | 807 | 62 | - | 1 | 1.2 | 1.0 | 0.8 |
| 7 | 793 | 61 | - | 1 | 1.4 | 0.8 | 0.7 |
Table 2.
Automatic building reconstruction accuracy based on visual analysis of 1000 buildings.
| DSM Resolution | Processing Time | LoD1 Reconstruction Success | LoD2 Reconstruction Success |
|---|---|---|---|
| 10 cm | 6 min 50 s | 100% | 73.8% |
| 25 cm | 1 min 54 s | 100% | 72.7% |
| 50 cm | 1 min 2 s | 100% | 65.4% |
| 100 cm | 39 s | 100% | 55.1% |
© 2018 by the authors. Licensee MDPI, Basel, Switzerland. This article is an open access article distributed under the terms and conditions of the Creative Commons Attribution (CC BY) license (http://creativecommons.org/licenses/by/4.0/).
Share and Cite
MDPI and ACS Style
Buyukdemircioglu, M.; Kocaman, S.; Isikdag, U. Semi-Automatic 3D City Model Generation from Large-Format Aerial Images. ISPRS Int. J. Geo-Inf. 2018, 7, 339. https://0-doi-org.brum.beds.ac.uk/10.3390/ijgi7090339
AMA Style
Buyukdemircioglu M, Kocaman S, Isikdag U. Semi-Automatic 3D City Model Generation from Large-Format Aerial Images. ISPRS International Journal of Geo-Information. 2018; 7(9):339. https://0-doi-org.brum.beds.ac.uk/10.3390/ijgi7090339
Chicago/Turabian StyleBuyukdemircioglu, Mehmet, Sultan Kocaman, and Umit Isikdag. 2018. "Semi-Automatic 3D City Model Generation from Large-Format Aerial Images" ISPRS International Journal of Geo-Information 7, no. 9: 339. https://0-doi-org.brum.beds.ac.uk/10.3390/ijgi7090339
Note that from the first issue of 2016, this journal uses article numbers instead of page numbers. See further details here.