A Twitter Data Credibility Framework—Hurricane Harvey as a Use Case


1
NSF Spatiotemporal Innovation Center and Department of Geography and GeoInformation Science, George Mason University, 4400 University Drive, Fairfax, VA 22030, USA
2
Ankura Consulting Group, LLC, 1220 19th St NW #700, Washington, DC 20036, USA
3
Nanjing University of Information Engineering, Pukou, Nanjing 210044, China
*
Author to whom correspondence should be addressed.
ISPRS Int. J. Geo-Inf. 2019, 8(3), 111; https://0-doi-org.brum.beds.ac.uk/10.3390/ijgi8030111
Submission received: 10 January 2019
/
Revised: 21 February 2019
/
Accepted: 21 February 2019
/
Published: 28 February 2019
(This article belongs to the Special Issue Convergence of GIS and Social Media)
Abstract
:Social media data have been used to improve geographic situation awareness in the past decade. Although they have free and openly availability advantages, only a small proportion is related to situation awareness, and reliability or trustworthiness is a challenge. A credibility framework is proposed for Twitter data in the context of disaster situation awareness. The framework is derived from crowdsourcing, which states that errors propagated in volunteered information decrease as the number of contributors increases. In the proposed framework, credibility is hierarchically assessed on two tweet levels. The framework was tested using Hurricane Harvey Twitter data, in which situation awareness related tweets were extracted using a set of predefined keywords including power, shelter, damage, casualty, and flood. For each tweet, text messages and associated URLs were integrated to enhance the information completeness. Events were identified by aggregating tweets based on their topics and spatiotemporal characteristics. Credibility for events was calculated and analyzed against the spatial, temporal, and social impacting scales. This framework has the potential to calculate the evolving credibility in real time, providing users insight on the most important and trustworthy events.
1. Introduction
During the 2017–2018 catastrophic Atlantic hurricane seasons, a series of hurricanes (e.g., Harvey, Irma, Florence) caused hundreds of billions of asset loss and tens to thousands of lives [1]. When a natural disaster occurs, emergency management and civil defense agencies need to determine the impact and circumstance of the events. The determination process is called “situational awareness”. Among the massive amount of information from multiple sources, only a small proportion is directly related to situation awareness. Therefore, decision-makers need to determine the essential data (i.e., more relevant than others) and ensure the collection of timely and reliable information.
Social media have contributed significantly to situation awareness during the past decade [2,3,4] with their publicly available, real-time streaming, timely reporting, and local-specific information. With the development of information technology, an increasing trend of social media platforms is that users attach more multimedia information rather than using text exclusively. Users link external URLs, upload images and videos, and contribute to multiple social media platforms through a third-party platform. This trend leads to more incomplete sentences but more data conveying the same message.
Along with the benefits, however, twitter data contain a significant amount of noise. For example, most tweets are not relevant to disaster management, generated by a robot or advertisement account, or posted with questionable provenance (i.e., fake news). For making good use of Twitter data, a primary procedure is to preprocess the data and extract actionable information (e.g., resource, casualty, damage, aid) [5]. Since geo-tagged tweets compose only a small proportion of the massive streaming data, extracting place names from the Twitter text and the related external URLs, images, and videos is essential to capture a better understanding of the disaster situation with geographic information. Based on the geographic information obtained, crisis maps can be produced for better situation awareness [6,7].
Additionally, the quality of publicly contributed data needs to be assessed and verified [8], and the demand for identifying relevant, accurate, and credible data is high [9]. Quality assessment of volunteered geographic information generated from social media [10] was proposed by Goodchild and Li [11], with three categories of approach: Crowdsourcing, social, and geographic. The crowdsourcing approach increases the number of contributors to improve validation and averaging the errors contributed by any one individual. The social approach identifies trusted individuals with a positive history of contribution. The geographical approach uses geographical knowledge to assess quality.
This paper tried to answer three subsequent questions: (1) How to integrate the quality assessment of Twitter data under disaster situation awareness with geographic information extracted from both Twitter text and external URLs to assess the trustworthiness of the associated spatial information, (2) in addition to the individual tweets, how can we use multiple tweets to identify a social event, and (3) how to build in both spatial and temporal characteristics into the assessment process for events happening in a spatiotemporal range?
The objectives of this research include: (1) Develop a 3-factor (Twitter text, URL, and retweet) hierarchical credibility framework with a scoring system to extract reliable situation awareness events from massive Twitter data, and (2) build an event detection mechanism from local gazetteer contraction and spacetime clustering with reference to prior studies.
The basic idea of this framework was to increase the credibility of a detected event when multiple sources (the 3-factor) refer to the same event. The credibility framework is hierarchical for several reasons. First, the credibility of an event detected from tweets increases with the tweet, the linked URL, and retweet referring to the same event. A tweet with a higher credibility score indicates that the tweet self-increases the reliability. Second, the credibility of the mentioned event increases when multiple tweets refer to the same event. An event with a higher credibility score indicates that there are more tweets, more linked URLs, and more retweets mentioning this event.
The remainder of the paper is structured as follows. Section 2 reviews the evolutionary work in social media quality assessment and information extraction in the context of disaster management and situation awareness. Section 3 describes the methodology to establish the proposed credibility framework. Section 4 introduces the Hurricane Harvey Twitter dataset, data preprocessing procedure, application of the credibility framework to the dataset, and credibility analysis results of the detected events with high credibility scores. Section 5 validates the detected events with the news reports covering Hurricane Harvey. Finally, Section 6 offers conclusions and provides limitations of the study with future research directions.
2. Literature Review
2.1. Information Extraction from Social Media in Disaster Situation
During a natural disaster, collected social media data are commonly massive, and only a small portion of the data is related and contributing to situation awareness. Therefore, extracting essential and related information from social media data is crucial for situation awareness. Previous research has applied machine learning, and more recently deep learning algorithms, to analyze texts from social media. For example, utilizing natural language processing (NLP) techniques, non-relevant information is filtered [12]. To detect events, Benson et al. [13] developed a structured graphical model to learn from a set of records and align record and message simultaneously. The model induced a canonical value for each event. The method was applied to Twitter messages related to entertainment events within New York City, and the detected events were verified with high precision using the city calendar section of NYC.com. Ritter et al. [14] ranked events based on importance and defined the importance as closely related to a unique date, rather than evenly distributed over a few days on the calendar. In comparison, Becker et al. [15] applied an incremental clustering algorithm that generates cluster events with a predefined threshold. Although these researches provided superior methods in the field of general event detection from social media, the former one has the biased definition of importance and the latter one can produce unstable results and might lead to topics that do not belong to a certain cluster. Events defined within disaster situations are always considered to be events that do not occur in daily bases and are specifically targeted and therefore should be detected within the predefined topics based on their frequencies (e.g., casualty, damage, aid, alerts). Research has discovered and examines the topics from social media data, especially in disaster management. For example, Imran et al. [16] categorized tweets during natural disasters into caution and advice, casualty and damage, donation and aid, and information sources. Huang and Xiao [5] examined the tweets from Hurricane Sandy, categorizing them into more detailed groups referring to different stages of disaster management, including preparedness, response, and recovery. These predefined categories of topics serve as a useful foundation for topic classifications, assisting rapid information extraction from massive social media data.
Without predefined topics, similar social media messages are clustered into different topics using topic modeling such as latent Dirichlet allocation [17]. The advantage of topic modeling is it allows for quickly clustering a massive number of tweets into different groups to assist the understanding of publicly contributed information. Utilizing Latent Dirichlet allocation (LDA), Chae et al. [18] detected abnormal topics and their associating time periods from Twitter during tornado and hurricane events. The detected abnormal topics assisted in understanding the spatiotemporal distribution and movement pattern of Twitter users before, during, and after a disaster. Resch et al. [19] investigated topic modeling with cascading LDA to extract subtopics under a higher-level topic. Using tweets covering the occurrence of the Napa Earthquake in 2014, Resch et al. [19] explored four subtopics, including ad-hoc reports during the event, post-event reports in the morning after the event, damage reports, and bucket challenge.
As multimedia data (e.g., images, videos) are hosted on social media platforms, research has also included these evolving data for disaster management purposes. For example, Bischke et al. [20] accessed Twitter texts and images to develop a real-time situation awareness framework to rapidly locate the most demanding area for disaster response activities. The authors applied a deep learning model, convolution neural networks, to the text and images to conduct sentiment analysis. When more negative tweets occur within a particular area, it is labeled a more demanding area. Pouyanfar and Chen [21] proposed an ensemble deep learning framework to extract information from YouTube disaster videos in the context of a flood, damage, fire, mud-rock, tornado, and lightning. Videos are initially preprocessed into shots by boundary detection and key-frame selection, and features are subsequently extracted through deep learning reference models on each key-frame. Herein, the goal of the proposed research is to include multiple data sources within tweets, including text, spatial coordinates, and text-based linked URL (e.g., news reports, personal blogs) to detect keyword-related events.
2.2. Quality and Trust for Crowdsourcing Data in Emergency Management
Reuter and Kaufhold [8] reviewed the research of social media in emergency management over the past fifteen years, focusing on issues of social media regarding trust and quality of social media data (e.g., “credibility doubts of citizen-generated content, lack of knowledge and personnel issues, absence of uniform terms of use, marginal accessibility for older generations”). For example, Gupta and Kumaraguru [22] calculated the credibility of a Twitter event via information propagation. The authors examined the percentage of credible information and spam on Twitter, concluding that only 17% of the collected tweets contained credible situation awareness information. This highlights the increasing need to identify trustworthy social media messages.
Senaratne et al. [23] reviewed the credibility study of text-based crowdsourcing data. They revisited the definition of credibility by Hovland et al. [24] as the “believability of a source or message, which comprises primarily two dimensions, the trustworthiness (as explained earlier) and expertise.” In addition, they reviewed the fundamental study by Mendoza et al. [25], which indicated that Twitter operates as a self-filtering community as users can question and identify rumors during an emergency.
Rice et al., Qin et al., and Qin [26,27,28] developed a comprehensive geospatial quality assessment method based on a crowdsourcing testbed designed to provide transient obstacle information to people with disabilities. They expanded the social quality assessment approach proposed by Goodchild and Li [11] and suggested that crowdsourcing data quality involves the following aspects: Position, time, attribute accuracy, completeness, malicious and mischievous content, logical consistency, and risk and fitness for use. However, due to the limitation of the Twitter dataset on data biases, data noise, and content length, this quality assessment method is not entirely adaptive. In addition, this quality assessment method requires the users to provide a set of predefined types of information, whereas Twitter, as an ambient crowdsourcing platform, cannot provide this information.
Castillo et al. [29] developed a supervised learning approach to automatically classify and identify credible news events from Twitter during the Chilean earthquake in 2010. First, time-critical information was automatically extracted, and the tweets manually labeled as news, chat, or unsure. Second, evaluators were asked to assign a credibility level (i.e., almost certainly true, likely to be false, almost certainly false, and cannot decide). Third, a set of 68 features were proposed to model the topics and associated information cascades, including features associated with the user, event, and propagation base. However, the high number of features made it difficult to prioritize the features and develop a unified credibility prediction model.
Sociospatial dimension analytics proposed by Shelton et al. [30] suggests that understanding the complexity of user-generated content should go beyond utilization of plotting coordinates to explicitly theorize sociospatial relations through measurements in other dimensions, e.g., territorial, palatial, or scalar. Herein and based on past research, a credibility framework is proposed that utilizes Twitter’s self-filtering mechanism to identify the most trustworthy posts and events related to disaster situation awareness [11]. This framework addresses information completeness by integrating text messages and the associating URL. In addition, this framework also allows for an exploration of two feature levels, tweet (i.e., text along with its URL, retweet number) and event (i.e., credibility scores) in order to propose a more effective credibility framework.
3. Methodology
A credibility framework was designed using a hierarchical strategy with tweet and event levels. For each tweet, credibility was calculated based on two features: The consistency of the tweet content and its URL in mentioning an event; and the retweet number. An event was defined as an incident at a specific time and location. Extracting location and time metrics from tweeted text messages and URLs is critical. Location extraction is challenging because only a small proportion of the Twitter dataset is geo-tagged; this necessitates that the information be extracted from text messages and URLs. In addition, local detailed gazetteers are generally not available, especially within the impacted area of a hurricane. Therefore, an essential part of the research was to create local gazetteers from Twitter data using text and URL content.
The structure of the credibility framework (Figure 1) starts with text information within tweets and URLs using predefined keywords as filters to reclassify tweets into different theme groups related to disaster situation awareness. Events were identified within the extracted locations and posting times, and location with different expressions was merged after coordinates (geocoding) collocation. The overall event credibility was based on the credibility calculated for each supporting tweet and its retweet. A higher overall credibility score indicates that the event is more trustworthy.
3.1. Twitter Reclassification Using Predefined Keywords
Twitter datasets generally contain a small proportion of disaster situation awareness information. To extract those related tweets, this research utilized a well-established keyword set (Huang and Xiao [5]) which focuses on classifying Twitter data into different topics under the disaster management situation using Hurricane Sandy as an example. A subset of the keyword list (Huang and Xiao [5]) was used herein because the interest is in ‘Sheltering’, ‘Casualty’, ‘Damage’, ‘Flood’, and ‘Power’ cases (Table 1). These events are the critical ones on which people need verification for trustworthiness. Based on the theme-driven keywords, tweets were reclassified into different themes, and each tweet contained one or more events related to their theme.
3.2. Event Identification
In each tweet, locations are published as geo-tags or indicated in the text message. An event is identified by extracting locations to construct a local gazetteer and merging tweets with a spatiotemporal range under the same theme.
3.2.1. Location Extraction and Local Gazetteer Construction
The location extraction focused on road and place names mentioned in the Twitter data, and the local gazetteer was constructed based on the extracted locations. This approach addresses road and place names separately as they have different characteristics. Taking road name extraction as an example (Figure 2), the overall procedure searches the tweet content for road names with a list of commonly used street suffixes (e.g., street, drive) and alternative abbreviations (e.g., st, dr.) according to the United States Postal Service (USPS). Once a suffix is located, the road name is extracted. The same principle is applied for place name extraction, except the list of place name suffixes is based on analyzing local area place naming rules (e.g., university, center).
The convention for both road and place names is that names usually consist of multiple words beginning with an uppercase letter. Road names are most commonly composed of either one or two words plus the road name suffix; less commonly, the information includes a number (e.g., Main St., 5555 Hermann Park Dr.). Less commonly, there is simply a suffix and number (e.g., Hwy 6) or road names alone (e.g., I 66, I66). All of these features are recognized in the procedure using expressions coded in the algorithms. While place names are usually absent of numbers, words are oftentimes associated with name suffix (e.g., Sam Houston State University, Toyota Center).
Location extraction was applied to tweets under different theme groups separately, and since tweet texts contain multiple themes, only those associated with the proposed themes were collected. To optimize the accuracy of the association, location extraction only applied to the paragraph where the keyword is in the keyword list of the theme. A local gazetteer is established for each theme group after location extraction.
3.2.2. Gazetteer Merging
After the local gazetteer was constructed from the Twitter data, duplicated information was removed or merged so that one address is uniquely referred to its associated place or road name. Merging extracted locations from the extracted gazetteer is crucial for providing meaningful event list without duplication of repeating the same location for different expressions and also reduces the heavy load for geocoding. There are three layers and two steps in the workflow (Figure 3) to merge extracted locations through a string and coordinate match, where the bottom layer shows locations from the constructed local gazetteer (Section 3.2.1).
Step 1: Before merging direct name/text, a standard location name format is adopted to ensure the same format for all names (loc name) from the bottom layer. For instance, “X Road”, “X road”, and “X Rd” is converted to “x rd” and considered to be the same road. The Loc names are merged with their associated tweet ID (supporting tweet or supporting ID) when they are the same location after being formatted.
Step 2: Geocoding enhanced merge in which each location is geocoded using Google Maps Geocoding API [31]. When associated with coordinates, place names, addresses, and zip codes, a geographical approach is applied to merge these gazetteers for a second time.
- Duplicated locations are identified through a coordinate check. If different expressions have the same coordinates after geocoding, these are merged.
- After a coordinate check, a road-name match, similar to the first step, is applied based on the road names acquired after the geocoding process as extracted place names do not have addresses before geocoding. If one road name has 75% or higher similarity score with another after standard name format and the zip codes are the same, these locations are merged. The similarity score is calculated based on the Jaro Distance score for a string match (jellyfish python package [32]). For example, because “X High School” is an 81% match to “X School” and is higher than 75%, these two are merged if they also share the same zip code.
3.2.3. Space–Time Event Identification
Gao et al. [33] extracted locations with the consideration of the geometric feature types; however, all polygon features in this research were generalized to points for better detecting the event location with line features ignored due to less contribution to event reporting. Inspired by Abdelhaq et al. [34], who calculated spatial density distribution to detect events, the point features collected above were aggregated to neighborhoods using the distance buffer within self-adaption thresholds. Instead of using a fixed spatial and temporal threshold to cluster events, self-adaption utilizes the space–time scan statistic method to find the local clusters in space and time based on their statistical significance. The space–time scan statistical method was originally developed by Kulldorff et al. [35,36] and integrated into the SaTScan software [37]. This method does not require a predefined cluster size, and the geographic distribution of events is normally inhomogeneous, which suits our case of identifying events from Twitter data well.
The initiation of the space–time scan statistics method requires a starting radius (r) and a minimum time frame (t). A space–time cluster is defined as a cylinder with r as the radius and t as the height. By systematically increasing r and aggregating multiple time frames, experiments are conducted to evaluate all possible cases and find statistically significant space–time clusters. A detailed explanation of the scan statistics can be found on the user guide of SaTScan [37].
3.3. Event-Based Credibility (EBC) Schema
Event credibility is generated from the supporting tweets of the associated event based on three factors: Mentioning of a specific event in the text content; mentioning of the event in URL; and the accumulated retweet number. The event credibility score is the weighted sum of the three factors normalized as follows:
where n = total number of tweets associated with the event.
For each event, the credibility score of each supporting tweet is calculated based on its mentioning of the event’s location from both text content and URL. The credibility of an event within a supporting tweet is 1 if the tweet mentions this event’s location in its text content. The normalized credibility of this event (EBCNORM) in this tweet is 0.5 × 1 + 0.5 × 1 = 1 if this tweet also mentions this location in its URL content, as in Equation (1). The 0.5 is not the weight assigned to the event mentioning but a normalization so that the maximum possible value of EBCNORM is 1. Retweet of a supporting tweet is also normalized (RetweetNORM) using Equation (2), where the Retweetmax is the maximum number of retweets among all supporting tweets under the theme, and the maximum possible value of RetweetNORM is 1 as well. The event-based credibility score of one tweet (EBCtweet) after normalization achieves its maximum of 2 of which 1 is provided each by EBCNORM and RetweetNORM (Equation (3)).
The total credibility score for each event is the accumulation of the EBCtweet (Equation (4)). Events with high credibility scores have a greater influence on the spatial, temporal, or social scales. Conversely, low credibility events are excluded from this schema.
4. Data and Credibility Analysis
This section introduces the Hurricane Harvey Twitter dataset, data preprocessing, and credibility analysis on calculating the credibility identified for each event with the proposed framework (Section 3).
4.1. Hurricane Harvey Twitter Dataset
The Twitter dataset for Hurricane Harvey (North Texas Libraries [38]) used a comprehensive keyword list and covered a total of 7,041,794 tweets and retweets in from August 18, 2017 to September 22, 2017 (Hurricane Harvey started on August 17, 2017, and ended on September 2, 2017) and stored as a single 43.2 GB JSON file. Of the total original tweets, 7537 are geo-tagged tweets.
The map of overall daily tweet count and theme-related tweet count demonstrates the major affected area (Houston) during Hurricane Harvey (Figure 4), displaying the distribution of the tweets using user-shared locations and the largest hotspot revealed in the Houston area, the first landfall site for Hurricane Harvey. There were three landfalls in total, starting on August 25, 2017, and all the related tweet counts reached their peak on this day of the first landfall. The most tweeted theme was Flood, a reasonable theme for a hurricane event. Tweet counts for all themes, except that for Power, dropped dramatically after the last landfall on August 30, 2017.
4.2. Data Preprocessing
Location information can be extracted from Twitter data through different elements, including tweet text, user-shared coordinate, and URLs (Laylavi et al. [39]). Together with tweet id, retweet count, user id, user followers, and tweet post time, these core attributes from each tweet were selected and stored in PostgreSQL [40] for faster storage and retrieval of the JSON data. Only original tweets were used, since retweets are duplicated information. In addition, only tweets in English were used, with a threshold of 60% English words (excluding emojis, symbols, URL links, and redundant white spaces).
The URL contents were retrieved to complement the information shared in the text content of a tweet. An open source python package (Goose [41]) was adopted, and algorithms designed to automatically loop through URLs, calling the Goose to extract web contents. All extracted contents were stored in a predefined database table schema with associated tweet ID to avoid duplicative operation when URL texts are needed. Each record with its associated tweet ID (tid) was stored so that tables are used for “join” search to provide fast query results.
Tweets were reclassified using predefined keyword sets (Section 3.1). Keywords were applied as query indicators for each theme, and tweets containing these keywords were reclassified to the theme group. Tweets from different theme groups were stored separately for later constructing theme-associated local gazetteers and event tables.
The frequency of tweets related to the five themes (Figure 5) shows a slightly different time series from the previous graph (Figure 4). Before Harvey’s first landfall, tweets are mostly related to personal feelings, forecast information, caution, and advice. Since these topics are not included in the analysis, this contributes to the difference in these two time series. In addition, the first landfall occurred at approximately 10 p.m. (August 25, 2017) with only two hours left in the day, and no major damage was reported. A trough in tweet frequency was observed in both figures with the second landfall (August 26, 2017). Harvey’s slow movement from August 26–30 resulted in catastrophic flooding which underpinned other damage observed from the increasing trends.
4.3. Event-Based Credibility Analysis
With data stored in the database after collecting and preprocessing, credibility analysis focused on analyzing event-based credibility (Section 3.2), starting from location extraction and event identification.
4.3.1. Local Gazetteer Construction
Location extraction methodology was applied to text messages and the associated URL web pages. All extracted locations were inserted into the gazetteer table created in PostgreSQL and classified in the following four categories: Roads from tweet texts; places from tweet texts; roads from URL texts; and place from URL texts with tweet ID (Table 2).
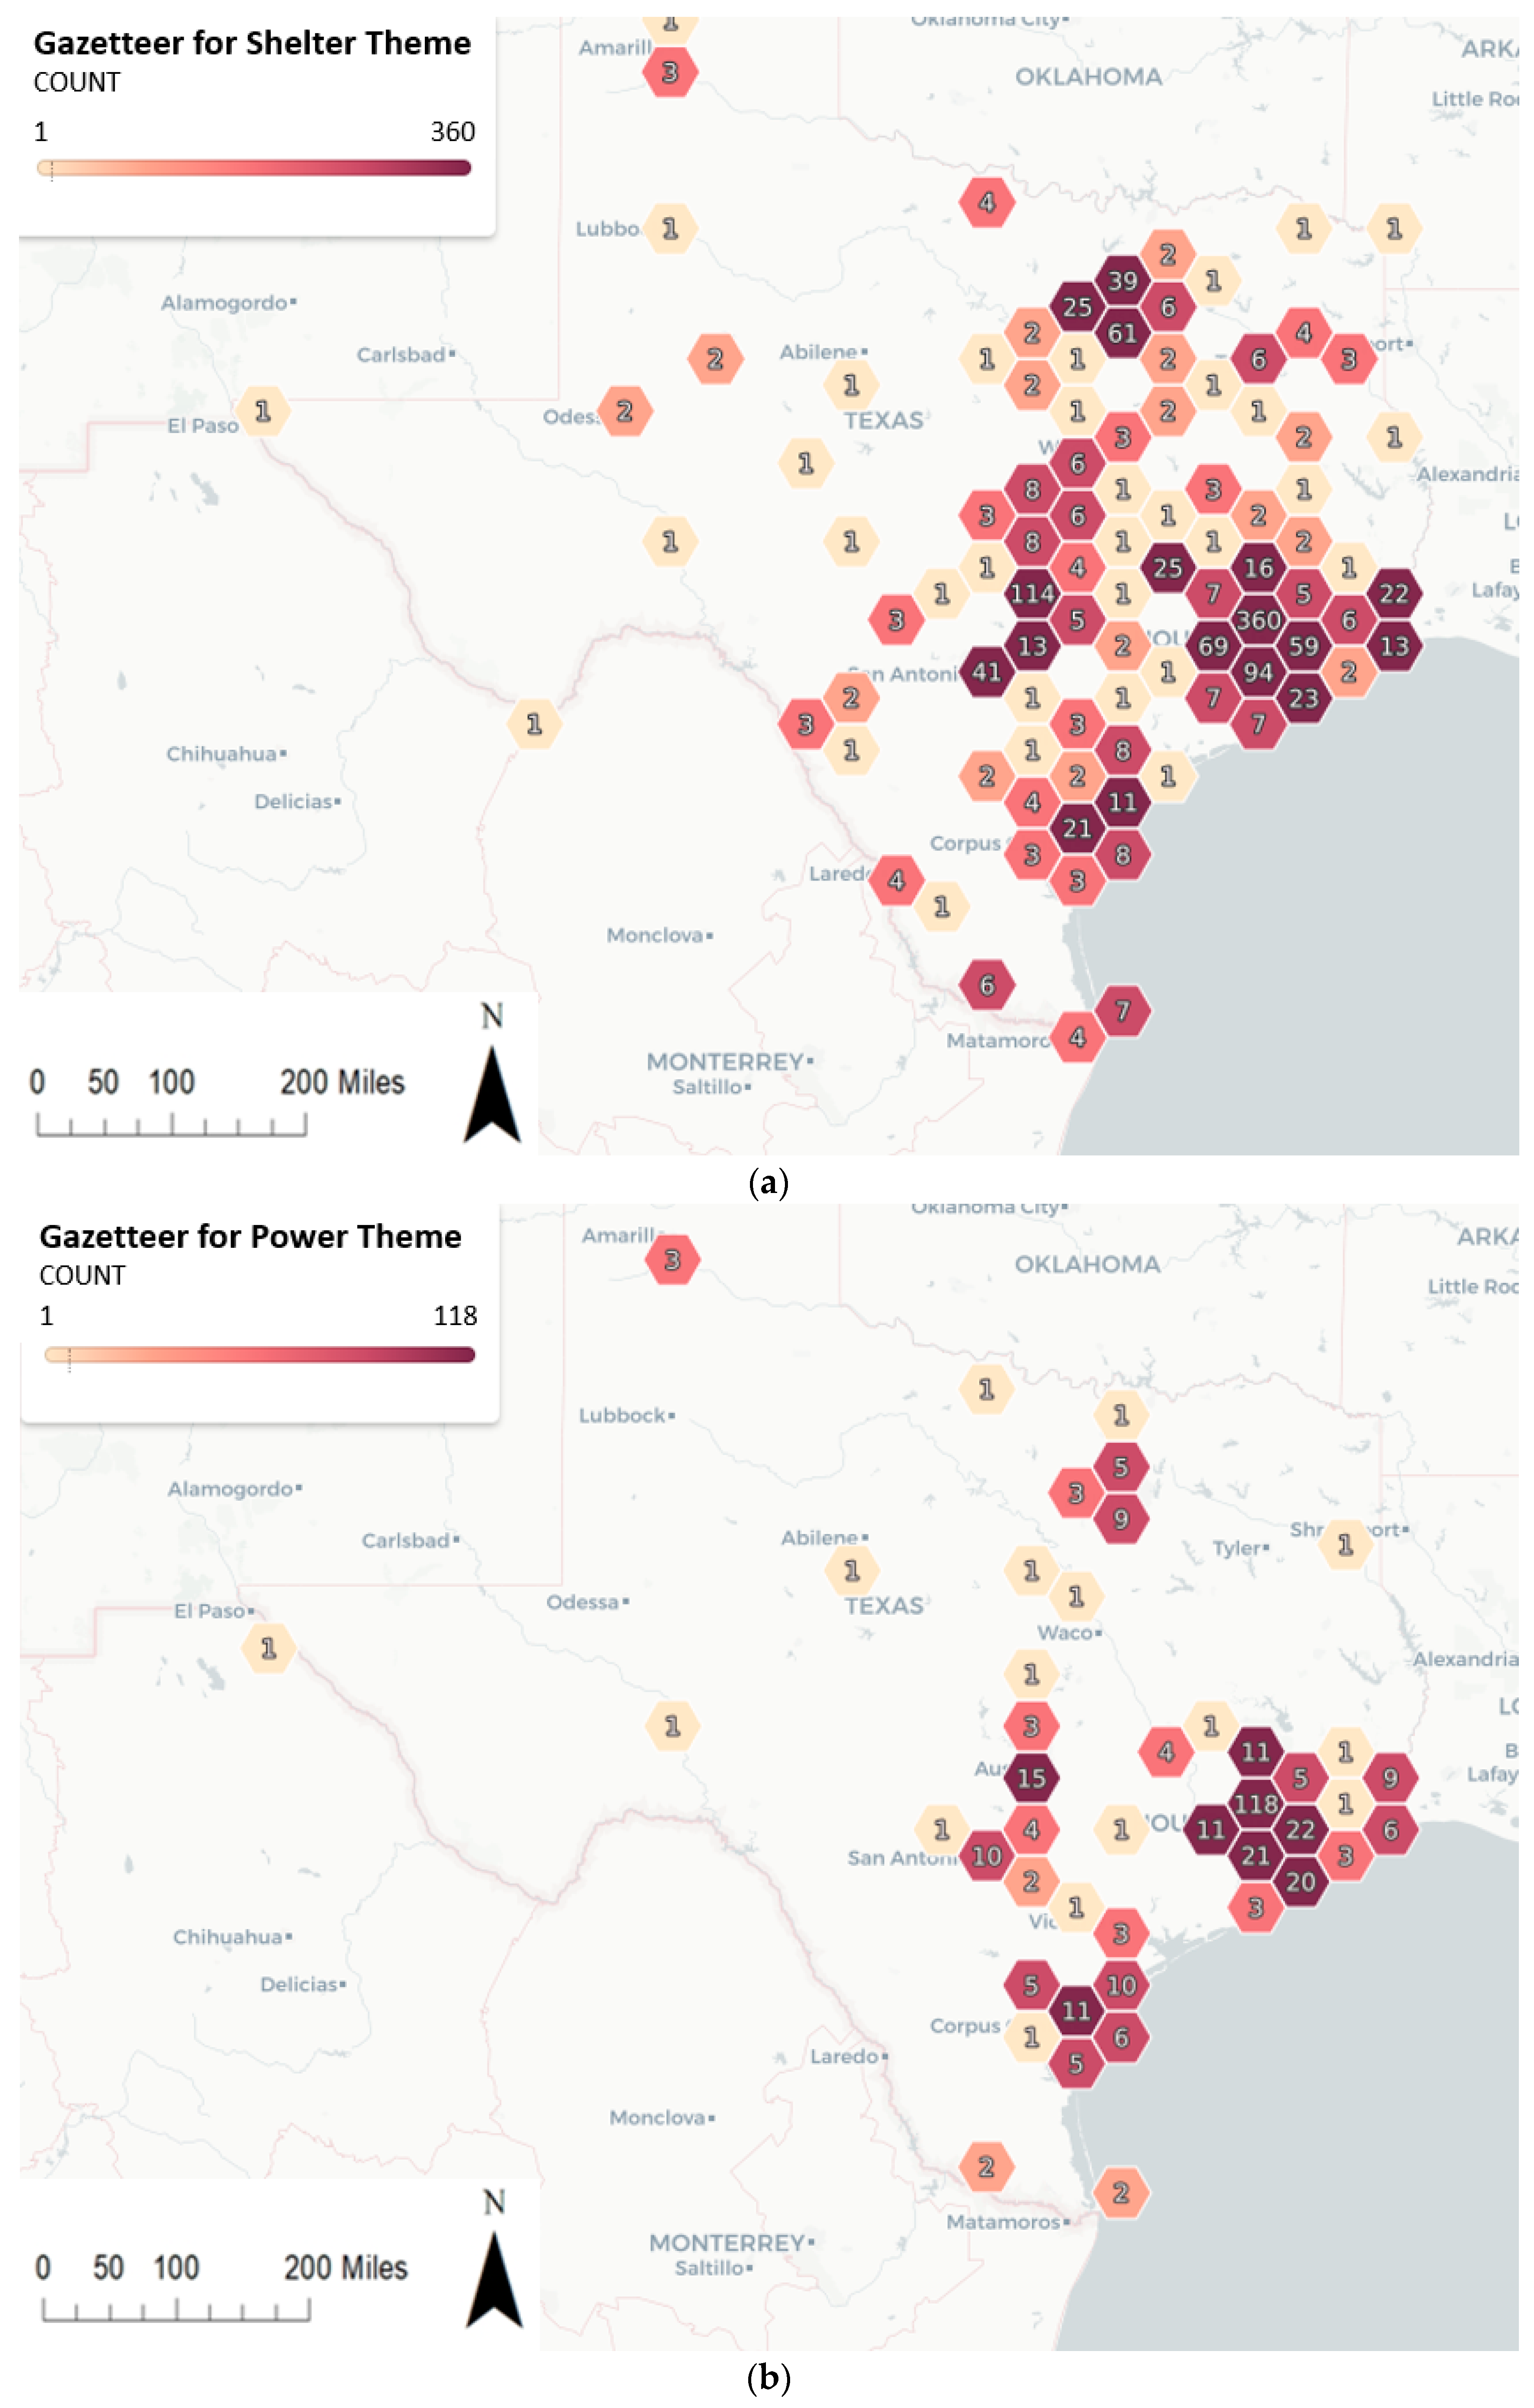
After extraction, location information was merged to eliminate duplication (Section 3.2.2). Within the twitter data, all location names were collected from the gazetteer table for roads and places as two groups, and these two groups were merged separately based on the string match after formatting the user-generated location names. These two groups were sent to the second step for further analysis with geocoding enabled, including coordinates match, road name match, and road name fuzzy match with zip code constraint. These two steps collected non-repeating locations for potential events. The overall distribution of these geocoded locations for each theme illustrates the different numbers of tweets posted at different locations, where the bigger the size, the more the tweets (Figure 6).
4.3.2. Event Identification
Based on the resulting local gazetteer, the space–time scan statistics was applied to identify events that are statistically significant (Figure 7). Each event is an occurrence that happened during a specific time frame and within a spatial range. A specific space–time cluster defined by this time frame and spatial range contains all tweets that belong to this event. For example, events happening at College Station and Texas A&M University are considered as the same “POWER” event (Figure 7b). The Power theme event table contains 252 events, and four other tables for Casualty, Damage, Flood, and Shelter, containing 716, 1,898, 3,672, and 1229 events, respectively.
4.3.3. Credibility Score Calculation
Credibility scores for each tweet and event were calculated (3.3), and an example of how the credibility scores were calculated and added to the event table is provided (Table 3). Compared with Table 2, the column “neighbors” contains all merged locations under the event. Column loc_credits and rt_credits stored the calculated credibility score for each supporting tweet (EBC_tweet), where loc_credits is the mention of a specific event (in the text content and/or in the event in URL), and rt_credits is the retweet number before normalization. Columns ‘loc_credit’ and ‘rt_credit’ are the sum for the column loc_credits and rt_credits, respectively.
5. Case-Study Results of Credibility Scores for Hurricane Harvey
The credibility scores were validated for the four most trustworthy events are as follows: Toyota Center shelter event; George R. Brown Convention center shelter event; Texas A&M University power event; and Ben Taub Hospital power event. The validation used spatial reliability, temporal trend, and social impacts. The context has been provided at the end of this section with one extra validation for a low credibility event.
5.1. Spatial Reliability
Spatial information is a critical component in credibility calculation. Corresponding news related to three of the four events corroborated this conclusion, confirming that the locations extracted from the tweets are valid [42,43,44]. In addition, high water mark (HWM) data obtained from USGS flood event viewer [45] that are presented in Figure 6c indicate the extracted geographic distribution of tweets can represent the actual geographic distribution of Harvey’s impacts. Calculating the Pearson correlation for location distribution of Shelter and HWM, an r of 0.879 illustrated a perfect positive linear relationship between variables. The r for location distribution of Power and HWM is 0.93, which is even better.
5.2. Temporal Trend
The temporal evolvement of credibility for the two shelter events included the credit count (total event-mentioning credibility of the day), tweet count (total supporting tweets of the day), event-match evolving (accumulation of credit count), retweet evolving (normalized total retweets of the day), and merged evolving (accumulated evolving trend of event-mentioning and retweet). Shelter events usually extend for a long time period existing from the first announcement until it is closed. This offers insight on how to adjust the temporal event separation (Figure 3, Section 3.2.2). The number of tweets that include Toyota Center shelter event peaked on August 29 (Figure 8a), the same day the Houston Mayor posted opened the Toyota Center as an additional shelter for Harvey Evacuees (The Weather Channel). The George R. Brown Convention Center shelter event is the most convincing shelter event, as its calculated credibility score ranked on the top of the Shelter event table and is supported by 3234 original tweets and 28,779 retweets. Trends for the two shelter events are similar, both peaking after being announced as shelters.
Power events show different trends (Figure 9) with more diversity. The Texas A&M University power event from August 24–25, 2017 showed two prominent peaks (Figure 9a), while the posts for the Ben Taub Hospital power event on August 27, 2017 showed no peak but a continuing increase. The evacuation event of Ben Taub Hospital at around 8 a.m. can be detected by the framework due to the dramatic increase of reporting the flooding and power outages and reflected more than 4 h later in the news reports at 12:23 p.m.
5.3. Social Impacts
The sources of a particular event are crucial for the evaluation of credibility, and the networks of social relations provide essential contributions. The social network built for the Toyota Center Shelter Event (Figure 10), an event with high credibility (Figure 8), is established by the retweet relationships among users as displayed using Gephi [46]), an open-source visualization platform. Twitter account St. John B. Smith is the most significant source for the event and is followed by Jason Westin MD, ABC News, Houston Chronicle, The Associated Press, and KPRC 2 Houston. The most contributing account, St. John B. Smith [47], is a public safety reporter at Houston Chronicle [48], the largest daily newspaper in Houston. The Associated Press [49] is a US-based not-for-profit news agency, and ABC News [50] is the news division of the American Broadcasting Company. These news outlets are generally regarded as trustworthy information resources, indicating that our framework provides credible results. Social networks can be applied to all trustworthy events to assist in the flow of information and a better understanding of how the events unfold.
5.4. Low Credibility Validation
A low-credibility event (College Station power event (August 27, 2017)) is demonstrated in this section to offer a complete view of the capability provided by the framework. Compared with the previous Texas A&M University power event, this event has only one supporting tweet. By tracing back from the tweet ID, the content revealed that although the content includes “College Station” and “lose power”, this piece of information does not reflect any real power outage event (Table 4).
6. Conclusions
This research proposed a Twitter data credibility framework to identify trustworthy events from massive social media posts under a disaster management scenario. Individual events with disaster situation awareness topics including power, shelter, and damage were identified. To complement the small proportion of geo-tagged tweets, location information was extracted from tweets by constructing a local gazetteer and merged events occurring in a specific spatiotemporal range. Firstly, the credibility score for each tweet was calculated based on the information contained in its text and URL. Secondly, the accumulated credibility score for each event was calculated based on the number of tweets and retweets associated with the same event.
This credibility framework was applied to the Twitter data collected during Hurricane Harvey related to situation awareness, and credibility scores were calculated for the identified events. It reliably identified events with the highest scores and analyzed their spatiotemporal characteristics and social impacts. Events revealed and reported by Twitter users were evaluated responsively through the credibility ranking system. Compared with formally drafted time-consuming news reports, this framework allowed the public to inform themselves via rapid crowdsourcing. As the example of Ben Taub Hospital power event indicates, the Twitter data credibility framework has the potential to reveal events out of sight from mainstream media.
This research also contributes to the integration of the 3-factor crowdsourcing information quality assessment and spatiotemporal event detection. It improves the credibility evaluation process of the user-generated information through detecting flexible and dynamic space–time clusters as events. The event detection procedure can also be applied to online learning of streaming Twitter data. The following are the limitations of this study and the possibilities for future development.
6.1. Limitations
When detecting events using Twitter data, spatial and social biases from unrepresentative data are non-negligible. Users that contribute data are usually younger, wealthier, and better educated [51,52], which do not represent the general population. The concentrations of these tweets are not evenly distributed, as displayed in Figure 4 and Figure 7c. The methods presented in Section 3, including the construction of local gazetteers and the identification of spatiotemporal events, are relatively straightforward, as the study’s aim was mainly to propose a framework for calculating the credibility of events in the context of disaster situational awareness. Readers are encouraged to replace the components inside this framework to suit their requirements. Furthermore, applying equal weight in the credibility scheme (Equations (1) and (3)) can be arbitrary. Though based on our assumption, the reliability of Twitter text and URL content are not necessarily one better than the other given that we do not have the authoritativeness information of any user or tweet. Using statistically calculated weights could potentially help improve the result.
6.2. Future Developments
For future developments, this credibility framework can be augmented to serve as a starting point for constructing a real-time, evolving credibility monitoring system in the context of big data [53]. Applying this credibility framework with streaming data, the potential exists to calculate evolving credibility in real-time, providing users a window into the most important and trustworthy events. With streaming tweets, each new post can be categorized in real time to a certain theme and start contributing to a new or existing event. Combined with the social impacts in Section 5.3, the credibility schema is enhanced by making the reliability of the individual user the third factor in Equation (3). Integrating existing (i) local gazetteer published either by government agencies or by a crowdsourcing knowledge base like Foursquare adopted by Li and Sun [54] with (ii) place/road representation and detection methodology, the accuracy and the completeness of the proposed social-network-based, gazetteer construction algorithm constitutes another improvement. Furthermore, further investigation can be conducted to achieve an advanced event detection, converge keywords for new event implementation, and complement the current limitation on events detected based on the predefined list of keywords by adopting similar ideas proposed by Li et al. [55] that auto expands the keyword set with bootstrapping idea.
Author Contributions
Chaowei Yang and Manzhu Yu came up with the original idea; Jingchao Yang, Manzhu Yu, Han Qin, Chaowei Yang and Mingyue Lu designed and developed the study; All conducted the data processing and analysis; and Jingchao Yang and Manzhu Yu wrote a draft of the manuscript, which was iteratively improved by all other authors of the manuscript.
Funding
This project is funded by NSF (IIP-1338925).
Acknowledgments
In this section you can acknowledge any support given which is not covered by the author contribution or funding sections. This may include administrative and technical support, or donations in kind (e.g., materials used for experiments).
Conflicts of Interest
The authors declare no conflict of interest.
References
- 2017 Atlantic hurricane season. Wikipedia. 2018. Available online: https://en.wikipedia.org/wiki/2017_Atlantic_hurricane_season (accessed on 7 December 2018).
- Murthy, D.; Gross, A.J. Social media processes in disasters: Implications of emergent technology use. Soc. Sci. Res. 2017, 63, 356–370. [Google Scholar] [CrossRef] [PubMed]
- Tim, Y.; Pan, S.L.; Ractham, P.; Kaewkitipong, L. Digitally enabled disaster response: The emergence of social media as boundary objects in a flooding disaster. Inf. Syst. J. 2017, 27, 197–232. [Google Scholar] [CrossRef]
- Yu, M.; Yang, C.; Li, Y. Big Data in Natural Disaster Management: A Review. Geosciences 2018, 8, 165. [Google Scholar] [CrossRef]
- Huang, Q.; Xiao, Y. Geographic Situational Awareness: Mining Tweets for Disaster Preparedness, Emergency Response, Impact, and Recovery. ISPRS Int. J. Geo-Inf. 2015, 4, 1549–1568. [Google Scholar] [CrossRef] [Green Version]
- Middleton, S.E.; Middleton, L.; Modafferi, S. Real-Time Crisis Mapping of Natural Disasters Using Social Media. IEEE Intell. Syst. 2014, 29, 9–17. [Google Scholar] [CrossRef]
- Tsou, M.-H.; Jung, C.-T.; Allen, C.; Yang, J.-A.; Han, S.Y.; Spitzberg, B.H.; Dozier, J. Building a Real-Time Geo-Targeted Event Observation (Geo) Viewer for Disaster Management and Situation Awareness. In Proceedings of the Advances in Cartography and GIScience; Peterson, M.P., Ed.; Springer International Publishing: Cham, Switzerland, 2017; pp. 85–98. [Google Scholar]
- Reuter, C.; Kaufhold, M.-A. Fifteen years of social media in emergencies: A retrospective review and future directions for crisis Informatics. J. Conting. Crisis Manag. 2018, 26, 41–57. [Google Scholar] [CrossRef]
- Collins, M.; Neville, K.; Hynes, W.; Madden, M. Communication in a disaster—The development of a crisis communication tool within the S-HELP project. J. Decis. Syst. 2016, 25, 160–170. [Google Scholar] [CrossRef]
- Goodchild, M.F. Citizens as sensors: The world of volunteered geography. GeoJournal 2007, 69, 211–221. [Google Scholar] [CrossRef]
- Goodchild, M.F.; Li, L. Assuring the quality of volunteered geographic information. Spat. Stat. 2012, 1, 110–120. [Google Scholar] [CrossRef]
- Chae, J.; Thom, D.; Bosch, H.; Jang, Y.; Maciejewski, R.; Ebert, D.S.; Ertl, T. Spatiotemporal social media analytics for abnormal event detection and examination using seasonal-trend decomposition. In Proceedings of the 2012 IEEE Conference on Visual Analytics Science and Technology (VAST), Seattle, WA, USA, 14–19 October 2012; pp. 143–152. [Google Scholar]
- Benson, E.; Haghighi, A.; Barzilay, R. Event Discovery in Social Media Feeds. In Proceedings of the 49th Annual Meeting of the Association for Computational Linguistics: Human Language Technologies, Portland, OR, USA, 19–24 June 2011; Association for Computational Linguistics: Stroudsburg, PA, USA, 2011; Volume 1, pp. 389–398. [Google Scholar]
- Ritter, A.; Mausam; Etzioni, O.; Clark, S. Open Domain Event Extraction from Twitter. In Proceedings of the 18th ACM SIGKDD International Conference on Knowledge Discovery and Data Mining, Beijing, China, 12–16 August 2012; ACM: New York, NY, USA, 2012; pp. 1104–1112. [Google Scholar]
- Becker, H.; Naaman, M.; Gravano, L. Beyond Trending Topics: Real-World Event Identification on Twitter. In Proceedings of the Fifth International Conference on Weblogs and Social Media, Barcelona, Catalonia, Spain, 17–21 July 2011. [Google Scholar]
- Imran, M.; Elbassuoni, S.; Castillo, C.; Diaz, F.; Meier, P. Practical Extraction of Disaster-relevant Information from Social Media. In Proceedings of the 22nd International Conference on World Wide Web, Rio de Janeiro, Brazil, 13–17 May 2013; ACM: New York, NY, USA, 2013; pp. 1021–1024. [Google Scholar]
- Discovering Health Topics in Social Media Using Topic Models. Available online: https://journals.plos.org/plosone/article?id=10.1371/journal.pone.0103408 (accessed on 7 December 2018).
- Chae, J.; Thom, D.; Jang, Y.; Kim, S.; Ertl, T.; Ebert, D.S. Public behavior response analysis in disaster events utilizing visual analytics of microblog data. Comput. Graph. 2014, 38, 51–60. [Google Scholar] [CrossRef]
- Resch, B.; Usländer, F.; Havas, C. Combining machine-learning topic models and spatiotemporal analysis of social media data for disaster footprint and damage assessment. Cartogr. Geogr. Inf. Sci. 2018, 45, 362–376. [Google Scholar] [CrossRef]
- Contextual Enrichment of Remote-Sensed Events with Social Media Streams. Available online: https://0-dl-acm-org.brum.beds.ac.uk/citation.cfm?id=2984063 (accessed on 7 December 2018).
- Pouyanfar, S.; Chen, S.-C. Automatic Video Event Detection for Imbalance Data Using Enhanced Ensemble Deep Learning. Int. J. Semant. Comput. 2017, 11, 85–109. [Google Scholar] [CrossRef]
- Gupta, A.; Kumaraguru, P. Credibility Ranking of Tweets during High Impact Events. In Proceedings of the 1st Workshop on Privacy and Security in Online Social Media, Lyon, France, 17 April 2012; ACM: New York, NY, USA, 2012; pp. 2:2–2:8. [Google Scholar]
- Senaratne, H.; Mobasheri, A.; Ali, A.L.; Capineri, C.; Haklay, M. (Muki) A review of volunteered geographic information quality assessment methods. Int. J. Geogr. Inf. Sci. 2017, 31, 139–167. [Google Scholar] [CrossRef]
- Hovland, C.I.; Janis, I.L.; Kelley, H.H. Communication and Persuasion; Psychological Studies of Opinion Change; Communication and Persuasion; Psychological Studies of Opinion Change; Yale University Press: New Haven, CT, USA, 1953. [Google Scholar]
- Mendoza, M.; Poblete, B.; Castillo, C. Twitter Under Crisis: Can We Trust What We RT? In Proceedings of the First Workshop on Social Media Analytics, Washington, DC, USA, 25–28 July 2010; ACM: New York, NY, USA, 2010; pp. 71–79. [Google Scholar]
- Rice, M.T.; Paez, F.I.; Rice, R.M.; Ong, E.W.; Qin, H.; Seitz, C.R.; Fayne, J.V.; Curtin, K.M.; Fuhrmann, S.; Pfoser, D.; et al. Quality Assessment and Accessibility Applications of Crowdsourced Geospatial Data: A Report on the Development and Extension of the George Mason University Geocrowdsourcing Testbed; George Mason University: Fairfax, VA, USA, 2014. [Google Scholar]
- Qin, H.; Rice, R.M.; Fuhrmann, S.; Rice, M.T.; Curtin, K.M.; Ong, E. Geocrowdsourcing and accessibility for dynamic environments. GeoJournal 2016, 81, 699–716. [Google Scholar] [CrossRef]
- Qin, H. Link to External Site, This Link Will Open in a New Window Modeling Accessibility through Geocrowdsourcing. Ph.D. Thesis, George Mason University, Fairfax County, VA, USA, 2017. [Google Scholar]
- Castillo, C.; Mendoza, M.; Poblete, B. Predicting information credibility in time-sensitive social media. Internet Res. 2013, 23, 560–588. [Google Scholar] [CrossRef]
- Shelton, T.; Poorthuis, A.; Graham, M.; Zook, M. Mapping the data shadows of Hurricane Sandy: Uncovering the sociospatial dimensions of ‘big data’. Geoforum 2014, 52, 167–179. [Google Scholar] [CrossRef]
- Get Started|Geocoding API. Available online: https://developers.google.com/maps/documentation/geocoding/start (accessed on 7 December 2018).
- Jellyfish 0.5.6—Jellyfish 0.5.6 Documentation. Available online: https://jellyfish.readthedocs.io/en/latest/ (accessed on 7 December 2018).
- Gao, S.; Li, L.; Li, W.; Janowicz, K.; Zhang, Y. Constructing gazetteers from volunteered Big Geo-Data based on Hadoop. Comput. Environ. Urban Syst. 2017, 61, 172–186. [Google Scholar] [CrossRef] [Green Version]
- Abdelhaq, H.; Sengstock, C.; Gertz, M. EvenTweet: Online Localized Event Detection from Twitter. Proc. VLDB Endow. 2013, 6, 1326–1329. [Google Scholar] [CrossRef]
- Kulldorff, M.; Athas, W.F.; Feurer, E.J.; Miller, B.A.; Key, C.R. Evaluating cluster alarms: A space-time scan statistic and brain cancer in Los Alamos, New Mexico. Am. J. Public Health 1998, 88, 1377–1380. [Google Scholar] [CrossRef] [PubMed]
- Kulldorff, M.; Heffernan, R.; Hartman, J.; Assunção, R.; Mostashari, F. A Space–Time Permutation Scan Statistic for Disease Outbreak Detection. PLoS Med. 2005, 2, e59. [Google Scholar] [CrossRef] [PubMed]
- SaTScan—Software for the Spatial, Temporal, and Space-Time Scan Statistics. Available online: https://www.satscan.org/ (accessed on 9 February 2019).
- Phillips, M.E. Hurricane Harvey Twitter Dataset. Twitter. 2017. Available online: https://digital.library.unt.edu/ark:/67531/metadc993940/ (accessed on 7 December 2018).
- Laylavi, F.; Rajabifard, A.; Kalantari, M. A Multi-Element Approach to Location Inference of Twitter: A Case for Emergency Response. ISPRS Int. J. Geo-Inf. 2016, 5, 56. [Google Scholar] [CrossRef]
- PostgreSQL: The World’s Most Advanced Open Source Database. Available online: https://www.postgresql.org/ (accessed on 7 December 2018).
- Welcome to Goose3’s Documentation!—Goose3 3.1.6 Documentation. Available online: https://goose3.readthedocs.io/en/latest/ (accessed on 7 December 2018).
- Houston Mayor Opens Toyota Center as Additional Shelter for Harvey Evacuees. Available online: https://weather.com/storms/hurricane/news/houston-convention-center-hundreds-refuge-harvey (accessed on 7 December 2018).
- City opening George, R. Brown, Multiservice Centers as Shelters|khou.com. Available online: https://www.khou.com/article/weather/tropics/city-opening-george-r-brown-multiservice-centers-as-shelters/468175978 (accessed on 7 December 2018).
- Taylor, B. Ben Taub Hospital Being Evacuated Due to Flooding, Power Outages. Available online: https://www.click2houston.com/news/ben-taub-hospital-being-evacuated-due-to-flooding-power-outages (accessed on 7 December 2018).
- Flood Event Viewer. Available online: https://stn.wim.usgs.gov/fev/#HarveyAug2017 (accessed on 20 February 2019).
- Gephi—The Open Graph Viz Platform. Available online: https://gephi.org/ (accessed on 7 December 2018).
- St. John Barned-Smith, Reporter, Houston Chronicle—Houston Chronicle. Available online: https://www.houstonchronicle.com/author/st-john-barned-smith/ (accessed on 7 December 2018).
- Houston Local News, Weather, Headlines, Sports, Business, and Entertainment—The Houston Chronicle at Chron.com—Houston Chronicle. Available online: https://www.chron.com/ (accessed on 7 December 2018).
- Associated Press News. Available online: https://apnews.com (accessed on 7 December 2018).
- News, A.B.C. ABC News. Available online: https://abcnews.go.com (accessed on 7 December 2018).
- Blank, G. The Digital Divide among Twitter Users and Its Implications for Social Research. Soc. Sci. Comput. Rev. 2017, 35, 679–697. [Google Scholar] [CrossRef]
- Ballatore, A.; De Sabbata, S. Charting the Geographies of Crowdsourced Information in Greater London. In Proceedings of the Geospatial Technologies for All; Mansourian, A., Pilesjö, P., Harrie, L., van Lammeren, R., Eds.; Springer International Publishing: Cham, Switzerland, 2018; pp. 149–168. [Google Scholar]
- Yang, C.; Huang, Q.; Li, Z.; Liu, K.; Hu, F. Big Data and cloud computing: Innovation opportunities and challenges. Int. J. Digit. Earth 2017, 10, 13–53. [Google Scholar] [CrossRef]
- Li, C.; Sun, A. Fine-grained Location Extraction from Tweets with Temporal Awareness. In Proceedings of the 37th International ACM SIGIR Conference on Research & Development in Information Retrieval, Gold Coast, Queensland, Australia, 6–11 July 2014; ACM: New York, NY, USA, 2014; pp. 43–52. [Google Scholar]
- Li, R.; Lei, K.H.; Khadiwala, R.; Chang, K.C. TEDAS: A Twitter-based Event Detection and Analysis System. In Proceedings of the 2012 IEEE 28th International Conference on Data Engineering, Washington, DC, USA, 1–5 April 2012; pp. 1273–1276. [Google Scholar]
Figure 1.
The overall structure of the credibility framework.

Figure 2.
Procedure for extracting road names from text. Possible road name compositions are as follows: 1. Number + Suffix; 2. Number + Capital Letter Words + Suffix; 3. Capital Letter Words + Suffix; and 4. Suffix + Number.
Figure 2.
Procedure for extracting road names from text. Possible road name compositions are as follows: 1. Number + Suffix; 2. Number + Capital Letter Words + Suffix; 3. Capital Letter Words + Suffix; and 4. Suffix + Number.

Figure 3.
An example showing how extracted local gazetteer is grouped, geocoded, and merged to the final detected events.
Figure 3.
An example showing how extracted local gazetteer is grouped, geocoded, and merged to the final detected events.

Figure 4.
Spatiotemporal distribution of original data. The map (center in the Houston area) shows geographic distribution within all user shared coordinates, and the bar chart demonstrates a temporal distribution. Three landfalls are marked in dark blue color on August 25, August 26, and August 30.

Figure 5.
Temporal distribution for 5 theme-related daily twitter count.

Figure 6.
Map examples showing local gazetteer plotted for two themes: (a) Shelter (from 2990 tweets); (b) Power (from 752 tweets), and (c) the high water mark location distribution from USGS. In contrast to the heat map on Figure 4 (users’ own location), these are the locations users mention in their tweets or locations from of the URLs they share (note: The bigger the size, the more the tweets).


Figure 7.
Detected space–time clusters in College Station and Houston regions: (a) Study area; (b) college station region; (c) clusters in the Houston region, with different sizes of red bubbles indicating different sizes of spacetime aggregation.
Figure 7.
Detected space–time clusters in College Station and Houston regions: (a) Study area; (b) college station region; (c) clusters in the Houston region, with different sizes of red bubbles indicating different sizes of spacetime aggregation.

Figure 8.
Evolving credibility of two event examples (Toyota Center (Panels a, b, and c) and George Brown Convention Center (Panels d, e, and f)). Panels a and d are credit counts, panels b and e are event-match evolving, and panels c and f are merged evolving.
Figure 8.
Evolving credibility of two event examples (Toyota Center (Panels a, b, and c) and George Brown Convention Center (Panels d, e, and f)). Panels a and d are credit counts, panels b and e are event-match evolving, and panels c and f are merged evolving.

Figure 9.
The evolving credibility under the Power theme for Texas A&M University (Panels a, b and c) and Ben Taub Hospital (Panels d, e, and f). Panels a and d are for credit count, panels b and e are for event-match evolving, and panels c and f are for merged evolving.
Figure 9.
The evolving credibility under the Power theme for Texas A&M University (Panels a, b and c) and Ben Taub Hospital (Panels d, e, and f). Panels a and d are for credit count, panels b and e are for event-match evolving, and panels c and f are for merged evolving.

Figure 10.
Social network relations of the Toyota Center Shelter Event. The blue arrows represent the paths of information transferred (retweeted) from its original resource. Red texts are the source names (twitter account), and text font size is indicative of how wide the information is being broadcasted.


Table 1.
Theme table with keywords.
| Theme | Keywords |
|---|---|
| Sheltering | hotel, housing, shelter |
| Casualty | dead, death, death toll, drowned, kill |
| Damage | catastrophe, collapse, damage, damaged, damaging, debris, destroy, destroyed, destruct, destructed, destructing, destruction, destroying, devastate, devastation, rip off, ruin, ruined, ruining, wreck, wrecking |
| Flood | flood, flooded, flooding, spill over, surge overflow, under water, underwater, wash away, washing away, water over the roof, water overflow, water rushing, drown |
| Power/Electricity | black out, blackout, coned, dark, darker, downed electrical wires, POWER down, POWER not expected, POWER off, POWER out, POWER outage, goodbye POWER, knock out POWER, lose POWER, losing POWER, lost POWER, no POWER, noPOWER, off the grid, powerless, shut off POWER, taken POWER, transformer exploding, transformer explosion, w/o POWER, wait POWER return, without POWER, without power |
Table 2.
Gazetteer table with Twitter ID.
| tw_road | tw_place | url_road | url_place | Tcreate | TID |
|---|---|---|---|---|---|
| *R 601 Delany Rd | #P Abundant Life Christian Center | 2017-08-25 10:08:51 p.m. | 901280250784514048 | ||
| *R Texas Coastal Bend | *R Texas Coastal Bend | #P Rockport Fulton High School | 2017-08-26 11:48:28 a.m. | 901486512914804738 | |
| *R 3300 Poteet Dr | #P Poteet High School | 2017-08-25 08:55:51 p.m. | 901261879120715777 | ||
| *R 5 Dallas Fort | *R San Antonio Fort | #P Bailey Hutchison Convention Center | 2017-08-30 03:04:34 p.m. | 902985413991727104 |
Table 3.
Event table with credibility score.
| Cluster | Neighbors | loc_credit | rt_credit | loc_credits | rt_credits |
|---|---|---|---|---|---|
| 6594 | #P Ben Taub Hospital, #P Houston Ben Taub Hospital, #P Ben Taub hospital, #P Nevertheless Ben Taub hospital | 6.5 | 38 | {0.5,0.5,0.5,0.5,0.5…} | {0,1,27,0,0,0,8…} |
| 34 | #P Texas A M university, #P Texas A M University, #P TEXAS A M UNIVERSITY, *R Smith College Station | 11.5 | 59 | {0.5,0.5,0.5,0.5,1…} | {4,2,12,11,0,11,9…} |
| 11 | *R The Galveston Ferry, #P Galveston Island Beach, #P The Galveston Island Beach, #P Stewart Beach | 14 | 97 | {0.5,0.5,0.5,0.5…} | {1,3,0,35,4,1,2,0,2…} |
| 162 | *R College Station, *R Bryan College Station, *R COLLEGE STATION, #P College Station, #P Bryan College Station, #P COLLEGE STATION | 1 | 0 | {1} | {0} |
Table 4.
Low-confidence event.
| TID | Content | loc_credit | rt_credit |
|---|---|---|---|
| 901869361501274112 | Not much rain in College Station for the time being but the wind is picking up. Hopefully we won’t lose power #Harvey | 1 | 0 |
© 2019 by the authors. Licensee MDPI, Basel, Switzerland. This article is an open access article distributed under the terms and conditions of the Creative Commons Attribution (CC BY) license (http://creativecommons.org/licenses/by/4.0/).
Share and Cite
MDPI and ACS Style
Yang, J.; Yu, M.; Qin, H.; Lu, M.; Yang, C. A Twitter Data Credibility Framework—Hurricane Harvey as a Use Case. ISPRS Int. J. Geo-Inf. 2019, 8, 111. https://0-doi-org.brum.beds.ac.uk/10.3390/ijgi8030111
AMA Style
Yang J, Yu M, Qin H, Lu M, Yang C. A Twitter Data Credibility Framework—Hurricane Harvey as a Use Case. ISPRS International Journal of Geo-Information. 2019; 8(3):111. https://0-doi-org.brum.beds.ac.uk/10.3390/ijgi8030111
Chicago/Turabian StyleYang, Jingchao, Manzhu Yu, Han Qin, Mingyue Lu, and Chaowei Yang. 2019. "A Twitter Data Credibility Framework—Hurricane Harvey as a Use Case" ISPRS International Journal of Geo-Information 8, no. 3: 111. https://0-doi-org.brum.beds.ac.uk/10.3390/ijgi8030111
Note that from the first issue of 2016, this journal uses article numbers instead of page numbers. See further details here.