A New Algorithms of Stroke Generation Considering Geometric and Structural Properties of Road Network

School of Resources and Environmental Engineering, Hubei Key Laboratory for Efficient Utilization and Agglomeration of Metallurgic Mineral Resources, Wuhan University of Science and Technology, Wuhan 430080, China
*
Author to whom correspondence should be addressed.
ISPRS Int. J. Geo-Inf. 2019, 8(7), 304; https://0-doi-org.brum.beds.ac.uk/10.3390/ijgi8070304
Submission received: 6 May 2019
/
Revised: 28 June 2019
/
Accepted: 13 July 2019
/
Published: 16 July 2019
(This article belongs to the Special Issue Map Generalization)
Abstract
:Strokes are considered an elementary unit of road networks and have been widely used in their analysis and application. However, most conventional stroke generation methods are based solely on a fixed angle threshold, which ignores road networks’ geometric and structural properties. To remedy this, this paper proposes an algorithm for generating strokes that takes into account these additional geometric and structural road network properties and that reduces the impact of stroke generation on road network quality. To this end, we introduce a model of feature-based information entropy and then utilize this model to calculate road networks’ information volume and both the elemental and neighborhood level. To make our experimental results more objective, we use the Douglas-Peucker algorithm to simplify the information change curve and to obtain the optimal angle threshold range for generating strokes for different road network structures. Finally, we apply this model to three different road networks, and the optimal threshold ranges are 54°–63° (Chicago), 61°–63° (Moscow), 45°–48° (Monaco). And taking Monaco as an example, this paper conducts stroke selection experiments. The results demonstrate that our proposed algorithm has better connectivity and wider coverage than those based on a common angle threshold (60°).
1. Introduction
Roads are a basic geographic facility that affect many people; researching effective road systems, therefore, is important for researchers in traffic planning, geography, and tourism. To this end, various studies have examined pedestrian and vehicle trajectories, road selection, and path planning [1]. The growth of the internet means that these studies are becoming more extensive as data on road networks is becoming more readily available, a development that requires more effective data processing tools than had previously been used.
Previous road network research divided a complete road into several independent segments based on road intersections. Each one of these independent segments had to be processed and analyzed in order to ensure a complete and correct understanding of the road network. When path planning using this method, the results obtained from analyzing a complete road may be different from those based on the analysis of individual road segments. As such, the efficiency of path planning based on segments is relatively low, especially when there are many intersections.
In order to solve this problem, some scholars have proposed merging segments according to their attributes to form a relatively complete “road” [2]. However, this method has severe limitations, since it requires detailed information on each segment’s attributes such as roads’ name [1]. A feasible solution is to concatenate road segments into long lines based on some criteria. It is hoped that these concatenated lines are the original roads. The concatenated line is called a ‘stroke’ in geographical information science [3]. The term ‘stroke’ is prompted by the idea of a curvilinear segment that can be drawn in one smooth movement and without a dramatic change in style. The original idea of building road segments into strokes, proposed by Thomson and Richardson [3], was based on a geometric approach. The basic principle was very simple. ‘Elements that appear to follow in the same direction tend to be grouped together’, which follows the ‘goodness of continuity’ theme in visual perception. Specifically, their method does not rely directly on fragmented segments, but rather constructs a larger selection unit based on perceptual grouping—i.e., strokes—and selects a road according to the length of the stroke [3]. Today, their method is widely perceived as effective [4,5,6].
When generating these strokes, selecting an angle threshold is the first problem, and different scholars have addressed this problem in different ways. For example, Zhu et al. [4] select 15°, while Weiwei et al. [7] determine that 45° is more suitable for road selection. Similarly, scholars use different angle thresholds to generalize road networks. Zhang, Wang, and Zhao [8] and Jiang, Zhao, and Yin [9] believe that strokes can be generated as long as the deflection angle is less than 60°, while Qi [1] and Omair [10] determine that two segments can only be merged into a stroke when the deflection angle is between 40° and 60°. In other studies, Zhongliang, Baofeng, and Yulong [11] use an angle of 22.5° to study road network schematics based on stroke and Lin et al. [12] utilize 45° as the stroke angle threshold in road network automatic matching. It can be seen that the stroke has been widely used in various analysis and applications of road networks.
However, while strokes are widely used in road network research, few scholars have examined the best methods of determining the most accurate angle threshold. Instead, most research directly applies a fixed angle threshold in stroke generation [7,8,9,10,11,12], ignoring the influence of a road network’s geometric and structural properties. This paper attempts to remedy that limitation by arguing that a road network’s geometric and structural properties have an important influence on the determination of the angle threshold.
To this end, in this paper we determine a model for describing changes in road network information under different angle thresholds to reflect the differences in strokes. Bjørke [13] suggests that information entropy, a measurement method based on probability, may be an accurate way of describing an uncertain motion state or existing mode of things. Indeed, most existing spatial information measurement methods are based on the concept of entropy and apply the classical information entropy model. However, the traditional probability-based information entropy model can’t meet this requirement. In recent years, scholars have combined this model with spatial cognitive analysis to establish a spatial information measurement method based on the spatial characteristics of roads, contours, and residential areas [14,15]. This method expresses the diversity of spatial elements and their distribution characteristics.
Therefore, using an information entropy model based on spatial characteristics, this paper develops a model to determine the corresponding indicators of element level and neighborhood level, generate strokes under different angle thresholds, and use the Douglas-Peucker algorithm to determine the optimal angle threshold range to generate strokes under different road network structures. We then test our model by applying it to three road systems: Monaco, Chicago, and Moscow. The remainder of this paper is organized as follows. Section 2 describes a new algorithm for stroke generating. In Section 3, a case study is then developed to validate the proposed method. Finally, Section 4 offers conclusions.
2. Materials and Methods
2.1. Framework
Since road networks are influenced by politics, geography, and topography, they differ in individual cities, suggesting that road segments will have different deflection angles as well and different optimal angle thresholds when constructing strokes. Map information comes from the diversity of elements and their distribution characteristics [16]. In other words, different road network structures have differences in road shape, scale, and structure and differing amounts of generated information. At the same time, there may also be differences between generated strokes within a certain road network under different angle thresholds; the greater this difference, the more information that is generated. If little information changes when using varying angle thresholds, therefore, then there is little difference between the generated strokes at different thresholds, suggesting that the corresponding angle is also the network’s optimal angle threshold.
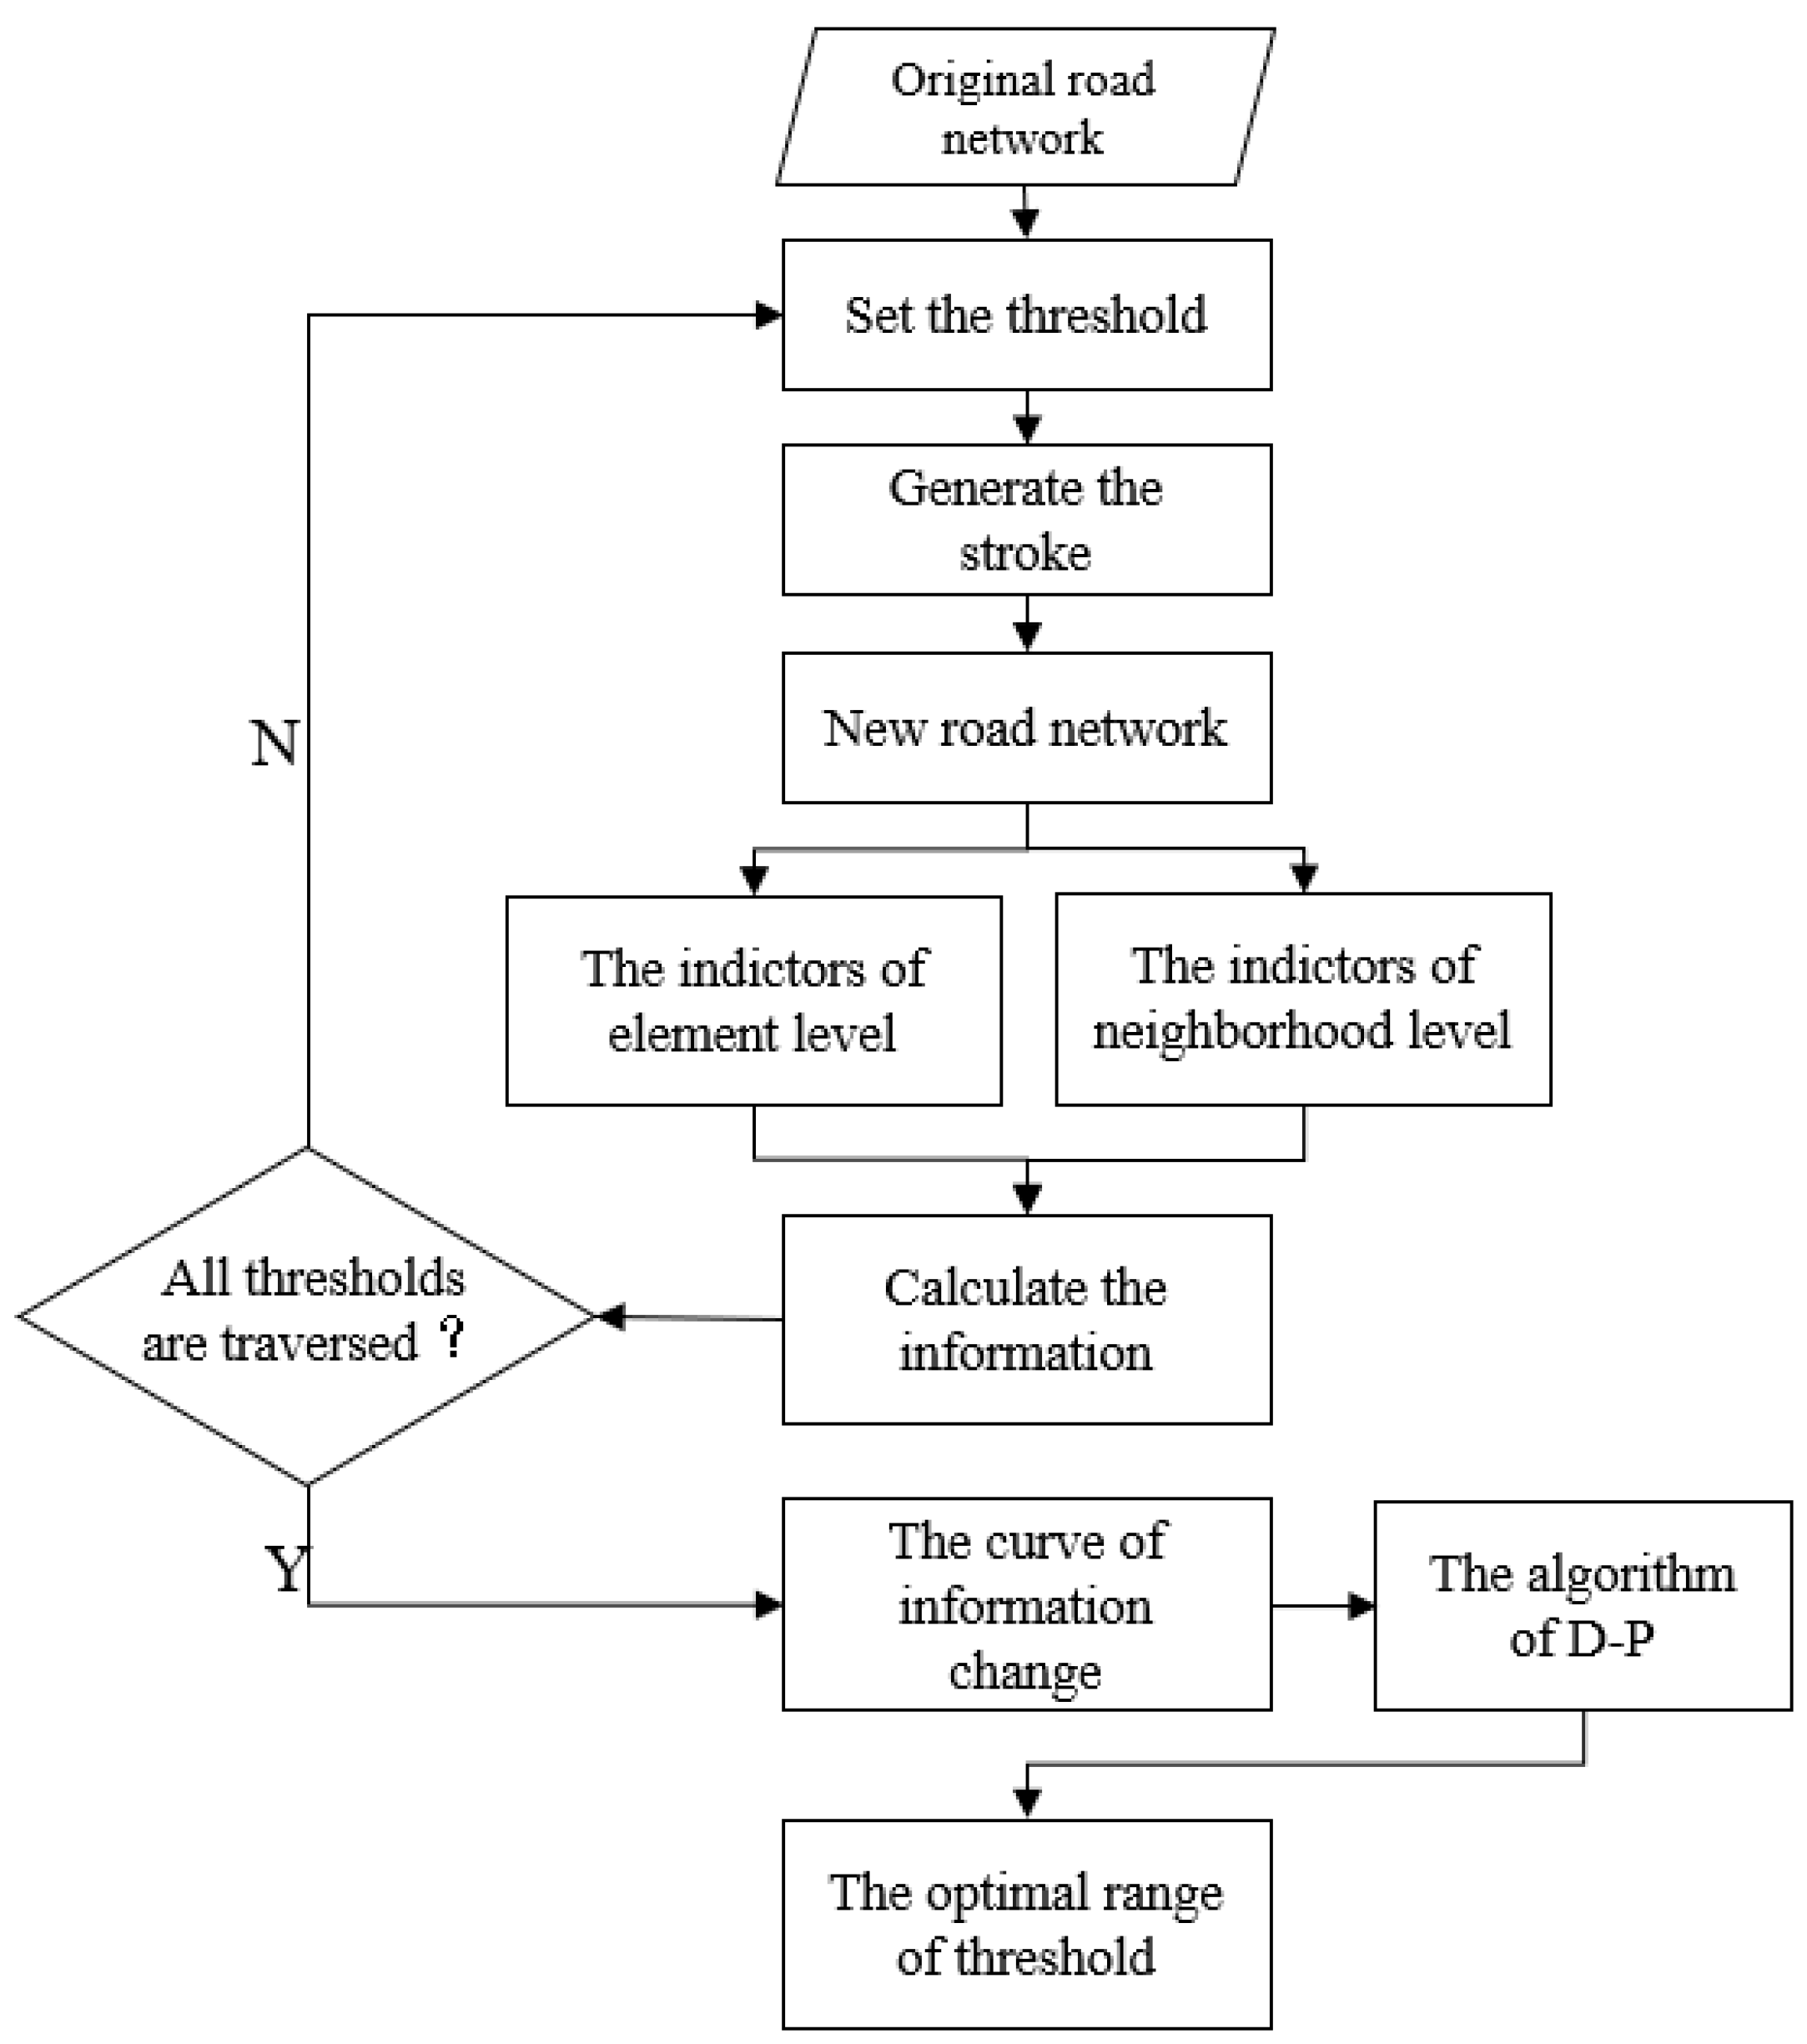
This paper relies on the above to introduce an information volume technique that quantitatively describes changes in each stroke’s geometric and structural properties under different angle thresholds at both the element and neighborhood levels. The flow chart of this method is shown in Figure 1 and the algorithm steps of this method are as follows:
- (1)
- Set the initial angle threshold, threshold = 1°;
- (2)
- According to the angle threshold, merge segments into strokes and the new road network will be generated;
- (3)
- Select indicators of information volume and, under the new road network, calculate the information volume of both road network elements and neighborhood levels;
- (4)
- If the threshold is greater than 90°, perform the step (5). Otherwise, set threshold = threshold + 1°, and repeat the step (2)–(4);
- (5)
- Draw the road network’s information volume curve under different angle thresholds and simplify the curve using the Douglas-Peucker algorithm, to determine the optimal angle threshold range for generating strokes in a specific road network.
2.2. Generating Strokes
Strokes are composed of a set of road segments grouped together using the principle of optimal continuity. Stroke generation algorithms include connection rules and strategies: The former determine whether road segments can be connected while the latter specify how they are connected.
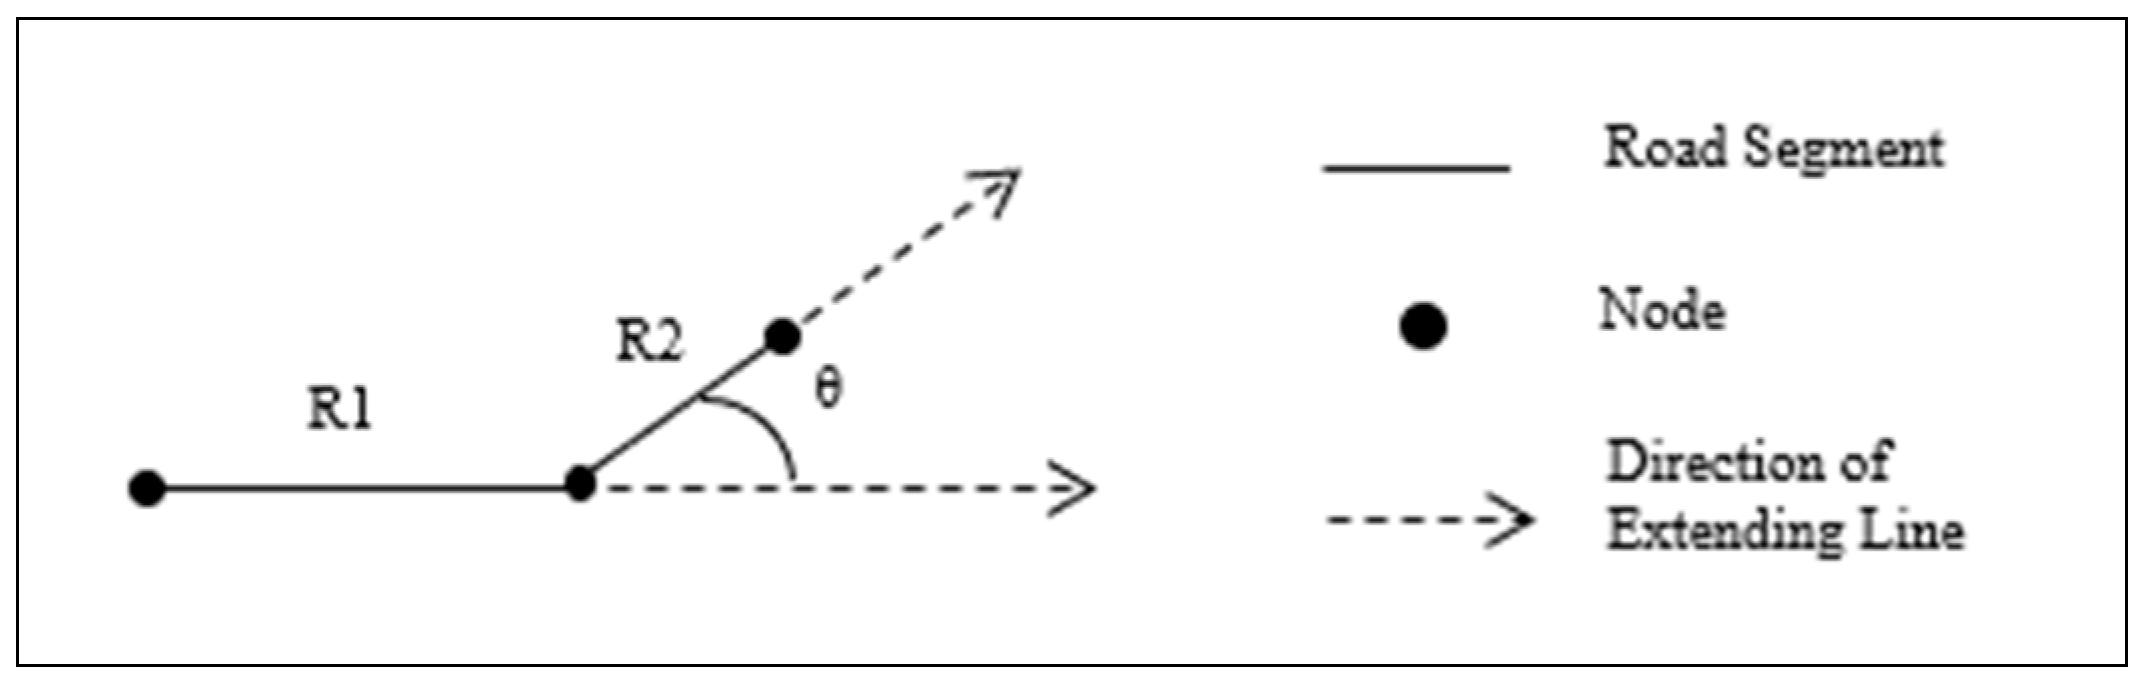
Connection rules include geometric rules, attribute rules, and a mixed rule that considers both geometry and altitude. However, in practical applications it is difficult to collect complete road attributes, such as road rank and name, while geometric information can be directly obtained from road networks. As such, most studies use geometry as a connection rule to constrain stroke generation. According to Tian et al. [17], many of these use Gestalt’s “good continuity” principle as a guide to establishing geometric rules. Since this principle relies on human visual perception, it is difficult to quantify; nevertheless, road segments’ deflection angle is often used only as an indicator of connection rules [4,18]. When relying on this method, two road segments are considered connected when their deflection angle, or the degree of deviation (0–180°) between two linked road segments is less than a specified threshold (Figure 2).
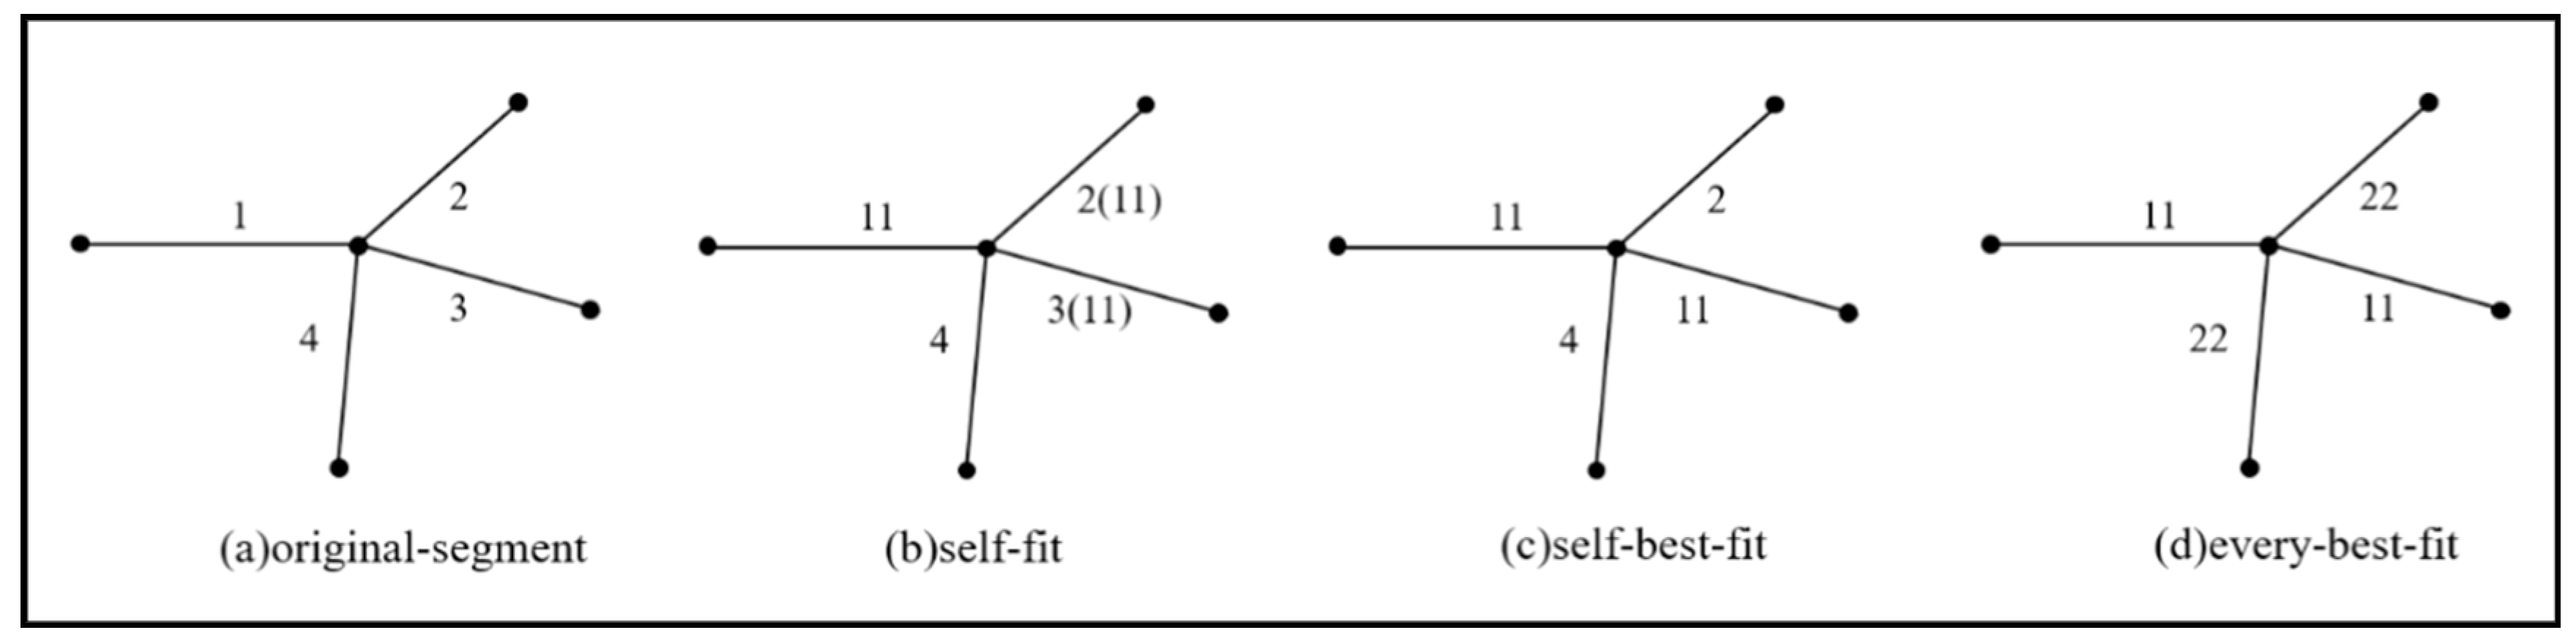
Connection strategies, meanwhile, involve the arbitrary choice of an initial road segment, and the angle threshold is then used to determine whether any connected segments can be merged. There are usually two aspects to such a method. First, how the initial segment is determined, and second, how to choose which segment with which to connect it if it is connected to several other segments. There are three commonly used connection strategies: self-fit, self-best-fit, and every-best-fit [11] (Figure 3). In self-fit, the researchers first identified the initial Segment 1. Then, the connected angles of all segments connected with Segment 1 are calculated. Finally, from these connected angles, a segment whose connected angle is less than the angle threshold is randomly selected for merging. In Figure 3b, for example, Segments 2 and 3 are both eligible for connection. In the self-best-fit method, researchers select the segment with the smallest deflection angle from Segment 1 to connect. In Figure 3c, this would be Segment 3, meaning that Segments 1 and 3 would be merged into a new stroke. The every-best-fit methods merges the pair of segments with the smallest deflection angle. In Figure 3d, the deflection angles between Segments 1 and 2, 1 and 3, and 2 and 4 are smaller than the angle threshold. Of these, Segments 1 and 3 have the smallest deflection angles, meaning that these two are merged into a new stroke.
The above descriptions demonstrate that the self-fit connection strategy has a strong randomness, and the results obtained from it are also uncertain. The every-best-fit connection strategy is more objective: It considers the intersection of segments as the object. However, this method requires the calculation of the deflection angle for each pair of segments connected by an intersection, meaning it is not very efficient.
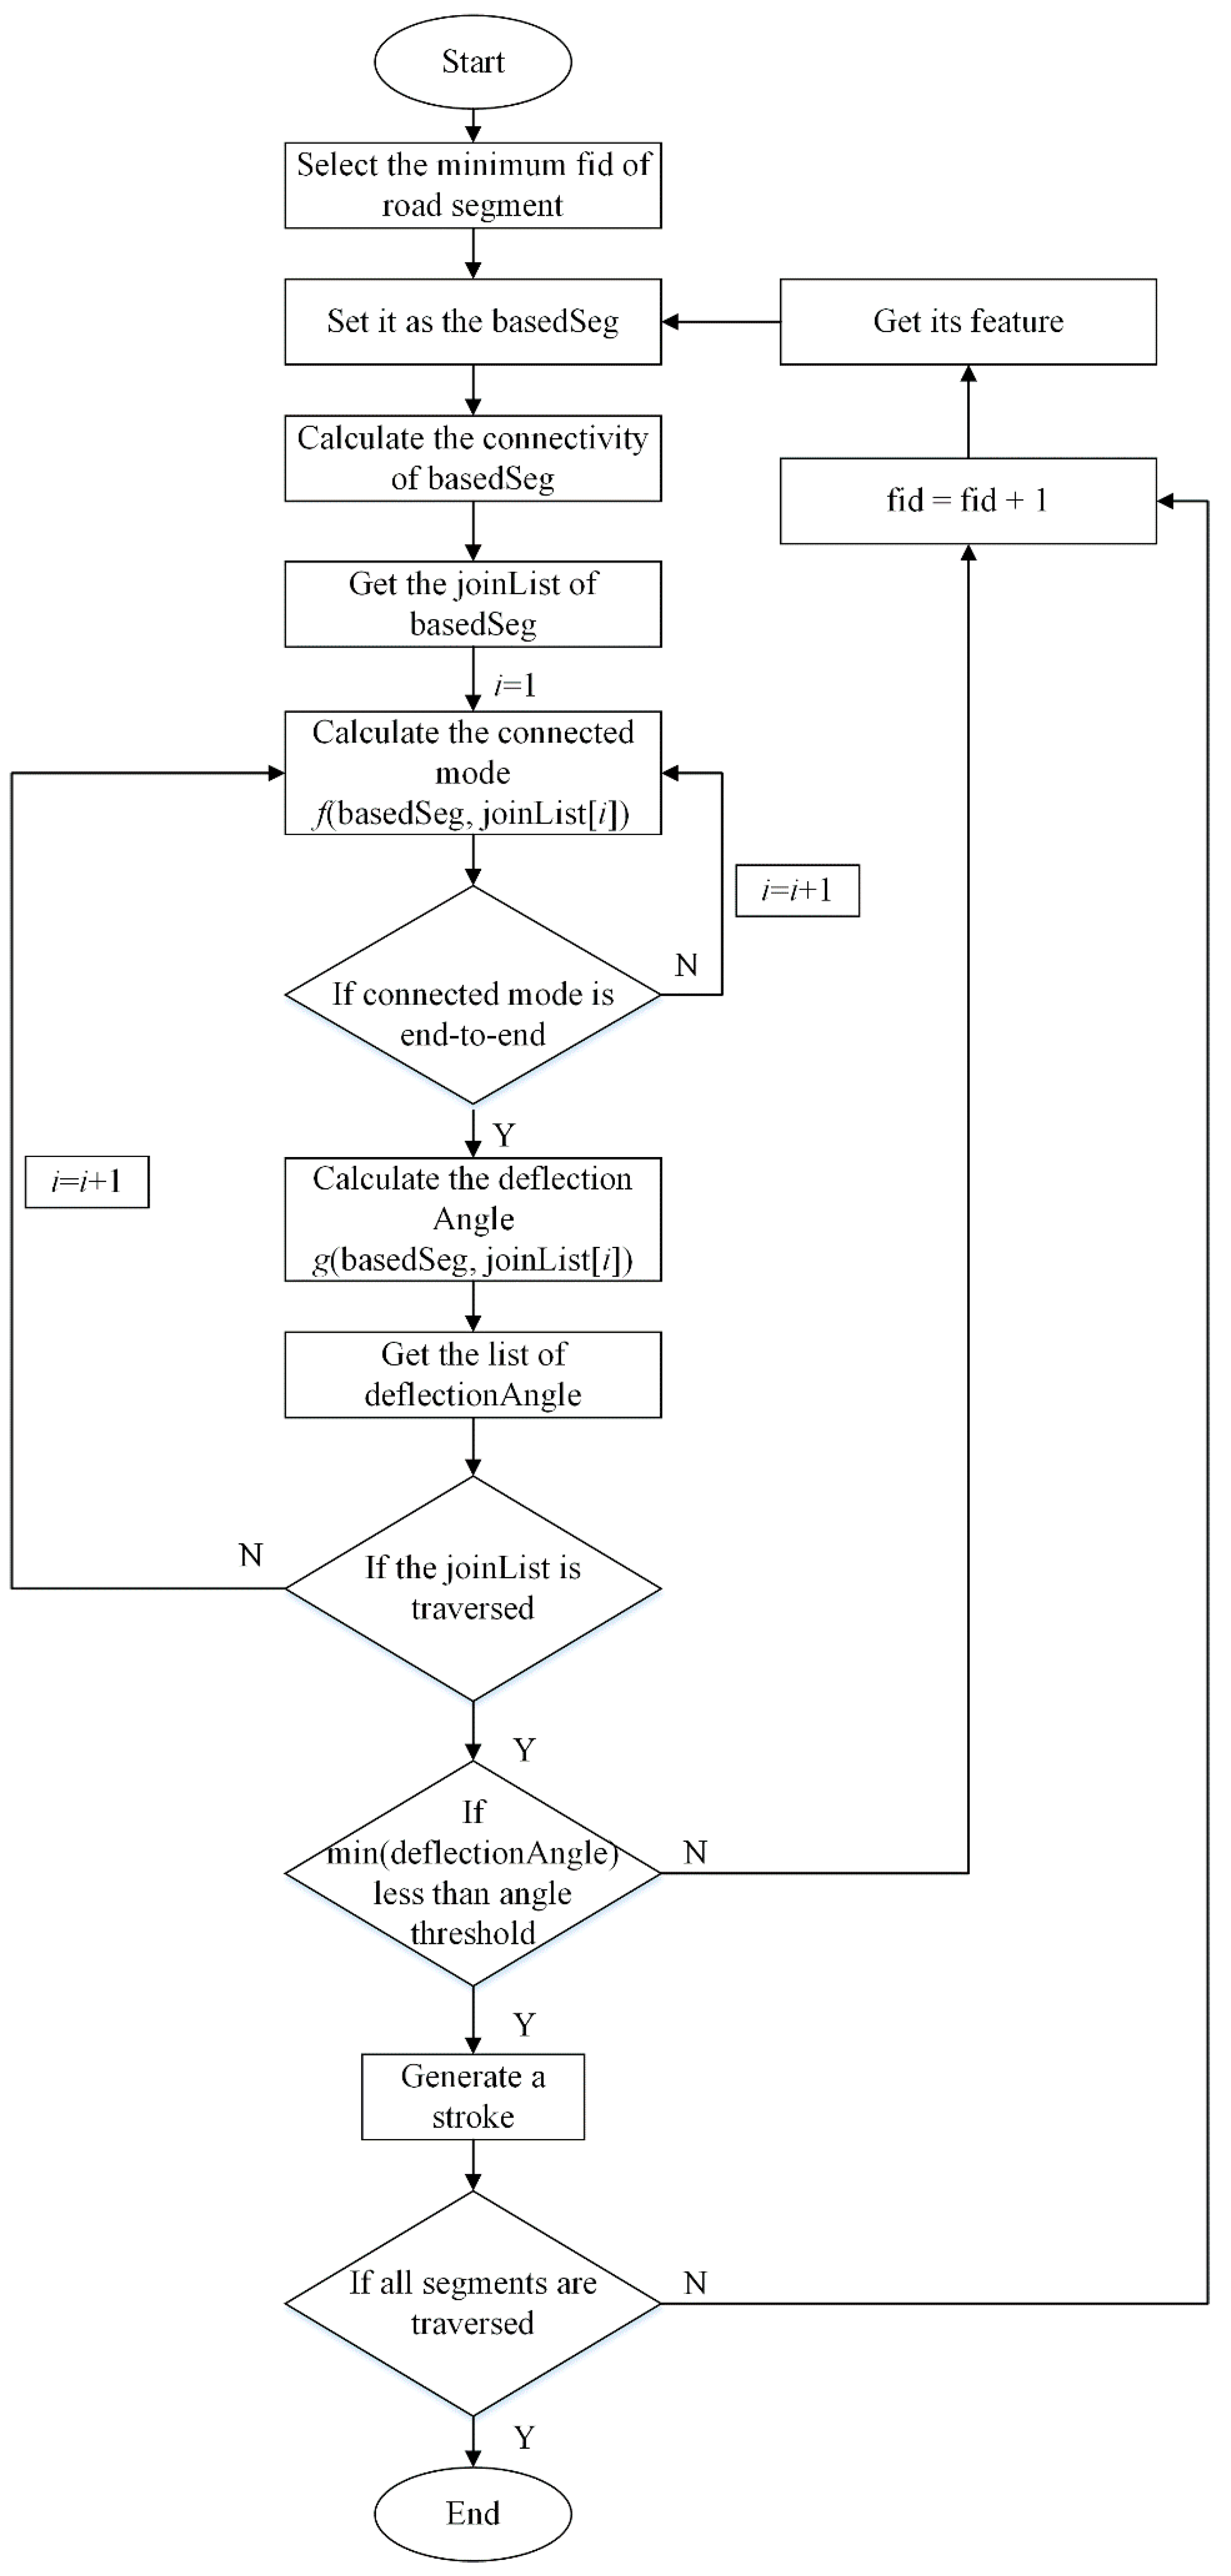
Therefore, in order to maintain road networks’ continuity, this paper relies on the self-best-fit connection strategy and furthers stroke generation by improving this strategy’s computational efficiency. To this end, we develop an improved algorithm (Table 1, Figure 4), using the following steps:
- (1)
- Add attribute FID (a randomly generated, continuous natural number) to road network data and sort in descending order. FID is then used to determine the base segment. The deflection angle for a given segment is only calculated when its FID is smaller than that of the base segment in order to avoid repeat calculation of connected segments;
- (2)
- Calculate each segment’s connectivity and judge the connected mode (only calculate the deflection angle of end-to-end connected modes). This method effectively avoids traversing the whole road network when calculating the deflection angle of each segment;
- (3)
- Obtain the list of connected segments and select the qualified segments to calculate the deflection angle;
- (4)
- Choose the minimum deflection angle. If the value is less than the angle threshold, generate a new stroke.
2.3. Calculating Road Network Information Volume
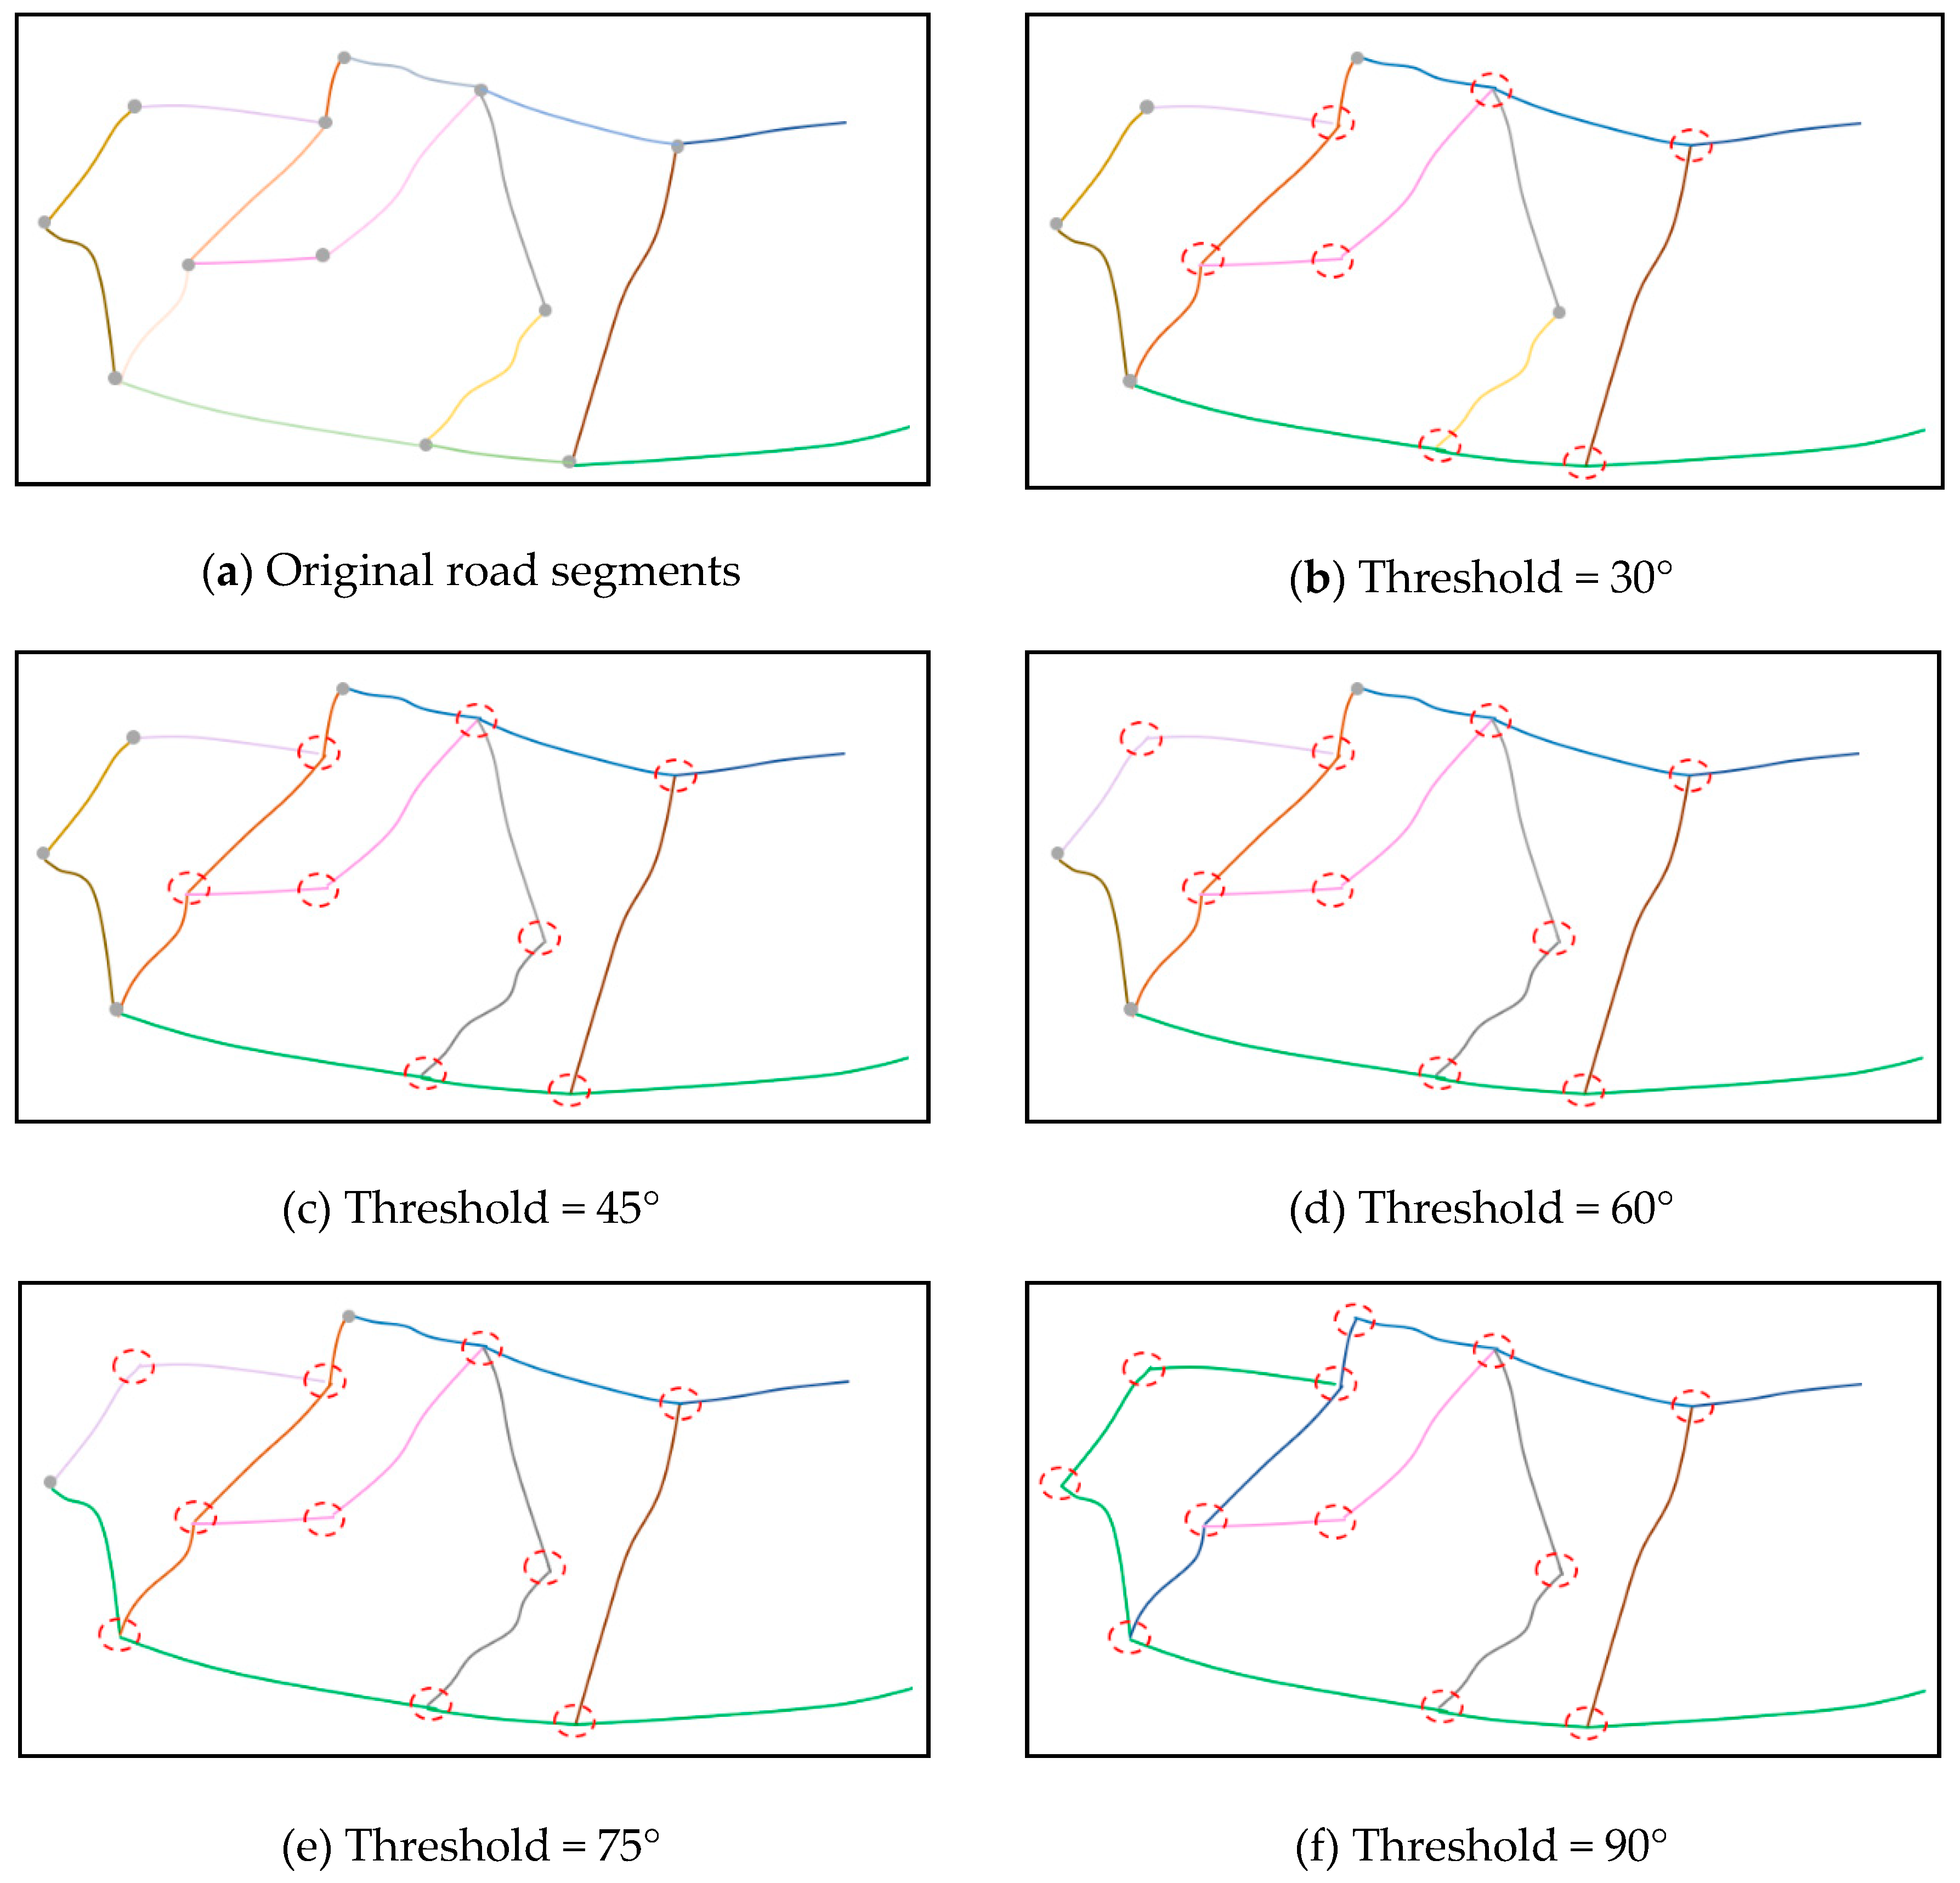
As stated earlier, map information comes from the diversity of elements and their distribution characteristics. Similarly, road network information comes from the difference in strokes’ number, shape, and structure under different angle thresholds, an example of which is shown in Figure 5. In Figure 5, the red circles show connected segments with a deflection angle less than the angle threshold. These segments are merged into new strokes, the numbers of which are shown in Table 2.
Shannon [19] introduced probability to study the measurement of information amount. He believed that information comes from the uncertainty of information, and proposed the concept of information entropy to represent the average information amount contained in information source [11]. Subsequently, Sukhov [20,21] first introduced information theory into cartography and used it to measure the diversity of map symbols. However, the information entropy theory is based on the probability of map symbols: if the probability of two map symbols is the same, their information volume will be the same. The traditional information entropy model will not reflect differences between map symbols, meaning that is not suitable for calculating road network information in our study. We therefore adopted a metric model based on spatial characteristics [22] that takes into account differences in strokes’ spatial distribution characteristics. We used each stroke’s corresponding spatial characteristics as the measurement index in order to measure its information volume:
where is the measurement index expressing the stroke’s geometric and structural characteristics, such as the length and connectivity of the stroke. And is the information volume under different angle thresholds.
Human spatial cognition is hierarchical and moves from the macro (global) to micro (local) levels [13]. The same is true for cognition of road networks. The macro level involves elements’ spatial distribution, the micro focuses on the topological connections between linked elements, and a third level, the element, concentrates on elements’ geometric properties. Figure 6 provides an example of this using Wuhan, China’s road network as an example. Figure 6a shows the macroscopic characteristics of the road network, or its overall spatial distribution characteristics: Scale and distribution density. Figure 6b shows the network’s mesoscopic characteristics, or the topological relationships among roads at the neighborhood level, including their connectivity. Finally, Figure 6c, focuses on microscopic characteristics, mainly the roads’ the geometric shape and overall length. If the angle threshold changed, the scale and distribution density of the overall road network (Figure 6a) would not change; however, the geometric shape and topological structure of each stroke would. Therefore, this paper focuses on the neighborhood and element levels to understand changes in road network information. More precisely, we focus on the geometric characteristics of roads at the element level and the spatial relationship between roads at the neighborhood level.
At the element level, the amount of information for each stroke depends on its geometric features, which are directly affected by the stroke length, which in turn differs according to the different angle threshold. The greater the difference in length depending on the angle, the greater the amount of information generated. At the neighborhood level, the amount of road network information comes from the topological relationship between linked segments. Based on the complex network characteristics of road networks, this paper constructs a dual graph of the original roads and chooses the degree, betweenness, and closeness of each stroke to measure the topological relationship between strokes. Similarly, the topological relationships between strokes are different under different angle thresholds: the greater the difference in topological relationships, the greater the difference in the amount of information produced. Table 3 provides our specific calculation methods of measurement indicators.
At the element level, different road networks have different structures, which results in different indicators having different impacts. Therefore, it is necessary to assign each indicator a corresponding weight. There are both objective and subjective methods for determining these weights. Among the latter are the analytic hierarchy process (AHP) [23], the Delphi method [24], etc. Such methods usually require researchers to score each attribute; although they are mature methods, they have poor objectivity. Objective methods, meanwhile, include the coefficient of variation method, the rough set [25,26], etc. When determining weights using rough sets, data must be discretized, and the weights obtained under different discretization methods differ. The coefficient of variation method can better measure the degree of difference between indicators. As this paper needs to measure the difference in road network information under different angle thresholds, we dynamically calculate the weight of each measure index in different road network using coefficient of variation, as follows:
where is the weight of indicator i, is the coefficient of variation of indicator i, is the standard deviation of indicator i, and is the average of indicator i.
At the same time, in order to eliminate the influence of road scale on the calculation results, we develop a standardization process for evaluation indictors using the following equation:
where is the measure value of jth stroke of ith indicator, is the standardized information volume of jth stroke of ith indicator, and is the average value of ith indicator.
Finally, the amount of information contained in the indicator is calculated using the following equation:
2.4. Using Douglas-Peucker Algorithm to Determine the Angle Threshold
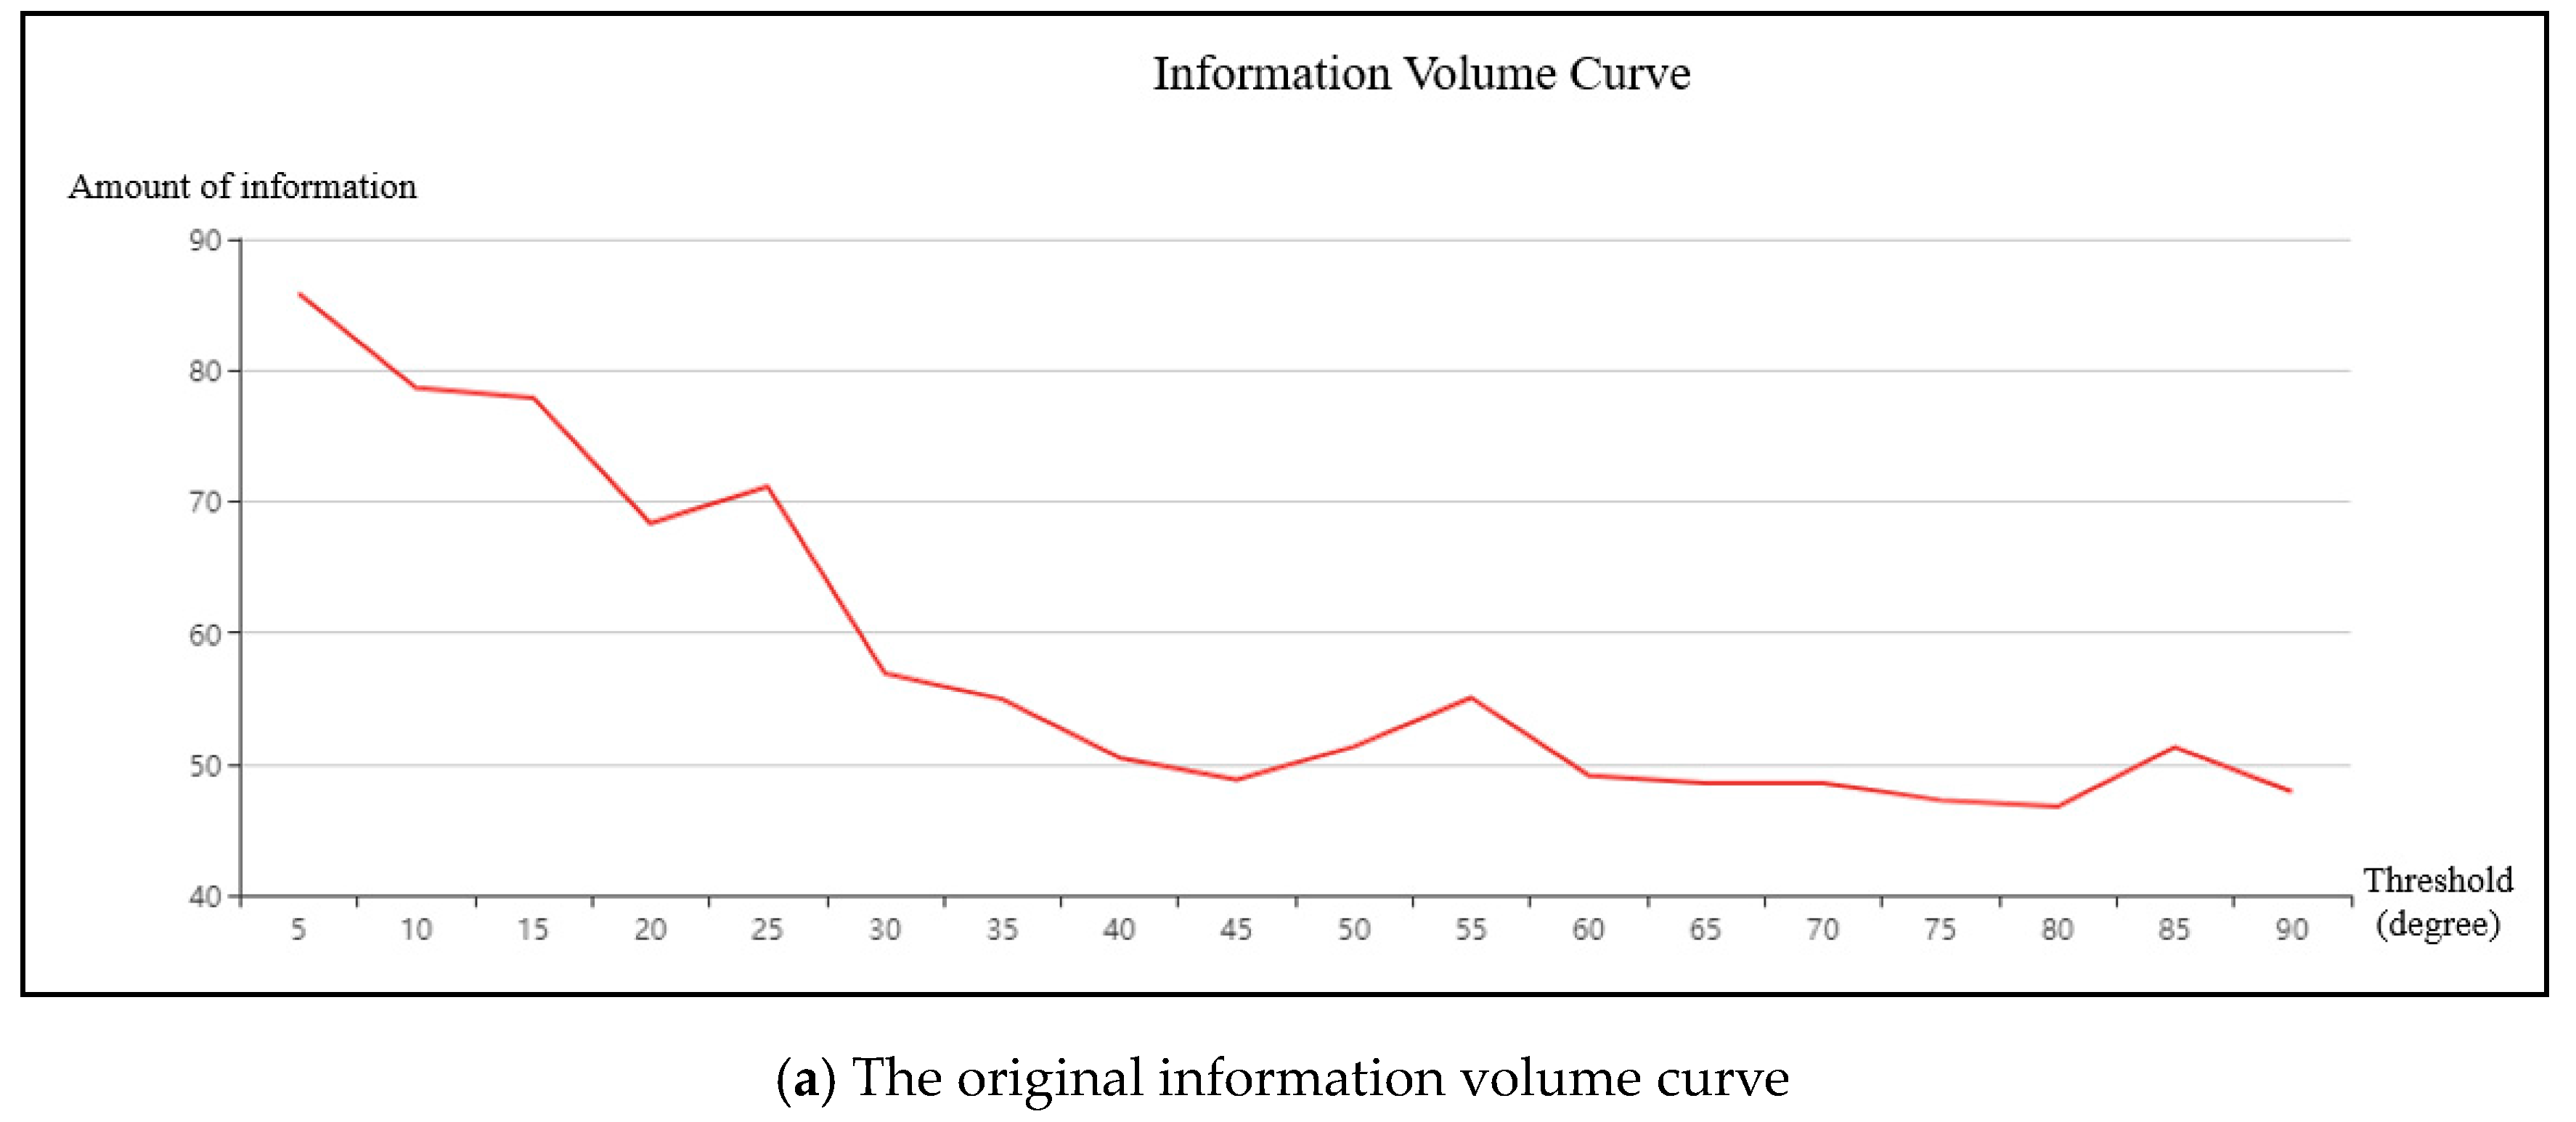
Calculating road network information as in the previous section provides us with a curve of road network information (Figure 7a). As the figure shows, the change in information is small between 40–45° and 60–80°, when the angle threshold interval is 5°. This makes it difficult to determine the optimal angle threshold visually. Moreover, to accurately determine the optimal angle threshold it is often necessary to set the angle threshold interval at 1–2° rather than 5°. This results in more angle threshold ranges and smaller changes; it is therefore necessary to simplify the curve so as to objectively and accurately determine the optimal threshold range.
There currently exist several algorithms for simplifying curves, including the interval point method [27], angle limit method [28], vertical distance limit method [29], and Douglas-Peucker method [30]. In this study we rely on the latter; the Douglas-Peucker (D-P) algorithm is a classic strategy for simplifying line elements in cartography that can maintain the shape of line elements very well [31]. Urs Ramer was the first to propose a prototype version of the method in 1972, and David Douglas and Thomas Peucker expanded it to its current form in 1973 [31]. The D-P algorithm includes two simplified methods: fixed point and fixed distance. D-P fixed distance algorithm needs to set a distance threshold, which is used as the basis of whether to retain the current point or not. Similarly, D-P fixed point algorithm needs to determine the number of retained points in advance, and then determine which points will be retained according to the distance from the points to the line. However, typically both involve setting thresholds in advance. Because this study attempts to determine the most adequate threshold for a given road system, we cannot rely on a fixed threshold. To this end, we determine the best threshold for simplifying the curve of a given road network as follows:
- (1)
- Set the threshold of D-P fixed point and D-P fixed distance algorithm, and use the two algorithms to simplify the information curve;
- (2)
- Calculate the slope between two adjacent points on the simplified line and sort the slopes. The two points corresponding to the minimum slope are the optimum threshold range for generating stroke;
- (3)
- Count the values and frequencies of the optimum angle threshold range under different tolerance which got by D-P fixed point and D-P fixed distance algorithm respectively. In the construction of stroke, the range of angle threshold with the highest frequency is the optimum range of angle threshold of the road network.
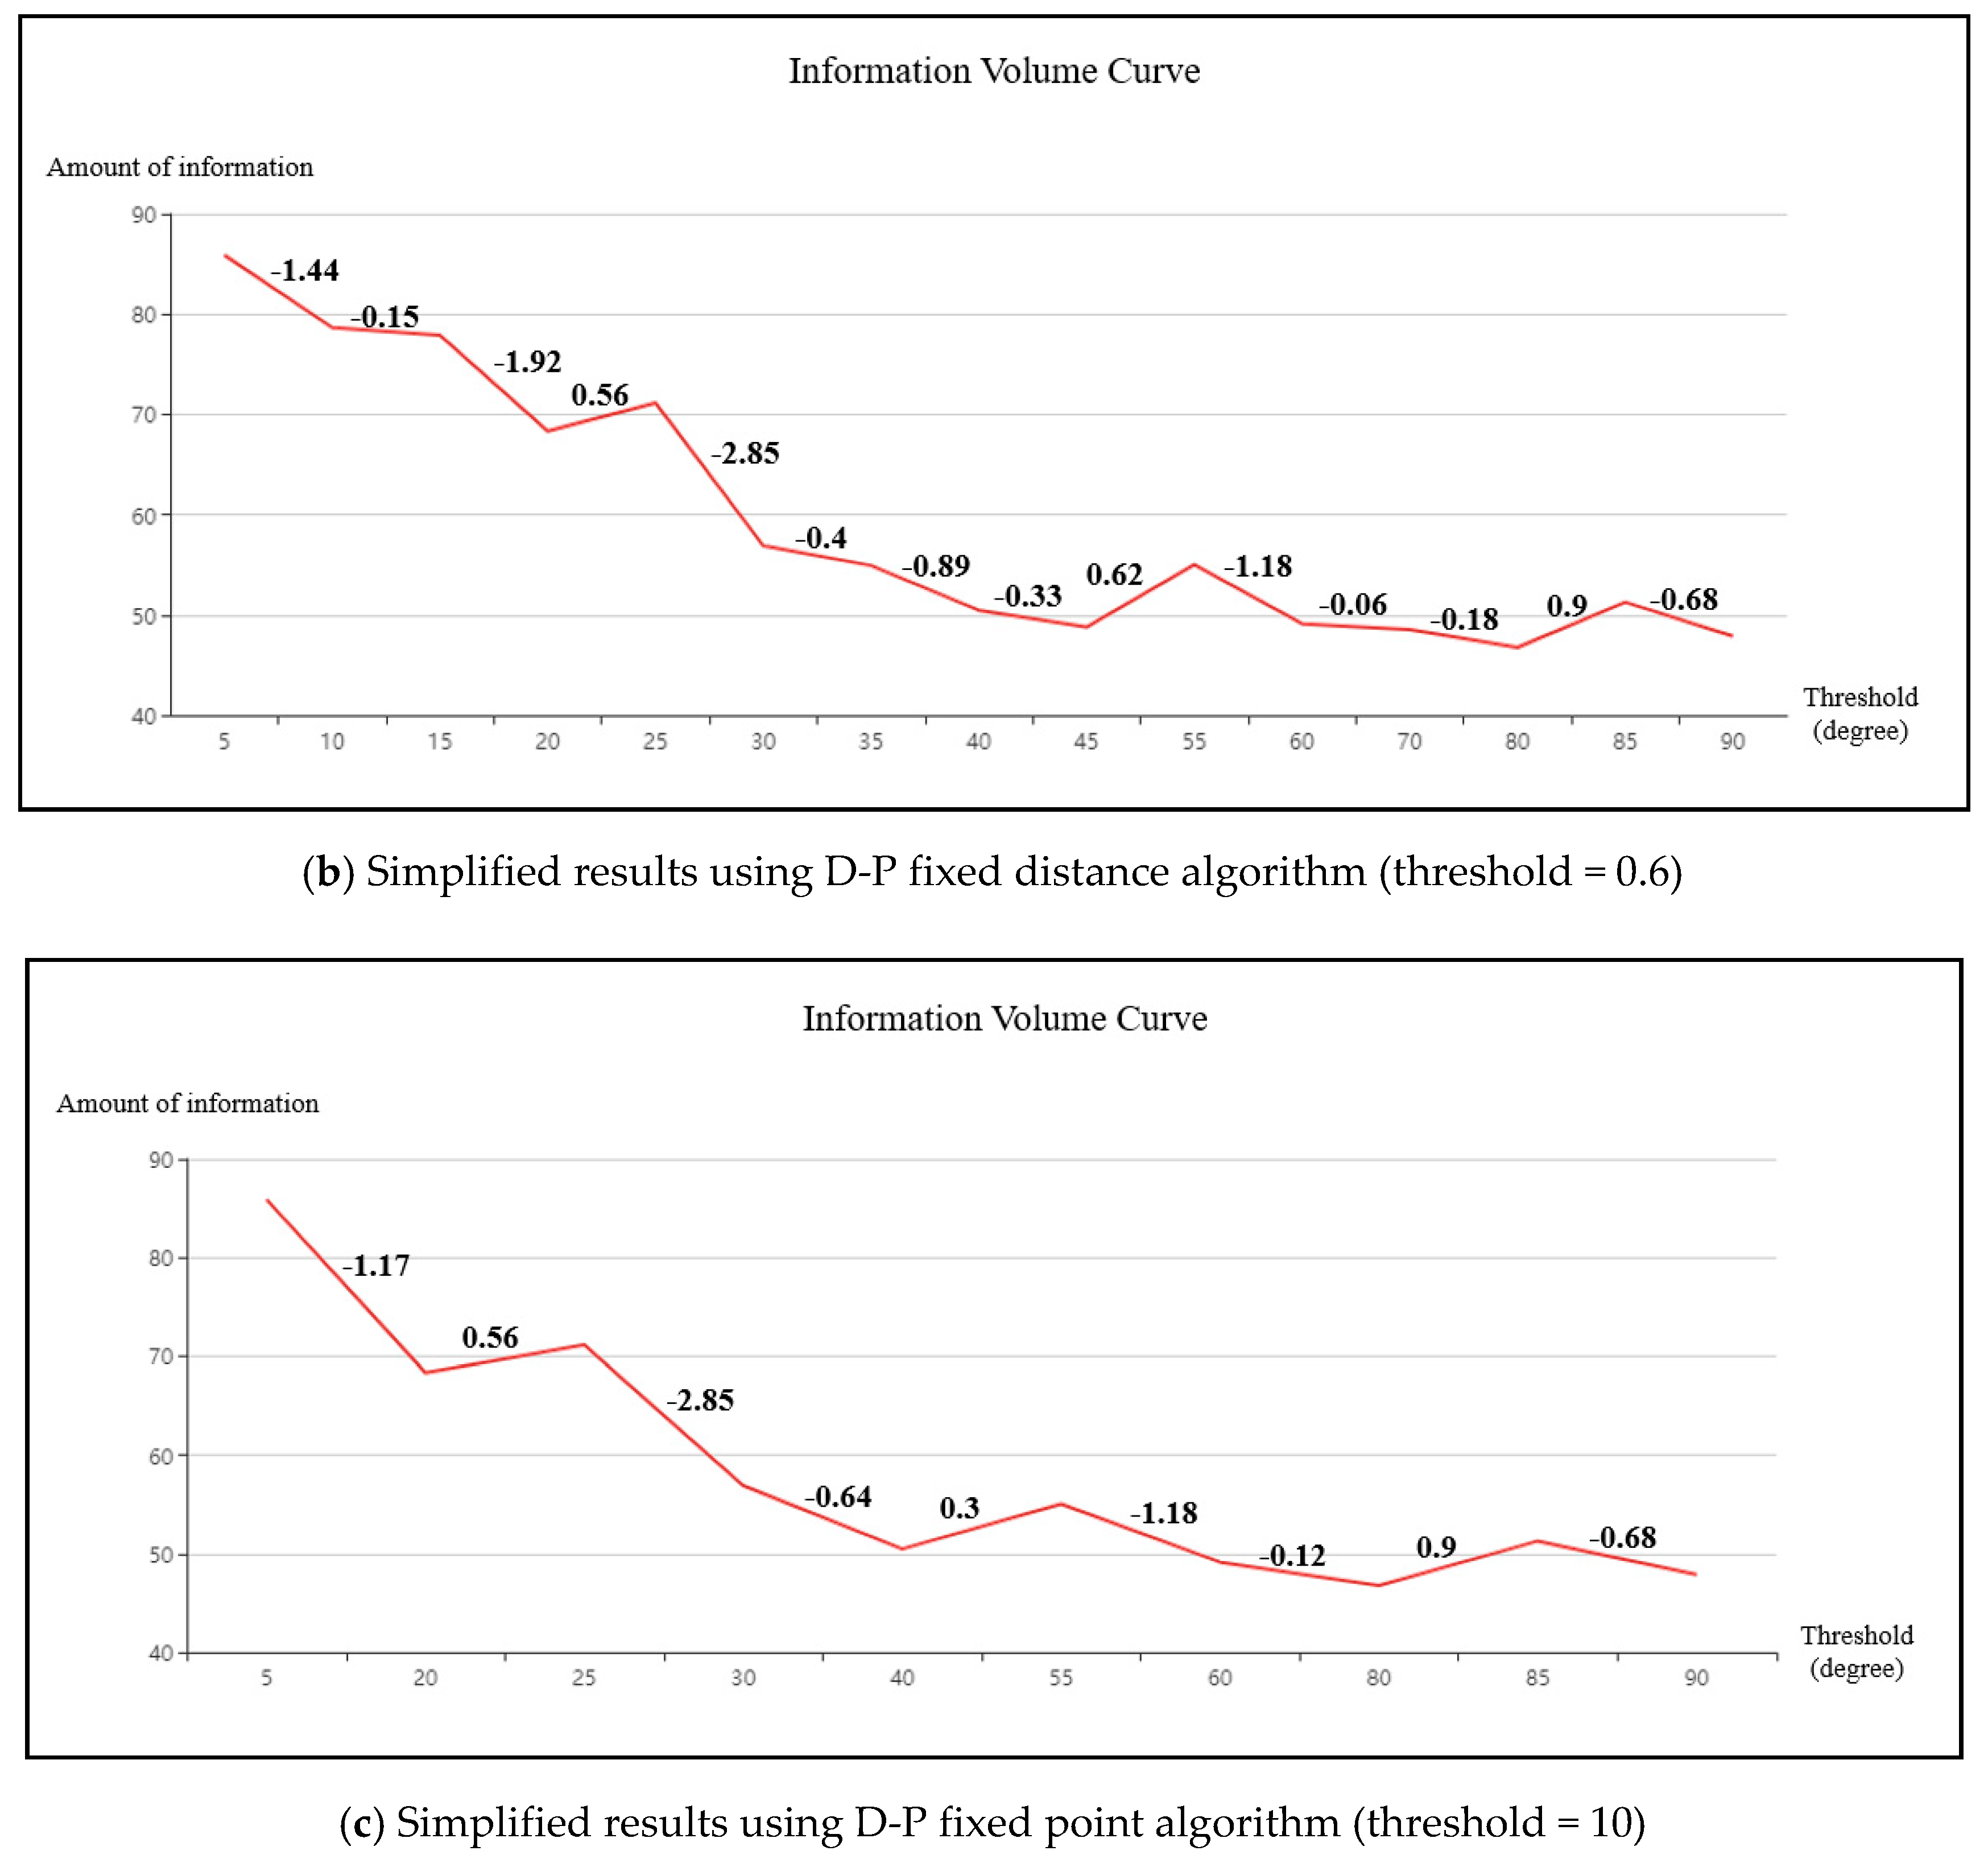
Figure 7b,c show the simplified version of the curve in Figure 7a obtained using the D-P fixed point and distance algorithms when the threshold is 0.6 and 10, respectively. According to Figure 7b, when the threshold is 0.6, the optimal angle threshold range for stroke generation is 60–70°. When the threshold is 10, the optimal angle threshold range is 60–80° (Figure 7c). By counting the frequency and value of the optimal angle threshold range using the two algorithms (2 and 1, respectively), we can determine the optimal range for generating strokes in the road network: 60–70°.
3. Results
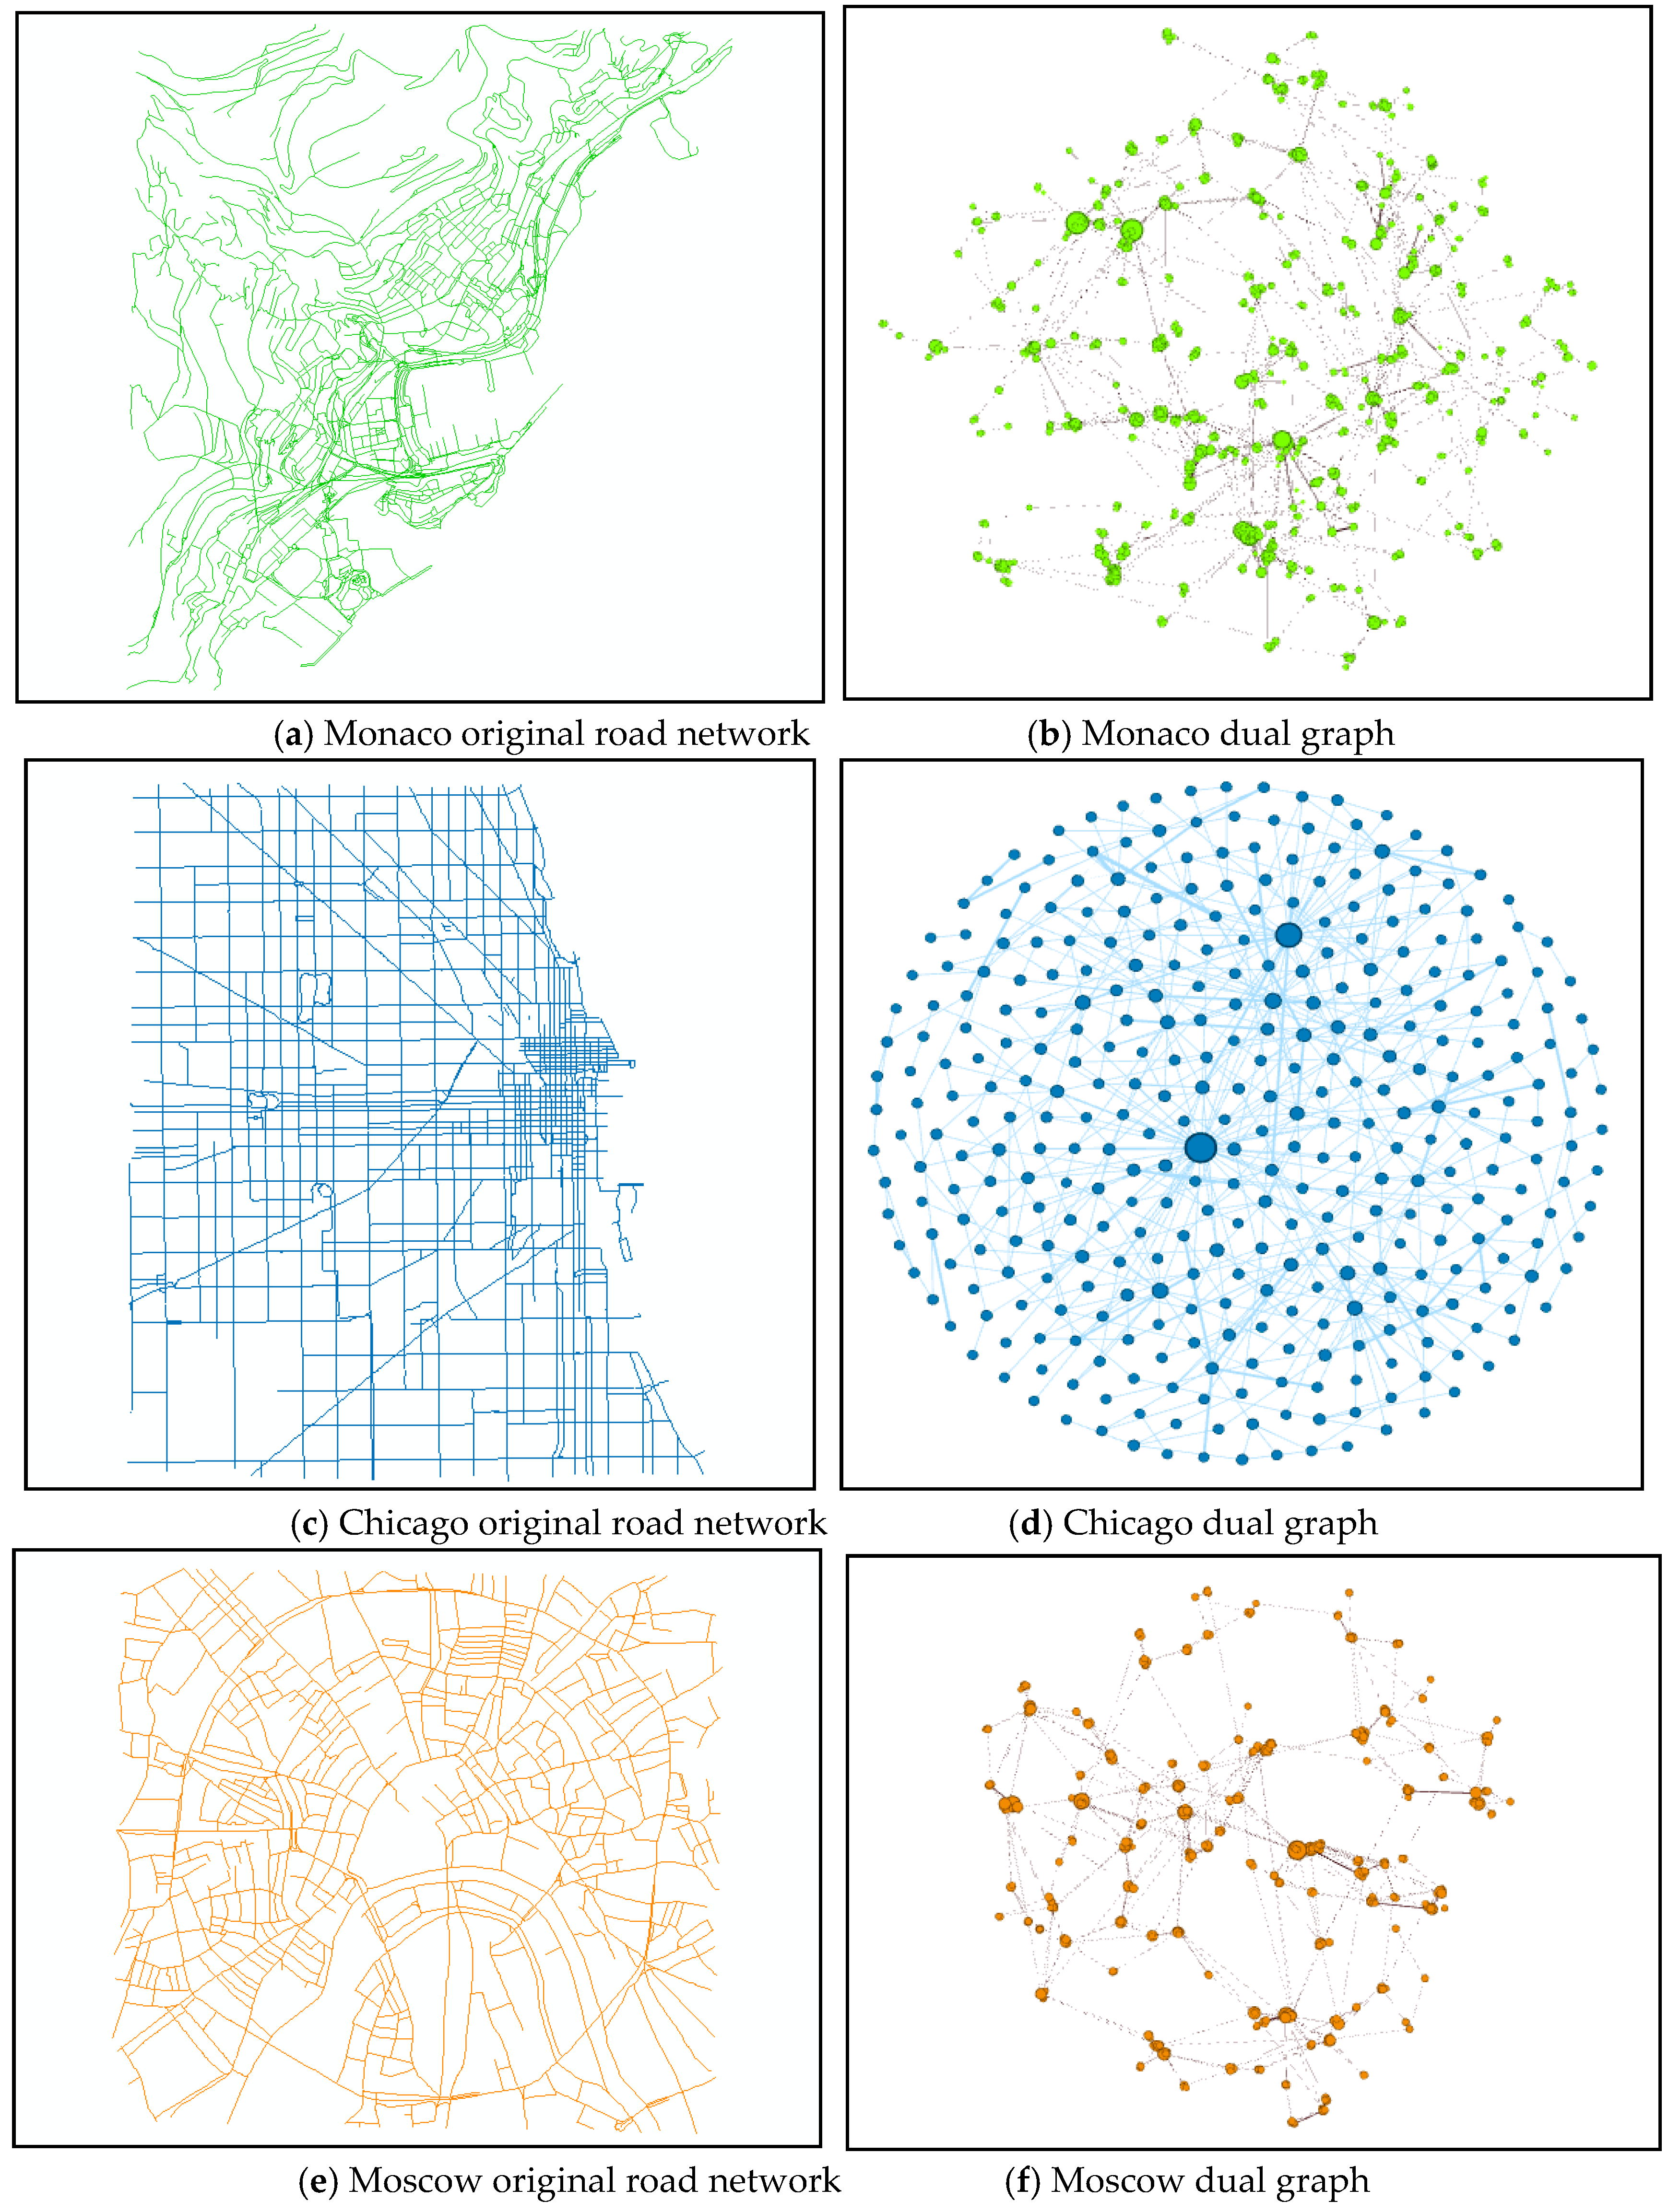
After building a model to determine the influence of angle threshold on stroke generation in different road network structures, we tested it on three road networks with typical structure characteristics: Monaco, Chicago, and Moscow. Monaco (Figure 8a,b) is a coastal country, with a “free pattern” road network greatly affected by topography. Chicago’s road network structure (Figure 8c,d is a typical “grid pattern,” while Moscow (Figure 8e,f has a “radial pattern.”
We acquired road network data from OpenStreetMap (OSM) and included data on primary, secondary, and tertiary roads (the road rank is not used in my procedure). We carried out data preprocessing for each road network, including merging segments with the same name and rank and reconstructing and checking topology (removing isolated segments). Figure 7 shows the segments of each network after this analysis: Monaco contains 1549 segments, Chicago 465 segments, and Moscow 1025 segments.
3.1. Analysis of Angle Threshold Range Results
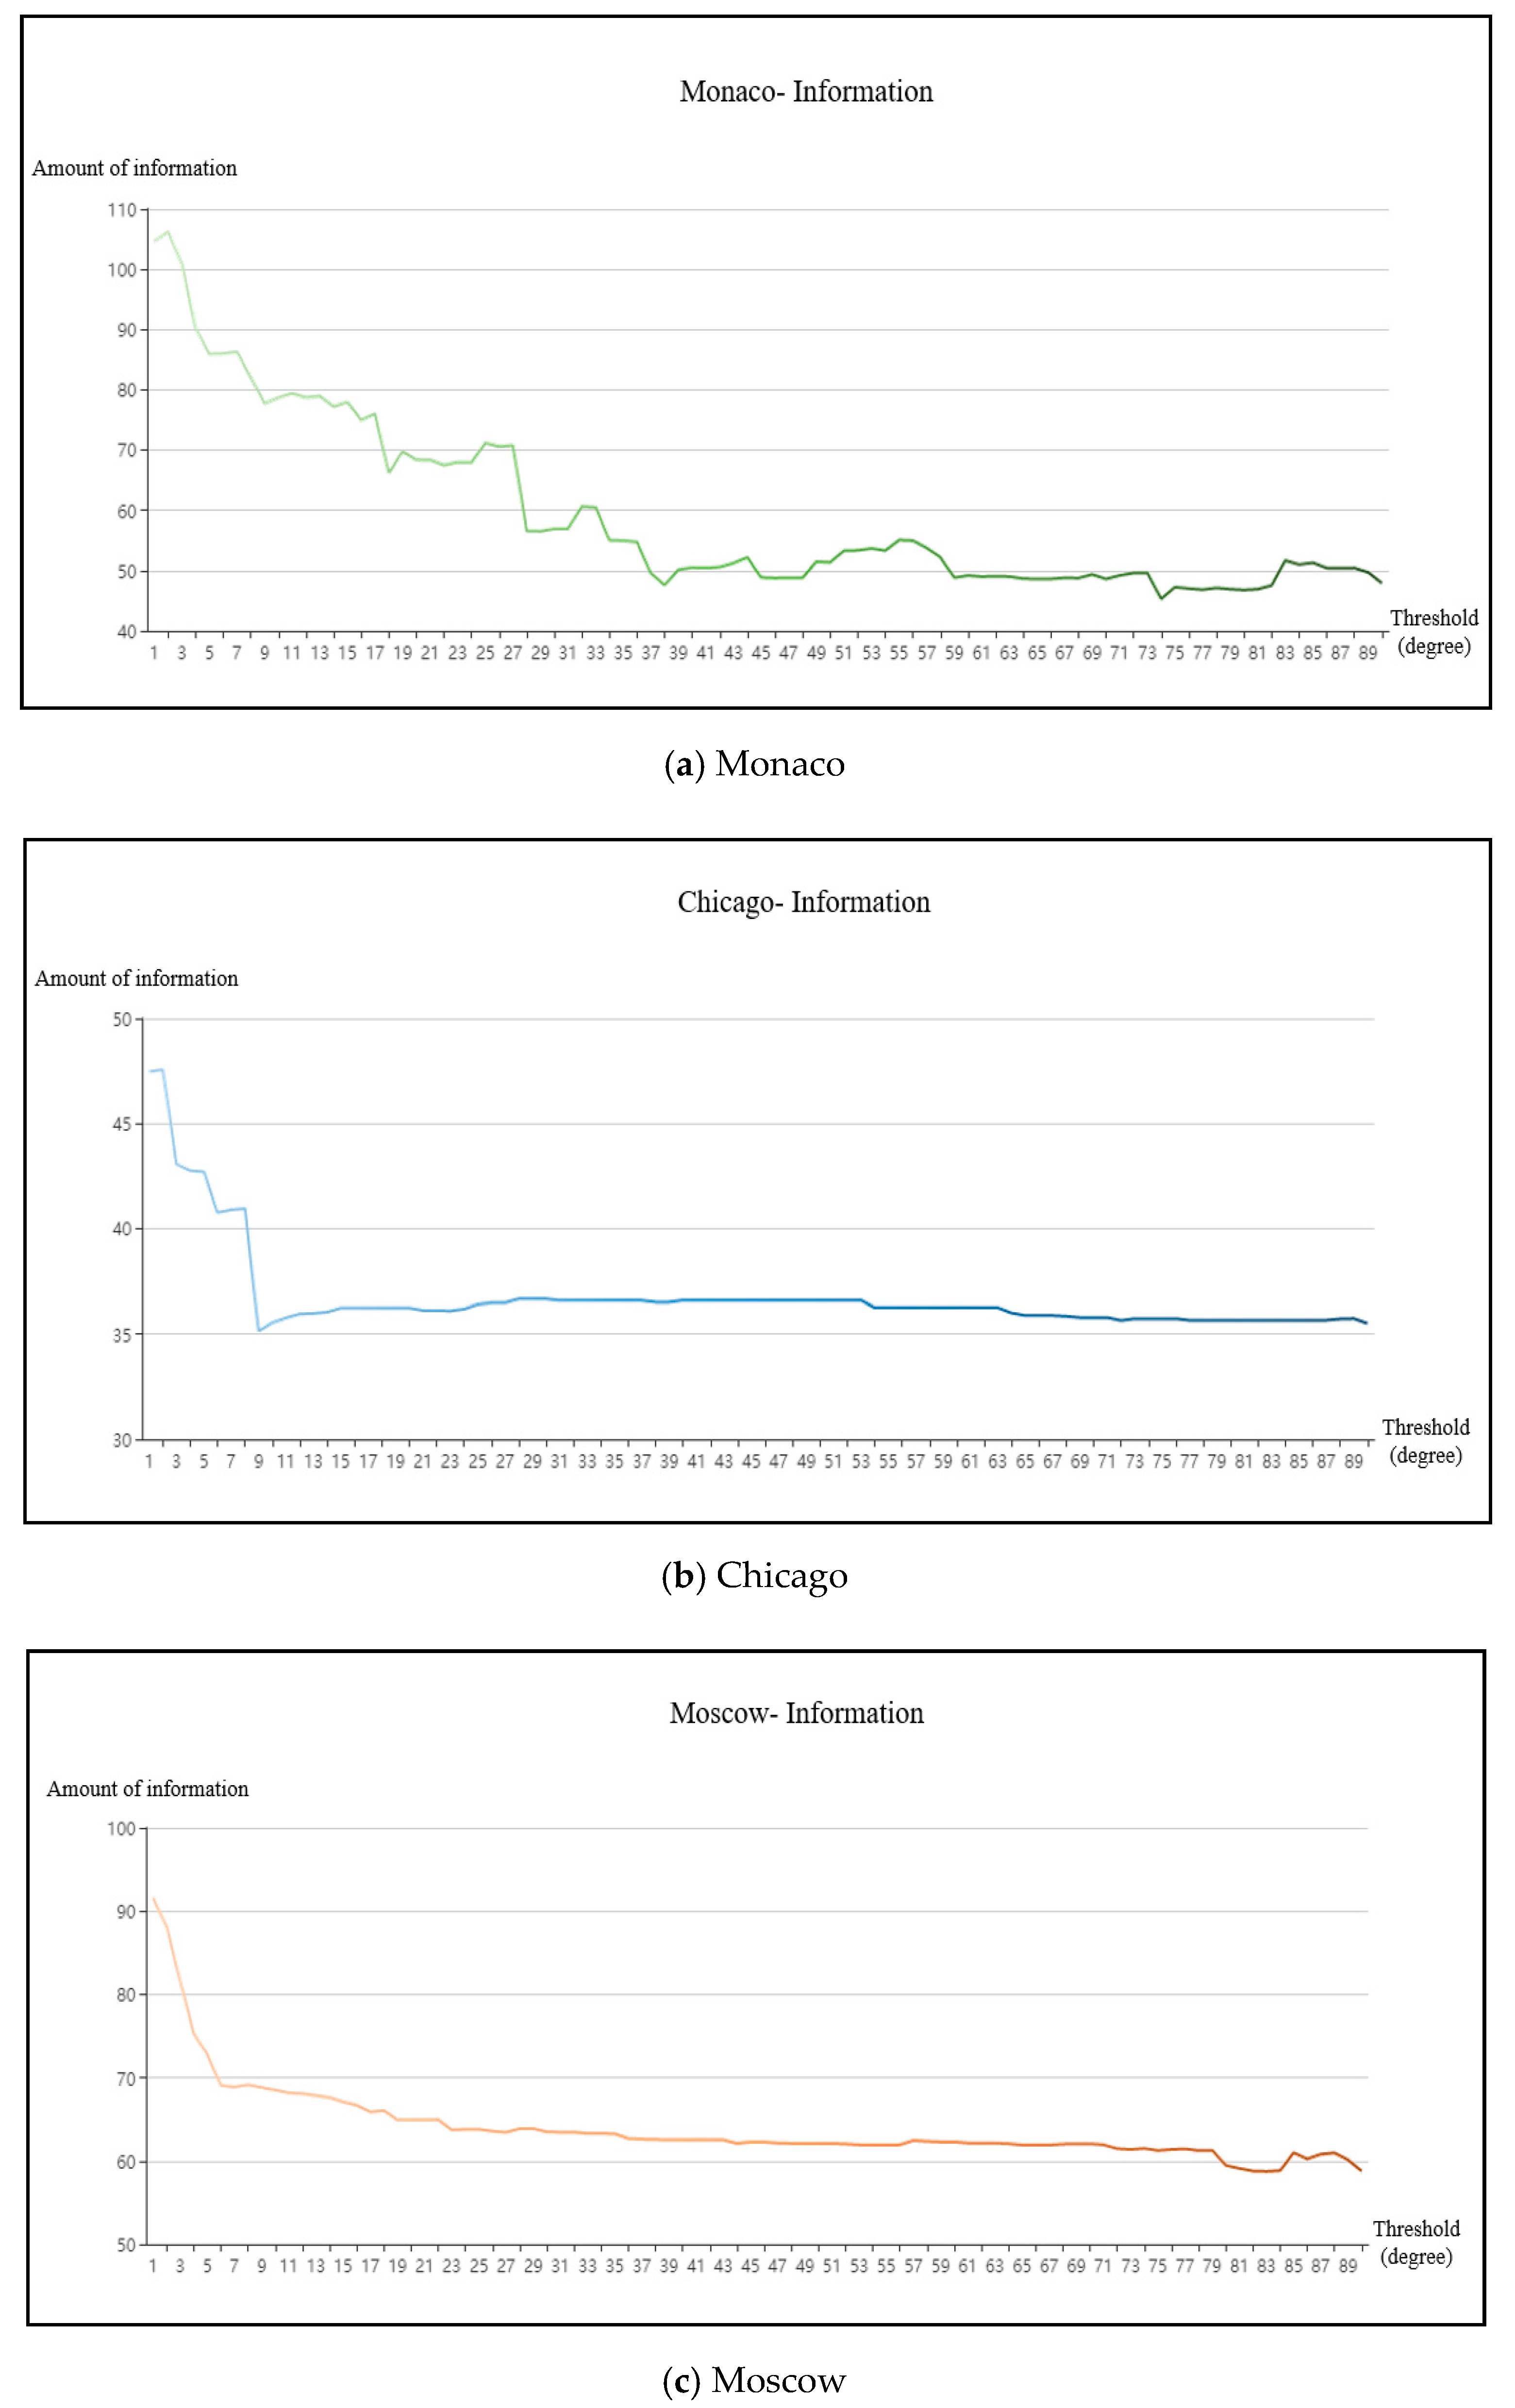
After data processing, we generated strokes and the corresponding dual graph based on different angle thresholds. The angle threshold of stroke varied from 1° to 90° with an interval of 1°. We then calculated the amount of road network information at different angle thresholds by using formula (5), and determined the information volume curves for each road network (Figure 9).
On the whole, as deflection threshold increased, the number of strokes decreased gradually, leading to an overall decrease in road network information. At the same time, due to the influence of road network morphology, each network’s changes in information were different. For example, Monaco’s information volume was most greatly affected by the angle threshold and there are frequent fluctuation in the information volume curve. The information volume of both Chicago and Moscow’s road networks, meanwhile, changes only slightly after the angle threshold exceeds 10°.
From a local perspective, the information change process can be divided into three parts. First, when the angle threshold is small, most segments that move towards the same direction are merged, resulting in a changing number of strokes and their connections and sharp decrease in the amount of information. Second, when the angle threshold reaches a certain range, there is only a slight change in the number of strokes and connections, meaning that the slope of the resulting information volume curve tends to be gentle. Finally, when the angle threshold exceeds a certain range, segments that would not be merged based on a visual analysis are merged into one stroke, leading to a great change in the number and connection of strokes and large slope of the curve.
As described in the previous section, we then simplified the information volume curves of the above road networks using the D-P fixed distance and fixed point algorithms. For the fixed distance algorithm, when the threshold ranges from 0.1 to 1 (interval = 0.1), this paper separately counts the optimum threshold range of road network’s stroke construction. For the fixed point algorithm, when the threshold varies from 20 to 80 (interval = 10), we separately counts the optimum threshold range of road network’s stroke construction. Figure 10, Figure 11 and Figure 12, show the results for Monaco, Chicago, and Moscow, respectively.
3.1.1. Determination of Optimum Angle Threshold Range of Monaco’s Road Network
As described above, Monaco’s road network is a “free pattern” influenced by the topography. The deflection angles between segments are also quite different, meaning that changes in road network information volume are obvious when determining stroke. As Figure 9a shows, linked segments with smaller angles begin to merge when the angle threshold is less than 38°, resulting in change in road connections and reduction in the number of strokes, as well as the amount of information generated by strokes. Subsequently, there is a gradual decrease in the influence of the angle threshold on road network and a number of smoothly varying deflection threshold ranges appear. The fluctuation of the information volume curve gradually decreases.
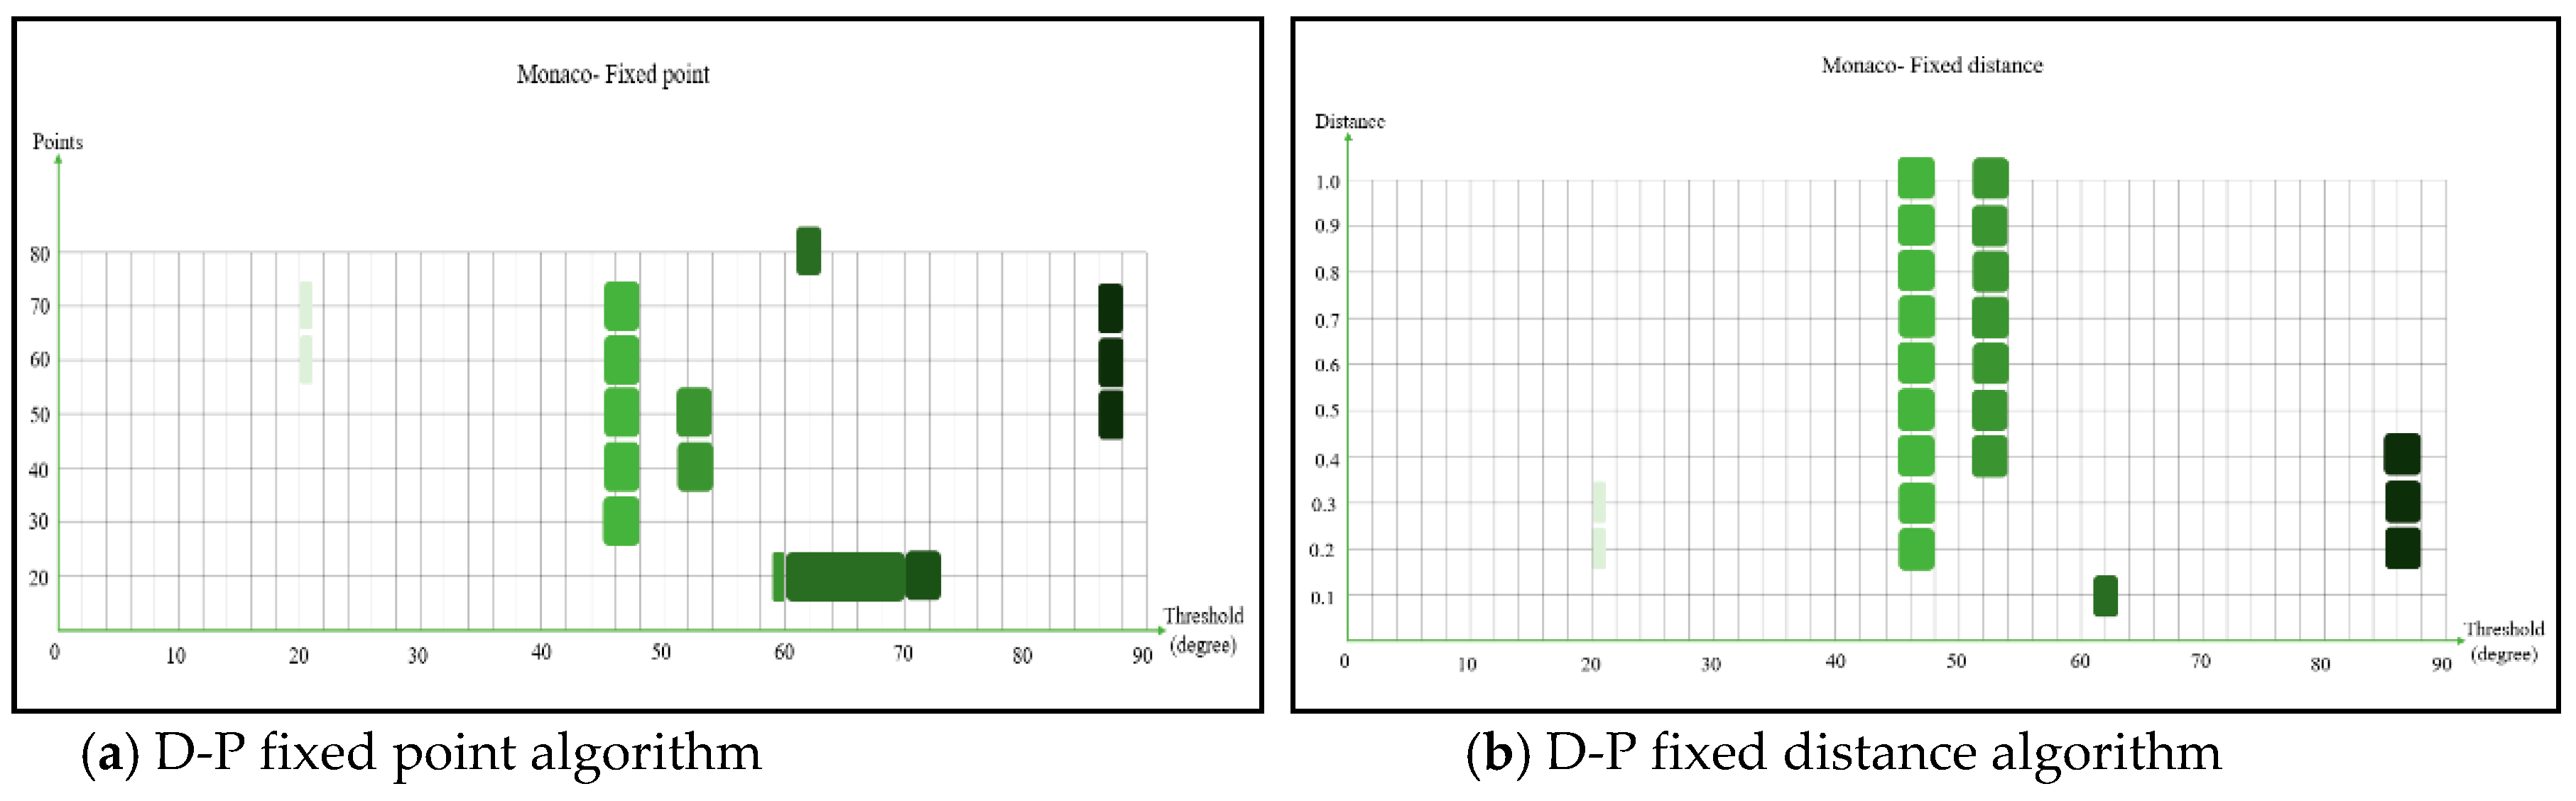
We then simplified the information volume curve using the D-P fixed point and fixed distance algorithms. Figure 10 shows the simplified results. The color of the rectangle in Figure 10 indicates the size of the threshold. The bigger the threshold, the darker the color of the rectangle. The edge of rectangle parallel to the vertical axis correspond to threshold of D-P algorithm. The edges parallel to the horizontal axis correspond to the optimum angle threshold range of stroke construction. As Figure 10 shows, even the simplified curve has more than one optimum threshold range. This is because the information volume curve fluctuates frequently under the influence of the angle threshold, and the basic principle of the D-P algorithm is to maintain the shape of the curve, including these fluctuating points, as much as possible. It is possible that the slopes between these fluctuating points are equal, suggesting more than one optimal deviation threshold range. In the case of Monaco, based on the results of our analysis (excluding some accidental and disturbing values) we concluded that the optimum angle threshold range for generating strokes in Monaco’s road network is 45–48° (Table 4).
3.1.2. Determination of Optimum Angle Threshold Range of Chicago’s Road Network
Unlike the road network built along Monaco’s coast, Chicago’s road network is a typical “grid pattern,” meaning that there is only a small difference in deflection angle between linked segments and small variation in information volume. As shown in Figure 9b, when the angle threshold is less than 10° road network segments begin to merge and the number of strokes is significantly reduced resulting in a continuous decrease in information volume. When the angle threshold exceeds 10°, the information volume of the whole road network tends to change smoothly. At this time, the optimum angle threshold range can’t be accurately judged visually.
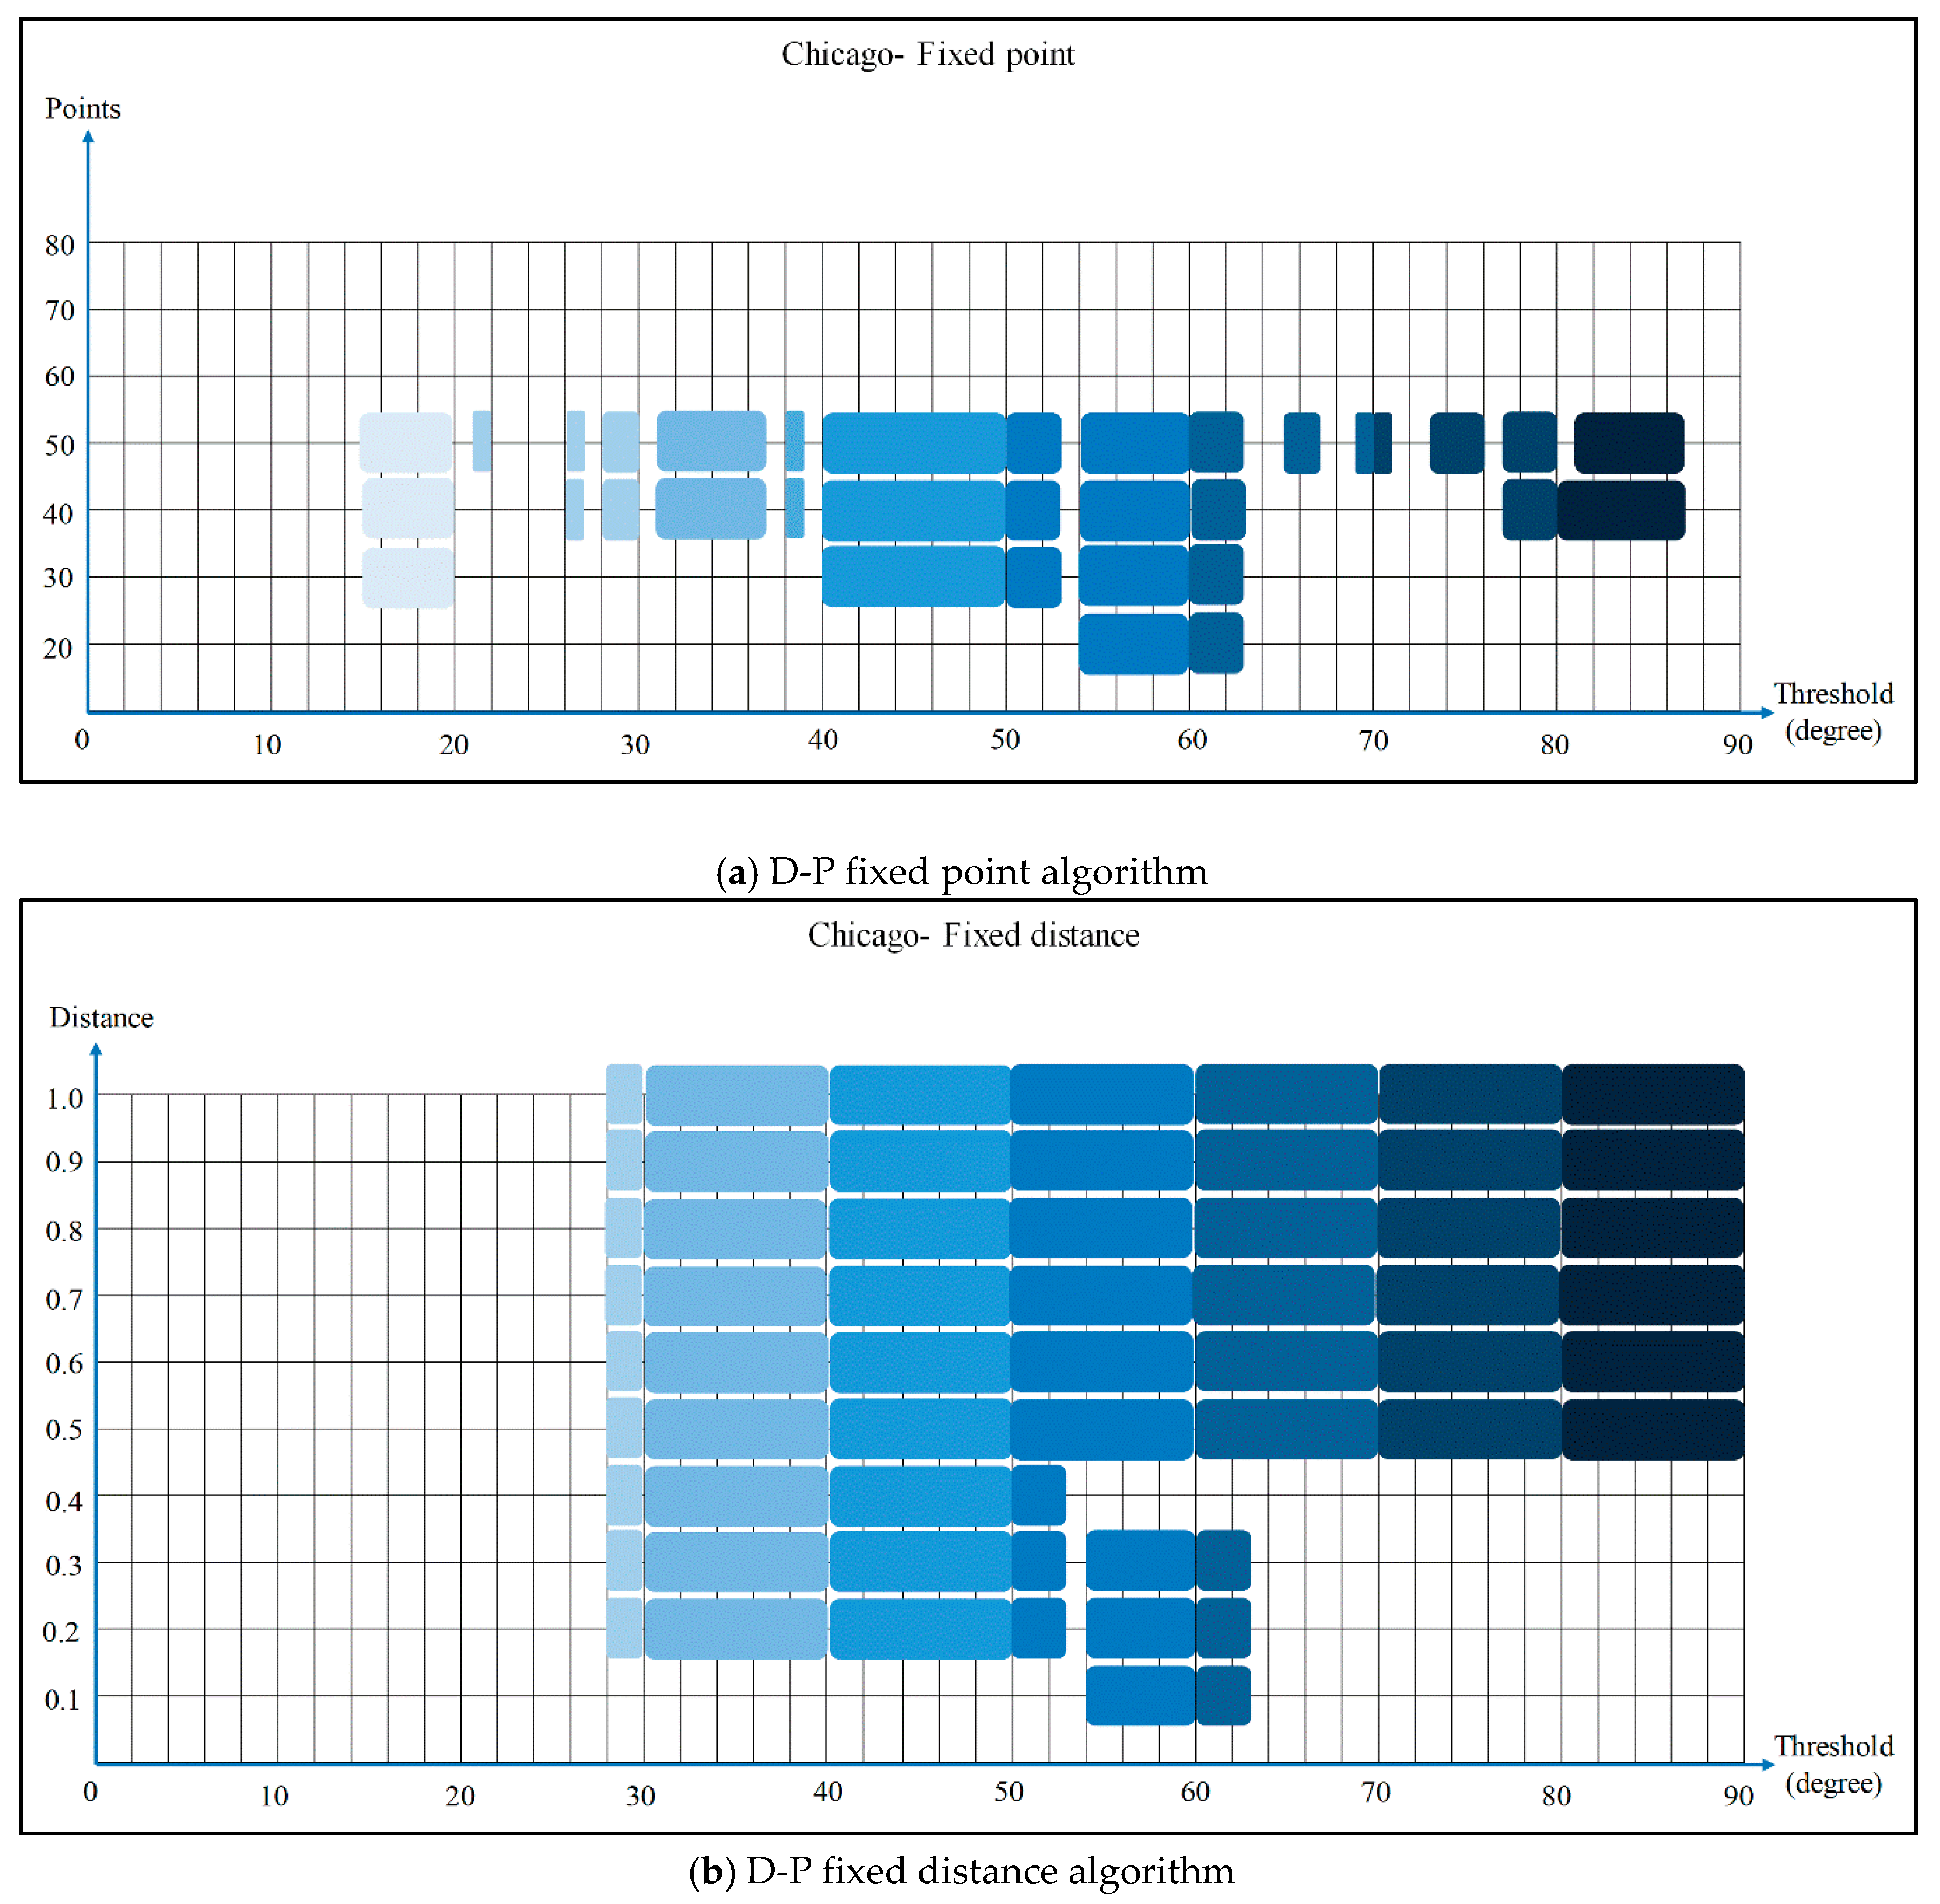
Figure 11 shows our simplification of Chicago’s information volume curve of Chicago using the D-P algorithm. As shown in the graph, the slope of the curve is relatively gentle in the later period. When the threshold of the algorithm is small, some slightly changed points can be retained and the optimum range of angle threshold can be obtained. However, with the increase of the algorithm’s threshold, those points with small changes will be discarded, which enlarges the range of the optimal angle threshold. As shown Figure 11a, when the threshold of the D-P fixed-point algorithm increases to 60°, it is impossible to select the eligible points due to the gentle change of Chicago’s information volume curve in the later period. Meanwhile, Figure 11b illustrates that when the threshold of the D-P fixed distance algorithm exceeds 0.5, the range of the optimum angle threshold is enlarged to 28–90°. This suggests that it is impossible to accurately obtain the optimal angle threshold range of Chicago’s road network using only one simplification algorithm. Both algorithms are necessary to determine the final optimal angle threshold: 54–63° (Table 5)
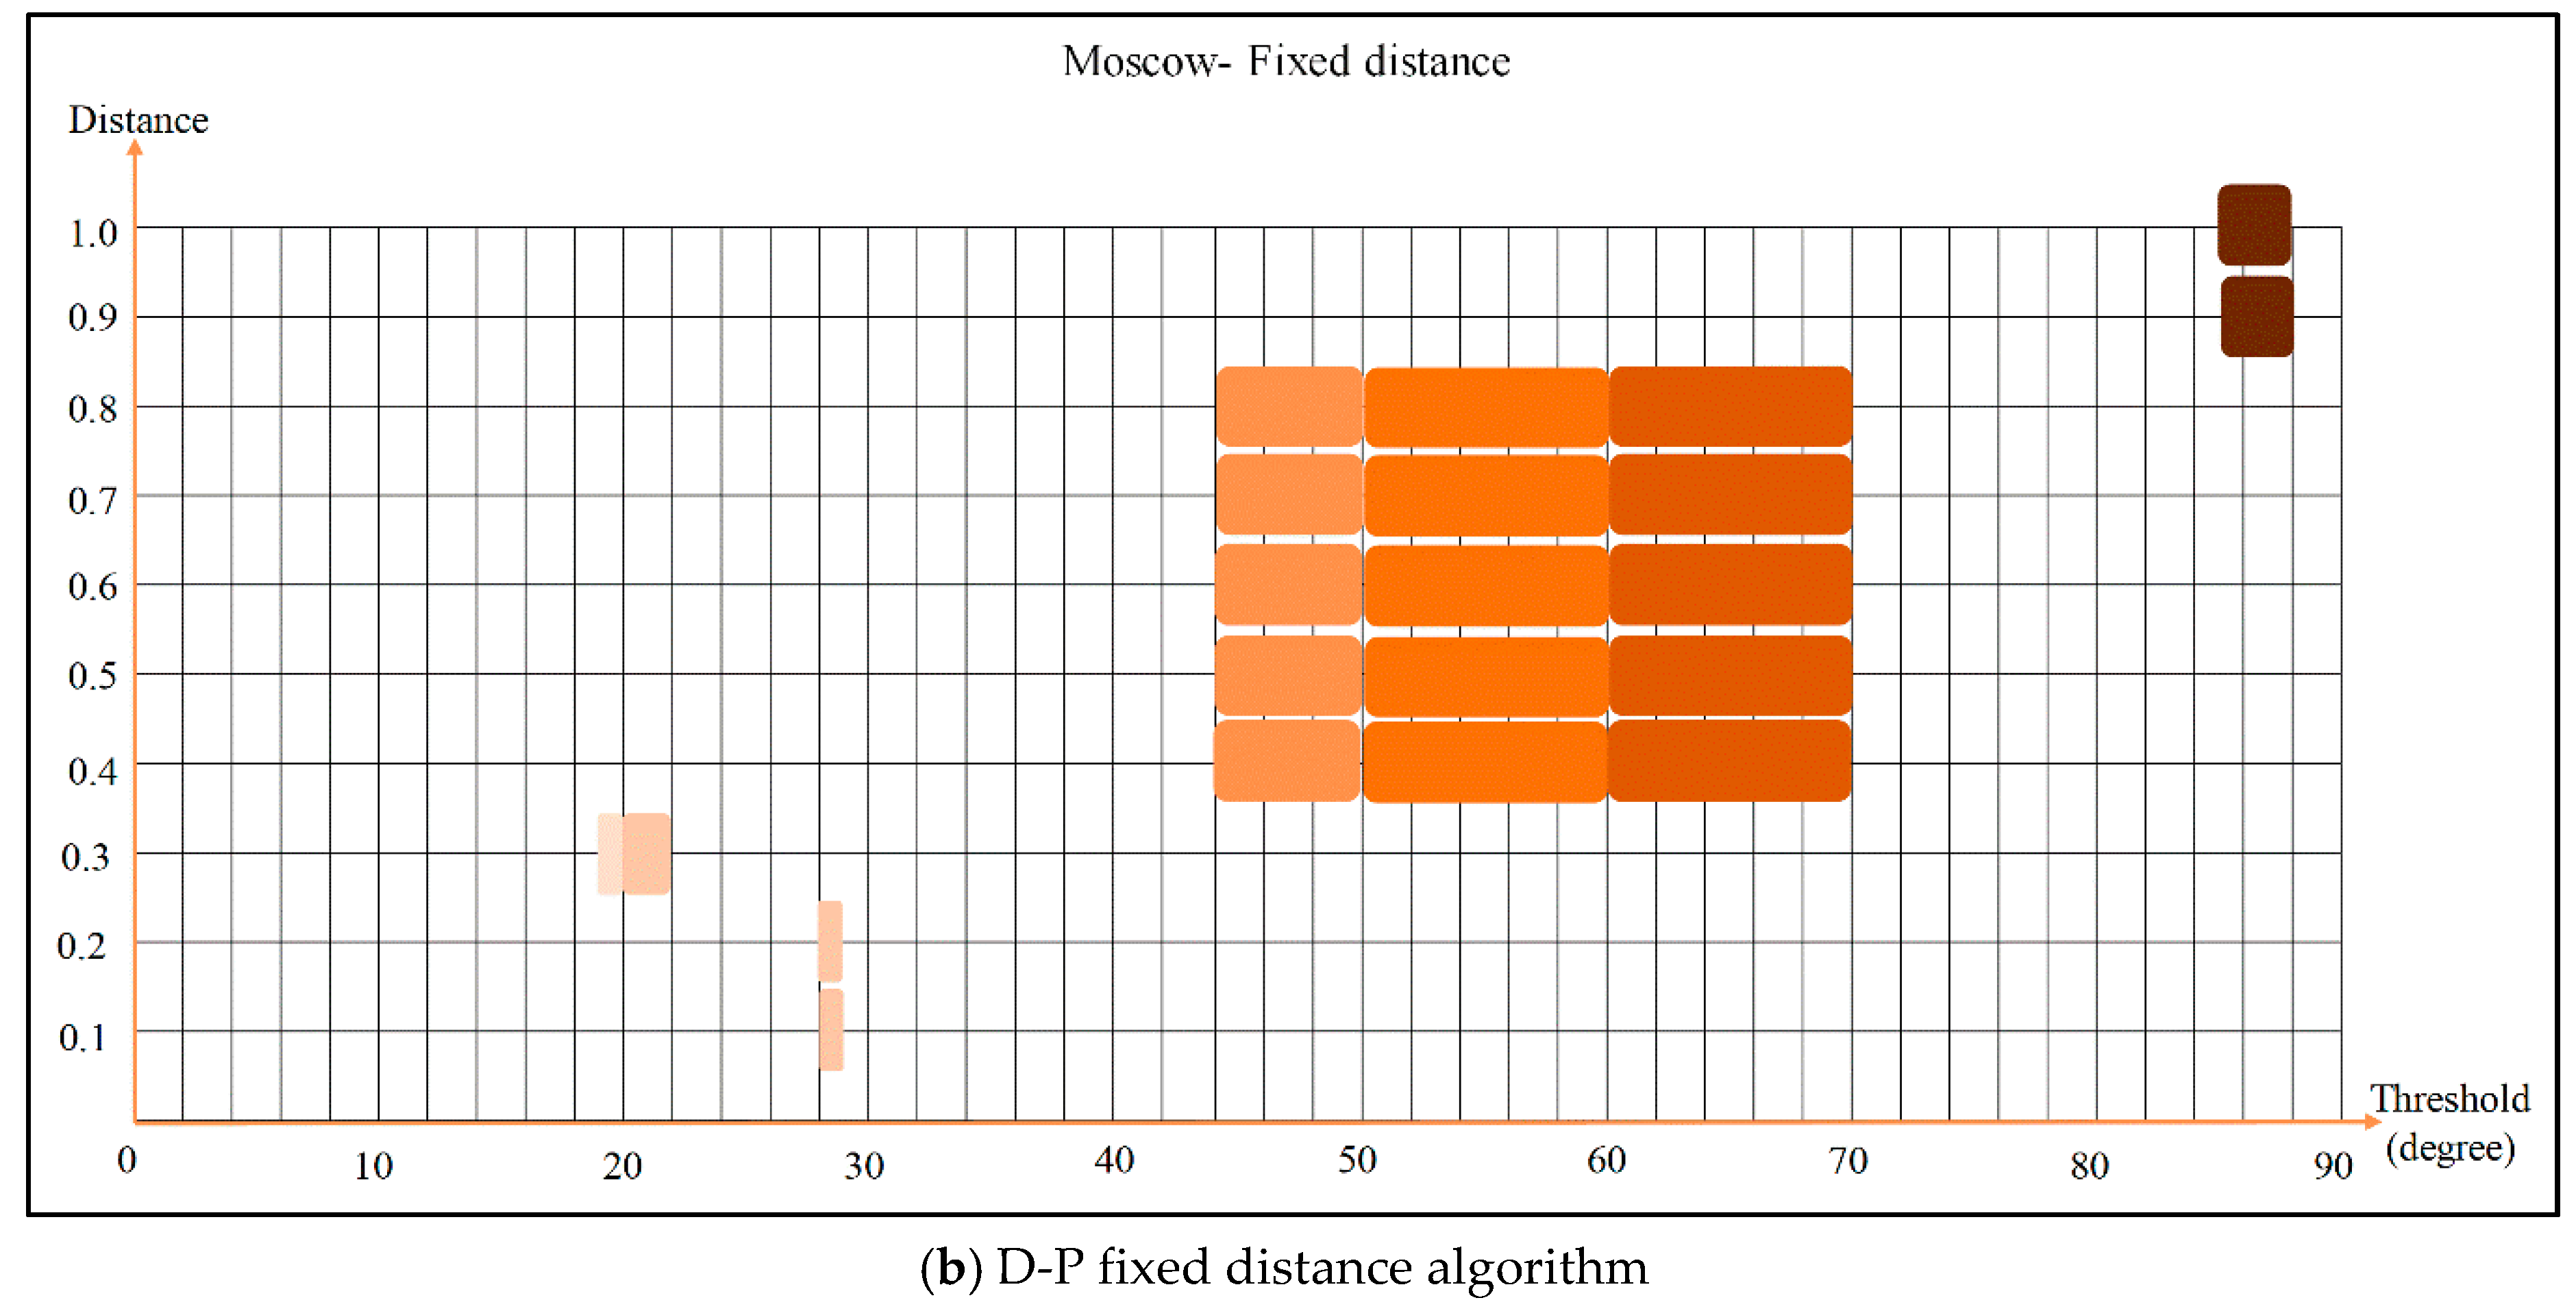
3.1.3. Determination of Optimum Angle Threshold Range of Moscow’s Road Network
Influenced by its politics and topography, Moscow’s road network takes on a radial pattern with only a small difference in deflection angle between linked segments. As shown in Figure 9c, the information volume curve of Moscow’s road network is similar to that of Chicago, with only small changes. When the angle threshold exceeds 7°, the slope tends to be flat.
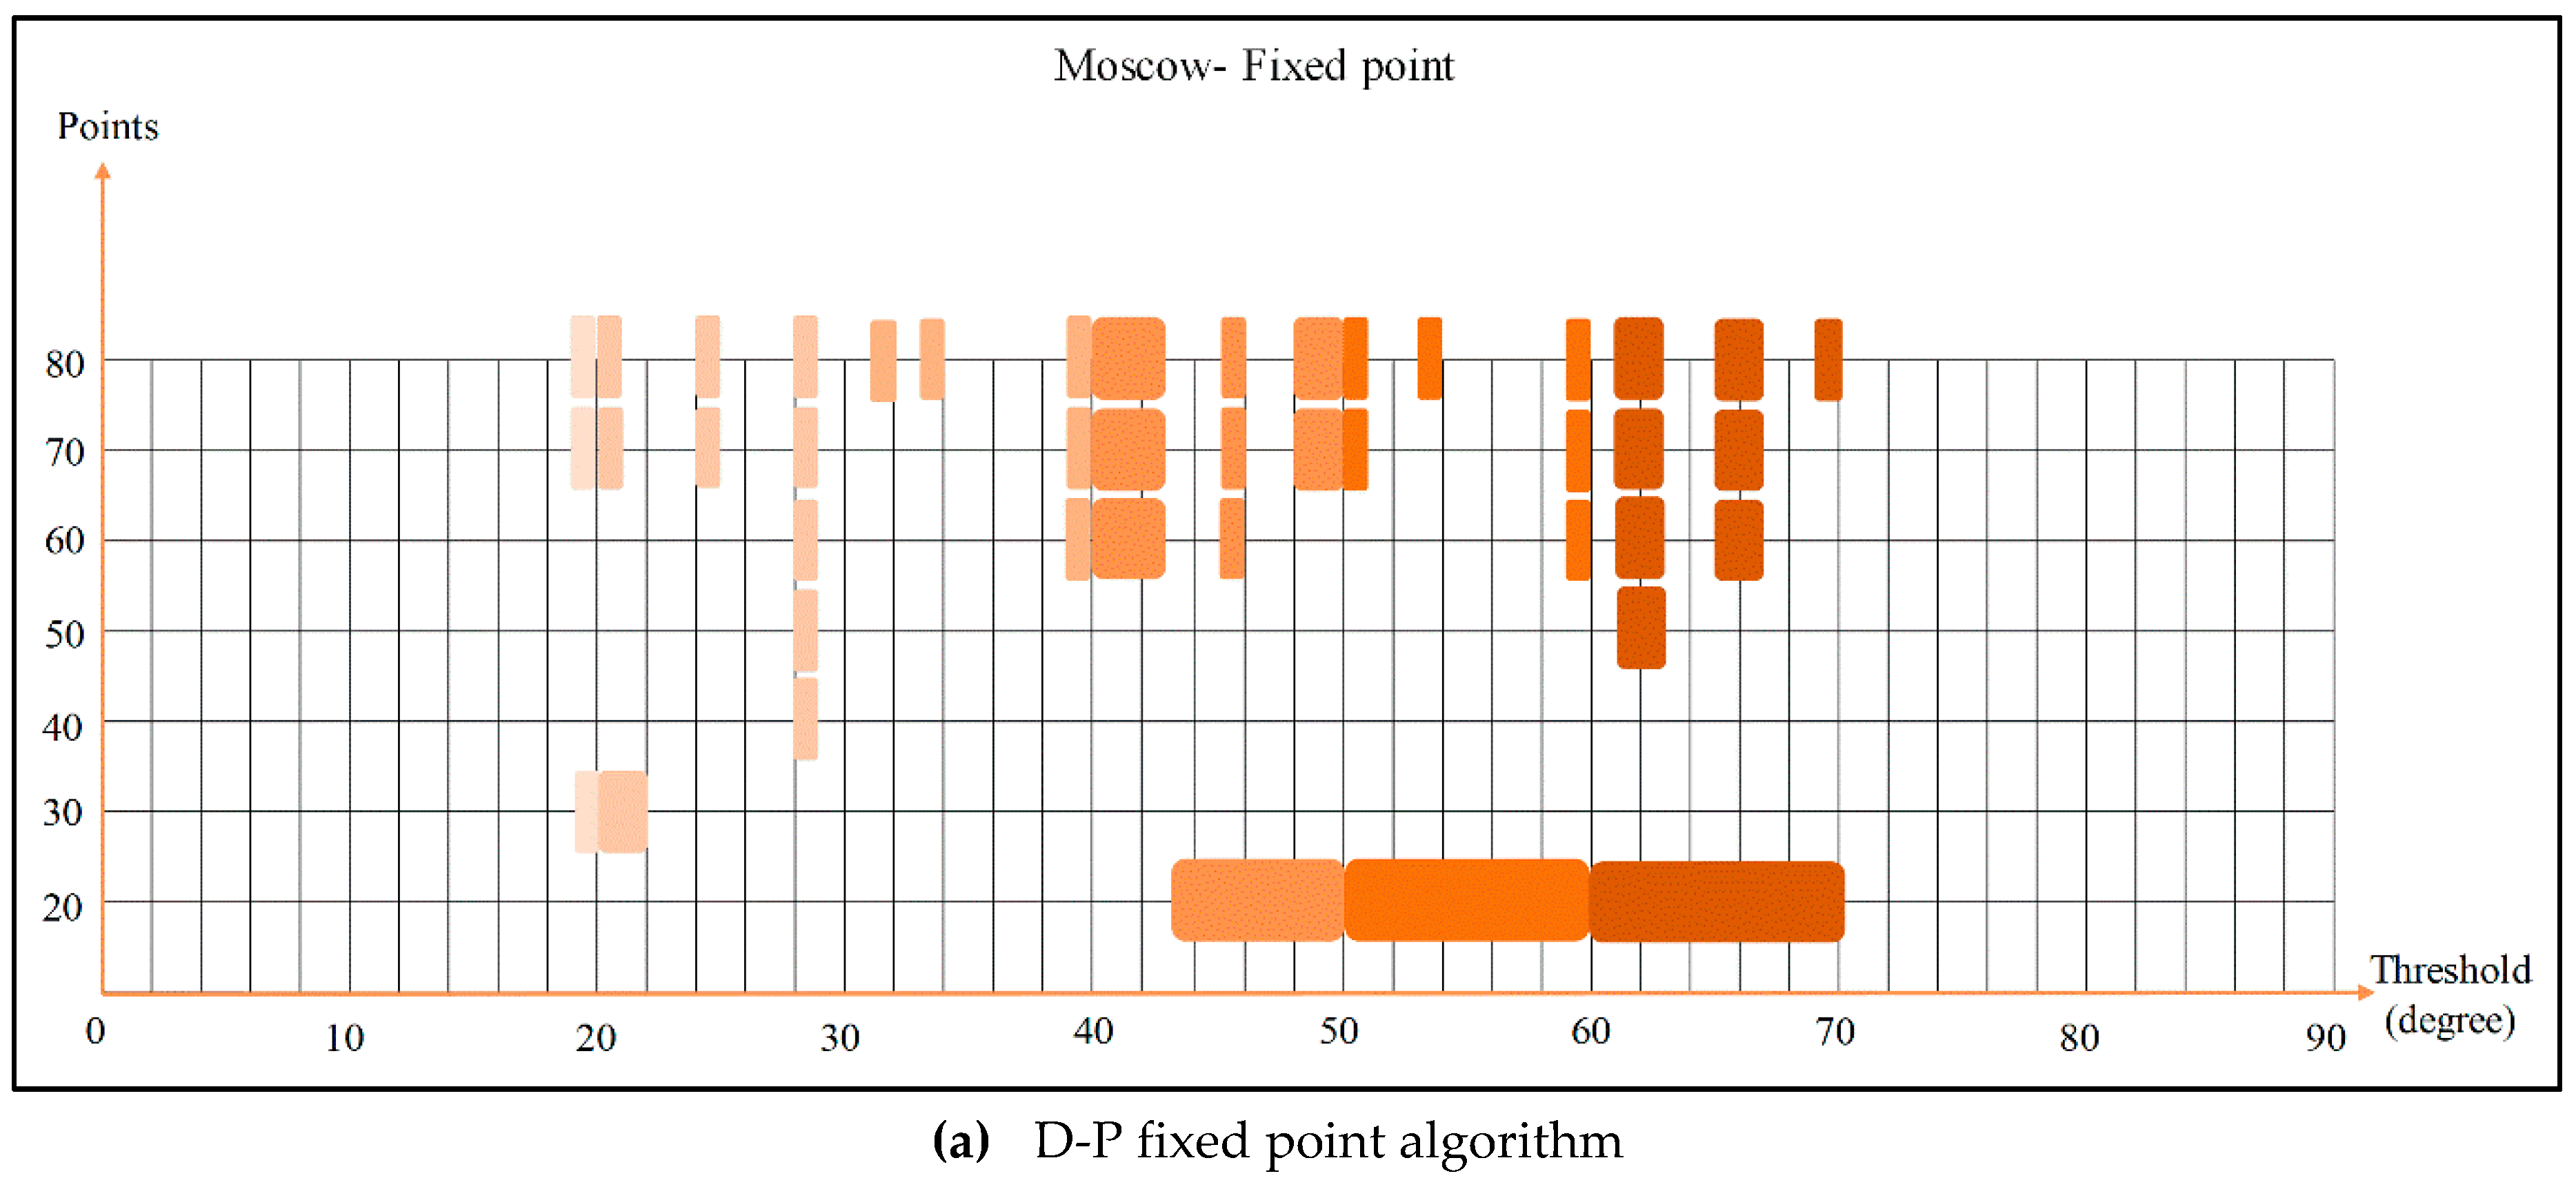
Figure 12 shows our simplification of Moscow’s information volume curve using the D-P algorithm. When the angle threshold is less than 27°, there is great variation in information volume, and there is no optimal angle threshold for generating stroke. As angle threshold increases, the change in information volume tends to be smooth, and the range of the optimal angle threshold is gradually increased. Both algorithms are necessary to determine Moscow’s road network’s optimal angle for stroke generation: 61°–63° (Table 6).
3.2. Analysis of Results
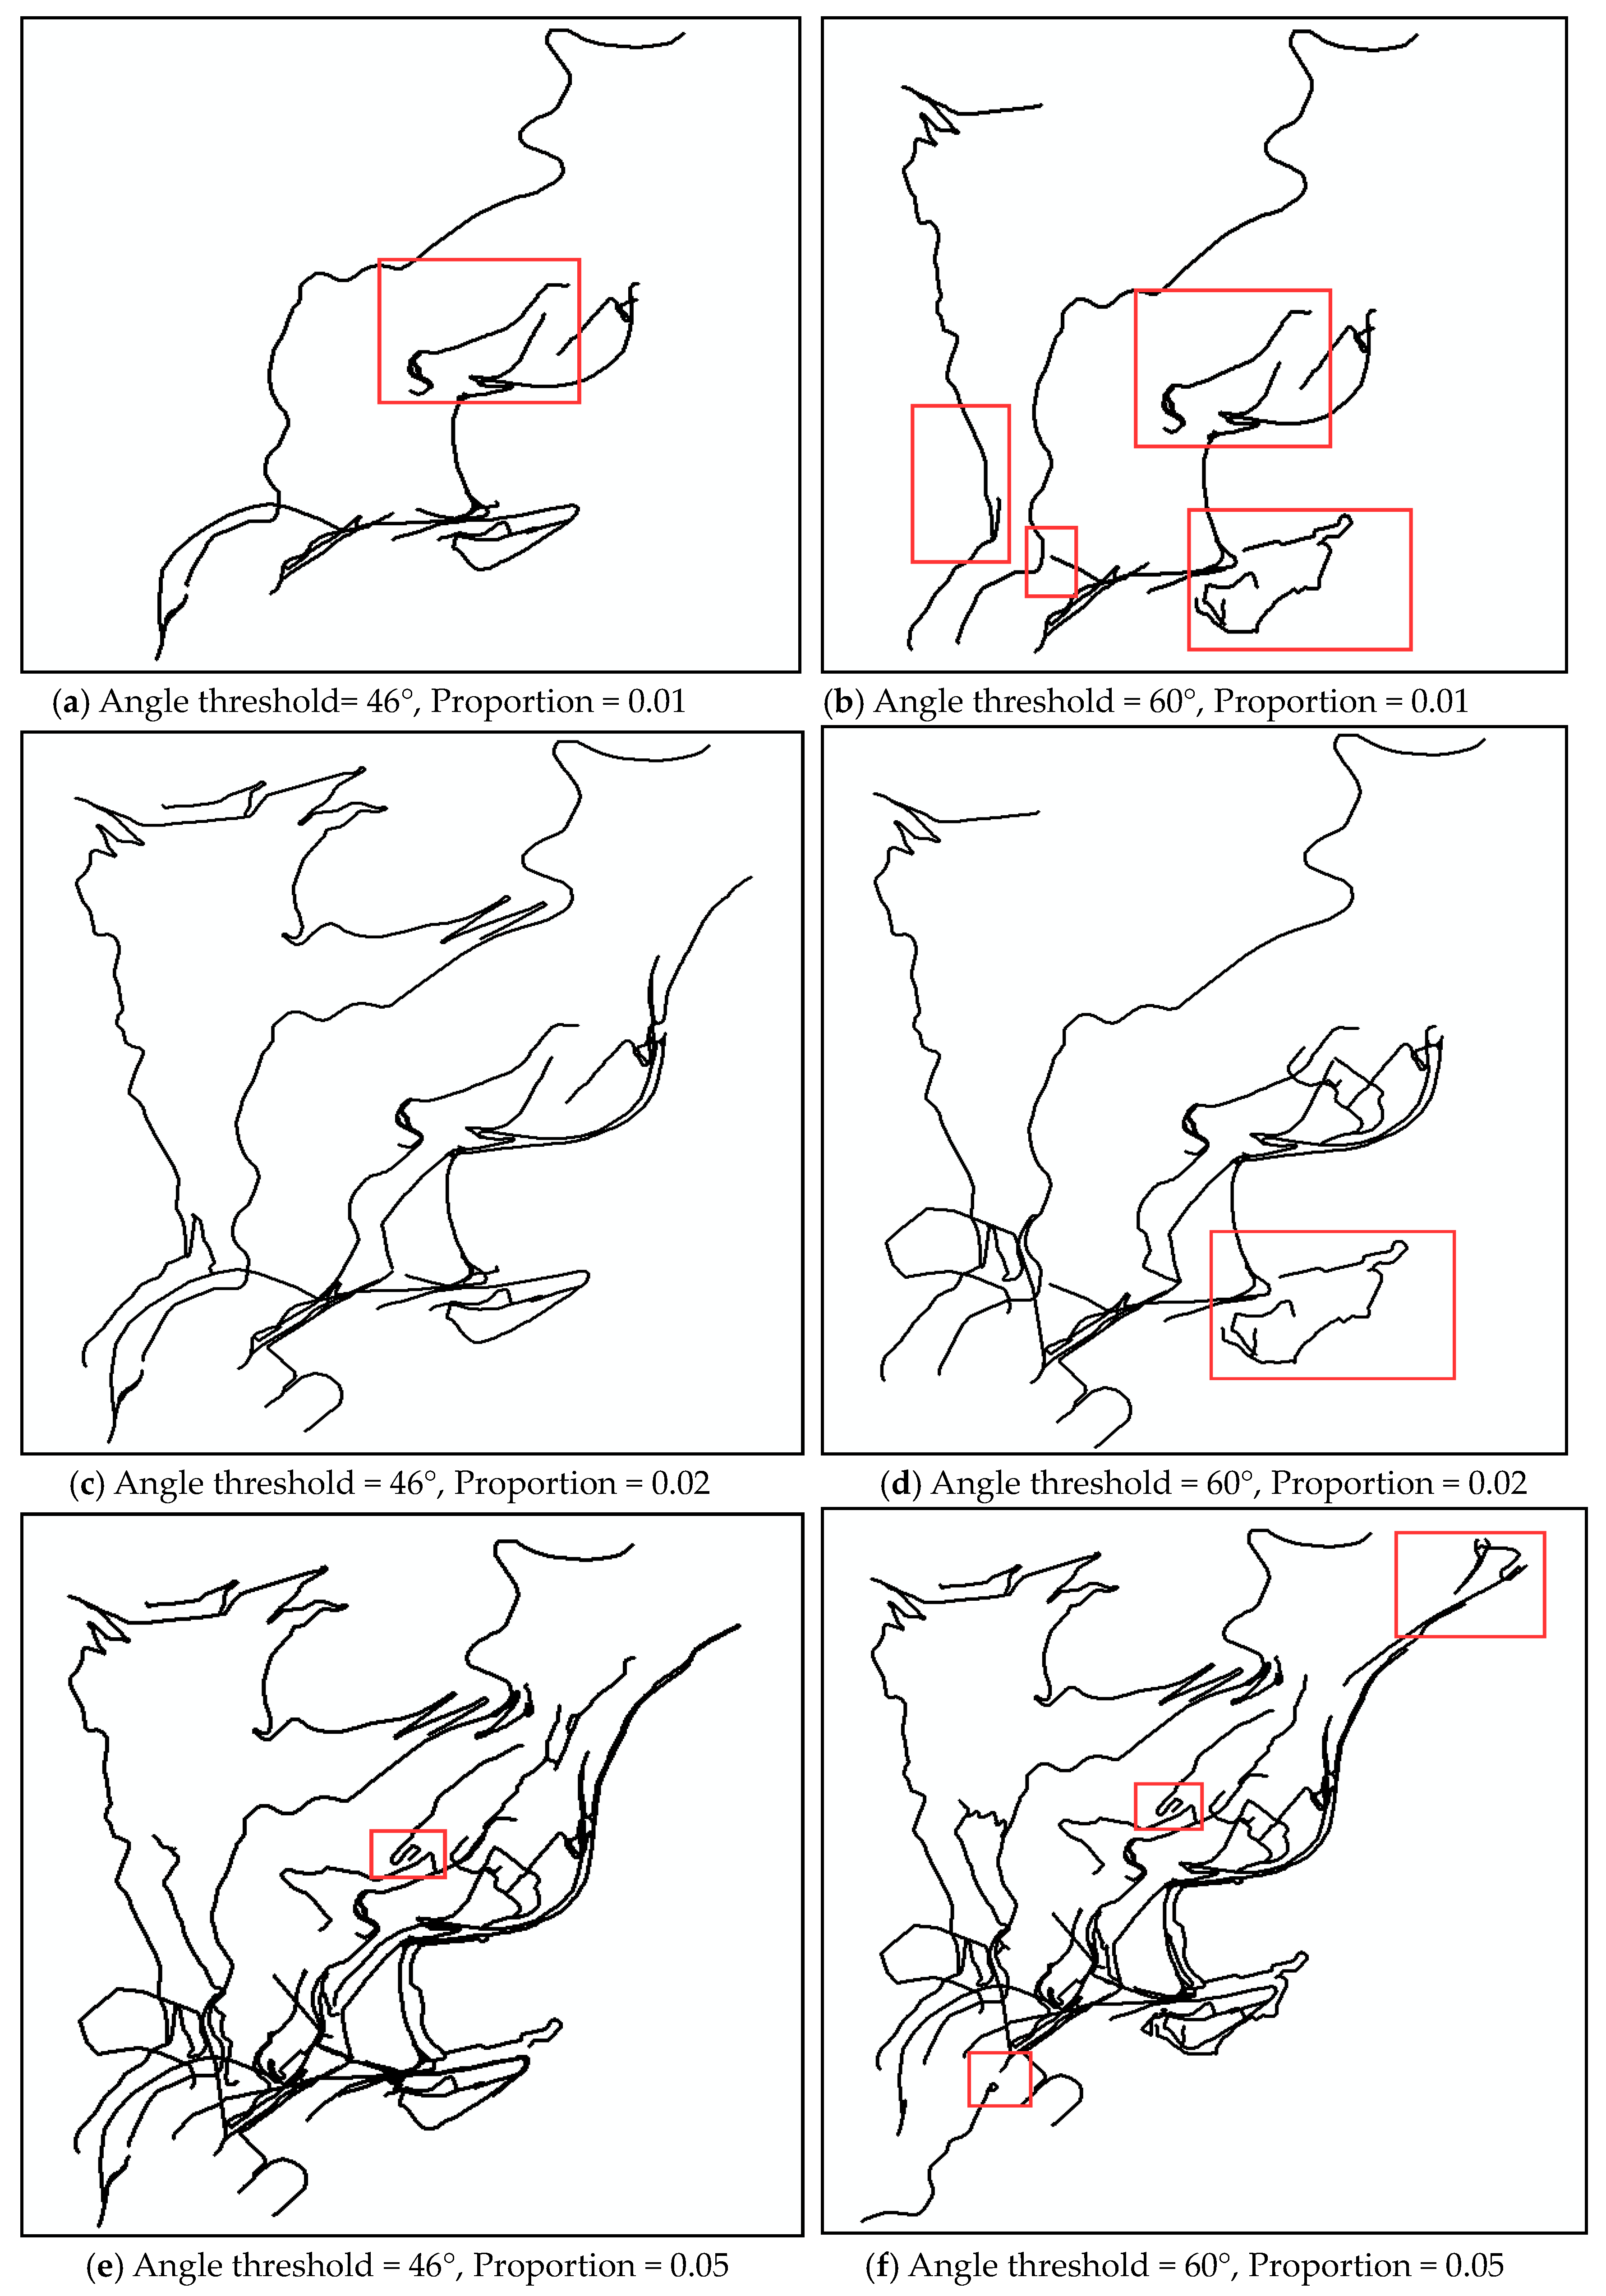
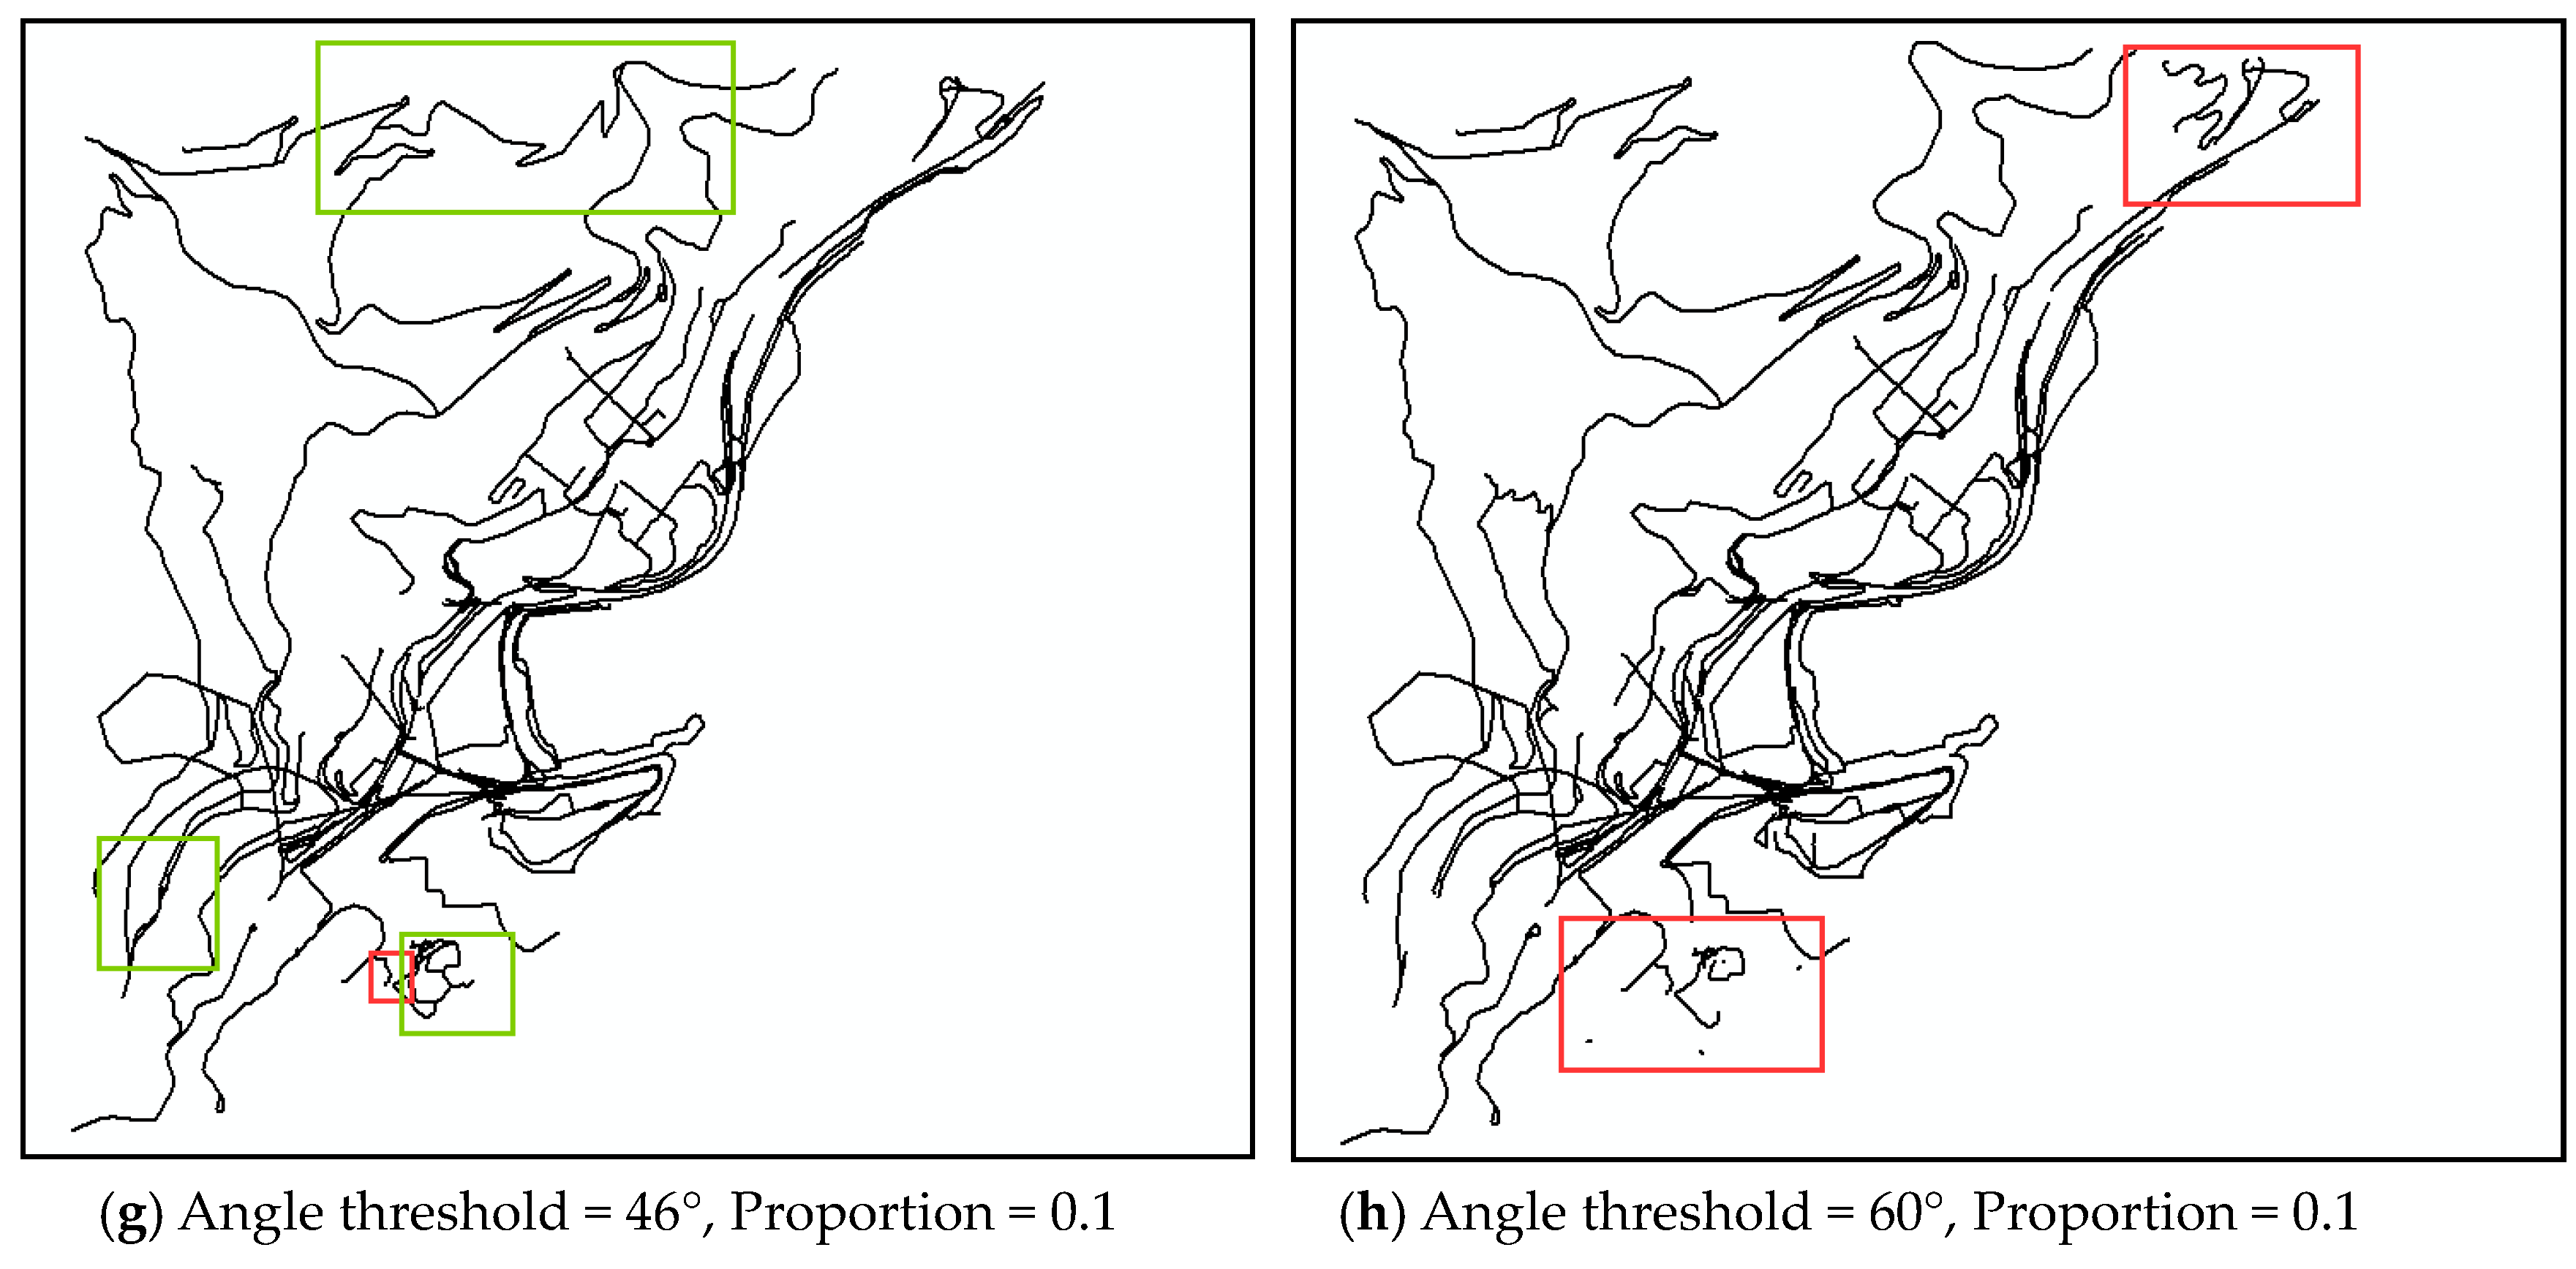
The optimal angle threshold range for constructing strokes varies according to a road network’s morphological structure. If the same angle threshold is used for different road network structures, it will lack certain rationality and effectiveness. From the experimental results of this paper, it can be seen that the optimum angle threshold range for road construction in Moscow and Chicago are 61°–63° and 54°–63° respectively, which is consistent with the commonly used angle threshold for road construction, and verifies the rationality of this method. In order to verify the effectiveness of the proposed algorithm, therefore, we generated strokes for Monaco’s road network using both 46° (Road network I) and 60° (Road network II) as angle thresholds. Using thresholds of 46° and 60° resulted in 847 strokes and 806 strokes, respectively. We then calculated the information volume for each stroke in the two road networks using the methods previously described. Finally, according to the amount of information and the proportion of selection, we selected strokes in Road networks I and II. Figure 13 shows the results when the proportion of selection is 0.01, 0.02, 0.05, and 0.1.
In Figure 13, the suspended strokes are marked by red rectangles and strokes that significantly increase connectivity and coverage are marked with green rectangles. The figure shows that Road network I has a lower suspension than Road network II, regardless of proportion. At the same time, the connectivity and coverage of strokes in both networks gradually increases as proportion increases until, in Figure 13g,h, Road network I has a higher connectivity than Road network II.
Figure 9a illustrates that there is a significant change in the information volume of Monaco’s road network when the angle threshold range is 48–59°. If the range is higher than this, i.e., if it is set at 60°, then segments that should not be connected are merged into one stroke, and the situation described in Figure 13 will appear. This suggests that the optimal angle thresholds are different for different road networks. And our method is more effective at determining the angle threshold than fixed threshold methods in terms of suspension, connectivity and coverage.
4. Conclusions
This paper proposes a new method for determining the angle threshold for stroke generation using a feature-based information entropy model and that takes into account geometric and topological changes to select both element- and neighborhood-level corresponding indicators. Our model also includes a calculation of the information volume for each road network after stroke generation and use of the Douglas-Peucker algorithm to simplify the information volume curve and make the angle threshold range more accurate and objective. We then test the method proposed in this paper on three road networks with different morphological features. Our results indicate that road networks with different morphological features have differing optimal angle threshold ranges. Finally, we compare the results of our model with the most commonly used threshold method using the Monaco road network and determine that under the same proportion of selection, our proposed method results in selected strokes with better connectivity and greater coverage. This suggests that our method is broadly applicable and can be applied to road networks with various morphological structures.
Author Contributions
Yi Liu and Wenjing Li conceived and designed the experiments; Yi Liu performed the experiments; Wenjing Li analyzed data; Wenjing Li contributed data and analysis tools; Yi Liu wrote the paper.
Funding
This research was funded by National Science Foundation of China under Grant No. 41271449.
Acknowledgments
This work was supported by the National Science Foundation of China (Grant No. 41271449) and the Key Laboratory of Rock Mechanics in Hydraulic Structural Engineering, Ministry of Education.
Conflicts of Interest
The authors declare no conflict of interest.
References
- Qi, Z.; Zhilin, L. A comparative study of various strategies to concatenate road segments into strokes for map generalization. Int. J. Geogr. Inf. Sci. 2012, 26, 691–715. [Google Scholar]
- Jiang, B.; Liu, L. Street-based topological representations and analyses for predicting traffic flow in GIS. Int. J. Geogr. Inf. Sci. 2009, 23, 1119–1137. [Google Scholar] [CrossRef] [Green Version]
- Thomson, R.; Richardson, D. The ‘Good Continuation’ Principle of Perceptual Organization Applied to the Generalization of Road Networks. In Proceedings of the 19th International Cartographic Conference, Ottawa, ON, Canada, 14–21 August 1999; pp. 1215–1223. [Google Scholar]
- Zhu, X.; Caifeng, L.; Hong, Z.; Zhang, H.; Zhang, L. Road Selection Based on Evaluation of Stroke Network Functionality. Acta Geod. Cartogr. Sin. 2012, 41, 769–776. [Google Scholar]
- Hu, Y.; Chen, J.; Li, Z.; Hu, Y.-G.; Chen, J.M.; Li, Z.-L.; Zhao, R.-L. Selective omission of road features based on mesh density for digital map generalization. Acta Geod. Cartogr. Sin. 2007, 36, 351–357. [Google Scholar]
- Thomson, R.C. The ‘stroke’ Concept in Geographic Network Generalization and Analysis. In Progress in Spatial Data Handling, Proceedings of the 12th International Symposium on Spatial Data Handling, Zurich, Switzerland, 1984; Riedl, A., Kainz, W., Elmes, G.A., Eds.; Springer: Berlin, Germany, 2006; pp. 681–697. [Google Scholar]
- Cao, W.W.; Zhang, H.; He, J.; Lan, T. Road selection considering structural and geometric properties. Wuhan Univ. J. Nat. Sci. 2017, 42, 520–524. [Google Scholar]
- Zhang, J.; Wang, Y.; Zhao, W. An improved hybrid method for enhanced road feature selection in map generalization. Int. J. Geo-Inf. 2017, 6, 196. [Google Scholar] [CrossRef]
- Jiang, B.; Zhao, S.; Yin, J. Self-organized natural roads for predicting traffic flow: A sensitivity study. J. Stat. Mech. Theory Exp. 2008, 2008, 1–23. [Google Scholar] [CrossRef]
- Omair, C.; William, M. ProRural and Urban. Road Network Generalisation Deriving 1:250,000 from OS MasterMap. In Proceedings of the XXII International Cartographic Conference (ICC2005), Coruña, Spain, 11–16 July 2005. [Google Scholar]
- Fu, Z.L.; Weng, B.F.; Hu, Y.L. A schematic method based on the integration of stroke construction and displacement for road network. Acta Geod. Cartogr. Sin. 2016, 45, 1115–1121. [Google Scholar]
- Yang, L.; Wan, B.; Wang, R.; Zuo, Z.J.; An, X.Y. Matching road network based on the structural relationship constraint of hierarchical strokes. Wuhan Univ. J. Nat. Sci. 2015, 40, 1661–1668. [Google Scholar]
- Bjørke, J.T. Framework for entropy-based map evaluation. Cartogr. Geogr. Inf. Syst. 1996, 23, 78–95. [Google Scholar] [CrossRef]
- Liu, H.M.; Deng, M.; Fan, Z.D.; Lu, Q.D. A characteristics-based approach to measuring spatial information content of the settlements in a map. Acta Geod. Et Cart. Sin. 2014, 43, 1092–1098. [Google Scholar]
- Li, W.J.; Hu, D.; Liu, Y. An improved measuring method for the information entropy of network topology. Trans. GIS 2018, 22, 1632–1648. [Google Scholar] [CrossRef]
- Liu, H.M.; Fan, Z.D.; Deng, M.; Xu, Z. A hierarchical approach to measuring the information content of the contours in a map. Acta Geod. Et Cart. Sin. 2012, 41, 777–783. [Google Scholar]
- Tian, J.; Ren, C.; Wang, Y.H.; Xiong, F.H.; Lei, Y.Z. Improvement of self-best-fit strategy for stroke building. Geomat. Inf. Sci. Wuhan Univ. 2015, 40, 1209–1214. [Google Scholar]
- Yang, B.S.; Luan, X.C.; Li, Q.Q. Generating hierarchical strokes from urban street networks based on spatial pattern recognition. Int. J. Geogr. Inf. Sci. 2011, 25, 2025–2050. [Google Scholar] [CrossRef]
- Shannon C, E. A Mathematical Theory of Communication. Bell Syst. Tech. J. 1948, 27, 379–423. [Google Scholar] [CrossRef] [Green Version]
- Sukhov, V.I. Information capacity of a map: Entropy. Geod. Aerophotogr. 1967, 10, 212–215. [Google Scholar]
- Sukhov, V.I. Application of information theory in generalization of map contents. Int. Yearb. Cartogr. 1970, 10, 41–47. [Google Scholar]
- Wenjun, O.; Xianlin, Y. Measuring of cartographic information amount the general eigen value measuring method. Map 1988, 4, 20–24. [Google Scholar]
- Qing, L.; Jiabao, W. Research on effectiveness of internal control based on analytic hierarchy process. J. Liaoning Norm. Univ. (Nat. Sci.) 2019, 42, 31–36. [Google Scholar]
- Ping, M. The study on influencing factors index system of enrollment quality in local normal college. J. Chongqing Norm. Univ. (Nat. Sci.) 2018, 35, 137–143. [Google Scholar]
- Li, W.J.; Qiu, J.; Long, Y. Application of rough set theory in map generalization. Acta Geod. Et Cartogr. Sin. 2012, 41, 298–301. [Google Scholar]
- Li, W.J.; Qiu, J.; Long, Y. An improvement selection method of GIS information generalization based on rough set. Wuhan Univ. J. Nat. Sci. 2011, 36, 588–591. [Google Scholar]
- Yang, H.W.; Yang, X.H.; Zhang, J.; Gao, Y. The influence analyze for wind power fluctuation of different data extraction methods. Power Syst. Big Data 2017, 20, 65–70. [Google Scholar]
- Xu, X. Research and application of new compression method aimed at vector data. Appl. Res. Comput. 2007, 24, 393–395. [Google Scholar]
- Tang, J.M.; Sun, H.M.; Li, H.Q. Space curve compression algorithm to extract moving pattern of aerial targets. J. Air Force Early Warn. Acad. 2017, 31, 31–35. [Google Scholar]
- Yang, M.; Chen, Y.Y.; Jin, C.; Cheng, Q. A Method of Speed-preserving Trajectory Simplification. Acta Geod. Et Cartogr. Sin. 2017, 46, 2016–2023. [Google Scholar]
- Li, T. Homogeneity of Positional Accuracy in Line Simplification Based on Douglas-Peucker Algorithm. Master’s Thesis, Southwest Jiaotong University, Chengdu, China, 2014. [Google Scholar]
Figure 1.
Flow chart of our model for determining the optimal angle threshold range for generating strokes in a specific road network.
Figure 1.
Flow chart of our model for determining the optimal angle threshold range for generating strokes in a specific road network.

Figure 2.
Calculation of road deflection angle. θ is the deflection angle of road segments R1 and R2.
Figure 2.
Calculation of road deflection angle. θ is the deflection angle of road segments R1 and R2.

Figure 3.
Illustration of different connection strategies.

Figure 4.
Flow chart for our improved stroke-determination algorithm.

Figure 5.
Stroke generation using different angle thresholds.

Figure 6.
Wuhan road network at different levels.

Figure 7.
Simplified results of information volume changing curve. The numbers represent the slope at a given point.
Figure 7.
Simplified results of information volume changing curve. The numbers represent the slope at a given point.


Figure 8.
Case study areas, both original road network and dual graph.

Figure 9.
The information volume curve of each road network.

Figure 10.
Monaco’s optimal angle threshold according to Douglas-Peucker algorithm.

Figure 11.
Chicago’s optimal angle threshold according to Douglas-Peucker algorithm.

Figure 12.
Moscow’s optimal angle threshold according to Douglas-Peucker algorithm.


Figure 13.
Results of stroke selection.


Table 1.
Pseudo-code for the stroke generation algorithm.
| Algorithm 1 Stroke generation considering geometric and structural properies of road network |
 |
Table 2.
Variations in stroke number under different thresholds.
| Number of Original Segments | Angle Threshold (°) | Number of Strokes |
|---|---|---|
| 17 | 30 | 10 |
| 17 | 45 | 9 |
| 17 | 60 | 8 |
| 17 | 75 | 7 |
| 17 | 90 | 5 |
Table 3.
Indicator explanation and calculation of stroke.
| Level | Evaluation Indicator | Equation | Explanation |
|---|---|---|---|
| Element | Length | Stroke’s geometric characteristics of the stroke, where is the length of the jth road segment of the ith stroke. | |
| Neighborhood | Degree | Stroke’s degree of connectivity. If stroke i intersects with stroke j, then =1 or =0. | |
| Between-ness | Stroke’s importance in the network; is the number of shortest paths between stroke j and stroke k; is the number of shortest paths between stroke j and stroke k that contain stroke i. | ||
| Closeness | The close relationship between strokes; N is the number of strokes; is the number of strokes in the shortest path from stroke i to stroke j. |
Table 4.
Statistical results for Monaco’s optimal angle threshold (Unit: degree).
| Threshold | 20–21 | 45–48 | 51–54 | 59–61 | 61–63 | 63–73 | 85–86 | 86–88 | |
|---|---|---|---|---|---|---|---|---|---|
| Method | |||||||||
| Fixed point | 2 | 5 | 2 | 1 | 2 | 1 | 0 | 3 | |
| Fixed distance | 2 | 9 | 7 | 0 | 1 | 0 | 3 | 3 | |
| statistics | 4 | 14 | 9 | 1 | 3 | 1 | 3 | 6 | |
Table 5.
Statistical results for Chicago’s optimal angle threshold (Unit: degree).
| Threshold | 15–20 | 21–22 | 26–27 | 28–30 | 31–37 | 38–39 | 40–53 | 53–54 | 54–63 | 63–65 | 65–67 | 67–69 | 69–71 | 71–73 | 73–76 | 76–77 | 78–80 | 80–81 | 81–87 | 87–90 | |
|---|---|---|---|---|---|---|---|---|---|---|---|---|---|---|---|---|---|---|---|---|---|
| Method | |||||||||||||||||||||
| Fixed-point | 3 | 1 | 2 | 2 | 2 | 2 | 3 | 0 | 4 | 0 | 1 | 0 | 1 | 0 | 1 | 0 | 2 | 1 | 2 | 0 | |
| Fixed-distance | 0 | 0 | 0 | 9 | 9 | 9 | 9 | 6 | 9 | 6 | 6 | 6 | 6 | 6 | 6 | 6 | 6 | 6 | 6 | 6 | |
| statistics | 3 | 1 | 2 | 11 | 11 | 11 | 12 | 6 | 13 | 6 | 7 | 6 | 7 | 6 | 7 | 6 | 8 | 7 | 8 | 6 | |
Table 6.
Statistical results for Moscow’s optimal angle threshold (Unit: degree).
| Threshold | 19–21 | 21–22 | 24–25 | 28–29 | 31–32 | 33–34 | 39–43 | 43–44 | 44–45 | 45–46 | 46–48 | 48–51 | 51–53 | 53–54 | 54–59 | 59–60 | 60–61 | 61–63 | 63–65 | 65–67 | 67–69 | 69–70 | 85–88 | |
|---|---|---|---|---|---|---|---|---|---|---|---|---|---|---|---|---|---|---|---|---|---|---|---|---|
| Method | ||||||||||||||||||||||||
| Fixed-point | 3 | 1 | 2 | 5 | 1 | 1 | 3 | 1 | 1 | 4 | 1 | 3 | 1 | 2 | 1 | 4 | 1 | 5 | 1 | 4 | 1 | 2 | 0 | |
| Fixed-distance | 1 | 1 | 0 | 2 | 0 | 0 | 0 | 0 | 5 | 5 | 5 | 5 | 5 | 5 | 5 | 5 | 5 | 5 | 5 | 5 | 5 | 5 | 2 | |
| statistics | 4 | 2 | 2 | 7 | 1 | 1 | 3 | 1 | 6 | 9 | 6 | 8 | 6 | 7 | 6 | 9 | 6 | 10 | 6 | 9 | 6 | 7 | 2 | |
© 2019 by the authors. Licensee MDPI, Basel, Switzerland. This article is an open access article distributed under the terms and conditions of the Creative Commons Attribution (CC BY) license (http://creativecommons.org/licenses/by/4.0/).
Share and Cite
MDPI and ACS Style
Liu, Y.; Li, W. A New Algorithms of Stroke Generation Considering Geometric and Structural Properties of Road Network. ISPRS Int. J. Geo-Inf. 2019, 8, 304. https://0-doi-org.brum.beds.ac.uk/10.3390/ijgi8070304
AMA Style
Liu Y, Li W. A New Algorithms of Stroke Generation Considering Geometric and Structural Properties of Road Network. ISPRS International Journal of Geo-Information. 2019; 8(7):304. https://0-doi-org.brum.beds.ac.uk/10.3390/ijgi8070304
Chicago/Turabian StyleLiu, Yi, and Wenjing Li. 2019. "A New Algorithms of Stroke Generation Considering Geometric and Structural Properties of Road Network" ISPRS International Journal of Geo-Information 8, no. 7: 304. https://0-doi-org.brum.beds.ac.uk/10.3390/ijgi8070304
Note that from the first issue of 2016, this journal uses article numbers instead of page numbers. See further details here.