A Sightseeing Support System Using Augmented Reality and Pictograms within Urban Tourist Areas in Japan


Graduate School of Information Systems, University of Electro-Communications, Tokyo 182-8585, Japan
*
Author to whom correspondence should be addressed.
ISPRS Int. J. Geo-Inf. 2019, 8(9), 381; https://0-doi-org.brum.beds.ac.uk/10.3390/ijgi8090381
Submission received: 25 July 2019
/
Revised: 21 August 2019
/
Accepted: 24 August 2019
/
Published: 30 August 2019
(This article belongs to the Special Issue Spatiotemporal Platforms for Addressing Social and Physical Challenges)
Abstract
:Though tourists can search for necessary information on the internet while sightseeing, it takes effort and is inconvenient to obtain available information related to specific sightseeing spots among the copious amount of information online. Targeting urban tourist areas in Japan, the present study aims to develop a system that can provide guidance and information concerning sightseeing spots by integrating location-based augmented reality (AR) and object-recognition AR and by using pictograms. The system enables users to efficiently obtain the directions to sightseeing spots and nearby facilities within urban tourist areas and sightseeing spot information. Additionally, the city of Chofu in the metropolis of Tokyo was selected as the operation target area. The operation of the system was conducted for 1 month, targeting those inside and outside the operation target area, and a web questionnaire survey was conducted with a total number of 50 users. From the evaluation results of the web questionnaire survey, the usefulness of the original functions of integrating location-based AR and object-recognition AR and by using pictograms, as well as of the entire system, was analyzed. From the results of the access analysis of users’ log data, it is expected that users will further utilize each function. Additionally, it is evident that location-based AR was used more often than was object-recognition AR.
1. Introduction
Due to the spread of mobile information terminals, such as smartphones and tablet PCs, in the current advanced information and communications society in recent years, anyone can easily access the internet and transmit and obtain information. However, as a plethora of information is available on the internet, each user must efficiently search the information they seek by themselves. Additionally, because a wide variety and a large amount of information are available, it may take time to search and obtain the necessary information. Therefore, information literacy is required for users to appropriately determine what information is necessary and how to effectively use it. The above can also be applied to sightseeing. Although tourists can search for the necessary information on the internet while sightseeing, it takes effort and is inconvenient to obtain the available information related to specific sightseeing spots among the copious amount of information online. Therefore, it is necessary to develop a method to efficiently and appropriately present sightseeing information to tourists. In response to this necessity, Dinis et al. (2019) [1] proposed a methodology that uses the big data from Google Trends (GT) tool to develop composite indicators to measure the public online search interest by tourist destinations. Additionally, Wise et al. (2019) [2] described the significance of the Internet of Things (IoT) and its potential for smart cities and provided practical foundations for destination organizers and stakeholders by integrating social media, content marketing, and wearable IoT devices into the emerging smart tourism paradigm.
On the other hand, augmented reality (AR) is a technology that visualizes information by displaying digital content, such as images and videos, in the actual world by means of wearable terminals, including mobile information terminals and smart glasses (Konoike, 2019) [3]. There are various types of AR, such as location-based AR, which use the location information obtained using global positioning systems (GPS), image-recognition AR, which recognizes images and markers, and markerless AR, which recognizes flat surfaces and spaces. Information technology developed using AR is not only used for sightseeing and disaster prevention (GrapeCity, 2019) [4] but is also used for Pokémon GO and other applications for various purposes that are used in the actual world by combining the technology with GPS. In this way, AR has become more common even to the general public. Additionally, AR is used in many various ways and situations and can also be used as a method to provide sightseeing information for the general public. The usefulness of providing sightseeing information using AR is evident from the results of the preceding studies (Fujita et al. 2016 and Zhou et al. 2016) [5,6] that developed the navigation system for normal conditions and for disaster situations, as well as the system to provide sightseeing spot information.
Meanwhile, since the start of the “Visit Japan Campaign” in 2003, Japan experienced 10 million foreign visitors by 2013. Additionally, due to the Tokyo Olympic and Paralympic Games that will be held in 2020, the number of foreign tourists is expected to increase. However, it has been pointed out that the most serious complaint among foreign tourists towards the Japanese sightseeing industry is the lack of foreign language services. Therefore, this issue must be resolved. As a solution to this issue, Yamamoto (2018) [7] and Abe et al. (2019) [8] proposed sightseeing support systems using English and other nonlinguistic information, including pictograms (symbols and marks).
Therefore, since foreign tourists come from various countries, and all of them may not necessarily completely understand Japanese or English, it is essential to develop a sightseeing support system that effectively uses nonlinguistic information. Additionally, it is desirable to adopt AR into the system that provides guidance and information concerning sightseeing spots. However, as described in the next session, such systems that meet these demands have not yet been developed. Based on the social and academic background described above, the present study aims to target urban tourist areas in Japan to develop a system that can provide guidance and information concerning sightseeing spots by integrating location-based AR and object-recognition AR and uses pictograms. Specifically, by using these two types of AR, the system can appropriately provide guidance for users. Additionally, using location-based AR and pictograms, this approach can also efficiently provide information concerning sightseeing spots for both Japanese and foreign users. In Japanese smart cities, as Wise et al. (2019) [2] described, it is expected that everyone would be able to fully enjoy sightseeing using the system as one of smart tourism tools, including mobile applications, AR and near-field communications (NFC). In other words, one component of the system is mobile applications that adopt the two types of AR that are powerful tools for NFC. This method will be detailed in the next section. Although the present study will develop a system that will operate within urban tourist areas in Japan, it is possible to apply it to similar areas in other countries. Because the system does not depend on any language, it is necessary to elaborate the display of nonlinguistic information, including pictograms.
2. Related Work
The present study is related to four study fields, including (1) studies related to navigation using location-based AR, (2) studies related to navigation using image-recognition AR, (3) studies related to information services using AR, and (4) studies related to information services using pictograms. In (1), using the AR smart glasses, Fujita et al. (2016) [5] developed a navigation system that can be used during sightseeing and disasters, while Zhou et al. (2016) [6] developed a recommendation system for sightseeing spots, and Rehman et al. (2017) [9] proposed an indoor navigation system. Morozumi et al. (2016) [10] and Chung et al. (2016) [11] developed a navigation system to navigate, users to their destinations. Amirian et al. (2016) [12] developed a landmark-based pedestrian navigation system using machine learning in addition to AR. Gerstweiler et al. (2016) [13] presented a hybrid tracking system specifically designed for complex indoor spaces that runs on mobile information terminals.
In (2), Mata et al. (2011) [14] developed an experimental virtual museum using paintings. Mulloni et al. (2011) [15], Okada et al. (2011) [16], Möller et al. (2012) [17], and Neges et al. (2017) [18] proposed a system that points an arrow in the direction of the destination by recognizing the user’s present location using images. Kurihara et al. (2014) [19] developed a marker-based indoor navigation system that allows location information to be shared. Wang et al. (2018) [20] proposed a mobile navigation system, adopting a multitarget AR recognition mechanism and polygon approximation-based data acquisition. Zhou et al. (2019) [21] designed a tourist attraction guide system combining image-recognition technology and AR technology.
In (3), Fukada et al. (2011) [22] developed a system that provides sightseeing information using image-recognition AR, while Han et al. (2014) [23] developed a mobile sightseeing application that provides information related to urban heritage using location-based AR. Komoda et al. (2013) [24] developed a system that provides information related to regional movies using images. Jung et al. (2015) [25] used a quality model to test user satisfaction and intention to recommend marker-based augmented reality applications in the case of a theme park. Ma et al. (2018) [26] developed a smart sightseeing application system combining AR technology and a paper sightseeing map for emergency response. Blanco-Ponsa et al. (2019) [27] presented an application that provides information related to cultural heritage. Makino et al. (2019) [28] developed a system that visualizes spatiotemporal information in both real and virtual spaces, integrating social networking services (SNS), Web GIS, mixed reality (MR) and the original gallery system, as well as Wikitude and connecting external social media. Both virtual reality (VR) and AR are integrated into MR that is used in the system for area-based learning and sightseeing.
In (4), Kusano et al. (2013, 2015) [29,30] developed a disaster information sharing system, while Yamamoto (2018) [7] and Abe et al. (2019) [8] developed sightseeing support systems using nonlinguistic information, including pictograms, as mentioned in the previous section. Sándor (2017) [31] examined the impact of weather-related warning message signs on traffic in adverse weather circumstances on motorways. Hayashi et al. (2019) [32] proposed an information-providing method to express train service situations in central urban areas by combining multiple pictograms, such as sign–logo images. Kołodziejczak (2019) [33] analyzed the information systems on internet tourist portals and suggested the uses of various symbols for accessible sightseeing for people with disabilities.
From the results of (1) and (2), i.e., the studies related to navigation using location-based AR and image-recognition AR, in smart cities, it is evident that AR is one of the powerful smart tourism tools to appropriately navigate the general public to their destinations. However, the AR smart glasses, which were used in Fujita et al. (2016) [5], Zhou et al. (2016) [6], and Rehman et al. (2017) [9], have not been popular all over the world. Moreover, considering the limitations of Kurihara et al. (2014) [19] and Zhou et al. (2019) [21], in the case of outdoor navigation, object-recognition AR is more suitable than image-recognition AR to show the information related to specific spots. The results of (3), i.e., the studies related to information services using AR, show that the general public, in addition to scientists and technicians, can efficiently obtain various information by means of AR technologies. Additionally, the results of (4), i.e., the studies related to information services using pictograms, indicate it is possible to develop a user-friendly system of universal design for both Japanese and foreigners by adopting nonlinguistic information.
In reference to the aim of the present study, as mentioned in Section 1, it is essential to integrate location-based AR and object-recognition AR and use pictograms in a unique system, despite these methods being separately adopted in the above 4 study fields. Therefore, in comparison with the abovementioned studies, the present study demonstrates originality by developing a unique system that can provide guidance and information concerning sightseeing spots by integrating location-based AR and object-recognition AR as smart tourism tools and by using pictograms as nonlinguistic information. Specifically, considering the findings and limitations based on the results of the above preceding studies, the present study demonstrates originality by navigating users to sightseeing spots, as well as by providing sightseeing spot information, using both location-based AR and object-recognition AR, in addition to visualizing and providing information about facilities near sightseeing spots on mobile information terminals using location-based AR and pictograms. Therefore, by means of the system, it is expected that even those who are not good at reading maps in either the digital or paper format or at using Google Maps and who have limited knowledge or sense of locality would be able to fully enjoy sightseeing.
3. System Design
3.1. System Characteristics
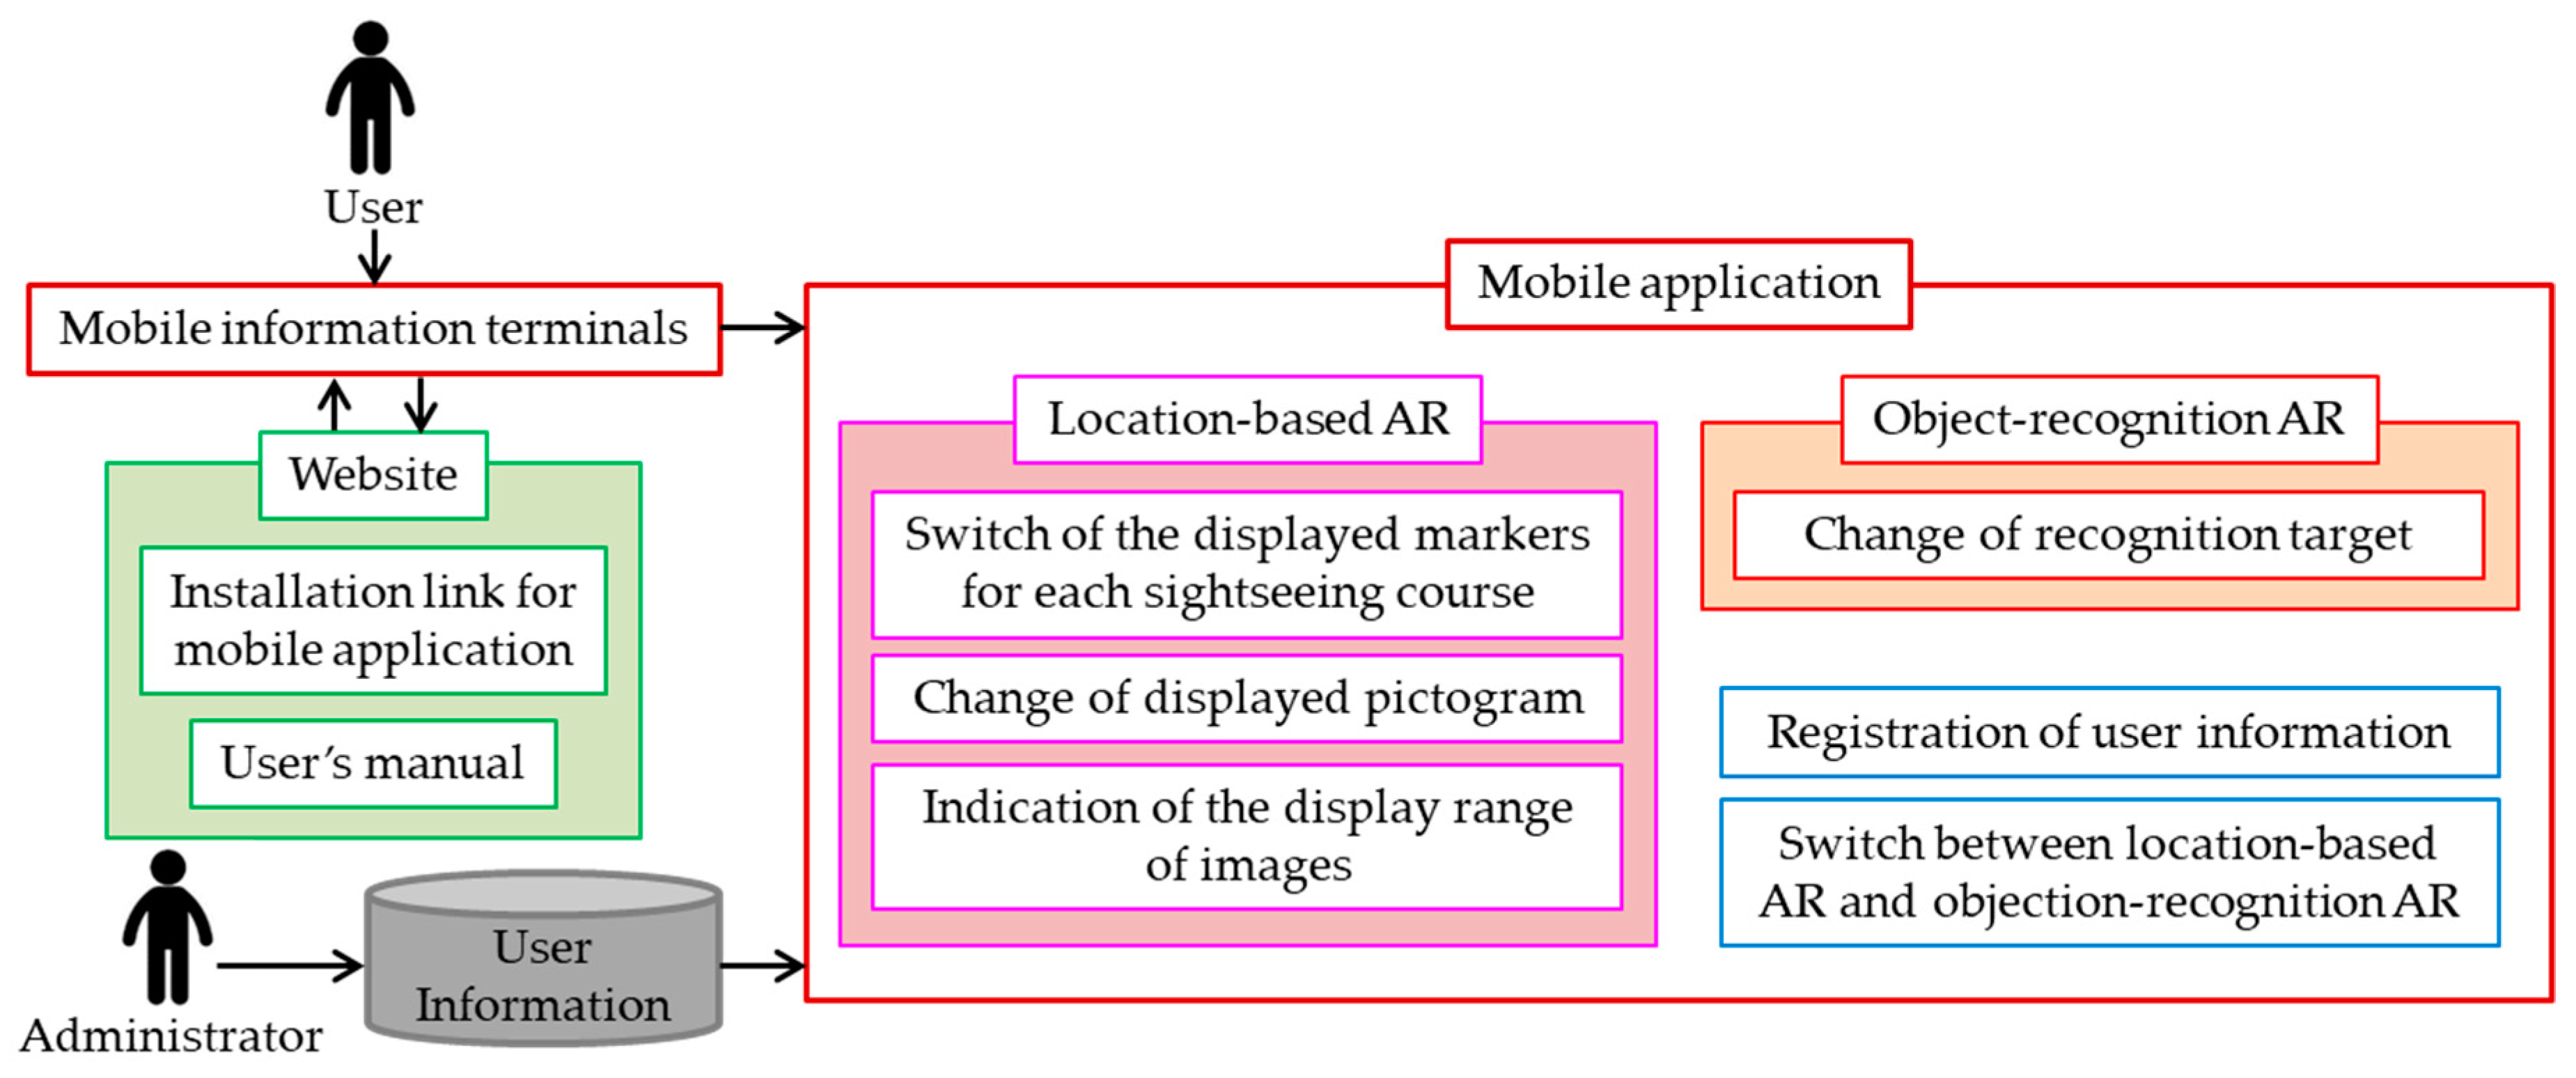
As shown in Figure 1, the system in the present study is composed of the website and the original mobile application, and the latter is uniquely developed by integrating location-based AR and object-recognition AR and by using pictograms. To use the system, users must first access the website on their mobile information terminals, such as smartphones and tablet PCs, and install the original mobile application that has been uploaded onto the online storage. Then, users can start using the system by activating the application and registering their information, including email addresses and passwords.
Using images, such as pictograms, that are provided by location-based AR, the system can display the directions to sightseeing spots and nearby facilities on the screens of mobile information terminals and provide the navigation to each destination. Furthermore, as the system displays images on mobile information terminals in a way that overlaps with the actual world using location-based AR, users do not need to walk around with pamphlets or guidebooks. Additionally, as users can easily obtain the relevant information by pointing the mobile information terminal in the direction of the sightseeing spot and using object-recognition AR, the system contributes to raising efficiency while sightseeing. Therefore, with a system that makes obtaining sightseeing information efficient, tourists who are not familiar with the local area can enjoy sightseeing without relying heavily on information found on the internet.
3.2. Usefulness of the System
The following three points explain the usefulness of the system.
(1) Guidance and information services using AR
The system displays images for sightseeing spots, as well as pictograms for facilities near sightseeing spots, which enables users to know the directions of their destinations. As the images are displayed using AR, those who are not skilled at reading maps can also grasp the directions through the screen of their mobile information terminals. Additionally, users can obtain the related information without having to go online to research the sightseeing spots they wish to visit by pointing their mobile information terminals to sightseeing spots or their images.
(2) Information services using pictograms
The system uses nine types of pictograms (i.e., stations, convenience stores, public restrooms, lodging facilities, restaurants, parking lots, police stations, bus terminals, and rental cars) provided by the Foundation for Promoting Personal Mobility and Ecological Transportation [34]. Therefore, users can easily understand what facilities are indicated by the pictograms displayed on the screens of their mobile information terminals.
(3) Dynamic and real-time services
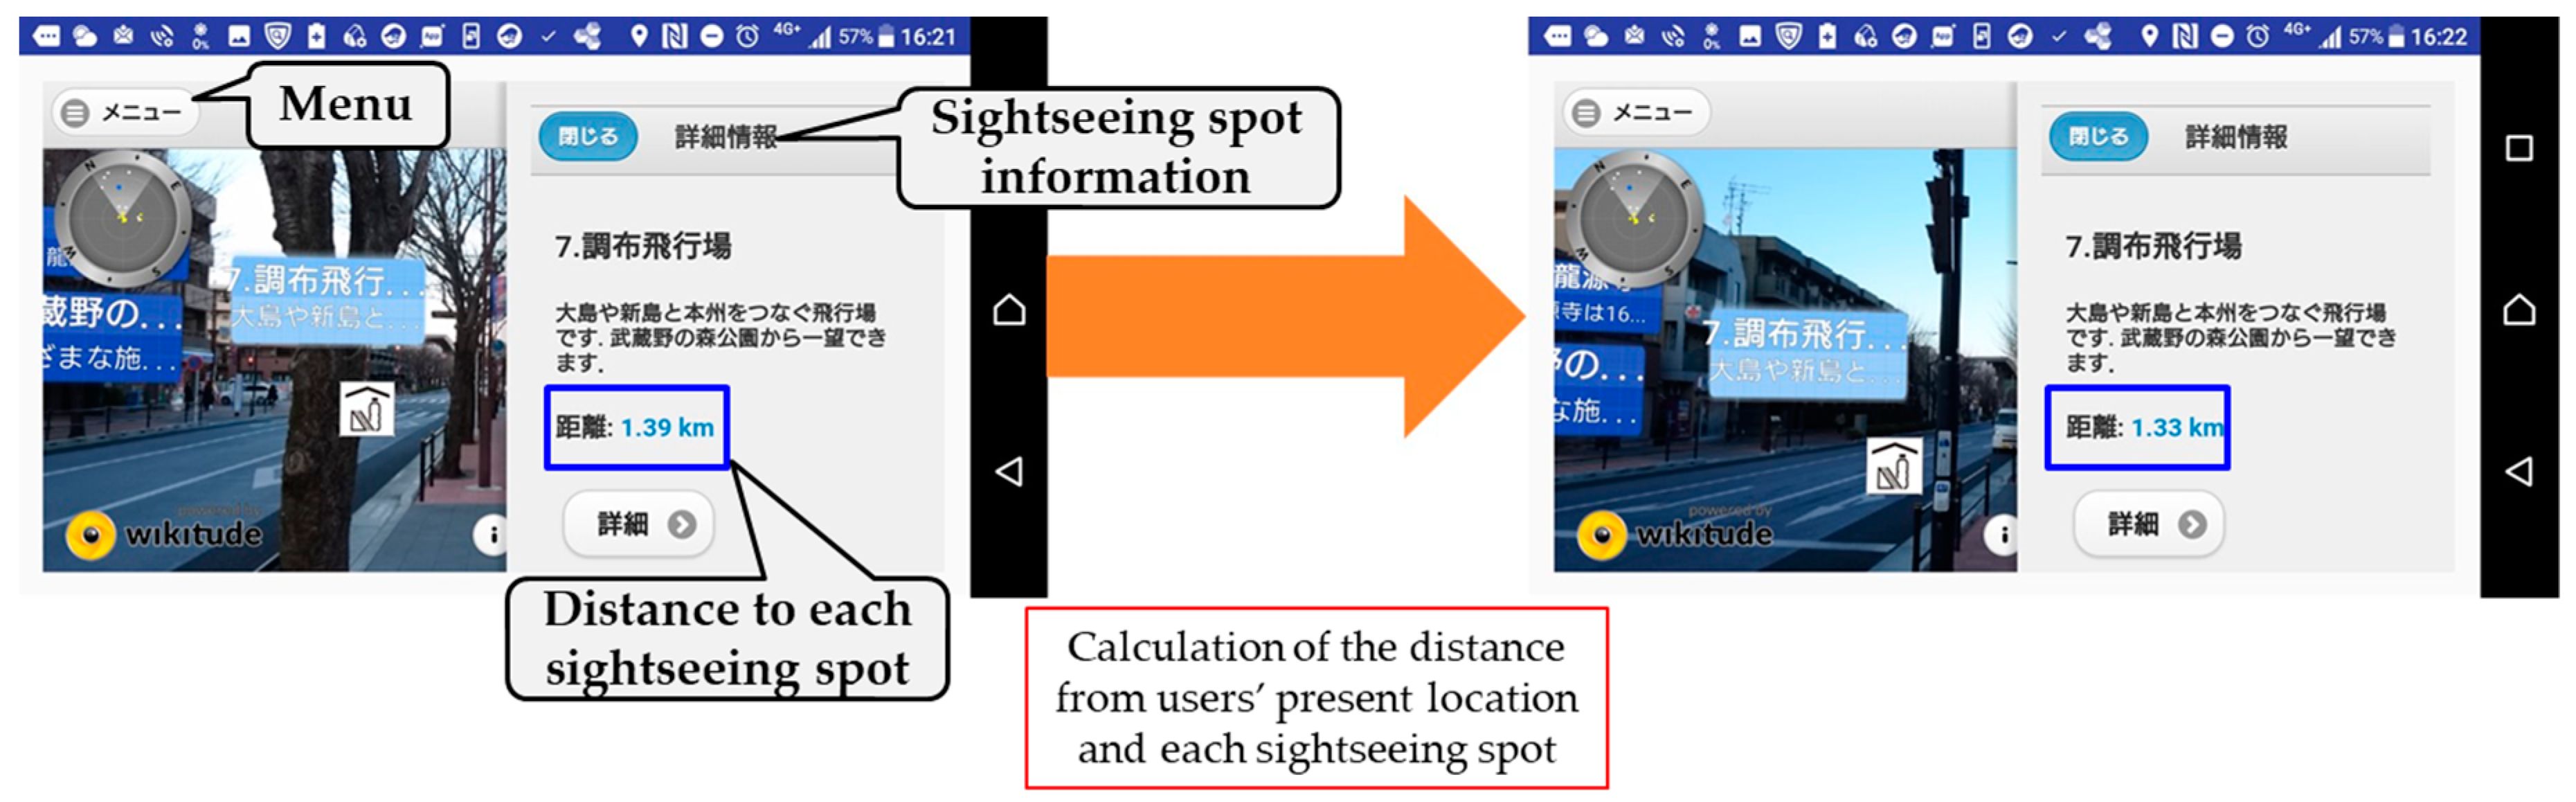
The distances from users’ present locations to all sightseeing spots are constantly updated in real-time. Therefore, the users’ location information is updated by GPS, and the distance to each sightseeing spot can be provided to them on a real-time basis. Additionally, the above nine types of pictograms that are nearest to the users’ present locations will be displayed each time the distance information is updated, which helps users to see what facilities are available nearby.
3.3. Target Information Terminals and Operating Environment
The system is meant to be used mainly on mobile information terminals both indoors and outdoors. As the mobile application used on mobile information terminals is set to be an Android application, the OS is also required to be Android (5.0 or higher). Due to the system requirement of Wikitude SDK used in application development, mobile information terminals must have a compass, network positioning, an accelerometer, high resolution, high-performance CPU and OpenGL (2.0 or higher), in addition to a camera and GPS function.
3.4. Overview of the System Design
As mentioned in Section 3.1, the system in the present study is composed of the website and original mobile application, and the latter is uniquely developed by integrating location-based AR and object-recognition AR and by using pictograms. The application can be downloaded from the website. Additionally, the images used for object-recognition AR and user’s manual can be viewed. The following will provide an explanation concerning the application, as well as location-based AR and object-recognition AR, that makes up the application.
3.4.1. Mobile Application
In the system, the mobile application that is uniquely developed by integrating location-based AR and object-recognition AR, and by using pictograms in an Android application. In developing the application, Android Studio, which is an integrated development environment for mobile applications, as well as Wikitude SDK, which is the SDK for AR application development that can be installed into Android Studio, were used. Android Studio can not only develop an application layout but can also confirm the camera and GPS permissions installed into Android devices as well as load the location information of the mobile information terminals. Since Wikitude SDK uses web technologies, such as HTML and JavaScript, the screen layout for the application was developed using xml files for Android Studio, HTML files, and CSS files.
For Android Studio, Java was used to set the camera and location information of the mobile information terminals, while JavaScript was used in Wikitude SDK to develop location-based AR and object-recognition AR. The screen layout was designed using HTML files and CSS files, while the user interface was designed using jQuery Mobile.
3.4.2. Location-Based AR
As the basic function of location-based AR, in addition to the marker images indicating the directions of sightseeing spots, the pictograms indicating facilities, such as stations and public restrooms, are displayed on the screens of mobile information terminals, and the directions are provided to sightseeing spots and nearby facilities. Furthermore, users can tap the image on the screens to see the name of each sightseeing spot and the distance to it and tap the marker to refer to each sightseeing spot information.
When starting the mobile application, the location-based AR screen will always appear. When this screen comes up, the user’s present location will be determined using GPS, and the images of sightseeing spots and nearby facilities will be allocated in each specified part of the screen. Then, the distance from the user’s present location to each sightseeing spot will be calculated. While the location-based AR screen is up, the present location will be constantly updated on a real-time basis using GPS, and the distance to sightseeing spots and nearby facilities displayed as images on the screen will be recalculated. Therefore, the system can provide users with real-time distances to each sightseeing spot.
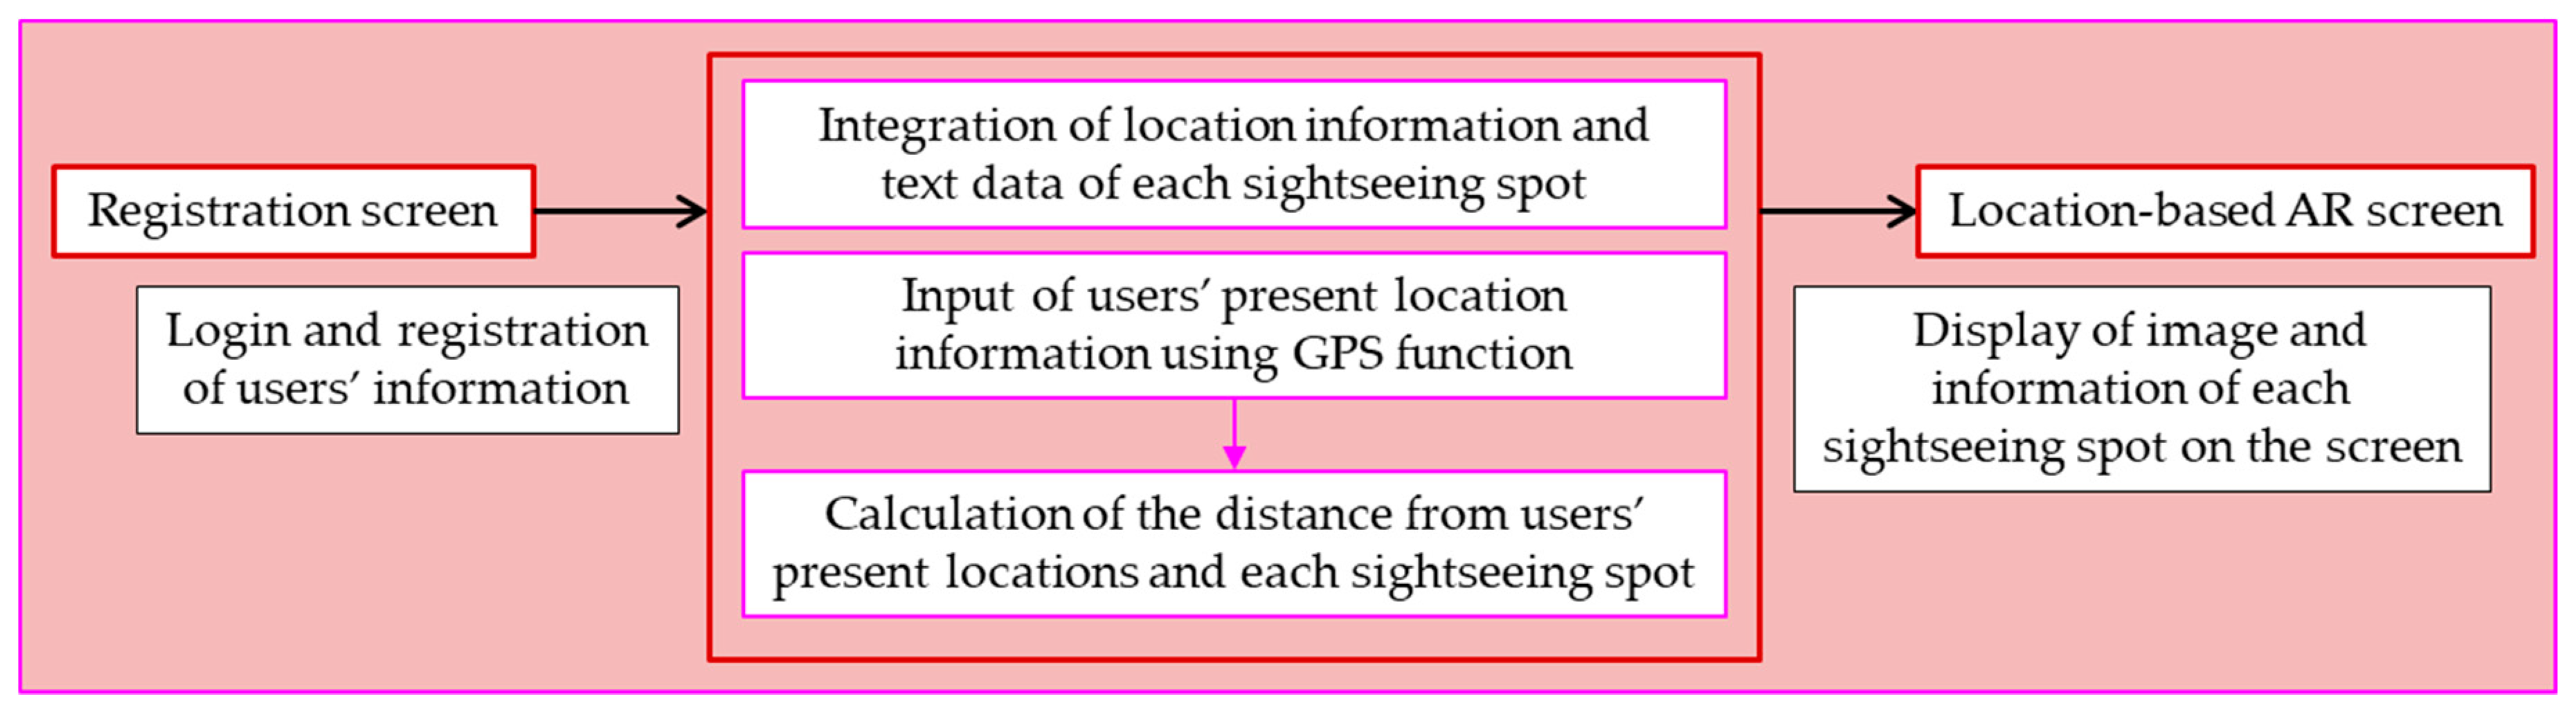
As the displayed image is allocated based on the location information (latitude and longitude) of sightseeing spots and nearby facilities, the location information of such places is researched using Google Maps. The file, along with the names of such places, was added into the application in the JSON format. Regarding pictograms, the location information and numbers according to the type of facility were added, and the pictogram that corresponds to each number was set to be displayed. The process mentioned above is shown in Figure 2.
3.4.3. Object-Recognition AR
As the basic function of object-recognition AR, sightseeing spots can be recognized by pointing a mobile information terminal at actual sightseeing spots or the images of such places, and the related information can be displayed on the screen. Users can switch between the screens of object-recognition AR and location-based AR.
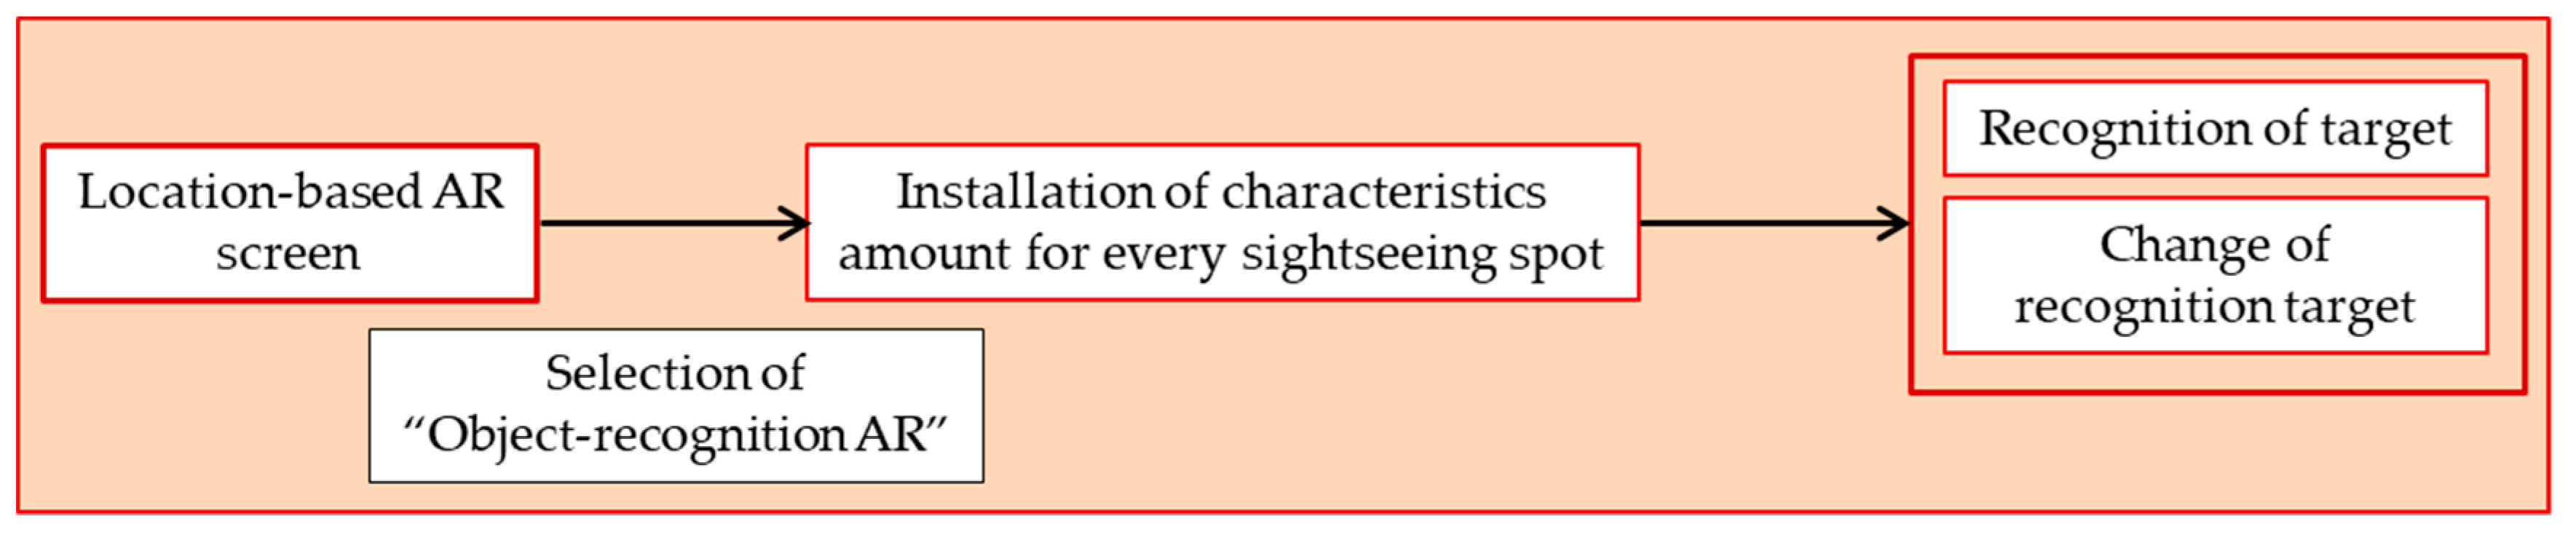
Object-recognition AR uses a web tool called Wikitude Target Manager provided by Wikitude to register 20 to 30 images of one sightseeing spot that is recognized. After the number of characteristics for the objects used in the recognition of registered images were extracted, files containing the characteristic amount for every sightseeing spot were downloaded and installed in the mobile application. Additionally, the images displayed for sightseeing spots were also installed into the application, and the location settings of each image were determined. The process mentioned above is shown in Figure 3.
4. System Development
4.1. The Front End of the System
The system will implement unique functions for users, which will be mentioned below, in response to the aim of the present study, as mentioned in Section 1. To implement the unique functions below, the system is composed of the website and original mobile application, and the latter was uniquely developed by integrating location-based AR and object-recognition AR and the use of pictograms. The basic functions of these two types of AR are described in Section 3.4.2 and Section 3.4.3. In addition to the basic function of using location-based AR, the three functions are available to switch the displayed markers for each sightseeing course, change the displayed pictograms, and indicate the display range of images. Additionally, using object-recognition AR, the function is available to change the recognition target.
4.1.1. User Registration Function for the System
The user registration function in the system uses Firebase Authentication. After installing the mobile application in the mobile information terminal and starting it for the first time, the registration screen for user information will come up. Users can create their own accounts using either their email addresses and passwords or their Google accounts. After confirming that the registered account has not already been registered, location-based AR will automatically be activated.
4.1.2. Function to Switch the Displayed Markers for Each Sightseeing Course When Using Location-Based AR
Regarding the operation target area of the system, areas offering multiple sightseeing routes are assumed. The system enables the display of markers that indicate the directions of sightseeing spots within the course. In this way, users can change the markers for each sightseeing course by tapping on the sightseeing course they wish to display on the screens.
4.1.3. Function to Change Displayed Pictograms When Using Location-Based AR
In the system, every time the distance information is updated, the 10 nearest pictograms to the users’ present locations are displayed on the screens of their mobile information terminals, which helps them to know what facilities are available nearby. Additionally, using the checkbox next to the category name of each facility, users can see the 10 nearest pictograms from the selected facility categories. For example, if users wish to see the directions only for the nearest restaurants, the restaurant category can be selected, and pictograms for restaurants only will be displayed on the screens of their mobile information terminals.
4.1.4. Function to Indicate the Display Range of Images When Using Location-Based AR
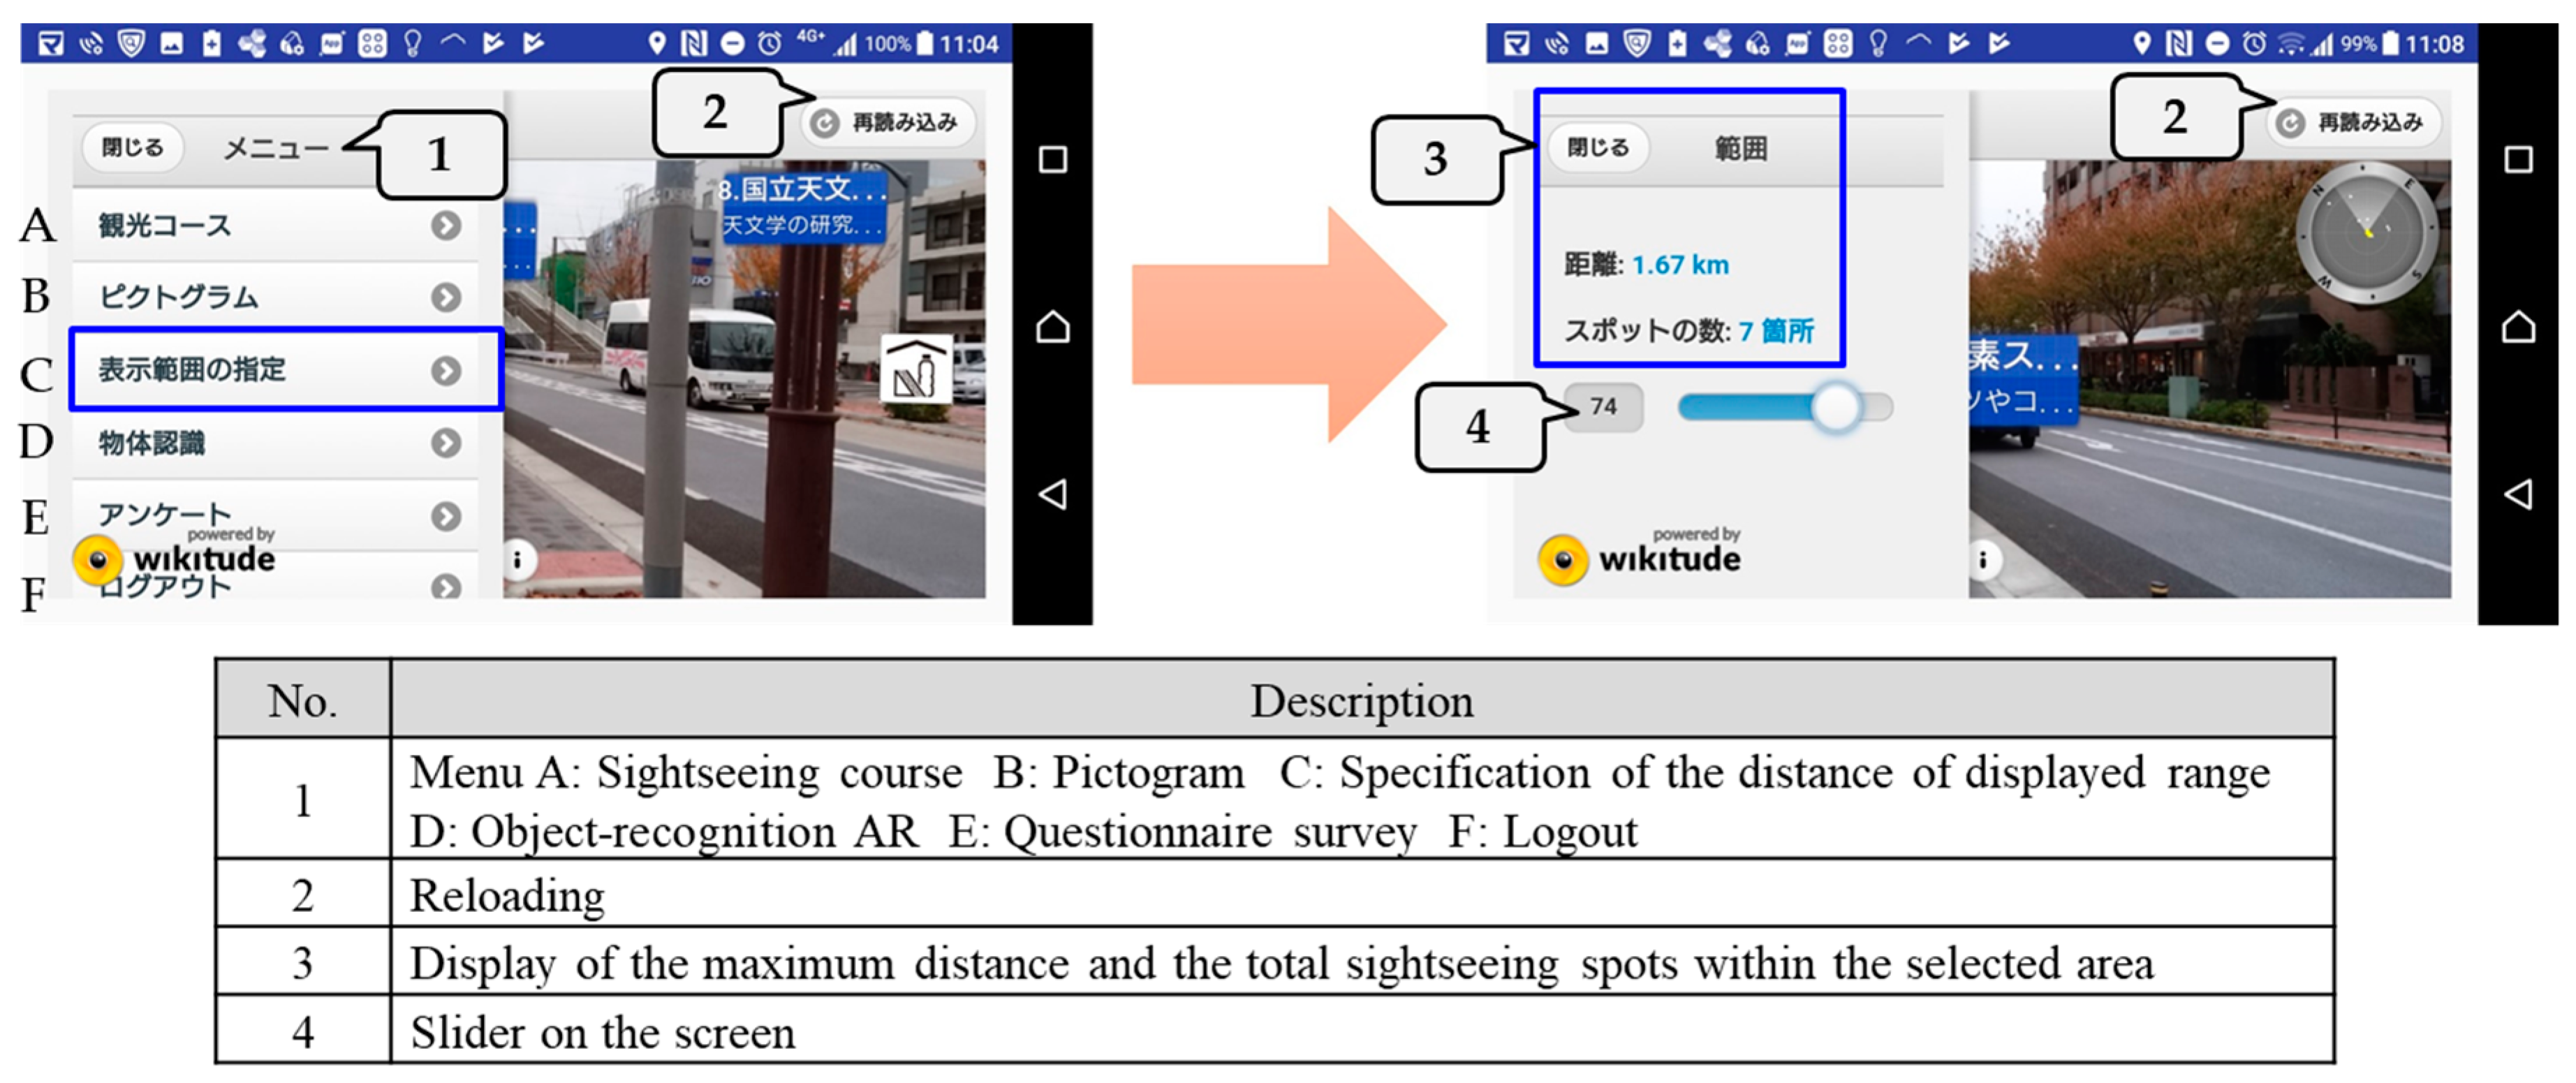
When using the system, users may want to limit the displayed images of sightseeing spots and nearby facilities to within a specific area. In this case, the displayed range can be changed by moving the slider on the screen sideways, as shown in Figure 4. Every time the displayed range is changed, the maximum distance and total sightseeing spots within the selected area will be displayed on the screen. The process of selecting the displayed range is shown in Figure 4.
4.1.5. Optional Function to Switch between Location-Based AR and Object-Recognition AR
When visiting sightseeing spots on the sightseeing course, the system enables users to easily switch between the location-based AR and the object-recognition AR screens to obtain the relevant information by pointing their mobile information terminals at the sightseeing spot. While users are on the location-based AR screen, users can go to the menu, select “Object-recognition AR”, and move to the object-recognition AR screen.
4.1.6. Function to Change Recognition Target When Using Object-Recognition AR
When changing the sightseeing spot that is the recognition target for object-recognition AR, users can select a favorite sightseeing spot from the recognition target list of the menu.
4.2. System Back End
4.2.1. Update of the Distance Information and Location Information Using GPS
In the system, the users’ present locations are determined using the GPS installed into their mobile information terminals. When the users’ present locations are updated, the distances to all sightseeing spots are displayed as images on the screens are also updated. As the updated distance information is reflected on a real-time basis, users can know the distance to each sightseeing spot by simply tapping on the image displayed on the screens. Figure 5 shows the real-time updates of distance information.
4.2.2. Changing the Marker Height Level and Displayed Pictograms According to the Updated Distance Information
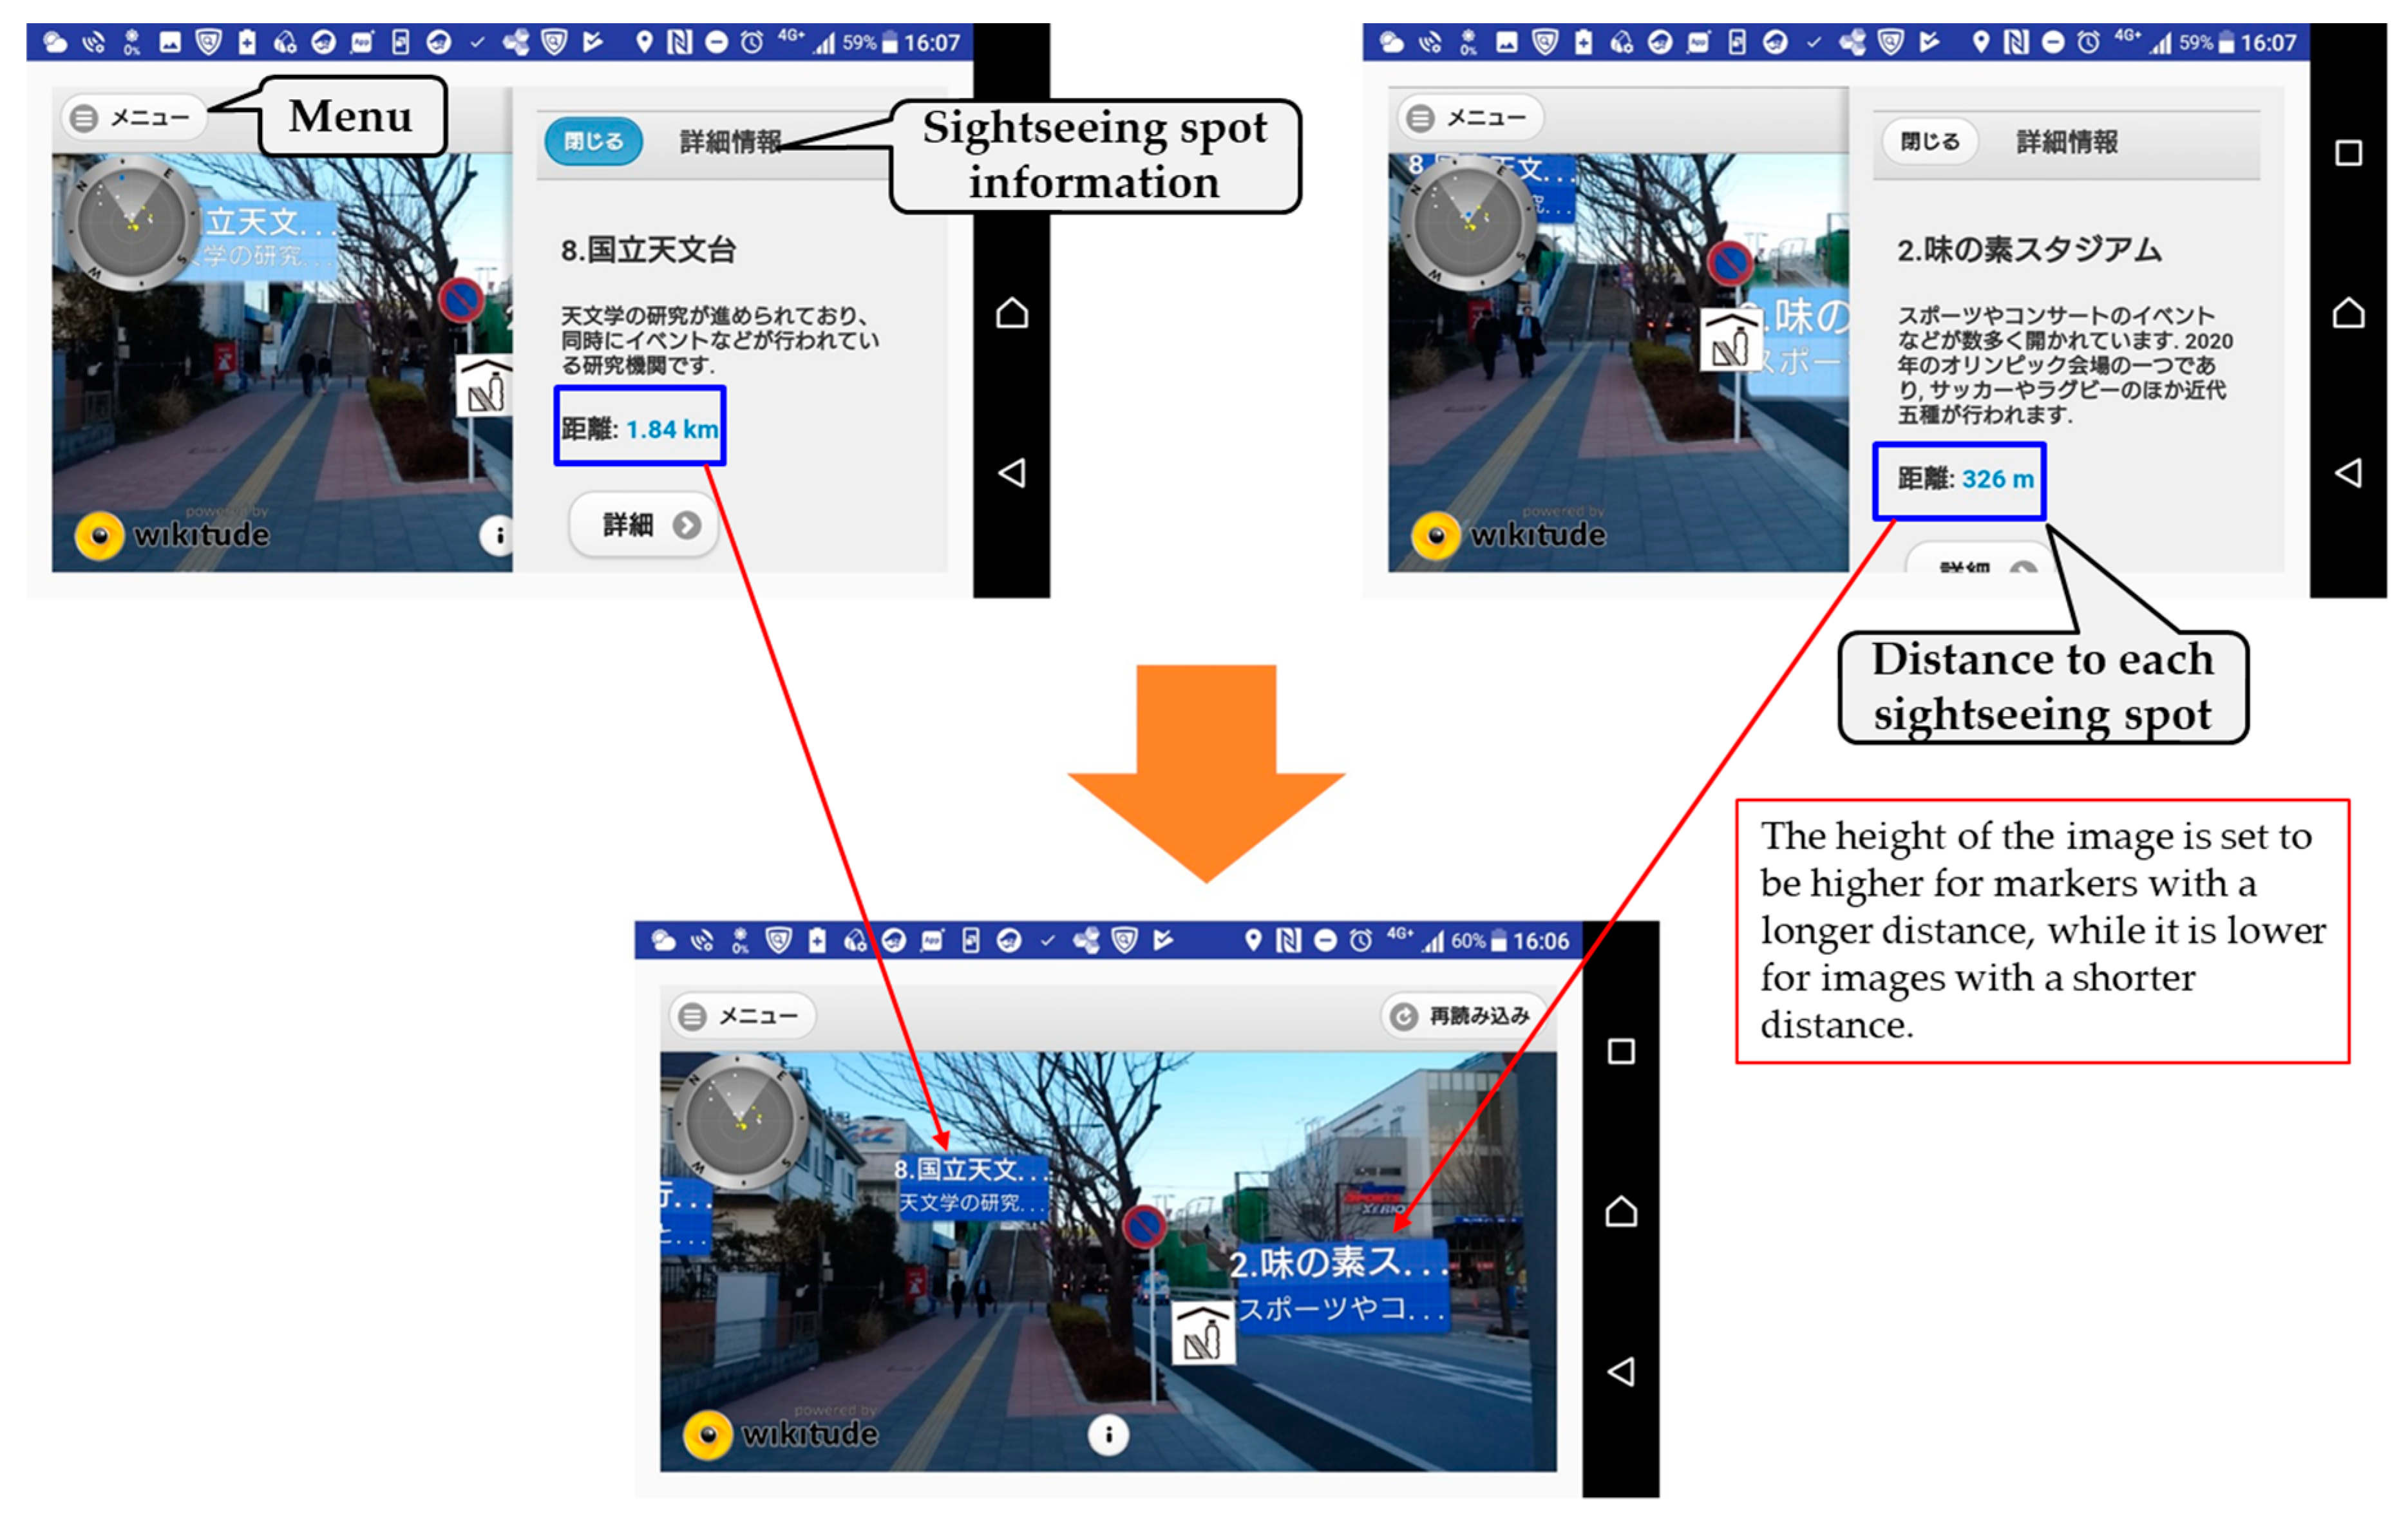
After the distances from the users’ present locations to all sightseeing spots are calculated, the height of the image is set to be higher on the screen for farther away markers, while it is lower for closer images. This prevents the markers from becoming invisible or unable to be tapped on due to overlapping and helps users to intuitively understand which facilities are available nearby. The pictograms are arranged from shortest to longest distances from the users’ present locations, and the first 10 nearest pictograms are displayed. In this way, the system can prevent overcrowding by a large number of pictograms on the screen and clearly show the directions to facilities near users. Figure 6 shows how the marker height differs according to the distance information.
4.2.3. Users’ Information Management Using Firebase
Administrators manage registered users’ information, including email addresses and passwords, using the Firebase console. Users can register their email addresses and passwords on the registration screen that is displayed right after starting the mobile application for the first time, which enables the information to be automatically reflected to the console. Administrators can operate the console to delete or invalidate the account information registered by users.
4.2.4. Data Management Using Android Studio
Regarding location-based AR, the files, including the locations and names of sightseeing spots and nearby facilities, are loaded, and images are allocated in the appropriate places on the screen. Administrators manage the names of sightseeing spots as well as where to display images within Android Studio. Additionally, the images used for both location-based AR and object-recognition AR and the HTML files that make up the interface are managed within Android Studio. When administrators update the information, it is edited within Android Studio, the apk files are output, and they are uploaded onto the downloadable online storage. Afterward, users download the apk files and update the mobile application. In this way, administrators are able to update the data within the application.
4.2.5. Recognition Target Management by Means of Wikitude Target Manager
As mentioned in Section 3.4, object-recognition AR can be used by registering recognition target images to Wikitude Target Manager. Administrators create a project to register images to Wikitude Target Manager, and images of sightseeing spots are registered there. By doing so, the number of characteristics for recognition targets is automatically extracted, and this can be confirmed by the administrators. After the extraction of the characteristic amount, administrators can click on “Download WTO” within the project, download the wto files that include the characteristic amount for each sightseeing spot, and install these files into the mobile application. Then, by opening the installed wto files, sightseeing spots can be recognized.
4.3. System Interface
4.3.1. Interface of Location-Based AR Screen
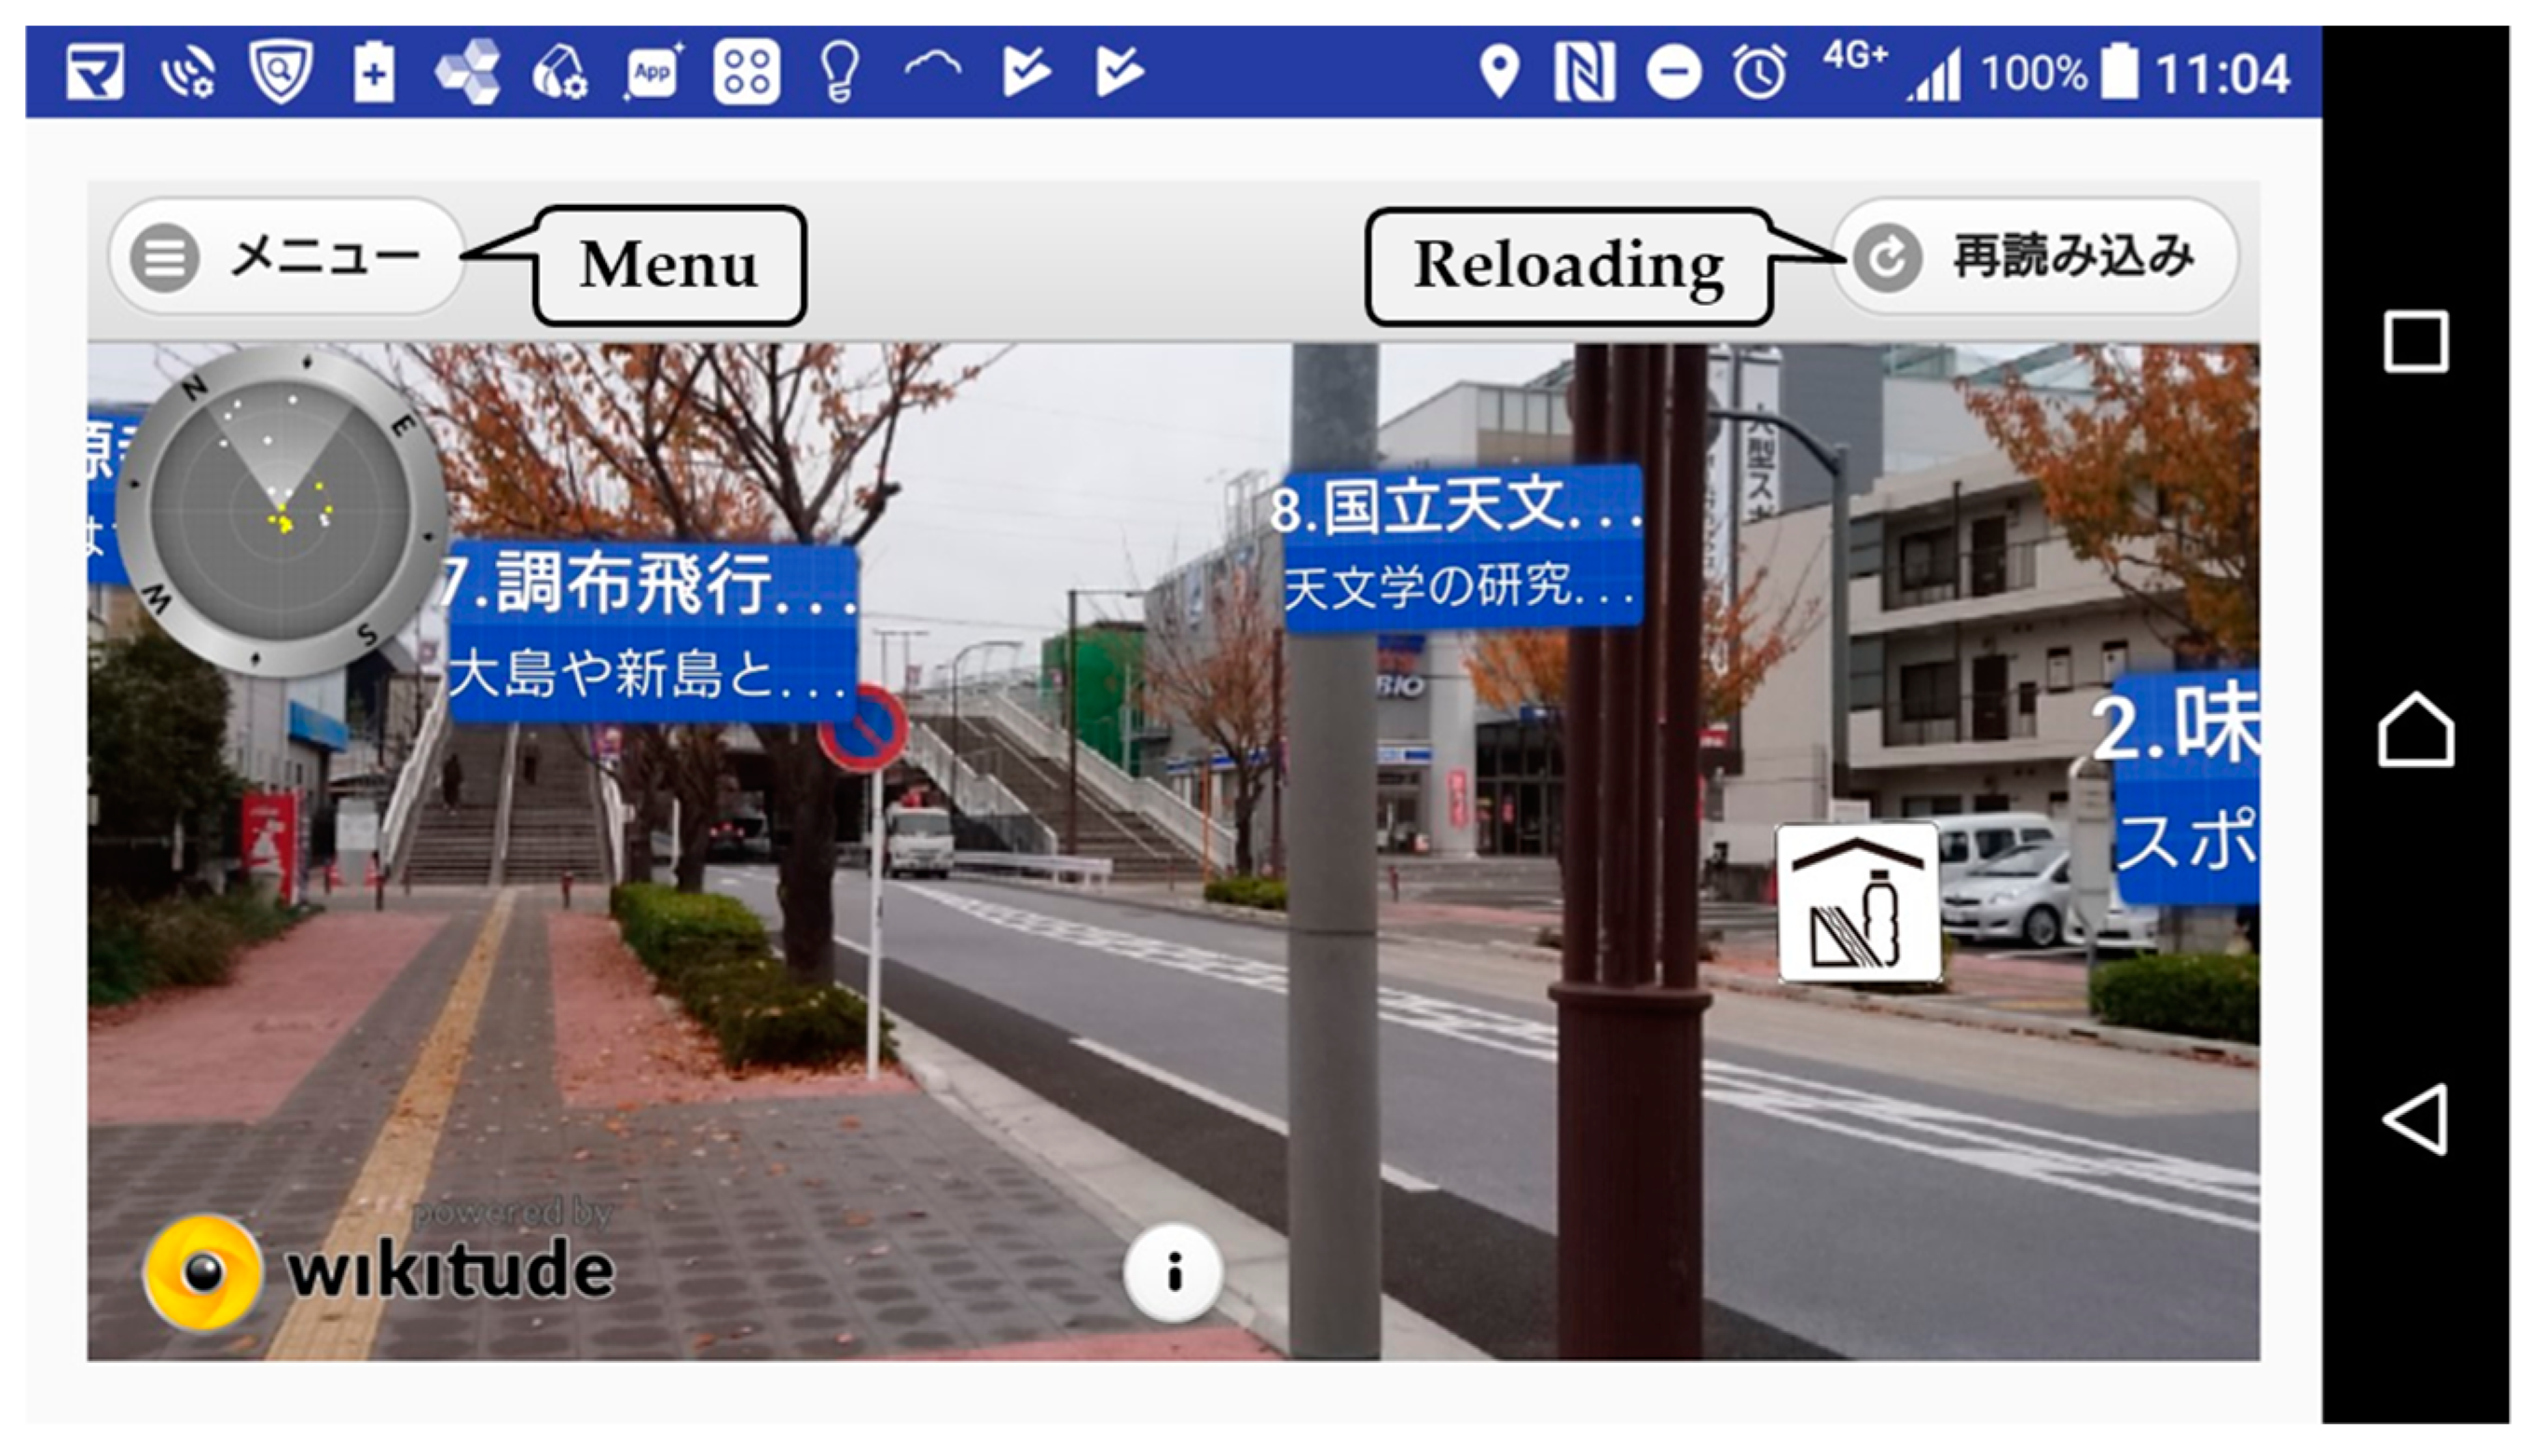
The interface when using location-based AR is shown in Figure 7. The functions introduced in Section 4.1 can be used by going to the menu button on the top left of the screen. Because the main functions used in the system can be selected from the menu and users can freely select any functions they wish to use, the interface can be easily operated even by those who are not familiar with mobile applications that use AR. If the image display is not working properly, users can use the reload button on the top right-hand corner of the screen to reload the image and recalculate the distance.
4.3.2. Interface of Object-Recognition AR Screen
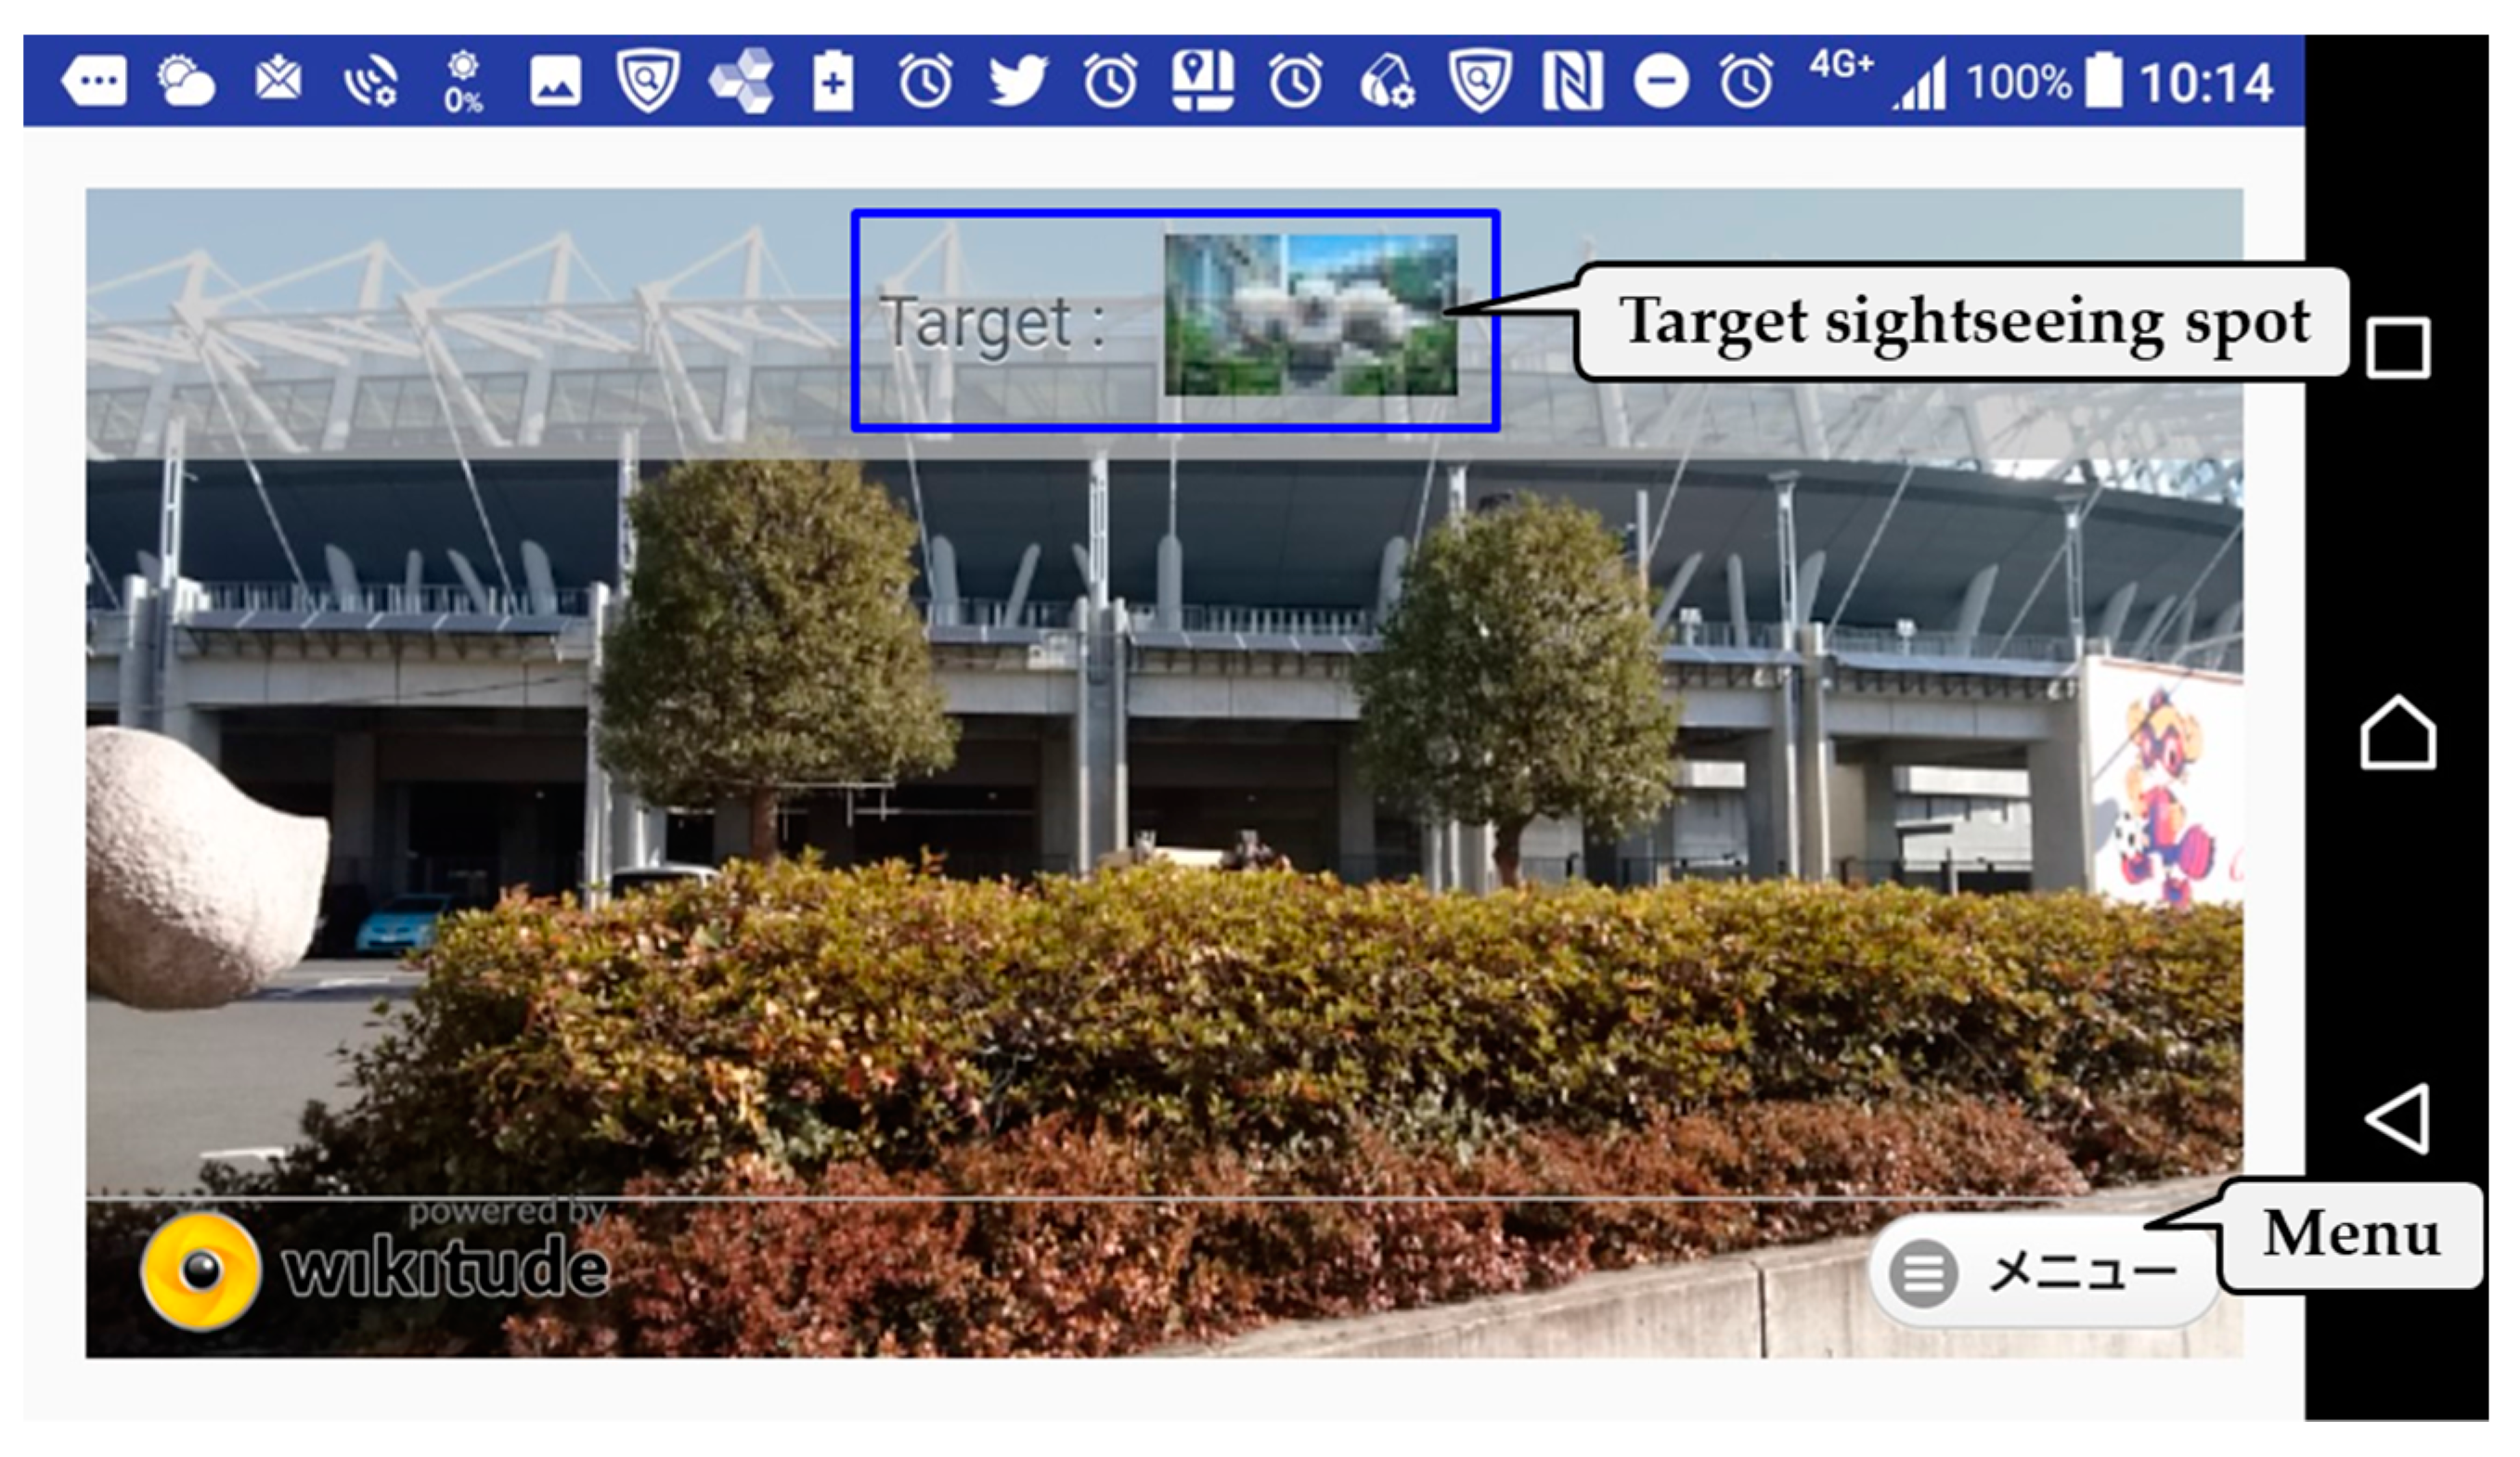
The interface when using object-recognition AR is shown in Figure 8. Users can change the recognition target and move to the location-based AR screen by clicking on the menu on the bottom right-hand corner of the screen. The images of sightseeing spots that can be recognized by mobile information terminals will be displayed on the screen and automatically updated when the recognition target is changed. Therefore, users can know the directions to currently recognized sightseeing spots.
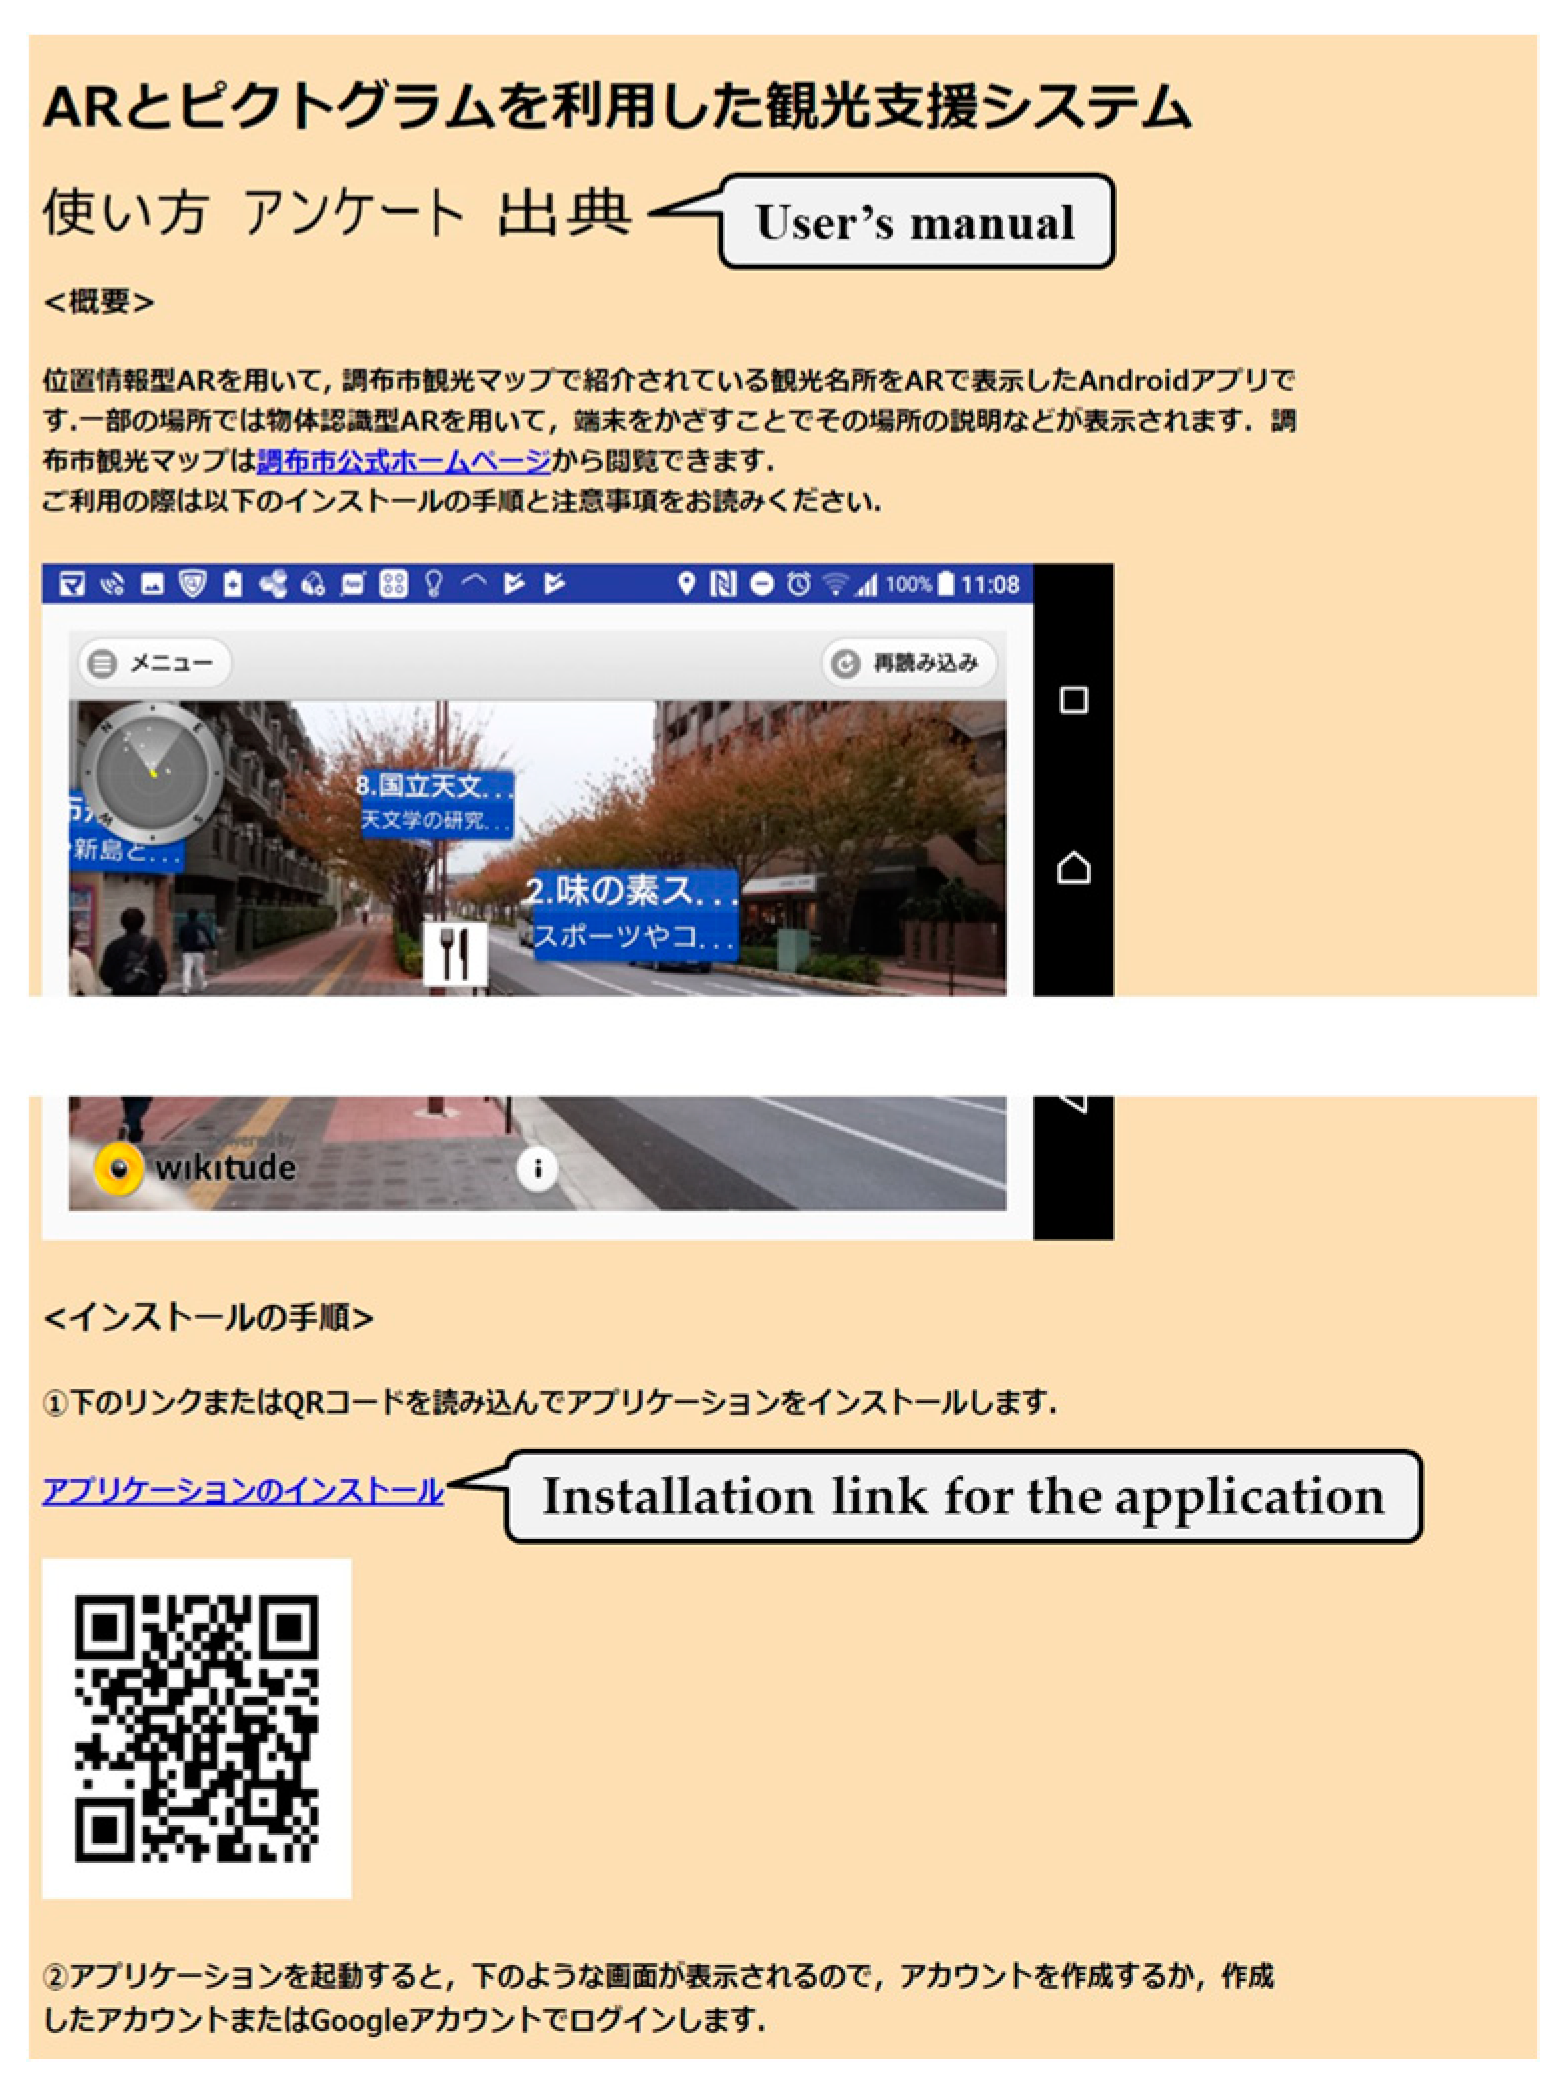
4.3.3. Website Interface
The website has an installation link for the mobile application, as well as a user’s manual. Because the website is expected to be accessed from PCs, as well as from mobile information terminals, such as smartphones and tablet PCs, it was designed to improve the visibility of the display for the screens of information terminals used to access the website. Additionally, when installing the application, if the website is accessed from PCs, a quick response code (QR code) that links the application download is displayed to enable the application installation into a mobile information terminal, even when using PCs to access the site. The website interface is shown in Figure 9.
5. Operation
5.1. Selection of the Operation Target Area
The city of Chofu in the metropolis of Tokyo was selected as the operation target area for the system. The reason behind this selection was that (1) there are multiple sightseeing routes, (2) famous sightseeing spots are scattered throughout the entire city, and (3) there has been an increase in foreign as well as Japanese tourists. The sightseeing routes within Chofu city include the “Route of Kondo Isami (a famous samurai who was born around present-day Chofu city at the end of the Edo era) and green space”, “Route of Gegege no Kitaro (a Japanese cartoon setting in Chofu city) and the Jindai-ji Temple”, “Route of City of the Movie, Chofu, and Tama River”, and the “Route of art and culture in the Sengawa District”. The target sightseeing spots for object-recognition AR are the “Monument for the marathon halfway point at the time of the Tokyo Olympic Games in 1964”, “Monument for movie actors”, “Sengawa Ichirizuka (milestone)”, and “Jindai-ji Castle ruins”.
5.2. Operation Overview
5.2.1. Operation Period
The system was operated for 1 month (23 November–28 December 2018) with participants both inside and outside the operation target area. Whether inside or outside the operation target area, the operation of the system was advertised using the website of the authors’ lab, as well as Twitter and Facebook. Additionally, the tourism department of Chofu city supported the present study by distributing pamphlets and user’s manuals. Users were able to register their information by creating their own accounts using either their email addresses and passwords or their Google accounts. After registration, users were automatically moved to the location-based AR screen where they could use the various functions of the system.
5.2.2. Operation Results
Table 1 indicates an overview of the system’s users. There were a total of 50 users, with 29 male and 21 female users. Regarding the age of the users, there were many users in their 20s for both males and females, making up 38% of the total. Twenty-four percent were in their 50s, and 16% were in each of the teens and 40s categories. These statistics show that the system was not only used by younger generations but also by various age groups.
6. Evaluation
After the end of the operation, a web questionnaire survey and an access analysis of the users’ log data were conducted to evaluate the system developed in the present study.
6.1. Evaluation Based on a Web Questionnaire Survey
6.1.1. Overview of the Web Questionnaire Survey
Along with the aim of the present study, a web questionnaire survey was implemented to conduct an (1) evaluation concerning compatibility with the information obtainment method, (2) evaluation concerning the usage of the system, and (3) evaluation concerning the functions of the system. The web questionnaire survey was conducted for 1 week after the start of the operation. The response rate was 100%, as all 50 users responded, as shown in Table 1.
Furthermore, regarding the frequency of visits to Chofu city, 36% answered “a few times a year”, 12% answered “never”, 34% answered “every day”, and 14% answered “a few times a week”. Therefore, approximately half of the users do not often visit Chofu city, and it is evident that they were not familiar with this area.
6.1.2. Evaluation Concerning the Compatibility with the Information Obtainment Method
Regarding the use of applications with AR, 24% of the users used it regularly, while 76% did not. However, 92% of the users had obtained information related to sightseeing spots using the internet. Therefore, although most users were not familiar with the applications with AR, the need for the system to effectively provide sightseeing information via the internet was made clear.
6.1.3. Evaluation Concerning the Usage of the System
(1) Evaluations concerning the use of pictograms
Of the nine types of pictograms mentioned in Section 3.2, the pictograms that were especially useful were “convenience stores” (76%), “stations” (71%), “restaurants” (63%), and “public restrooms” (59%). The reason for this outcome was that these facilities are frequently used by users on a regular basis. As these facilities are not only frequently used while sightseeing but also in everyday life, users tend to look for information concerning such facilities. On the other hand, pictograms that were not as useful were “rental cars” (10%), “police station” (20%), and “lodging facilities” (20%). This result is because both the opportunity and situations where such facilities are used are limited.
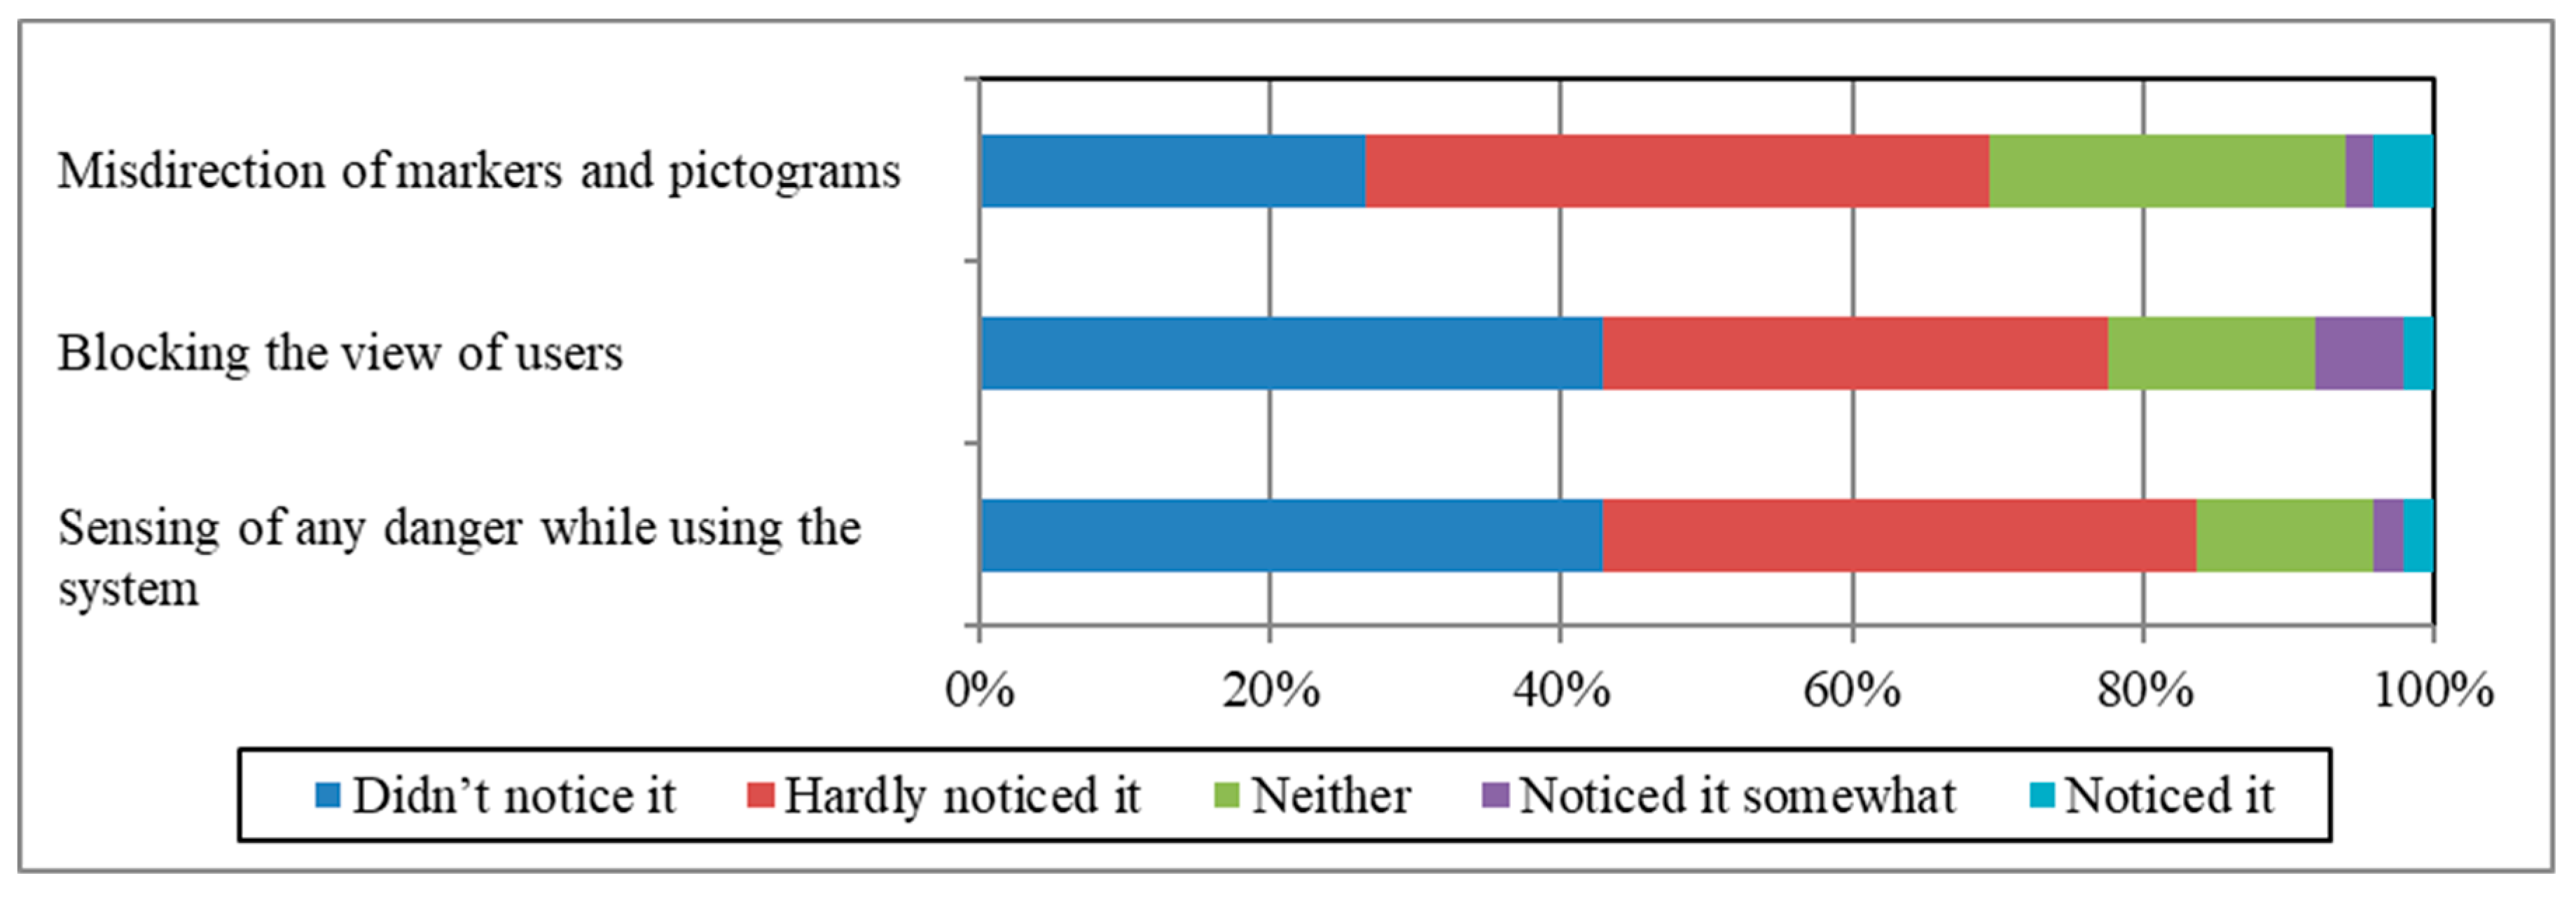
(2) Evaluations concerning the usage condition of the system
Figure 10 shows the evaluation results for the usage condition of the system. Regarding incorrect directions of markers and pictograms, 70% answered “didn’t notice it” or “hardly noticed it”, while 25% answered “neither”. Regarding the blocking of the view of users, 78% answered “didn’t notice it” or “hardly noticed it”, while 14% answered “neither”. As mentioned in Section 6.1.1, this result is because approximately half of the users were not familiar with Chofu city and could not determine whether there were incorrect directions or vision obstructions. Regarding the sensing of any danger while using the system, 84% answered “didn’t feel any danger” or “hardly felt any danger”, which indicates that almost all users felt barely any type of danger while using the system.
6.1.4. Evaluation Concerning the Functions of the System
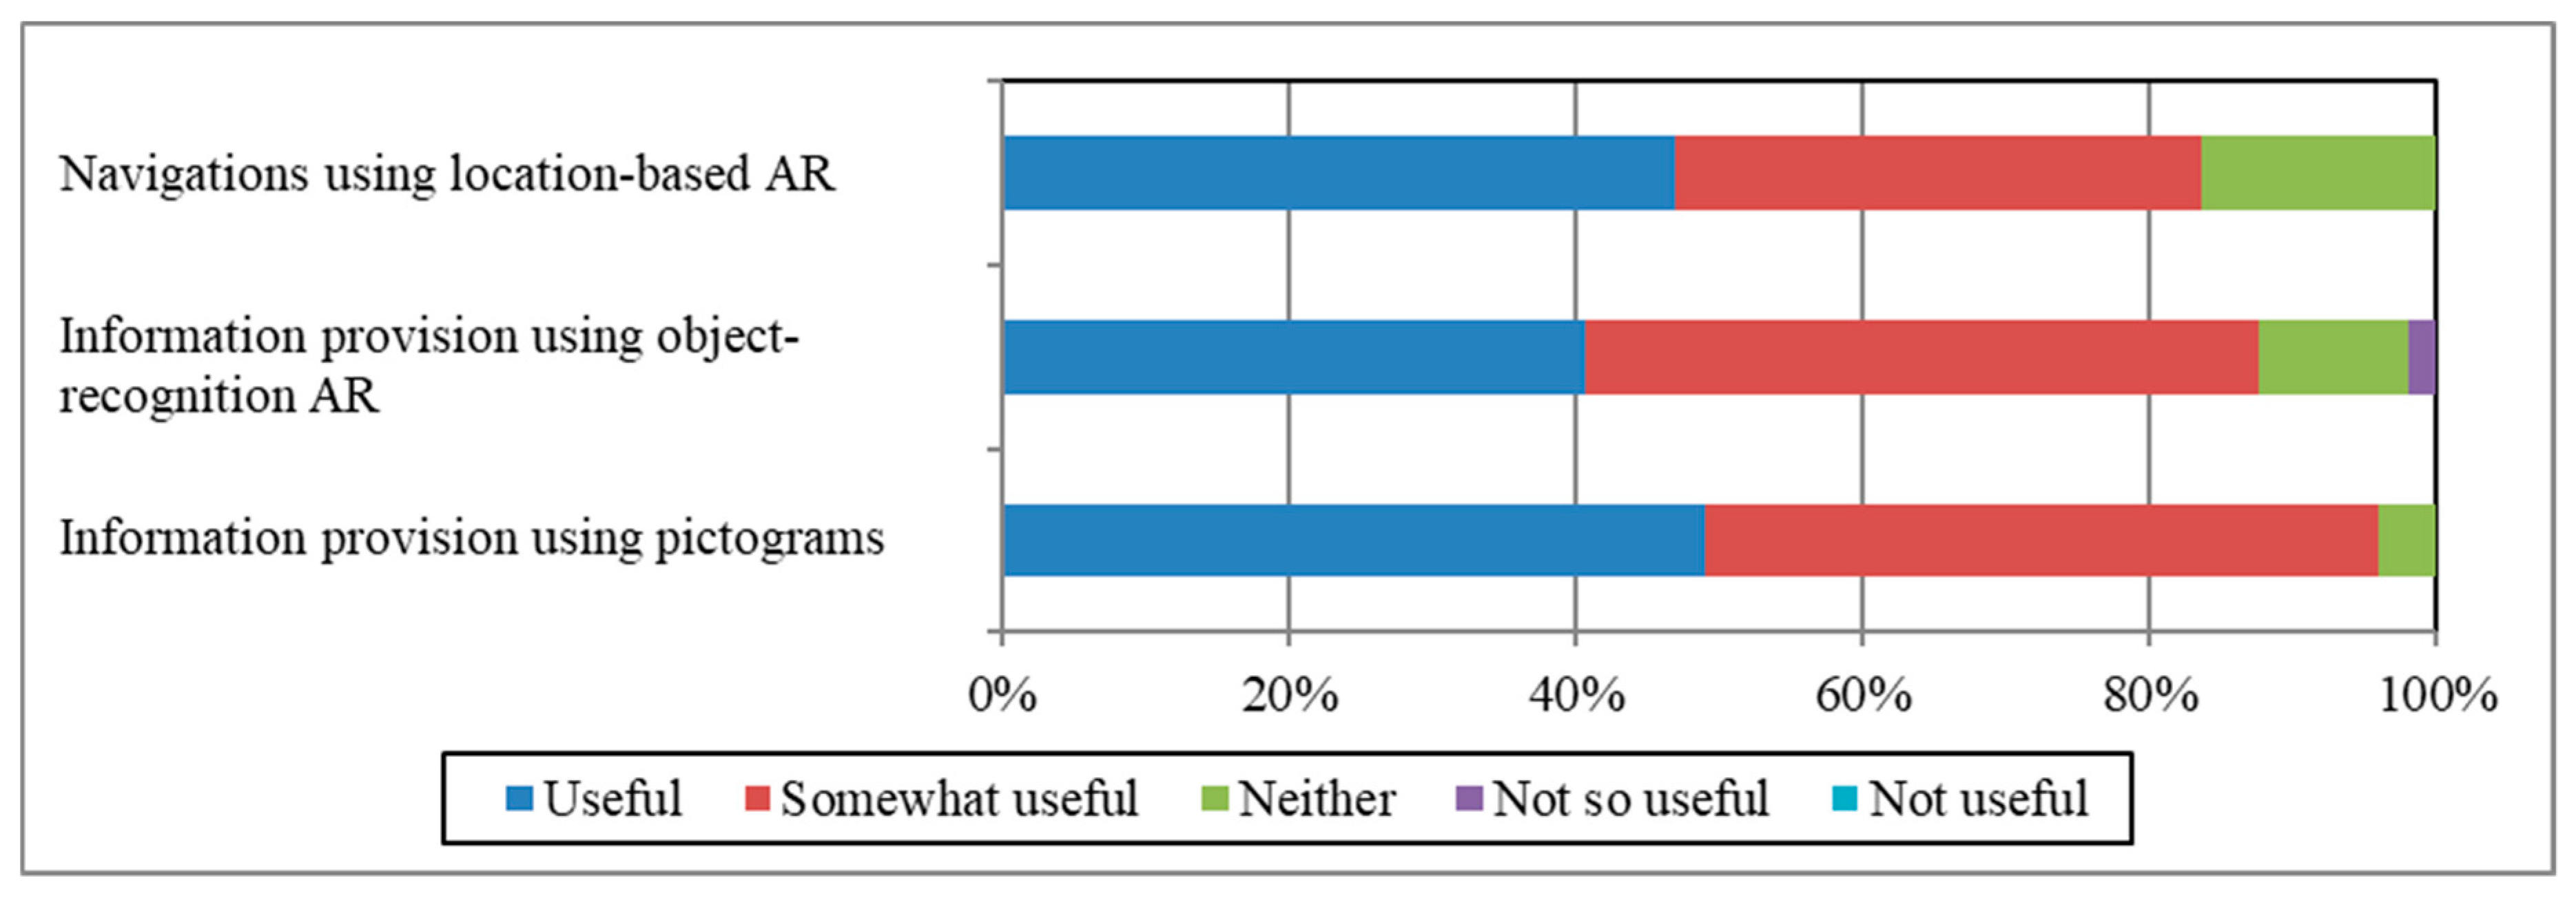
(1) Evaluation concerning the usefulness of the original functions
Figure 11 shows the evaluation results concerning the usefulness of the original functions. Regarding the navigation system’s use of location-based AR, 84% answered “useful” or “somewhat useful”, and 16% answered “neither”. As mentioned in the previous section, this result is because half of the users were not familiar with Chofu city and cannot determine whether the navigations were correct. Regarding the information provision using object-recognition AR, 41% answered “useful”, 47% answered “somewhat useful”, and 10% answered “neither”. As a reason for this, while information can be obtained by pointing a mobile information terminal at sightseeing spots or their images, target recognition may not be successful depending on the angle of the camera in the mobile information terminal or how it is affected by the sunlight, as well as the fact that AR can only be used for four sightseeing spots. Therefore, as noted in Section 6.1.2, although most users were not familiar with the applications with AR, many of them used and gave a high rating to the functions that used both location-based AR and object-recognition AR. Regarding the information provision using pictograms, 49% answered “useful”, and 47% answered “somewhat useful”. Therefore, almost all users were satisfied with the information provided using pictograms, indicating that pictograms were an effective method for providing information.
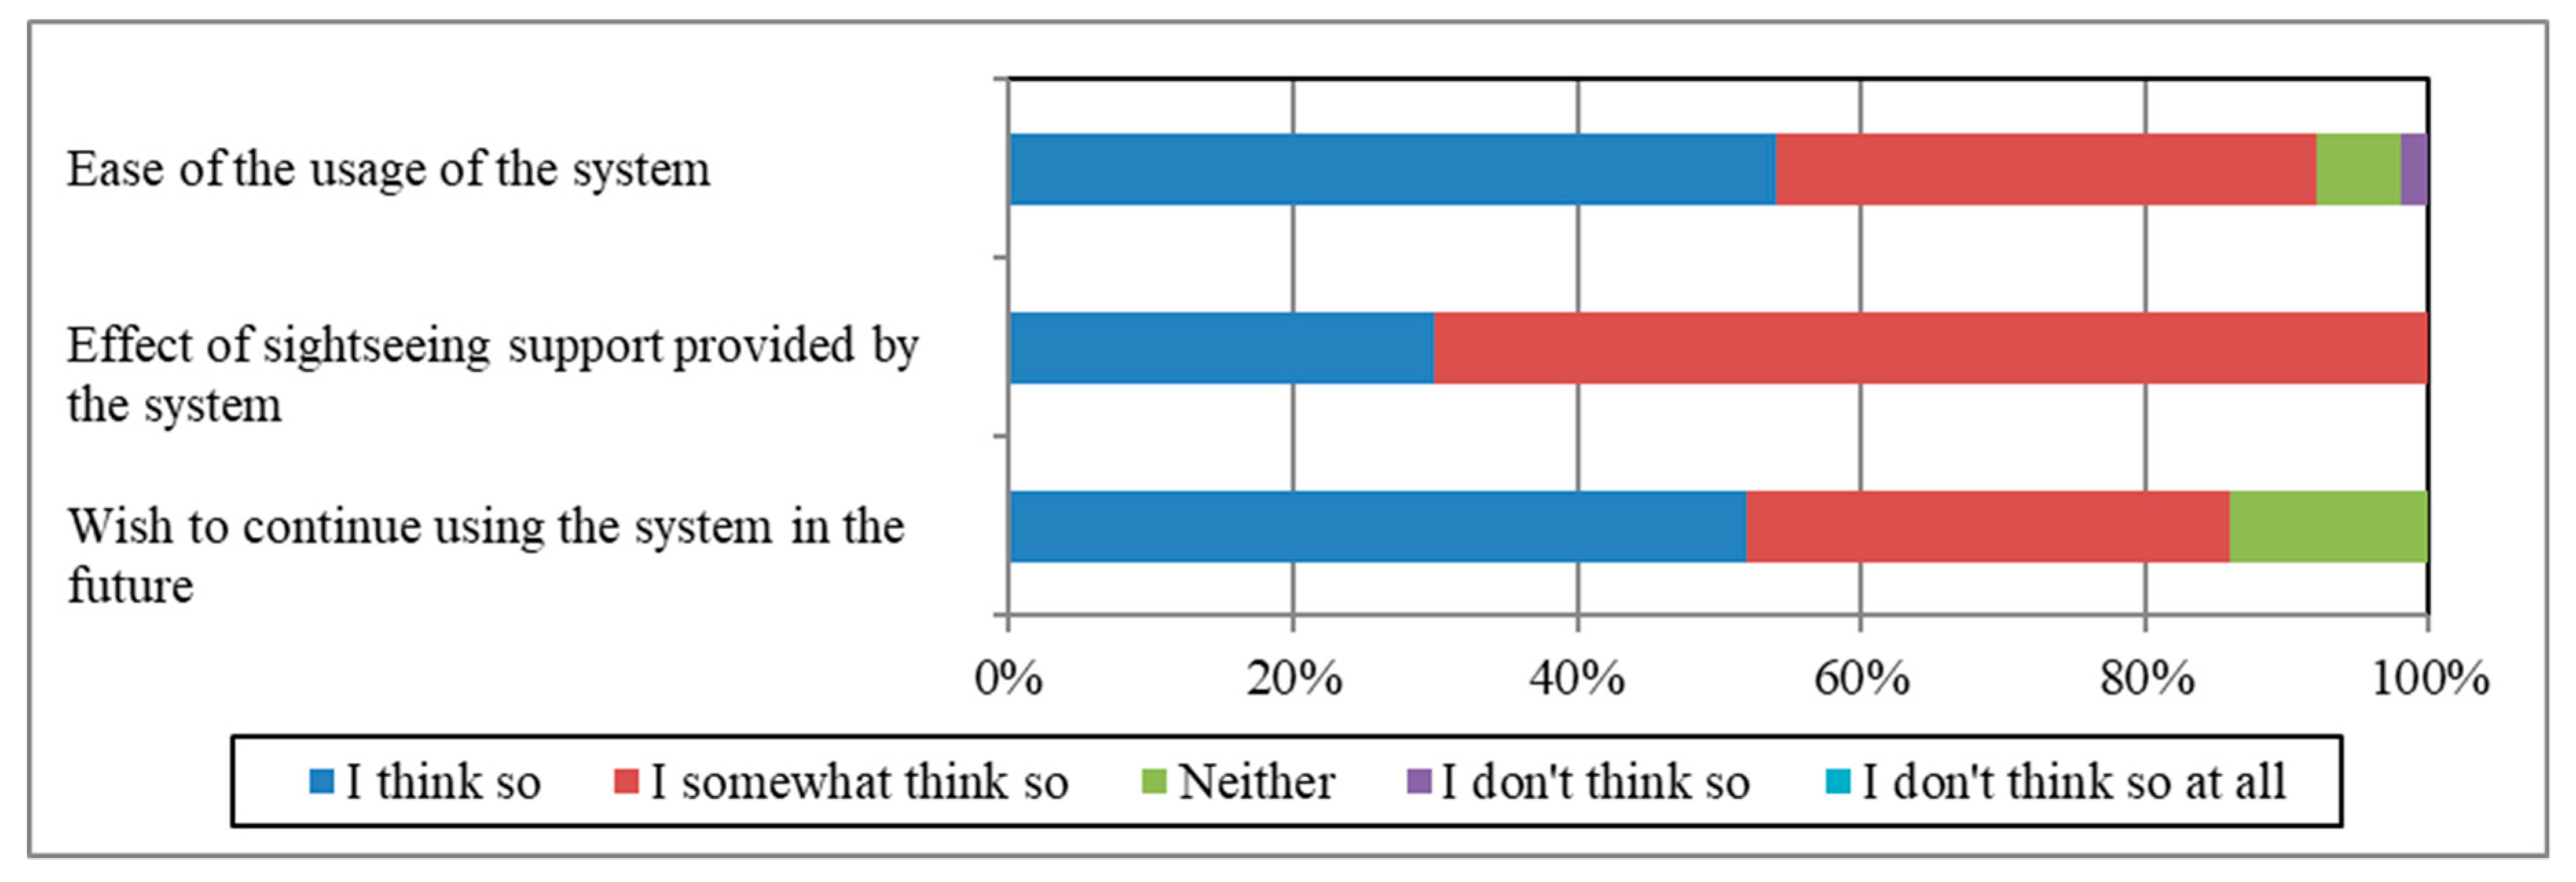
(2) Evaluation concerning the usefulness of the entire system
Figure 12 shows the evaluation results concerning the entire system. Regarding the ease of use of the system, 92% answered “I think so” or “I somewhat think so”, indicating that the system developed in the present study was easy to use. The sightseeing support function provided by the system was highly rated, as 30% answered “I think so” and 70% answered, “I somewhat think so”. Therefore, the present study was able to develop a system that effectively provides sightseeing support. Regarding the wish to continue using the system in the future, 52% answered “I think so” and 34% “I somewhat think so”, indicating that the system can be used in the long term. However, 14% answered “neither” because half of the users do not have opportunities to visit Chofu city, as mentioned in Section 6.1.1.
6.2. Evaluation Based on the Mobile Application Analysis
In the present study, an access analysis was conducted using the users’ log data during the operation period. This analysis was conducted using Google Analytics for Firebase, one of the Firebase functions, which is a mobile backend service. Firebase is a service provided by Google, and log data analysis can be conducted by installing Firebase into the mobile application.
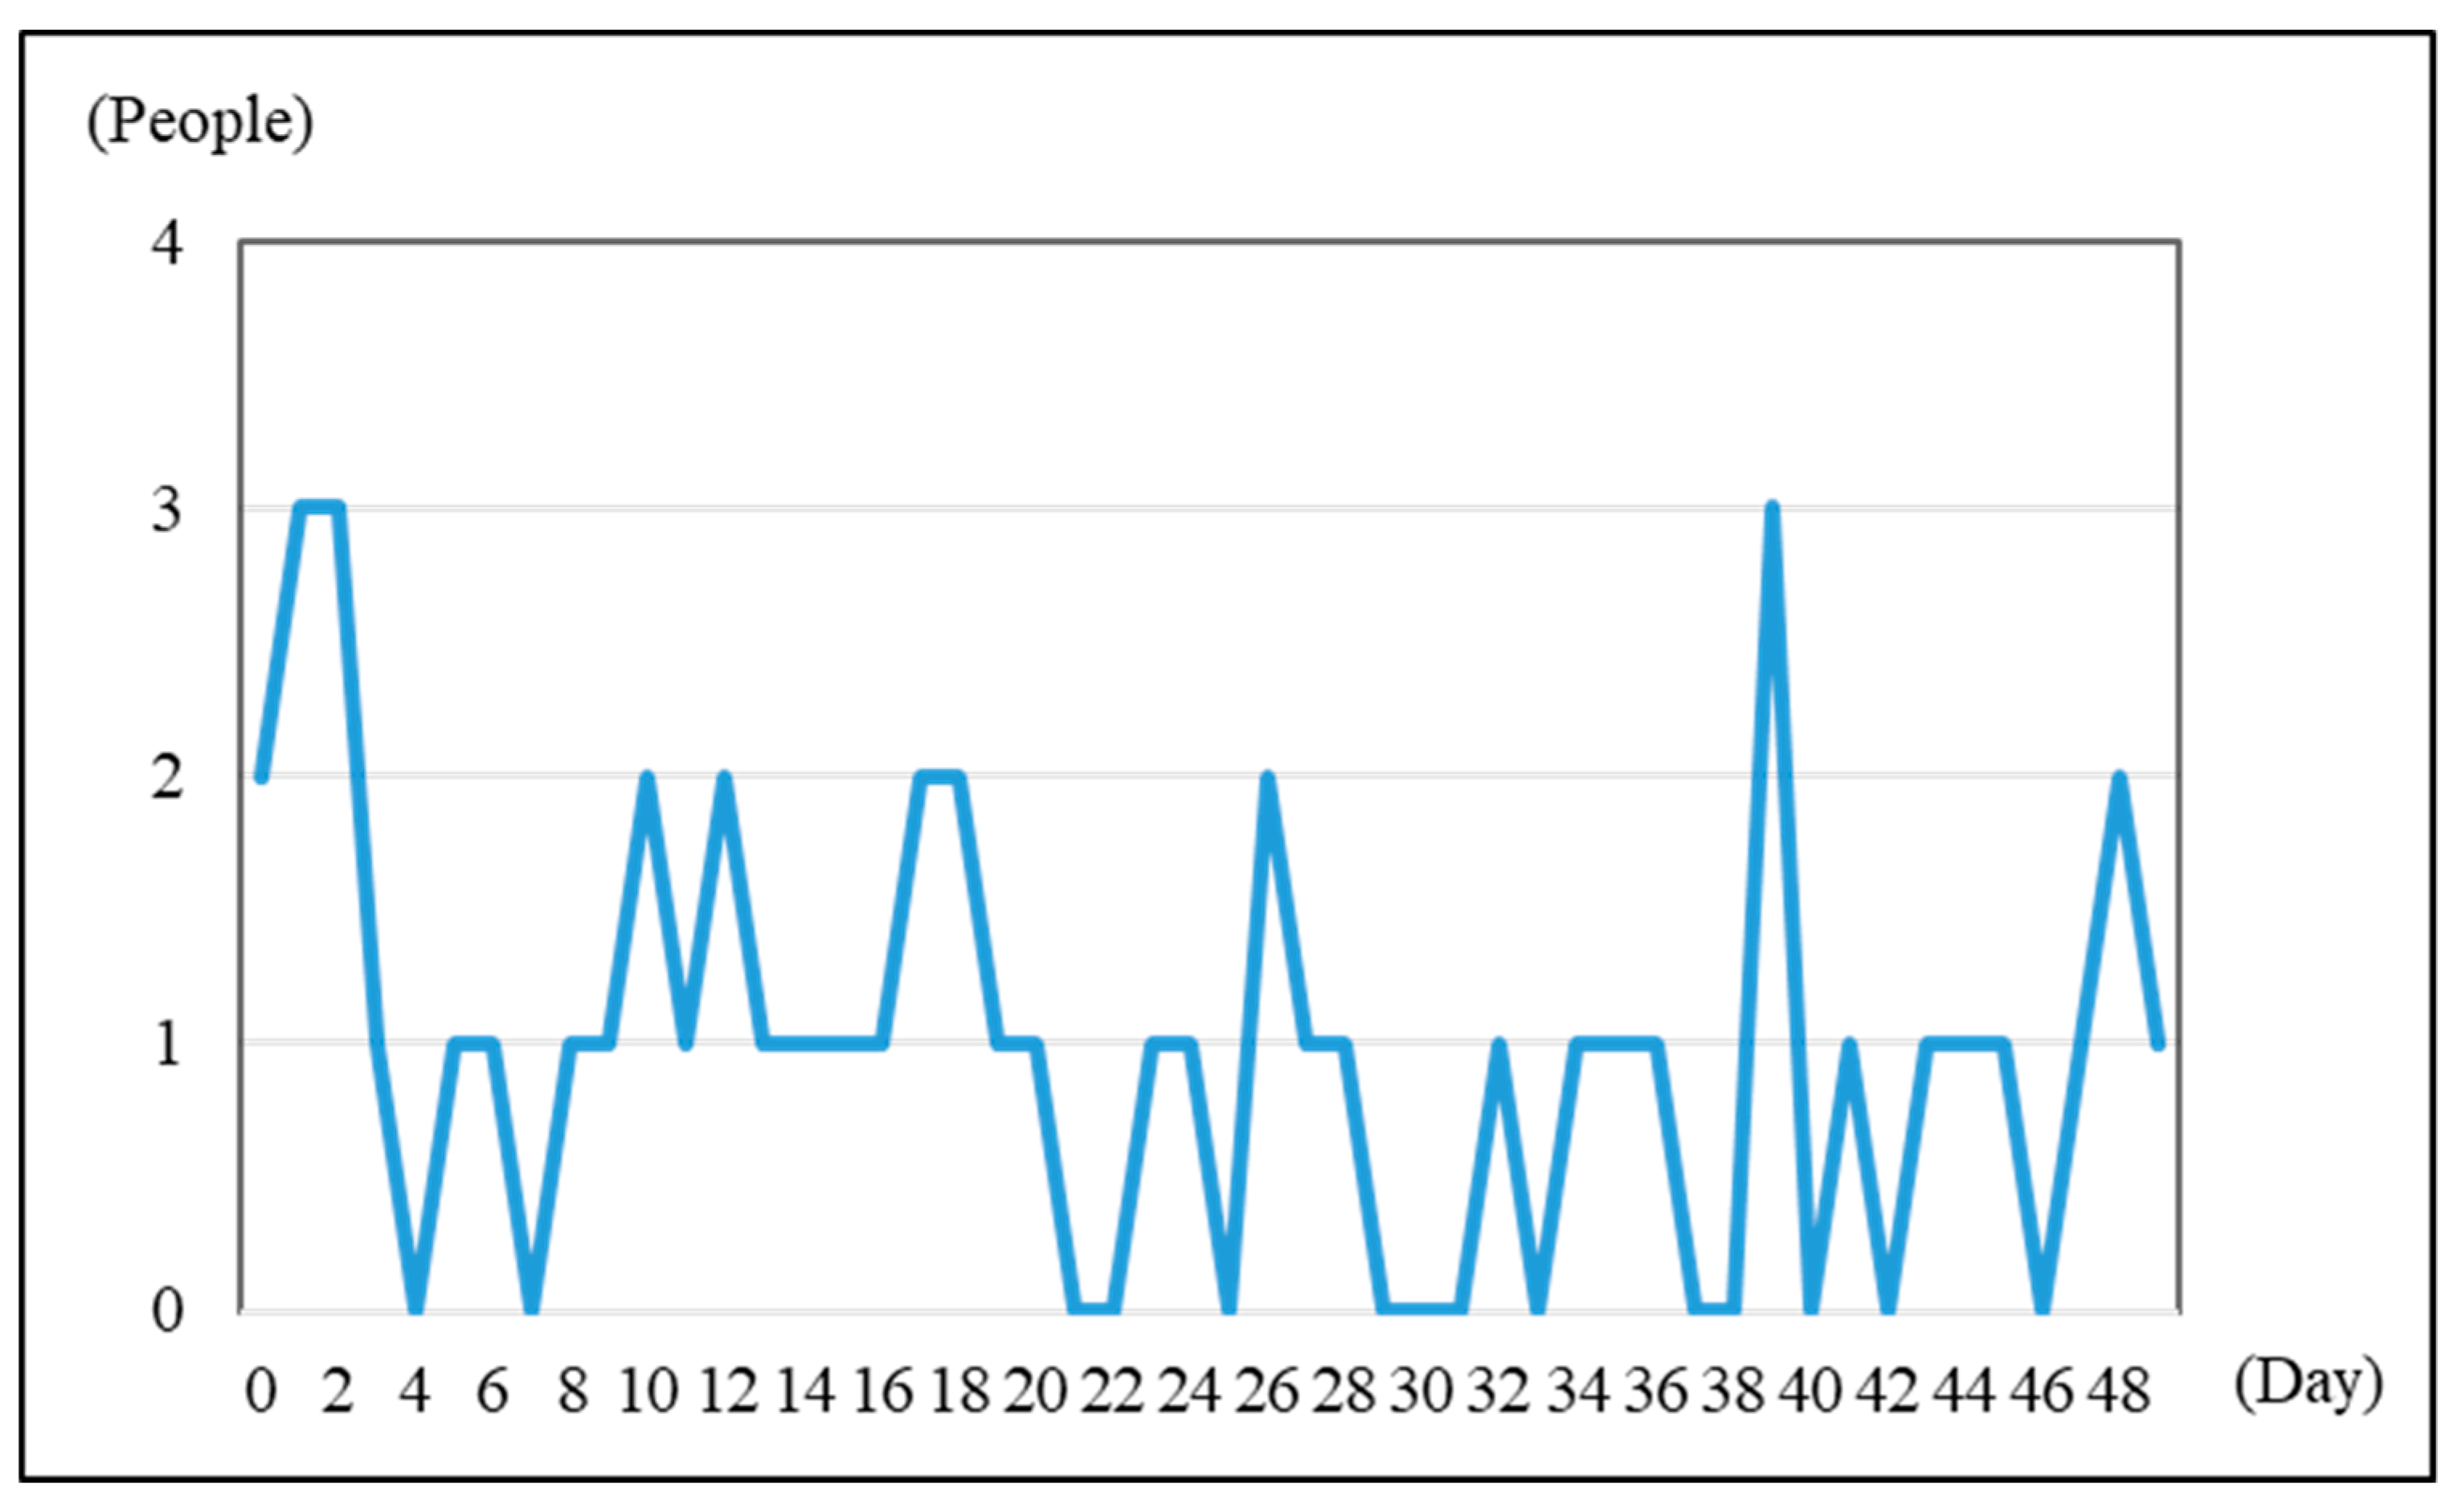
Figure 13 shows the daily transition of active users during the operation of the system. From the transition of active users, it became clear that the system developed in the present study was continuously used by users. Furthermore, from the results of the user engagement rate, the usage time was 67% for the location-based AR screen and 29% for the object-recognition AR screen. This result is because the former can be used within Chofu city or in nearby areas, while the latter can only be used at four specific sightseeing spots.
6.3. Extraction of Improvement Measures
The issues concerning the system were extracted based on the results of the web questionnaire survey, as well as the access analysis of users’ log data, and are summarized below.
(1) Route guiding display using location-based AR
The system was designed to display sightseeing spots and nearby facilities on specified parts of the screens for the three functions introduced in Section 4.1 that use location-based AR when the location information, such as longitude and latitude, was obtained. Therefore, by combining the system with remote location tracking GPS, it is possible to implement a new function to display route guidance to sightseeing spots outside of the present operation target area.
(2) Improvement of the recognition rate of sightseeing spots with object-recognition AR
Object-recognition AR can be used by registering the images of sightseeing spots with the Wikitude Target Manager. Therefore, the recognition rate can be improved by reviewing the registered images, replacing them with clearer images of sightseeing spots, and increasing the number of registered images. Additionally, images other than those of the four target sightseeing spots can be gathered and registered to improve the usability of the function introduced in Section 4.1 of changing the recognition target when using object-recognition AR.
7. Conclusions
The present study designed and developed a system (Section 3 and Section 4), conducted a test of the system operation (Section 5), and evaluated and extracted improvement measures (Section 6). The present study can be summarized in the following three points:
(1) To provide guidance to sightseeing spots and nearby facilities using location-based AR and pictograms and to provide information on the sightseeing spots using object-recognition AR, a system that is composed of the website and original mobile application was designed and developed. The application was uniquely developed by integrating location-based AR and object-recognition AR and by using pictograms. As the system enables users to efficiently obtain the directions to sightseeing spots and nearby facilities within urban tourist areas and sightseeing spot information, it is a method that can help users who are not good at reading maps or searching necessary information to enjoy sightseeing. Additionally, the city of Chofu in the metropolis of Tokyo was selected as the operation target area for the system, and an evaluation of the operation of the system was conducted.
(2) The operation of the system was conducted over a one month period, targeting those inside and outside the operation target area, and a web questionnaire survey was conducted with a total number of 50 users. Based on the results of the web questionnaire survey, the usefulness of the original functions of integrating location-based AR and object-recognition AR and of using pictograms, as well as of the entire system, was highly rated, indicating that efficient sightseeing support for users can be expected. Although most users were not familiar with the application that used AR, they highly rated the functions using location-based AR and object-recognition AR.
(3) From the results of the access analysis of users’ log data, the transition of the number of active users revealed that the system was continuously used during the operation. By continuously using the system, it is expected that users will further utilize each function. Based on the results of the user engagement rate, the usage time was 67% for location-based AR and 29% for object-recognition AR, indicating that the former was used more often because it is easier for users to use.
As future study projects, the improvement of the system based on the results in Section 6.3, as well as the enhancement of the significance of using the system by gaining more data from other urban tourist areas inside and outside Japan, can be raised. Additionally, it is desirable to develop a unique mobile application in accordance with the above improved system.
Author Contributions
Ryo Sasaki design, develop and operate the sightseeing support system using augmented reality and pictograms in the present study. He also initially drafted the paper. Kayoko Yamamoto carried out background work, and evaluates the system. All authors contributed to write up and review, and approved the paper manuscript.
Funding
This research received no external funding.
Acknowledgments
In the operation of the sightseeing support system using augmented reality and pictograms and the web questionnaires survey of the present study, enormous cooperation was received from participants, mainly in the Tokyo metropolitan area. We wish to take this opportunity to gratefully acknowledge them.
Conflicts of Interest
The authors declare no conflict of interest.
References
- Dinis, M.G.F.; Costa, C.M.M.; Rocha Pacheco, O.M. Composite Indicators for Measuring the Online Search Interest by a Tourist Destination. In Big Data and Innovation in Tourism, Travel, and Hospitality: Managerial Approaches, Techniques, and Applications; Sigala, M., Rahimi, R., Thelwall, M., Eds.; Springer: Berlin, Germany, 2019; pp. 1–19. [Google Scholar]
- Wise, N.; Heidari, H. Developing Smart Tourism Destinations with the Internet of Things. In Big Data and Innovation in Tourism, Travel, and Hospitality: Managerial Approaches, Techniques, and Applications; Sigala, M., Rahimi, R., Thelwall, M., Eds.; Springer: Berlin, Germany, 2019; pp. 21–29. [Google Scholar]
- Kounoike, K. Available online: https://kakakumag.com/pc-smartphone/?id=9609 (accessed on 8 January 2019).
- GrapeCity. Available online: https://wikitude.grapecity.com/topics/interviews-harbor-solutions (accessed on 8 January 2019).
- Fujita, S.; Yamamoto, K. Development of Dynamic Real-Time Navigation System. Int. J. Adv. Comput. Sci. Appl. 2016, 7, 116–130. [Google Scholar] [CrossRef]
- Zhou, J.; Yamamoto, K. Development of the System to Support Tourists’ Excursion Behavior using Augmented Reality. Int. J. Adv. Comput. Sci. Appl. 2016, 7, 197–209. [Google Scholar] [CrossRef]
- Yamamoto, K. Navigation System for Foreign Tourists in Japan. J. Environ. Sci. Eng. 2018, 10, 521–541. [Google Scholar]
- Abe, S.; Yoshitsugu, N.; Miki, D.; Yamamoto, K. An Information Retrieval System with Language-Barrier-Free Interfaces. J. Inf. Syst. Soc. Jpn. 2019, 14, 57–64. [Google Scholar]
- Rehman, U.; Cao, S. Augmented-Reality-Based Indoor Navigation: A Comparative Analysis of Handheld Devices versus Google Glass. IEEE Trans. Hum.-Mach. Syst. 2017, 47, 140–151. [Google Scholar] [CrossRef]
- Morozumi, S.; Yamazaki, Y.; Chigusa, Y.; Hattori, T. Development of Navigation System for Restaurants Using AR. In Proceedings of the 78th National Convention of Information Processing Society of Japan, Tokyo, Japan, 10–12 March 2016; Volume 2016, pp. 361–362. [Google Scholar]
- Chung, J.; Pagnini, F.; Langer, E. Mindful Navigation for Pedestrians: Improving Engagement with Augmented Reality. Technol. Soc. 2016, 45, 29–33. [Google Scholar] [CrossRef]
- Amirian, P.; Basiri, A. Landmark-Based Pedestrian Navigation Using Augmented Reality and Machine Learning. In Progress in Cartography; Gartner, G., Jobst, M., Huang, H., Eds.; Springer: Berlin, Germany, 2016; pp. 451–465. [Google Scholar]
- Gerstweiler, G.; Vonach, E.; Kaufmann, H. HyMoTrack: A Mobile AR Navigation System for Complex Indoor Environments. Sensors 2016, 16, 17. [Google Scholar] [CrossRef] [PubMed]
- Mata, F.; Claramunt, C.; Juarez, A. An Experimental Virtual Museum Based on Augmented Reality and Navigation. In Proceedings of the 19th ACM SIGSPATIAL International Conference on Advances in Geographic Information Systems, Chicago, IL, USA, 1–4 November 2011; pp. 497–500. [Google Scholar]
- Okada, H.; Yoshimi, T.; Motokurumada, M.; Ota, M.; Yamashita, K. AR Navigation System Obtained Location Information from Maker. In Proceedings of the 2011 Convention of Information Processing Society of Japan-Kansai Branch, Osaka, Japan, 22 September 2011. [Google Scholar]
- Mulloni, A.; Seichter, H.; Schmalstieg, D. Handheld Augmented Reality Indoor Navigation with Activity-Based Instructions. In Proceedings of the 13th International Conference on Human Computer Interaction with Mobile information terminals and Services, Beijing, China, 17–21 September 2011; pp. 211–220. [Google Scholar]
- Möller, A.; Kranz, M.; Huitl, R.; Diewald, S.; Roalter, L. A Mobile Indoor Navigation System Interface Adapted to Vision-Based Localization. In Proceedings of the 11th International Conference on Mobile and Ubiquitous Multimedia, Ulm, Germany, 4–6 December 2012. [Google Scholar] [CrossRef]
- Neges, M.; Koch, C.; König, M.; Abramovici, M. Combining Visual Natural Markers and IMU for Improved AR Based Indoor Navigation. Adv. Eng. Inform. 2017, 31, 18–31. [Google Scholar] [CrossRef]
- Kurihara, K.; Sato, H. Marker-Based Indoor Navigation for Sharing Location Information. In Proceedings of the 2011 Multimedia, Distributed, Cooperative, and Mobile Symposium, Shibata, Nigata, Japan, 9–11 July 2014; pp. 1099–1103. [Google Scholar]
- Wang, C.-S.; Su, W.-T. An Efficient Mobile AR Navigation System Using Polygon Approximation Based Data Acquisition. In Proceedings of the 2018 International Wireless Internet Conference, Taipei, Taiwan, 15–16 October 2018; pp. 215–224. [Google Scholar]
- Zhou, X.; Sun, Z.; Xue, C.; Lin, Y.; Zhang, J. Mobile AR Tourist Attraction Guide System Design Based on Image Recognition and User Behavior. In Proceedings of the 2019 International Conference on Intelligent Human Systems Integration, San Diego, CA, USA, 7–10 February 2019; pp. 858–863. [Google Scholar]
- Fukada, H.; Funaki, T.; Kodama, M.; Miyashita, N.; Ohtsu, S. Proposal of Tourist Information System Using Image Processing-Based Augmented Reality. In Proceedings of the 2011th Special Interest Group on Information Systems (SIG-IS) of Information Processing Society of Japan, Tokyo, Japan, 14–15 March 2011; pp. 1–8. [Google Scholar]
- Han, D.-I.; Jung, T.; Gibson, A. Dublin AR: Implementing Augmented Reality in Tourism. In The Proceedings of the Information and Communication Technologies in Tourism 2014; Springer: Berlin, Germany, 2014; pp. 511–523. [Google Scholar]
- Komoda, S.; Takasu, Y.; Mizuno, S. Smartphone Application for Walking around the Locations of Movie of Local Cinema “Takahama Story”. In Proceedings of the 2011th Special Interest Group on Digital Contents Creation (SIG-DCC) of Information Processing Society of Japan, Tokyo, Japan, 21–22 January 2013; Volume 2013-DCC-3 No.16. [Google Scholar]
- Junga, T.; Chung, N.; Leue, M.C. The Determinants of Recommendations to Use Augmented Reality Technologies: The Case of a Korean Theme Park. Tour. Manag. 2015, 49, 75–86. [Google Scholar] [CrossRef]
- Ma, X.; Sun, J.; Zhang, G.; Ma, M.; Gong, J. Enhanced Expression and Interaction of Paper Tourism Maps Based on Augmented Reality for Emergency Response. In Proceedings of the 2nd International Conference on Big Data and Internet of Things, Beijing, China, 24–26 October 2018; pp. 105–109. [Google Scholar]
- Blanco-Pons, S.; Carrión-Ruiza, B.; Lerma, J.L.; Villaverde, V. Design and Implementation of an Augmented Reality Application for Rock Art Visualization in Cova dels Cavalls (Spain). J. Cult. Herit. 2019. [Google Scholar] [CrossRef]
- Makino, R.; Yamamoto, K. Spatiotemporal Information System Using Mixed Reality for Area-Based Learning and Sightseeing. In Lecture Notes in Geoinformation and Cartography: Computational Urban Planning and Management for Smart Cities; Stan, G., Andrew, A., Chris, P., John, S., Eds.; Springer: Berlin, Germany, 2019; pp. 283–302. [Google Scholar]
- Kusano, K.; Izumi, T.; Nobutani, Y. Proposal of Disaster Information Sharing System Using Pictogram. In Proceedings of the 75th National Convention of Information Processing Society of Japan, Sendai, Miyagi, Japan, 6–8 March 2013; Volume 2013, pp. 802–804. [Google Scholar]
- Kusano, K.; Izumi, T.; Nobutani, Y. Nonlinguistic Disaster Information Sharing System Using Visual Marks. In Transactions on Engineering Technologies; Haeng, K., Kim, M., Amouzegar, A., Sio-long, A., Eds.; Springer: Berlin, Germany, 2015; pp. 273–288. [Google Scholar]
- Sándor, Z. Effects of Weather Related Safety Messages on the Motorway Traffic Parameters. Period. Polytech. Transp. Eng. 2017, 45, 58–66. [Google Scholar] [CrossRef] [Green Version]
- Hayashi, Y.; Oyakawa, D.; Kiyoki, Y.; Mita, T. An information Providing Method to Express Train Service Situation by Combining Multiple Sign-Logo Images. In Information Modelling and Knowledge Bases XXX; Tatiana, E., Alexander, D., Hannu, J., Bernhard, T., Yasushi, K., Naofumi, Y., Eds.; IOS Press: Amsterdam, The Netherlands, 2019; pp. 384–392. [Google Scholar]
- Kołodziejczak, A. Information as a factor of the Development of Accessible Tourism for People with Disabilities. Quaest. Geogr. 2019, 38, 67–73. [Google Scholar] [CrossRef]
- Foundation for Promoting Personal Mobility and Ecological Transportation. Available online: http://www.ecomo.or.jp/english/index.html (accessed on 8 January 2019).
Figure 1.
System design.

Figure 2.
Sequence of steps for location-based augmented reality (AR).

Figure 3.
Sequence of steps for object-recognition AR.

Figure 4.
Screen that indicates the displayed range.

Figure 5.
Update of distance information.

Figure 6.
Marker height level.

Figure 7.
Interface of location-based AR screen.

Figure 8.
Interface of object-recognition AR screen.

Figure 9.
Website interface.

Figure 10.
Evaluation results concerning the usage condition of the system.

Figure 11.
Evaluation results concerning the usefulness of the original functions.

Figure 12.
Evaluation results concerning the entire system.

Figure 13.
Daily transition of active users during the operation of the system.


Table 1.
Overviews of system users.
| Age Groups of Users | 10–19 | 20–29 | 30–39 | 40–49 | 50–59 | 60+ | Total |
|---|---|---|---|---|---|---|---|
| Number of users | 8 | 18 | 2 | 8 | 12 | 1 | 50 |
© 2019 by the authors. Licensee MDPI, Basel, Switzerland. This article is an open access article distributed under the terms and conditions of the Creative Commons Attribution (CC BY) license (http://creativecommons.org/licenses/by/4.0/).
Share and Cite
MDPI and ACS Style
Sasaki, R.; Yamamoto, K. A Sightseeing Support System Using Augmented Reality and Pictograms within Urban Tourist Areas in Japan. ISPRS Int. J. Geo-Inf. 2019, 8, 381. https://0-doi-org.brum.beds.ac.uk/10.3390/ijgi8090381
AMA Style
Sasaki R, Yamamoto K. A Sightseeing Support System Using Augmented Reality and Pictograms within Urban Tourist Areas in Japan. ISPRS International Journal of Geo-Information. 2019; 8(9):381. https://0-doi-org.brum.beds.ac.uk/10.3390/ijgi8090381
Chicago/Turabian StyleSasaki, Ryo, and Kayoko Yamamoto. 2019. "A Sightseeing Support System Using Augmented Reality and Pictograms within Urban Tourist Areas in Japan" ISPRS International Journal of Geo-Information 8, no. 9: 381. https://0-doi-org.brum.beds.ac.uk/10.3390/ijgi8090381
Note that from the first issue of 2016, this journal uses article numbers instead of page numbers. See further details here.