Integrated Hazard Modeling for Simulating Torrential Stream Response to Flash Flood Events


1
College of Earth and Environmental Sciences, University of the Punjab, Lahore 54000, Pakistan
2
Department of Land Surveying and Geo-informatics, The Hong Kong polytechnic University, Kowloon, Hong Kong
*
Author to whom correspondence should be addressed.
ISPRS Int. J. Geo-Inf. 2020, 9(1), 1; https://0-doi-org.brum.beds.ac.uk/10.3390/ijgi9010001
Submission received: 21 October 2019
/
Revised: 9 December 2019
/
Accepted: 10 December 2019
/
Published: 18 December 2019
(This article belongs to the Special Issue Geo-Spatial Analysis in Hydrology)
Abstract
:This study aims to monitor the flash flood response of Vidor/Wadore hill torrent in Pakistan by the integration of Personal Computer Storm Water Management Model PCSWMM (hydrologic) and HEC-RAS 5.x (hydraulic) models. The method leverages remote sensing and GIS derive estimates of measured and inferred parameters of Vidor rural catchment to quantify the flash flood events of the last four years: 2014–2017. The calibration of the PCSWMM is performed using the sensitivity-based radio tuning calibration (SRTC) tool. The Nash–Sutcliffe efficiency (NSE), coefficient of determination (R2), and relative error (RE) values were found between 0.75–0.97, 0.94–0.98, and −0.22–−0.09 respectively. The statistical indicators prove the accuracy of PCSWMM for rural catchments. The runoff response of Vidor torrent is also analyzed for 0.5/12.7, 1.5/38.1, and 2.0/50.8-inch/mm rainfall hyetographs. The generated hydrographs are used to simulate 2D-module in HEC-RAS 5.x for floodplain demarcation in the piedmont area. The accuracy of the flood extent is analyzed using spatial overlay analogy in the ArcGIS environment by comparing simulated and historically available flood extents. The simulated flood extent shows 76% accuracy with historic flood extent. The impact of flash flood events shows wheat, maize, and fruit orchards are the most effected agriculture in piedmont area. The results revealed that the integration of hydrological, hydraulic, and geospatial modeling approaches can be used to model a full picture of catchment response during flash flood events.
1. Introduction
Flash floods are considered one of the most disastrous natural hazards because of their sudden and severe impact [1]. Intense rainfall on steep slopes of hill torrents engenders flash flooding with a short lag time that causes an unbearable economic loss. Human intrusion and variability in climate have modified the prevailing natural conditions and rainfall-runoff processes in mountainous catchments, ensuing an increase in the frequency of flash flood events. According to the statistical record of the National Civil Affairs (NCA), on average, a global loss of 3–6 % in the gross national product is caused by flash floods each year [2,3,4,5,6,7,8].
The rainfall-runoff behavior in steep mountainous catchment is a complex process solely depends upon the physical parameters (shape, size, type of stream, etc.) of catchment [9]. The accurate discharge measurement for such catchment remains a challenge due to the in-depth calculation of physical parameters. However, improvements and advancement in studies, on water balance and natural environment change, have propelled hydrological—as well as hydraulic—studies in past decades [10]. Different strategies have been developed by researchers [11,12,13,14,15] to integrate the effects of physical and human-induced factors on runoff for storm events. Among the different methods (Green Ampt, Hortons, Holton, etc.), Soil Conservation Service Curve Number (SCS-CN) has proven to be an enduring technique to quantify the flash flood discharge volumes in catchments [9,16].
In recent decades, hydrological models are proved as one of the effective measures used to predict and monitor flash floods. Globally, hydrometeorological approaches have been classified as the best management practices for flash floods. Hydrological models are classified into lumped, semi-distributed and distributed schemas. Lumped modeling incorporates uniform assumptive conditions; however, distributed models can incorporate distributed measured and inferential data (e.g., precipitation, solar radiation, temperature, soil moisture distributions, etc.). Distributed models perform calculations on both chorological as well as chronological scales. Semi distributed models perform in the same way as a distributed model with a difference of catchment scales. In semi-distributed model the smallest unit of a watershed is sub-catchment however, in the distributed model it further calculates the process on pixel (raster-based) scale. Distributed and semi-distributed models are equally implemented for flash flood monitoring, and have better performance than lumped models. Zoccatelli et al., Anquetin et al., and Jia, P et al., confirm that model results are significantly improved with distributed spatial forcing data (rainfall, temperature, soil moisture condition, etc.) [17,18,19]. However, hydrologic calculation remains a challenge due to the non-linear behavior of flash floods in spatiotemporal domain. Generally, different uncertainties in the source input data affect hydraulic models, particularly the available supporting data which determines the output of the model. Briefly, data limitations undermine the implementation of detailed physical-based models for the prediction of flash floods [20,21,22,23,24,25].
The monitoring of hydrological variables is complex in nature. Researchers make use of various computer-aided programs and models to interpolate and extrapolate diverse variables in spatiotemporal contexts [26]. Such platforms and models are valuable to explore and comprehend a system behavior as the models are used to identify errors and inconsistencies in the system. The advantage of different models is to improve user-defined scenarios. The developed setups portray the reality of a system with sufficient accuracy [26,27]. Researchers have simulated the flooding situation and perform flood risk zoning which provides technical support for flash flood control and disaster reduction in urban areas [28,29,30,31]. Personal Computer Storm Water Management Model (PCSWMM) is one of the models that offer hydrological (lumped, semi-distributed, and distributed) and hydraulic capabilities. However, it is mostly calibrated for urban catchments using gauge and flow data collected from the site [32,33,34,35]. Other models such as MIKE series (Denmark) and InfoWorks ICM (UK), with strong hydrodynamic ability and preprocessing, also have a good number of users. In comparison, the SWMM model (United States) is broadly used because its code is open-source and it is free to use [36]. SWMM has been extensively used for urban flooding, however, limited studies have shown it to be equally successful on rural catchments suing gauge data [7,37].
The frequency of flash floods in different mountain ranges of Pakistan has increased due to change in rainfall patterns in recent years [38,39,40,41]. The frequency of small to large range of flash floods is very high in D.G. Khan district. Vidor is one of the major hill torrents of the Suleiman mountainous range of D.G. Khan district. Frequent flash flood events in the Vidor catchment damage the infrastructure, valuable crops, and small villages in the piedmont area. The mighty flood of 2012 and 2015 also damage the irrigation canal systems in the downstream of piedmont plain at different RDs-reduced distances [7].
Based on historical records, and frequent flash flood events in D.G. Khan from the Vidor catchment, this paper validates the applicability of PCSWMM using semi-distributed modeling approach, and analyzes the impact of flash floods in downstream piedmont plains using HEC-RAS 2D hydraulic modeling. The accuracy of PCSWMM is cross-examined for rural catchments as it had been extensively used for urban catchments. The characteristics of the Vidor catchment are scrutinized using online data source in remote sensing and GIS domain. Finally, flash flood extents are demarcated for medium, high, and intense classes for vulnerability analysis using spatial overlay analogy. The proposed study will redound to the social benefits considering the importance of CCA (climate change adaptation) and DRR (disaster risk) reduction strategies.
2. Materials and Methods
2.1. Study Area
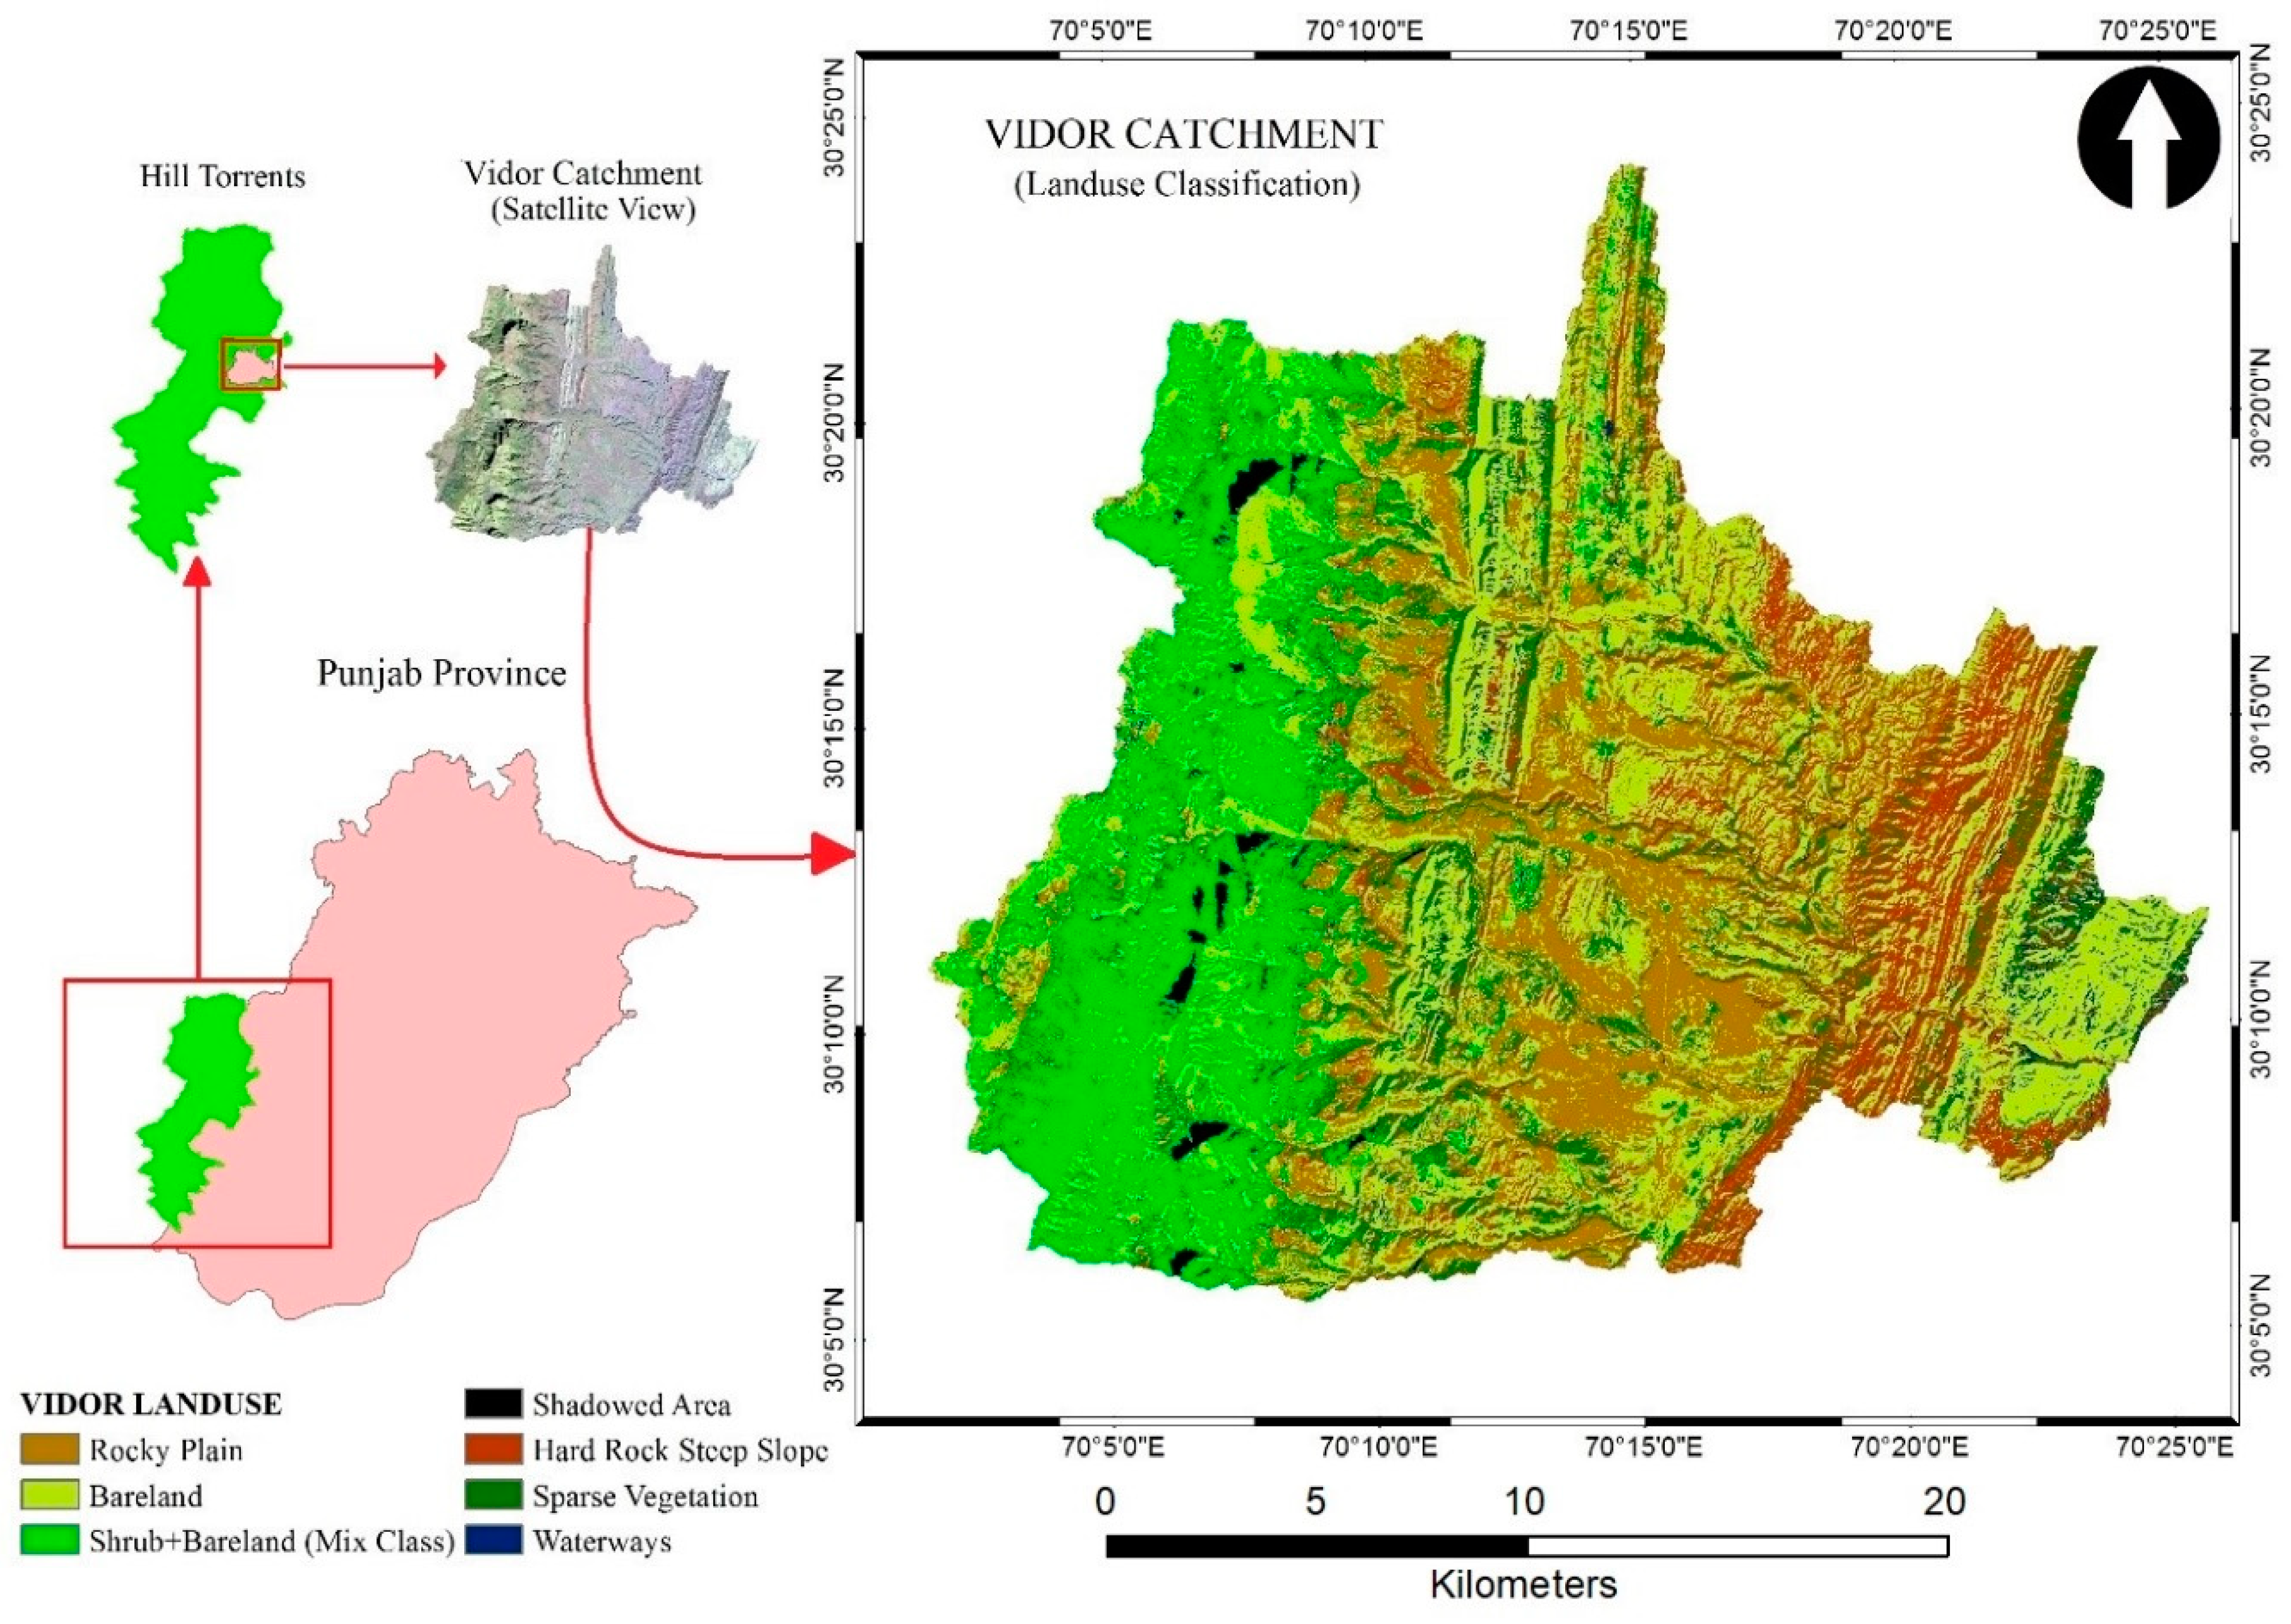
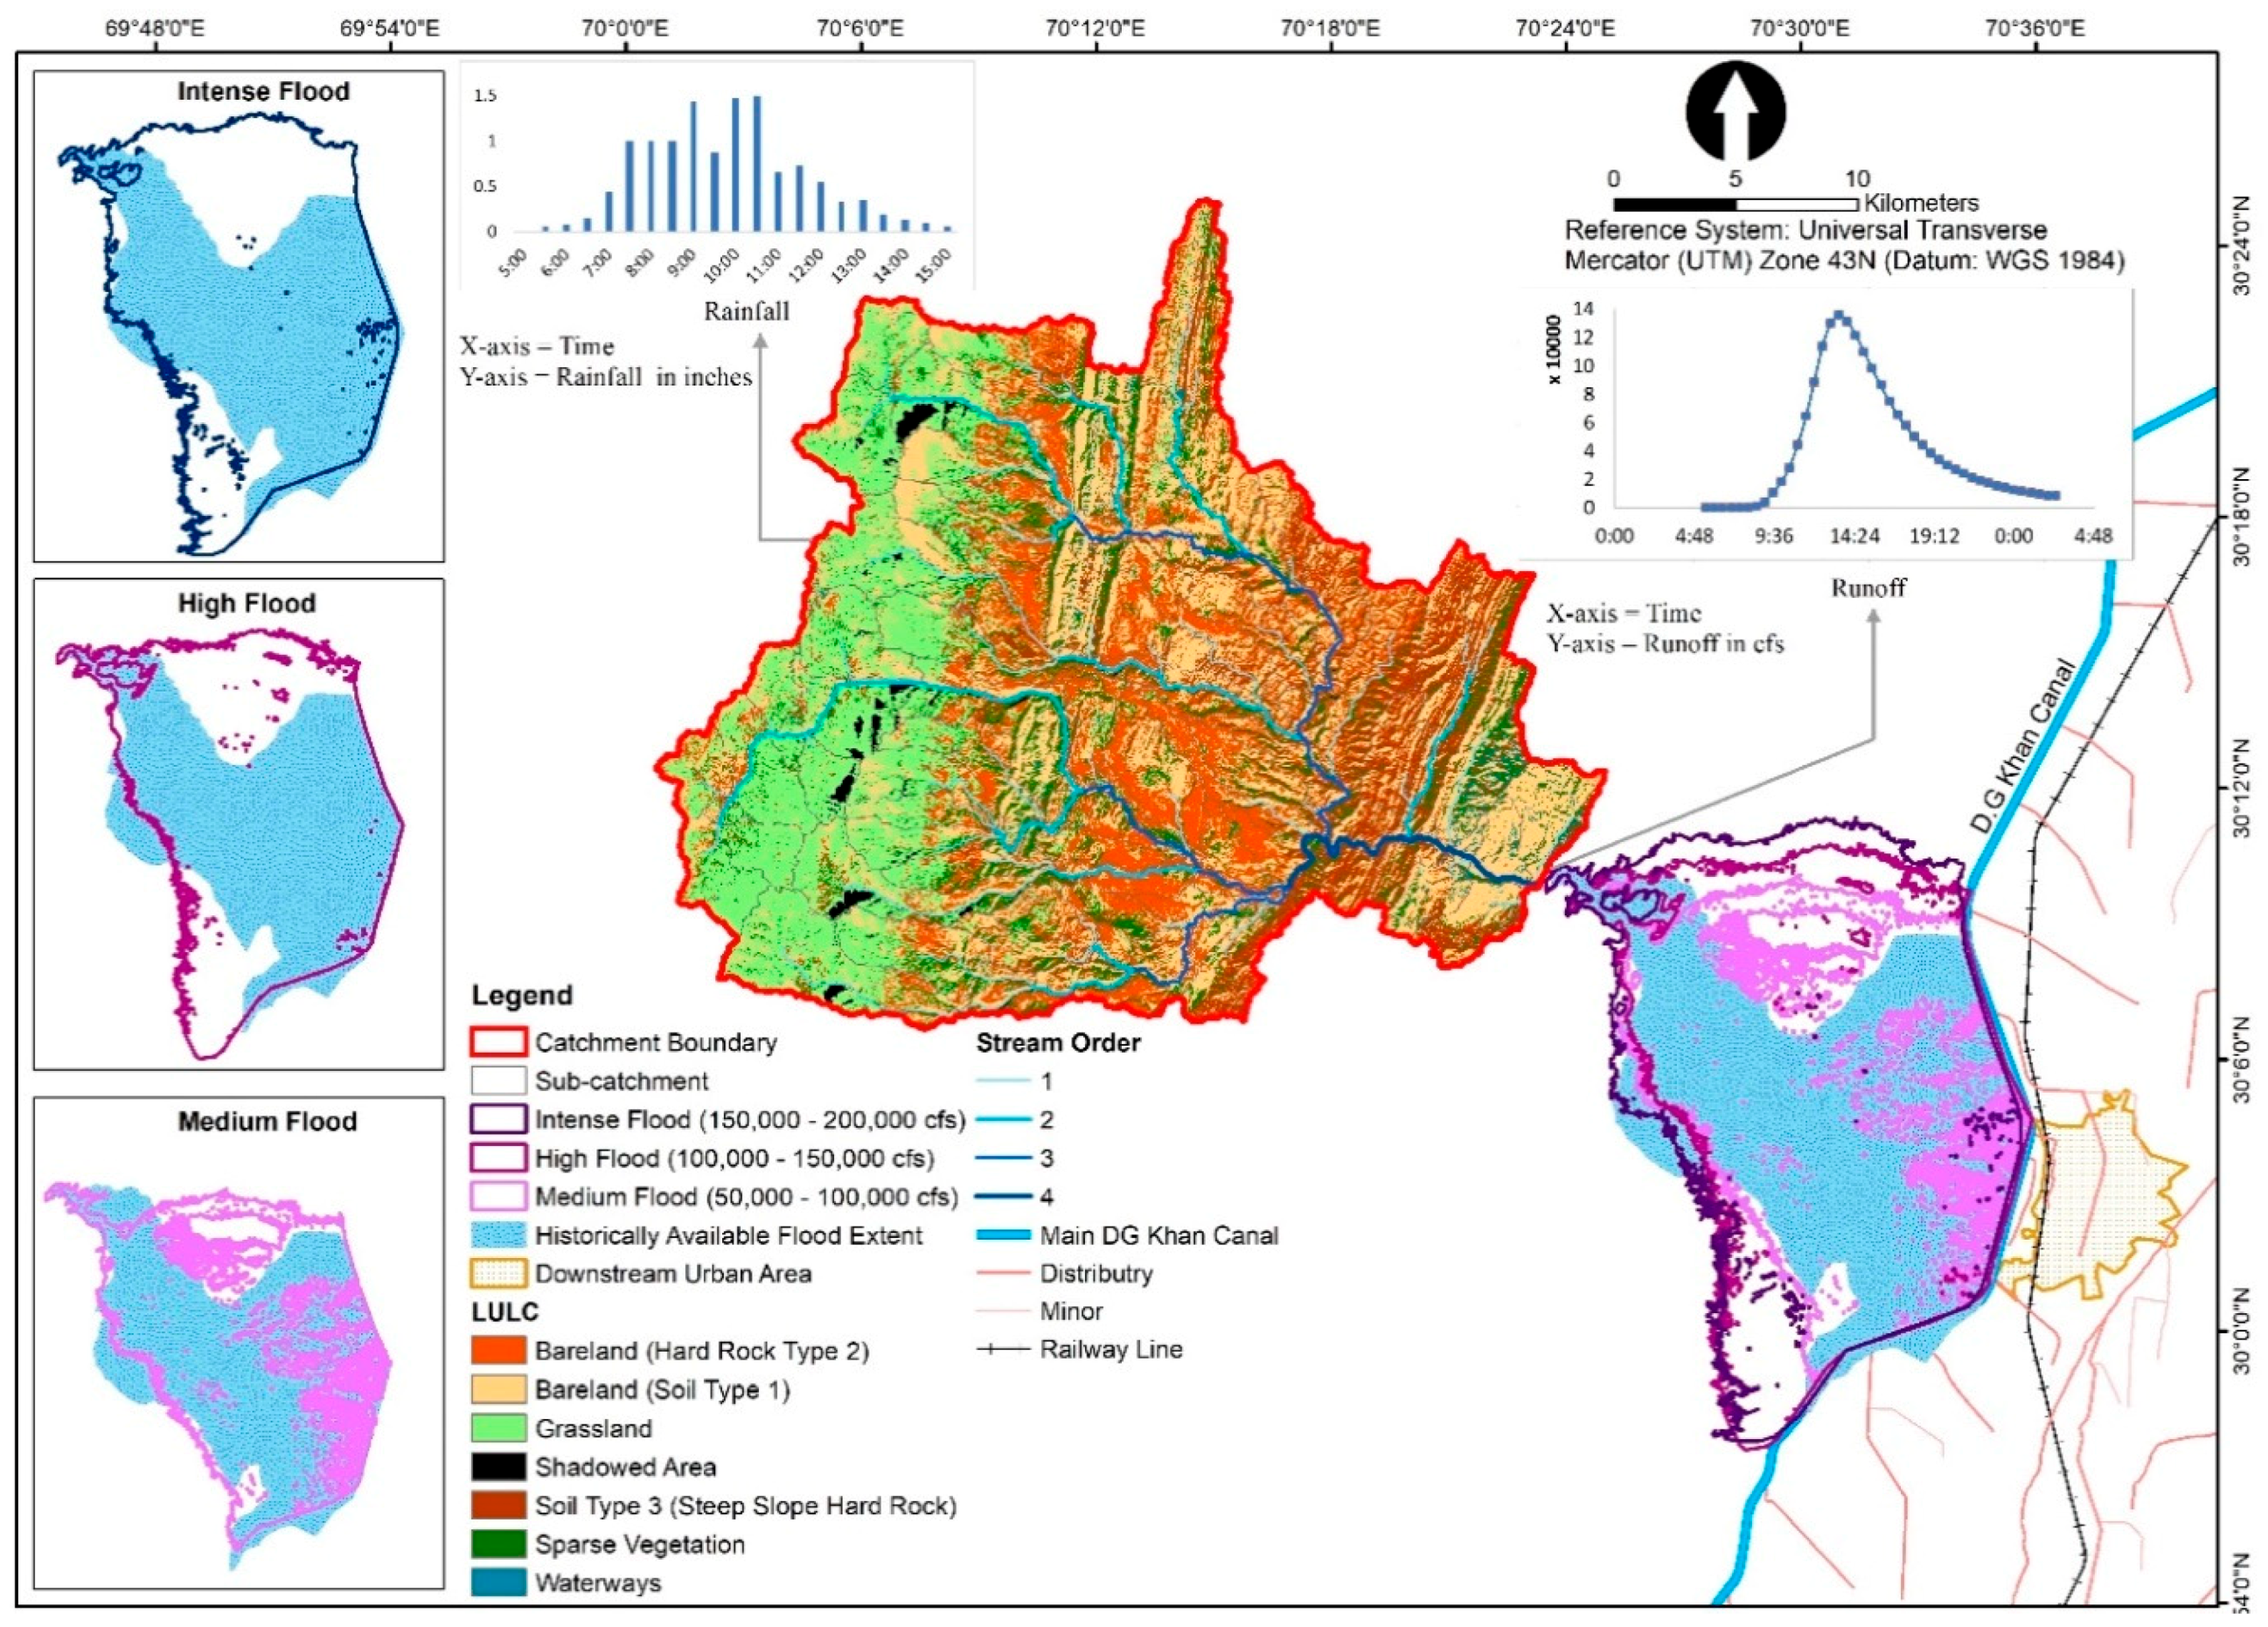
For this appraisal research, Vidor watershed/catchment in the administrative boundary of D.G. Khan district was selected to scrutinize the rainfall-runoff behavior for different curve number (CN) arrangements. Barren mountainous Vidor catchment with steep slopes receiving non-perennial flows during a storm is prone to disastrous flash floods [7]. The area was divided into two parts, Vidor watershed area, the source area of runoff generation, and the piedmont area of Vidor. The area has diverse terrain with elevation >200 m to <2500 m. The catchment consists of mostly hard rock strata with the barren land formation and dominating sandy soil [42]. The area lies in low annual average rainfall zones with rainfall schemes mostly adopting sudden surge from cloudbursts or thunderstorms and therefore categorizing the streams in the watershed area as episodic streams (Figure 1).
Geologically, the area was part of the structural trough which was occupied by an arm of old Tethys Sea continuously receiving the calcareous and argillaceous sediments. Quaternary and Tertiary deposits are the geologic formations of the area. Generally, sandy soil and alluvial/piedmont plain are present in the study area. The area consists of loam, silt loam, sandy loam, and sandy soils [43]. These soil types are considered as good for agriculture. However, sandy soils are an exception in the study area. The surface hydrology of the area is mainly controlled by torrential streams in the west. The streams pattern shows behavior in the west to east direction with an inclination in the south and tributaries in the catchment area shows a mixture of dendritic and contorted patterns. However, tributaries debouch from the piedmont line follows a distributary channel system in the piedmont plain. Stream network from main ordered stream dissipates into smaller tributaries scattered in all directions in the piedmont area. Most of the agriculture and urban areas are far away from the catchments that generate torrential flood. Sometimes, weather conditions recorded by the downstream weather station in the city and the catchment areas are far different from each other. Mostly, these streams are activated suddenly without any weather symptoms or any warning sign [38].
The catchment area consists of shrubland in the west and diverse barren land with a mixture of rocky plains. The density of shrub cover is high in the western part; however, sparse vegetation cover is spread over the upper catchment area. The piedmont area contains seasonal patchy crop patterns including wheat, cotton, maize, and rice. In Pakistan crops are classified for two seasons namely: Rabbi (November–May) and Kharif (June–October). The exposed crop classes by flash floods are reclassified as single, double, and triple classes. The area with two and three crops in a year are classified as double and triple crops, respectively. The study area also contains double (wheat and cotton, wheat and maize, wheat and rice) and triple (rice) crop patterns in a calendar year.
2.2. Models Description
PCSWMM is an updated version of SWMM developed by the United States-Environmental Protection Agency (US-EPA). Many researchers have used SWMM/PCSWMM in the urban watershed for rainfall-runoff modeling [7,44]. However, ref. [10,45] also practice SWMM for hydrological modeling of rural watersheds and found it a suitable package for implementation over other rural watersheds. The model works on different blocks among which runoff block generates surface runoff governed by the equation of continuity.
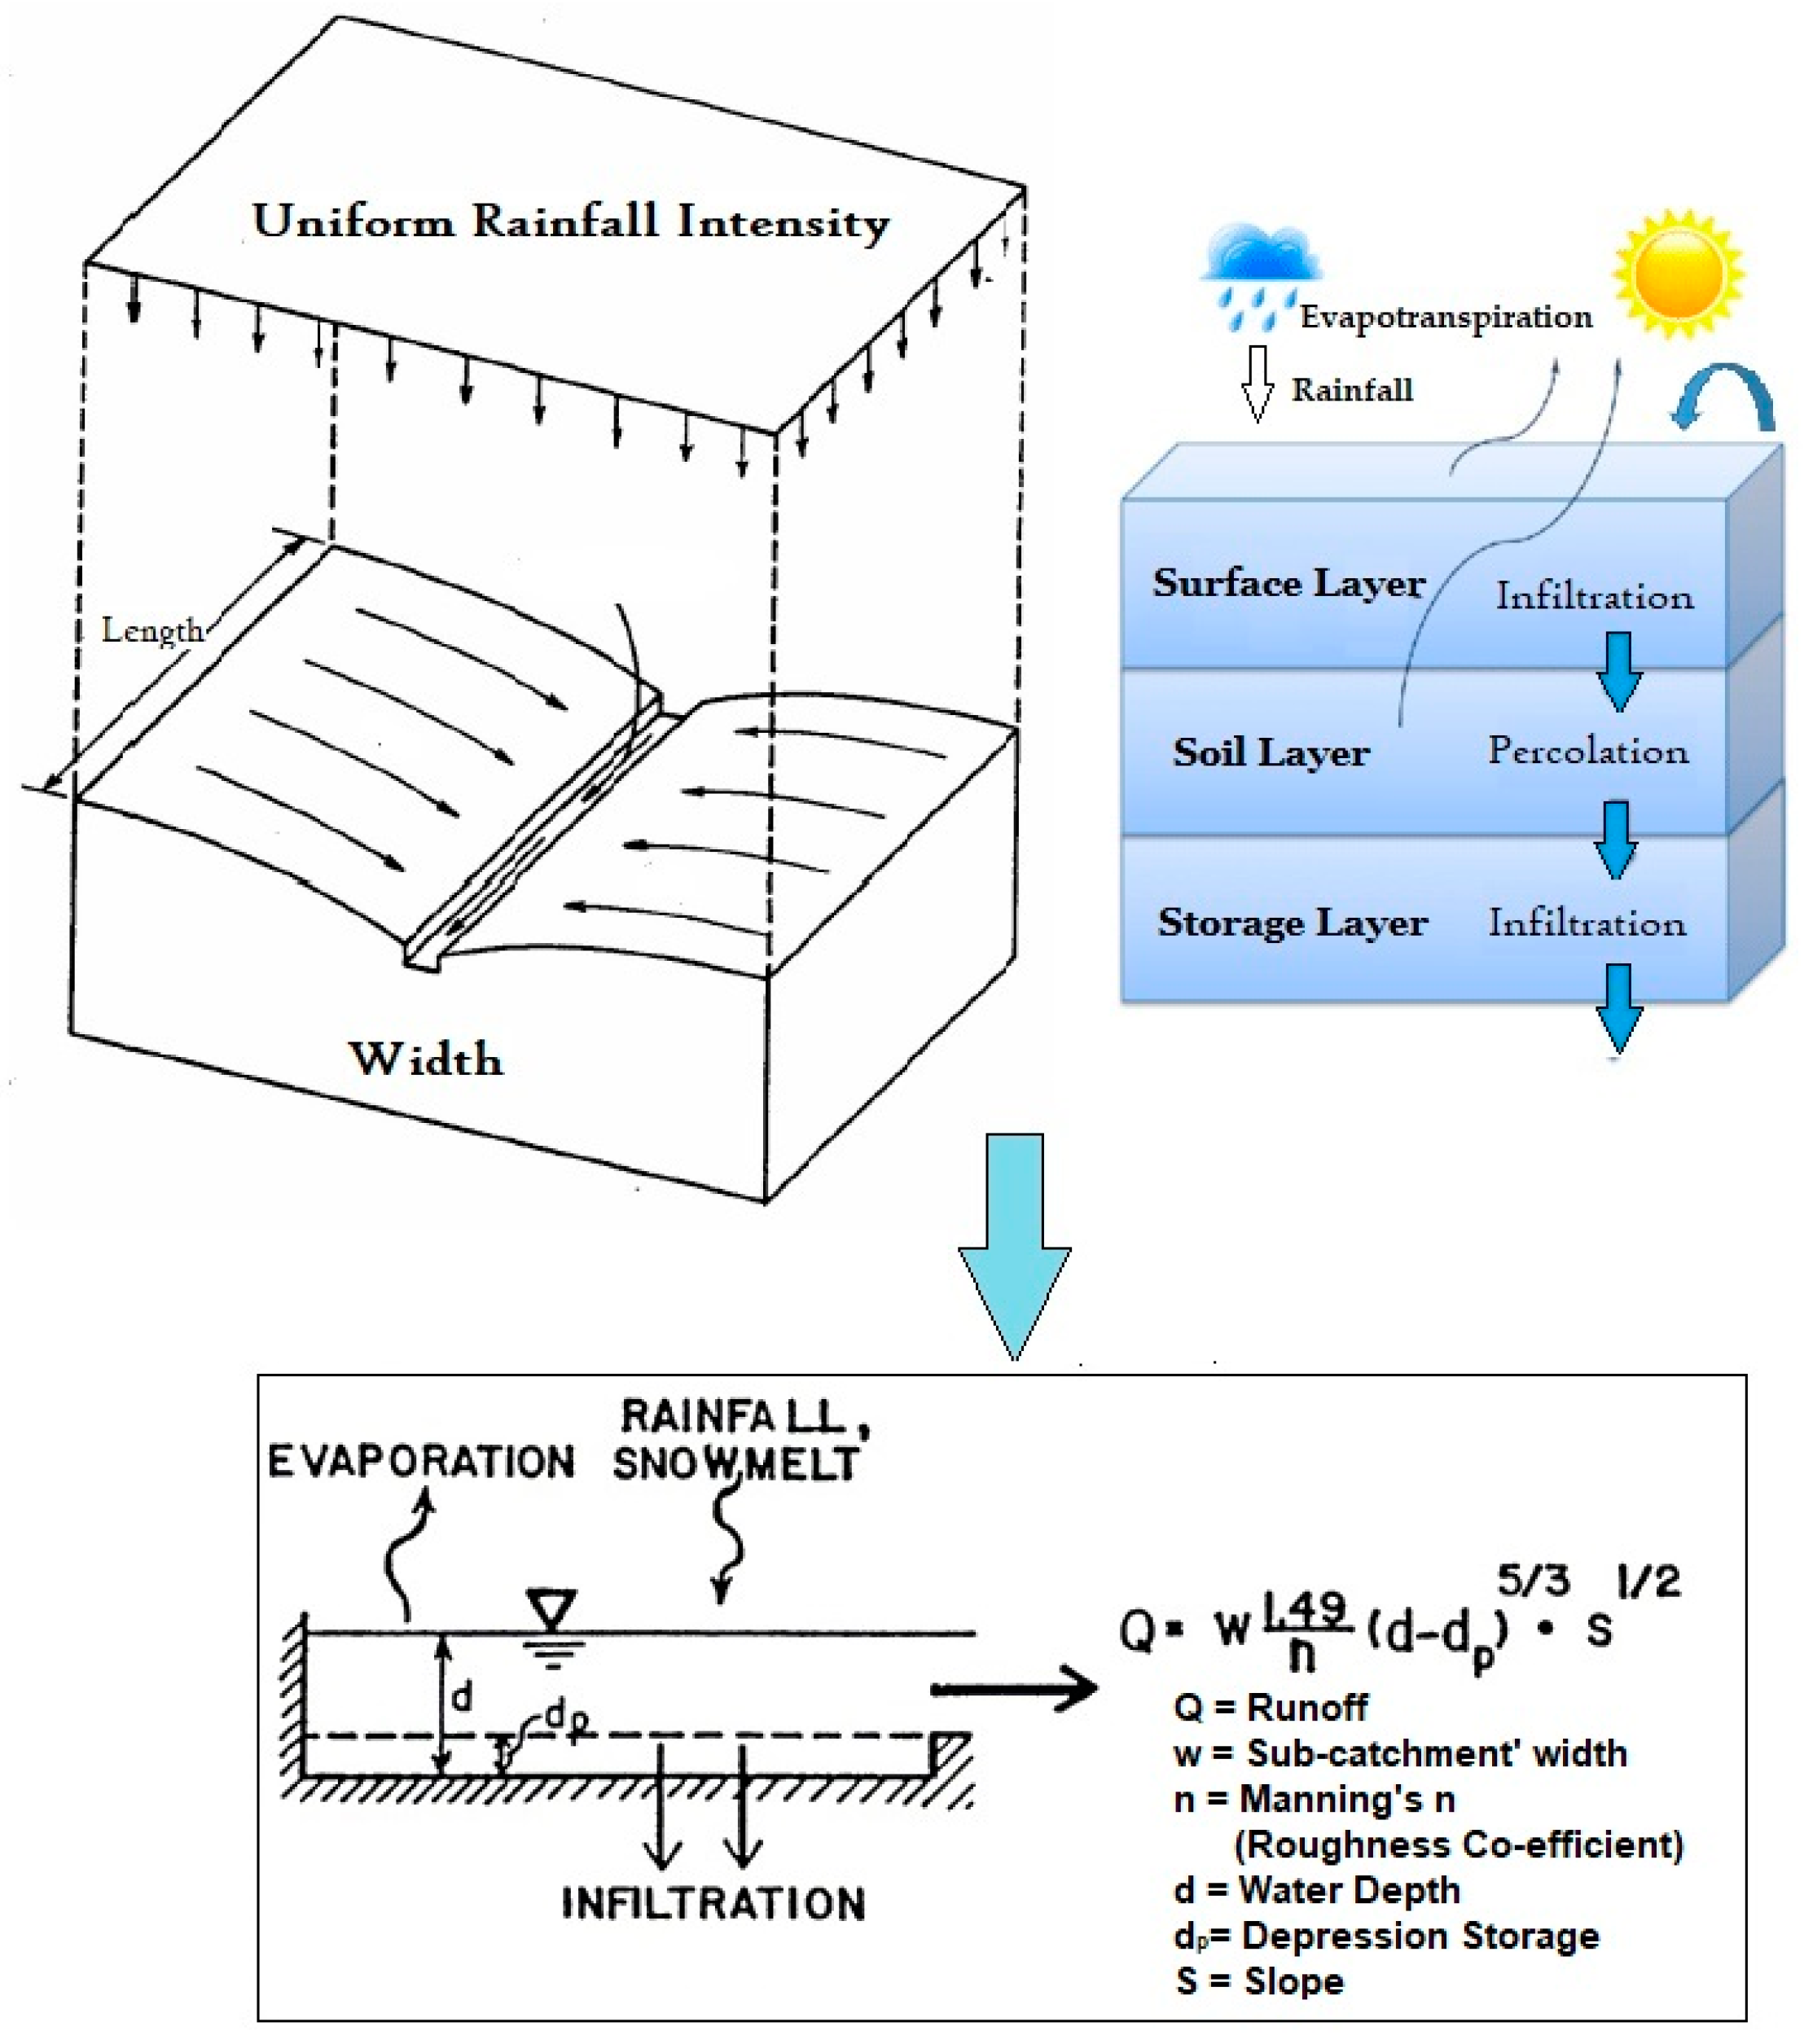
PCSWMM runoff block’s entire process for the generation of runoff is followed by the equation of continuity which tracks the volume of generated runoff within a sub-catchment. The runoff block deals each of the sub-catchment as a nonlinear rectangular reservoir as shown in Figure 2.
The rectangular sub-catchments only generate runoff when the water depth (d) exceeds the depression storage (dp) of sub-catchment. The system calculates the water depth (d) for the rectangular sub-catchment, nonlinear reservoir, by coupling the equation of continuity (1) with manning’s Equation (2).
where = = change in volume store per unit time, Aie = net inflow to the watershed, Q = runoff (outflow from the watershed)
where = sub-catchment width, = manning’s coefficient, = water depth, = depression storage, = average slope of the sub-catchment.
The coupling of Manning’s and continuity equation into one nonlinear differential equation is used for the calculation of water depth (d). The equation was developed for calculating flows in open channels. However, the equation has been adapted for overland flow applications [45,46]. The nonlinear differential equation for sub-catchment behaving as a nonlinear reservoir is given below
The model solves the above nonlinear equation at each designed time step to quantify the response of each sub-catchment for a given hyetograph. Where = change in water depth, = rainfall intensity.
The generated hydrograph from PCSWMM is used as a basic input for 2D hydraulic modeling through HEC-RAS version 5.0. The 2D system of the model discretizes the floodplain or river areas into a number of grid cells. The grid cells are attributed to friction (Manning’s n) and elevation (DEM) values along the surface. The water surface elevation is developed using the topography of the individual grid cell, more commonly referred to as stage-storage curve analysis. The momentum equation (diffusion-wave form) is coupled with the continuity equation for the calculation of water surface elevation for individual grid cells at interval of time. The differential equation of mass conservation in the unsteady form given as
The model solves Equation (4) at each time interval for the individual grid cell. Where t = time; D = water surface elevation; d = water depth; u and v are the velocities in x and y-direction respectively; and q = source or sink term.
2.3. Data and Processing
The data used for hydrologic and 2D hydraulic modeling were collected from different online sources as well as from government organizations (Table 1).
For a particular storm event, the observed discharge data for Vidor torrent from the Irrigation Department is limited and was preprocessed to fill the data gaps. The cubical spline process is applied to the observed hydrographs to have continuous values at the 30 min interval. The time interval is set to match with simulated results of runoff. The process is a third-order polynomial equation. The higher-order polynomial equation is preferred over linear equations because runoff processes follow smooth trends. The general equation is given as
where, x, x0, x1, x2 are the known values of variables; and b0, b1, b2, b3 are the unknown coefficient.
2.4. PCSWMM Input Parameter Estimation
There is only one station in the Vidor watershed for discharge measurement, and it has data gaps and limited records. Therefore, only peak events for the year 2014–2017 were used for analyzing the behavior of Vidor torrent. The maximum peak observed for each year is selected for simulating the PCSWMM.
The torrential floods are very fast and short events generated only from 3 h to 8 h rainfall. Hourly rainfall data was not available for the study area, therefore, satellite rainfall data from global precipitation measurement (GPM) was used for rainfall records due to its high temporal resolution (30 min).
Arc Hydro toolset of Arc-GIS platform was used for the delineation of Vidor watershed. The toolset uses DEM and flow direction as a major input for morphometric characteristic calculations of the watershed. For hydrodynamic modeling, the input parameters are classified as measured (surface elevation, catchment and channel geometry, node, etc.) and inferred parameters (infiltration parameters, depression storage, percentage impervious, roughness coefficient, etc.) [47]. The inferred parameters are calculated by the model and are used for the calibration of the model. Ebrahimian et al. use RS and GIS technique to estimate the sub-catchment area parameters for SWMM [48].
Land use land cover (LULC) of the Vidor catchment was classified through Landsat-8 satellite image. The image was processed under a maximum likelihood classifier (MLC) algorithm. The classified LULC and soil datasets were coupled to generate CN of the Vidor watershed. James et al. reports that in the watershed, an area with a slope greater than five percent should be adjusted for CN values [49]. Adjusted CN is calculated by multiplying the CN values obtained from the SCS general guide with a factor.
where
CN values, DEM (digital elevation model), and associated datasets were all in a raster format and were average out to small catchment level, therefore the slope factor was converted at such level by means of weighted slope factor.
where, is the area (ha) of the slope, is a slope in percentage, and is the area of sub-catchment.
The calculation of input parameters is performed at the pixel level of 30 m and 12.5 m. The generated datasets are downscaled at sub-catchment levels for PCSWMM. The model has a unique database system that linked each sub-catchment with a reference identifier system. The complete system file is in .INP format.
2.5. Calibration and Validation
Vidor streams are non-perennial in nature and remains active for the monsoon season. Sudden response to short rainfall spells generates peaks greater than 0.1 million cusecs. Therefore, the PCSWMM was calibrated and validated for peak events only. The hydrologic model developed undergoes calibration process to adjust the input parameters and validation is performed using the real-time gauge data. A sensitivity-based radio tuning calibration (SRTC) tool was used for PCSWMM calibration. The generated model was calibrated for a peak event of 2014 and prediction was analyzed for 2015, 2016, and 2017 peak events. SRTC tool allows tuning the model for selected inferred parameters with a percentage of influence. However, the parameter selection is solely depending upon the performance of the model and uncertainties in the data. For the calibration width, Manning’s (n) for the pervious area, drying time, and CN were used. The uncertainties for the calibration process based on [50,51,52] are shown in Table 2.
However, boundary conditions (BC) for 2D hydraulic simulations include: (1) BC for upstream is defined at outlet location of Vidor catchment (locally named as Darra Site) and (2) BC for downstream is defined at reduced distance RD-241 and RD-242 of DG Khan canal.
The calibration-validation results were evaluated using statistical criteria such as Nash–Sutcliffe efficiency (NSE), relative error (RE) (%), and coefficient of determination (R2). Whereas, the demarcated flood extents using a 2D hydraulic scheme was validated through overlay analogy of the ArcGIS platform using historic flood extent collected from Irrigation Department, Pakistan. Different researchers have discussed the Soil & Water Assessment Tool (SWAT) performance on the basis of NSE as: NSE > 0.65, 0.54 < NSE < 0.65, and 0.5 < NSE < 0.54 as very good, good, and satisfactory respectively [53,54,55]. However, ref. [56] have used RE for accuracy assessment of PCSWMM and found it a reasonable indicator for model performance assessment. The plus and minus sign of RE represents the underestimation and overestimation of the model respectively.
The methodological flow chart is shown in Figure 3.
2.6. Flash Flood Exposure Assessment
The flash flood exposure analysis is performed using spatial overlay analogy in the ArcGIS environment. It was preferred to compare the results with the field data from the Irrigation Department instead of the MODIS product due to the cloud cover in the imagery. The piedmont area is vulnerable to flash floods; however, local community manages the patchy crop production in the area. Small diversion structures are constructed in the area to overcome the impacts of flash flood events. LULC data acquired from the Punjab Irrigation Department was used to analyze the crop vulnerability in the piedmont plains. The 2D simulations result in different flash flood inundation scenarios.
3. Results
3.1. Measured and Inferred Parameters
Arc Hydro tools were used to derive the Vidor watershed morphometric characteristics. The generated hydrodynamic model consists of measured and inferred parameters. EI Alfy and Santhi et al. use Arc Hydro technique for delineation of catchment boundary and found it a suitable technique for deriving morphometric characteristics of watersheds [53,54]. Vidor watershed consists of a total of 88 sub-catchments with different characteristics. The ranges of measured and inferred parameters are shown in Table 3.
3.2. PCSWMM Simulations
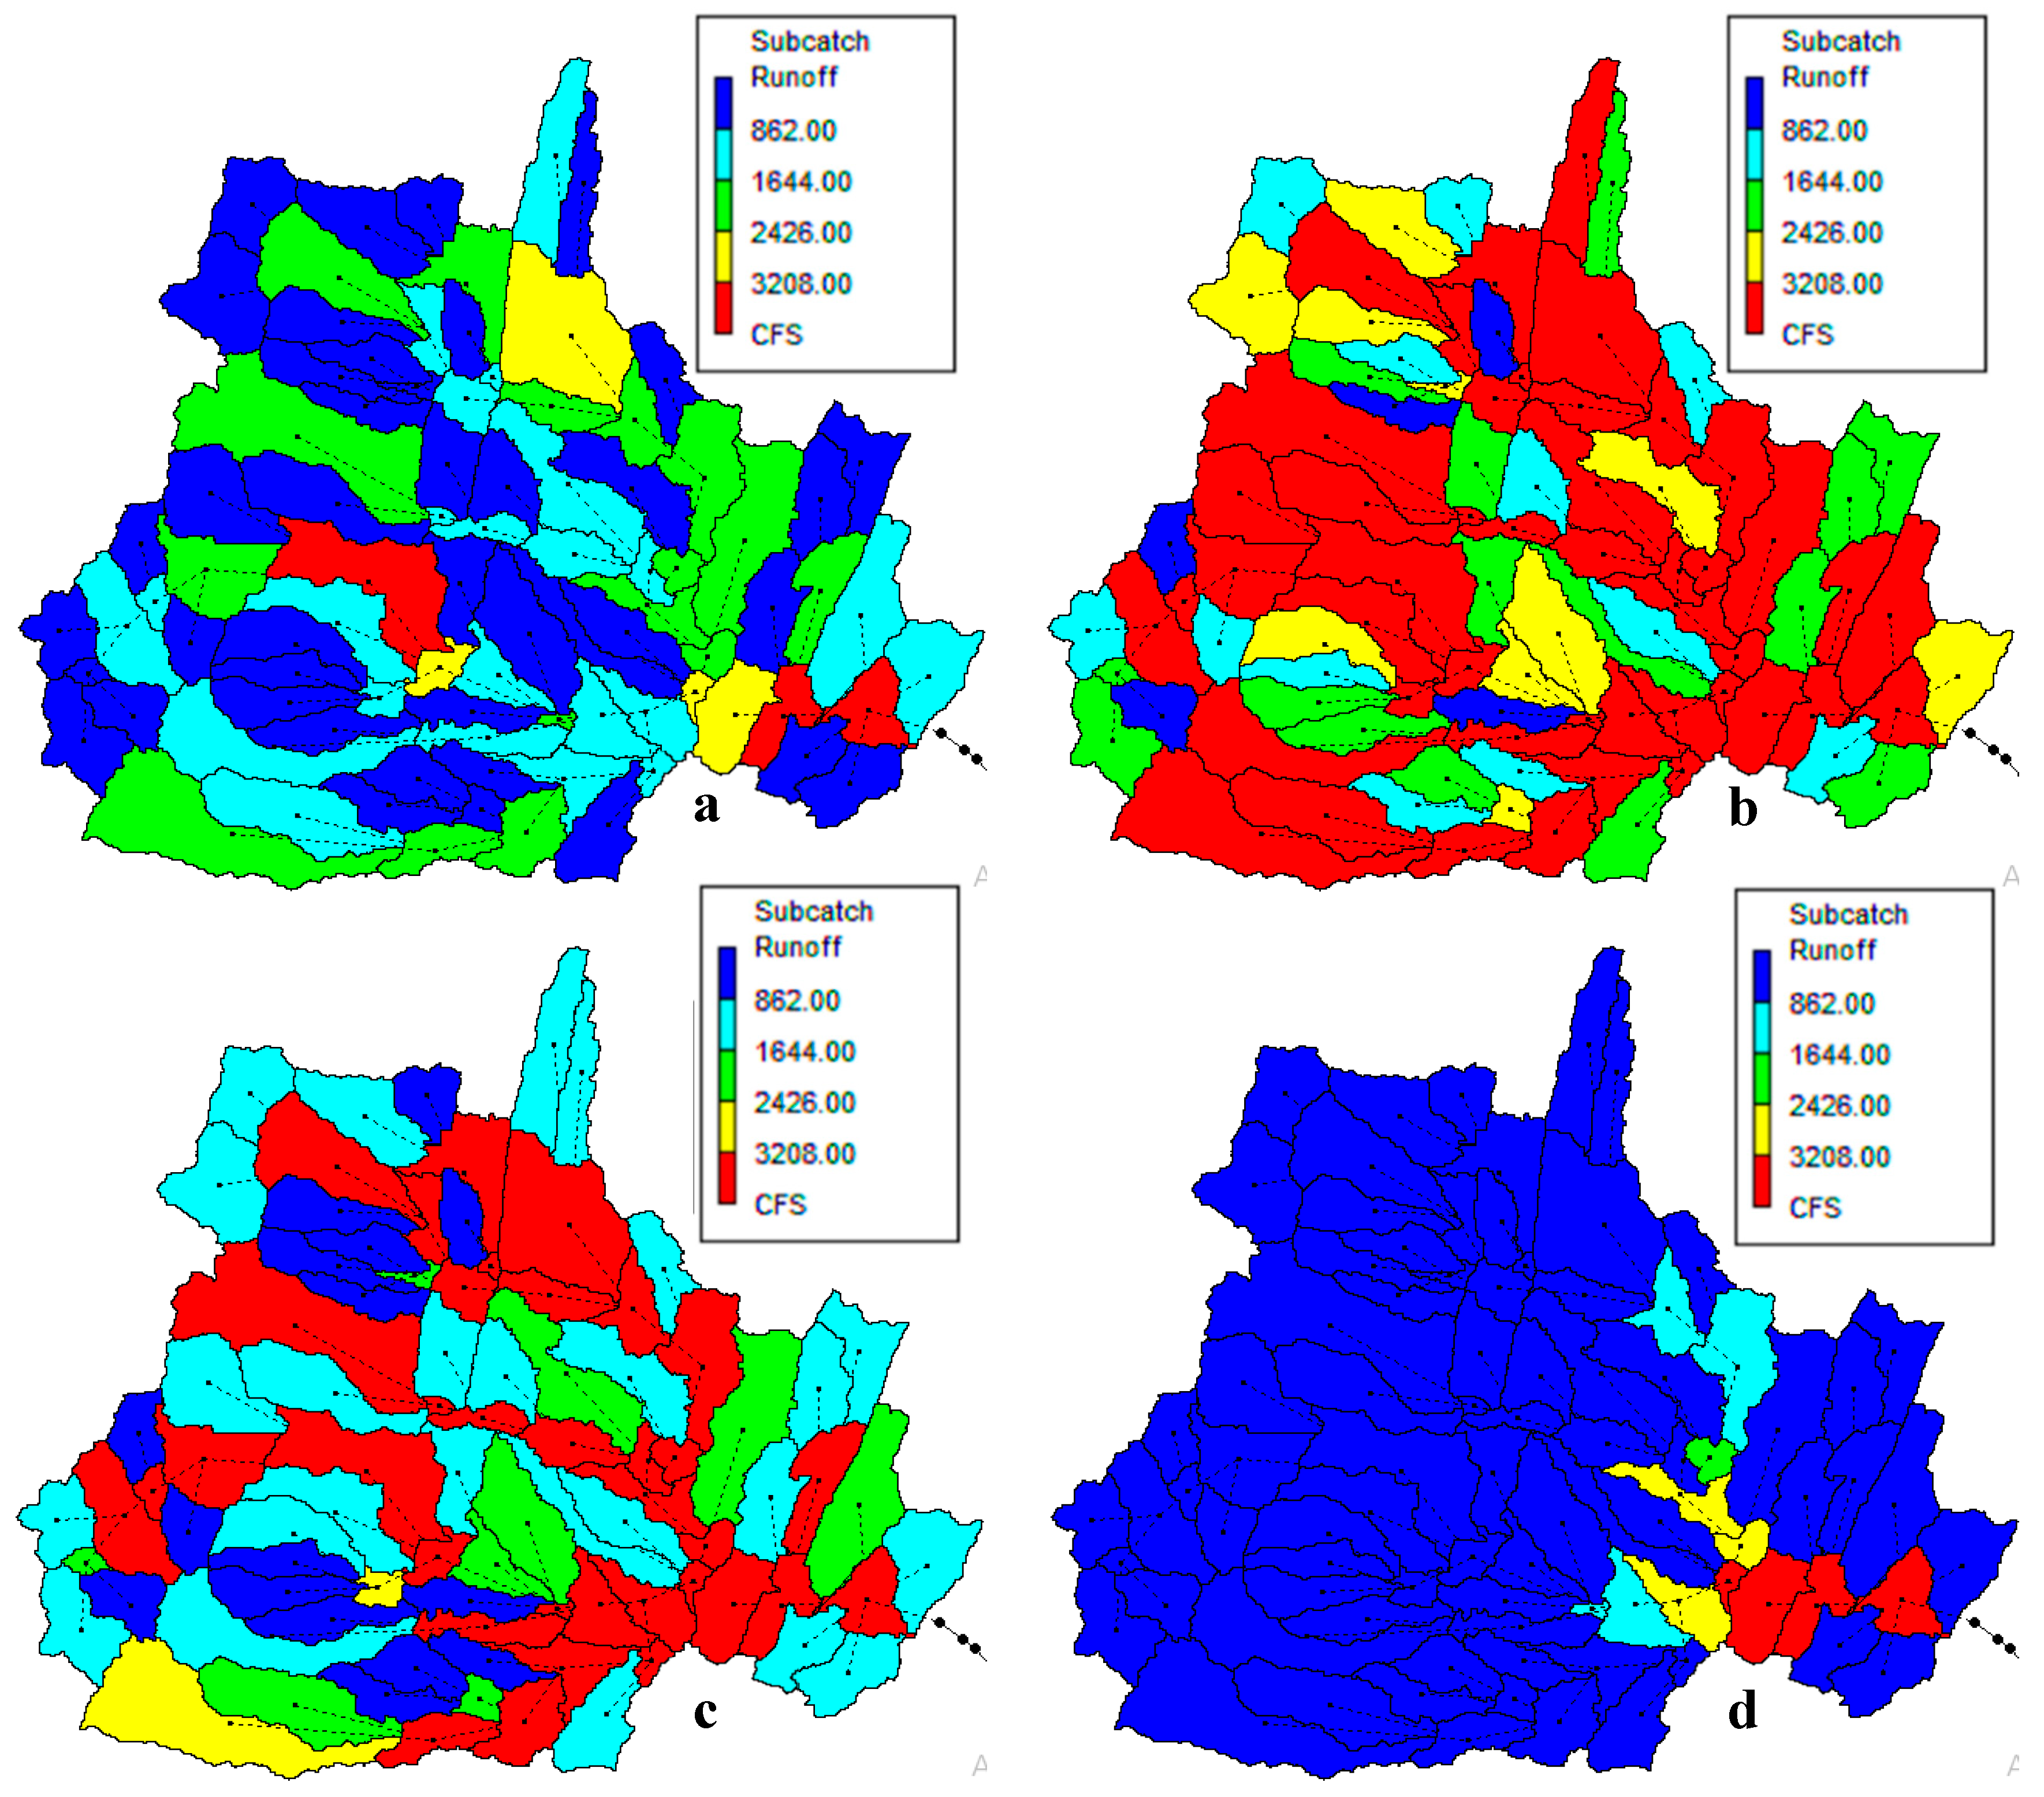
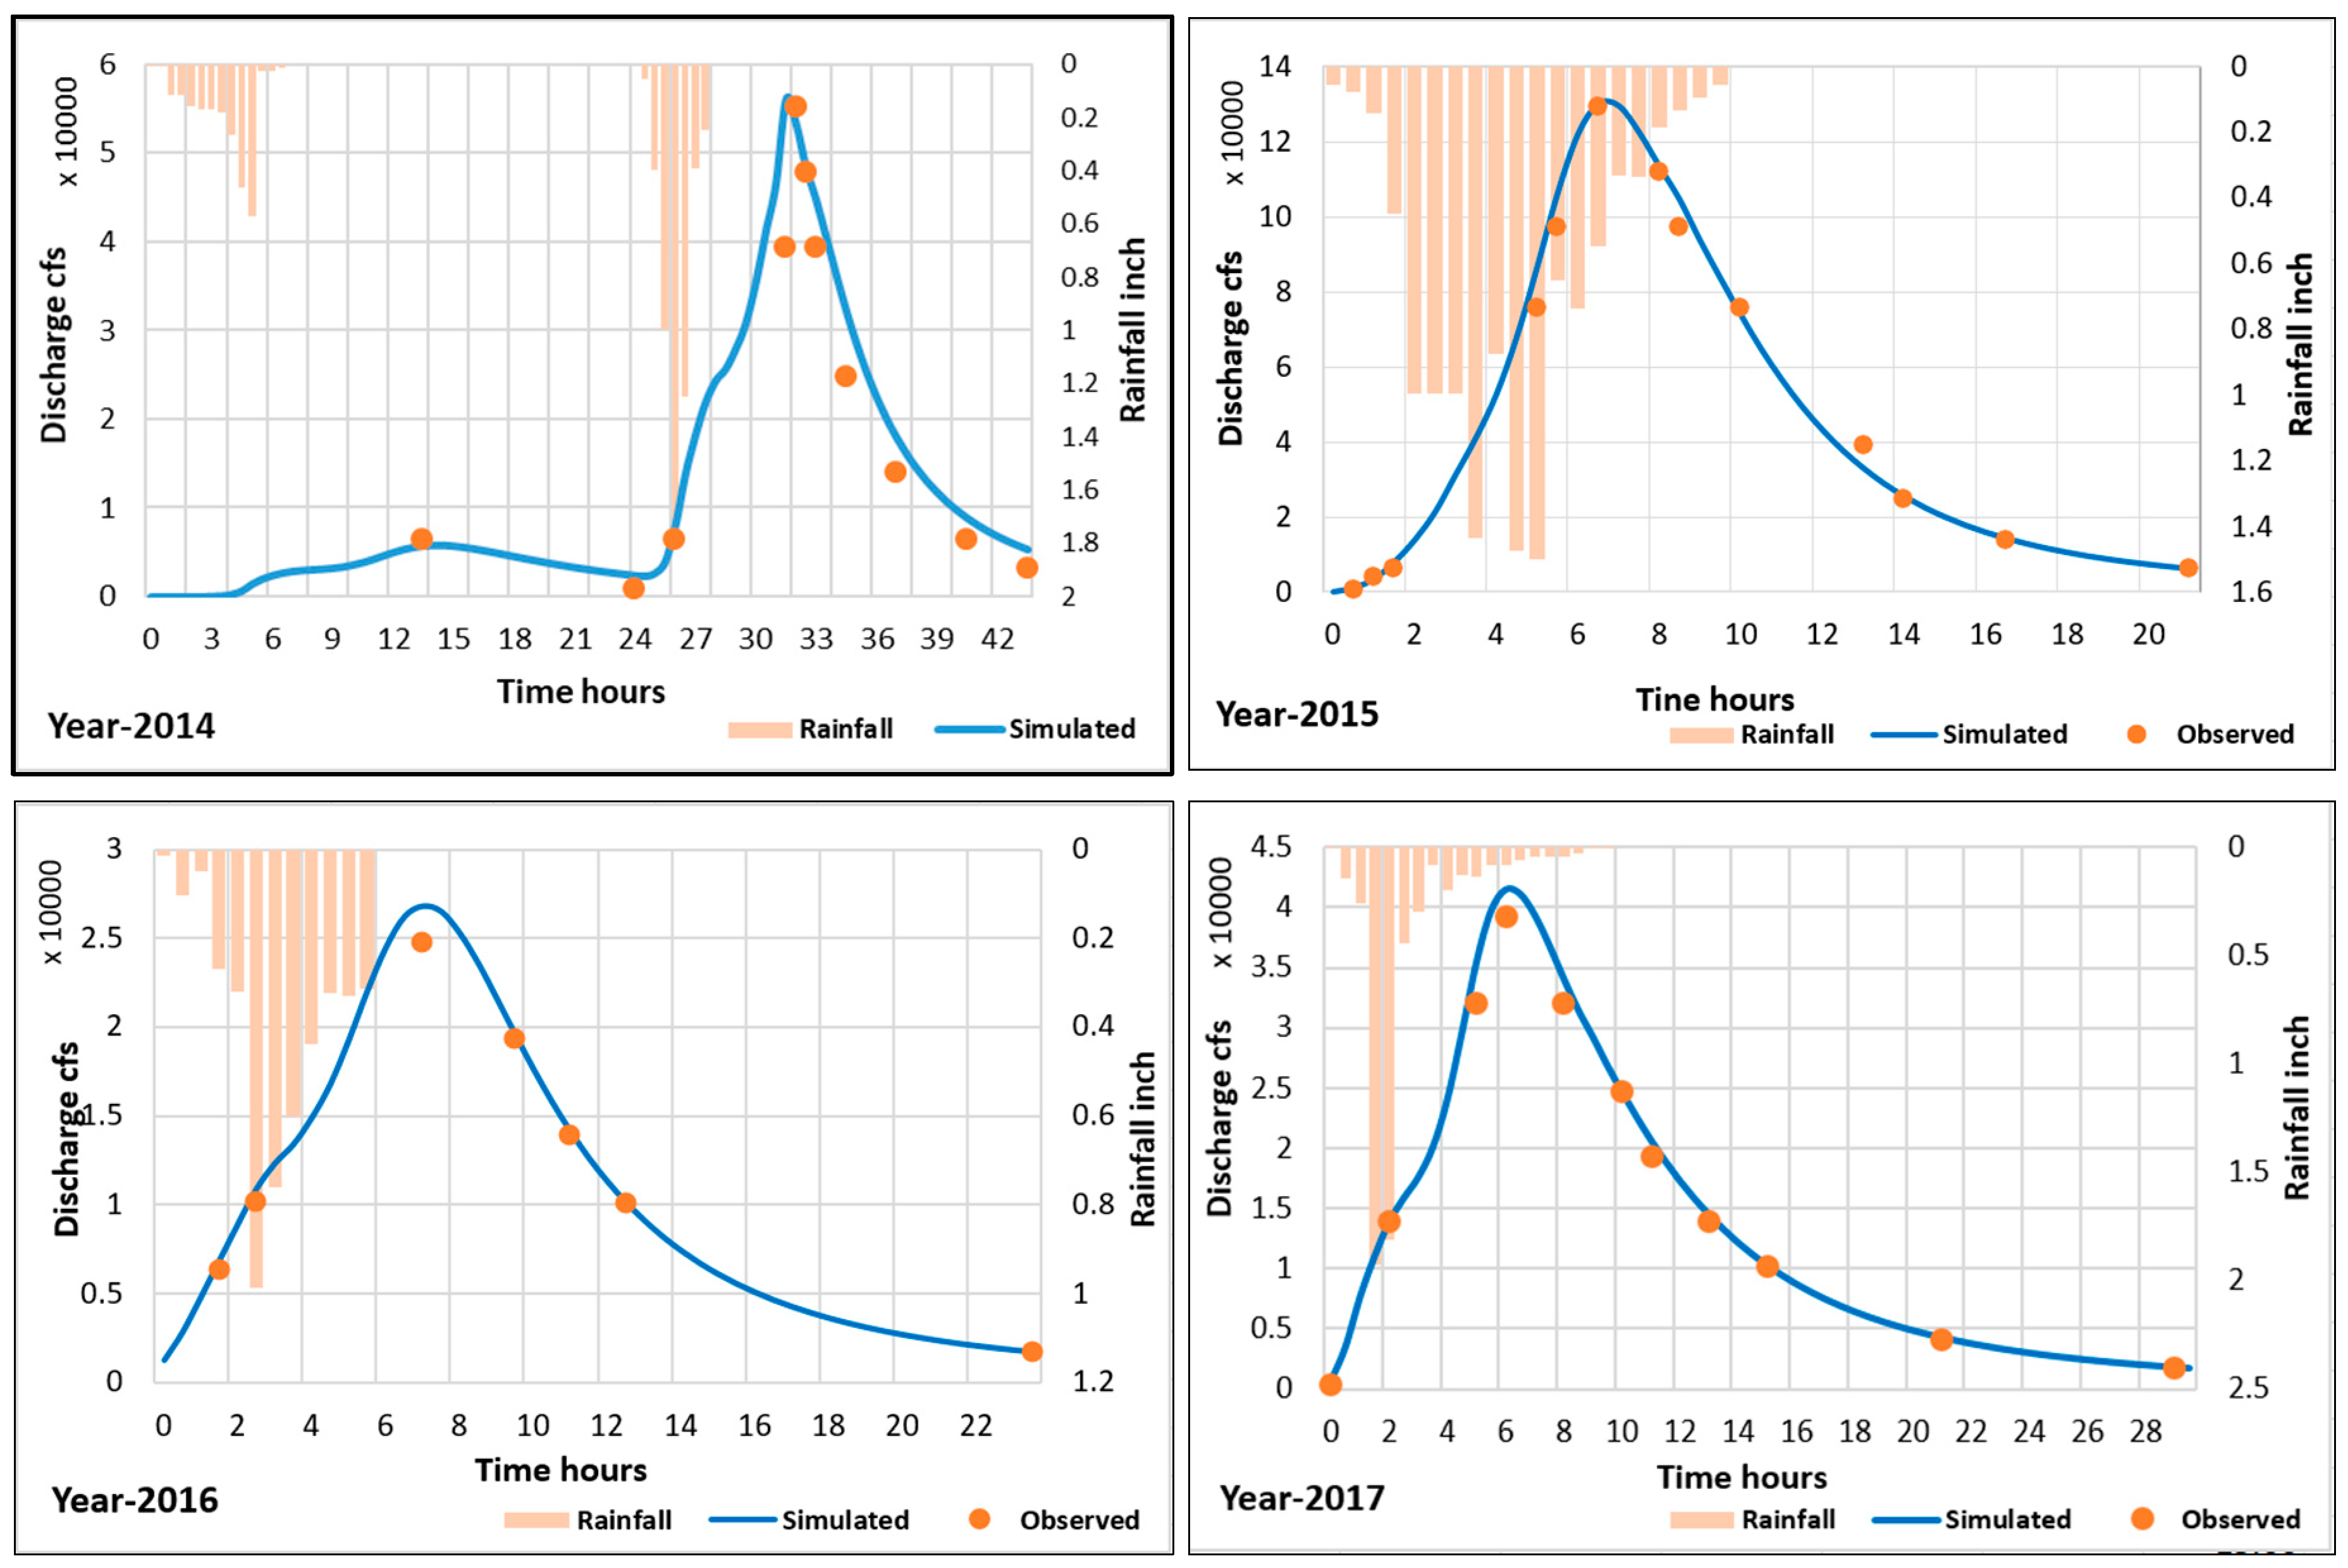
The integration of measured and inferred parameters at the sub-catchment level allows each catchment to behave independently for rainfall hyetograph. The system of sub-catchments generates a semi-distributed scheme as shown in Figure 4. Each sub-catchment behaves as the smallest unit of the system. Every catchment has a dual behavior in the designed system for a particular event including (1) the runoff generated by the individual sub-catchment, and (2) the contributed discharge from the connected upstream catchment known as run-on. The individual sub-catchment generates runoff for a particular rainfall event; however, due to upstream and downstream catchment connections the total runoff volume and peak is a combination of the runoff and the run-on. The discharge variations for each sub-catchment was observed for the peak events of 2014–2017 with a constant time interval Δt = 30 min as shown in Figure 4.
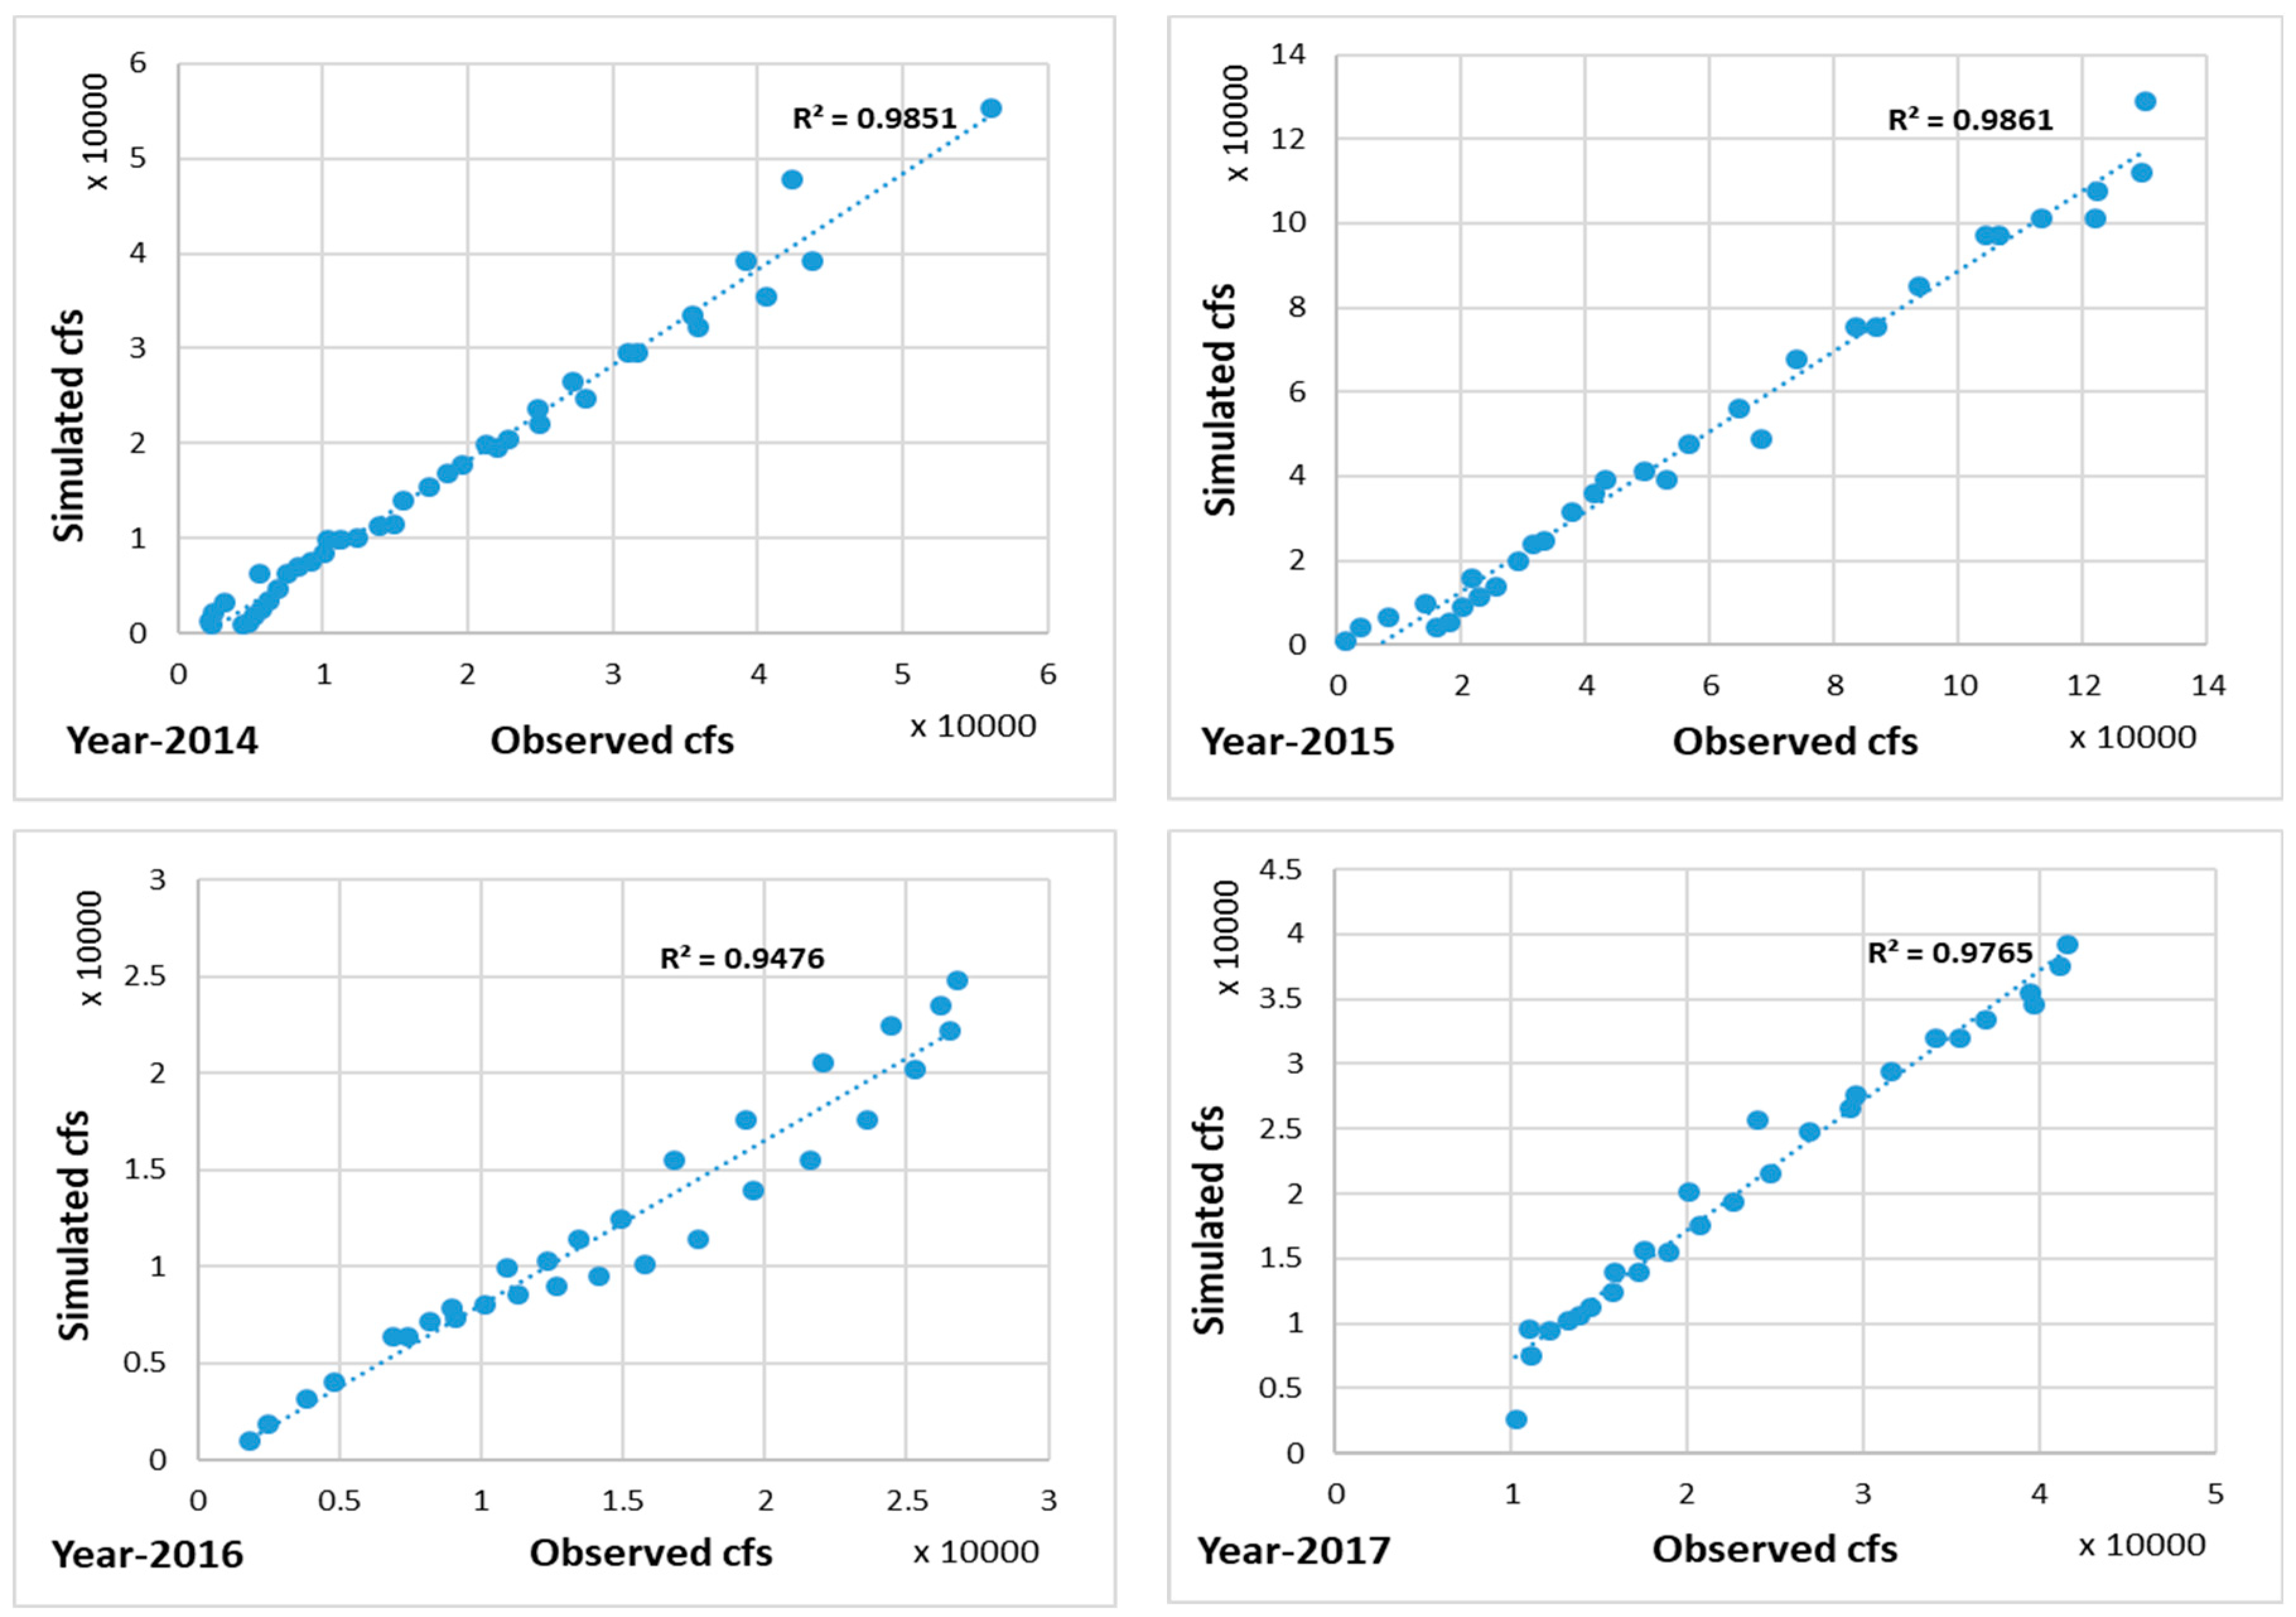
The calibration and validation results show high correlation with the observed discharge measurements. Figure 5 shows the calibrated and validated scatterplots on event basis.
It can be seen from Table 4 that model performed efficiently for Vidor torrent when tested on peak events on the statistical criteria of NSE, RE, and R2. The model dropped NSE and R2 value for the year 2016 and remains in an excellent class for calibrated and validated periods. It has been observed that the model for whole events overestimates the results with fractions of difference (−0.22 < RE < −0.09).
Flash flood event of the year 2012 was recorded as the maximum peak of Vidor catchment [7]. However, due to the lack of high accuracy data of rainfall and discharge historical events were not simulated. GPM data was available since 2014 at 30 min resolution and has been used exorbitantly all over the globe for flood studies [57,58,59]. GPM satellite data found suitable for storm burst event simulations for Vidor torrent. It was observed that GPM generates high accuracy (NSE, RE, and R2) for high-intensity rainfall events and accuracy reduces for low-intensity peak events (Table 4).
The dry and abrupt nature in the topography of Vidor torrent makes it a unique catchment. The runoff is entirely depending upon rainfall behavior in the catchment with no base flow. The abrupt nature of rainfall on Vidor torrent results in sudden response due to steep slopes. The result substantiates no influence of evapotranspiration on runoff due to very short time of flash flood events. The data interpolation of observed discharge and the rainfall-runoff direct relation results to achieve such high values of statistical indicators.
3.3. Data Limitations and Interpolation
The observed data record (2014–2017) has a limited number of observations and was interpolated using cubical spline statistics. The data was completed for the peak events and was used for accuracy assessments. The limited number of observed records are shown in Figure 6. Different researchers have used the cubical spline methodology for the calculation of missing datasets [60,61,62,63,64,65,66]. For uneven distribution of gap, it is preferred to apply piece-wise cubical spline interpolation. In this technique, each gap is interpolated individually. However, the size of the gap between two observations affects the accuracy of interpolation.
High variation in the slope of Vidor torrent substantiates random and sudden response depending upon the shape of hyetograph. The intensity and duration of rainfall define the lag-time (time between the peaks of hyetograph and hydrograph) of torrent response to flash flood events. The Table 4 summarizes the storm duration, total rainfall, and resulting lag-time. The PCSWMM results show an excellent agreement between simulated and observed flash flood peaks for four years’ data.
It was found that the slope adjusted CN scheme performs efficiently for event-based simulation [7,16,49,67]. However, soil physical infiltration models (Horton, Green Ampt, etc.) behave more efficiently for monthly and annual quantification of runoff [68]. The study demonstrates the supremacy of modern GIS and RS coupling techniques in the integration of different parameters at a pixel level. The slope shows a huge impact on the modification of CN and hence the surface runoff. [69,70,71,72,73] utilizes GIS and RS techniques for accurate measurement of CN values.
3.4. Flood Extent Analysis (2D Simulations)
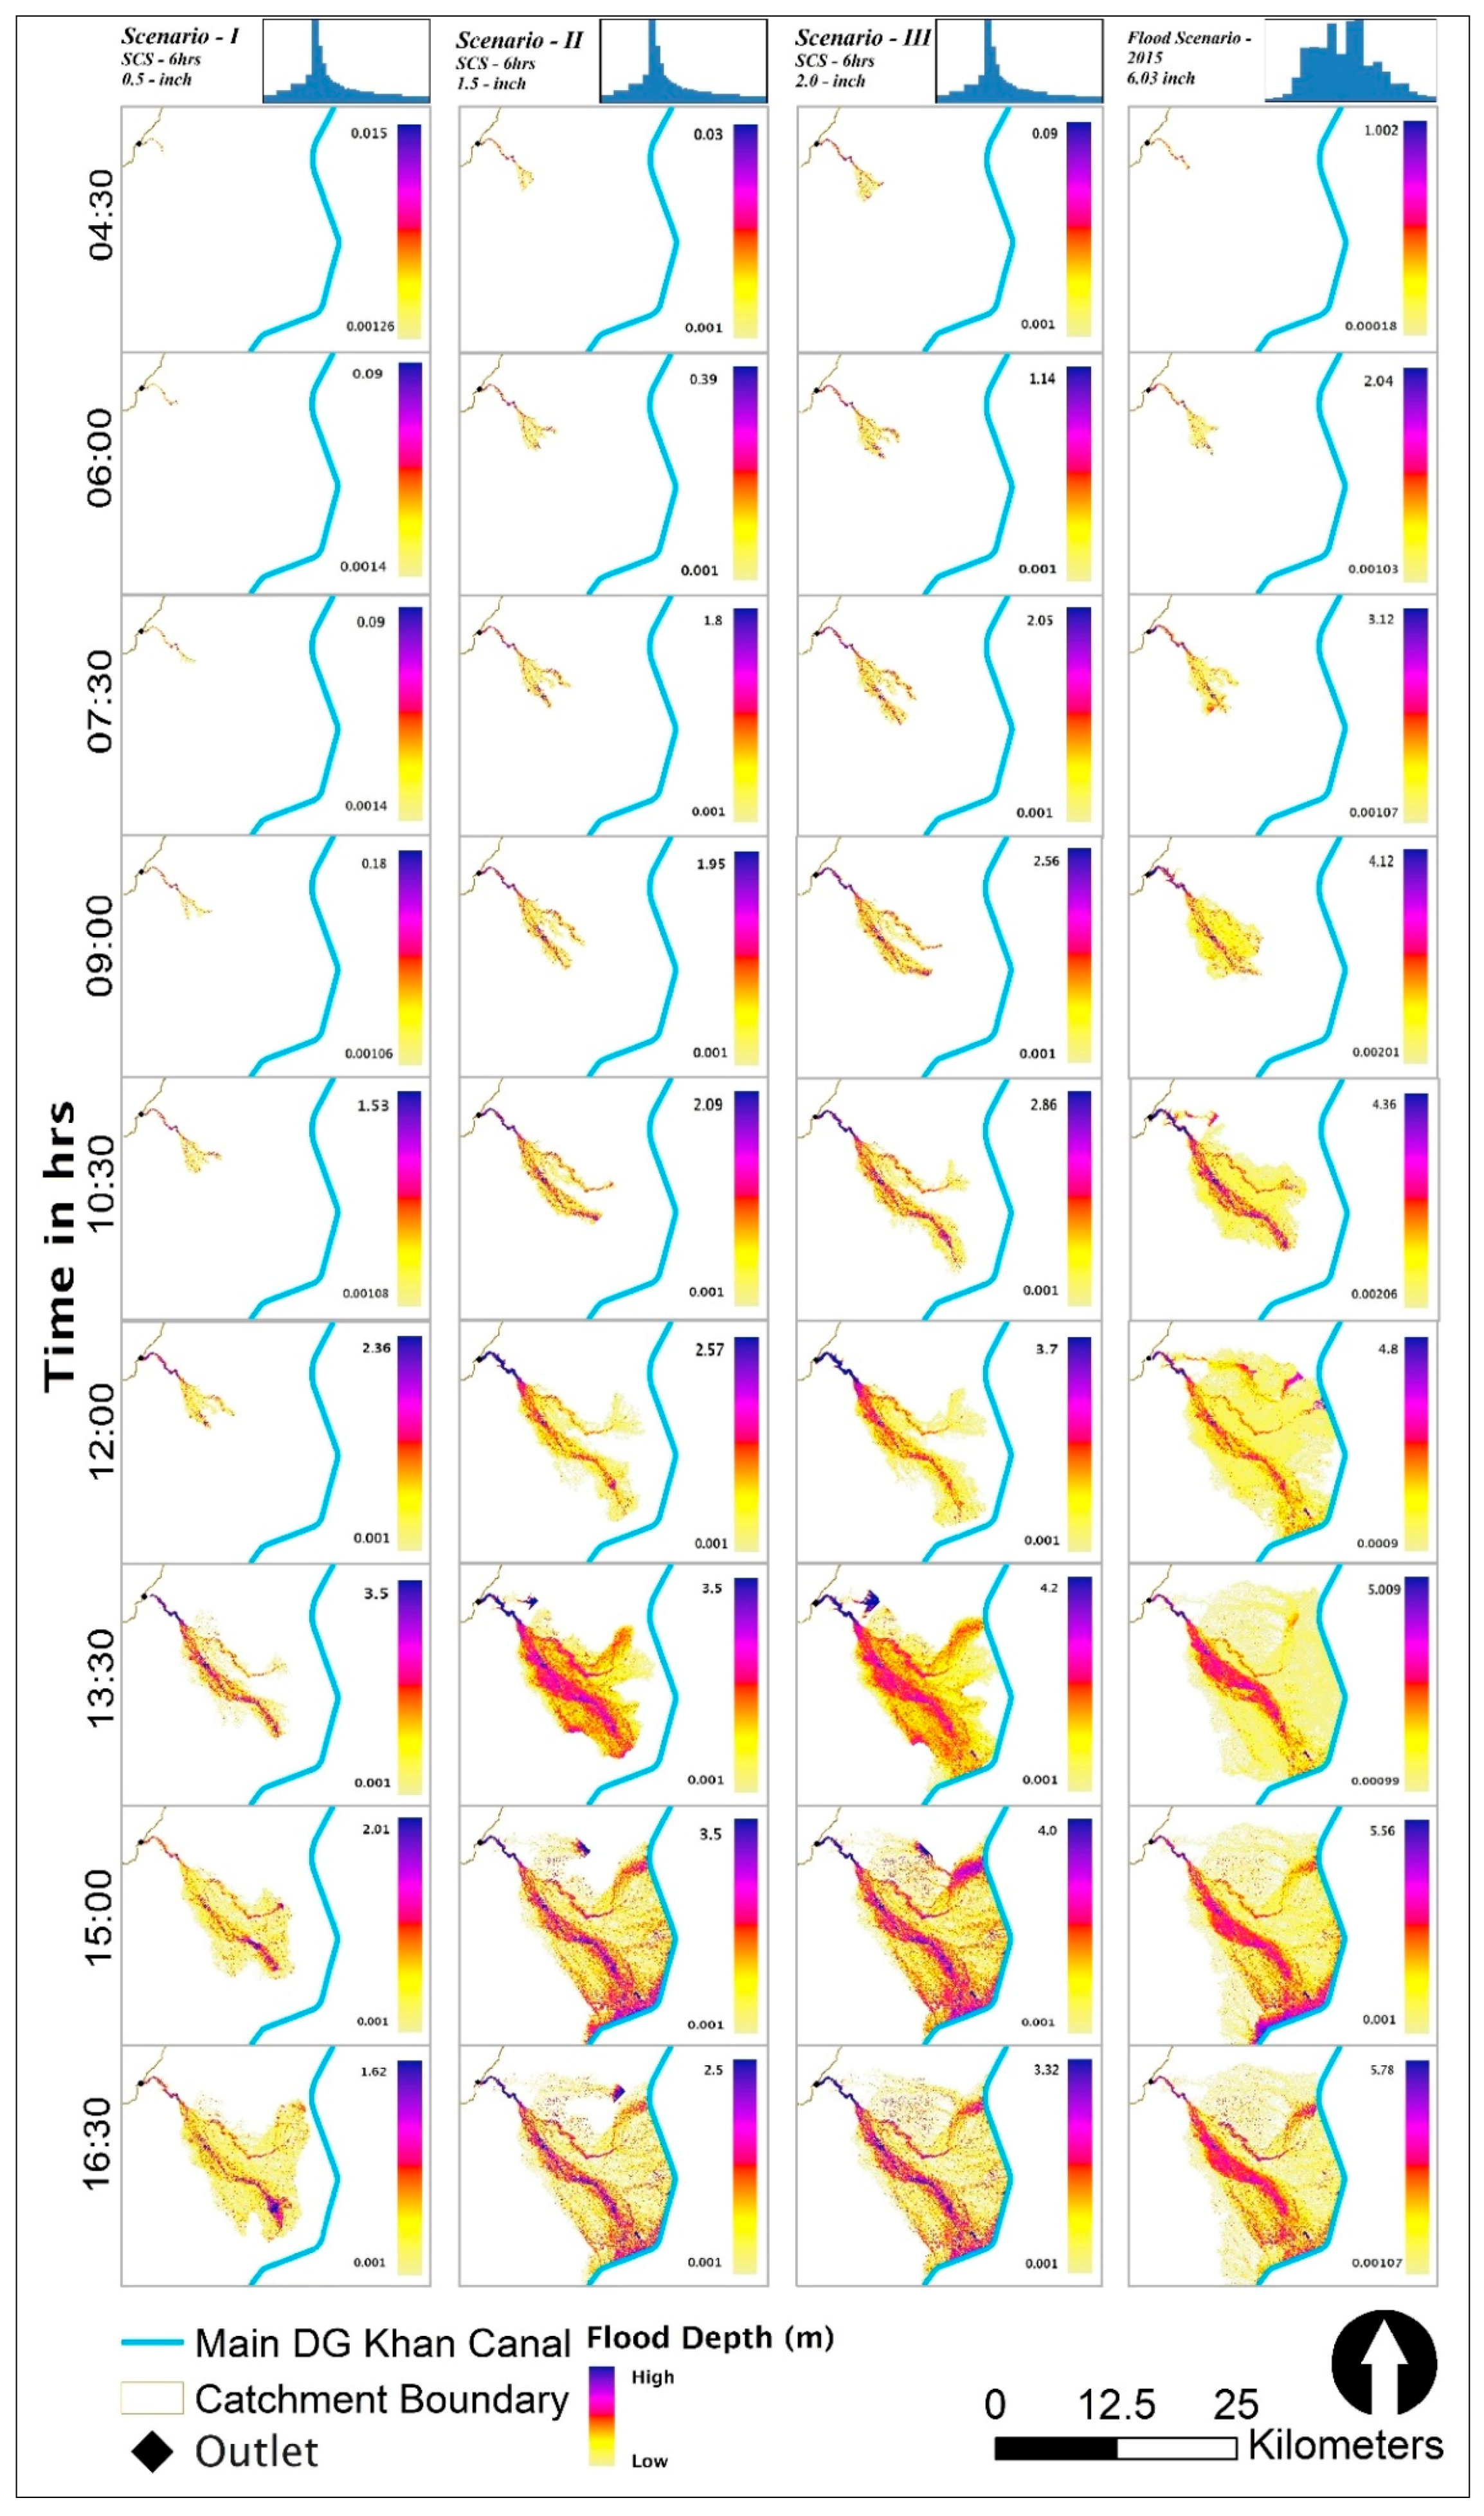
The flood plains are demarcated with recursive 2D hydraulic simulations. The designed storms of 0.5, 1.0, and 1.5-inch intensity of SCS type at 6 h duration were generated in PCSWMM. The simulated hydrographs were further used for flood plain zoning in the down piedmont plains. Furthermore, changes in the depth and flow area were scrutinized for designed storms.
It was observed that the behavior of flash flood water in the piedmont plain is solely dependent on the shape of hyetograph, time of peak, lag time, roughness coefficient (soil × LULC), and DEM (elevation and slope). However, the main flow path remains the same with the increase of inundation depth. The flow in piedmont plain lacked in channel flow due to flash flood events and its non-perennial nature.
The behavior of flash flood water for 0.5, 1.0, and 1.5-inch SCS 6-h storm hyetograph in comparison with flash flood event 2015 is shown in Figure 7. The results for different storm intensities show the change in expansion of flood zone, branched from natural path of the nullah. With the increase in the intensity of storm, width of the flood plain is also increased with widespread, generating a fan-shaped zone in the piedmont area. Contrarily, low-intensity flood events also follow the main path of the natural nullah but the width of the flood plain decreases sufficiently, generating a small fan-shaped zone in the piedmont area. The depth of the flash flood water remains high in the existing nullah, but the depth diminished at the outskirts of nullah due to the steep topography of the piedmont plain (upstream to downstream) and the vague footprints of natural nullah. It was observed that for all developed scenarios the peak flood depth appeared near the outlet of the catchment where the depth of the channel is high. However, in the piedmont plain, the flood water depth decreases sufficiently due to the dispersion of flood in different directions.
The 2D hydraulic modeling procedures in HEC-RAS 5.x not only provide better and accurate (DEM resolution dependent) floodplain demarcation as compared to 1D hydraulic modeling but the methodology is also time and effort efficient in data-limited areas. However, the 1D hydraulic modeling model needs extensive data inputs including a storage area, cross-sections, weir structures that require a lot of time and effort [34].
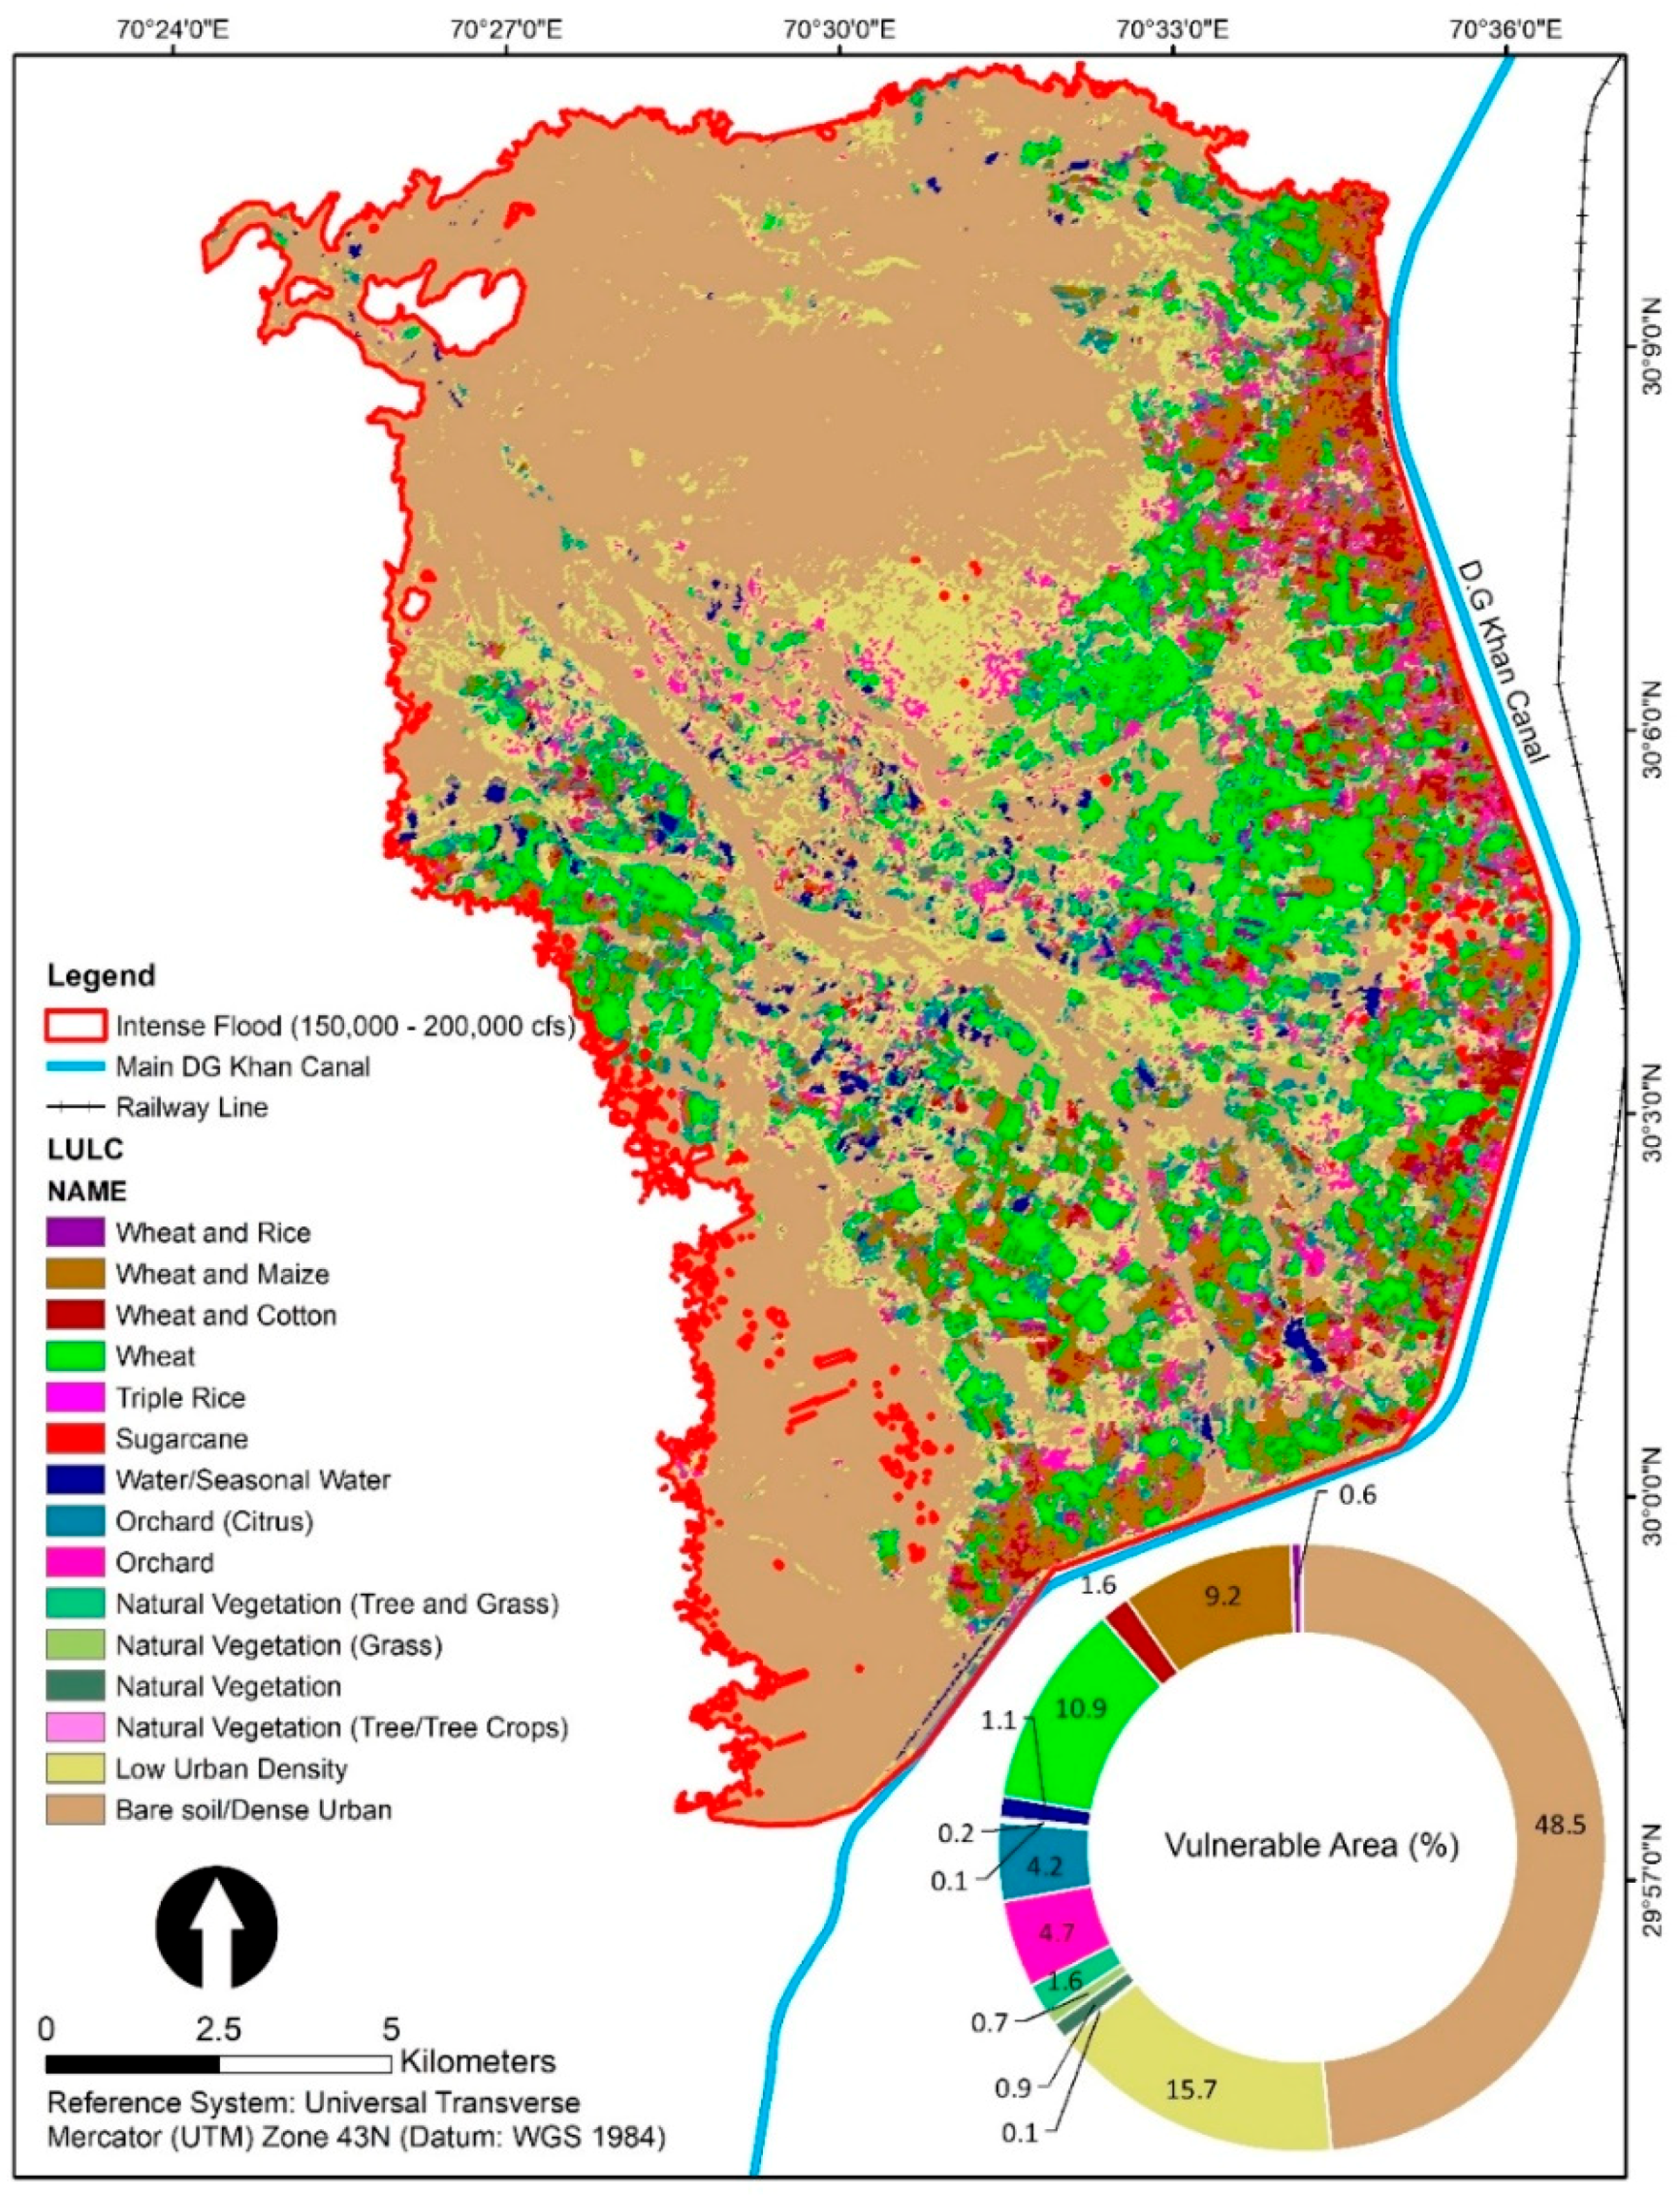
In the current study, the multiple 2D hydraulic simulations result in the classification of flood extents for medium, high, and intense flash flood scenarios. The classification is based on the peak event discharges observed in the past years and the areal destruction recorded (local-knowledge) during the event. The discharge magnitudes of 0.05–0.1 million cusec, 0.1–0.15 million cusec, and 0.15–0.2 million cusec are classified as medium, high, and intense flood respectively. The medium, high, and intense flood covers 19557.58, 26875.28, and 29087.97 ha of area respectively as shown in Figure 8. Whereas historically available flood extent, extracted from MODIS data, for the year 2012 during a high flood event is 20519 ha.
3.5. Flash Flood Exposure and LULC Vulnerability
Simulated flood extent boundary, considering intense flood scenario, matched 76% with historically available flood extent boundary. The main flow area remains the same when compared with the available flash flood extent data collected from the Irrigation department. Ahmed et al. use multi-temporal Landsat-8 and MODIS satellite products to analyze the impact of the flash flood on rice crops [74]. However, ref. [75] uses Landsat 7 to delineate maximum flood extent in North Carolina. Tanguy et al. use high-resolution Radarset-2 dataset for flood monitoring [76].
4. Discussion
Pakistan is a country with varied topography—from alpine forests in the north to the barren mountainous catchment in the south and west regions. Mostly, low-lying areas including piedmont plains on the downstream of mountainous catchment face low to high-intensity flash flood events and during last few years, Pakistan has experienced an increased number of flash flood events owing to the changes in weather pattern [38,39]. Flash floods in Pakistan are mostly caused by monsoonal torrential rains, and a shift of monsoonal patterns has increased the frequency of flash flooding [30]. Hill torrents of southwest Punjab (Pakistan) are extremely vulnerable to flash floods. Historically, flash floods of small to large intensity frequently damage agriculture in the west of Dera Ghazi (D.G.) Khan District. The main source of flash flooding in these areas are the hill torrents situated nearby the area including Vidor, Chachar, Mithawan, Sakhi Sarwar, Kaha, Sanghar, and Sori Lund. Hill torrents of southern Punjab, after receiving torrential rains during monsoon season, frequently generate flash floods in the area. In September 2012, heavy spells of Monsoon rainfall on Suleiman hills (Vidor catchment) of D.G. Khan cause disastrous conditions in the city area and adjoining rural areas [7].
In Pakistan, flash flood management measures are done structurally by embankments, studs, spurs, and various flood protection techniques. For the safety from small as well as large-scale destruction flood walls with diversion structures are constructed. Structural measures delay action dams and channelization of flood water through small streams are also some techniques that are used for flood protection at the local level. Mirani Dam constructed in 2006 is an example of a delay action dam in Baluchistan for the storage of hill torrent water for the sake of irrigation purposes and for the protection of the low-lying area from any flash event [38].
The study tries to combine multi-steps methodology for alternative cost and time effective parsimonious methodologies used for flash flood water assessments in rural areas. The main goal of the research was to use a semi-distributed modeling approach to calibrate the PCSWMM for rural Vidor’ catchment prone to flash flood. Satellite rainfall, GPM, data with a temporal resolution of 30 min accurately predicts the peak discharges for flash flood events of 2014–2017. The reliable results of statistical tests prove the applicability of GPM data for torrential catchment in a semi-distributed modeling approach. Hydrologic modeling requires extensive data records for processing when performed for flash flood events. The input parameters were generated using remote sensing and GIS techniques. Different researches have shown the accuracy of semi-distributed and distributed hydrologic modeling for flash flood prediction and monitoring. The models are equally applicable for catchments with steep slopes and high topographic relief [17,18,19]. The generated slope adjusted CN scheme and designed methodology for the semi-distributed model generate consistent results with less data requirement and is replicable in other torrential catchments with ease. The CN scheme with different antecedent moisture conditions results in high accuracy of peak discharges. Rozalis et al., also used CN schemes on Merhavia watershed in northeastern Israel and found it a reliable approach for flash flood prediction [77]. However, ref. [78] used GIS-based model to evaluate the flood discharge of Xirolaki torrent in Northern Greece. Contrarily, the approaches for flash flood inundation modeling requires extensive data measurements. The results substantiate that for foothill areas, piedmont plains with vague cross-sections, 2D hydraulic modeling without incorporating cross-section data in piedmont plains can be replaced with 1D hydraulic modeling. However, 2D hydraulic simulation solely depends upon the accuracy and refinement of elevation data, therefore preprocessing including Fill sinks, depression evaluation, and DEM reconditioning must be performed prior to simulate 2D hydraulic model. The processed elevation data incorporates in 2D hydraulic model substantiates sufficient accuracy for flash flood extents. The integration of hydrological modeling (PCSWMM) with open source data and 2D hydraulic modeling (HEC-RAS 5.x) links the research for flash flood hazard modeling in data-poor areas.
This study also highlights the value of open-source information for flash flood hazard assessment. The freely available ALOS PALSAR elevation data, 12.5 m spatial resolution, generates a good prediction of flood extents in the piedmont plains. The multi-step scheme for flash flood assessment is simple and effective in nature for areas with limited data and hence could be implemented on other mountainous catchments with similar topography.
5. Conclusions
The study utilizes an integrated procedure for the quantification of flash flood events and demarcation of floodplain at foothill area of Vidor torrent. Hydrological investigations were performed using PCSWMM suit to scrutinize the rainfall-runoff relation. The generated hydrographs were tested for piedmont plain to analyze the simulated flood extents (medium, high, and intense) and depth distributions using 2D hydraulic modeling domain of HEC-RAS 5.x. The foregoing research tries to attempt the disaster risk reduction strategy in D.G. Khan for Vidor torrent. The integrated approach of hydrological, 2D-hydraulic modeling, and GIS-RS approach is used to identify the potential disaster of Vidor torrent. The study quantifies the flash flood extent for designed and peak events observed in the past years 2014–2017. The target area covers the Vidor catchment (source of flash flood) and the piedmont area in the down-plains of the source catchment. The rainfall-runoff simulation and flood extent demarcation with sufficient accuracy unveil the flash flood problem in the area. The demarcated flood extents are classified in medium to intense flood scenarios substantiates the basics for an early warning system in the area. The study concludes the following testimonials:
- Slope adjusted CN scheme at sub-catchment level accurately quantifies the peak events for Vidor torrent and proved the applicability of the adopted procedure for torrented areas. The statistical indicators (NSE, R2, RE) justifies the result with high values (0.75–0.97, 0.94–0.98, and −0.22– −0.09) respectively. The semi-distributed hydrologic modeling approach using satellite rainfall-GPM in PCSWMM best fits the quantification of peak flash flood events in rural catchments with no rain gauge installed. However, the accuracy may drop for low-intensity events.
- The results substantiate the accuracy of 2D hydraulic modeling when compared, 76%, with existing flash flood extents. The areas with maximum inundation depths were observed in an exact match with the existing data collected from field staff of the Irrigation department, Pakistan.
- The visual representation of inundation depths and flood extents based on 0.5/12.7, 1.5/ 38.1, and 2.0/50.8 inch/mm rainfall and flash flood event of the year 2015 (intense flash flood event observed in past years) were analyzed to evaluate the behavior of flash flood water in the piedmont plain. Recursive 2D hydraulic simulations identify the areas with maximum inundation. The maximum depth was observed near the vague footprints of natural nullah.
- The overlay analogy of GIS and RS schemes were used for vulnerability analysis against intense flash flood extent. Patchy rural settlements and wheat crop in the piedmont areas were observed most vulnerable for generated flash flood scenarios. The overlay scheme is proved handy for vulnerability and risk analysis for data-poor areas.
- The methodology and substantiated results confirmed the application of PCSWMM with advance SRTC calibration module and 2D hydraulic simulation of HEC-RAS in chorological (space-wise) and chronological (time-wise) domains. However, the research upshot suggests that real-time discharge observations should be carried out at hourly basis to better check the accuracy of PCSWMM. The flash flood extents were demarcated using 12.5 m ALOS-PALSAR open-source DEM; however, the extents may be improved using high resolution DEM.
6. Recommendations
The changing behavior of climate is expected to affect flooding through rainfall disturbing patterns. The abnormalities in rainfall exacerbate the existing effects of flash flooding on community services, infrastructures, etc. in Pakistan. The priorities, therefore, of flood risk management should be changed to adapt the changing behavior of climate. Vidor is an active non-perennial torrent and frequently affects the settlements and crops in the piedmont area. The management of present-day and future risk from Vidor flash floods should be a combination of possible risk mitigation through structural or regulatory measures. In a study by [7], they proposed two small dams with a storage capacity of 13.31 and 14.29 million cubic meter capacity. The proposed structural measures by [7] are a part of disaster risk management and will lock the communities in the future of no risk from flash flooding.
Author Contributions
Conceptualization: Bilal Ahmad Munir, Sajid Rashid Ahmad, Sidrah Hafeez; Analysis: Bilal Ahmad Munir, Sidrah Hafeez; Writing—Original Draft Preparation: Bilal Ahmad Munir, Sidrah Hafeez; Writing—Review and Editing: Bilal Ahmad Munir, Sajid Rashid Ahmad, Sidrah Hafeez. All authors have read and agreed to the published version of the manuscript.
Funding
This research received no external funding.
Acknowledgments
The authors would like to acknowledge the Punjab Irrigation Department and Pakistan Meteorological Department for providing rainfall, discharge, historical flood extents, and LULC of piedmont plains datasets.
Conflicts of Interest
The authors declare no conflict of interest.
References
- Van Westen, C.J.; Alkema, D.; Damen, M.C.J.; Kerle, N.; Kingma, N.C. Multi-Hazard Risk Assessment: Distance Education Course Guide Book; United Nations University—ITC School on Disaster Geoinformation Management: Tokyo, Japan, 2009. [Google Scholar]
- Norbiato, D.; Borga, M.; Degli Esposti, S.; Gaume, E.; Anquetin, S. Flash flood warning based on rainfall thresholds and soil moisture conditions: An assessment for gauged and ungauged basins. J. Hydrol. 2008, 362, 274–290. [Google Scholar] [CrossRef]
- Gaume, E.; Bain, V.; Bernardara, P.; Newinger, O.; Barbuc, M.; Bateman, A.; Blaškoviĉová, L.; Blöschl, G.; Borga, M.; Dumitrescu, A.; et al. A compilation of data on European flash floods. J. Hydrol. 2009, 367, 70–78. [Google Scholar] [CrossRef] [Green Version]
- Liste, M.; Grifoll, M.; Monbaliu, J. River plume dispersion in response to flash flood events. Application to the Catalan shelf. Cont. Shelf Res. 2014, 87, 96–108. [Google Scholar] [CrossRef]
- Borga, M.; Boscolo, P.; Zanon, F.; Sangati, M. Hydrometeorological analysis of the 29 August 2003 flash flood in the eastern Italian Alps. J. Hydrometeorol. 2007, 8, 1049–1067. [Google Scholar] [CrossRef]
- Xiaotao, L.; Shifeng, H.; Tao, S.; Jinfeng, X. Design and Implementation of Flood Monitoring and Assessment System. In Proceedings of the 2011 International Symposium on Image and Data Fusion (ISIDF), Tengchong, China, 9–11 August 2011; pp. 1–3. [Google Scholar]
- Munir, B.A.; Iqbal, J. Flash flood water management practices in Dera Ghazi Khan City (Pakistan): A remote sensing and GIS prospective. Nat. Hazards 2016, 81, 1303–1321. [Google Scholar] [CrossRef]
- Petrovic, A. Challenges of torrential flood risk management in Serbia. J. Geogr. Inst. Jovan Cvijic SASA 2015, 65, 131–143. [Google Scholar] [CrossRef]
- Fan, F.; Deng, Y.; Hu, X.; Weng, Q. Estimating Composite Curve Number Using an Improved SCS-CN Method with Remotely Sensed Variables in. Remote. Sens. 2013, 5, 1425–1438. [Google Scholar] [CrossRef] [Green Version]
- Moynihan, K.P.; Vasconcelos, J.G. SWMM Modelling of a Rural Watershed in the Lower Coastal Plains of the United States. J. Water Manag. Model. 2014, 1–12. [Google Scholar] [CrossRef] [Green Version]
- Nielsen, S.A.; Hansen, E. Numerical simulation of the rainfall runoff process on a daily basis. Nord. Hydrol. Res. 1973, 4, 171–190. [Google Scholar] [CrossRef]
- Burnash, R.J.C. The NWS river forecast system-catchment modelling. Comput. Models Watershed Hydrol. 1995, 188, 311–366. [Google Scholar]
- Wang, W.; Shao, Q.; Yang, T.; Peng, S.; Xing, W.; Sun, F.; Luo, Y. Quantitative assessment of the impact of climate variability and human activities on runoff changes: A case study in four catchments of the Haihe River basin, China. Hydrol. Process. 2013, 27, 1158–1174. [Google Scholar] [CrossRef]
- Jiang, C.; Xiong, L.; Wang, D.; Liu, P.; Guo, S.; Xu, C.Y. Separating the impacts of climate change and human activities on runoff using the Budyko-type equations with time-varying parameters. J. Hydrol. 2015, 522, 326–338. [Google Scholar] [CrossRef]
- Gutiérrez, F.; Parise, M.; De Waele, J.; Jourde, H. A review on natural and human-induced geohazards and impacts in karst. Earth Sci. Rev. 2014, 138, 61–88. [Google Scholar] [CrossRef]
- Ahmad, I.; Verma, V.; Verma, M.K. Application of Curve Number Method for Estimation of Runoff Potential in GIS Environment. In Proceedings of the 2015 2nd International Conference on Geological and Civil Engineering (ICGCE), Singapore, 10–11 January 2015; Volume 80, pp. 16–20. [Google Scholar] [CrossRef]
- Zoccatelli, D.; Borga, M.; Viglione, A.; Chirico, G.B.; Schl, G.B. Spatial moments of catchment rainfall: Rainfall spatial organisation, Catchment morphology, and flood response. Hydrol. Earth Syst. Sci. Discuss 2011, 8, 5811–5847. [Google Scholar] [CrossRef]
- Anquetin, G.; Horgan, G.; Rawe, S.; Murray, D.; Madden, A.; Macmathuna, P.; Doran, P.; Murphy, P.V. Synthesis of novel macrolactam and macroketone analogues of migrastatin from d-glucal and comparison with macrolactone and acyclic analogues: A dorrigocin a congener is a potent inhibitor of gastric cancer cell migration. Eur. J. Org. Chem. 2008, 2008, 1953–1958. [Google Scholar] [CrossRef]
- Jia, P.; Liu, R.; Ma, M.; Liu, Q.; Wang, Y.; Zhai, X.; Xu, S.; Wang, D. Flash Flood Simulation for Ungauged Catchments Based on the Distributed Hydrological Model. Water 2019, 11, 76. [Google Scholar] [CrossRef] [Green Version]
- El-Nasr, A.A.; Arnold, J.G.; Feyen, J.; Berlamont, J. Modelling the hydrology of a catchment using a distributed and a semi-distributed model. Hydrol. Process. 2005, 19, 573–587. [Google Scholar] [CrossRef]
- Reed, S.; Schaake, J.; Zhang, Z. A distributed hydrologic model and threshold frequency-based method for flash flood forecasting at ungauged locations. J. Hydrol. 2007, 337, 402–420. [Google Scholar] [CrossRef]
- Walega, A.; Cupak, A.; Amatya, D.M.; Drozdzal, E. Comparison of direct outflow calculated by modified SCS-CN methods for mountainous and highland catchments in upper Vistula Basin, Poland and lowland catchment in South Carolina, U.S.A. Acta Sci. Pol. Form. Circumiectus 2017, 16, 187–207. [Google Scholar] [CrossRef]
- Gironas, J. Morphologic Characterization of Urban Watersheds and Its Use in Quantifying Hydrologic Response; Dissertations Theses-Gradworks; Colorado State University: Fort Collins, CO, USA, 2009. [Google Scholar]
- Khaleghi, M.R.; Gholami, V.; Ghodusi, J.; Hosseini, H. Efficiency of the geomorphologic instantaneous unit hydrograph method in flood hydrograph simulation. Catena 2011, 87, 163–171. [Google Scholar] [CrossRef]
- Beven, K.; Freer, J. Equifinality, data assimilation, and uncertainty estimation in mechanistic modelling of complex environmental systems using the GLUE methodology. J. Hydrol. 2001, 249, 11–29. [Google Scholar] [CrossRef]
- Silberstein, R.P. Hydrological models are so good; do we still need data? Environ. Model. Softw. 2006, 21, 1340–1352. [Google Scholar] [CrossRef]
- Xie, J.; Chen, H.; Liao, Z.; Gu, X.; Zhu, D.; Zhang, J. An integrated assessment of urban flooding mitigation strategies for robust decision making. Environ. Model. Softw. 2017, 95, 143–155. [Google Scholar] [CrossRef]
- Hu, W.; He, W.; Huang, G.; Feng, J. Review of urban storm water simulation techniques. Adv. Water Sci. 2010, 21, 137–144. (In Chinese) [Google Scholar]
- Wu, X.; Wang, Z.; Guo, S.; Liao, W.; Zeng, Z.; Chen, X. Scenario-based projections of future urban inundation within a coupled hydrodynamic model framework: A case study in Dongguan City, China. J. Hydrol. 2017, 547, 428–442. [Google Scholar] [CrossRef]
- Huang, Q.; Wang, J.; Li, M.; Fei, M.; Dong, J. Modelling the influence of urbanization on urban pluvial flooding: A scenario-based case study in Shanghai, China. Nat. Hazards 2017, 87, 1035–1055. [Google Scholar] [CrossRef]
- Cheng, T.; Xu, Z.; Hong, S.; Song, S. Flood risk zoning by using 2D hydrodynamic modelling: A case study in Jinan City. Math. Probl. Eng. 2017. [Google Scholar] [CrossRef] [Green Version]
- Tavakol-Davani, H.; Burian, S.; Apul, D.; Devkota, J. Developing urban water infrastructure modelling approach to control flood damages and reduce life cycle impacts. In Proceedings of the World Environmental and Water Resources Congress 2013: Showcasing Future, Cincinnati, OH, USA, 19–23 May 2013; pp. 2951–2958. [Google Scholar]
- Avila, H.; Avila, L.; Sisa, A. Dispersed storage as stormwater runoff control in consolidated urban watersheds with flash flood risk. J. Water Resour. Plan. Manag. 2016, 142, 04016056. [Google Scholar] [CrossRef]
- Avila, L.; Ávila, H.; Sisa, A. A Reactive Early Warning Model for Urban Flash Flood Management. In Proceedings of the World Environmental and Water Resources Congress, Sacramento, CA, USA, 21–25 May 2017; pp. 372–382. [Google Scholar]
- Huber, W.; Heaney, J.; Medina, M.; Peltz, W.; Sheikh, H. Storm Water Management Model: User’s Manual, 2nd ed.; 1975. [Google Scholar]
- Gironás, J.; Roesner, L.A.; Rossman, L.A.; Davis, J. A new applications manual for the Storm Water Management Model (SWMM). Environ. Model. Software 2010, 25, 813–814. [Google Scholar]
- Tariq, M.A.U.R. Risk-based flood zoning employing expected annual damages: The Chenab River case study. Stoch. Environ. Res. Risk Assess. 2013, 27, 1957–1966. [Google Scholar] [CrossRef]
- Saher, F.N.; Nasly, M.A.; Kadir, T.A.B.A.; Yahaya, N.K.E.; Ishak, W.M.F.W. Harnessing floodwater of hill torrents for improved spate irrigation system using geo-informatics approach. Res. J. Recent Sci. 2014, 3, 14–22. [Google Scholar]
- Hanif, M.; Khan, A.H.; Adnan, S. Latitudinal precipitation characteristics and trends in Pakistan. J. Hydrol. 2013, 492, 266–272. [Google Scholar] [CrossRef]
- Tariq, M.A.U.R.; Van de Giesen, N. Floods and flood management in Pakistan. Phys. Chem. Earth Parts A/B/C 2012, 47, 11–20. [Google Scholar] [CrossRef]
- Ahmad, M. Famer’s Irrigation Practices under Rod Kohi Irrigation System, Department of Irrigation and Drainage, Faculty of Agricultural Engineering and Technology; University of Agriculture: Faisalabad, Pakistan, 2003. [Google Scholar]
- Ahmad, M. Optimal Management of Water Resources in Selected Hill Torrent Command Area of University of Agriculture: Faisalabad, Pakistan. 2016. Available online: http://prr.hec.gov.pk/jspui/bitstream/123456789/7941/1/Matlob Ahmad Full.pdf (accessed on 10 December 2019).
- Leong, T.M.; Ibrahim, A.L.B. Remote sensing, geographic information system and hydrological model for rainfall-runoff modelling. In 33rd Asian Conference on Remote Sensing 2012, ACRS 2012; 2012; Volume 2, pp. 1334–1343. Available online: http://0-www-scopus-com.brum.beds.ac.uk/inward/record.url?eid=2-s2.0-84880019131&partnerID=tZOtx3y1 (accessed on 10 December 2019).
- Luan, Q.; Fu, X.; Song, C.; Wang, H.; Liu, J.; Wang, Y. Runoff Effect Evaluation of LID through SWMM in Typical Mountainous, Low-Lying Urban Areas: A Case Study in China. Water 2017, 9, 439. [Google Scholar] [CrossRef] [Green Version]
- Rees, P.; Schoen, J. PCSWMM Evaluation: Project# 08-08/319: Final Technical Report; University of Massachusetts: Amherst, MA, USA; Water Resources Research Center: Tucson, AZ, USA, 2009. [Google Scholar]
- Cronshey, R. Urban Hydrology for Small Watersheds-Technical Release 55, 2nd ed.; Dept. of Agriculture, Soil Conservation Service, Engineering Division: Washington, DC, USA, 1986.
- Jain, G.V.; Agrawal, R.; Bhanderi, R.J.; Jayaprasad, P.; Patel, J.N.; Agnihotri, P.G.; Samtani, B.M. Estimation of sub-catchment area parameters for Storm Water Management Model (SWMM) using geo-informatics. Geocarto Int. 2015, 31, 462–476. [Google Scholar] [CrossRef]
- Ebrahimian, M.; Nuruddin, A.A.B.; Amin, M.; Soom, B.M.; Sood, A.M.; Neng, L.J. Runoff Estimation in Steep Slope Watershed with Standard and Slope-Adjusted Curve Number Methods. Pol. J. Environ. Stud. 2012, 21, 1191–1202. [Google Scholar]
- James, W. Rules for Responsible Modelling; Computational Hydraulics International (CHI): Guelph, ON, Canada, 2005. [Google Scholar]
- Huber, W.C.; Dickinson, W.T. Storm Water Management Model; Version 4; User’s Manual, USEPA. EPA-600-3-88-001a: Athens, Georgia, 1992. [Google Scholar]
- Rossman, L.A. Storm Water Management Model User’s Manual; version 5.0; National Risk Management Research Laboratory, Office of Research and Development: Cincinnati, OH, USA; US Environmental Protection Agency: Washington, DC, USA, 2010; p. 276.
- Rai, P.K.; Chahar, B.R.; Dhanya, C.T. GIS-based SWMM model for simulating the catchment response to flood events. Hydrol. Res. 2016, 48, 384–394. [Google Scholar] [CrossRef]
- EI Alfy, M. Assessing the impact of arid area urbanization on flash fl oods using GIS, remote sensing, and HEC-HMS rainfall—Runoff modelling Mohamed El Alfy. Hydrol. Res. 2016, 47, 1142–1160. [Google Scholar] [CrossRef]
- Santhi, C.; Arnold, J.G.; Williams, J.R.; Dugas, W.A.; Srinivasan, R.; Hauck, L.M. Validation of the swat model on a large RWER basin with point and nonpoint sources. J. Am. Water Resour. Assoc. 2001, 37, 1169–1188. [Google Scholar] [CrossRef]
- Saleh, A.; Arnold, J.G.; Gassman, P.W.A.; Hauck, L.M.; Rosenthal, W.D.; Williams, J.R.; McFarland, A.M.S. Application of SWAT for the upper North Bosque River watershed. Trans. ASAE 2000, 43, 1077–1087. [Google Scholar] [CrossRef]
- Akhter, M.; Hewa, G. The Use of PCSWMM for Assessing the Impacts of Land Use Changes on Hydrological Responses and Performance of WSUD in Managing the Impacts at Myponga Catchment, South Australia. Water 2016, 8, 511. [Google Scholar] [CrossRef]
- Hossain, F.; Katiyar, N. Improving flood forecasting in international river basins. Eos Trans. Am. Geophys. Union 2006, 87, 49–54. [Google Scholar] [CrossRef] [Green Version]
- Ghosh, S.; Nandy, S.; Kumar, S. Rapid assessment of recent flood episode in Kaziranga National Park, Assam using remotely sensed satellite data. Curr. Sci. 2016, 111, 1450–1451. [Google Scholar]
- Yuan, F.; Zhang, L.; Win, K.; Ren, L.; Zhao, C.; Zhu, Y.; Liu, Y. Assessment of GPM and TRMM multi-satellite precipitation products in streamflow simulations in a data-sparse mountainous watershed in Myanmar. Remote. Sens. 2017, 9, 302. [Google Scholar] [CrossRef] [Green Version]
- Hou, H.; Andrews, H. Cubic splines for image interpolation and digital filtering. IEEE Trans. Acoust. Speech Signal Process. 1978, 26, 508–517. [Google Scholar]
- Sibetheros, I.A.; Holley, E.R.; Branski, J.M. Spline interpolations for water hammer analysis. J. Hydraul. Eng. 1991, 117, 1332–1351. [Google Scholar] [CrossRef]
- Kastanek, F.J.; Nielsen, D.R. Description of soil water characteristics using cubic spline interpolation. Soil Sci. Soc. Am. J. 2001, 65, 279–283. [Google Scholar] [CrossRef] [Green Version]
- Saber, N.R.; Gosman, A.D.; Wood, N.B.; Kilner, P.J.; Charrier, C.L.; Firmin, D.N. Computational flow modelling of the left ventricle based on in vivo MRI data: Initial experience. Ann. Biomed. Eng. 2001, 29, 275–283. [Google Scholar] [CrossRef]
- Daliakopoulos, I.N.; Coulibaly, P.; Tsanis, I.K. Groundwater level forecasting using artificial neural networks. J. Hydrol. 2005, 309, 229–240. [Google Scholar] [CrossRef]
- Plaia, A.; Bondi, A.L. Single imputation method of missing values in environmental pollution data sets. Atmos. Environ. 2006, 40, 7316–7330. [Google Scholar] [CrossRef]
- Fritsch, F.N.; Carlson, R.E. Monotone piecewise cubic interpolation. SIAM J. Numer. Anal. 1980, 17, 238–246. [Google Scholar] [CrossRef]
- Akbari, A. Slope Adjustment of Runoff Curve Number (CN) Using Advanced Spaceborne Thermal Emission and Reflection Radiometer (ASTER) Global Digital Elevation Model (GDEM) for Kuantan River Basin; 2015; Volume 9644, p. 96441W. [Google Scholar] [CrossRef] [Green Version]
- Gabellani, S.; Silvestro, F.; Rudari, R.; Boni, G.; Magliotto, A. General calibration methodology for a combined Horton-SCS infiltration scheme in flash flood modelling. Nat. Hazards Earth Syst. Sci. 2008, 8, 1317–1327. [Google Scholar] [CrossRef]
- Nayak, T.R.; Jaiswal, R.K. Rainfall-runoff modelling using satellite data and GIS for Bebas river in Madhya Pradesh. J. Inst. Eng. India. Civ. Eng. Div. 2003, 84, 47–50. [Google Scholar]
- Gandini, M.L.; Usunoff, E.J. Curve Number Estimation Using Remote Sensing NDVI in a GIS Environment. J. Environ. Hydrol. 2004, 12. [Google Scholar]
- Akhondi, S. An Investigation of Curve Number Model in Flood Estimation Using Geographical Information System (GIS). Ph.D. Thesis, Tarbiat Modares University, Tehran, Iran.
- Pandey, V.K.; Panda, S.N.; Sudhakar, S. Curve Number Estimation from Watershed Using Digital Image of IRS-1D, LISS III, 2002.
- Hong, Y.; Adler, R.F. Estimation of global SCS curve numbers using satellite remote sensing and geospatial data. Int. J. Remote. Sens. 2008, 29, 471–477. [Google Scholar] [CrossRef]
- Ahmed, M.; Rahaman, K.; Kok, A.; Hassan, Q. Remote sensing-based quantification of the impact of flash flooding on the rice production: A case study over Northeastern Bangladesh. Sensors 2017, 17, 2347. [Google Scholar] [CrossRef] [Green Version]
- Wang, Y. Using Landsat 7 TM data acquired days after a flood event to delineate the maximum flood extent on a coastal floodplain. Int. J. Remote. Sens. 2004, 25, 959–974. [Google Scholar] [CrossRef]
- Tanguy, M.; Chokmani, K.; Bernier, M.; Poulin, J.; Raymond, S. River flood mapping in urban areas combining Radarsat-2 data and flood return period data. Remote. Sens. Environ. 2017, 198, 442–459. [Google Scholar] [CrossRef] [Green Version]
- Rozalis, S.; Morin, E.; Yair, Y.; Price, C. Flash flood prediction using an uncalibrated hydrological model and radar rainfall data in a Mediterranean watershed under changing hydrological conditions. J. Hydrol. 2010, 394, 245–255. [Google Scholar] [CrossRef]
- Tsanakas, K.; Gaki-Papanastassiou, K.; Kalogeropoulos, K.; Chalkias, C.; Katsafados, P.; Karymbalis, E. Investigation of flash flood natural causes of Xirolaki Torrent, Northern Greece based on GIS modelling and geomorphological analysis. Nat. Hazards 2016, 84, 1015–1033. [Google Scholar] [CrossRef]
Figure 1.
Study area map.

Figure 2.
Concept of the sub-catchment as a non-linear rectangular reservoir in PCSWMM [36].
Figure 2.
Concept of the sub-catchment as a non-linear rectangular reservoir in PCSWMM [36].

Figure 3.
Methodological flow chart.

Figure 4.
Sub-catchment behavior observed at arbitrary time t0 (a), t1 + Δt (b), t2 + Δt (c), and t3 + Δt (d).
Figure 4.
Sub-catchment behavior observed at arbitrary time t0 (a), t1 + Δt (b), t2 + Δt (c), and t3 + Δt (d).

Figure 5.
Scatterplots for observed and simulated results.

Figure 6.
Observed records and simulated hydrograph.

Figure 7.
Inundation behavior for 0.5/12.7, 1.5/ 38.1, and 2.0/50.8 inch/mm and flood 2015.

Figure 8.
Classified floodplain map for Vidor torrent.

Figure 9.
Floodplain LULC and exposed percentage.


Table 1.
Dataset used for modeling.
| Description | Source/Resolution | Objectives |
|---|---|---|
| GPM-Global Precipitation Measurement | Giovanni/0.25° | Rainfall hyetograph |
| PCSWMM input | ||
| DEM (ALOS-PALSAR, AW3D) | Alaska Satellite Facility/12.5 m | Catchment geodatabase |
| Topography surface for 2D model | ||
| Slope calculation | ||
| Peak events discharge | Punjab Irrigation Department/events discharge in cusecs | Accuracy assessment |
| Land use/land cover | Landsat 8 – Maximum likelihood classification for Vidor Watershed 30 m, and Irrigation Department (piedmont plain) | CN calculation |
| Exposure analysis | ||
| Manning’s (n) for catchment & piedmont plain | ||
| Flood water extent | ||
| Vulnerability analysis | ||
| Soil | Survey of Pakistan, HWSD (Harmonized world soil database) | CN calculation |
| Manning’s (n) |
Table 2.
Calibration parameter.
| Notation | Parameter | Uncertainty (%) | Calibration Interval |
|---|---|---|---|
| Width | Sub-catchment width | 100 | ±15 |
| N perv | Manning’s roughness for pervious area | 25 | 0.02–0.8 |
| Dry Time | Dry time | 50 | 2–10 days |
| CN | Curve number | 100 | ±5 |
Table 3.
Measured and inferred parameters.
| Type | Description | Count/Range |
|---|---|---|
| Measured | No. of Catchments | 88 |
| Stream order | 1–5 | |
| Slope | 3.94–49.02(%) | |
| Catchment area | 167–7752(ac) | |
| Inferred | Manning’s (n) | 0.03–0.09 |
| Dry time | 7(days) | |
| Catchment width | 485.63–404.93(ft) | |
| Adjusted CN | 86.44–94.89 |
Table 4.
Hydrologic modeling results.
| Parameters | 2014 (Calibrated) | 2015 (Validated) | 2016 (Validated) | 2017 (Validated) |
|---|---|---|---|---|
| NSE | 0.967 | 0.972 | 0.754 | 0.90 |
| RE | −0.09 | −0.187 | −0.22 | −0.135 |
| R2 | 0.985 | 0.986 | 0.947 | 0.976 |
| Observed peak (cfs) | 55,258 | 129,101 | 24,767 | 39,254 |
| Simulated peak (cfs) | 56,065.7 | 131,200 | 26,812.85 | 41,527.59 |
| Total rainfall (inch) | 7.4 (2 Peaks) | 12.06 | 4.502 | 5.823 |
| Storm duration (hr) | 11 | 9.5 | 6.0 | 10 |
| Lag time (hr) | 4 | 2.5 | 6 | 5.5 |
Table 5.
Vulnerable LULC for intense flood simulated class.
| LULC | Sub-class | Area (ha) | % Area (ha) |
|---|---|---|---|
| Barren land | 14,040.72 | 48.458 | |
| Settlement | 4540.23 | 15.669 | |
| Natural | Trees | 33.21 | 0.114 |
| Vegetation | 270.63 | 0.934 | |
| Grass | 202.86 | 0.70 | |
| Trees and grass | 470.79 | 1.624 | |
| Orchard | 1349.64 | 4.658 | |
| Orchard (citrus) | 1214.73 | 4.192 | |
| Sugarcane | 46.98 | 0.162 | |
| Triple rice | 16.29 | 0.056 | |
| Permanent or seasonal water | 329.31 | 1.136 | |
| Wheat | Single wheat | 3159.63 | 10.904 |
| Wheat and cotton | 463.14 | 1.598 | |
| Wheat and maize | 2666.61 | 9.203 | |
| Wheat and rice | 169.74 | 0.585 | |
© 2019 by the authors. Licensee MDPI, Basel, Switzerland. This article is an open access article distributed under the terms and conditions of the Creative Commons Attribution (CC BY) license (http://creativecommons.org/licenses/by/4.0/).
Share and Cite
MDPI and ACS Style
Munir, B.A.; Ahmad, S.R.; Hafeez, S. Integrated Hazard Modeling for Simulating Torrential Stream Response to Flash Flood Events. ISPRS Int. J. Geo-Inf. 2020, 9, 1. https://0-doi-org.brum.beds.ac.uk/10.3390/ijgi9010001
AMA Style
Munir BA, Ahmad SR, Hafeez S. Integrated Hazard Modeling for Simulating Torrential Stream Response to Flash Flood Events. ISPRS International Journal of Geo-Information. 2020; 9(1):1. https://0-doi-org.brum.beds.ac.uk/10.3390/ijgi9010001
Chicago/Turabian StyleMunir, Bilal Ahmad, Sajid Rashid Ahmad, and Sidrah Hafeez. 2020. "Integrated Hazard Modeling for Simulating Torrential Stream Response to Flash Flood Events" ISPRS International Journal of Geo-Information 9, no. 1: 1. https://0-doi-org.brum.beds.ac.uk/10.3390/ijgi9010001
Note that from the first issue of 2016, this journal uses article numbers instead of page numbers. See further details here.