1. Introduction
Network analysis refers to the tools applied on network-based data towards the discovery of useful knowledge. The research area of network analysis enjoys widespread use, mainly because there are numerous and significant diverse applications that require the manipulation and analysis of network-based data, such as social network analysis, searching and mining the Web, pattern mining in bioinformatics and neuroscience.
In this paper, we use information collected from CDRs to generate a network, representing the communication traffic between different parts of the mobile network. This network is represented by a graph , where V is the set of nodes (vertices) and E is the set of edges (links).
There is a wide spectrum of network science applications in diverse fields. For smart city policy making and urban planning, it is essential to know how people move around and how they use urban spaces. Mobile phone data can be of great value for urban policy making as they contain valuable information about users’ mobility and activity. The spatial semantics of the location are determined by their land use, but even so, people are using urban spaces in many different ways. The activity detected through mobile phone data is changing over different day types but also over different day times [
1].
Urban spaces are also affected by daily base migrations of people who are commuting to work which is reflected in telecom traffic. Telecom Radio Base Stations are forming a latent network over urban area consisted of links created by users’ connectivity. A network, mathematically speaking could be represented as a graph structure and powerful Graph Theory methods can be applied. We can track the dynamics and changes in the network by analyzing local and global properties of the graph that represent the network.
Despite the unprecedented value of user generated networks that reflects human dynamics many obstacles are present when analyzing such data. User generated networks could be made of telecom connectivity data, location-based social media data, GPS data from devices, etc. Those networks are highly dynamic and very complex while at the same time they demand efficient analytics that could deliver the result as fast as possible. To address this issue, high-performance computing frameworks must be incorporated in analytical pipelines. To be able to exploit the value of user generated data, we must know the specific context of the location or the event. The importance of the place in urban zones is determined by its land use. Densely built up urban zones with many diverse amenities are likely to form different telecom traffic footprint than sparsely populated industrial zones. Knowing the importance of the place defined by land use and human interactions formed around the place, we could strengthen transport and telecom infrastructure where needed, plan events better, enhance services, etc. By knowing the correlation between land use and human dynamics, we could predict the impact of land use change to people’s lives.
Contributions. This work investigates the potential of using innovative data sources, such as telecom CDR data together with land use data, to evaluate and analyze human dynamics. Human Dynamics is a very wide research area that often requires a multidisciplinary approach. Mobile phone data analysis is one way to perceive Human Dynamics that can be reflected through telecom activity, connectivity and users’ mobility. In this work, we explore the aspect of Human Dynamics reflected through mobile communication network in the form of connectivity links. The interplay between Human Dynamics and Network Science has been demonstrated before in [
2]. Our work is based on the rationale that if centrality measures can be predicted by using land use properties, then what-if scenarios can be applied in order to detect the factors that affect human connectivity dynamics through mobile networks. More specifically, the contributions of our work are summarized briefly as follows:
Shaw et al. pointed out several challenges in handling big and mobile human dynamics data in a hybrid physical–virtual environment where activities and interactions occurring in virtual space are not independent from activities and interactions in physical geographical space [
3]. One example of such physical–virtual cohesion of the events is experimental study conducted by Graells-Garrido et al., where the authors evaluated the impact of the Pokemon Go game to the change of people’s movement and mobility patterns in physical geographical space [
4]. In this work, we are determining the correlation between physical geographical space characterized by land use and human dynamics virtual space created by users telecom interactions.
Based on CDR data and communication traffic between different areas, a weighted network is constructed to represent the linkage between different city areas. Community detection is applied in this network in a daily basis, in order to detect community evolution across time. Communities are clusters in the network where high inner connectivity is present. The evolution of clusters through time is triggered by users’ dynamics and their activity variations in space and time.
We further analyze the dynamics of community structure by calculating spatial as well as structural (i.e., network-based) properties of communities. It turns out that land-use information is strongly related to spatial and structural properties of communities, as it is shown by a thorough performance evaluation.
Earlier studies indicate that there is great potential in using mobile phone activity data to predict land use [
5,
6]. Mobile phone data could be used as proxy for human dynamics, to the best of our knowledge there is no prior work on how to predict human connectivity dynamics reflected through telecom data based on land use. Such results are valuable for urban planning that becomes more challenging as urban population grows with expectation that two thirds of the world population will be living in the cities by 2050. Changes in land use across cities and further expansions should be accompanied with assessment of changes in human connectivity.
Our methodology involves the use of Big Data Analytics platforms. More specifically, the most computationally intensive parts of the pipeline are implemented in the Apache Spark engine. Therefore, our technique is scalable as it can handle potentially large amounts of data.
Roadmap. The rest of the paper is organized as follows.
Section 2 presents related work in the area. Fundamental concepts and definitions are given in
Section 3, whereas the proposed methodology is detailed in
Section 4. System architecture is presented in
Section 5. Experimental results are presented in
Section 6 and finally
Section 7 concludes our work and presents briefly interesting future research directions.
2. Related Work
With an increasing number of devices and services that collect data about people activity, interactions and mobility in the last few years, human dynamics research became the key topic in computational social science [
7]. Human dynamics research evolves with changing every day circumstances in which people live such as natural and urban environment, emerging new technologies, climate change and society. High presence of modern information and communication (ICT) technologies including location-aware devices, various sensors and mobile technology in every day life have great impact on shaping human activity and interaction patterns [
8].
One of the richest data sources about human daily based activities is mobile phone data [
9]. Many diverse applications with significant social impact are developed based on mobile phone data, such as urban sensing and planning [
10,
11], traffic engineering [
12,
13,
14], predicting energy consumption [
15], disaster management [
16,
17,
18], epidemiology [
19,
20,
21], deriving socio-economical indicators [
22,
23].
More specifically, Ratti et al. in their review [
24] highlighted the potential of using mobile phone data for urban planning. Soto et al. [
25] used
Call Detail Records to extract the information to automatically identify land use behaviors in urban environments. They used fuzzy c-means to cluster the Radio Base Station signatures and detect the class representatives of the land use in urban environment. Grauwin et al. used mobile phone data to detect land use classes in three different cities, New York, London and Hong Kong [
26]. Furno et al. conducted comparative analysis between ten different cities, in which they constructed specific mobile traffic signatures to determine dynamic patterns of human presence in urban areas [
27]. Rios and Muñoz used a big mobile phone data set with 880 million records in a case study for Santiago, Chile for land use pattern detection. They used the latent variable clustering technique in detecting clusters of residential, office area, leisure-commerce and rush hour pattern areas [
28]. Pei et al. used hourly relative pattern and the total call volume trough semi supervised fuzzy c-means clustering approach in inferring land use types in Singapore, showing that the accuracy decreased with the increase in heterogeneity of land use and density of cell phone towers [
6]. Furno et al. combined simultaneously Call Detail Records and vehicle GPS traces for revealing land use context in French and Italian cities [
29].
Unveiling complex ties between land use and human dynamics properties derived from mobile phone data is an active area of research. The latest results demonstrate relations between dominant land use for each Voronoi zone and corresponding human activity represented as aggregated CDRs [
30], as well as land-use composition of city’s neighborhoods and the time series of CDR intensities [
31]. Both studies utilized clustering to group similar land uses on one side and human dynamics properties on the other side and finally estimated agreement between clustering results obtained from this two data sources. Another novel study quantified by regression models how urban land use influences the commuting flows [
32].
Noyman et al. conducted the study that suggests a methodology of “reversed urbanism” to urban planning and decision making. The methodology considers human behaviour patterns extracted from mobile phone data as a key element of urban design and their association with the functionality of urban areas [
33]. One recent study conducted by Cottineau et al. showed the relation of mobile phone data indicators such as number of calls, active days, duration of calls, entropy, etc. and socioeconomic organization of cities [
34]. They showed how mobile phone data together with census and administrative data could be used for urban development.
User-generated mobile phone data are highly dynamic and usually very large in size. Analytical pipelines over such data sets could be computationally expensive, while at the same time delivery of the results needs to be efficient since many applications require almost real-time response. Brdar et al. [
35] provided a broad overview of the entire workflow starting from raw data access, followed by demands for analytical performance and data fusion, to the final application. They pointed out the critical challenges in mobile phone data analysis that need to be addressed, in order to disclose the hidden potential of the data. To make large scale telecom data analytics more efficient the work in [
36] suggested using the Apache Spark [
37] platform for distributed data analytics.
Our methodology differs from previous work in many aspects. First of all, to analyze the mobile network we are combining graph mining techniques [
38,
39] such as community detection and centrality measures. Next, we provide a mechanism in order to be able to predict spatial as well as network-based properties from land-use data. Last but not least, and following our previous work in [
36], we have implemented the most demanding tasks inside the Apache Spark engine.
6. Results
In this section, we present some representative experimental results of our study.
The Telecommunication Radio Base Station (RBS) network consists of carefully designed and spatially distributed equipment used to provide the signal and to transfer telecom traffic. Each RBS is characterized with defined signal coverage, and in urban areas signal coverage is ubiquitous. In telecommunications, signal coverage is often determined with Voronoi polygons with antenna in the polygon center. In our connectivity network, telecom traffic is aggregated and distributed from one RBS to another. The connectivity network is modelled as graph, where base stations represent nodes and weighted links represent edges in the graph. We further applied graph filtering to keep only significant edges, and community detection to obtain community structure over inspected area.
For graph filtering, we applied the
Disparity filter, which is a method for statistical filtering of weighted networks [
46]. To select the appropriate
value, we compared the results of community detection for the same graph when different filtering levels are applied. The results are presented in
Table 1. From this table we observe a significant drop in the number of edges when filtering is applied, which is expected when using the Disparity filter. The number of detected communities remains stable when filtering with
is applied, while with smaller
values a higher number of communities is observed. To evaluate how similar are the results when different filtering levels are applied, we computed the
Adjusted Random Index (ARI) which is a common measure for evaluating similarity between clusters [
53]. Higher values of ARI indicate more similar clusters. We considered the results of community detection performed over the unfiltered graph as the
ground truth. The ARI between the clustering of the ground truth graph and the graph filtered with
is 0.83 which indicates very high similarity. When filtering is applied with
threshold, ARI drops slightly to 0.81 which also indicates a high similarity between clustering, while the number of detected communities increases 20% which is significant compared to the increase in communities when filtering with
is applied. With more strict filtering, when the
threshold is set to 0.001, ARI drops to 0.71 and the number of detected communities increases for 38% compared to the ground truth. The aim of graph filtering before running community detection is to eliminate a large number of weak edges, in order to make the graph structure less dense and therefore to increase performance, while preserving network properties. Filtering with
threshold showed the best results, eliminating a significant number of edges, while the high value of ARI and the change in number of detected communities of only 4% indicate a very high similarity between clustering.
We performed community detection over graphs filtered with using Louvain algorithm to obtain snapshots of daily based community structure. Louvain algorithm starts with assigning each node to its own community and proceeds with moving nodes across communities to maximize the modularity function. Although the initial assignment of nodes might depend on data partitioning and sorting, Louvain algorithm showed very stable results between different iterations for the same graph. We run Louvain algorithm for community detection 10 times for each day and calculated ARI between different iterations. ARI between different iterations for the same input graph is always 1.0 indicating that the algorithm is very stable. The change in community structure between days is caused by change in input graph structure which reflect the dynamics of human connectivity. To evaluate the change in community structure between sequential days we calculated average ARI, which is 0.73.
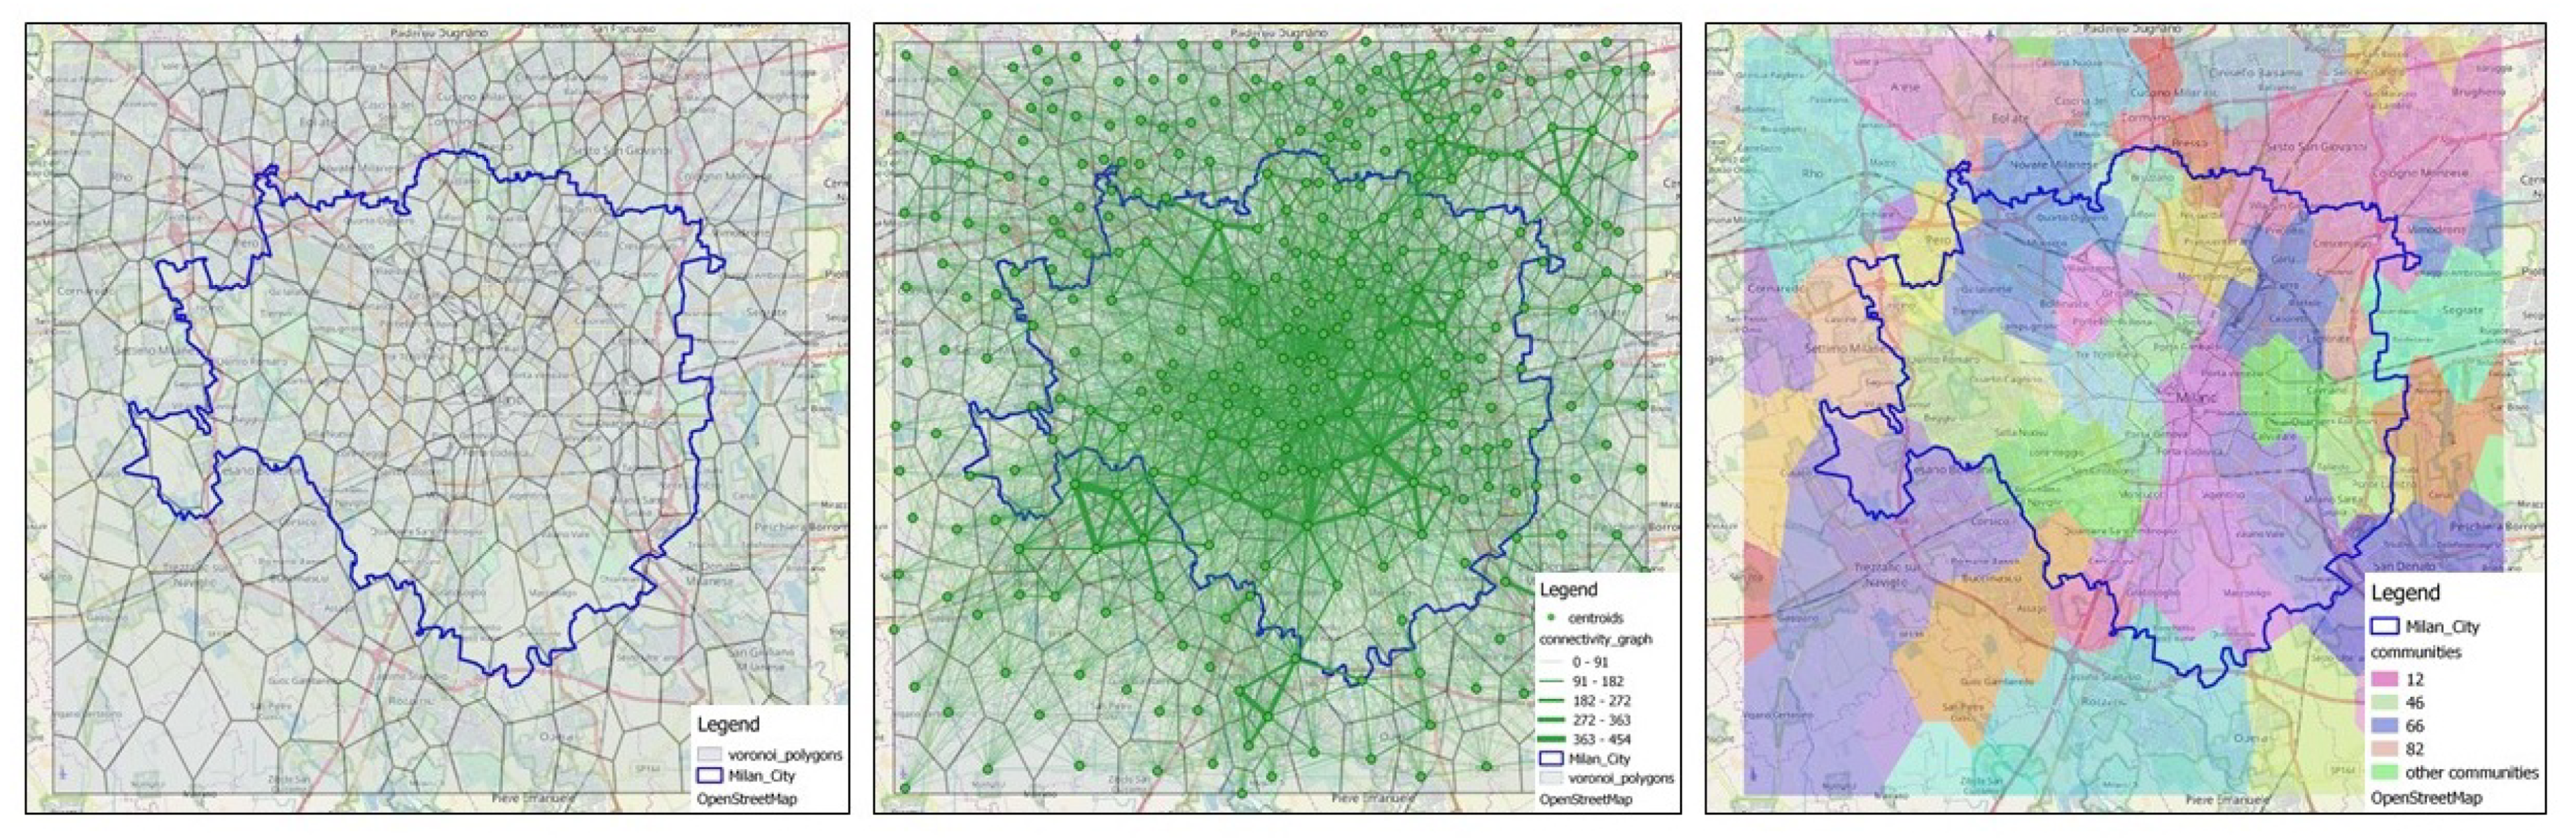
The path from RBS coverage area network to communities detected based on connectivity network graphs is presented in
Figure 7. On the first map, far left in
Figure 7, the network coverage consisting of Voronoi polygons over the inspected area of Milan city with the surroundings is presented. On the middle map in
Figure 7, the overlaid connectivity graph which is the input for community detection is presented. On the last map from
Figure 7, the result of community detection for the input graph is presented.
The next step in our processing pipeline is to deeper investigate the time and space evolution of community structure. First we extracted communities from Hive database layer to common
csv files and we visually examined the spatial distribution of communities using QGIS software. By visual inspection we noticed that although the form and number of communities differ between days some patterns are repeating. The granularity, size and spatial distribution of communities formed in densely populated, built up areas differ much compared to those of communities formed in peripheral parts of urban zone. High dynamics of community structure formed over urban core of the city can be explained by high dynamics of connectivity network over same area, reflected in input graph. The presence of high dynamics in community structure over urban core of the city can be explained by high dynamics of input graph over same area. In our previous work [
1], we observed that core of the connectivity network, where the strongest links occur, is located over urban core of the city. Communities formed in the urban core of the city tend to be small in size and dynamically distributed in space between days, while communities formed in less urbanized peripheral zones tend to form large, more stable structures. To quantify the observed phenomena, we introduce spatial
community properties described in
Section 4.
In our previous work [
1], we detected the social event presence through analysing local and global graph properties of telecom connectivity networks. Those findings motivated us to compute the graph properties described in
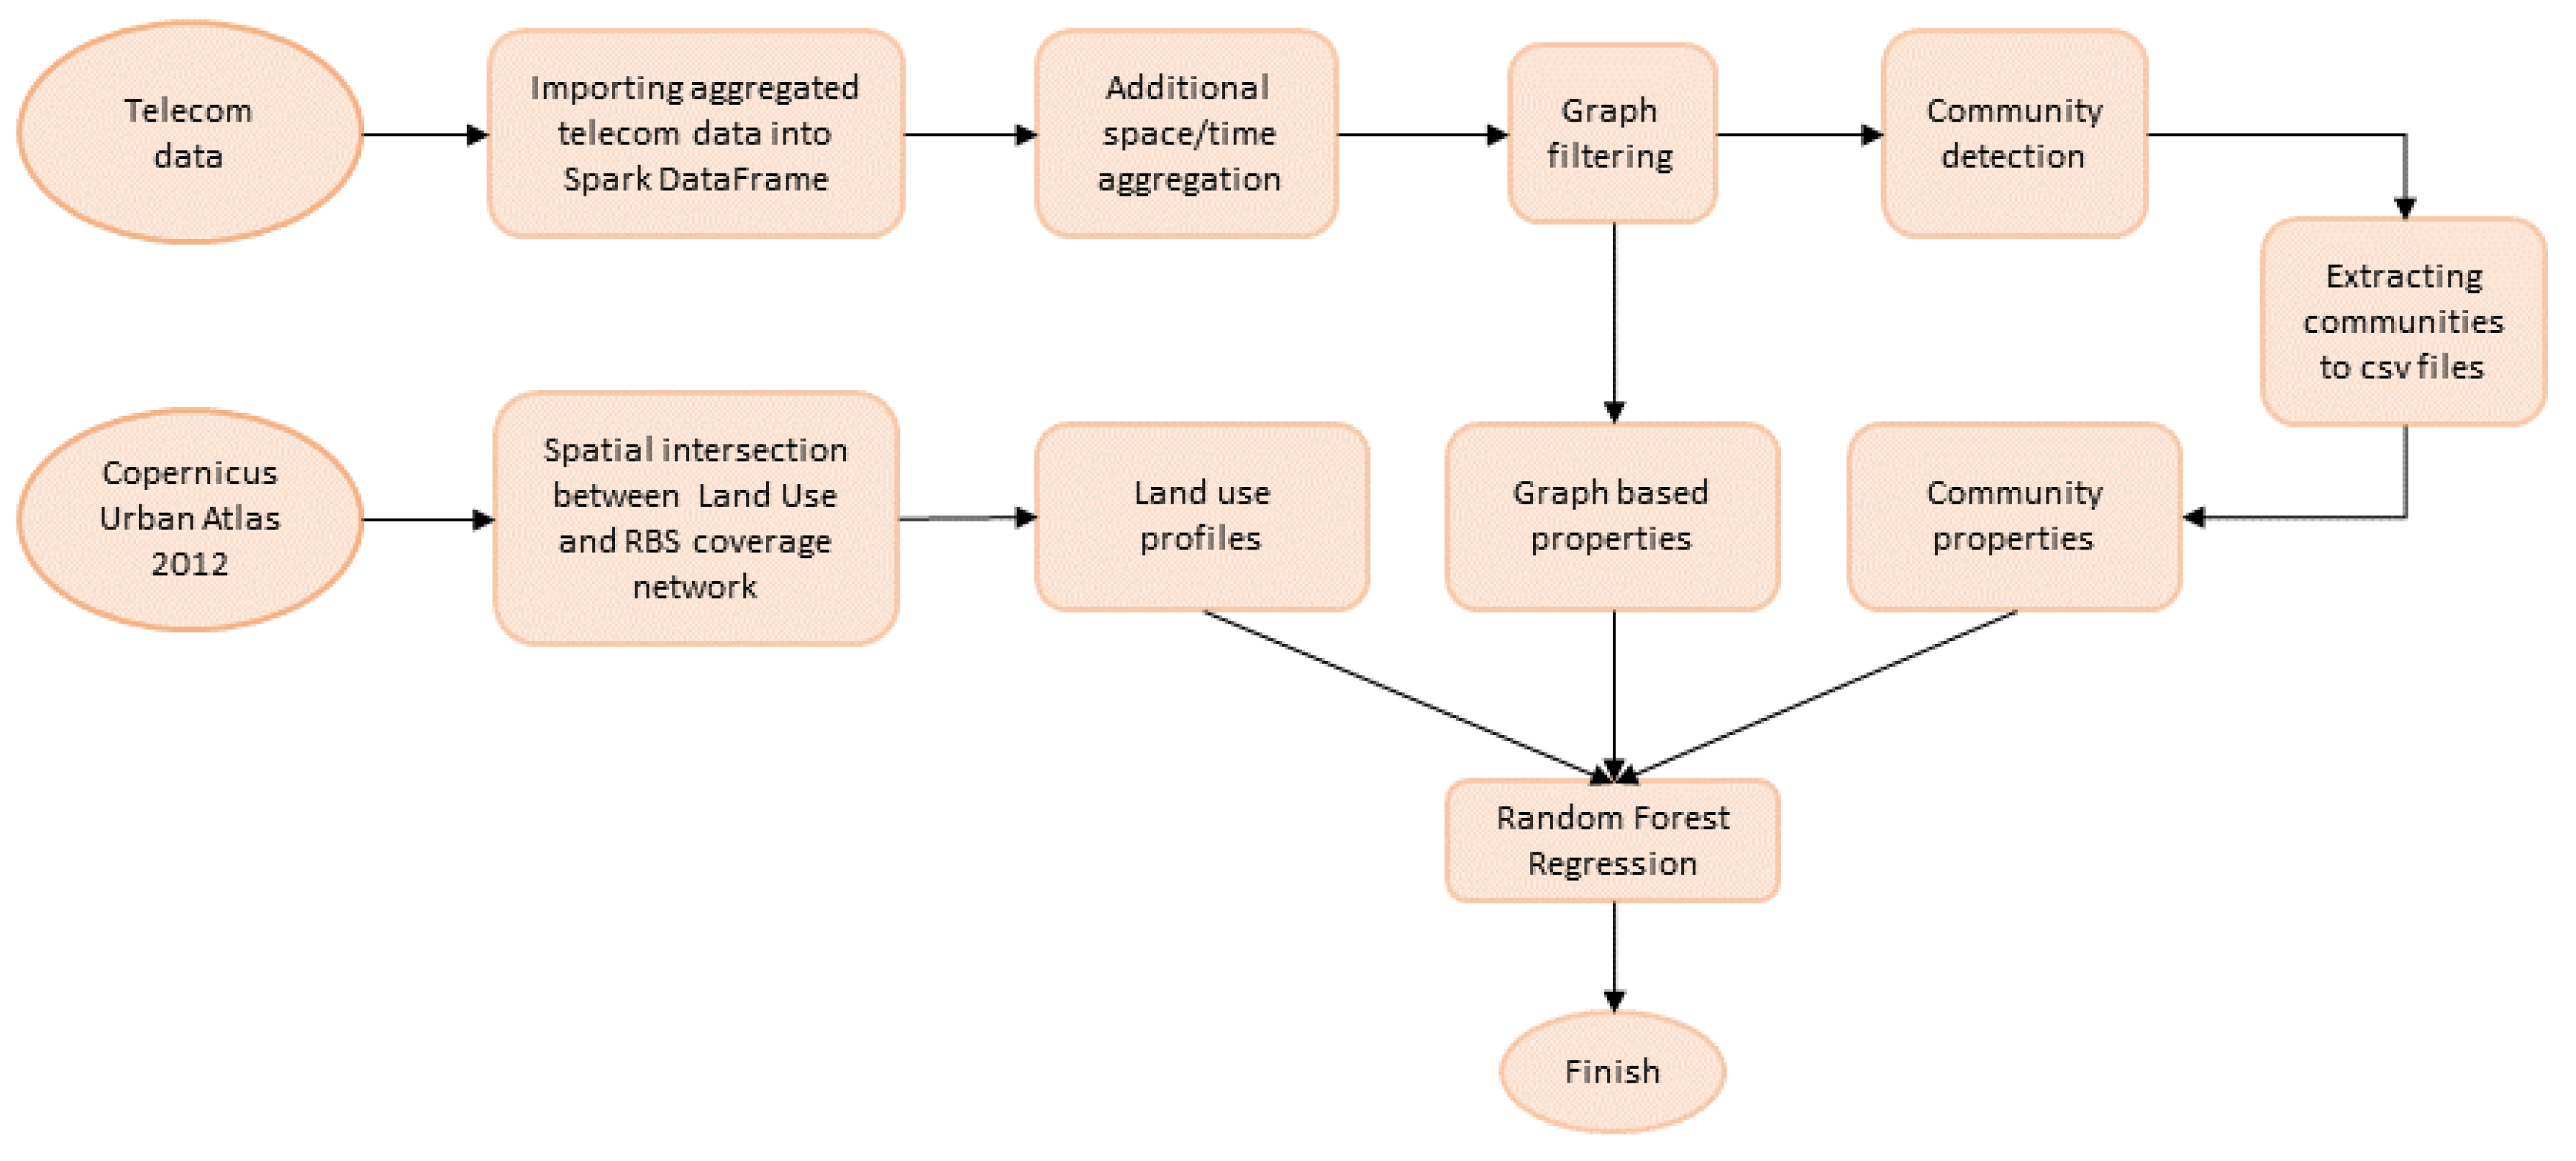
Section 4, to evaluate their correlation with land use and communities. To calculate community and graph properties, we used Python and its rich portfolio of libraries such as Pandas, NetworkX, NumPy, SciPy, Matplotlib, GeoPy, GeoPandas, etc. To evaluate the predictiveness of graph and community properties which contain latent footprint of human dynamics, based on land use we applied regression. Regression is applied sequentially over graph and community properties.
The results of regression are presented for the graph properties in
Table 2 and for spatial community properties in
Table 3. For all properties, Random Forest regression showed better results than Ridge regression. From
Table 2, we observe that the predicted values of the property avgCN, i.e.,
average core number show the best correlation with real values, followed by property avgWND, i.e.,
average weighted node degree which is expected since both measures are considering weights over nodes edges which is important structural property of the network. This result is significant since it emphasize that the variability in core number and weighted node degree can be explained by the variability in the land use. Another property that shows strong correlation between predicted and real values considering Spearman coefficient is avgPR, i.e.,
average PageRank, while the other metrics, Pearson and R2, indicate a weaker correlation. The property that is the least associated with land use is avgBC, i.e.,
average betweenness centrality. From
Table 3 we observe that the predicted values of the spatial community property avgCA, i.e.,
average coverage area show the best correlation with real values. Predicted values of spatial community property avgIA, i.e.,
average intersection area show fair correlation with real values considering Spearman coefficient, but show less correlation considering Pearson and R2 metric. Community properties that seem the least associated to land use are st.dev IA, i.e.,
standard deviation intersection area and avgDiam, i.e.,
average diameter. Overall Spearman correlation test shows the best results for all properties except for avgCN, avgDiam and st.dev IA Ridge regression where the Pearson correlation was higher. Spearman correlation test is expected to show robust results in the most of the cases since it does not carry any assumptions about the distribution of the data. All correlation results are significant at 0.01 (all
p-values < 0.006).
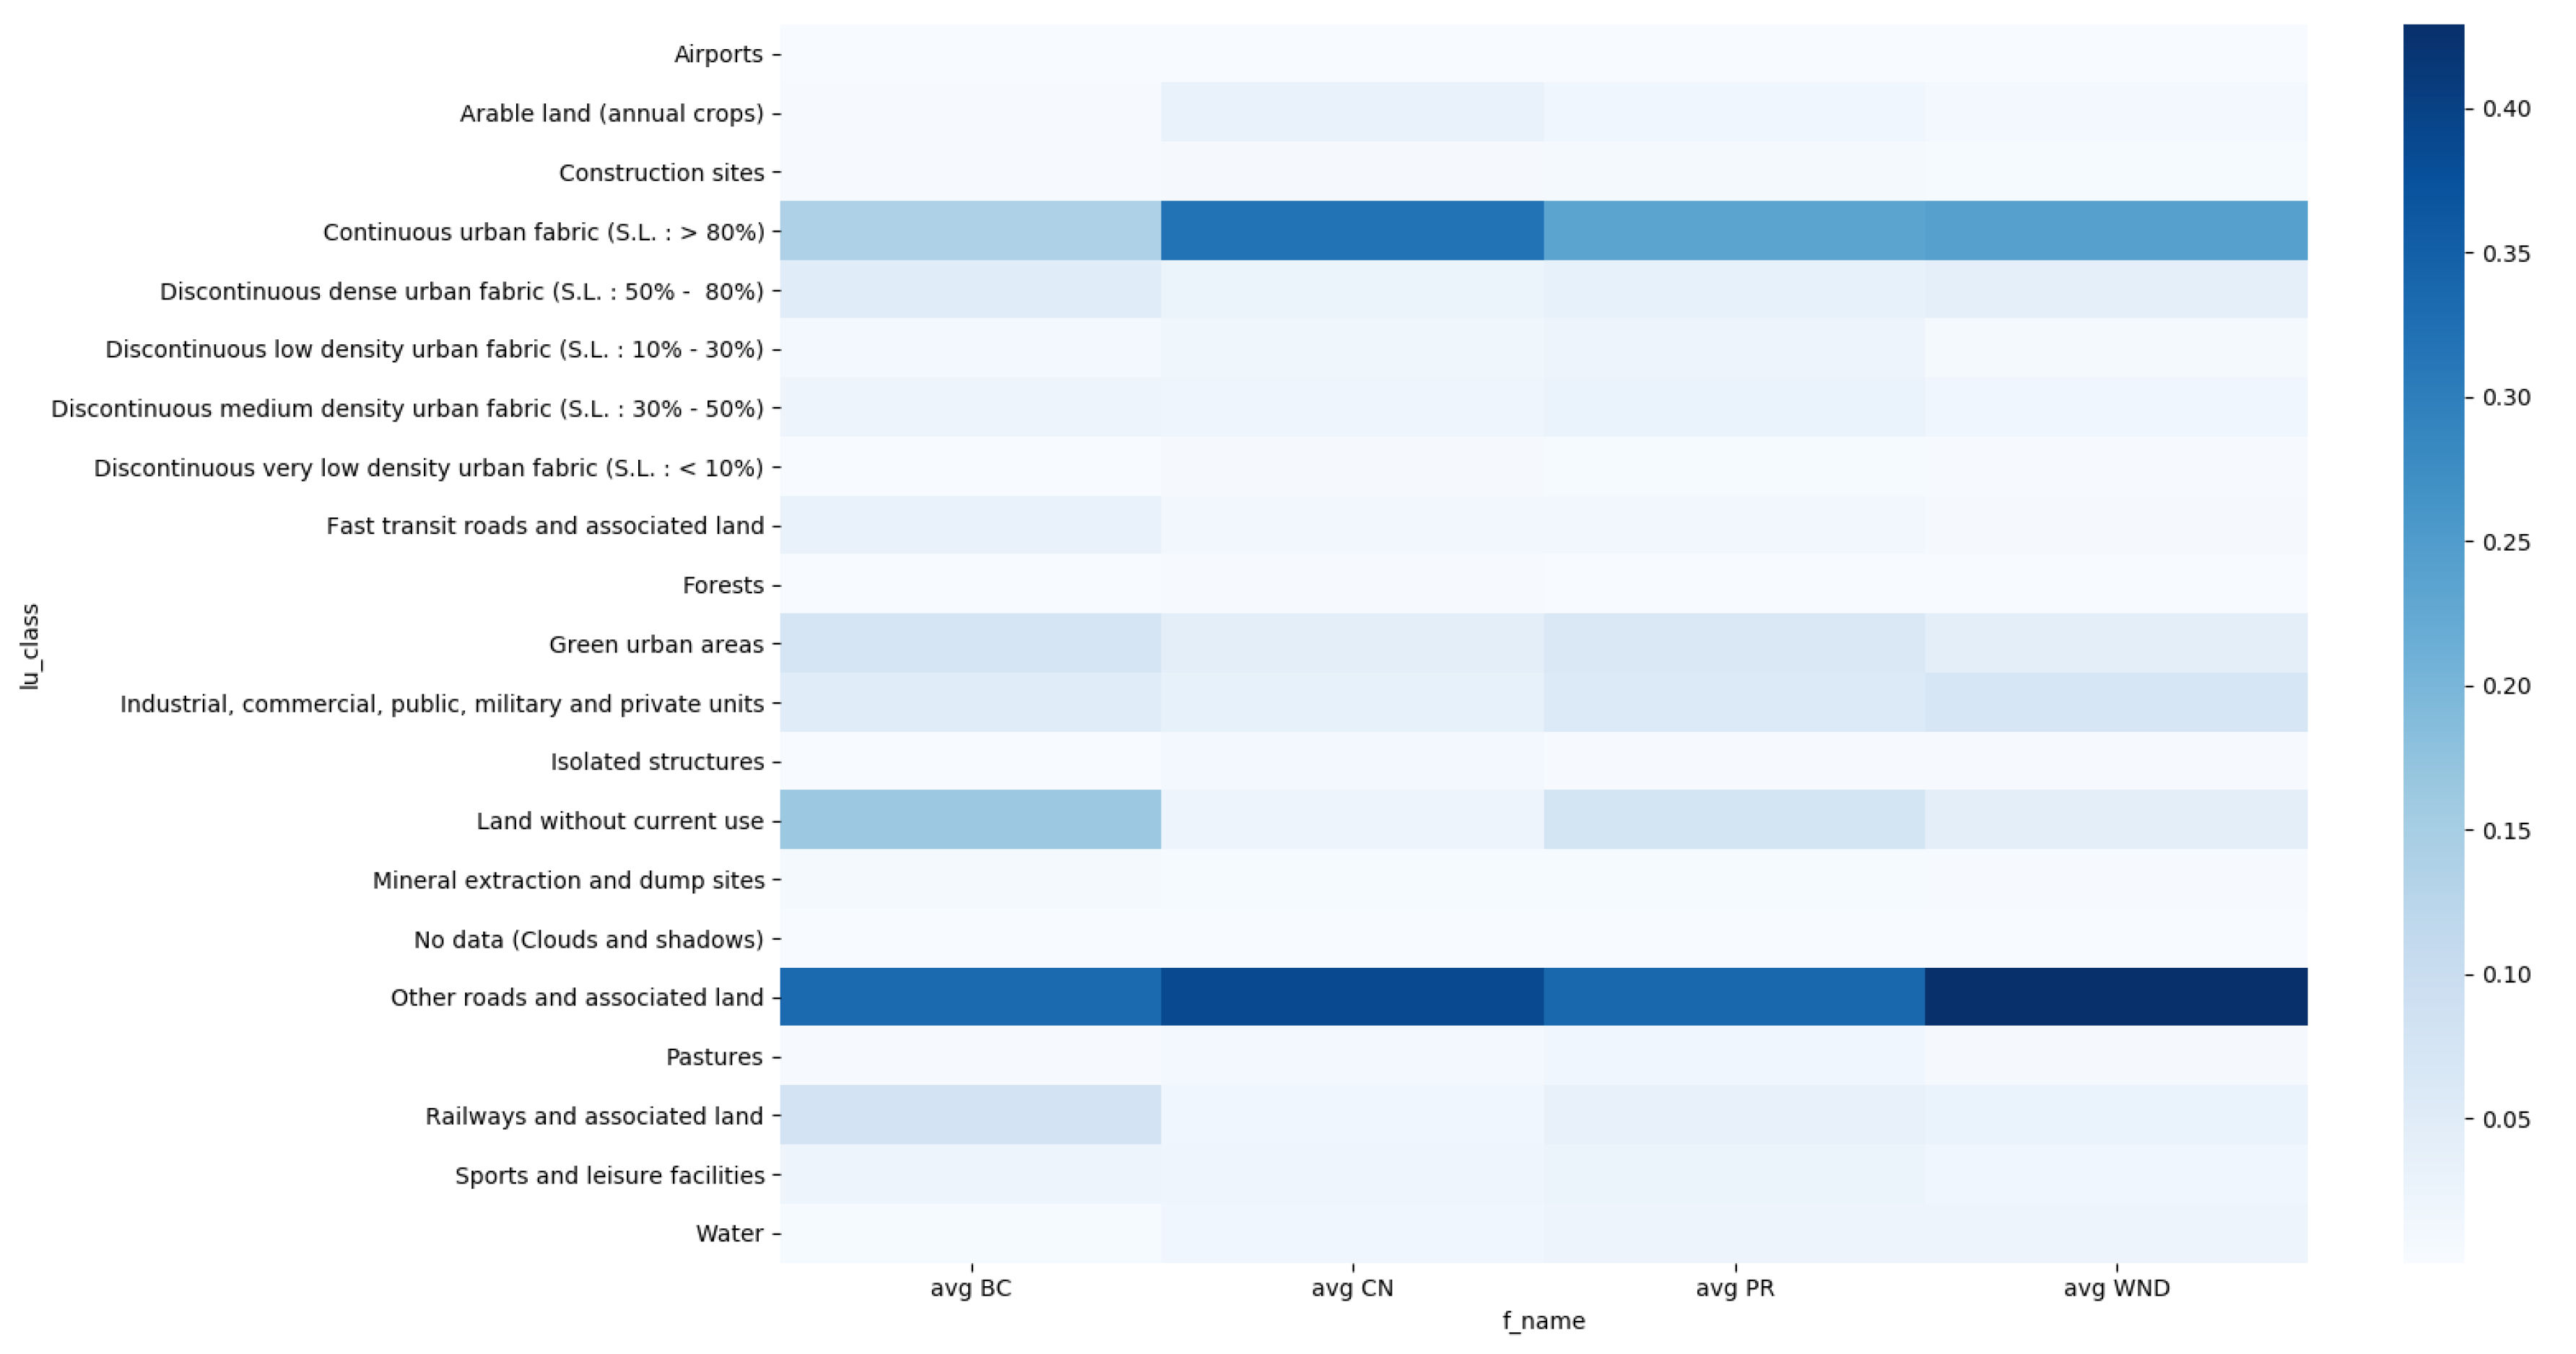
To explore how each specific land use class is important for prediction, we calucalated feature importances. The importance of land use classes for predicting each graph based and community property is presented in heatmaps in
Figure 8 and
Figure 9.
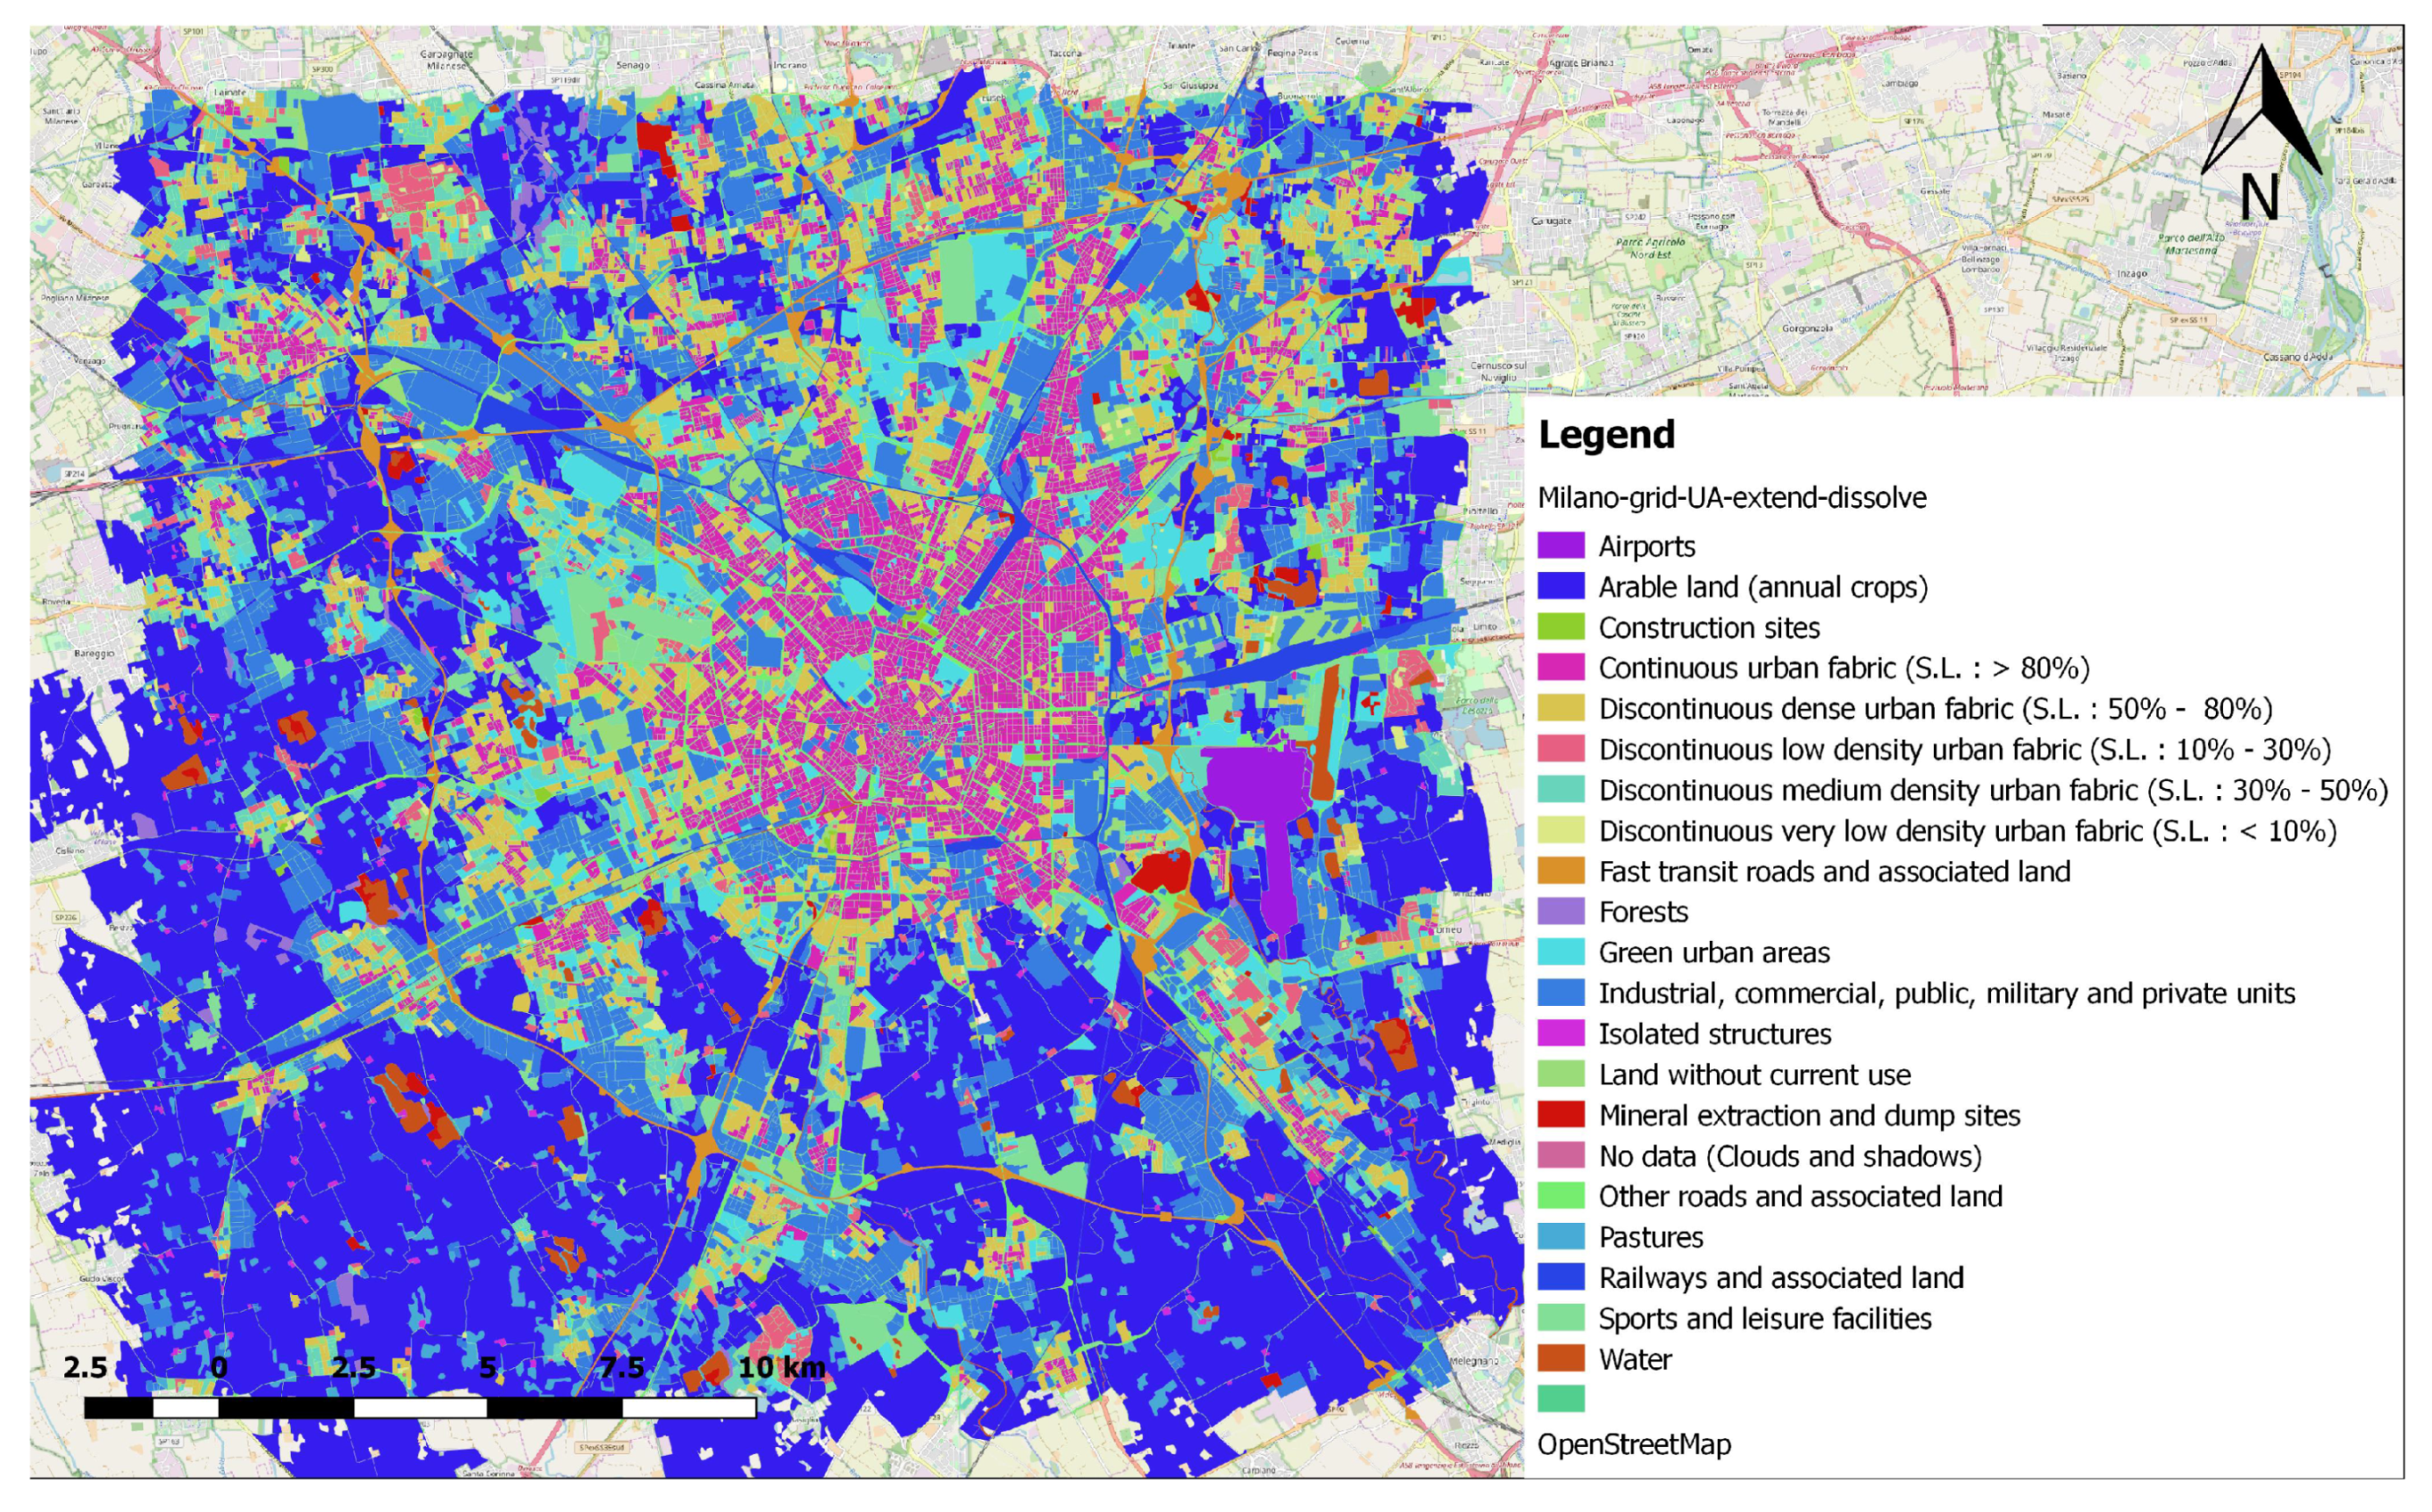
For predicting the graph based properties based on land use, the most important classes are
Other roads and associated land, Continuous urban fabric (S.L.: > 80%), as shown in
Figure 8. The highest predictive power has land use class
Other roads and associate land for the property
average weighted node degree (avgWND). For predicting the property
average core number (avgCN) the most important land use classes are
Other roads and associated land and
Continuous urban fabric (S.L.: > 80%), which also have the highest impact on predicting the property
average PageRank (avgPR). Land use has the least predictive power for the property
average betweenness centrality, which is shown in
Table 2 with small values of correlation metrices. From the heatmap in
Figure 8 we can notice that only land use class
Other roads and associated land has impact on predicting the property
average betweenness centrality, but due to small values of correlation metrices we can conclude that impact is not significant.
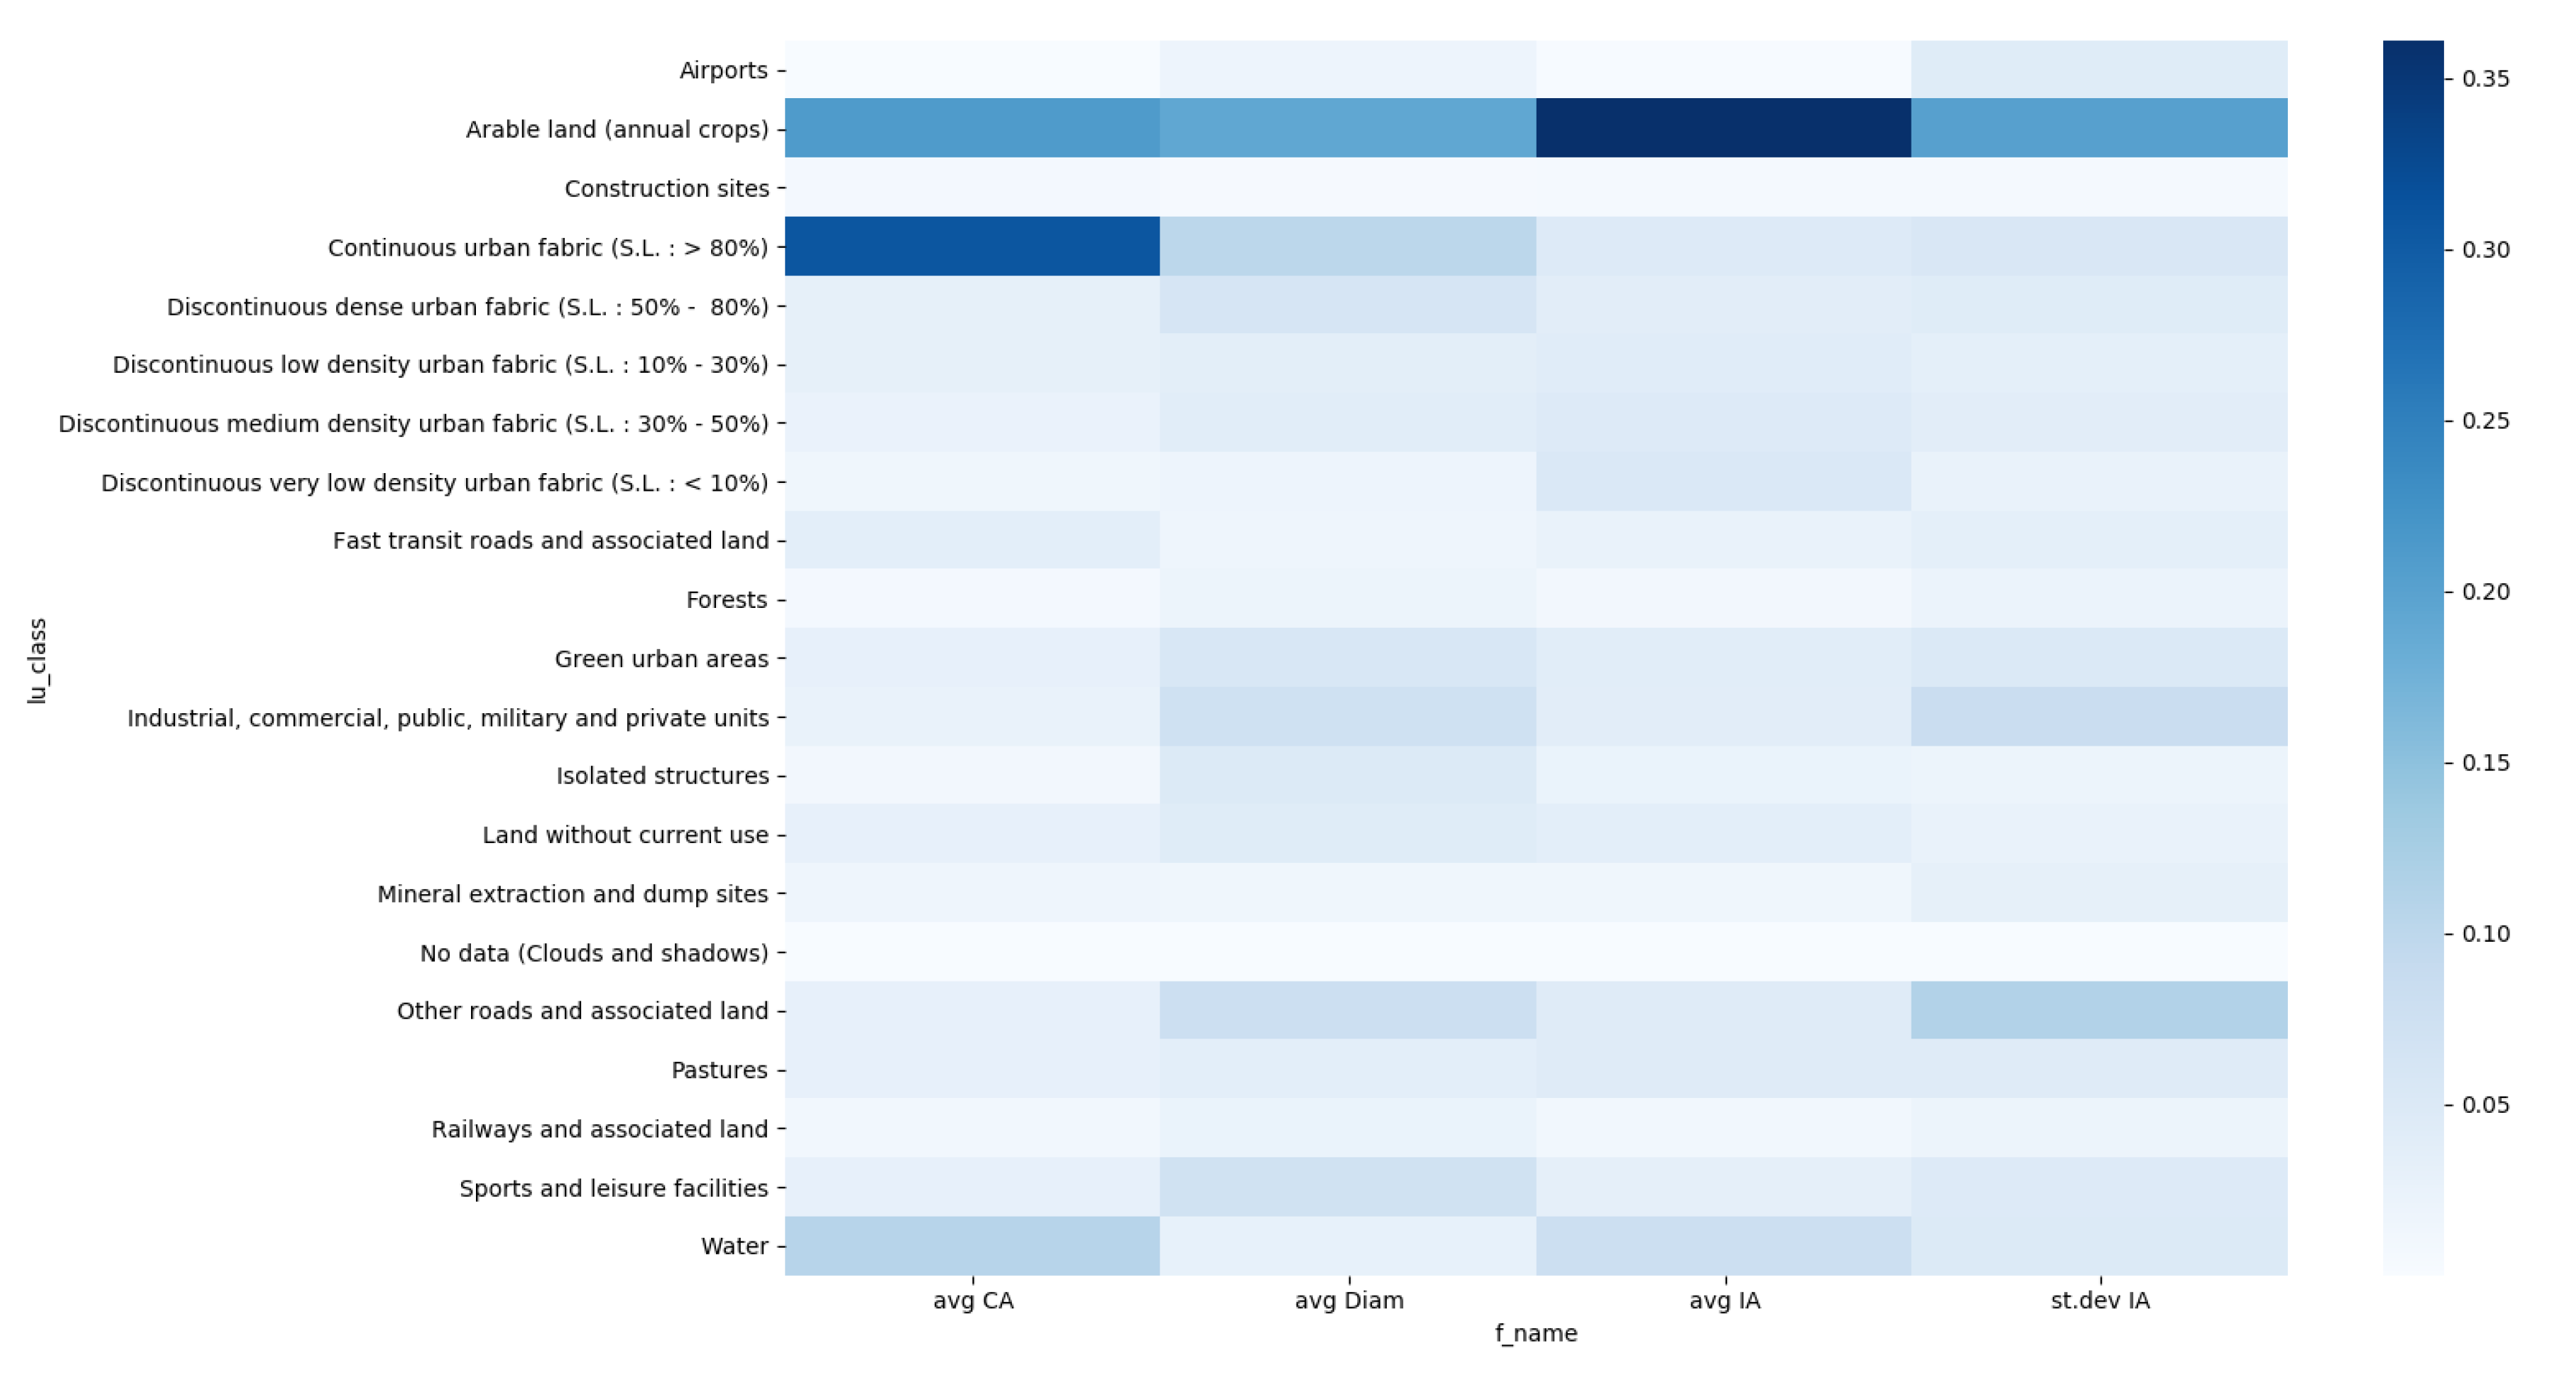
For predicting the community properties based on land use, the most important classes are
Arable land, Continuous urban fabric (S.L.: > 80%), as shown in
Figure 9. Land use class
Arable land has the most impact on predicting the community property
average intersection area (avg IA), which can be observed from the heatmap in
Figure 9. The most predictive community property based on land use is
average coverage area (avg CA), where the most impact have land use classes
Continuous urban fabric (S.L.: > 80%) and
Arable land. From the heatmap in
Figure 9 we can notice that only land use class
Arable land has the impact on predicting the community properties
average diameter (avg Diam) and
standard deviation intersection area (st.dev IA), but from the
Table 3 we can observe small values of correlation metrices which indicate that the impact is not significant.
We investigated deeper the urban profiles to detect polygons from network coverage area where the classes of high importance for predicting properties are dominant in area.
In
Figure 10 is presented network coverage polygon where the dominant land use class is
Other roads and associated land together with its graph and community spatial properties and its geographical position in the network.
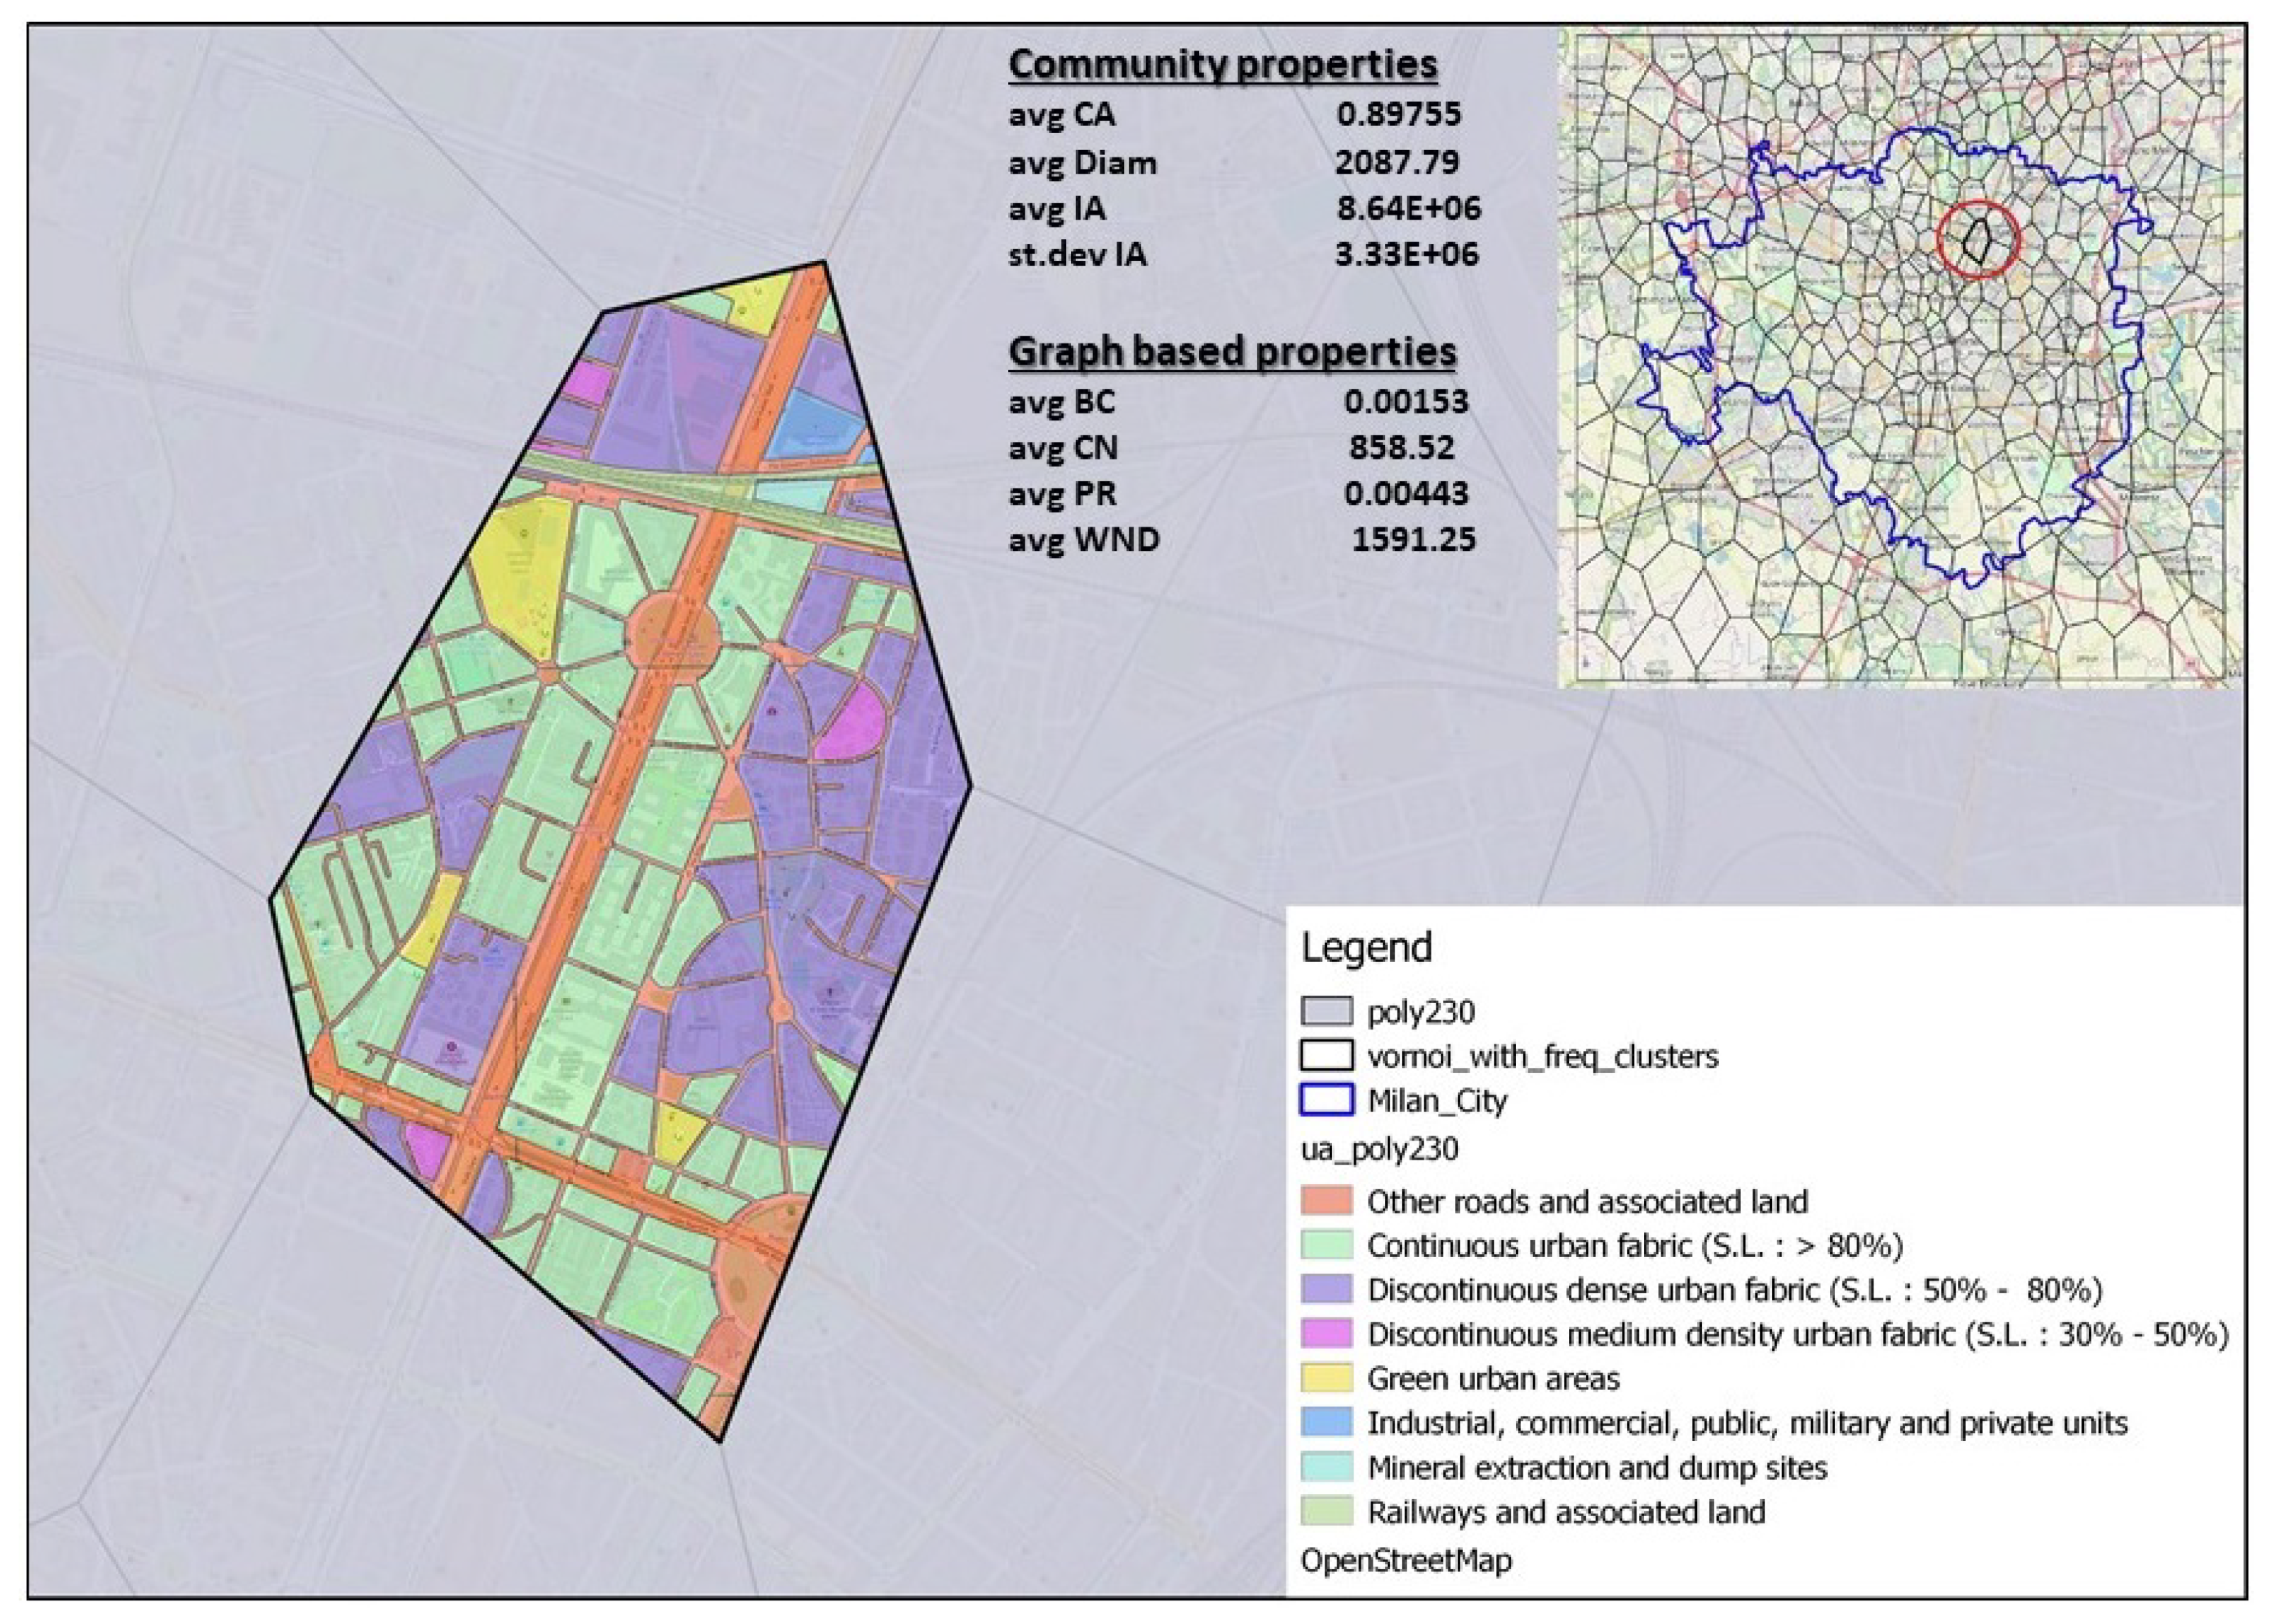
In
Figure 11 is presented network coverage polygon where the dominant land use class is
Continuous urban fabric (S.L.: > 80%) together with its graph and community spatial properties and its geographical position in the network.
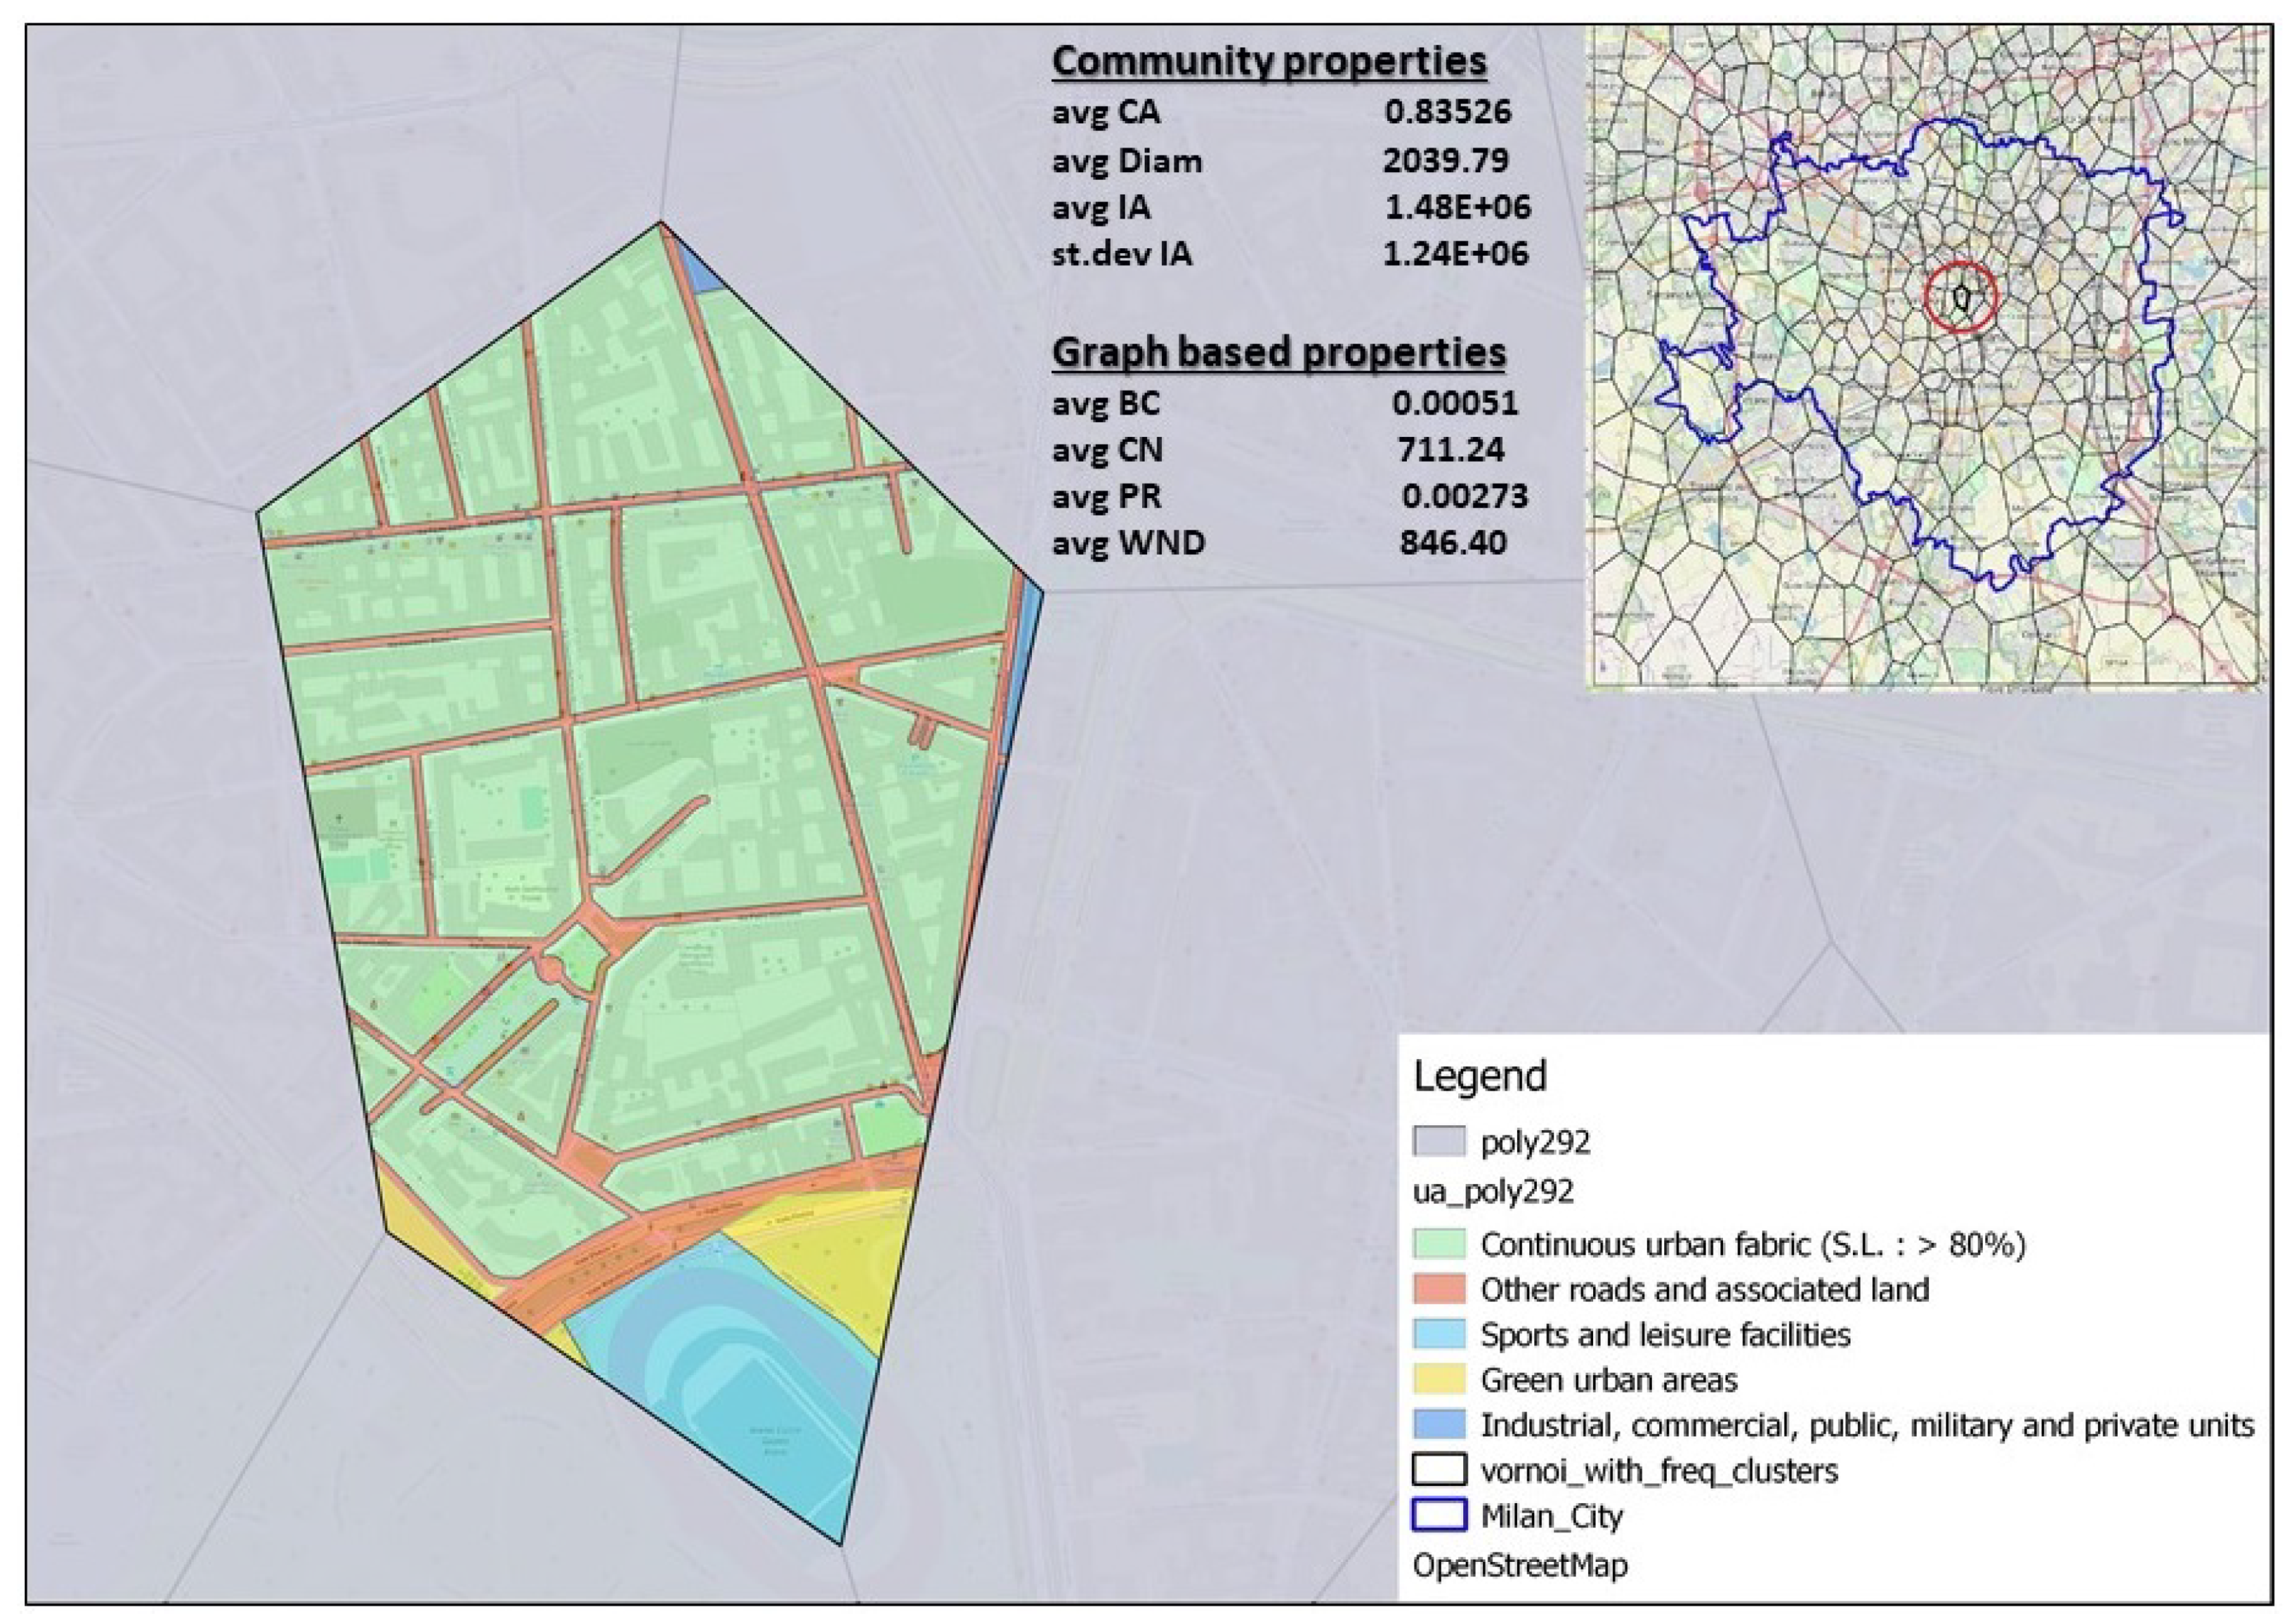
In
Figure 12 is presented network coverage polygon where the dominant land use class is
Arable land together with its graph and community spatial properties and its geographical position in the network.
By observing those three special cases presented in
Figure 10,
Figure 11 and
Figure 12 with specific dominant land use class we can notice some trends related to spatial community and graph properties. Polygon in the highly urban area where the dominant class is
Continuous urban fabric (S.L.: > 80%) is characterized with lower
mean intersection area than polygons where the most dominant classes are
Other roads and associated land and
Arable land. This property indicates that the observed polygon forms highly dynamic communities, which are distributed in space in diverse manner and therefore the spatial intersection between communities is small. On contrary, high value of
mean intersection area indicates the presence of more stable community structure that is not prone to dynamical change. The property
st.dev. intersection area shows similar behaviour and indicates the same characteristics. Community properties
average coverage area and
diameter indicates the maximal spatial reach of all communities formed including observed polygon. High value of
average coverage area indicates that formed communities are large in size, covering significant spatial area. This behaviour can occur due to initial size and/or granularity of Voronoi polygons contained in the communities, where we can have fewer very large polygons in the community or many smaller ones. Larger
average coverage area of the community indicates wider reach of information spread inside community. High value of
diameter indicate larger and wider reach of the communities, but only as a linear measure and therefore shows not significant correlation with land use which is area feature.
Graph properties of polygons show diverse behaviour depending on the dominant land use class. The property average betweenness centrality gains the highest value for polygons with dominant land use class Arable land. This can be explained with the geographical position of the polygon in the network and network dynamics. Polygons that are located far from urban core of the city may act as bridges between distinct parts of the network and therefore gain higher value of betweenness centrality. Also, if the network around specific polygon is changing fast day by day, it is more likely that the observed polygon will have less impact to network connectivity between days. The property average PageRank has the highest value for the polygon where the dominant land use class is Other roads and associated land. It is interesting to notice how physical transitivity of a node, i.e., polygon in the network characterized by land use class Other roads and associated land is reflected to its communication transitivity defined by average PageRank property.
The value of
average PageRank decreases for the polygons where transit infrastructure defined with land use class
Other roads and associated land is less present, as shown in
Figure 11 and
Figure 12. The property that is the most predictive based on land use is
average core number, and it has the highest value for the polygon where the dominant land use classes are
Other roads and associated land and
Continuous urban fabric (S.L. : > 80%), as shown in
Figure 10. Polygons located in the urban core of the city where the dominant land use classes are
Continuous urban fabric (S.L. : > 80%) and
Other roads and associated land also show high value for the property
average core number. In contrast, polygons where the most dominant land use class is
Arable land and classes
Continuous urban fabric (S.L. : > 80%) and
Other roads and associated land are not significantly present show very small values of
average core number. We can conclude that both classes
Continuous urban fabric (S.L. : > 80%) and
Other roads and associated land have a significant impact on the value of the property
average core number, which is also confirmed by the algorithm when calculating feature importance, as shown in
Figure 8.
The property
average weighted degree shows similar trends as
average PageRank and
average core number, which is expected since those properties are correlated. Even though those values are highly correlated, they represent different very important graph properties related to connectivity and transitivity and we considered them independently in relation to land use profiles. Correlation between centrality measures is commonly observed in many different networks, but as they represent different property they might have diverse impact on information flow through the network [
54].
Polygons that have the highest value of
average weighted degree are the ones where the dominant land use class is
Other roads and associated land. Polygons that have the dominant class
Continuous urban fabric (S.L. : > 80%) also have a high value of
average weighted degree but significantly less than the polygons with dominant class
Other roads and associated land, as shown in
Figure 11. Polygons with the dominant class
Arable land,
Figure 12, have very small
average weighted degree. We can conclude that the land use classes that have the most impact on
average weighted degree property are
Other roads and associated land and
Continuous urban fabric (S.L. : > 80%) which is also detected by the algorithm when calculating feature importance, as shown in
Figure 8.
7. Conclusions and Future Research
Human dynamics in geography and computational social sciences is related to human movement and mobility, but there are other aspects of human dynamics that need to be considered. Virtual activity reflected through social media, location-based services, telecommunications, internet usage, even some online games can have severe impact on shaping the patterns of human dynamics. The relationship between physical and virtual space is indisputable which adds even more complexity to human dynamics research.
In this study, we have analyzed human dynamics reflected by telecom traffic network through connectivity links. User generated data is usually very large in size, dynamic and it has complex structure. To analyze such data we have designed and developed a processing pipeline based on Apache Spark Big Data platform using programming language Scala. We have introduced graph filtering as a method for performance enhancement by keeping only statistically significant links in the graph.
To investigate community structure of the network we applied modularity-based algorithm for community detection, to investigate the space-time network evolution. We analyzed the community structure in a daily basis and observed some persistent patterns over time although the number, structure and spatial distribution of communities differs between days. We also noticed that communities formed over the urban core of the city are smaller in size but highly dynamic while communities formed over peripheral parts of the city and in sub-urban zones are larger in size and more stable. This observation motivated us to deeper investigate the correlation between land use and community structure. We have created land use profiles for each polygon of the RBS coverage network and quantified graph based and spatial community properties, which contain latent information about human dynamics. We further used the properties to learn the predictive model and to evaluate the correlation and predictiveness of properties based on land use.
Our results have shown strong correlation between land use and the properties average core number, average coverage area, fair correlation for the properties average weighted degree, average page rank and average intersection area, weak correlation for properties average diameter, standard deviation of intersection area and almost no correlation for property average betweenness centrality. To deeper investigate the impact of specific land use classes on properties predictiveness we have calculated feature importance.
Based on the results, for predicting all properties, the land use classes Other roads and associated land, Continuous urban fabric (S.L. : > 80%) and Arable land have the highest impact. The land use class Other roads and associated land has the highest impact on predicting all graph based properties. For predicting the property average core number, which shows the highest correlation to land use, the land use classes Other roads and associated land and Continuous urban fabric (S.L.: > 80%) have the highest impact. This can be explained by considering the concept of importance, both in physical space and in networks. In physical geographical space, the important urban zone is the one with many amenities, densely built up zone with developed transit infrastructure and good connections. Such zones would be characterized with high presence of land use classes Continuous urban fabric (S.L. > 80%) and Other roads and associated land.
In network science, graph centrality measures are used to quantify the importance of a node. Therefore a node with high importance would participate in the high degree core, which means its core number would be high. The results of feature importance calculation indicate that highly important zones in physical geographical space would also have an important role in the virtual telecom traffic network. Similar behaviour could refer to the property average weighted degree, its expected that highly urban zones would reflect to network nodes with high weighted degree. For predicting the property average page rank the most important land use class is Other roads and associated land. This can be explained by considering the concept of transitivity. Transitivity of the urban zone is reflected in the prevalence of important roads, public transport and other transport infrastructure, while the transitivity of a node in the network is associated with its page rank property. Our results indicate that transitivity in physical space is linked with transitivity in the telecom connectivity network. The results of this study lead us to the conclusion that physical geographical space and virtual communication space need to be considered together as one entity.
To evaluate space–time dynamics of communities we have introduced spatial community properties. Spatial community property that shows the highest correlation with land use is average coverage area. To predicting the property average coverage area the most impact has the land use class Continuous urban fabric (S.L. : > 80%) and Arable land. Based on the feature importance result both classes have significant impact, although they predict opposite values. Polygons where dominant land use class is Arable land tend to have very high coverage area, while those where the dominant land use class is Continuous urban fabric (S.L. : > 80%) form smaller coverage area. This can be explained by observing the size and granularity of the neighbouring Voronoi polygons in the highly urban and non urban area. In highly urban areas, communities are formed by many small polygons, while in non urban zones communities are formed by few very large polygons, affecting the area of the community. The property that is the most related to spatial dynamic of community is mean intersection area. If a polygon is forming a stable community structure that does not differ much between days, its mean intersection area would be high comparing to polygons which form dynamic community structure with little or non spatial overlapping between days. The land use class Arable land has the most impact on predicting mean intersection area, but it is interesting to notice that the land use classes associated with highly urban zones such as Continuous urban fabric (S.L. : > 80%) and Other roads and associated land do not show significant predictive power. Based on the results, the land use class Arable land is very predictive for the property mean intersection area and it indicates high values of the property, but the opposite pattern is not observed. Land use classes that are associated with highly urban zones, Continuous urban fabric (S.L. : > 80%) and Other roads and associated land do not seem to have any significant impact on predicting the value of the property mean intersection area, neither high or low. This imply that even in the highly urban zones it is possible to form stable community structure that would persist in size and spatial distribution over time.
Future work. In this study, we evaluated the correlation and predictive power of land use features for predicting graph based and spatial properties of communities, derived from the telecom connectivity network. Graph-based and spatial properties reflect human dynamics related to their communication patterns. There are several interesting directions for future work, such as: (i) adding day type dimension to the analytics by distinguishing between working days, weekends and holidays, (ii) a deeper investigation of communication patterns associated with specific land use classes, and (iii) developing all the steps of analytical pipeline inside Apache Spark to have unified HPC framework, without the need to of additional processing tools such as Python.
The results of this study could be beneficial for urban planning and city policy making since it emphasize the correlation between land use and human dynamics reflected through properties evaluated from telecom connectivity network. Although human dynamics is often considered through the lenses of movement and mobility patterns, communication as one of the main aspects of human activity shouldn’t be neglected when analysing human behaviour patterns. Telco providers are facing many challenges related to network infrastructure management, demands of new services which needs to be supported by the infrastructure, etc. With knowing the importance of the place, its transitivity and dynamics telco providers could enhance and optimize the network infrastructure and services they are providing.
The topic of human dynamics has been studied by many researchers from diverse disciplines over years. In the era where technology is present in our every day life more then ever, when data records are generated by almost every action we take, it is a huge challenge for the research community to design and develop methods to explore human dynamics which will help us answer essential questions about urban development and society in general.

 ,
, 


