Article

When Traditional Selection Fails: How to Improve Settlement Selection for Small-Scale Maps Using Machine Learning

by
Izabela Karsznia
* and
Karolina Sielicka
Department of Geoinformatics, Cartography and Remote Sensing, Faculty of Geography and Regional Studies, University of Warsaw; Krakowskie Przedmiescie 30, 00-927 Warsaw, Poland
*
Author to whom correspondence should be addressed.
ISPRS Int. J. Geo-Inf. 2020, 9(4), 230; https://0-doi-org.brum.beds.ac.uk/10.3390/ijgi9040230
Submission received: 7 February 2020 / Revised: 7 April 2020 / Accepted: 8 April 2020 / Published: 9 April 2020
(This article belongs to the Special Issue Map Generalization)

Abstract

:
Effective settlements generalization for small-scale maps is a complex and challenging task. Developing a consistent methodology for generalizing small-scale maps has not gained enough attention, as most of the research conducted so far has concerned large scales. In the study reported here, we want to fill this gap and explore settlement characteristics, named variables that can be decisive in settlement selection for small-scale maps. We propose 33 variables, both thematic and topological, which may be of importance in the selection process. To find essential variables and assess their weights and correlations, we use machine learning (ML) models, especially decision trees (DT) and decision trees supported by genetic algorithms (DT-GA). With the use of ML models, we automatically classify settlements as selected and omitted. As a result, in each tested case, we achieve automatic settlement selection, an improvement in comparison with the selection based on official national mapping agency (NMA) guidelines and closer to the results obtained in manual map generalization conducted by experienced cartographers.

1. Introduction

The decision to remove or maintain an object while changing the level of detail requires many features of the object itself and its surroundings to be taken into account. This decision constitutes the essential element of cartographic generalization, defined by ICA (International Cartographic Association) as the selection and simplification of information appropriate to the scale and purpose of a map [1]. Cartographic generalization can be viewed both as a process of exploration, associated with information abstraction and of communication, related to the optimal map design. According to [2], selection, also named as elimination, constitutes one of the generalization operators. Among other generalization operators like aggregation, collapse, merge, simplification and refinement it is classified as the operator that affects objects visual quantity. Selection deals with one or more objects or object classes removal without replacement, thus it is used to reduce map or database content according to the target detail level. It has also been referred to as elimination, class selection, extraction, thinning or pruning [2]. Selection usually constitutes the first generalization operation, thus it can be a prerequisite to effective objects generalization. Especially in the context of settlement generalization and in particular, for small scale maps, the selection is an essential step as it is not a straightforward operation. Although it is intuitive that large settlements should take precedence over the smaller ones, it is not true that if five settlements are selected, these are the largest ones. A large settlement located close to a larger one may be excluded, and a smaller settlement not in the neighborhood of any other larger one may be included because of its relative importance [3].
Researchers agree on the need for fully automating the generalization process [4]. Numerous research centers, cartographic agencies and commercial companies have undertaken successful attempts to implement certain generalization solutions [4,5,6,7,8,9]. Nevertheless, developing an effective and consistent methodology for generalizing small-scale maps has not gained enough attention. Most of the research conducted so far has focused on the acquisition of large-scale maps [4]. The presented research aims to fill this gap by exploring new variables, which are of key importance in the automatic settlement selection process at small scales. Variables are understood as settlement characteristics calculated, measurable and comparable. The paper addresses two research questions explicitly:
  • Which variables are essential in settlement selection for small-scale maps?
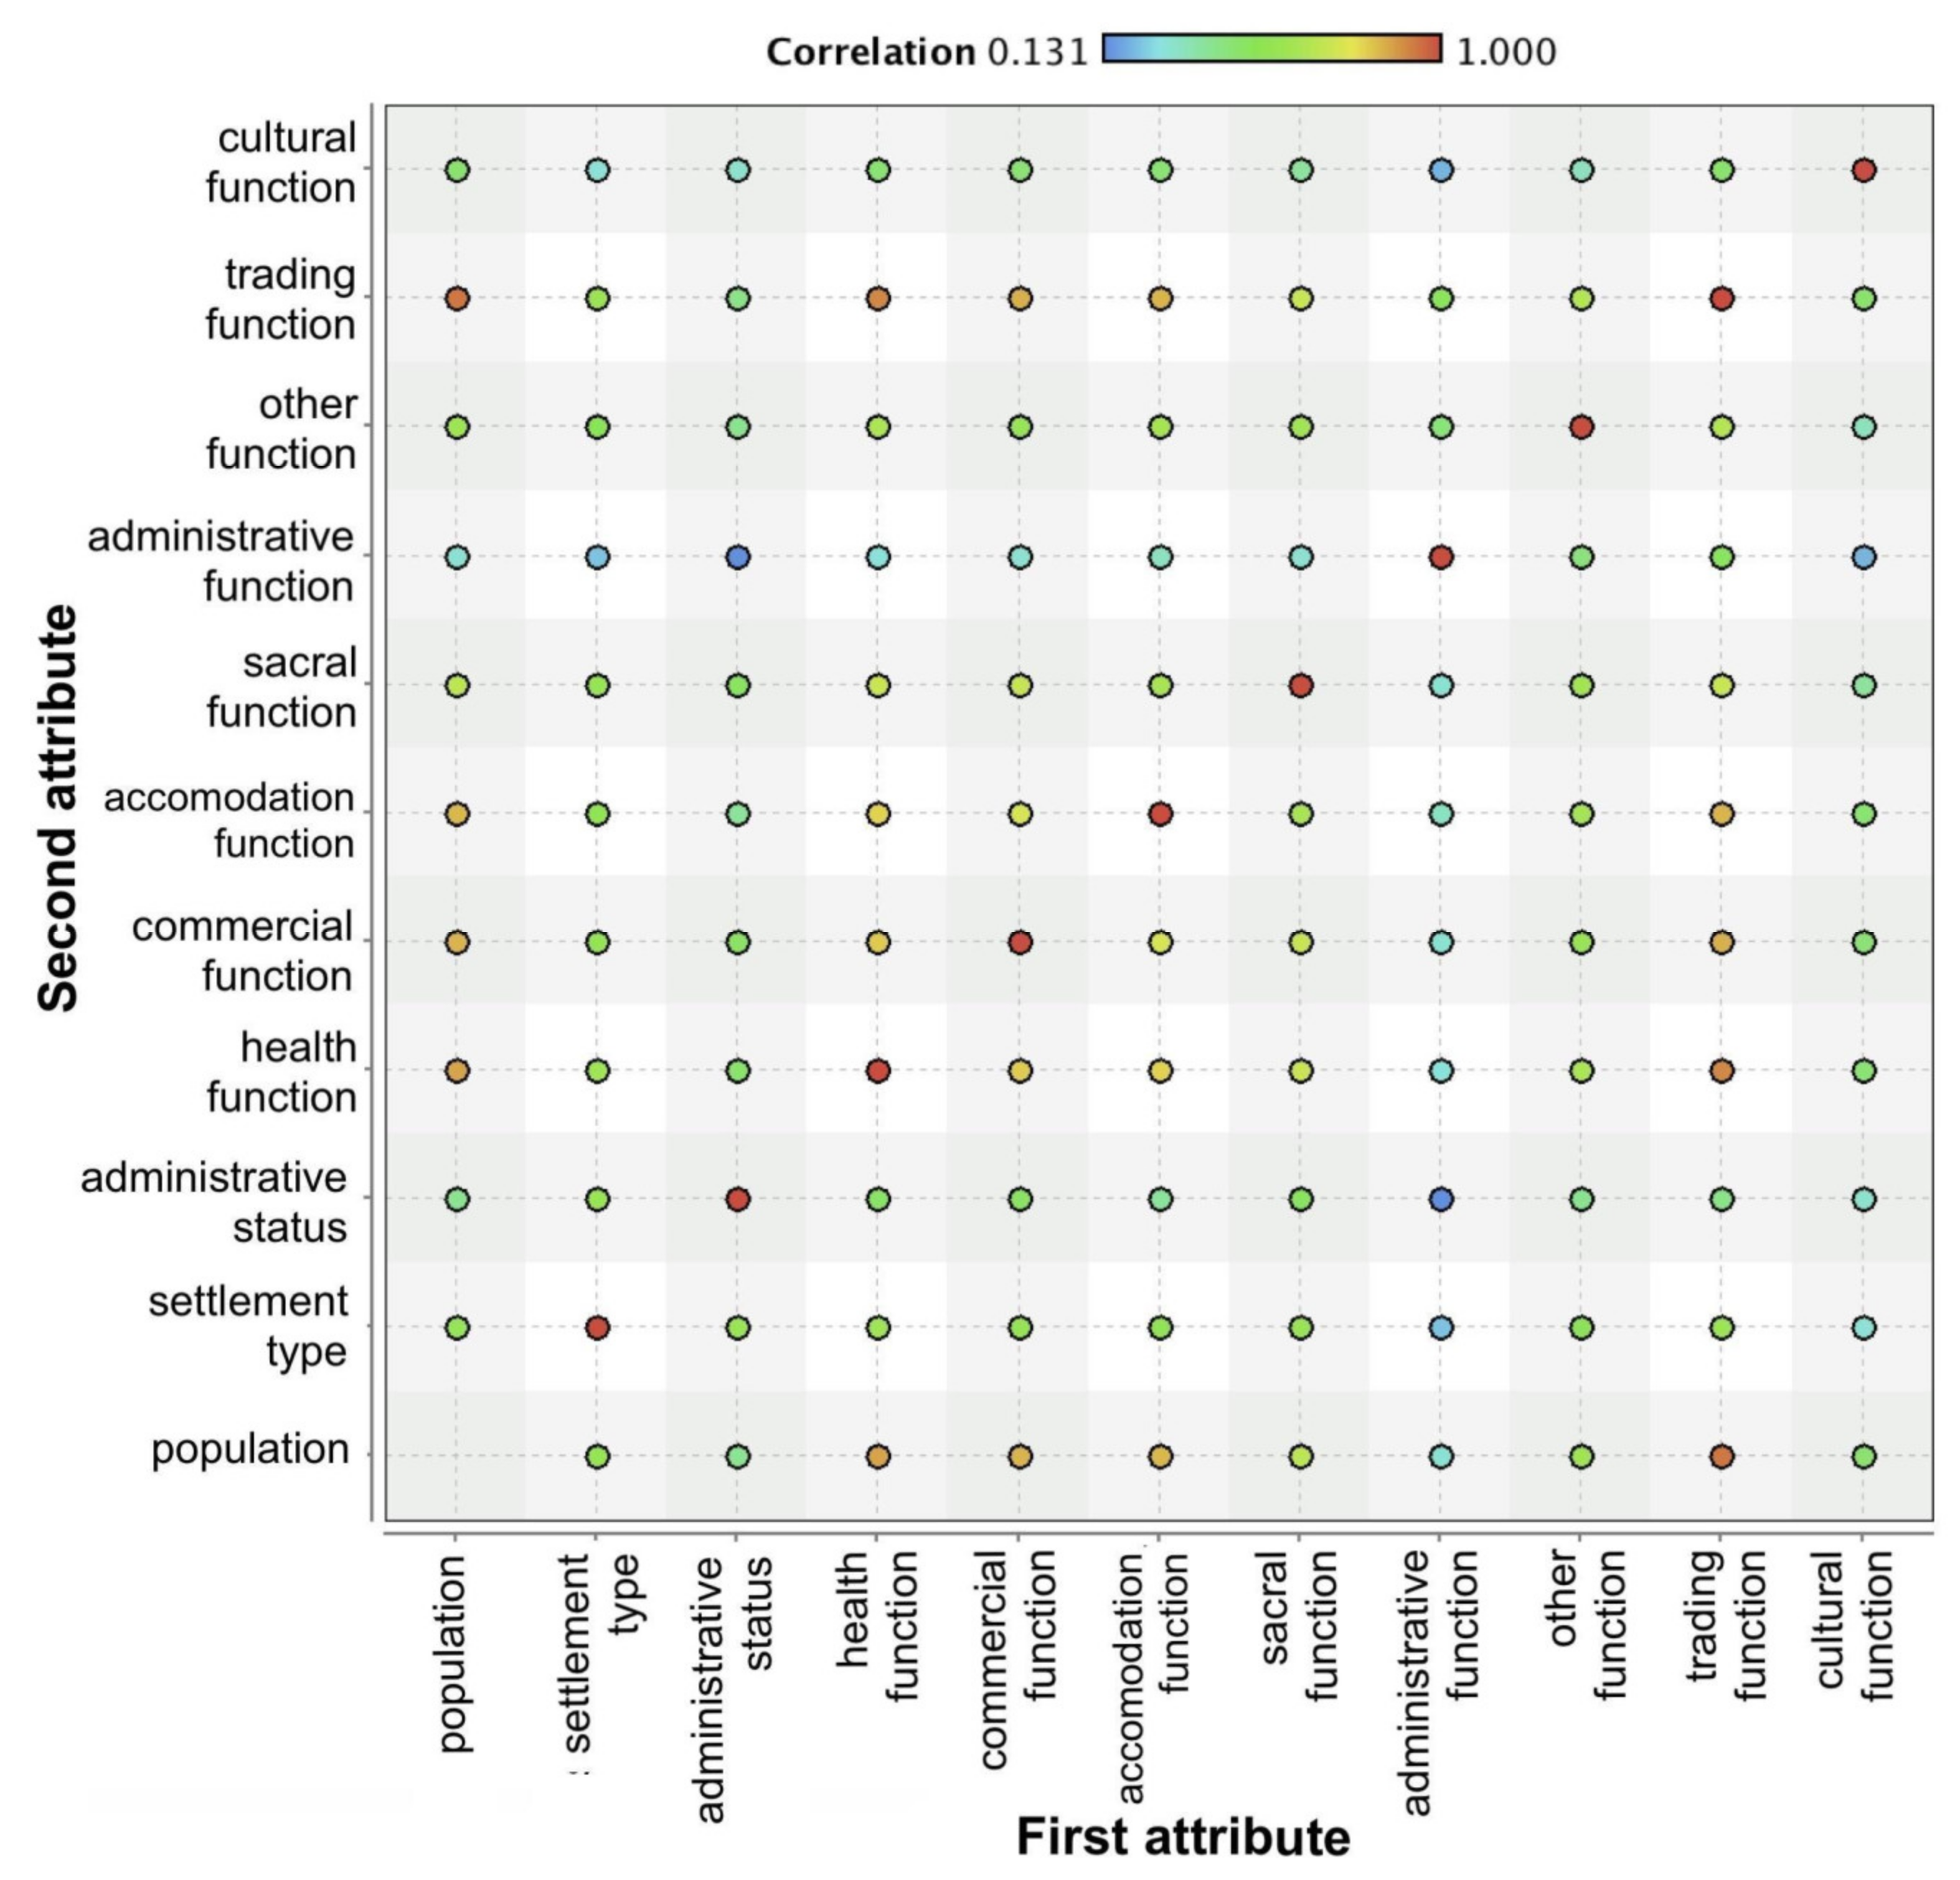
  • Is there a correlation between the proposed variables?
Addressing these issues is an essential step towards proposing new algorithms for effective and automatic settlement selection that will contribute to enriching the sparsely filled small-scale generalization toolbox. The article is an extension of the research presented at the 29th International Cartographic Conference [10].

1.1. Variables Considered in Settlement Selection

Cartographers design maps by generalizing more detailed data and selecting objects based on many features—both in relation to the object itself and its surroundings. During manual generalization, it was possible to make decisions based on visual map inspection. The observation allowed the density of settlements and the patterns of the settlement network to be taken into account. Formalizing such considerations and subjective decision-making is very challenging in order to automate the process. In object selection or quantitative evaluation of the generalization results, the Radical Law developed by Topfer and Pillewizer [11] is often applied. However, apart from knowing the optimal number of objects that should remain on the map, it is necessary to decide which of them should be kept and which can be omitted [2]. This issue has been dealt with in previous research [12,13].
The significant settlements should have priority to be maintained and presented on maps at smaller scales. Still, this significance can be understood and measured in various ways. It should be remembered that some important settlements located in the vicinity of more important ones must be omitted due to map readability. At the same time, small settlements located at a considerable distance from others might be preserved on a small-scale map, because they signal the presence of built-up areas in a given region and allow the density of the settlement network to be estimated [14].
When choosing the criteria to determine whether to maintain or omit objects, the theme, purpose and scale of the map should be considered. Measurable criteria allow the importance of settlements to be assigned and their hierarchy to be developed in a given classification. According to Sirko [13], the features considered in the classification should meet the conditions of measurability, independence, summation and variability. The most commonly used criterion for assessing the significance of a settlement, and hence the selection criterion, is its size, measured by the number of inhabitants. This was mentioned as the most crucial criterion by, among others, Pietkiewicz [15], Rado [16], Ostrowski [17], Baranowski and Grygorenko [18], Ratajski [19] and Flewelling and Egenhofer [20].
In the literature concerning the selection of settlements in cartographic generalization, the authors propose additional selection criteria. Sirko [13] notes that taking more criteria into account allows the settlement to be characterized as fully as possible and contributes to an objective assessment of its importance. At the same time, Sirko proposes nine settlement selection criteria. Based on each of the characteristics (variables), the rank of the settlement is calculated. The combined value of the ranks constitutes the information on the weight of the settlement. The characteristics indicated by Sirko to assess the importance of settlements are the number of inhabitants, administrative significance, level of urbanization, economic significance, road transport accessibility, rail transport accessibility, historical significance, touristic significance and location of the settlement with regard to the river network. Ratajski [19] also mentions the criterion of centrality, taking into account the set of all functions of the settlement as well as the following criteria: settlement importance as a central place, fulfilling a service function for other settlements in the network; settlement timeliness, expressing the temporary significance of the settlement due to events; change tendencies, understood as the tendency for settlements to develop or regress; as well as settlement patterns, that is, the presentation of differences in the density of the settlement network.
The need to take the criteria related to the functional significance of settlements into account, defined by their educational, touristic or historical role, was also emphasized in geographical and urban literature [21,22,23]. The first attempts to take the functional significance of the settlement into account were made by Christaller [24], Dixon [25], Kadmon [12], Richardson and Müller [3].

1.2. Machine Learning in Cartographic Generalization

The main idea behind this research is to use machine learning (ML) to explore new variables, which can be valuable in the automatic settlements generalization in small scales. So far, a few approaches based on the use of ML have already been proposed. One of the first attempts to determine generalization parameters with the use of ML was performed by Weibel et al. [26]. The learning material was the observation of cartographer’s manual work. Additionally, Mustière [27] tried to identify the optimal sequence of the generalization operators for roads using ML. A different approach was presented by Sester [28]. The goal was to extract the cartographic knowledge from spatial data characteristics, especially from the attributes and geometric properties of objects, regularities and repetitive patterns that govern object selection with the use of decision trees. Lagrange et al. [29] and also Balboa and López [30] used ML techniques, namely neural networks to generalize line objects. Recently, Sester et al. [31] and Feng et al. [32] proposed the application of deep learning for the task of building generalization.
However, as noted by Sester et al. [31], these ideas, although interesting, remained proof of concepts only. Moreover, previous research concerned topographic databases and large-scale maps. Promising results of automatic settlement selection in small scales were reported by Karsznia and Weibel [33]. To improve the settlement selection process, they used data enrichment and ML. Due to classification models based on decision trees, they explored new variables that are decisive in the settlement selection process. Nevertheless, they also concluded that there is probably still more “deep knowledge” to be discovered, possibly linked to further variables that were not included in their work. Thus, the motivation for this research is to fill this gap and look for additional, essential variables governing settlement selection in small scales.

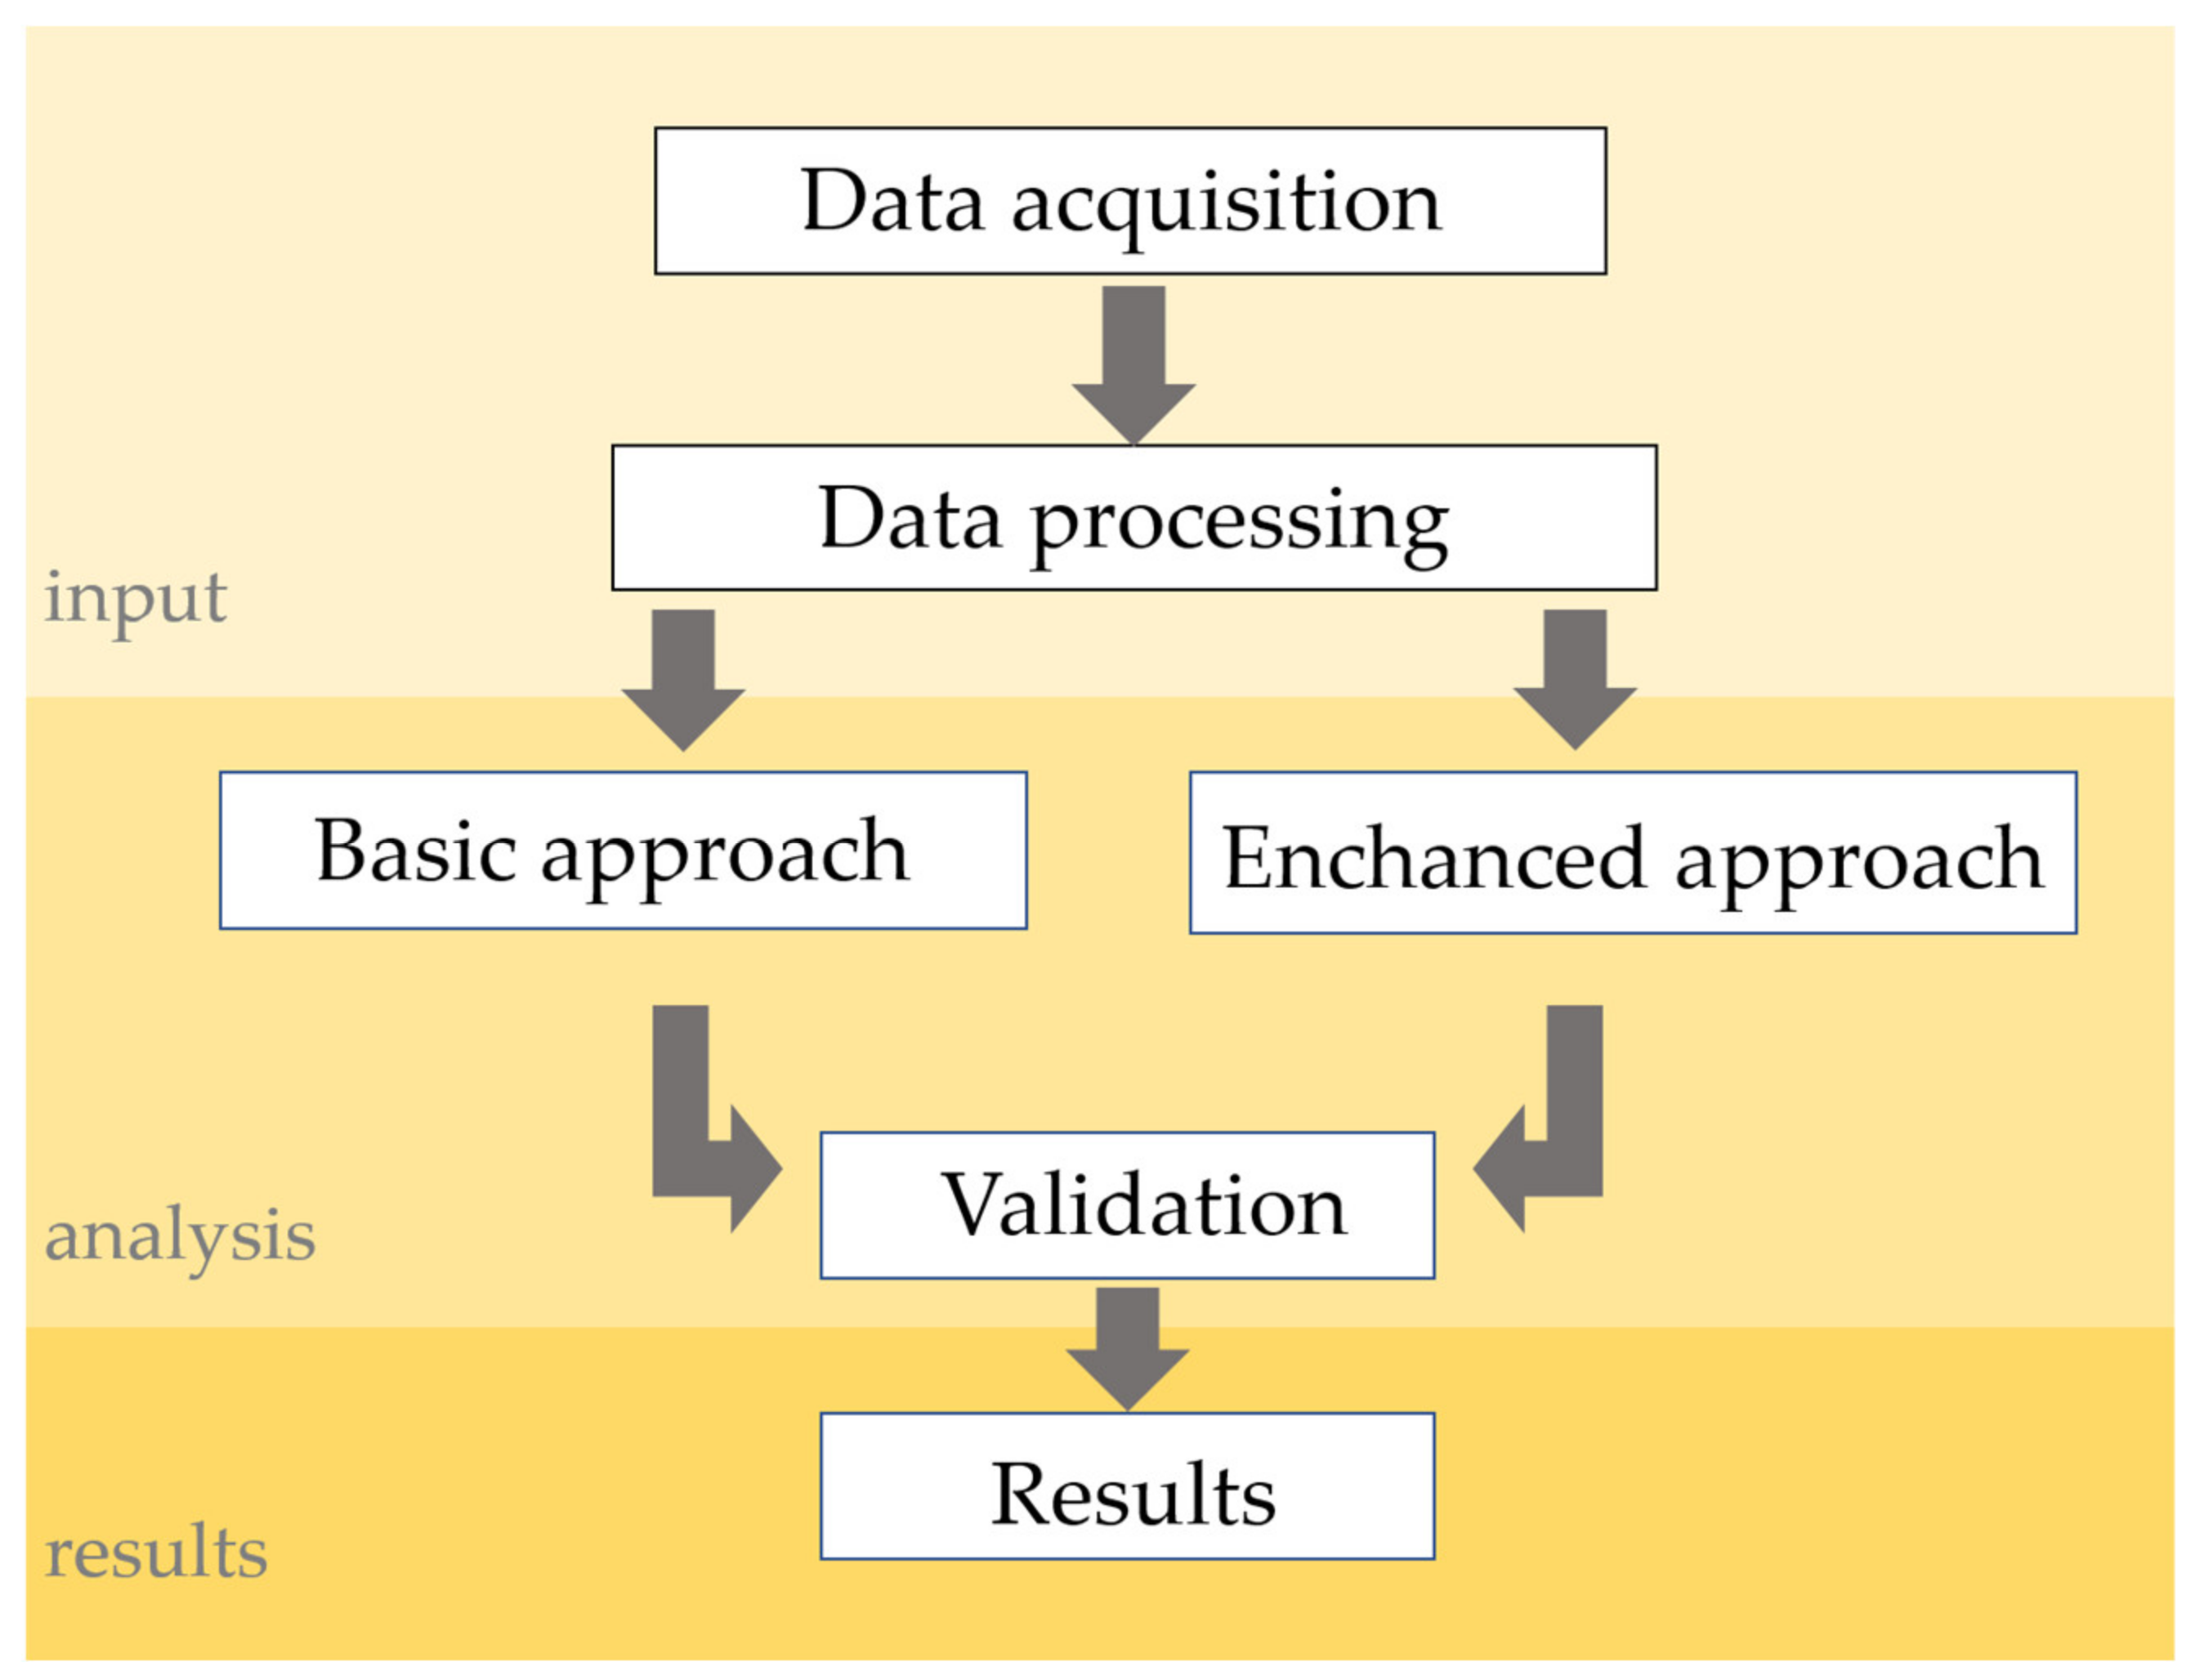
2. Materials and Methods

The scope of this research covered automatic settlement selection from the General Geographic Object Database (GGOD) at the detail level of the 1:250 000–1:500 000 scale.
The data contained in GGOD is gathered and stored by districts, which are the second-level units of administration in Poland, equivalent to LAU-1 and NUTS-4. In this research, a sample of 16 districts was used. This represents approximately 5% of Polish districts. The districts were split into four groups, coherent in terms of population density, settlement density and settlement type (Figure 1, Table 1).
The settlements have been generalized using two approaches (Figure 2). The primary stage consisted of acquiring the source data from the GGOD (thematic layers of settlements, roads, road nodes, land use and administrative borders), enriching the source data with information from the Topographic Objects Database (buildings with their functions) and from the Atlas of the Republic of Poland 1: 500,000 [34]. This map was designed manually in the 1990s. Unfortunately, it is the latest available map at the 1: 500,000 scale, covering the whole country. Taking into account that the settlement network did not undergo such dynamic changes, the authors, after consultation with cartographers, considered the map as sufficient comparative material. The data processing step included the GGOD enrichment and the raster atlas map conversion to digital, vector form, interoperable with GGOD. Then the settlements were selected based on the rules defined in Polish legal guidelines. This process was called the basic approach [35]. Secondly, automatic settlement selection models based on ML were used and are referred to as the enhanced approach in this paper. According to the regulation, the settlements should be selected, taking four variables into account: three thematic and one spatial. The variables provided in the regulation are as follows:
  • Population (number of inhabitants);
  • Administrative status (seat of administrative office);
  • Settlement type (“city”, “village”, “hamlet”, etc.);
  • Population density (calculated per district).
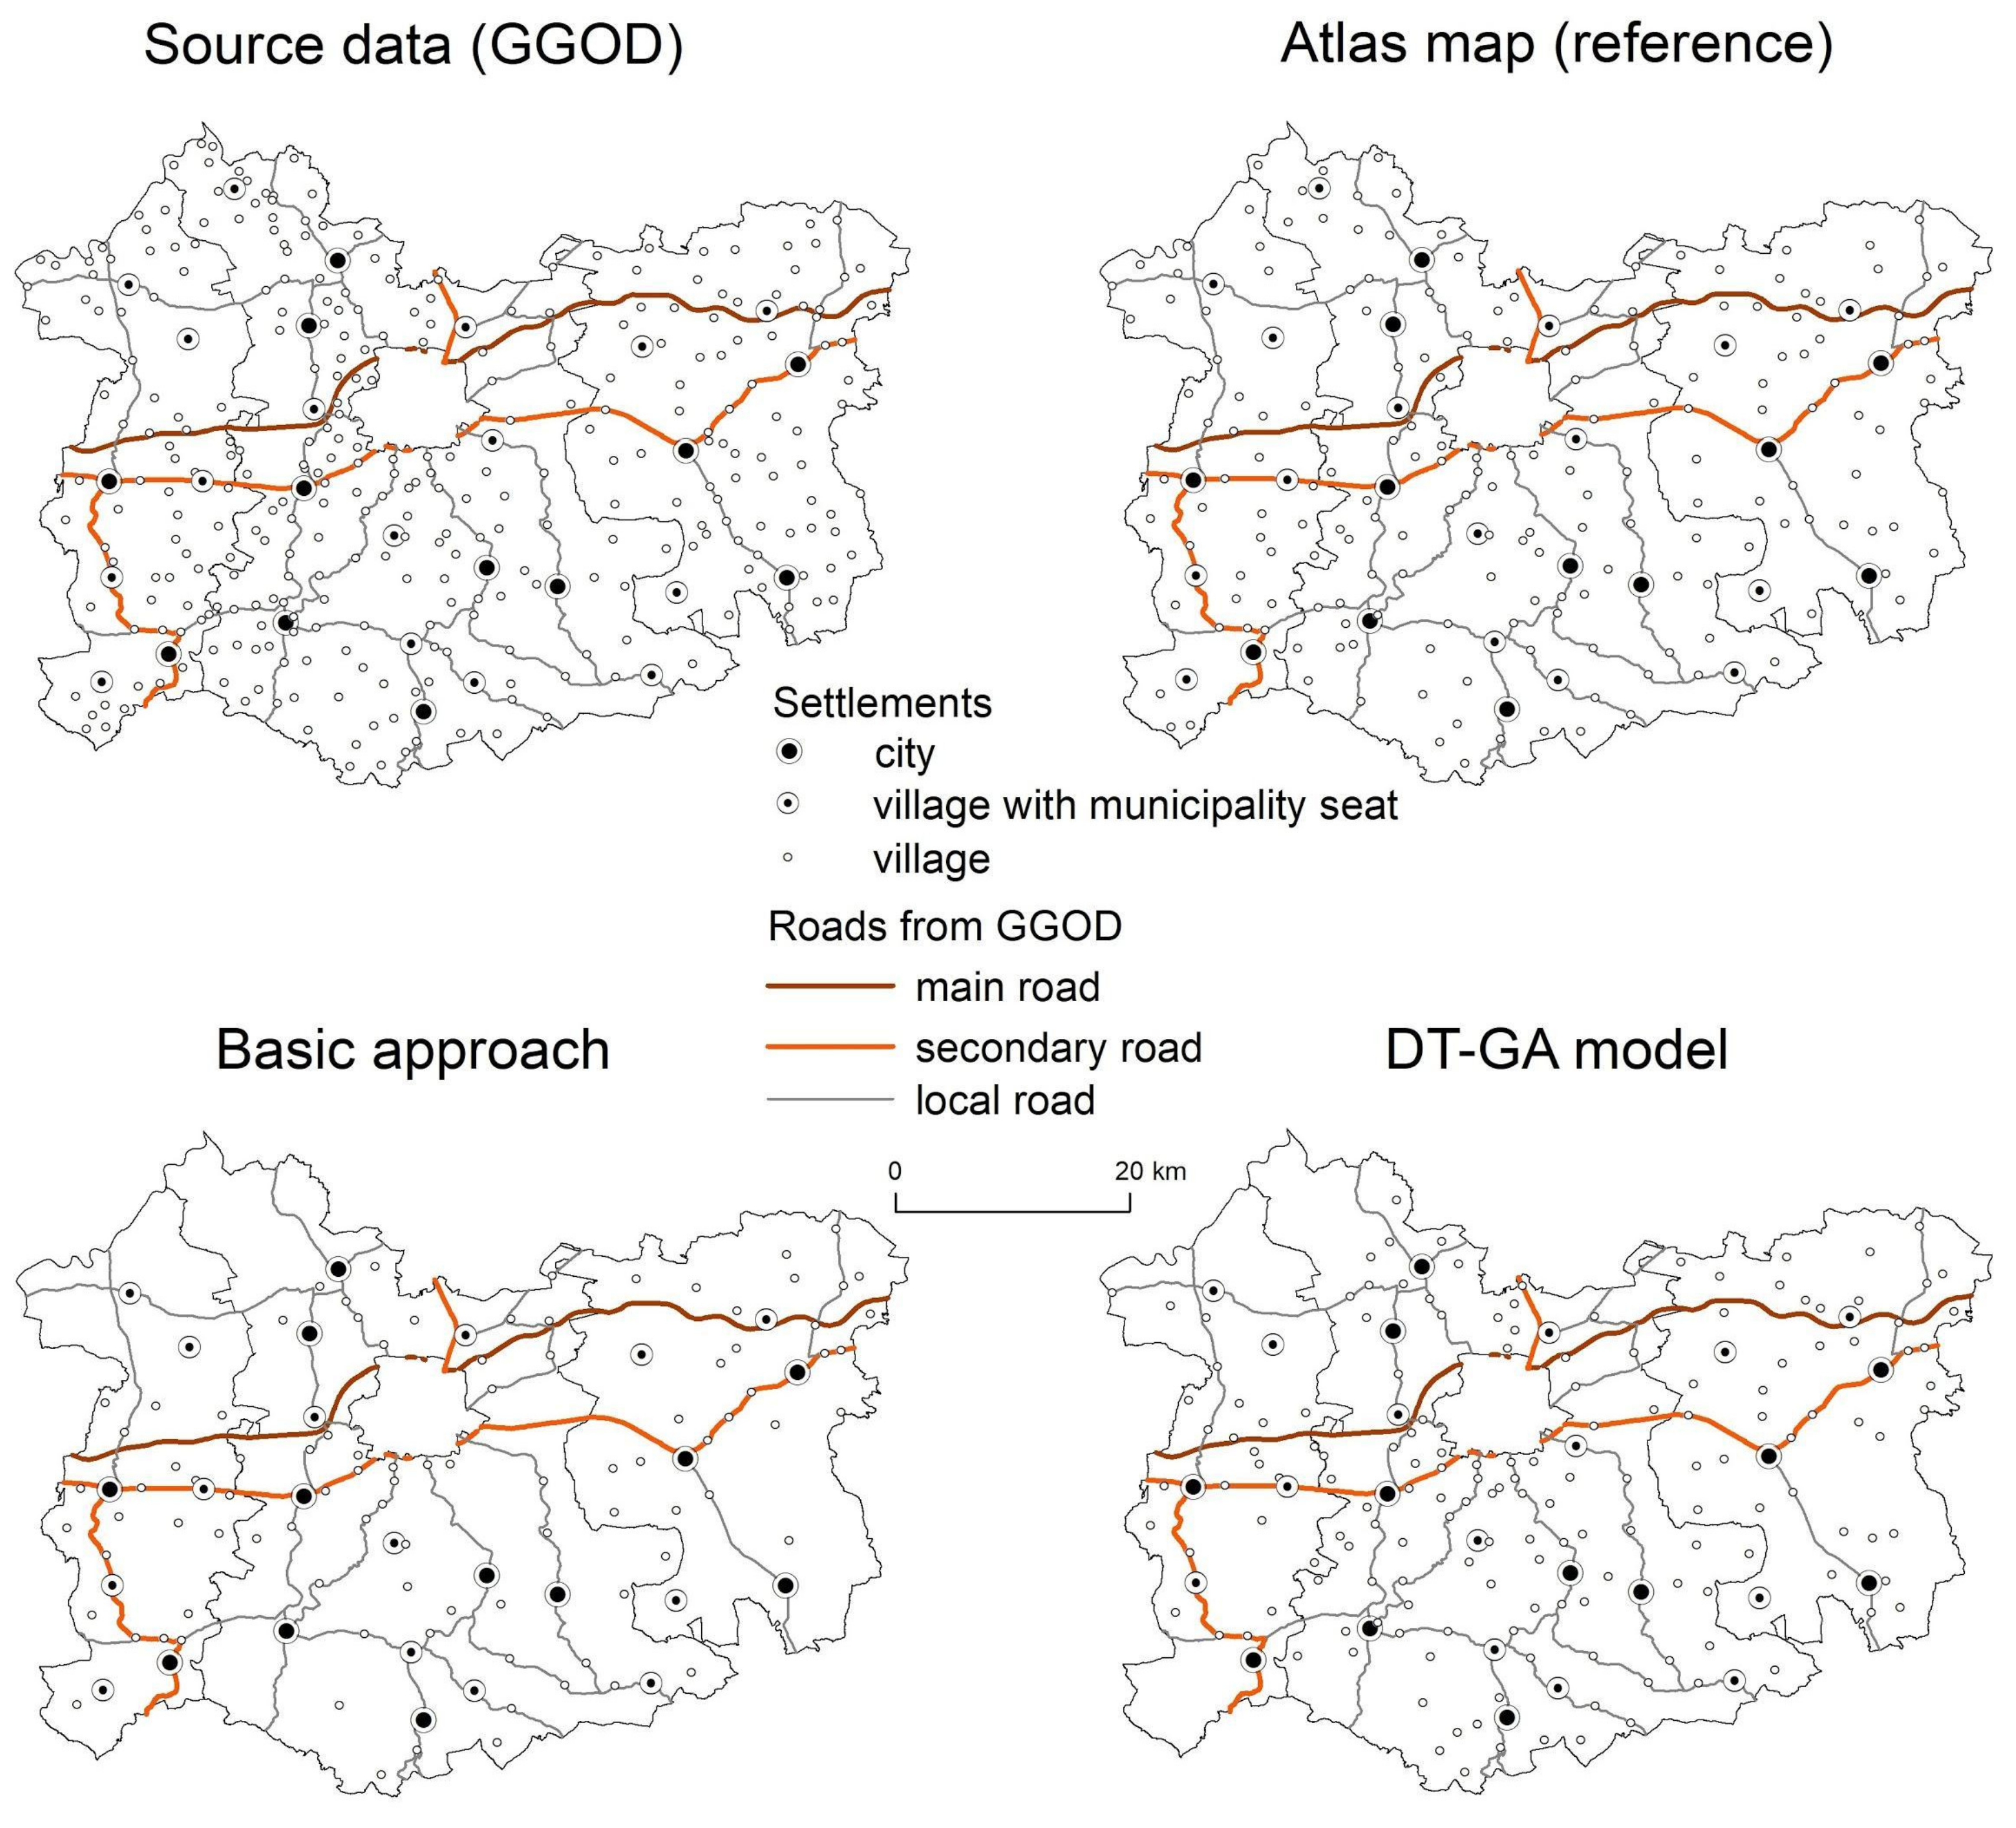
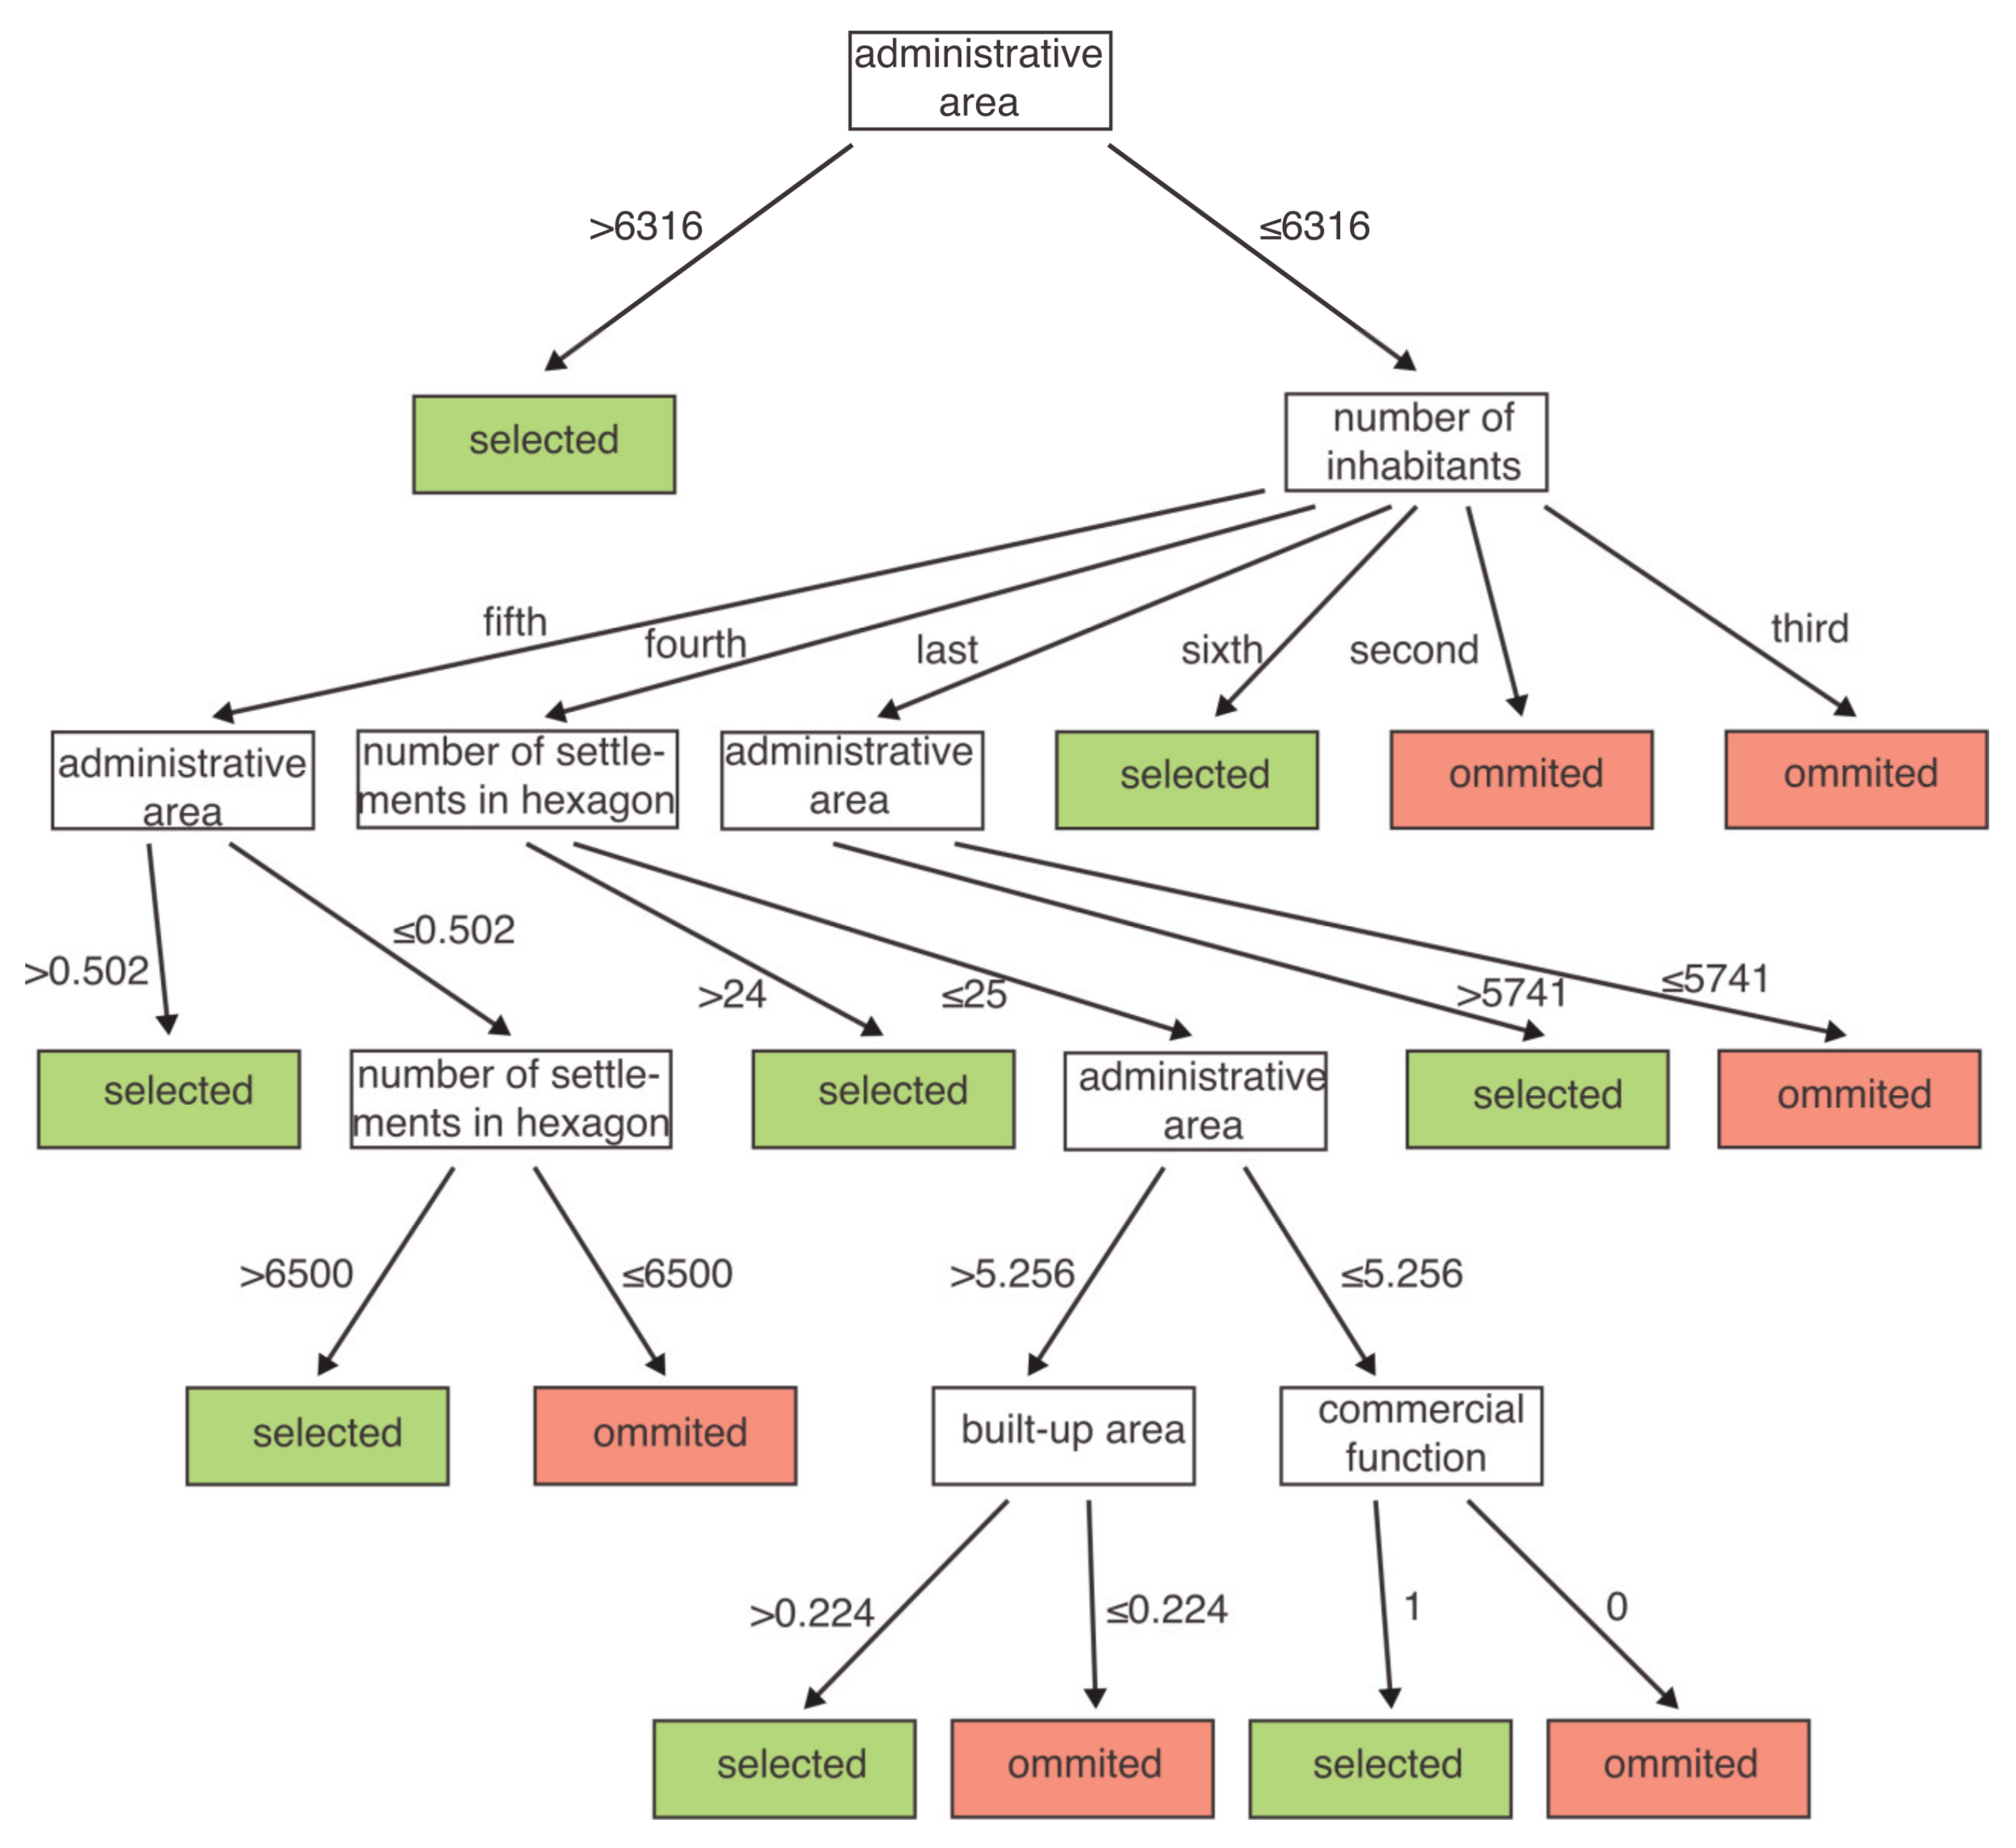
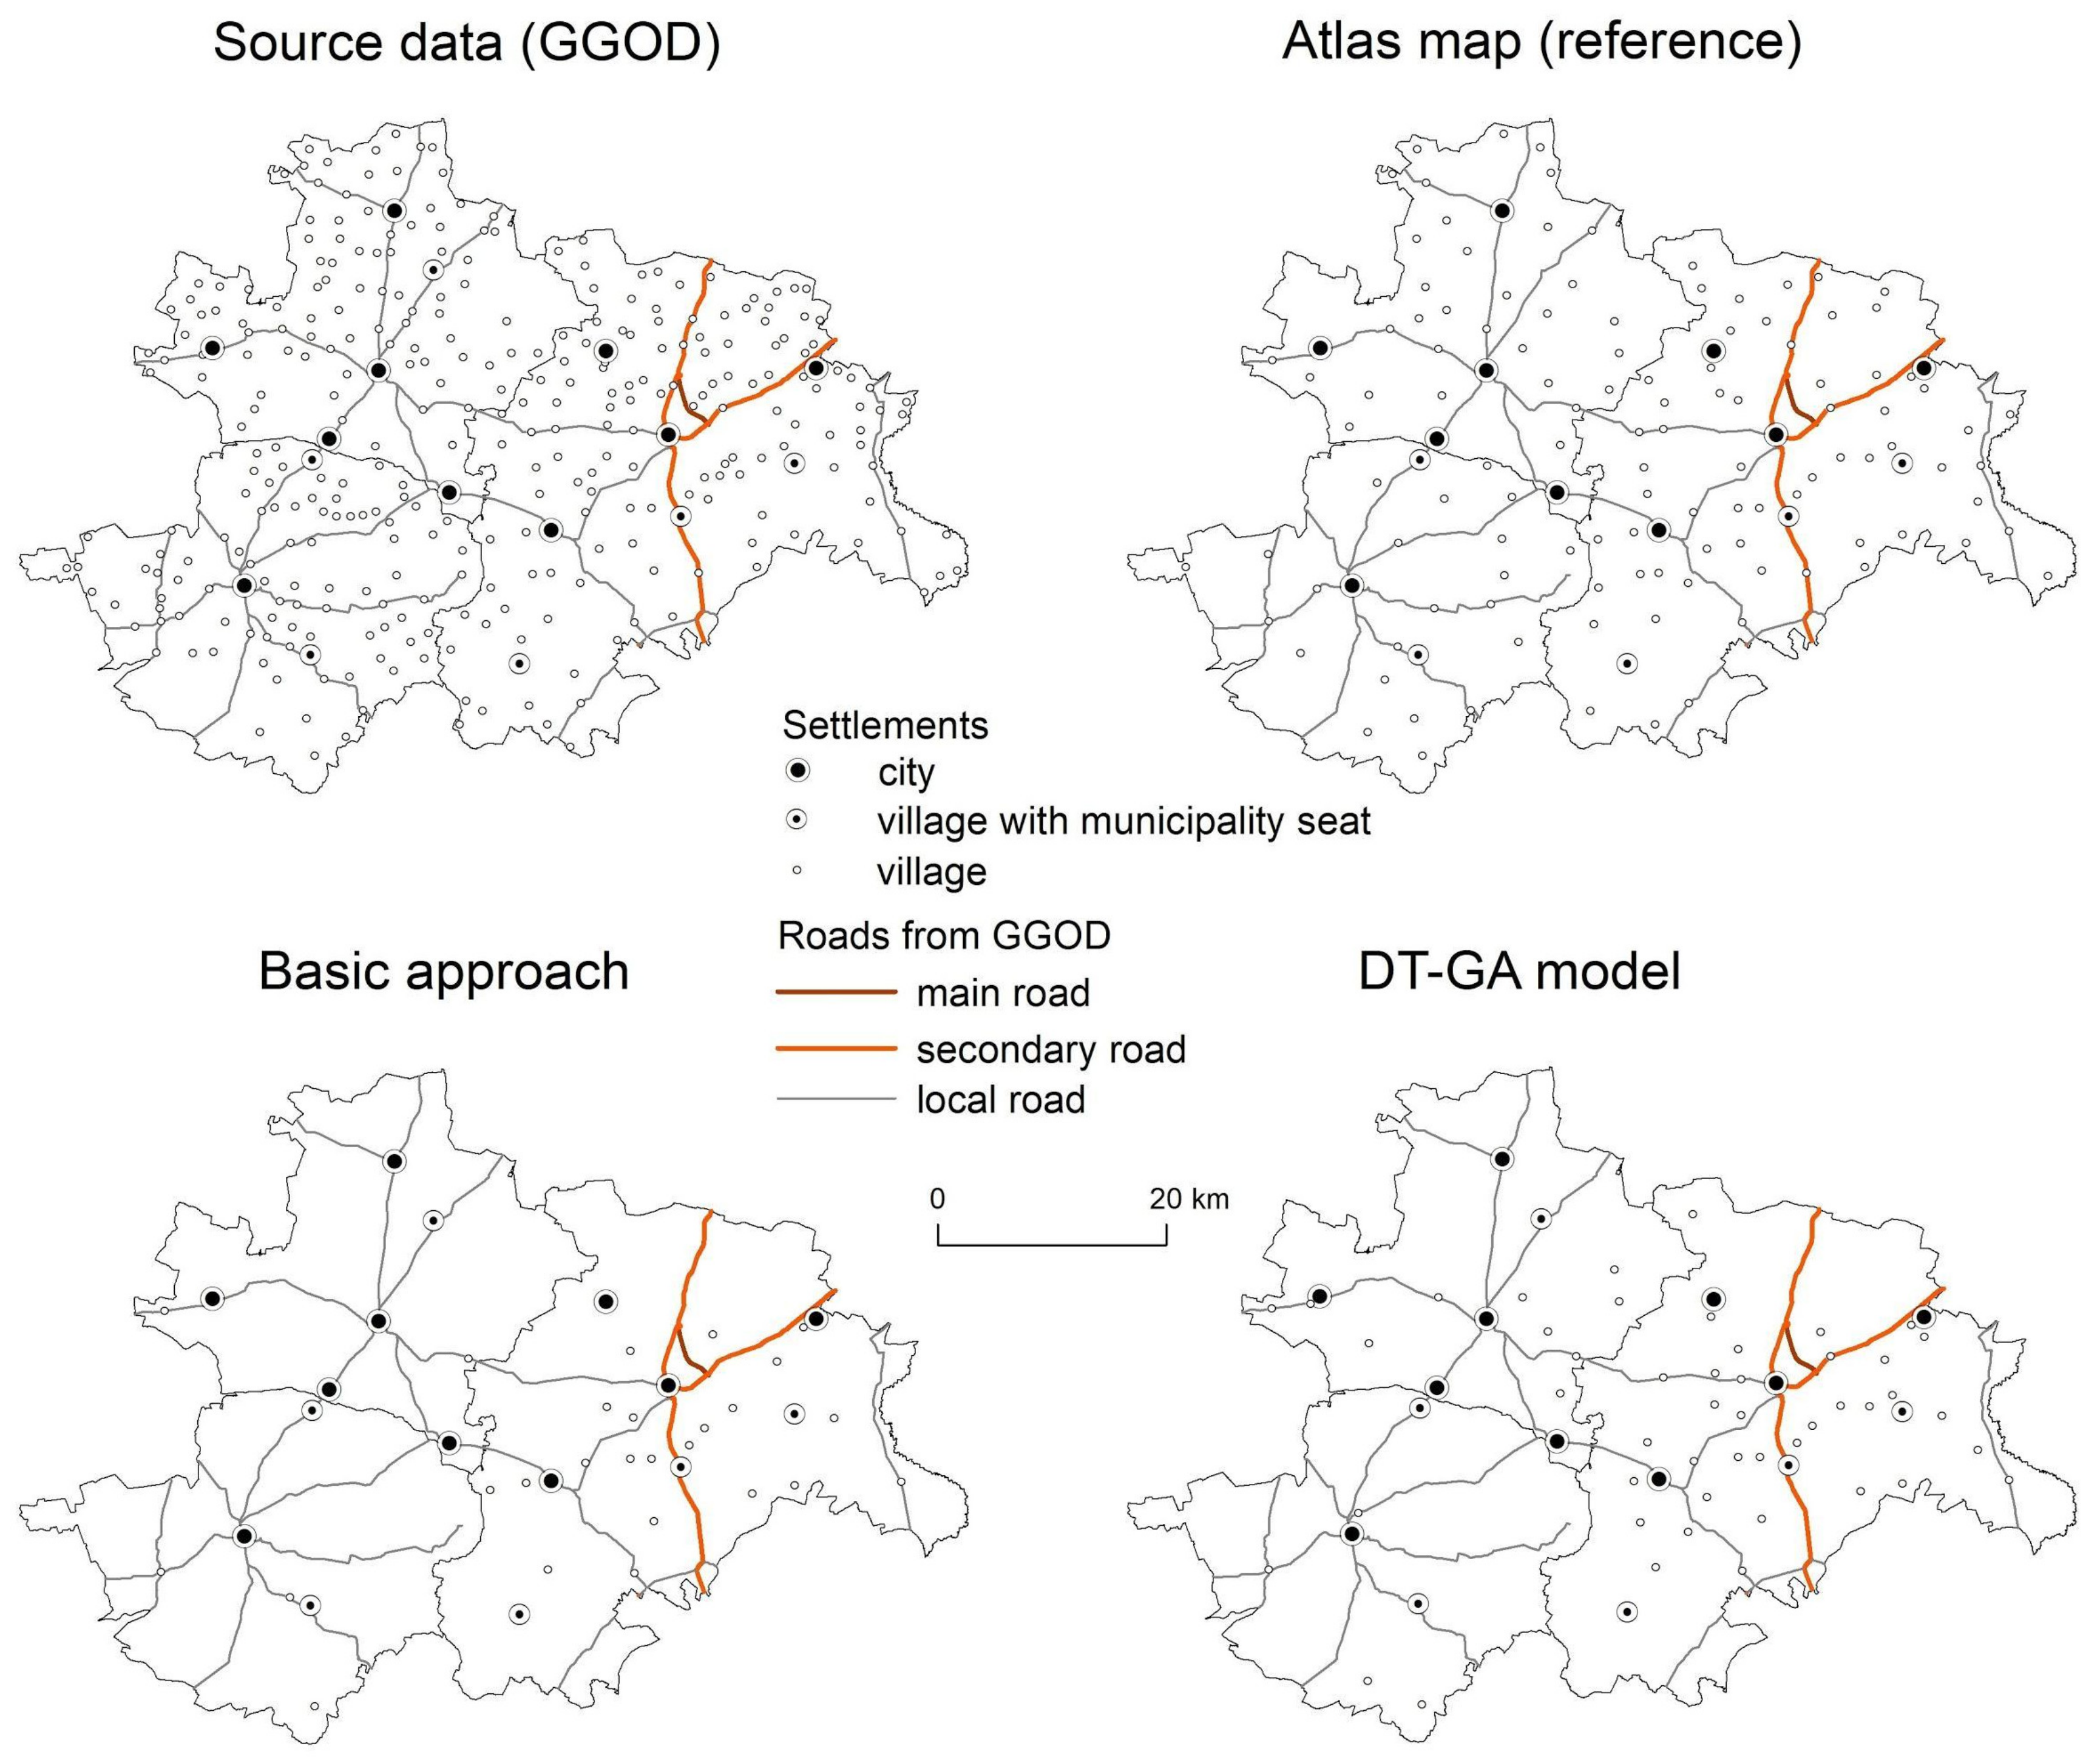
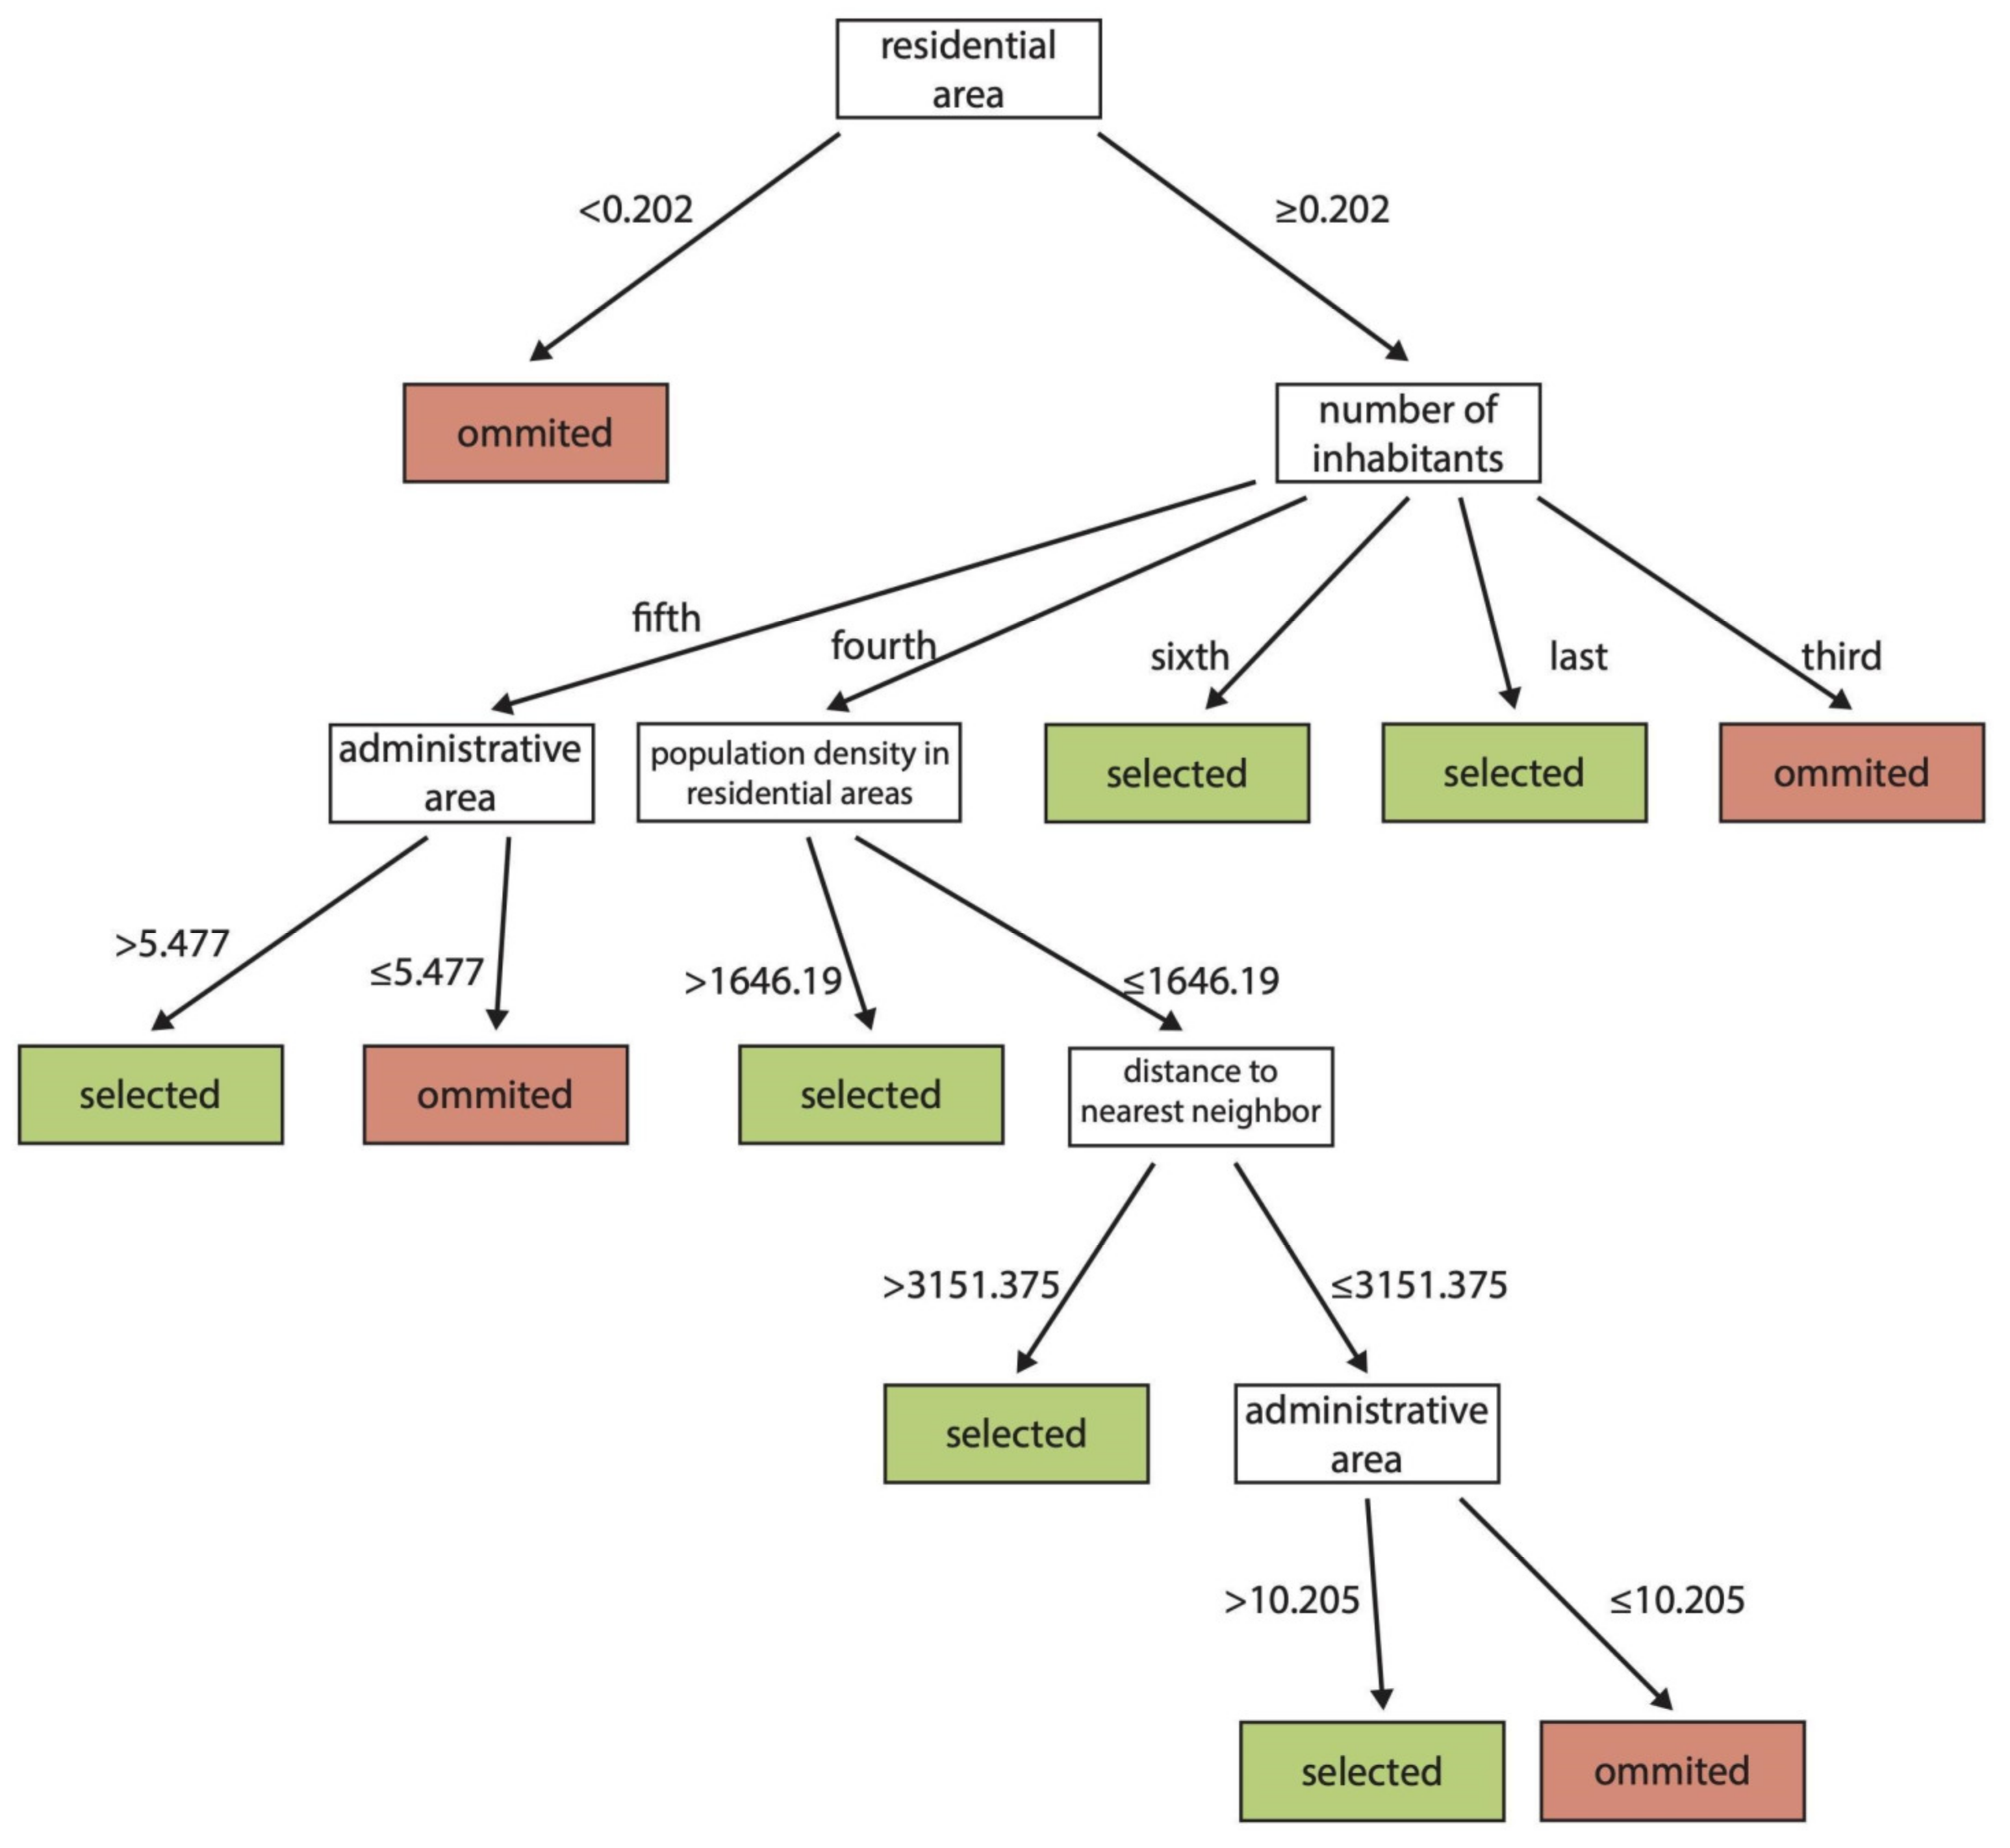
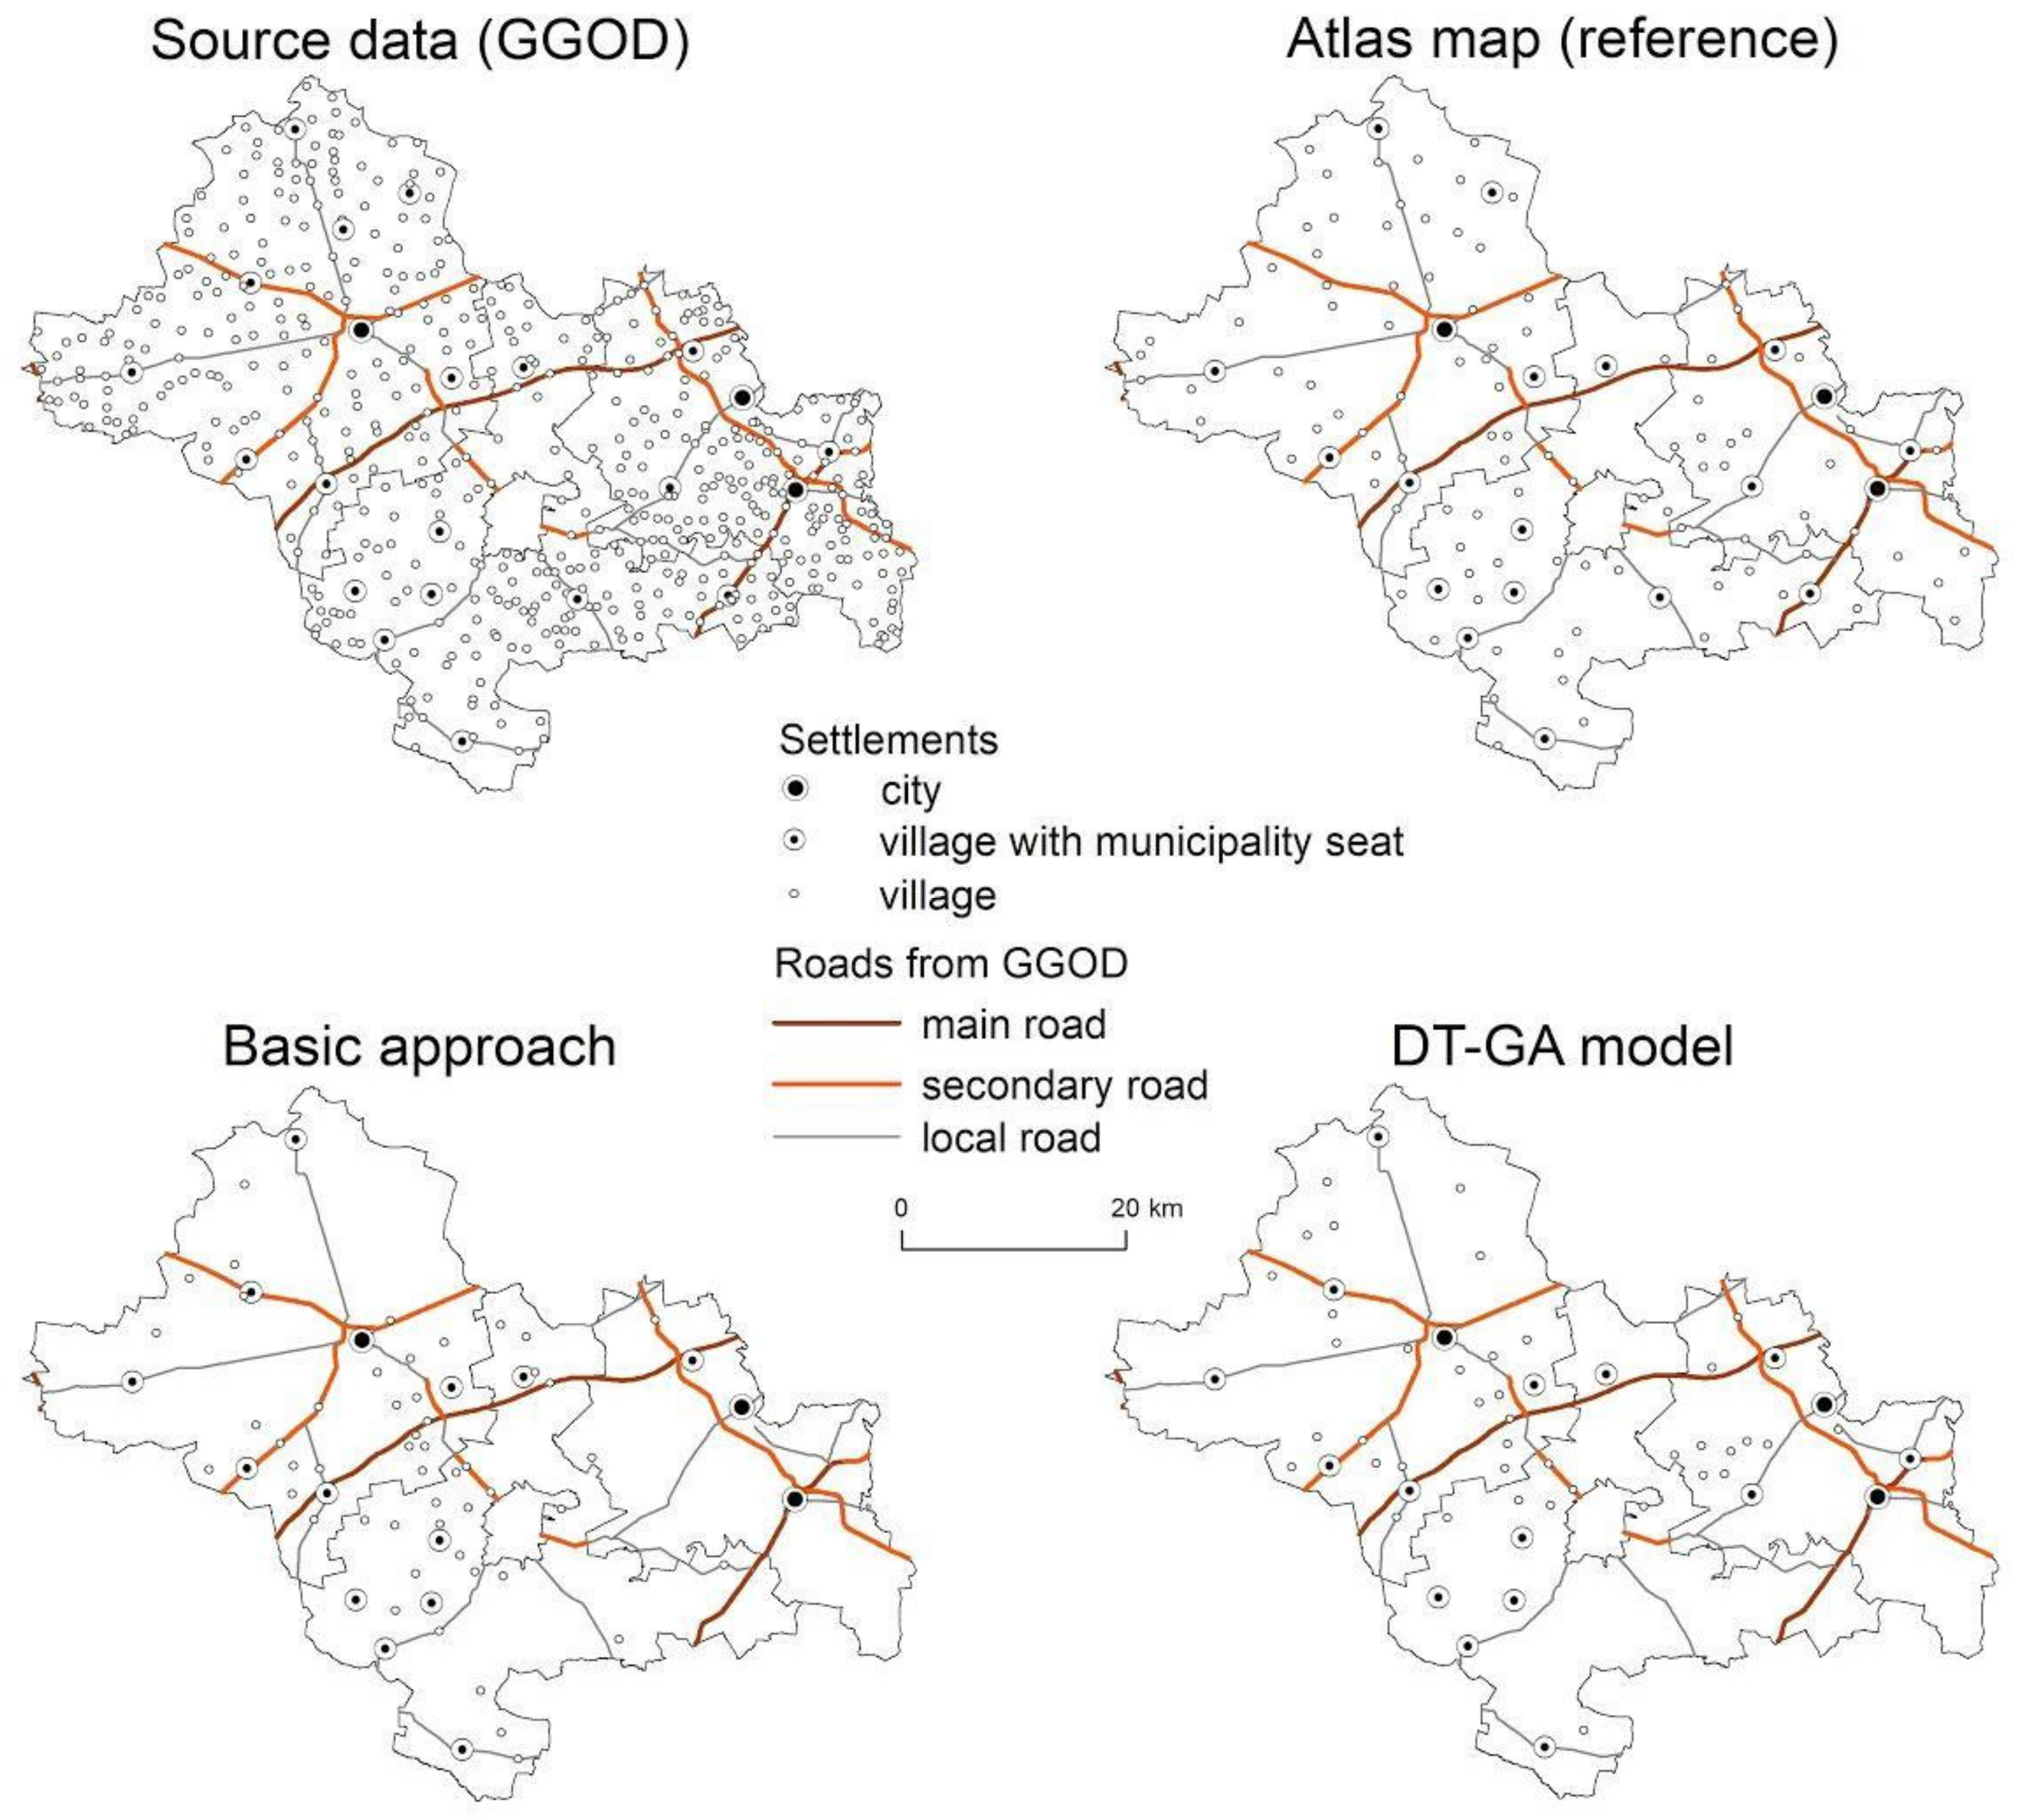
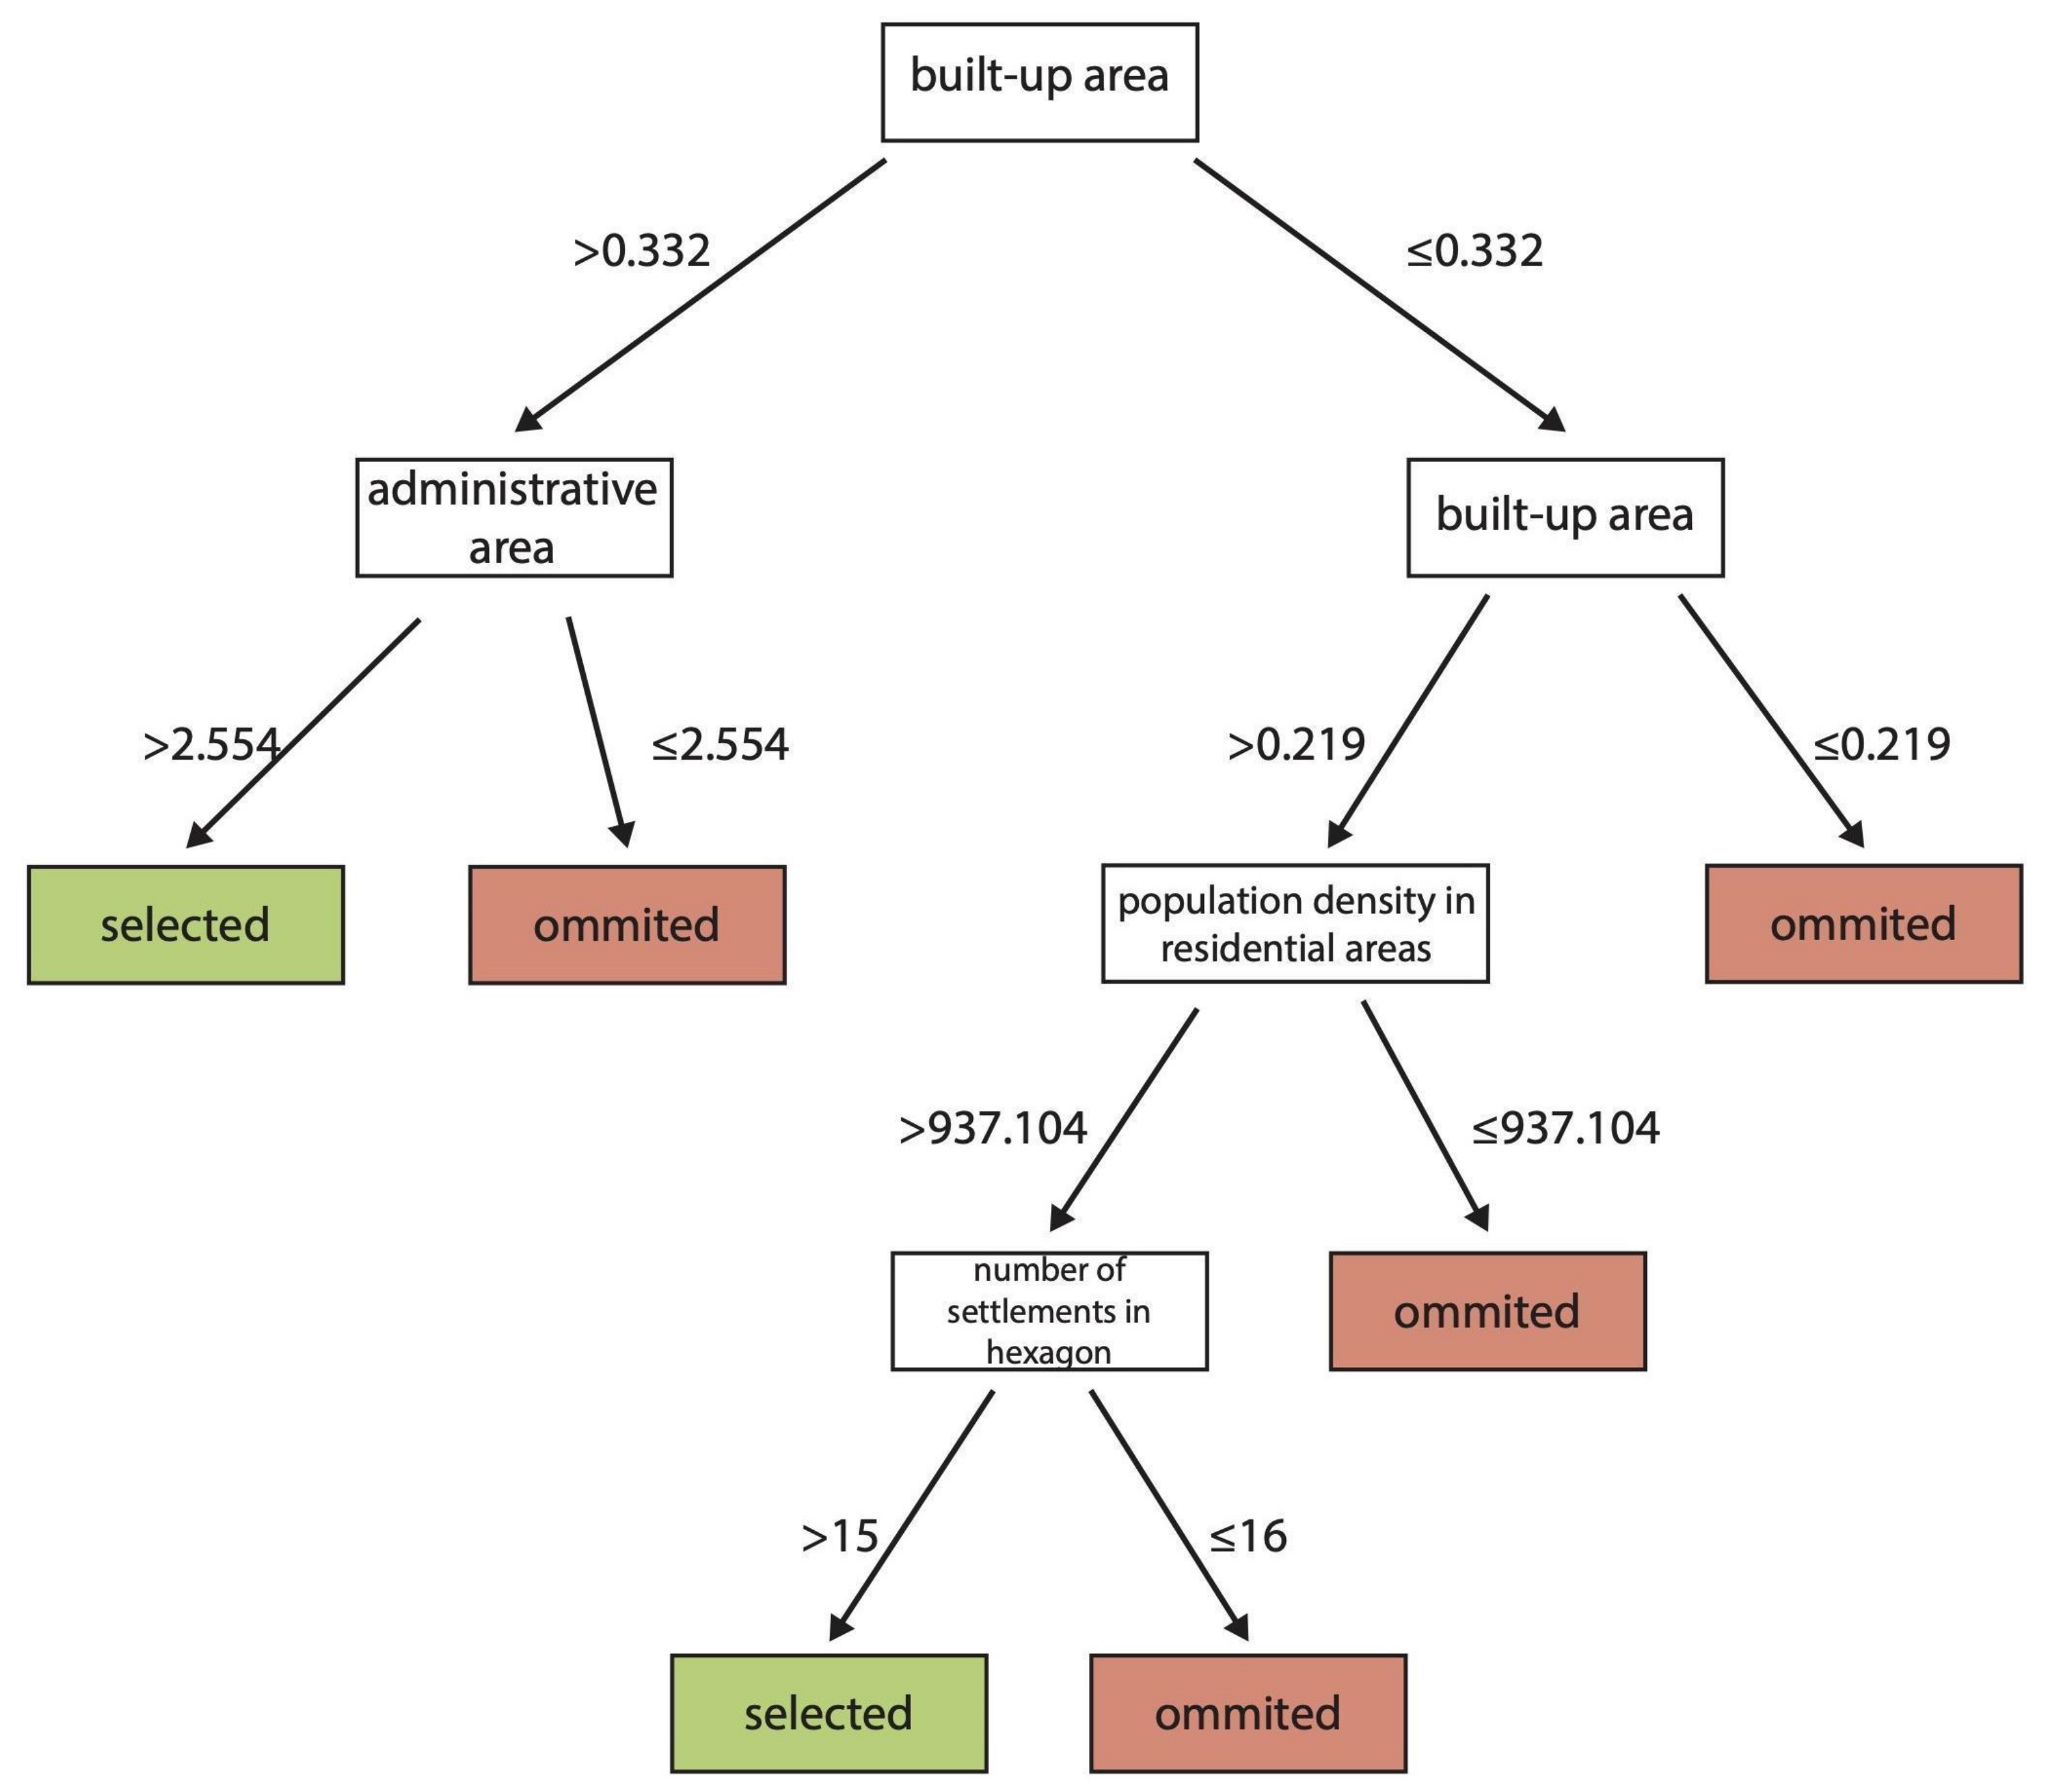
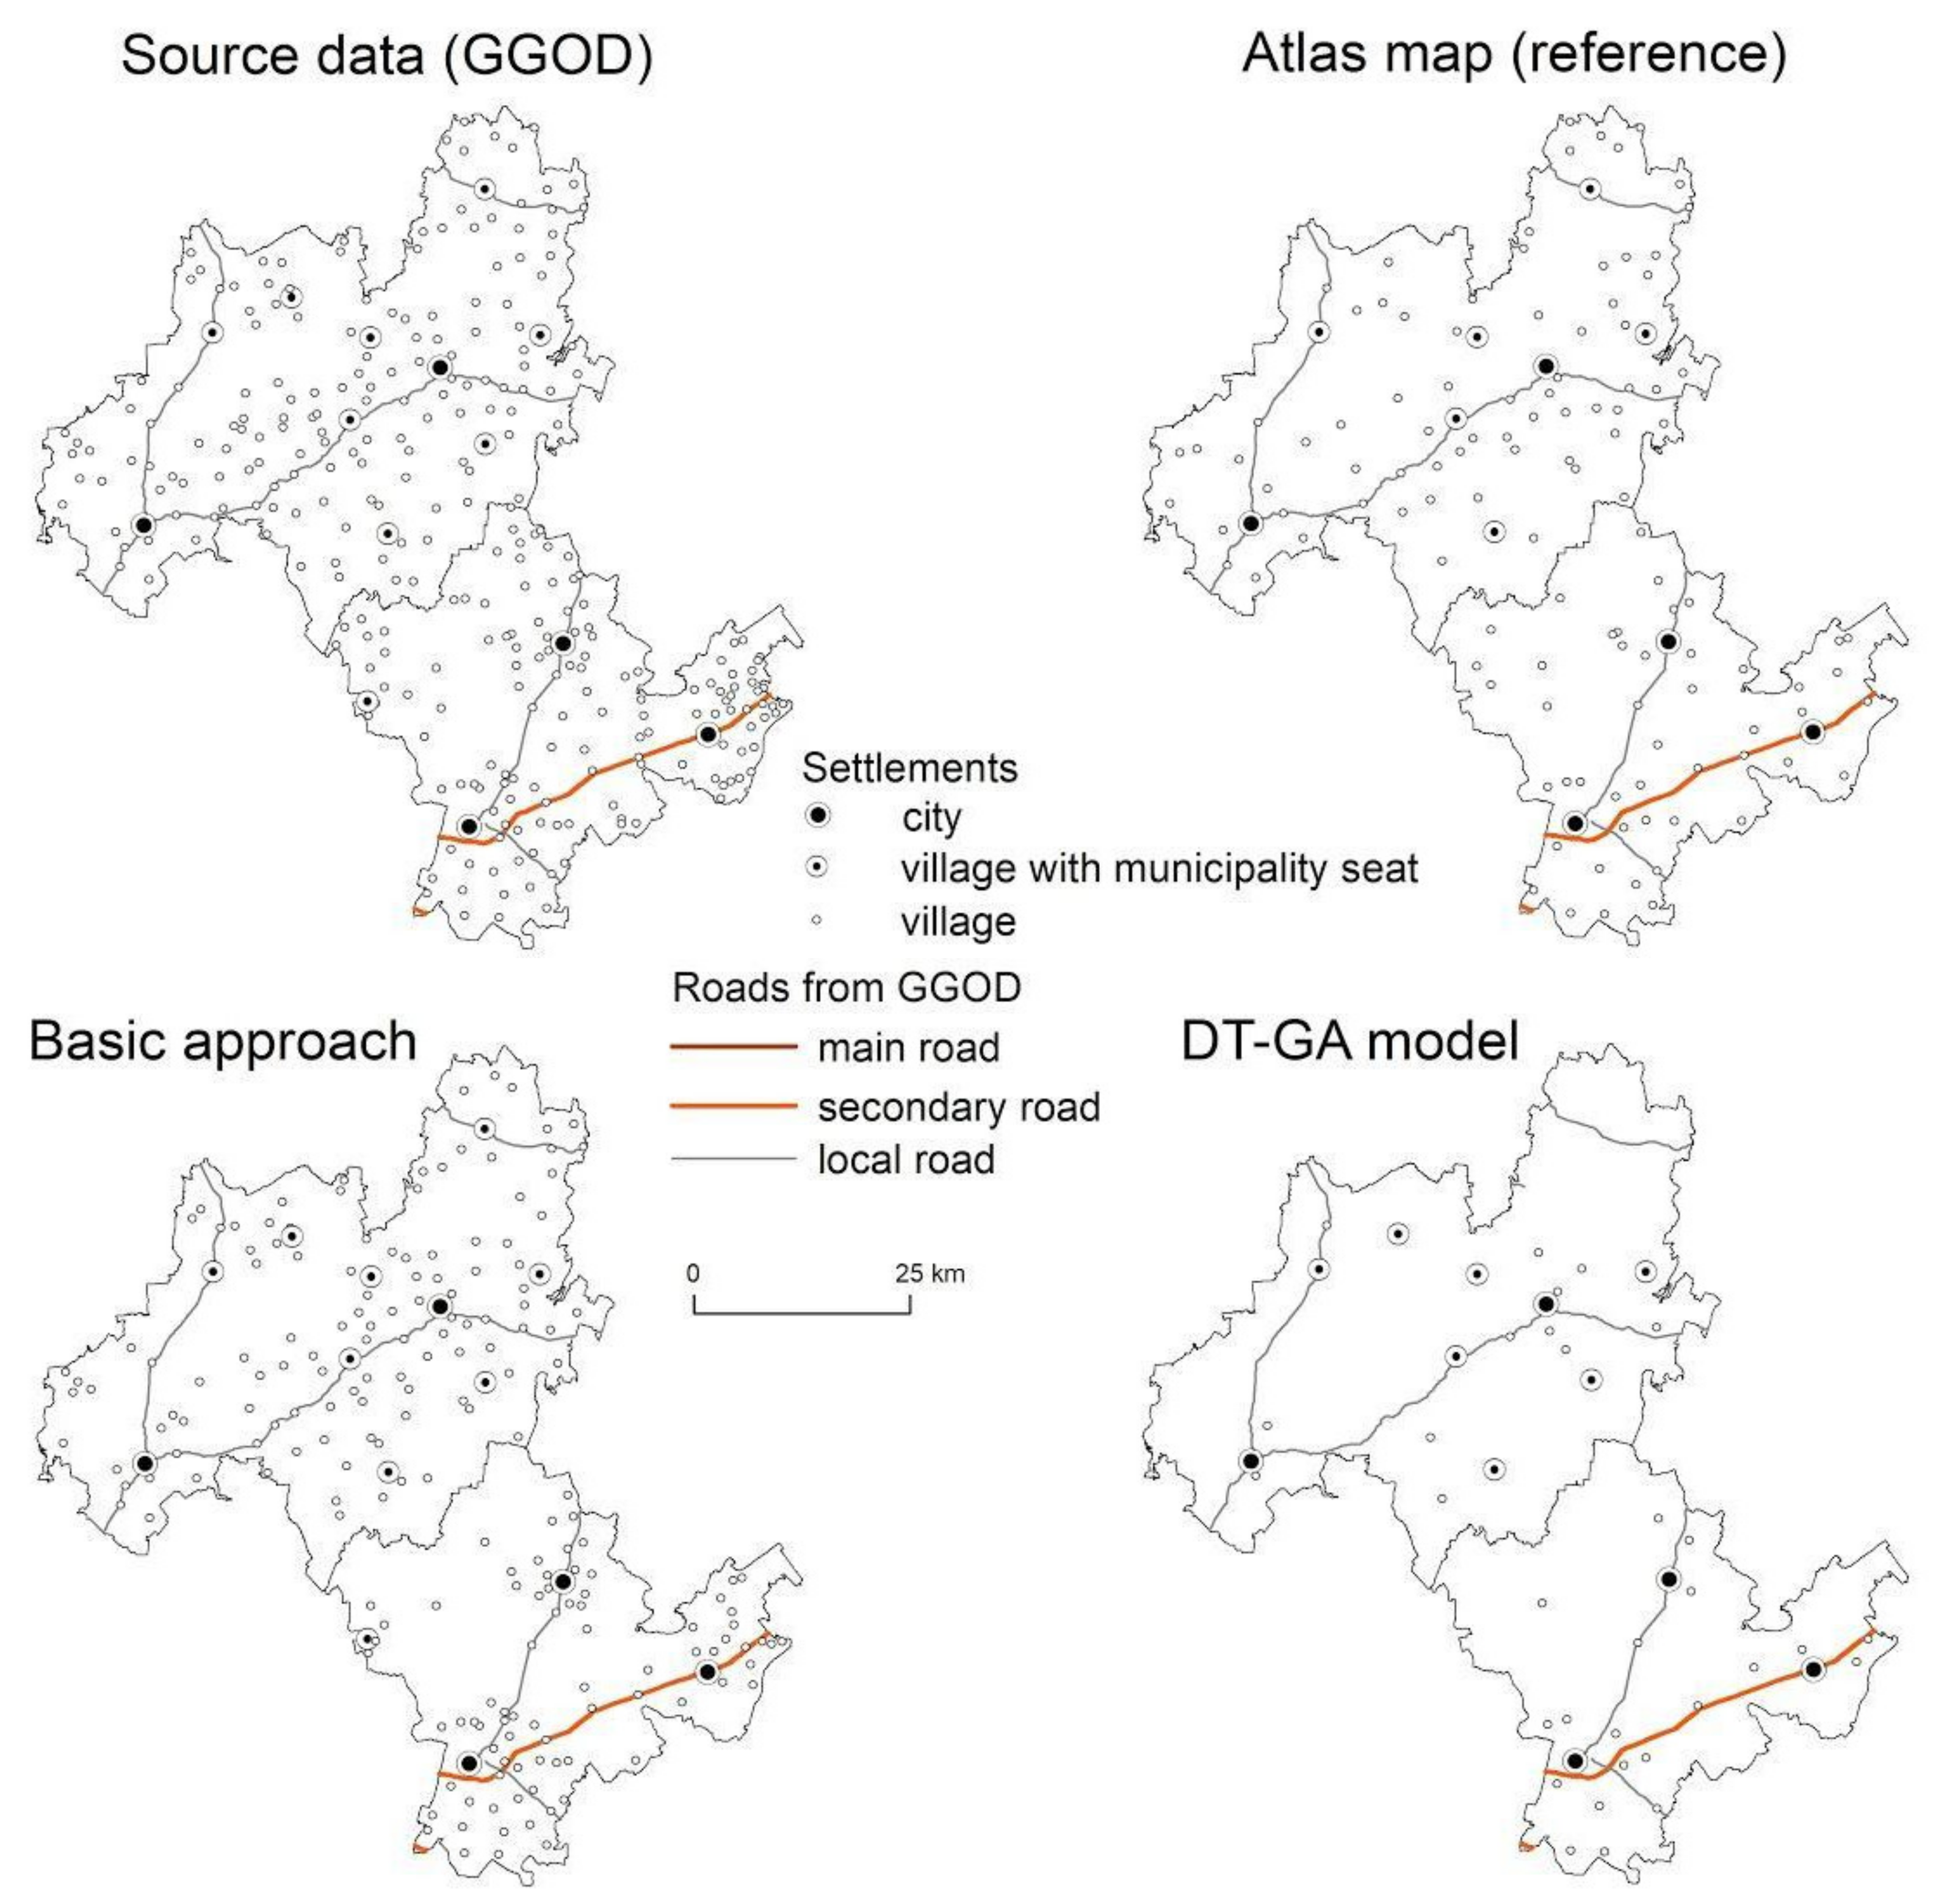
The generalization rules contained in the regulation state that the selection algorithms are constant for all districts in Poland. There is one exception: for districts with a population density below 50 people per square kilometer, the algorithm parameters are different from those for more densely populated areas.
The first step, in the enhanced approach, was to create and verify a list of measurable attributes, named variables here, that are essential in the settlement selection for small scales. Then the use of ML-based models made it possible to assess the importance of the proposed variables by investigating their weights as well as the correlation between them. The source data was enriched with 33 additional variables and the settlement status (selected or omitted by a cartographer) acquired from the reference atlas map [34]. Out of 33 variables, 16 of them had earlier been considered by Karsznia and Weibel [33] and 17 were proposed in this research. Thus, this work extended the methodology proposed by Karsznia and Weibel [33]. The complete list of considered variables has been presented in Table 2. For variables calculation, ArcGIS v. 10.5 and Python 2.7.6 were used.
Considering a thorough set of variables makes it possible to take all settlement characteristics that can be decisive in the selection process into account. It also helps to take into account settlement characteristics that would be considered by an experienced cartographer during manual map generalization. To achieve this, we added variables concerning holistic settlement characteristics, including various settlement areas (residential, service, commercial and industrial), population density, settlement density, as well as variables concerning relations between settlements and other objects, important from the communications point of view, for instance, the number of crossings, number of airports and number of railways. For the density measures, we considered the density of settlements, calculated both in square and hexagonal grids to find more meaningful enumeration units. The size of the grid was assumed experimentally, in a way to highlight settlement density variations and taking into account the target scale.
However, in the case of ML, the number of variables should also be optimized for two reasons. Primarily, as more variable are included in the model, the process requires more training data. Secondly, one should also be aware that the information extracted from numeric variables could be redundant. Besides, referring to cartographic knowledge, variables have different levels of importance. Some variables—such as population or area—should be considered as a priority. Others—such as the number of roads crossing the settlement—are of secondary importance. To evaluate which variables could be omitted in future ML processes, an assessment of the correlation strength among the proposed variables was also conducted. As a final step, automatic selection models based on decision trees were built.
The classification models were implemented in RapidMiner 9.0, an open-source ML and data mining software, making use of two different ML algorithms: decision trees (DT) and decision trees with an optimized feature selection using a genetic algorithm (DT-GA).
The decision tree is a method of machine learning in which a tree represents the learned function. Although the decision tree is known for not being the best performing method, its strength lies in the fact that trees can also be re-represented as sets of if-then rules to improve human readability [36,37]. Decision trees classify features (in our case settlements) by sorting them down the tree from the root to the leaf node, which provides the classification of the feature. Each node in the tree specifies a test of some variable of the feature, and each branch descending from that node corresponds to one of the possible values for this variable. A settlement is classified by starting at the root node of the tree, testing the attribute specified by this node, then moving down the tree branch corresponding to the value of the attribute in the given example. This process is then repeated for the subtree rooted at the new node. The variable placed at the root of the tree is the most important one in the classification process. The decision is made based on the outcome of the terminal leaf.
To improve the classifier performance of decision trees, genetic algorithms can be applied. Following this, we used genetic algorithms to optimize the selection of input variables. The genetic algorithm is a learning method based on an analogy with biological evolution. It operates by iteratively updating a pool of hypotheses, called the population (in our case a set of settlement variables). On each iteration, all members of the population are evaluated according to the fitness function. A new population is then generated by probabilistically selecting the fittest individuals from the current population. Some of these selected individuals are carried forward into the next generation population intact, and others are used as the basis for creating new offspring individuals by applying genetic operations such as crossover and mutation [36].
To build classification models, we used all settlements as input data and 10-fold cross-validation to iteratively split the input data into a training and a testing subprocess. In 10-fold cross-validation the input data is partitioned into ten subsets of equal size. Of the ten subsets, a single subset is retained as the testing data set, and the remaining subsets are used as the training data set. The cross-validation process is then repeated ten times, with each of the subsets used exactly once as the testing data. The results from the iterations can then be averaged (or otherwise combined) to produce a single estimation [38,39].
In both approaches, the settlement status from the atlas map, stating if the settlement was selected or omitted during manual map generalization by experienced cartographer, was taken as a reference for the evaluation.

3. Results

As a result of the presented research, the automatic models of settlement selection from 1:250,000 to 1:500,000 scale for all 16 districts, and of districts split into four groups, were built. The accuracy of the selection and its visual correctness were compared to the results obtained from the basic approach and to the settlement status taken from the atlas map (Table 3).
In Table 3 the best performing method has been bolded and the difference between the best performing method and the basic approach has been stated. In this paper, we decided to look closer at the results, both the decision trees and the maps for all considered district groups. Group 1 represents districts with high population density and high settlement density, while group 4 contains districts with very low population density and low settlement density, group 2 and 3 concern medium and low population and settlement density. In the presented maps, the original road network from the GGOD database was used, without generalization, as we focused exclusively on settlement selection in this paper.
The accuracy of the selection was higher for machine learning with DT-GA, therefore these results were visually compared to the atlas map and the results of the basic approach. Regarding the district group 1, presented in Figure 3 and Figure 4, the accuracy of the basic approach was 71.62%, while the accuracy based on ML equaled 78.02% for DT-GA model. For district group 2, the results were significantly better in the ML approach (77.26% for DT model and 80.90% for DT-GA respectively; Figure 5 and Figure 6) than in the basic approach (71.02%). Based on both the measured accuracy as well as the visual inspection (Figure 5) we could see that the result achieved in the enhanced approach was closer to the atlas map than the results of the basic approach. In the case of district group 3, the percentage accuracy of the selection was not significantly greater, namely in the basic approach it equaled 84.39%, while in ML models it equaled 84.57% in DT and 85.87% in DT-GA respectively (Figure 7 and Figure 8). However, a visual assessment of the density of settlements allowed us to state that the selection using ML gave results more similar to the atlas map (Figure 7). For the group 4 district, presented in Figure 9 and Figure 10, the accuracy was the highest out of all district groups. For the basic approach, it equaled 68.39%, while for the enhanced approach it equaled 80.23% for the DT model and 81.98% for DT-GA. The selection accuracy improved by up to several percent compared to the basic approach in all tested ML models, for all evaluated district groups (Table 3). While the selection in the basic approach was the same for all areas, in the extended approach a decision tree for each district group was developed separately, following the approach of Karsznia and Weibel [33], to consider different settlement characteristics.
The RapidMiner software allows the correlation between all attributes (variables) to be calculated and it can produce a weights vector based on these correlations. Correlation is a statistical technique that can show whether, and how strongly, pairs of attributes are related. A positive value for the correlation implies a positive association. In this case, the strength of the degree of the correlation is important, whether it is positive or negative. The correlation between proposed variables was calculated for all four groups and presented in Table 4.
One of the outcomes of the learning method based on DT-GA for all four groups was the normalized weights of settlement attributes presented in Table 5. Based on this model, the most relevant attributes of the given data set were selected, which offered an opportunity to develop a more effective selection algorithm.

4. Discussion

The results obtained confirmed the assumptions of the current cartographic knowledge that it was crucial to take both thematic (attributes) and spatial variables into account.
Looking at the decision tree developed for the group 1 district, we saw that the first step was to check the administrative area of the settlement (Figure 4). Just one attribute appearing on the decision tree has been mentioned in the regulation. The other four decision steps are made based on new variables, considering settlement areas, settlement density as well as settlement function. While we looked at the map presenting the selection results for group 1, we noted that the density of the settlement network was better preserved on the map designed using ML than in the basic approach. Still, there were areas not dense enough (e.g., the north-western part of the district group). ML algorithm maintained some settlements omitted by the cartographer, for instance, the ones located near bigger cities (Figure 3).
In the case of the decision trees for groups 2 and 3 (Figure 6 and Figure 8) the area of settlement, namely residential area, for district group 2 and built-up area, for district group 3, constituted the leading criteria. Both decision trees were not very complex, they consisted of five for group 2 and four for group 3 decisive steps. On both decision trees, the newly introduced variables played an important role in the selection process (Figure 6, Figure 8).
The decision tree developed for district group 4 (Figure 10) was more complex than for the other considered district groups. It consisted of nine decisive steps. In the case of district groups 1 and 4, the area was the most important variable—administrative or built-up. Then, the importance of the settlement was assessed by the number of inhabitants (decision tree for group 1, Figure 4) or the sacral function (decision tree for group 4, Figure 10). The next steps in the decision-making process only refined the criteria and aimed to increase the accuracy of the selection. For both district groups, the variable concerning the settlement density, namely the settlement density in hexagons, appeared on the decision trees (Figure 4 and Figure 10). The importance of this variable as the one that models the overall settlement network density was especially evident in the case of district group 4 (Figure 10), where the machine learning result was closer to the reference map in terms of the settlement density than the result coming from the basic approach. The result from the basic approach for this group presented a settlement network that was too dense.

4.1. Which Variables Are Essential in Settlement Selection for Small-Scale Maps?

The most important variable, as was verified in the ML process, was the Voronoi diagram area (Table 5). This variable provided information about the density of the settlement network and the distance to the nearest neighbors. The larger the area, the higher the likelihood of choosing a settlement and showing it on the map. Not surprisingly, the number of inhabitants (population) of the settlement was indicated as the second most important variable. Cartographers had also emphasized the importance of this in previous studies. Further variables were the geometrical properties of the network, such as settlements and population density in various enumeration units (for instance population density in residential areas for district groups 2 and 3; Figure 6 and Figure 8). Settlements’ functions appeared as decisive variables for district group 4 close to the root of the tree (sacral function), while for district group 1 the commercial function appeared close to the final decision at one of the final leaves of the tree. This means that the functions might be of different importance for different settlement characteristics. In very low populated districts, containing a small number of settlements, the presence of a sacral object like a church could make a particular settlement more important. While in highly populated areas the commercial function of the settlement could be of importance as shown in the case of district group 1. The sacral function, measured by the presence of a church or monastery, was not correlated with the population, and significantly affected the importance of the settlement, which is why it appeared on the roots of a decision tree (Figure 10).

4.2. Is There a Correlation between Proposed Variables?

The evaluation has shown strong correlations of variables that are interrelated (e.g., the presence of industrial facilities and the industrial land area). The strongest correlating variables were the commercial function, built-up area, industrial function and the number of inhabitants. The least-correlated features were the area of Voronoi diagrams, the presence of the airport and the number of roads crossing the settlement. This shows the importance of the variables related to the density of the settlement network and the presence of special objects, like airports, in the selection process (Figure 11).
The thematic variables of the settlement proved to be the most correlated (Table 4, Figure 11). This is related to the lack of specialization of the settlements and their multidirectional development—in terms of the function and area type. Attributes of the spatial distribution of the settlement were not highly correlated with other features. This proves their irreplaceability in the selection process and the need to take the geometrical properties of the settlement network into account. Settlement functions were highly correlated with each other and with the number of inhabitants. This is logical and confirms the fact that settlements developed multidirectionally, and settlements with a strong specialization were rare.
The issue of settlement selection for small-scale maps is more complex than previous research indicates. Future research, therefore, should focus on looking at the variables of the settlements in the context of bigger and more diverse data sets. The conducted study opened up interesting research questions for future studies, namely:
  • How many settlement variables will be optimal for efficient machine learning?
  • Which variables are essential in the settlement selection process?
  • Will extending the data sample influence machine learning results?
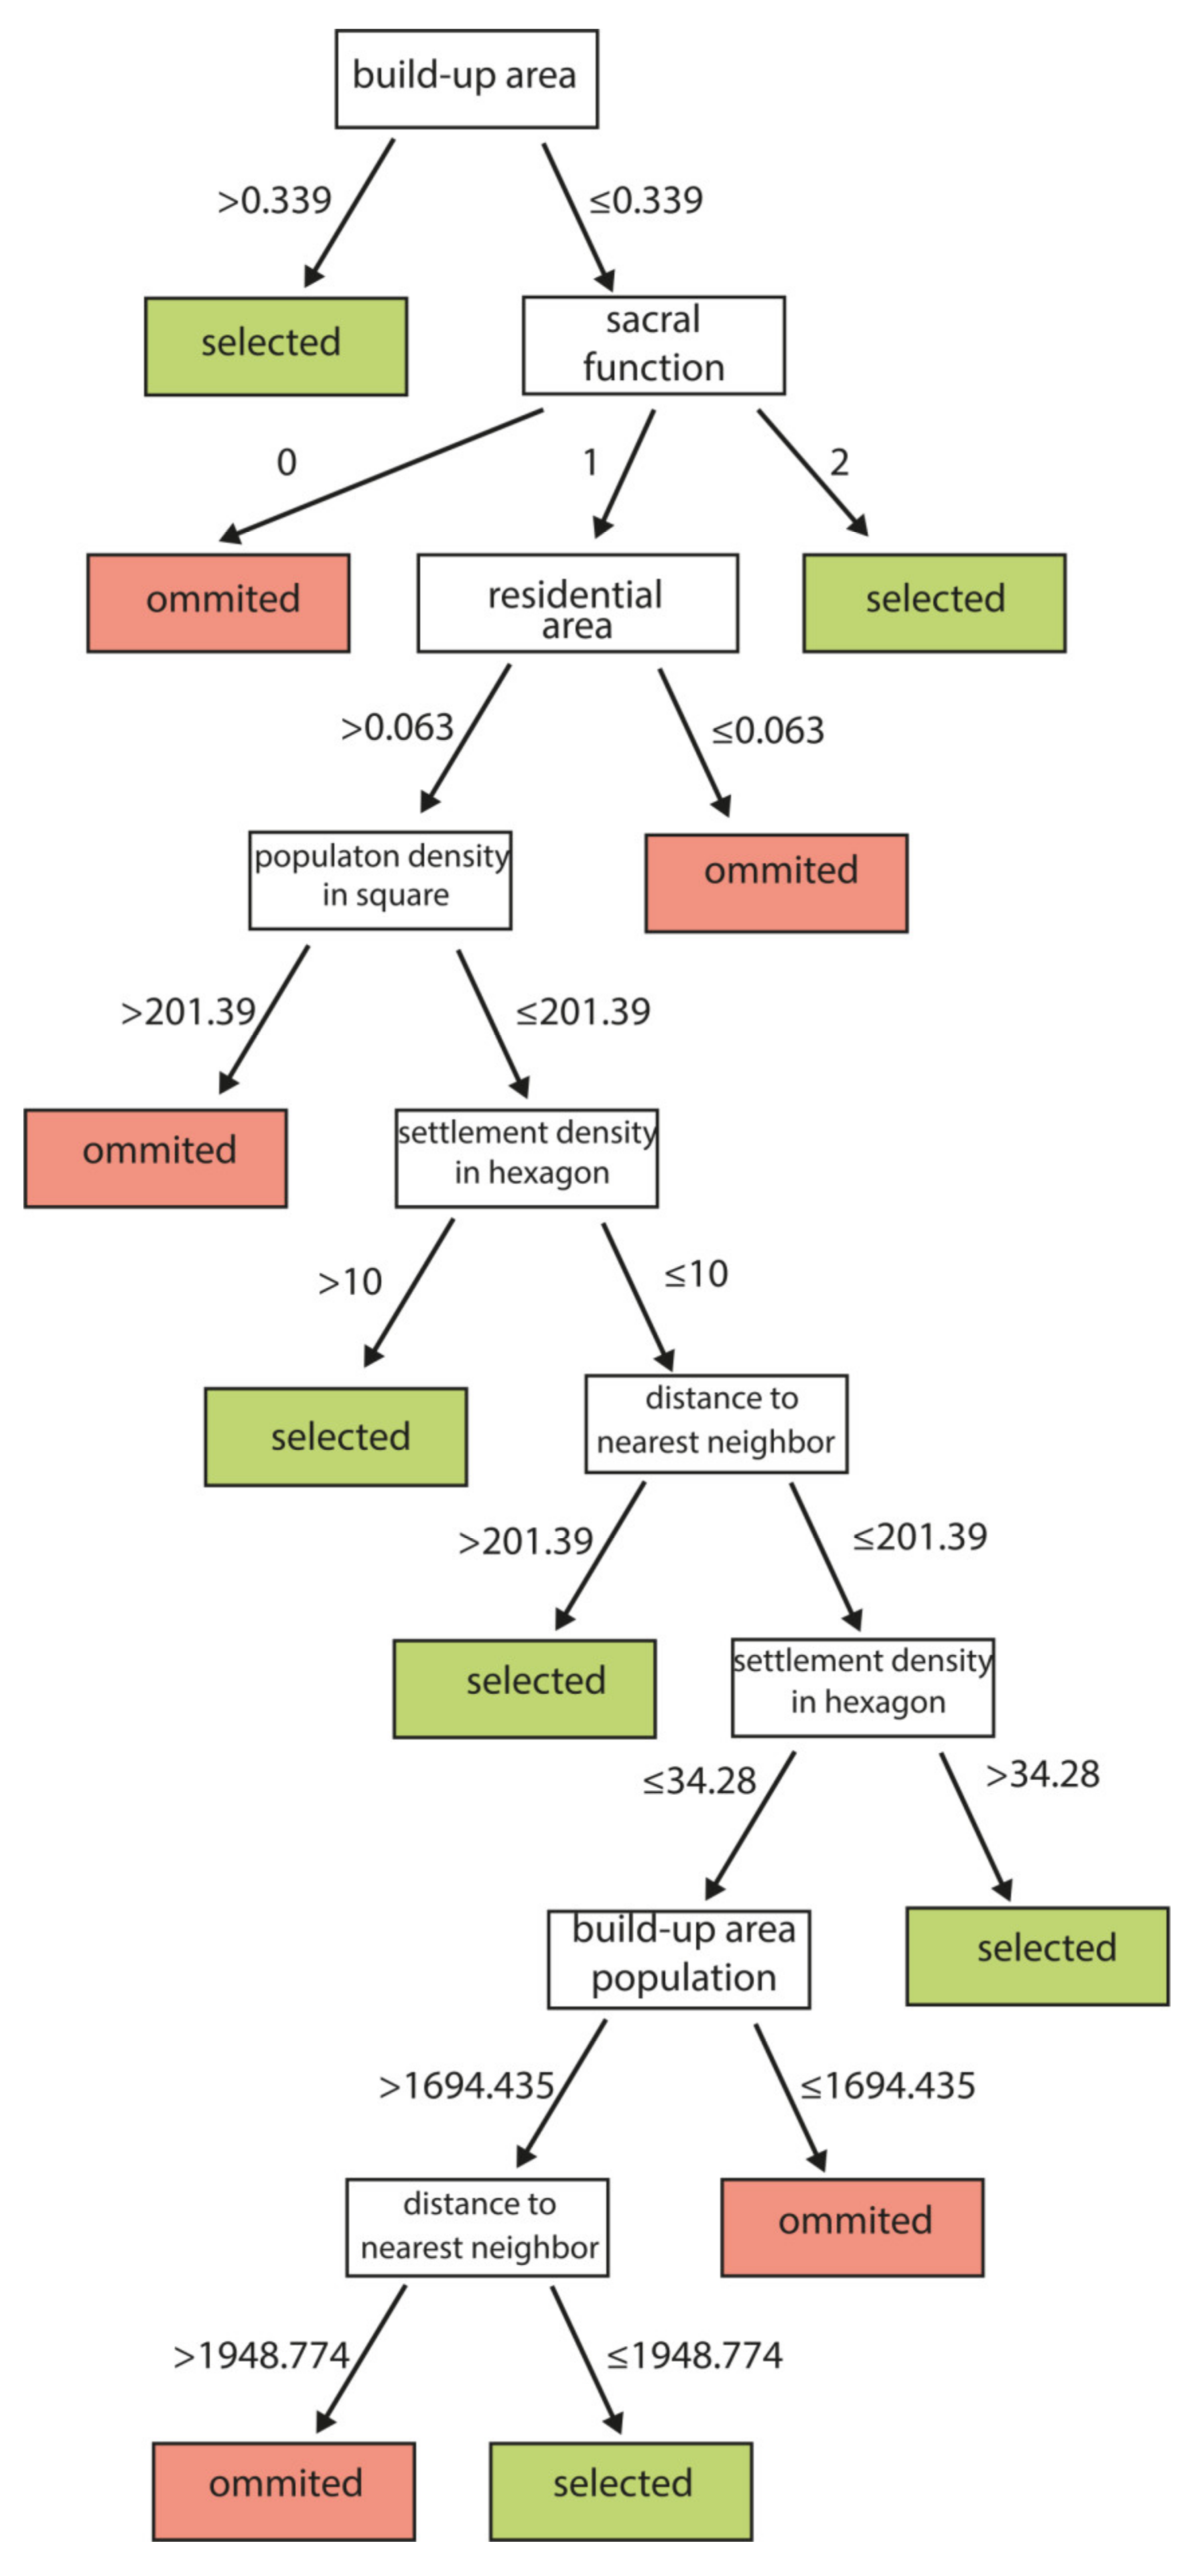
Based on the weights and correlation of proposed variables, which show their relevance with respect to the label attribute that indicates the status of the settlement (selected or omitted) taken from the reference map, we might consider omitting certain variables of the settlement in the selection process. The example variables we considered could be omitted in future research were as follows: the number of at least district rank roads crossing the settlement border, the total number of communication nodes within the settlement area, population density in residential areas or administrative function. We could consider omitting them as they did not appear on the decision trees and they did not have high weight values. However, since it was planned to expand the research area (from 16 to 89 districts), for this paper, all variables remained as we only wanted to check their importance. However, a further interesting finding of this research is that the most important variables of the settlement, from the point of correlations analysis results, were:
  • − Population;
  • − Sacral function;
  • − Distance to the nearest neighborhood;
  • − Built-up area;
  • − Density of settlement calculated in a grid.

5. Conclusions

The study aimed to propose new variables to fill the knowledge gap in the selection algorithms for small-scale maps. The approach, assuming data enrichment and ML, was extended to include more significant and holistic variables as well as the variable correlation analysis. The ML models built in four groups of districts showed that different variables were crucial for selection depending on the region. The obtained selection accuracy in each tested case was better than the selection in the basic approach. The fact that accuracy did not reach 100% means that further work on optimizing the settlement selection ML-based models is recommended. It should also be noted that the goal was not to achieve a complete reconstruction of the manual cartographer’s work, because the manual map design process is subjective and may differ according to the map designer engaged. The authors’ goal was to automatically achieve the results that would be optimal, acceptable from the cartographic point of view and possibly the nearest to the manual map design.
The solutions presented in the article are a further step in the direction towards full automation of the selection process for small-scale maps. Currently, the main focus is on large-scale maps, but it can be assumed that small-scale maps will be the next point of interest, and it is in this field that the research on essential selection variables seems to be the most prospective.

Author Contributions

Conceptualization: Izabela Karsznia and Karolina Sielicka, methodology: Izabela Karsznia and Karolina Sielicka, software: Izabela Karsznia and Karolina Sielicka, validation Izabela Karsznia and Karolina Sielicka, formal analysis: Izabela Karsznia and Karolina Sielicka, investigation: Izabela Karsznia and Karolina Sielicka, data curation: Izabela Karsznia and Karolina Sielicka, writing—original draft preparation: Izabela Karsznia and Karolina Sielicka, writing—review and editing: Izabela Karsznia and Karolina Sielicka, visualization: Izabela Karsznia and Karolina Sielicka; Supervision and project administration: Izabela Karsznia. All authors have read and agreed to the published version of the manuscript.

Funding

Open Access publication and final Native Speaker language correction has been supported by the Faculty of Geography and Regional Studies, University of Warsaw, Poland. Grant numbers SWIB 29/2020 and SWIB 49/2020.

Conflicts of Interest

The authors declare no conflict of interest.

References

  1. ICA, International Cartographic Association. Multilingual Dictionary of Technical Terms in Cartography; Franz Steiner Verlag: Wiesbaden, Germany, 1973. [Google Scholar]
  2. Stanislawski, L.V.; Buttenfield, B.P.; Bereuter, P.; Savino, S.; Brewer, C.A. Generalisation operators. In Abstracting Geographic Information in a Data Rich World; Burghardt, D., Duchêne, C., Mackaness, W., Eds.; Springer: Cham, Switzerland, 2014; pp. 157–195. [Google Scholar]
  3. Richardson, D.E.; Muller, J.-C. Rule selection for small-scale map generalization. In Map Generalization: Making Rules for Knowledge Representation; Buttenfield, B.P., McMaster, R.B., Eds.; Longman: London, UK, 1991; pp. 136–149. [Google Scholar]
  4. Stoter, J.; van Altena, V.; Post, M.; Burghardt, D.; Duchêne, C. Automated generalisation within NMAs in 2016. In Proceedings of the The International Archives of the Photogrammetry, Remote Sensing and Spatial Information Sciences, XLI-B4, XXIII ISPRS Congress, Prague, Czech Republic, 12–19 July 2016. [Google Scholar]
  5. Stoter, J.; Van Smaalen, J.; Bakker, N.; Hardy, P. Specifying map requirements for automated generalization of topographic data. Cartogr. J. 2009, 46, 214–227. [Google Scholar] [CrossRef]
  6. Stoter, J.; Post, M.; van Altena, V.; Nijhuis, R.; Bruns, B. Fully automated generalization of a 1:50k map from 1:10k data. Cartogr. Geogr. Inf. Sci. 2014, 41, 1–13. [Google Scholar] [CrossRef]
  7. Regnauld, N.G. Data Quality. In Proceedings of the International Archives of the Photogrammetry, Remote Sensing and Spatial Information Sciences, XL-3/W3, La Grande Motte, France, 28 September–3 October 2015; pp. 91–94. [Google Scholar]
  8. Burghardt, D.; Schmid, S.; Duchêne, C.; Stoter, J.; Baella, B.; Regnauld, N.; Touya, G. Methodologies for evaluation of generalised data derived with commercial available generalisation systems. In Proceedings of the ICA Workshop on Generalization and Multiple Representation, Montpellier, France, 20–21 June 2008. [Google Scholar]
  9. Chaundhry, O.Z.; Mackaness, W.A. Automatic identification of urban settlement boundaries for multiple representation databases. Comput. Environ. Urban Syst. 2008, 32, 95–109. [Google Scholar] [CrossRef]
  10. Karsznia, I.; Sielicka, K. Exploring essential variables in the settlement selection for small-scale maps using machine learning. Abstr. Int. Cartogr. Assoc. 2019, 1, 162. [Google Scholar] [CrossRef]
  11. Topfer, F.; Pillewizer, W. The Principles of Selection. Cartogr. J. 1966, 3, 10–16. [Google Scholar] [CrossRef]
  12. Kadmon, N. Automated selection of settlements in map generation. Cartogr. J. 1972, 9, 93–98. [Google Scholar] [CrossRef]
  13. Sirko, M. Teoretyczne i metodyczne aspekty obiektywizacji doboru osiedli na mapach [Theoretical and methodical aspects of objectifying the selection of settlements on the maps]. In Rozprawy Wydziału Biologii i Nauk o Ziemi Uniwersytetu Marii Curie-Skłodowskiej, Rozprawy Habilitacyjne; Wydawnictwo Uniwersytetu Marii Curie-Skłodowskiej: Lublin, Poland, 1988. [Google Scholar]
  14. Van Kreveld, M.; van Oostrum, R.; Snoeyink, J. Efficient settlement selection for interactive display. In Proceedings of the ACSM/ASPRS Annual Convention & Exposition, Seattle, WA, USA, 7–10 April 1997; Volume 5, pp. 287–296. [Google Scholar]
  15. Pietkiewicz, F. La carte de la Pologne au millionieme de L’Institut Geographique Militare; Comptes Rondus du Congres, Travaux de la Section I; Institut Geographique Militare: Warszawa, Poland, 1935; pp. 286–289. [Google Scholar]
  16. Rado, S. Az 1:2 500 000 meretaranyu vilag terkep. Geodezia es Kartografia 1965, 17, 166–173. [Google Scholar]
  17. Ostrowski, J. Analiza doboru osiedli na Mapie Świata 1:2 500 000. Polski Przegląd Kartograficzny 1970, 2, 1–14. [Google Scholar]
  18. Baranowski, M.; Grygorenko, W. Próba obiektywnego doboru osiedli na mapie z zastosowaniem maszyny cyfrowej. Polski Przegląd Kartograficzny 1974, 6, 149–155. [Google Scholar]
  19. Ratajski, L. Commission V of the ICA: The Tasks It Faces. Int. Yearb. Cartogr. 1974, 14, 140–144. [Google Scholar]
  20. Flewelling, D.M.; Egenhofer, M.J. Formalizing importance: Parameters for settlement selection in a geographic database. Proceedings Auto-Carto XI. 1993, pp. 167–175. Available online: https://cartogis.org/docs/proceedings/archive/auto-carto-11/pdf/formalizing-importance-parameters-for-settlement-selection-from-a-geographic-database.pdf (accessed on 2 March 2020).
  21. Batty, M. Hierarchy in cities and city systems. In Hierarchy in Natural and Social Sciences; Pumain, D., Ed.; Springer: Amsterdam, The Netherlands, 2006; pp. 143–168. [Google Scholar]
  22. Carol, H. The hierarchy of central functions within the city. Ann. Assoc. Am. Geogr. 1960, 50, 419–438. [Google Scholar] [CrossRef]
  23. Smith, R.H.T. Method and purpose in functional town classification. Ann. Assoc. Am. Geogr. 1965, 55, 539–548. [Google Scholar] [CrossRef]
  24. Christaller, W. Central Places in Southern Germany; Prentice-Hall: New York, NY, USA, 1933. [Google Scholar]
  25. Dixon, O.M. The selection of towns and other features on Atlas maps of Nigeria. Cartogr. J. 1967, 4, 16–23. [Google Scholar] [CrossRef]
  26. Weibel, R.; Keller, S.; Reichenbacher, T. Overcoming the knowledge acquisition bottleneck in map generalization: The role of interactive systems and computational intelligence. In Lecture Notes in Computer Science; Proceedings COSIT; Springer: Berlin, Germany, 1995; Volume 988, pp. 139–156. [Google Scholar]
  27. Mustière, S. GALBE: Adaptive Generalisation. The need for an Adaptive Process for Automated Generalisation, an Example on Roads. In Proceedings of the 1st GIS’PlaNet Conference, Lisbonne, Portugal, 22 July 1998. [Google Scholar]
  28. Sester, M. Knowledge acquisition for the automatic interpretation of spatial data. Int. J. Geogr. Inf. Sci. 2000, 14, 1–24. [Google Scholar] [CrossRef]
  29. Lagrange, F.; Landras, B.; Mustiere, S. Machine learning techniques for determining parameters of cartographic generalisation algorithms. Int. Arch. Photogramm. Remote Sens. 2000, 33, 718–725. [Google Scholar]
  30. Balboa, G.J.L.; López, A.F.J. Generalization-oriented Road Line Classification by Means of an Artificial Neural Network. Geoinformatica 2008, 12, 289–312. [Google Scholar] [CrossRef]
  31. Sester, M.; Feng, Y.; Thiemann, F. Building generalization using deep learning. International Archives of the Photogrammetry. Remote Sens. Spat. Inf. Sci. 2018, XLII-4, 565–572. [Google Scholar]
  32. Feng, Y.; Thiemann, F.; Sester, M. Learning Cartographic Building Generalization with Deep Convolutional Neural Network. Int. J. Geo-Inf. 2019, 8, 258. [Google Scholar] [CrossRef] [Green Version]
  33. Karsznia, I.; Weibel, R. Improving Settlement Selection for Small-scale Maps Using Data Enrichment and Machine Learning. Cartogr. Geogr. Inf. Sci. 2018, 45, 111–127. [Google Scholar] [CrossRef] [Green Version]
  34. Polskie Przedsiębiorstwo Wydawnictw Kartograficznych im. Eugeniusza Romera S.A. In Atlas Rzeczypospolitej Polskiej [Atlas of Republic of Poland]; Główny Geodeta Kraju: Warsaw, Poland, 1993; pp. 1993–1997.
  35. Regulation of the Minister of Interior and Administration of 17 November 2011 on the topographical objects database, the general geographical objects database and standard cartographic elaborations. 2011. Available online: http://prawo.sejm.gov.pl/isap.nsf/DocDetails.xsp?id=WDU20112791642 (accessed on 4 March 2020).
  36. Mitchell, T.M. Machine Learning; McGraw-Hill: New York, NY, USA, 1997. [Google Scholar]
  37. Alpaydin, E. Introduction to Machine Learning; The MIT Press: Cambridge, MA, USA, 2010. [Google Scholar]
  38. Murphy, K.P. Machine Learning. A Probabilistic Perspective; The MIT Press: Cambridge, MA, USA, 2012. [Google Scholar]
  39. Rapid Miner Reference Manual. Available online: https://docs.rapidminer.com/latest/studio/operators/rapidminer-studio-operator-reference.pdf (accessed on 19 January 2020).
Figure 1. Location of research areas (source: own elaboration based on GGOD data).
Ijgi 09 00230 g001
Figure 2. Research scheme.
Ijgi 09 00230 g002
Figure 3. Maps of Brzeski, Tarnowski and Dębicki districts; group 1.
Ijgi 09 00230 g003
Figure 4. Decision tree for group 1, result of machine learning using decision trees with an optimized feature selection using a genetic algorithm (DT-GA) model.
Ijgi 09 00230 g004
Figure 5. Maps of Krotoszyński, Ostrowski, Milicki and Złotoryjski districts; group 2.
Ijgi 09 00230 g005
Figure 6. Decision tree for group 2, result of machine learning using the DT-GA model.
Ijgi 09 00230 g006
Figure 7. Maps of Łowicki, Skierniewicki and Żyrardowski districts; group 3.
Ijgi 09 00230 g007
Figure 8. Decision tree for group 3, result of machine learning using the DT-GA model.
Ijgi 09 00230 g008
Figure 9. Maps of Bytowski and Chojnicki districts; group 4.
Ijgi 09 00230 g009
Figure 10. Decision tree for group 4, result of machine learning using the DT-GA model.
Ijgi 09 00230 g010
Figure 11. Variables’ correlation strength. Calculated for all four district groups.
Ijgi 09 00230 g011
Table 1. Characteristics of district groups.
Group no.CharacteristicDistricts
1.High population density area—151.84 people per km2Brzeski, Dębicki, Rzeszowski, Tarnowski
2.Medium population density area—101.36 people per km2Krotoszyński, Ostrowski, Milicki, Złotoryjski
3.Low population density area—85.04 people per km2Łowicki, Skierniewicki, Żyrardowski
4.Very low population density area—41.98 people per km2Bytowski, Chojnicki, Gołdapski, Olecki, Suwalski
Table 2. Variables with their description. The variables proposed by Karsznia and Weibel [33] have been marked with asterisks.
VariableVariable Description
Administrative area of the settlementIn square kilometers
Built-up area of the settlementIn square kilometers
Residential area of the settlementIn square kilometers
Service and commercial area of the settlementIn square kilometers
Industrial and storage area of the settlementIn square kilometers
Population density in residential areasPeople per square kilometer
Number of railway stops within settlement areaCalculated using the basic ArcGIS and Python functionality
Number of airports within settlement areaCalculated using the basic ArcGIS and Python functionality
Number of ports within settlement areaCalculated using the basic ArcGIS and Python functionality
Number of at least district rank roads crossing the settlement borderNumber of roads (national, voivodeship and district) crossing the administrative borders of the settlement
Total number of communication nodes within settlement areaCalculated using the basic ArcGIS and Python functionality
Number of crossings of higher category roads within the settlement areaNumber of national, voivodeship and district intersections
Density of settlement in the districtNumber of settlements per square kilometer
Density of settlement calculated in a rectangular gridNumber of settlements per 5 km × 5 km grid
Density of settlement calculated in a hexagonal gridNumber of settlements per 25 km2 grid
Population density calculated in a rectangular gridPopulation density per grid 5 km × 5 km
Population density calculated in a hexagonal gridPopulation density per 25 km2 grid
Population density in districts *People per square kilometer in districts
Population *Number of inhabitants
Administrative status *Information concerning the seat of administrative office
Settlement type *Information concerning settlement type, for instance: city, village, colony, etc.
Cultural function *Number of buildings fulfilling cultural function within the settlement administrative area
Educational function *Number of buildings fulfilling educational function within the settlement administrative area
Trading function *Number of buildings fulfilling trading function within the settlement administrative area
Industrial function *Number of buildings fulfilling industrial function within the settlement administrative area
Monumental function *Number of buildings fulfilling monumental function within the settlement administrative area
Sacral function *Number of buildings fulfilling sacral function within the settlement administrative area
Accommodation function *Number of buildings fulfilling accommodation function the within settlement administrative area
Communication and finance *Number of buildings fulfilling communication and finance function within the settlement administrative area
Health function *Number of buildings fulfilling health function within the settlement administrative area
Other functions *Number of buildings fulfilling functions not assigned to any other group, which might however be important for the selection process
Voronoi area *Area of the Voronoi diagram
Distance to nearest neighbor *Distance to the nearest settlement
Table 3. The selection accuracy for basic and enhanced approaches.
Basic ApproachEnhanced ApproachDifference *
DTDT-GA
Group 171.62%76.4% 78.02% +6.40
Group 271.02%77.26% 80.90% +9.88
Group 384.39%84.57% 85.87% +1.48
Group 468.39%80.23% 81.98% +13.59
* Between the best performing method and the basic approach.
Table 4. Correlation value between the most correlated settlement attributes. Calculated for all four district groups.
First AttributeSecond AttributeCorrelation
PopulationTrade function0.934
Health functionTrade function0.907
PopulationHealth function0.867
Commercial functionTrade function0.849
PopulationCommercial function0.844
Accommodation functionTrade function0.844
PopulationAccommodation function0.837
Health functionCommercial function0.811
Health functionAccommodation function0.799
Commercial functionAccommodation function0.743
Health functionSacral function0.707
Sacral functionTrade function0.707
Commercial functionSacral function0.703
Table 5. Normalized weights of settlement attributes, calculated using the DT-GA model. Calculated for all four district groups.
AttributeWeight
Area of Voronoi diagram1.0
Population0.952
Population density per district0.858
Population density in hexagons (100 km2)0.807
Population density in squares 10 km × 10 km0.756
Population density in squares 5 km × 5 km0.713
Population density in hexagons (25 km2)0.649
Administrative area0.593
Distance to the nearest neighbor0.498
Commercial area0.372
Number of settlements in hexagons (25 km2)0.29
Number of settlements in hexagons (100 km2)0.257
Number of settlements in squares 5 km × 5 km0.244
Industrial area0.227
Number of settlements in squares 10 km × 10 km0.217
Residential area0.033

