2.1. Transcriptome Analysis
In order to obtain the transcriptomes of the endangered Lycaenid butterflies
S. takanosis and
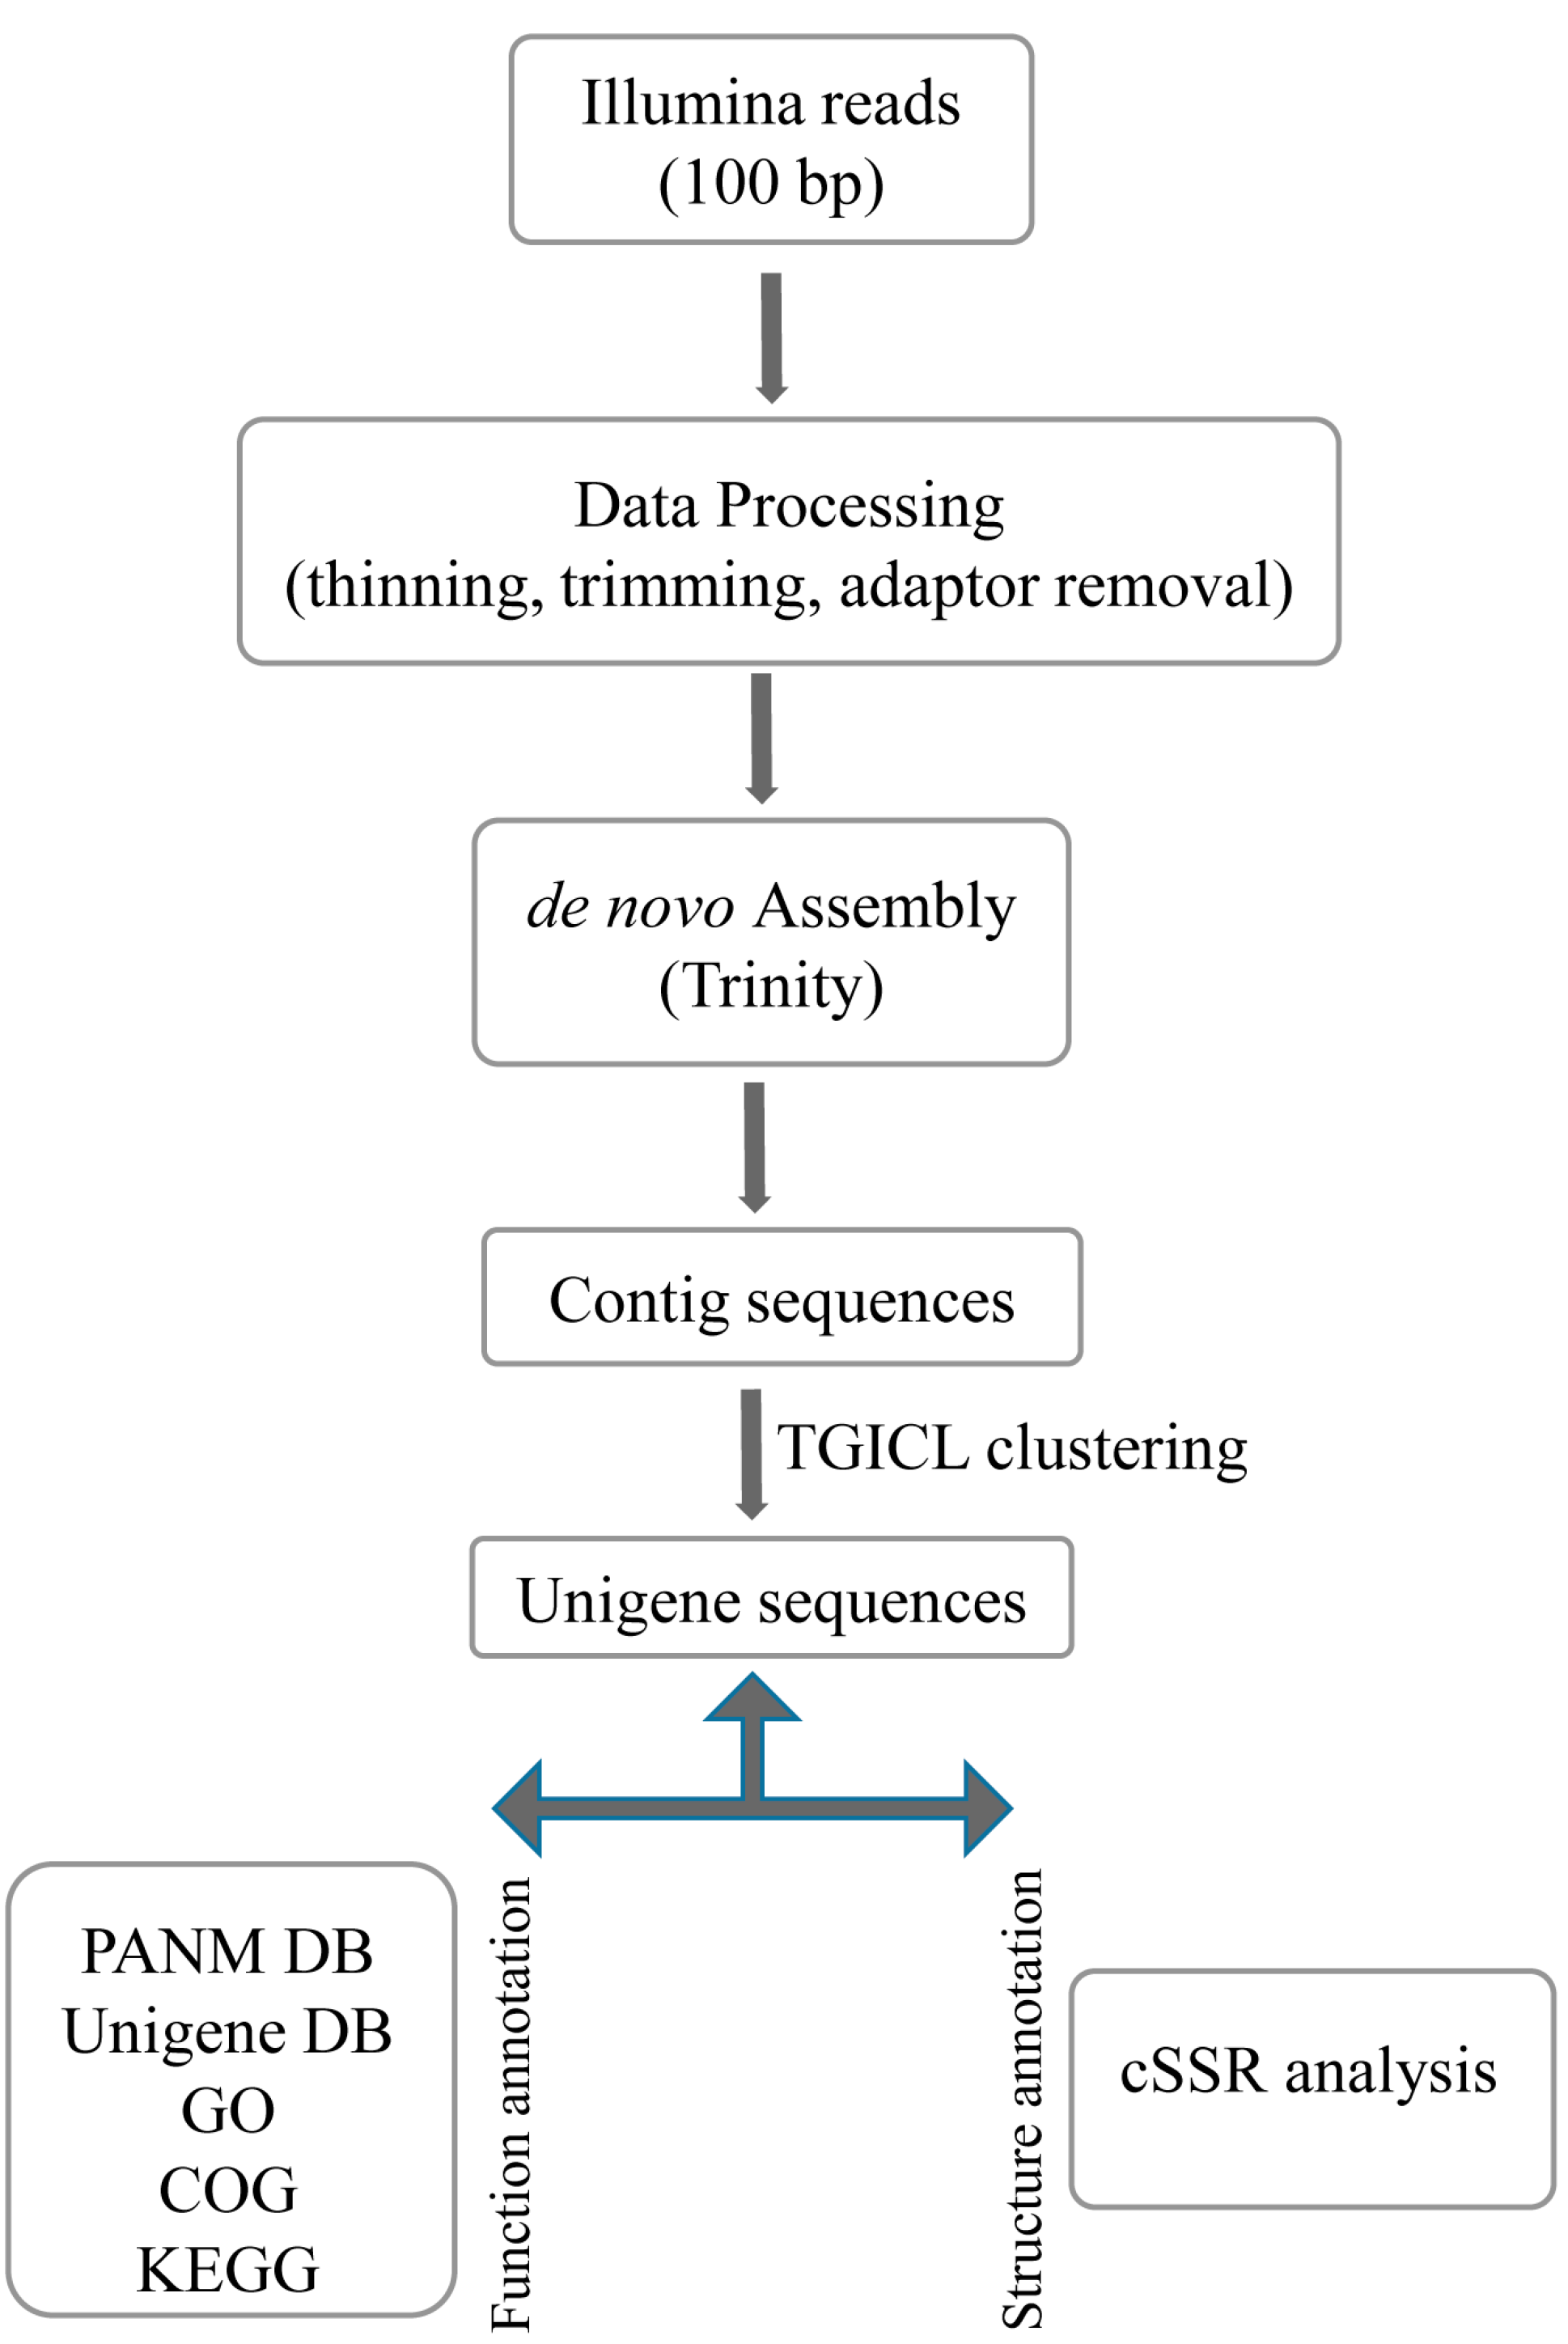
P. superans, a cDNA library was constructed from the RNA isolated from the whole body of adult insects and sequenced on the Illumina HiSeq 2500 NGS platform. The transcriptome assembly and analysis work-flow has been depicted in
Figure 1.
The Illumina HiSeq 2500 sequencing of
P. superans generated a total of 258,875,070 raw reads (32,618,258,820 bases) with a mean length of 126 bp. The filtering of reads based on quality parameters resulted in the discard of 0.32% of bases to get a paired-end profile of 32,514,410,974 bases with an average length of 125.6 bp. After stringent quality assessment, a total of 254,340,693 clean reads (Q
20 ~99% and percent of unknown nucleotide is 0%) were obtained, which represents 98.25% of the obtained raw reads. The mean length and the N50 length of the obtained clean reads were 124.3 bp and 126 bp, respectively, with GC% (or guanine-cytosine content) of 39.81%. In the case of
S. takanosis, the transcriptome generated a total of 249,312,792 raw reads (31,413,411,792 bases) with a mean length of 126 bp. Adapter trimming led to a discard of 0.35% of the total base pairs processed, which, after stringent quality assessment, generated a total of 245,110,582 clean reads (30,515,812,866 bases). The mean length, N50 length, and GC% of the obtained clean reads were 124.5, 126, and 41.96%, respectively. The summary of the read processing analysis based on quality parameters is shown in
Table S1. The sequence reads generated from the transcriptome sequencing of
P. superans and
S. takanosis have been submitted to GenBank Sequence Read Archive (SRA) at National Center for Biotechnology Information (NCBI) under accession numbers SRP063812 and SRP063813, respectively.
Figure 1.
Schematic work-flow followed for the transcriptome analysis of Lycaenid butterflies, Protantigius superans and Spindasis takanosis.
Figure 1.
Schematic work-flow followed for the transcriptome analysis of Lycaenid butterflies, Protantigius superans and Spindasis takanosis.
The processed high quality reads were assembled using the Trinity program which uses three sequential software modules, namely Inchworm, Chrysalis, and Butterfly, for
de novo transcriptome assembly [
24]. Trinity is an exclusive program for assembling transcript sequences from Illumina transcriptome data and scores over other
de novo transcriptome algorithms developed including SOAPdenovo-Trans [
25], Trans-ABySS [
26], and Oases [
27]. With Trinity, a total of 159,074 contigs were assembled for the
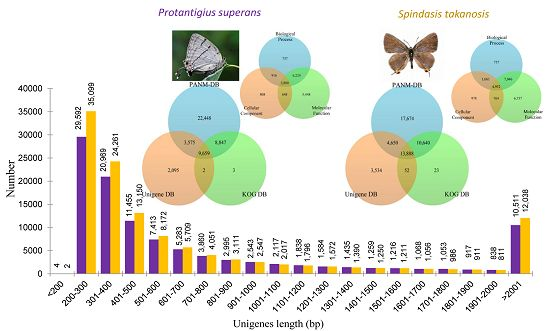
P. superans transcriptome, with N50 (contig length such that equal or longer contigs amount to half of the total assembly length) and mean length of 1220 bp and 746.3 bp, respectively. A significant proportion of the assembled contigs (39.28%) were ≥500 bp with the longest contig size of 15,152 bp. A total of 170,449 contigs were assembled for the
S. takanosis transcriptome, with N50 and mean length of 1372 bp and 786.4 bp, respectively. Out of the total assembled contigs, 66,844 contigs (39.21%) were ≥500 bp with the longest contig size of 16,820 bp. The size distribution of the assembled contigs for the
P. superans and
S. takanosis transcriptomes have been shown in
Figure 2A. It is evident that the proportion of short contigs and contigs over 1 kb were high in our datasets. Also, the contig N50 value was found higher in the Lycaenid butterfly transcriptome compared to N50s obtained from transcriptome assemblies of distinct insects [
28,
29,
30]. The contigs were finally clustered to a total of 107,950 unigenes with 89,022,313 bases for
P. superans and 121,140 unigenes with 100,232,710 bases for
S. takanosis. For
P. superans, the N50 and mean length of unigenes were 1452 and 824.7 bp, respectively, with a GC% of 38.46%. Among these unigenes, 29,596 (27.42%) had a size of no more than 300 bp, 54,518 (50.50%) were in the sizes of 301–1000 bp, 13,325 (12.34%) were of lengths in between 1001 and 2000 bp, and 10,511 (9.74%) were over 2000 bp. For
S. takanosis, the N50 and mean length of unigene sequences were 1537 and 827.4 bp, respectively, with a GC% of 38.68%. Among these unigenes, 35,101 (28.97%) had a size of ≤300 bp, 61,001 (50.36%) were in the size range of 301–1000 bp, 13,000 (10.73%) were of lengths 1001–2000 bp, and 12,038 (9.93%) were over 2000 bp. The size distribution of assembled unigenes for both the Lycaenid butterflies are shown in
Figure 2B. A summary of the
P. superans and
S. takanosis transcriptomes depicting the datasets obtained after the processing of raw reads, Trinity
de novo assembly, and TGIR Gene Indices Clustering Tool (TGICL) clustering are depicted in
Table 1. The transcriptome sequence and assembly efficiency was better in case of
S. takanosis as it resulted in greater number of transcripts from a lesser number of raw read sequences.
Table 1.
Summary of transcriptome assembly after Illumina HiSeq 2500 sequencing of Lycaenid butterflies Spindasis takanosis and Protantigius superans.
Table 1.
Summary of transcriptome assembly after Illumina HiSeq 2500 sequencing of Lycaenid butterflies Spindasis takanosis and Protantigius superans.
| Assembly Features | Spindasis takanosis | Protantigius superans |
|---|
| Raw Reads | | |
| Number of sequences | 249,312,792 | 258,875,070 |
| Number of bases | 31,413,411,792 | 32,618,258,820 |
| Mean length (bp) | 126 | 126 |
| Clean reads | | |
| Number of sequences | 245,110,582 | 254,340,693 |
| Number of bases | 30,515,812,866 | 31,607,701,940 |
| Mean length (bp) | 124.5 | 124.3 |
| N50 length (bp) | 126 | 126 |
| GC% | 41.96 | 39.81 |
| High-quality reads (%) | 98.31 (sequences), 97.14 (bases) | 98.25 (sequences), 96.90 (bases) |
| Number of reads discarded (%) | 1.69 (sequences), 2.86 (bases) | 1.75 (sequence), 3.1 (bases) |
| Contig information | | |
| Total number of contig | 170,449 | 159,074 |
| Number of bases | 134,036,728 | 118,721,203 |
| Mean length of contig (bp) | 786.4 | 746.3 |
| N50 length of contig (bp) | 1372 | 1220 |
| GC% of contig | 38.58 | 38.45 |
| Longest contig (bp) | 16,820 | 15,152 |
| No. of large contigs (≥500 bp) | 66,844 | 62,485 |
| Unigene information- | | |
| Total number of unigenes | 121,140 | 107,950 |
| Number of bases | 100,232,710 | 89,022,313 |
| Mean length of unigene (bp) | 827.4 | 824.7 |
| N50 length of unigene (bp) | 1537 | 1452 |
| GC% of unigene | 38.68 | 38.46 |
| Length ranges (bp) | 124–16,820 | 114–17,062 |
2.2. Sequence Annotation
The assembled unigenes of
P. superans and
S. takanosis were used as query sequences and blasted (BLASTX search;
E-value ≤ 1.0 ×10
−5) against various protein databases, including a locally curable Protostome DB (PANM-DB), Unigene and EuKaryotic Orthologous Groups (KOG) databases. Significant matches were found for the assembled unigenes with the subject sequences in PANM-DB with 44,529 (41.25%) and 46,852 (38.68%) unigenes of
P. superans and
S. takanosis recovering the BLAST results. Similarly, a total of 15,331 (14.2%) unigenes of
P. superans and 22,124 (18.26%) unigenes of
S. takanosis found homology to sequences in the Unigene database. Roughly, 18,511 (17.14%) and 24,603 (20.31%) unigenes of
P. superans and
S. takanosis show BLASTX hits in the KOG database. The sequence-based annotation of unigenes from the
P. superans and
S. takanosis transcriptomes are shown in
Table 2.
Figure 2.
Size distribution of contig (A); and unigenes (B) after assembly and clustering of the quality reads from the transcriptomes of P. superans and S. takanosis.
Figure 2.
Size distribution of contig (A); and unigenes (B) after assembly and clustering of the quality reads from the transcriptomes of P. superans and S. takanosis.
Table 2.
Sequence annotation of unigenes assembled from the Protantigius superans and Spindasis takanosis transcriptomes.
Table 2.
Sequence annotation of unigenes assembled from the Protantigius superans and Spindasis takanosis transcriptomes.
| Databases | All Annotated Transcripts | ≤300 bp | 300–1000 bp | ≥1000 bp |
|---|
| P. superans | S. takanosis | P. superans | S. takanosis | P. superans | S. takanosis | P. superans | S. takanosis |
|---|
| PANM-DB | 44,529 | 46,852 | 6272 | 7342 | 19,244 | 19,666 | 19,013 | 19,844 |
| UNIGENE | 15,331 | 22,124 | 1267 | 2751 | 5098 | 7848 | 8966 | 11,525 |
| KOG | 18,511 | 24,603 | 1273 | 2721 | 5399 | 7971 | 11,839 | 13,911 |
| GO | 18,661 | 22,275 | 1956 | 2705 | 6355 | 7566 | 10,350 | 12,004 |
| KEGG | 5259 | 6697 | 541 | 897 | 1615 | 2289 | 3103 | 3511 |
| ALL | 46,754 | 51,908 | 6739 | 8721 | 20,557 | 22,559 | 19,458 | 20,628 |
We found that a significant proportion of longer unigene sequences (≥1000 bp) are circumstantial in returning a higher proportion of BLAST hits against various protein databases as compared to short-read unigenes (≤300 bp). In the case of
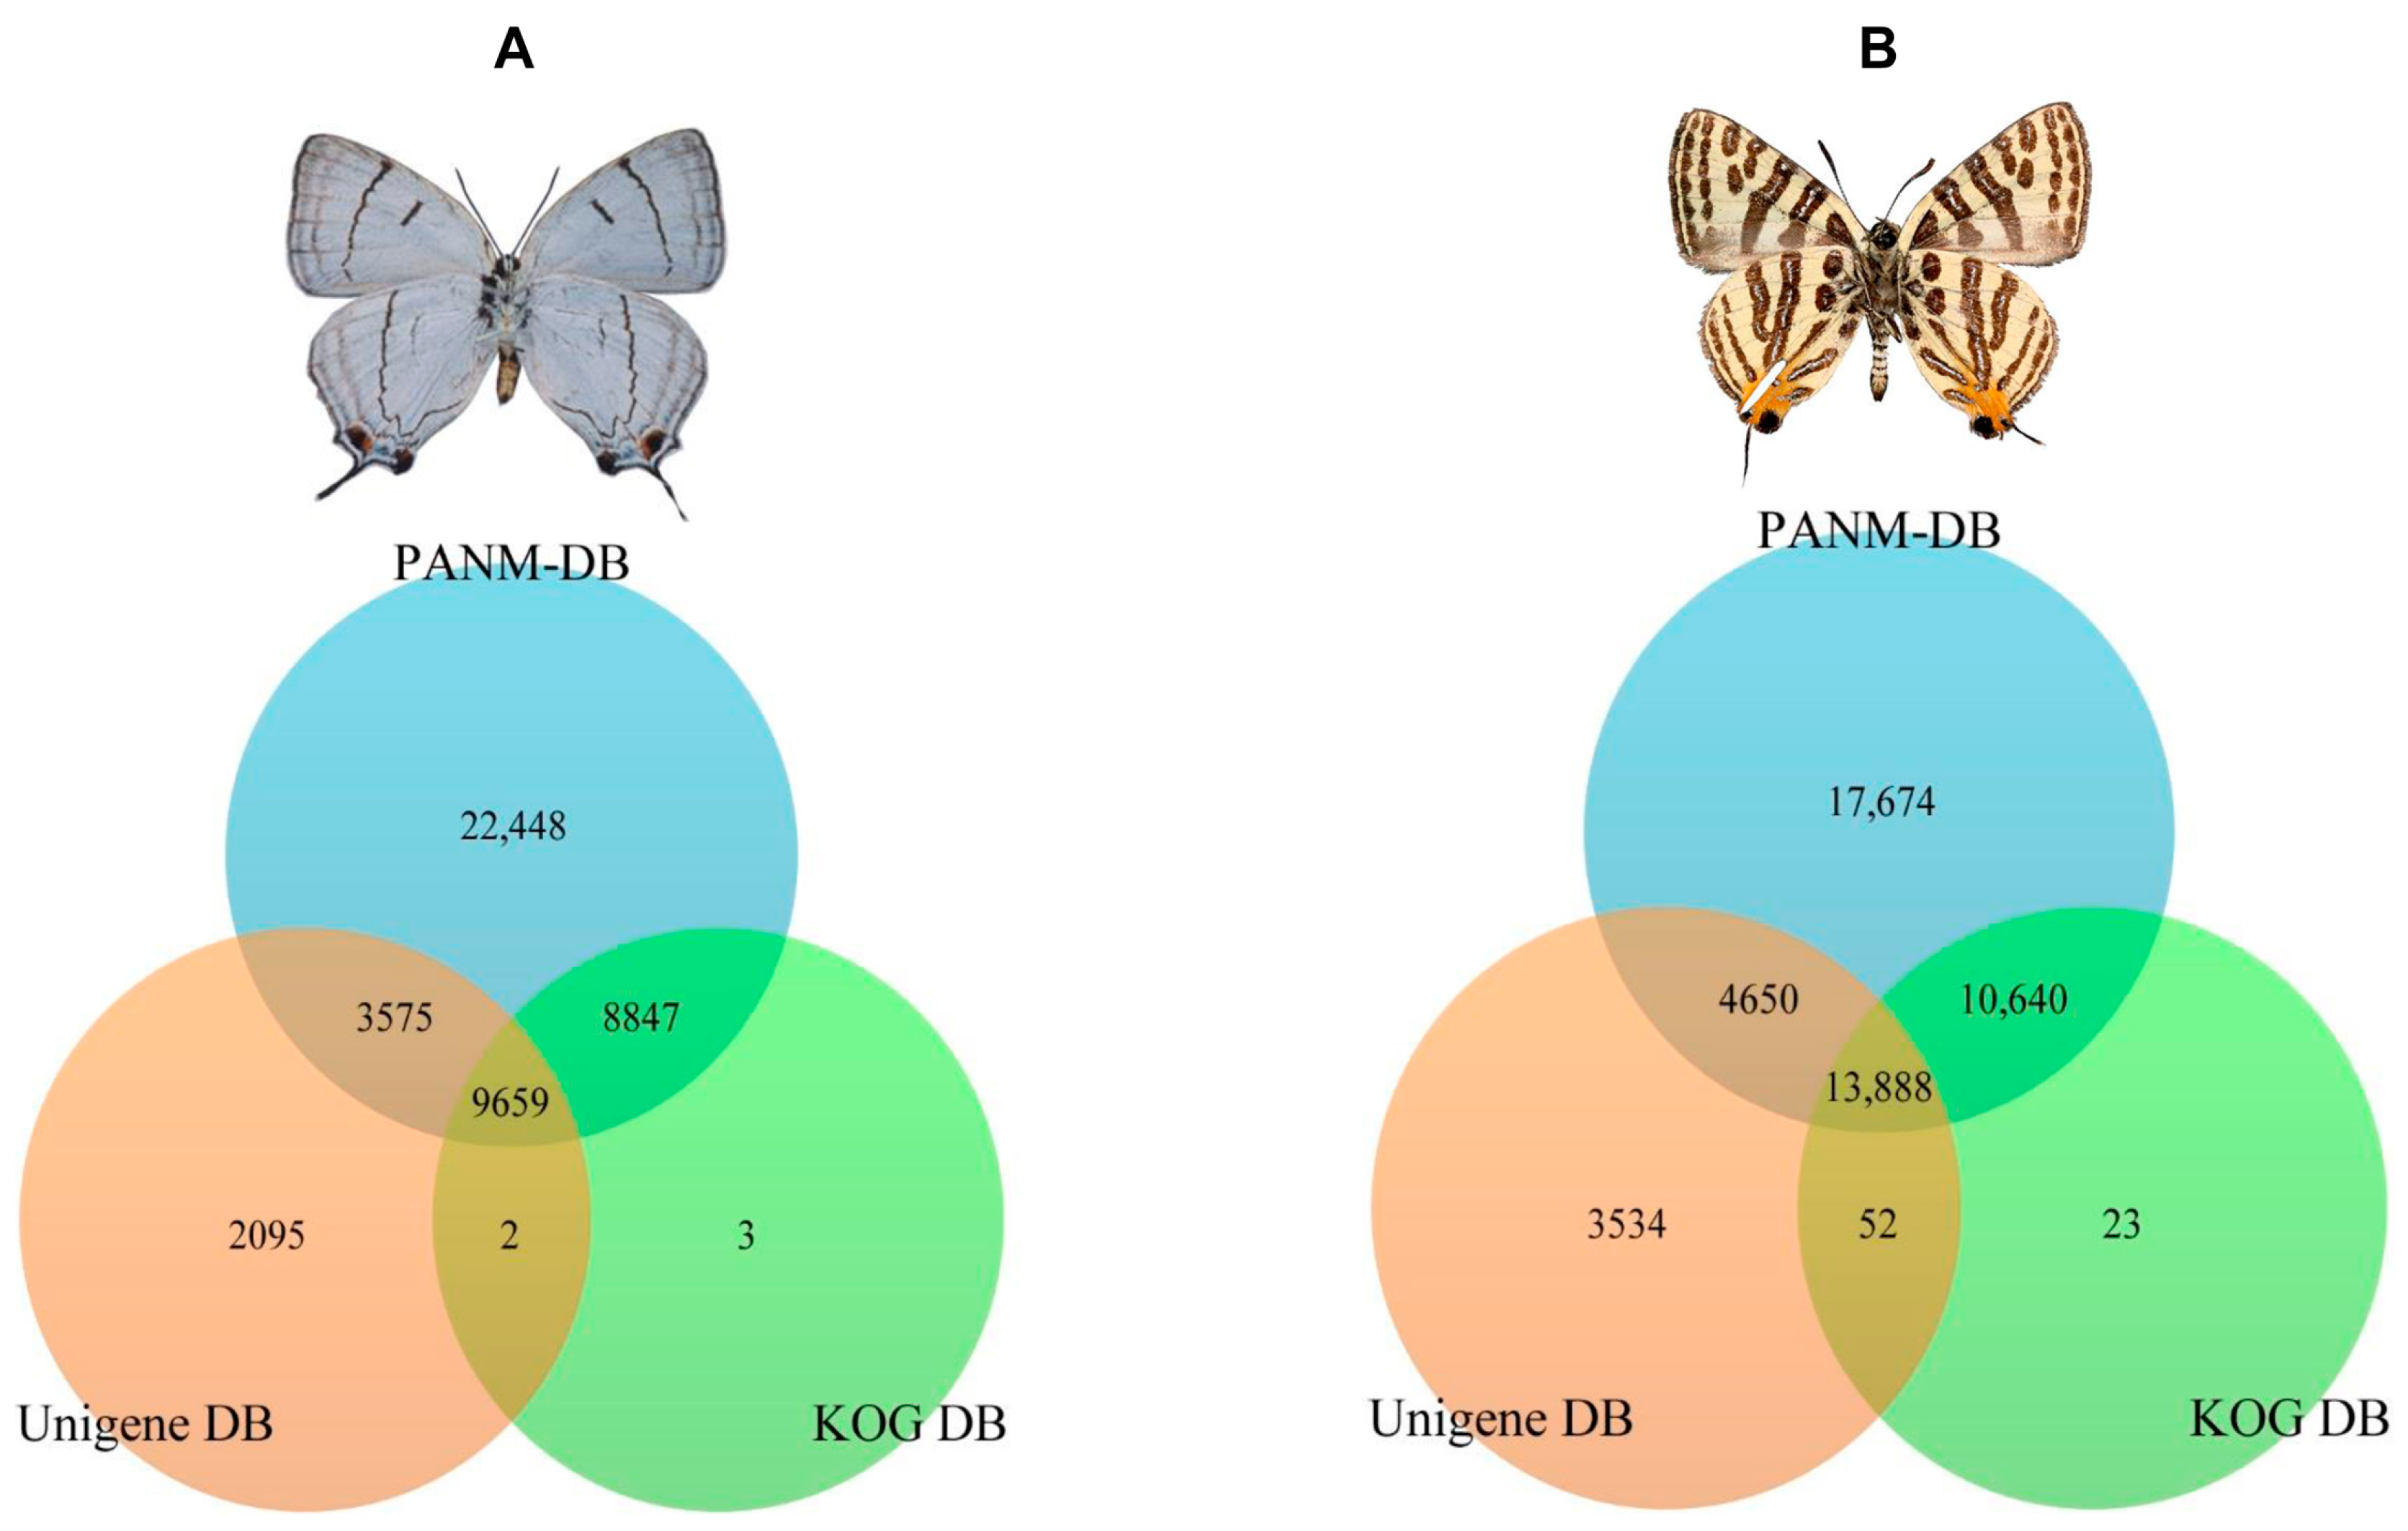
P. superans, a total of 18,506 and 13,234 unigenes had common homologous matches in the PANM-DB and KOG DB and PANM-DB and Unigene DB, respectively. A total of 9659 unigene sequences overlapped within the three protein databases. Only three unigenes sequences were found exclusive to the KOG DB, whereas two sequences were uniquely shared between the KOG and Unigene DB. A total of 22,448 and 2095 sequences showed homologies exclusive to the PANM-DB and Unigene DB, respectively. The sequence annotation results for the
P. superans butterfly are shown in
Figure 3A. The unigene annotation for
S. takanosis (
Figure 3B) showed a total of 13,888 sequences overlapping the three databases. A total of 24,528, 18,538, and 13,940 unigenes recovered BLAST hits from both the PANM-DB and KOG DB, the PANM-DB and Unigene DB, and the KOG DB and Unigene DB, respectively. BLASTX was also used to search for the matches of
P. superans and
S. takanosis unigenes against Gene Ontology (GO) and Kyoto Encyclopedia of Genes and Genomes (KEGG) protein functional databases. A total of 18,661 (17.29%) and 5259 (4.87%) unigenes of
P. superans found matches to protein sequences in the GO and KEGG databases, respectively (
Table 2). As expected, the majority (more than 55%) of GO and KEGG annotated transcripts were ≥1000 bp. The non-annotated transcripts may also attribute to novel genes, but it is possible that most of these shorter sequences may lack a functional conserved domain and hence are missing sequence matches in the databases.
Figure 3.
A summary depicting the annotation of P. superans (A); and S. takanosis (B) unigenes against PANM-DB, Unigene DB, and KOG DB.
Figure 3.
A summary depicting the annotation of P. superans (A); and S. takanosis (B) unigenes against PANM-DB, Unigene DB, and KOG DB.
2.3. Homology Characteristics of Assembled Unigenes
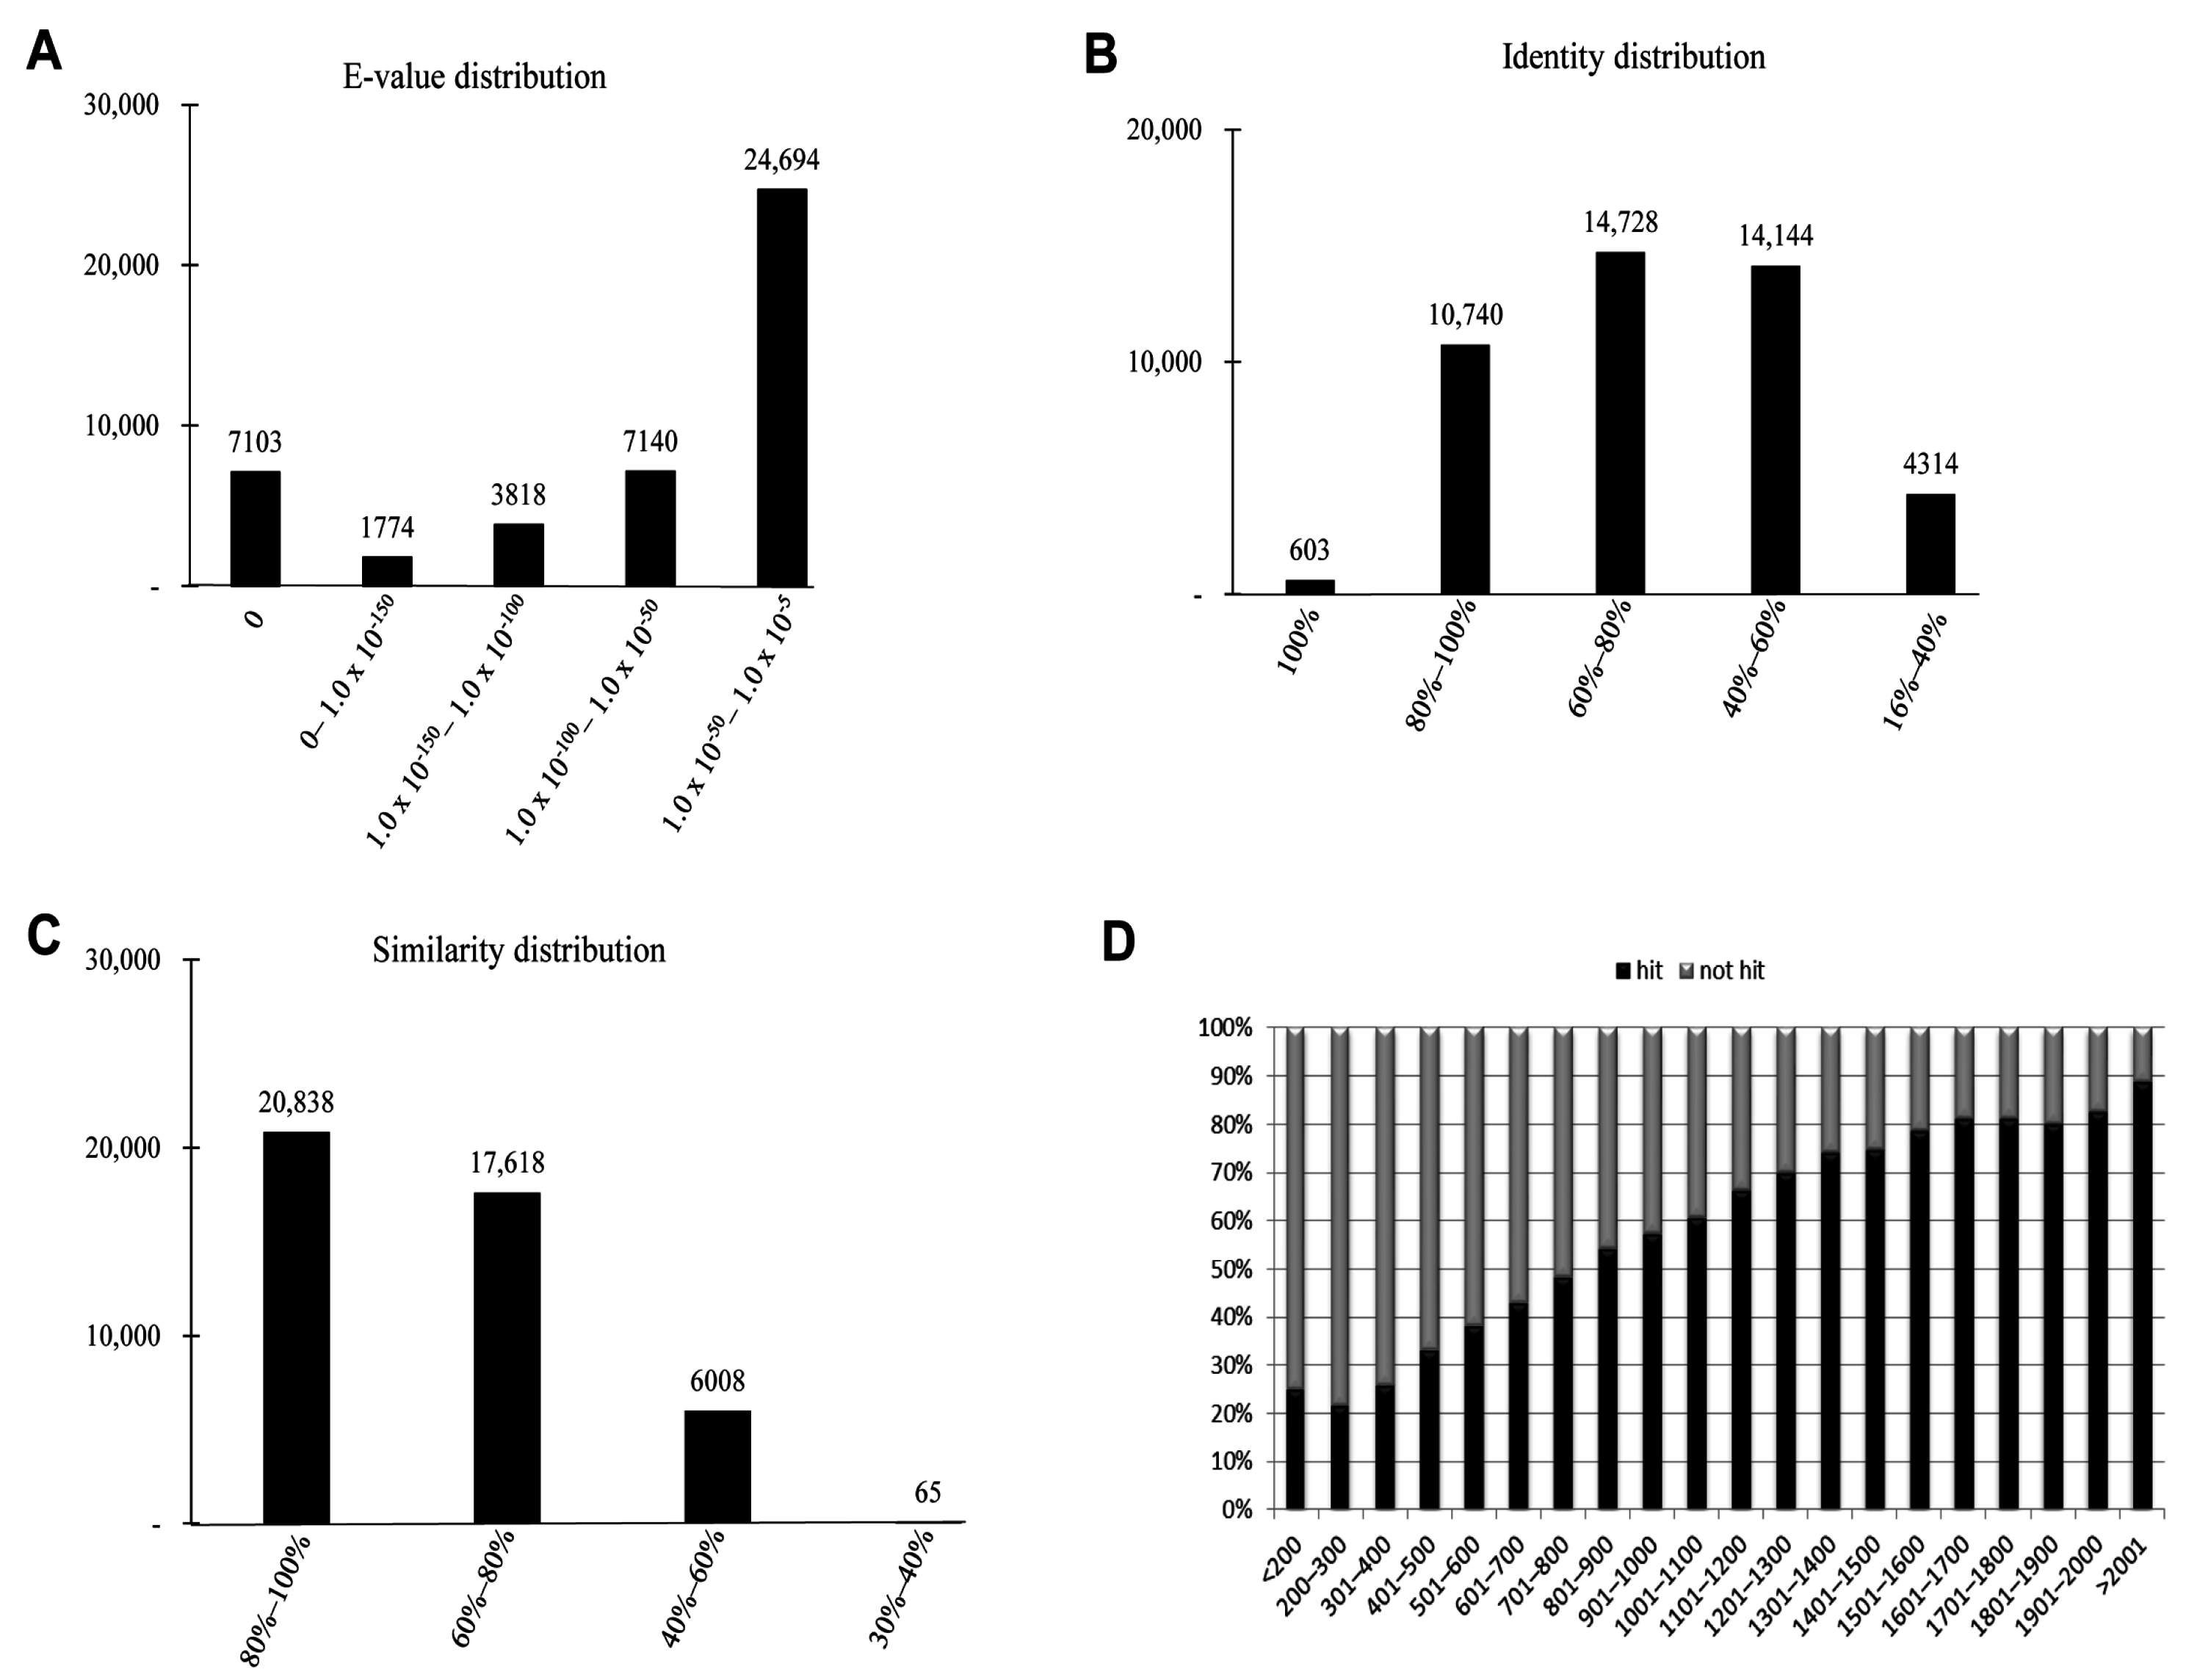
The characteristics of the homology search of assembled unigenes from
P. superans recovered by BLAST hits against the PANM-DB were analyzed. We studied for homology characteristics such as the
E-value, identity and similarity distribution (
Figure 4). We have also performed the homology search of assembled unigenes against the Unigene DB (
Figure S1). The
E-value distribution revealed that a significant proportion of unigenes (24,694, 55.46%) showed significant homology to previously deposited sequences in the PANM-DB with an
E-value ranging from 1.0 × 10
−50 to 1.0 × 10
−5 (
Figure 4A). Identity distribution chart revealed a close distribution with 14,728 (33.08%), 14,144 (31.76%), and 10,740 (24.12%) unigenes showing identity of 60%–80%, 40%–60%, and 80%–100%, respectively. About 603 (1.35%) unigenes showed an identity of 100% to match subject sequences in the PANM-DB (
Figure 4B). According to the similarity distribution chart, 20,838 (46.80%) unigenes had a similarity of 80%–100% and 17,618 (39.57%) unigenes had a similarity of 60%–80% with the deposited sequences (
Figure 4C). In addition, our results showed that the unigene hit percentage increased steadily with an increase in the length of the unigenes. Above 70% of
P. superans unigene sequences over 1500 bp in length showed BLASTx hits to protein sequences in the PANM-DB. In contrast, only close to 20% of sequences shorter than 300 bp found a hit to homologous sequences in the database (
Figure 4D). In the homology search of
P. superans assembled sequences using the Unigene DB (
Figure S1), we found a majority showing an
E-value ranging from 1.0 × 10
−50 to 1.0 × 10
−5 (
Figure S1A). The identity distribution plot revealed most assembled sequences showing an identity of 80%–100% (
Figure S1B) to sequences in the Unigene DB. About 50% of sequences >2001 bp showed annotation hits, while none of the <200 bp sequences were annotated to sequences in the database (
Figure S1C).
Figure 4.
Homology search characteristics of P. superans assembled unigenes against PANM database. (A) E-value distribution of BLAST hits for each unigene with a cutoff value of 1.0 × 10⁻⁵; (B) Identity distribution of BLAST hits for each unigene; (C) Similarity distribution of BLAST hits for each unigene; (D) Unigene lengths with or without hits.
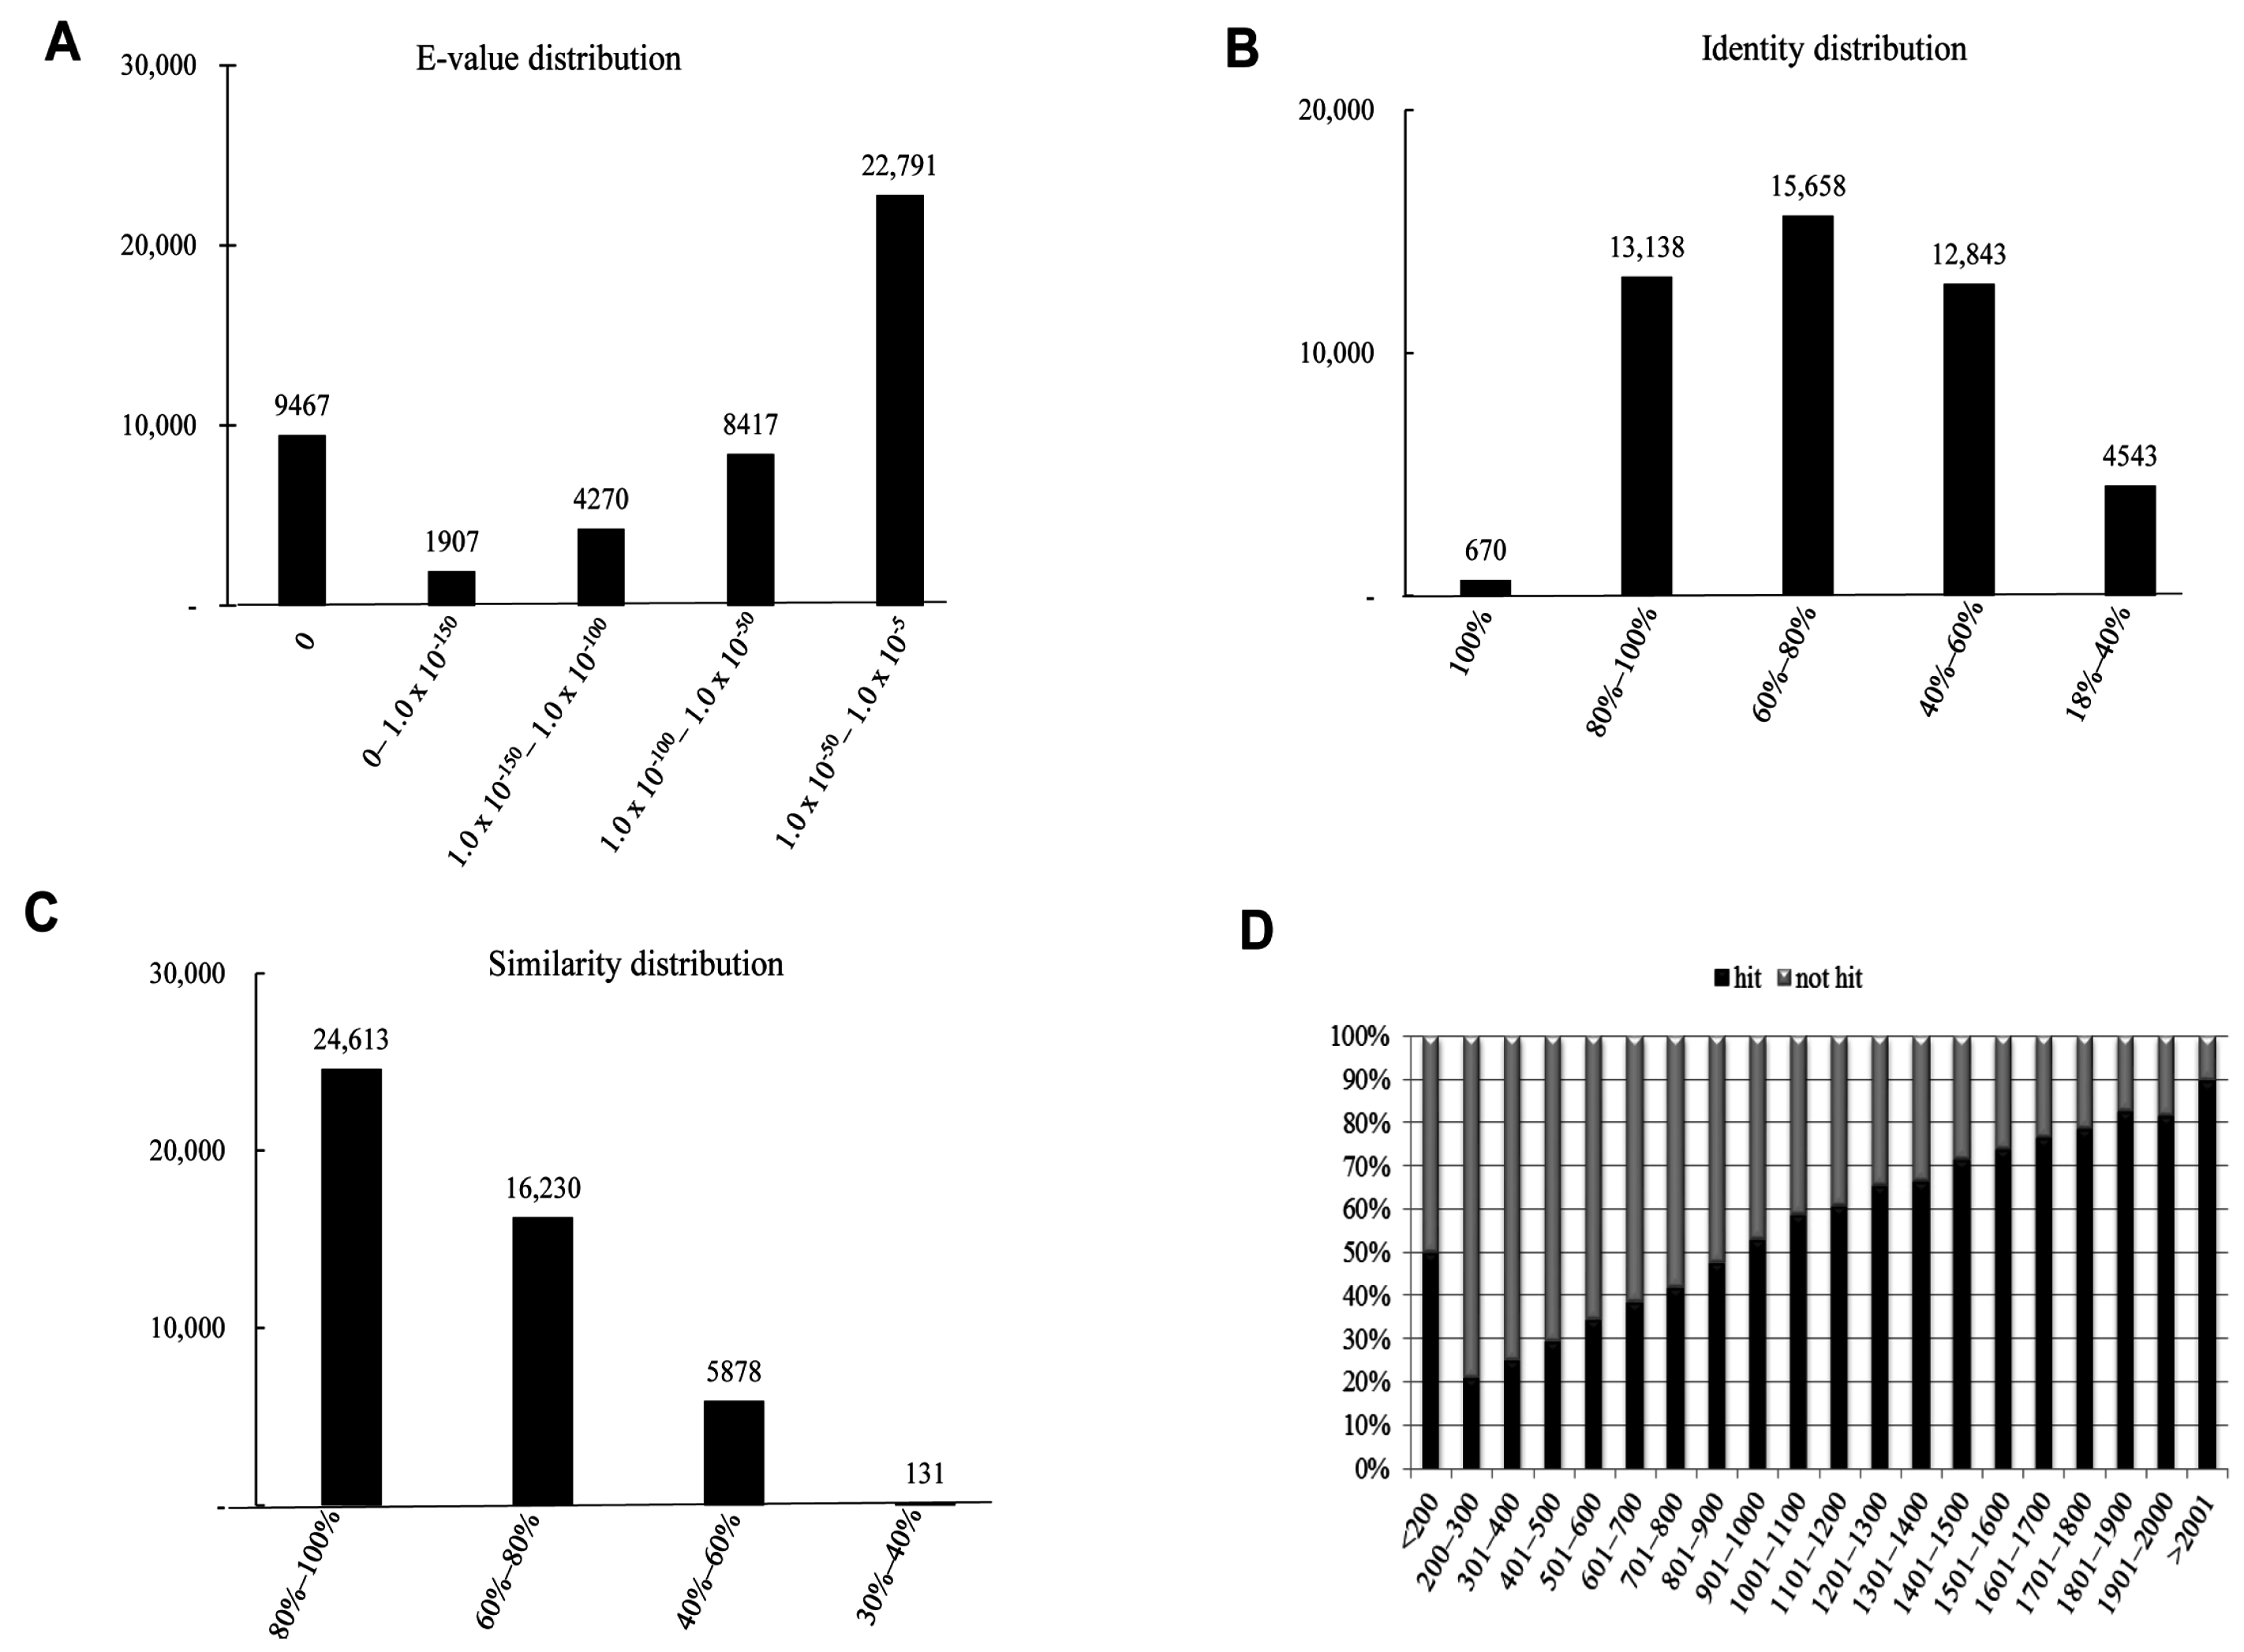
We have summarized the characteristics of the homology search of assembled unigenes from
S. takanosis in
Figure 5. The
E-value distribution chart revealed that about 22,791 (48.64%) unigenes showed an
E-value ranging from 1.0 × 10
−50 to 1.0 × 10
−5 (
Figure 5A). As with
P. superans,
S. takanosis unigenes reveal close identity distribution with 15,658 (33.42%), 13,138 (28.04%), and 12,843 (27.41%) unigenes showing identity in the range of 60%–80%, 80%–100%, and 40%–60%, respectively. About 670 (1.43%) unigenes showed an identity of 100% to subject sequences in the PANM-DB (
Figure 5B). The similarity distribution chart shows a larger share of unigenes (24,613, 52.53%) having similarity in the range of 80%–100% (
Figure 5C). Unlike the
P. superans unigenes hit percentage, almost 50% of the unigenes in
S. takanosis with a length of less than 200 bp showed a positive hit. Following the same, the hit percentage increased by about 90% for unigenes above 2001 bp in length (
Figure 5D). Homology search of
S. takanosis assembled sequences using the Unigene DB (
Figure S2) showed a majority of sequences having an
E-value ranging from 1.0 × 10
−50 to 1.0 × 10
−5 (
Figure S2A). A majority of sequences showed an identity of 80%–100% (
Figure S2B) to sequences in the Unigene DB. Assembled sequences of >2001 bp showed about 60% annotation hits to sequences in the Unigene DB (
Figure S2C). Moreover, more unigene hits were observed with the PANM-DB compared to the Unigene DB over the length of assembled sequences. This indicates that longer unigenes are more likely to get an identifiable affiliation during BLAST matches, due to the likely presence of a representative protein domain that may be hard to find in shorter sequences. More so, the longest unigenes yield BLAST hits and annotations with a higher frequency [
31,
32].
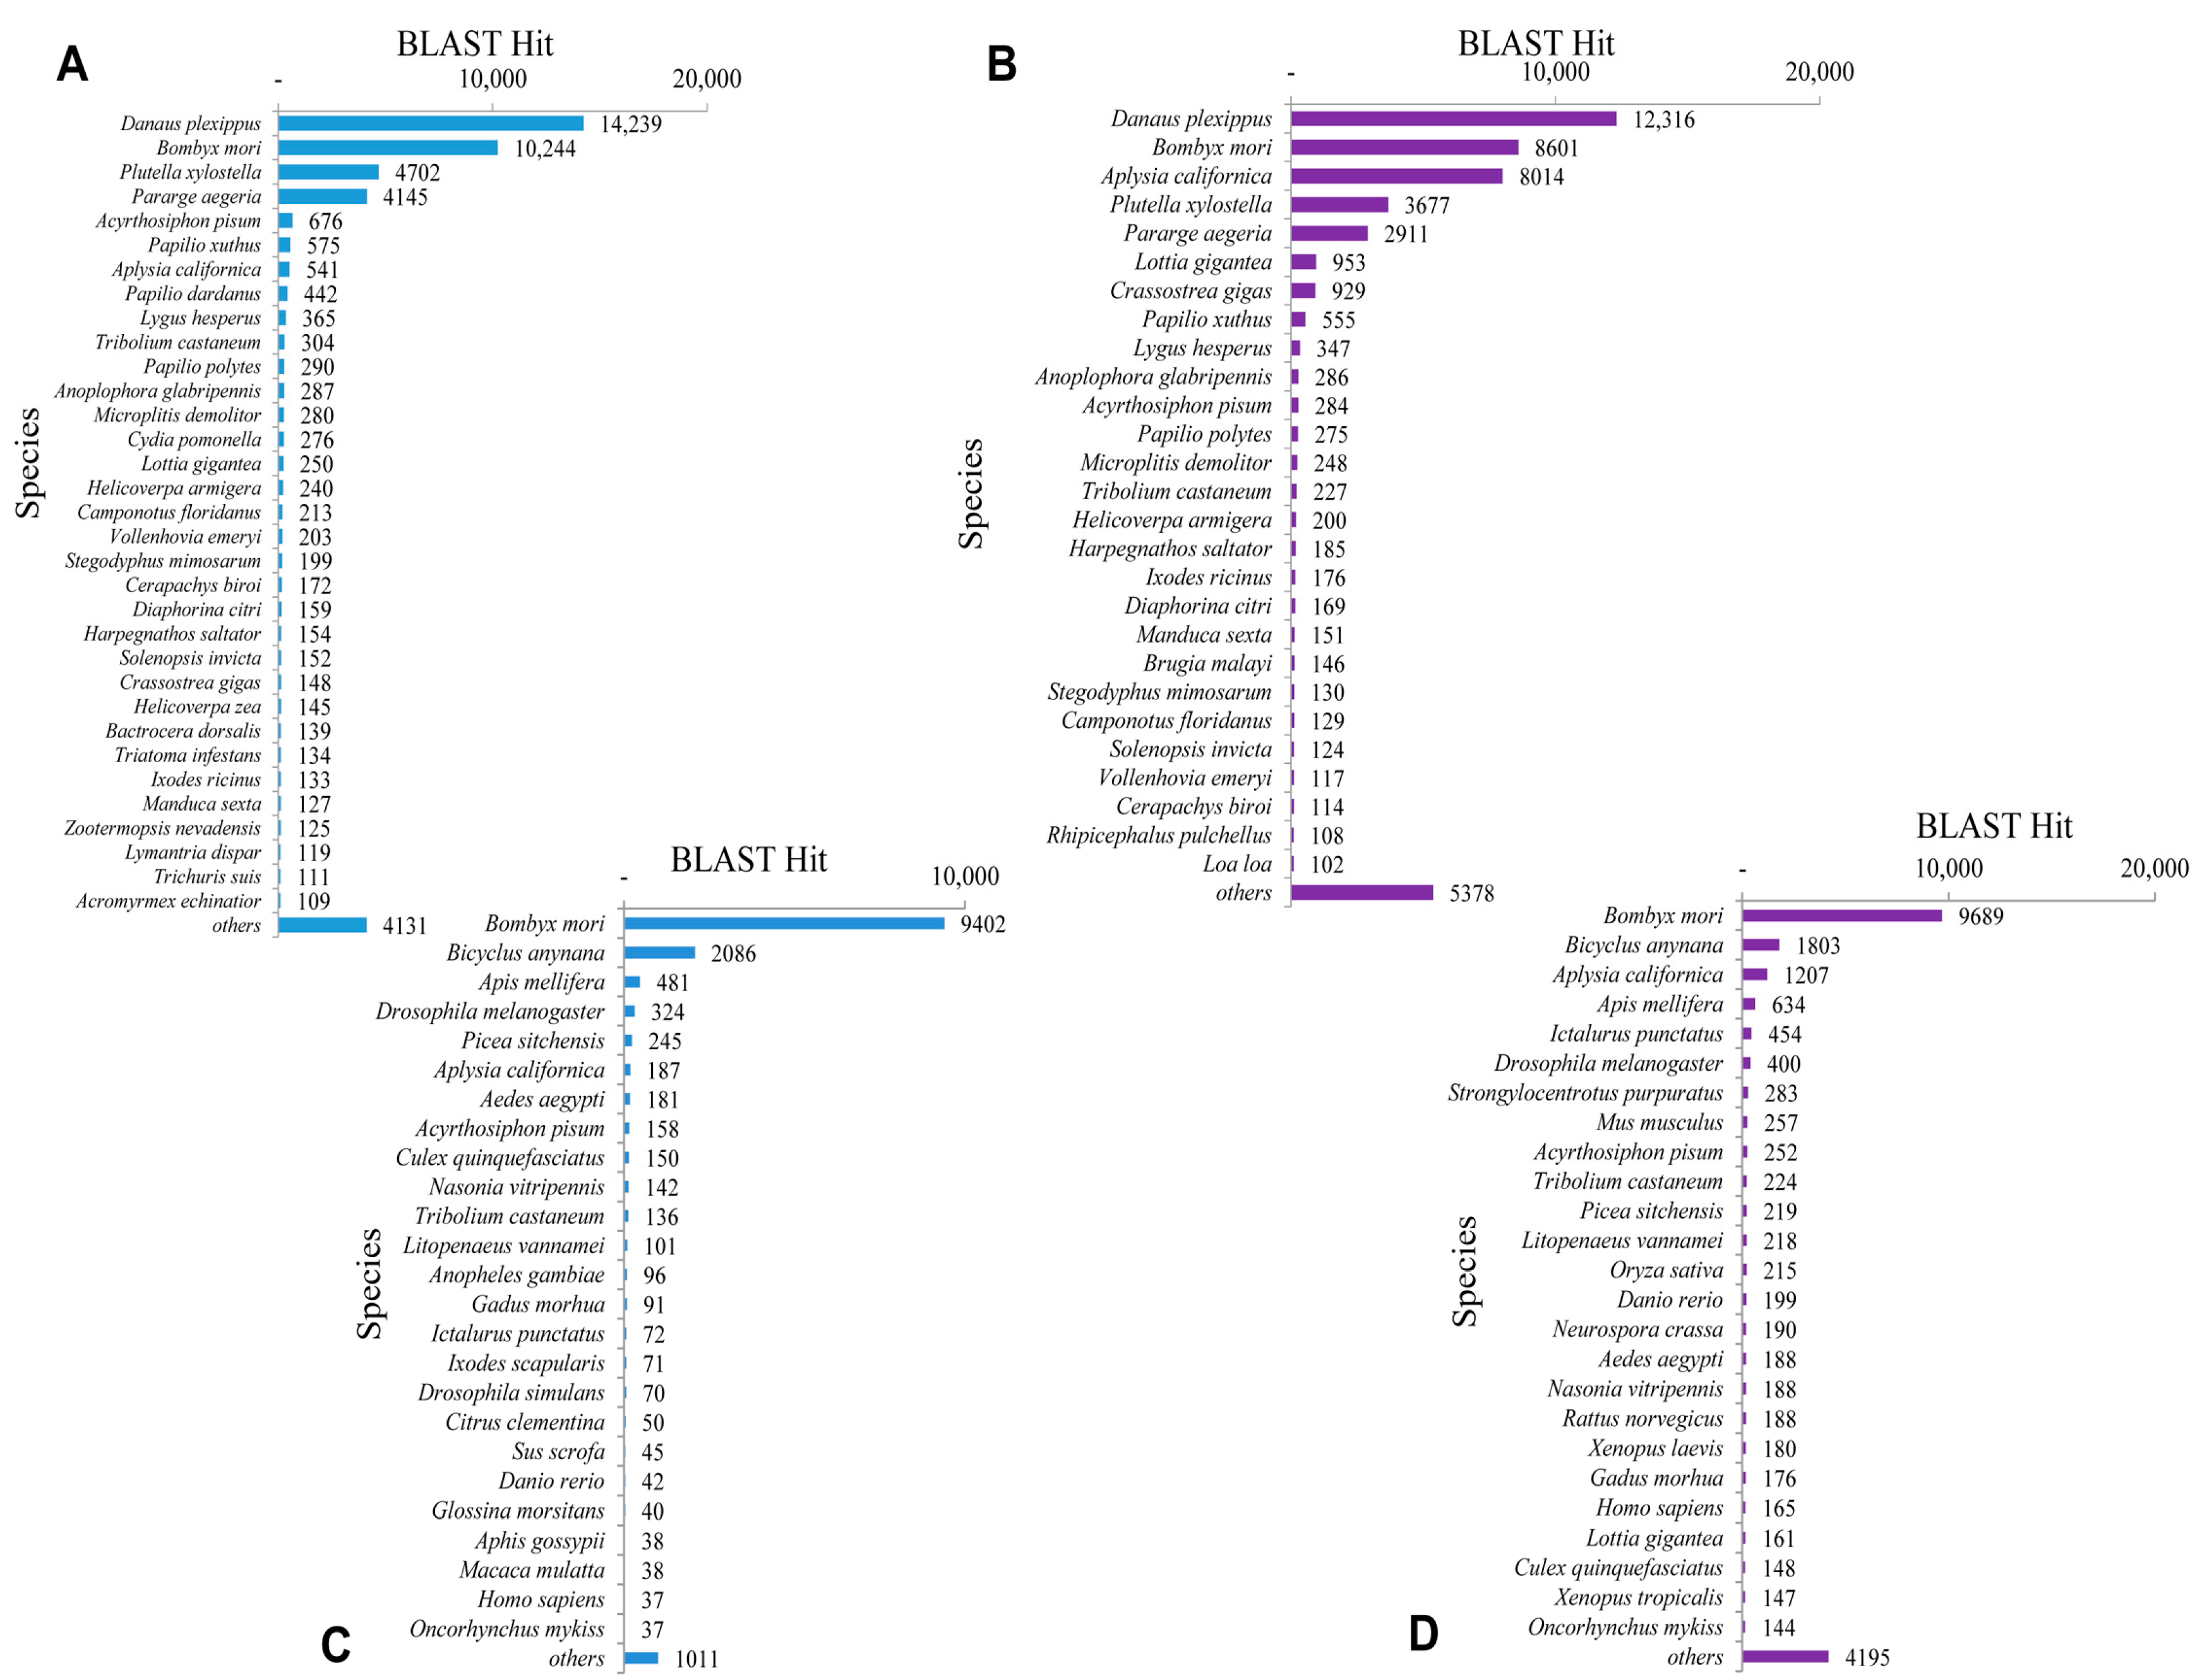
The BLASTx top-hit species distribution of unigenes matched to the PANM-DB has been shown for
P. superans and
S. takanosis in
Figure 6A,B, respectively. In the case of both the butterfly species, the highest match was observed to
Danaus plexippus (14,239 unigenes, 13.19%, for
P. superans; and 12,316 unigenes, 10.17%, for
S. takanosis), followed by
Bombyx mori (10,244 unigenes, 9.49%; and 8601 unigenes, 7.10%). Other species ranked high with a greater number of hits included the Arthropods such as
Plutella xylostella,
Pararge aegeria and the mollusk
Aplysia californica among others with more than 1000 unigene hits. We also analyzed the top-hit species distribution of the 15,331 and 22,124 assembled sequences for
P. superans (
Figure 6C) and
S. takanosis (
Figure 6D) matched to the Unigene database. The highest BLASTx hits were shown to
Bombyx mori with 9402 and 9689 unigenes of
P. superans and
S. takanosis, respectively, showing matches.
Figure 5.
Homology search characteristics of S. takanosis assembled unigenes against PANM database. (A) E-value distribution of BLAST hits for each unigene with a cutoff value of 1.0 × 10⁻⁵; (B) Identity distribution of BLAST hits for each unigene; (C) Similarity distribution of BLAST hits for each unigene; (D) Unigene lengths with or without hits.
Figure 6.
Top-hit species distribution. BLASTx top-hit species distribution of P. superans and S. takanosis against PANM-DB (A,B); and Unigene DB (C,D).
Figure 6.
Top-hit species distribution. BLASTx top-hit species distribution of P. superans and S. takanosis against PANM-DB (A,B); and Unigene DB (C,D).
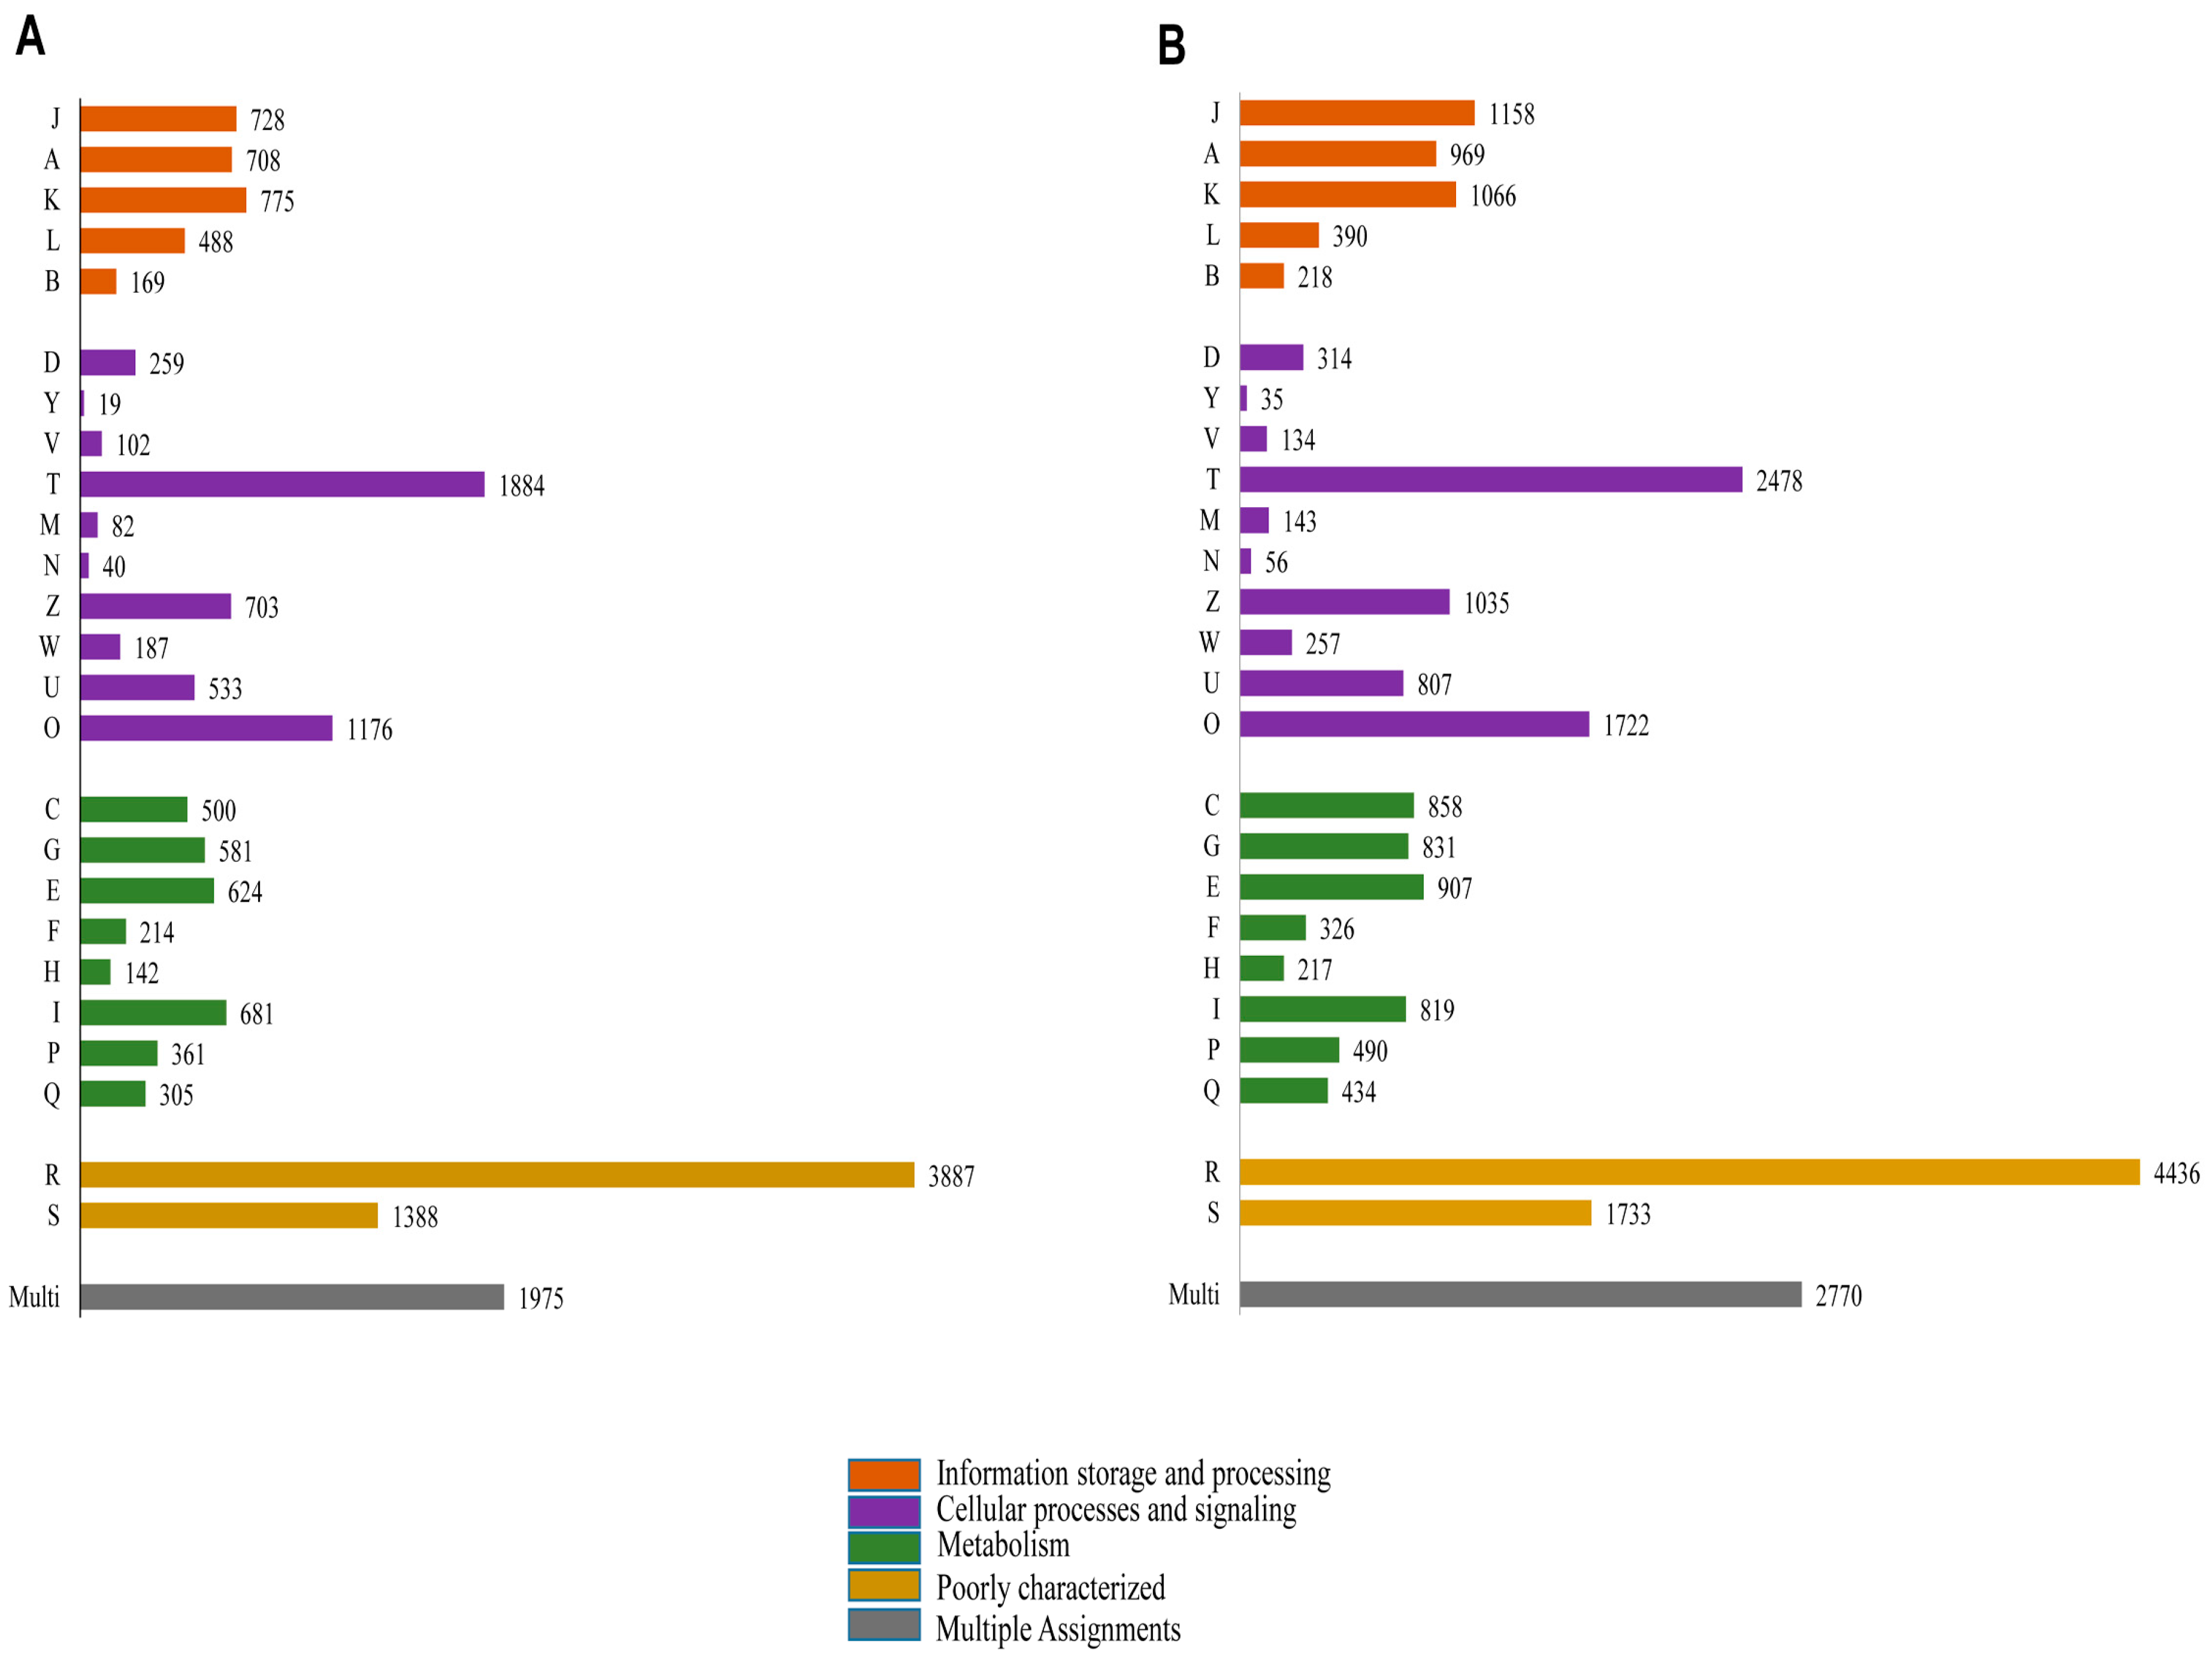
Functional prediction and classification of the butterfly unigenes were achieved by a search against the KOG database (
Figure 7). A total of 18,511 (17.15% of total unigenes) and 24,603 (20.31% of total unigenes) unigenes of
P. superans (
Figure 7A) and
S. takanosis (
Figure 7B), respectively were ascribed functions under 25 categories arranged to four main functional groups. A greater proportion of unigenes were clustered to the cellular processes and signaling group (4985 unigenes for
P. superans and 6981 unigenes for
S. takanosis), followed by the metabolism group (3408 for
P. superans and 4882 for
S. takanosis) and the information storage and processing group (2868 for
P. superans and 3801 for
S. takanosis). Within the cellular processes and signaling group, most of the unigenes were classified under the signal transduction process category followed by the post-translational modification, protein turnover and chaperone categories. Furthermore, a significant fraction of unigenes remained poorly characterized (5275 unigenes for
P. superans and 6169 unigenes for
S. takanosis).
Figure 7.
Clusters of orthologous groups’ classification (KOG) of P. superans (A); and S. takanosis (B) unigenes into four major categories of information storage and processing, cellular processes and signaling and metabolism. The code descriptions for KOG categories are as follows: J, translation, ribosomal structure, and biogenesis; A, RNA processing and modification; K, transcription; L, replication, recombination, and repair; B, chromatin structure and dynamics; D, cell cycle control, cell division, and chromosome portioning; Y, nuclear structure; V, defense mechanisms; T, signal transduction mechanisms; M, cell wall/membrane/envelope biogenesis; N, cell motility; Z, cytoskeleton; W, extracellular structures; U, intracellular trafficking, secretion, and vesicular transport; O, post-translational modification, protein turnover, and chaperones; C, energy production and conversion; G, carbohydrate transport and metabolism; E, amino acid transport and metabolism; F, nucleotide transport and metabolism; H, co-enzyme transport and metabolism; I, lipid transport and metabolism; P, inorganic ion transport and metabolism; Q, secondary metabolites biosynthesis, transport and catabolism; R, general function prediction only; S, unknown function; Multi, more than one classified function.
![Ijms 16 26213 g007]()
2.4. Functional Annotation Using GO and KEGG
To functionally classify
P. superans and
S. takanosis unigenes, GO terms and KEGG pathway classification were assigned to each unigene using the BLAST2GO software suite. For
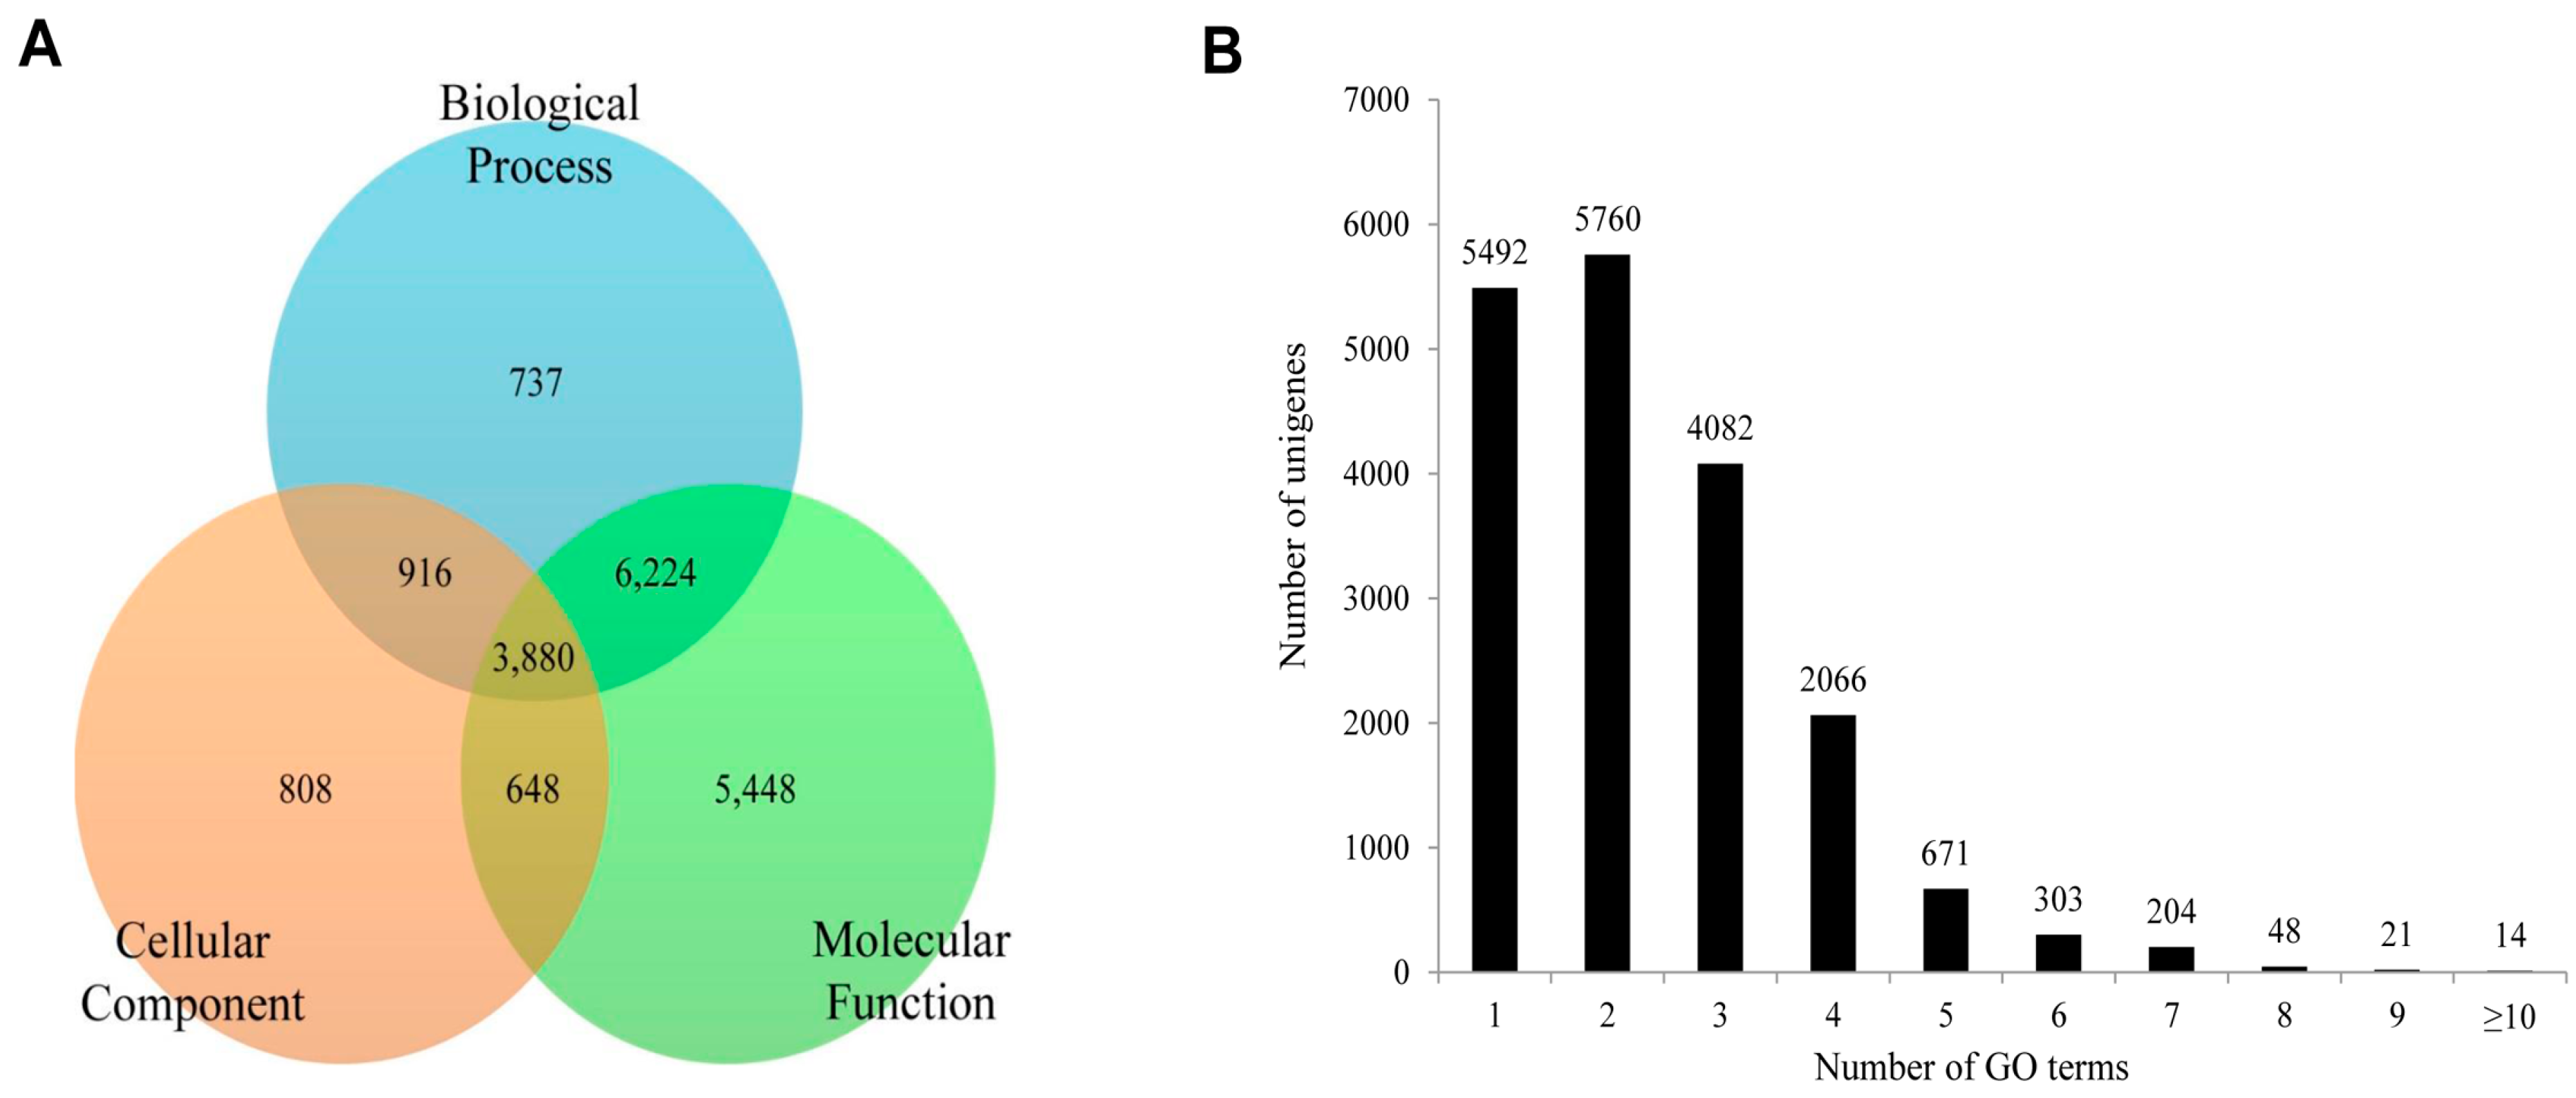
P. superans, the 18,661 unigenes annotated from the total unigene profile were allocated one or more GO terms based on sequence similarity. A total of 89,289 unigene sequences were without GO terms. The GO annotated unigenes were functionally classified into three broad categories such as biological process, cellular component, and molecular function. A summary of
P. superans unigenes and GO terms have been shown in
Figure 8. The molecular function category was assigned 16,200 unigenes, followed by biological process with 11,757, and cellular components with 6252 unigenes. Of these unigenes, 3880 showed functional attributes shared within the three main categories. Additionally, 5448, 808 and 737 unigenes were found uniquely attached to the molecular function, cellular component, and biological process categories, respectively (
Figure 8A). As shown in
Figure 8B, a significant number of unigenes were represented by more than a single GO term. Only 5492 (29.43%) unigenes were ascribed to one GO term with most unigenes (5760, 30.87%) represented by two GO terms.
Figure 8.
The functional distribution of the assembled unigenes of Protantigius superans by gene ontology assignment. (A) The distribution of the GO-annotated unigenes to biological process, cellular components and molecular function categories; (B) The number of GO term annotations ascribed to each unigene.
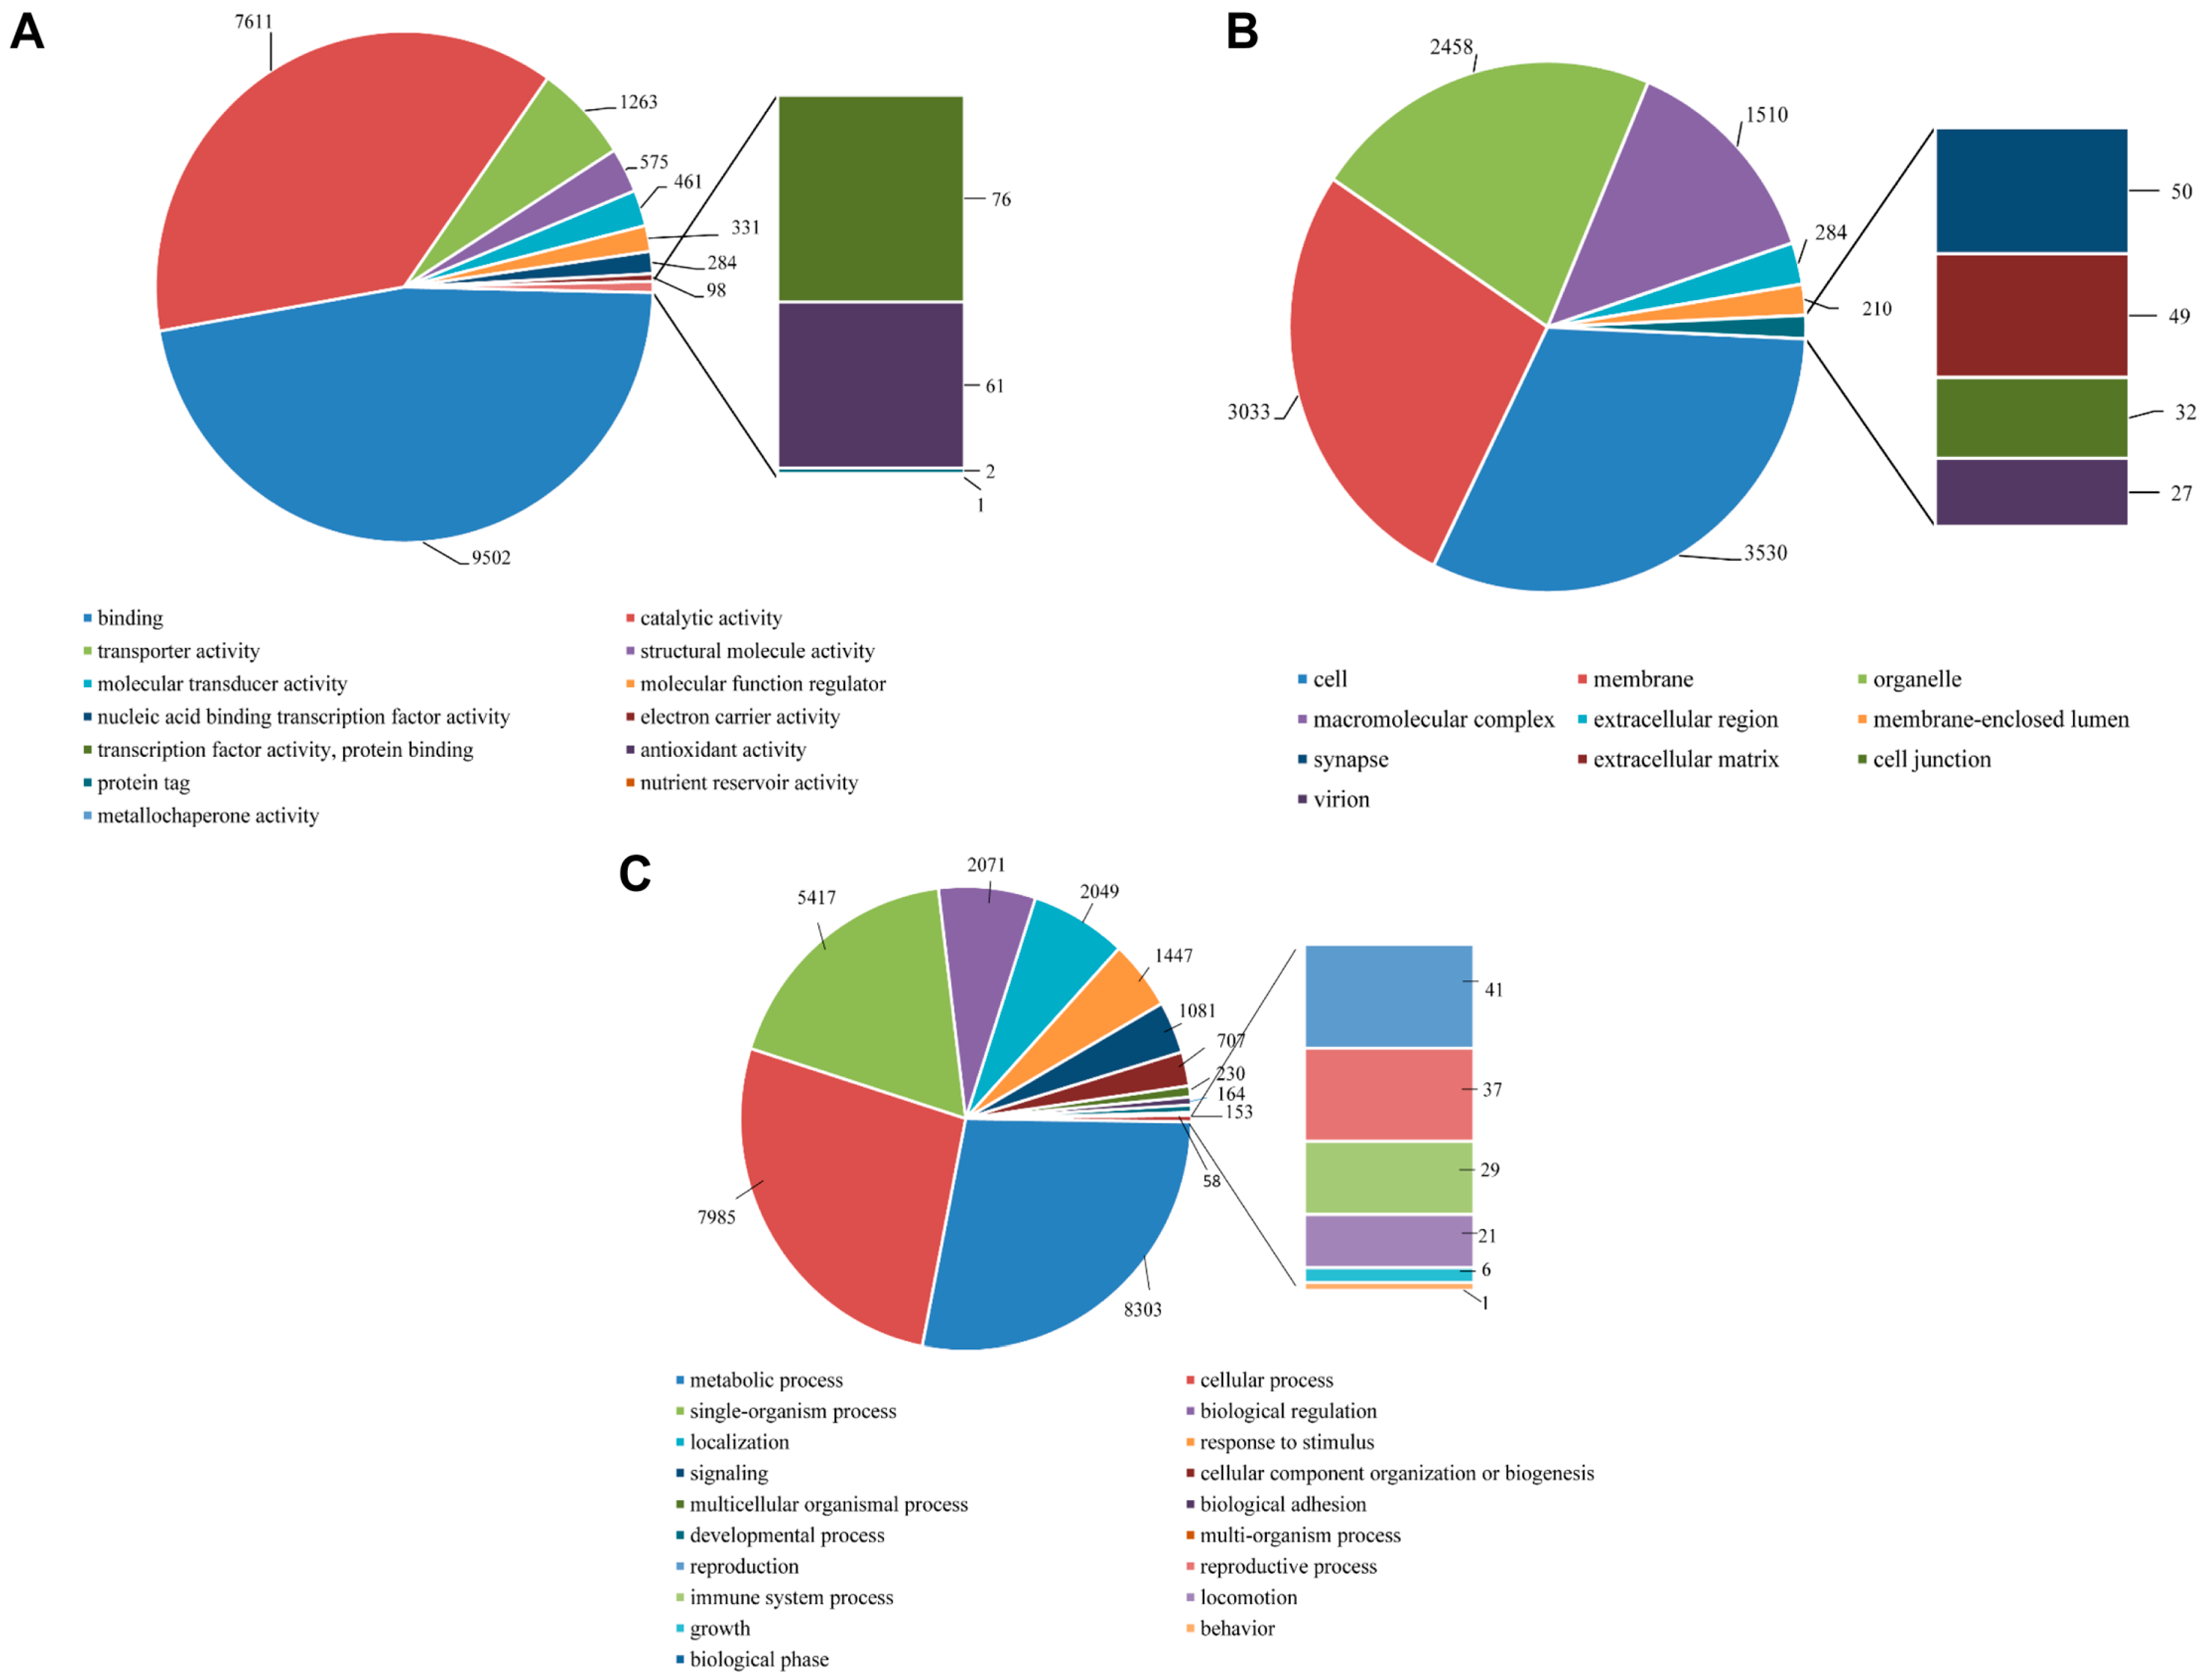
All unigene sequences were classified into molecular function, cellular components, and biological process level 2. Within the molecular function category, the unigenes were further classified to 13 sub-categories, out of which a majority were represented under binding (9502 unigenes, 46.89%), catalytic activity (7611, 37.56%), and transporter activity (1263, 6.23%). About 61 sequences represented the antioxidant activity with very few transcripts assigned to protein tag, nutrient reservoir activity, and metallochaperone activity (
Figure 9A). Within the cellular components category, the majority of unigenes represented cell (3530, 31.57%), membrane (3033, 27.12%), organelle (2458, 21.98%) and macromolecular complex (1510, 13.50%). Few unigenes also represented synapse (50, 0.45%) and extracellular matrix (49, 0.44%) (
Figure 9B). For the biological process category, there were 19 sub-categories, and metabolic process (8303, 27.86%), cellular process (7985, 26.79%) and single-organism process (18.18%) were the predominant GO groups. A smaller proportion of unigenes also fell under response to stimulus (1447, 4.86%), signaling (1081, 3.63%), reproduction (41, 0.14%), reproductive process (37, 0.12%), and immune system process (29, 0.10%) (
Figure 9C).
In the case of
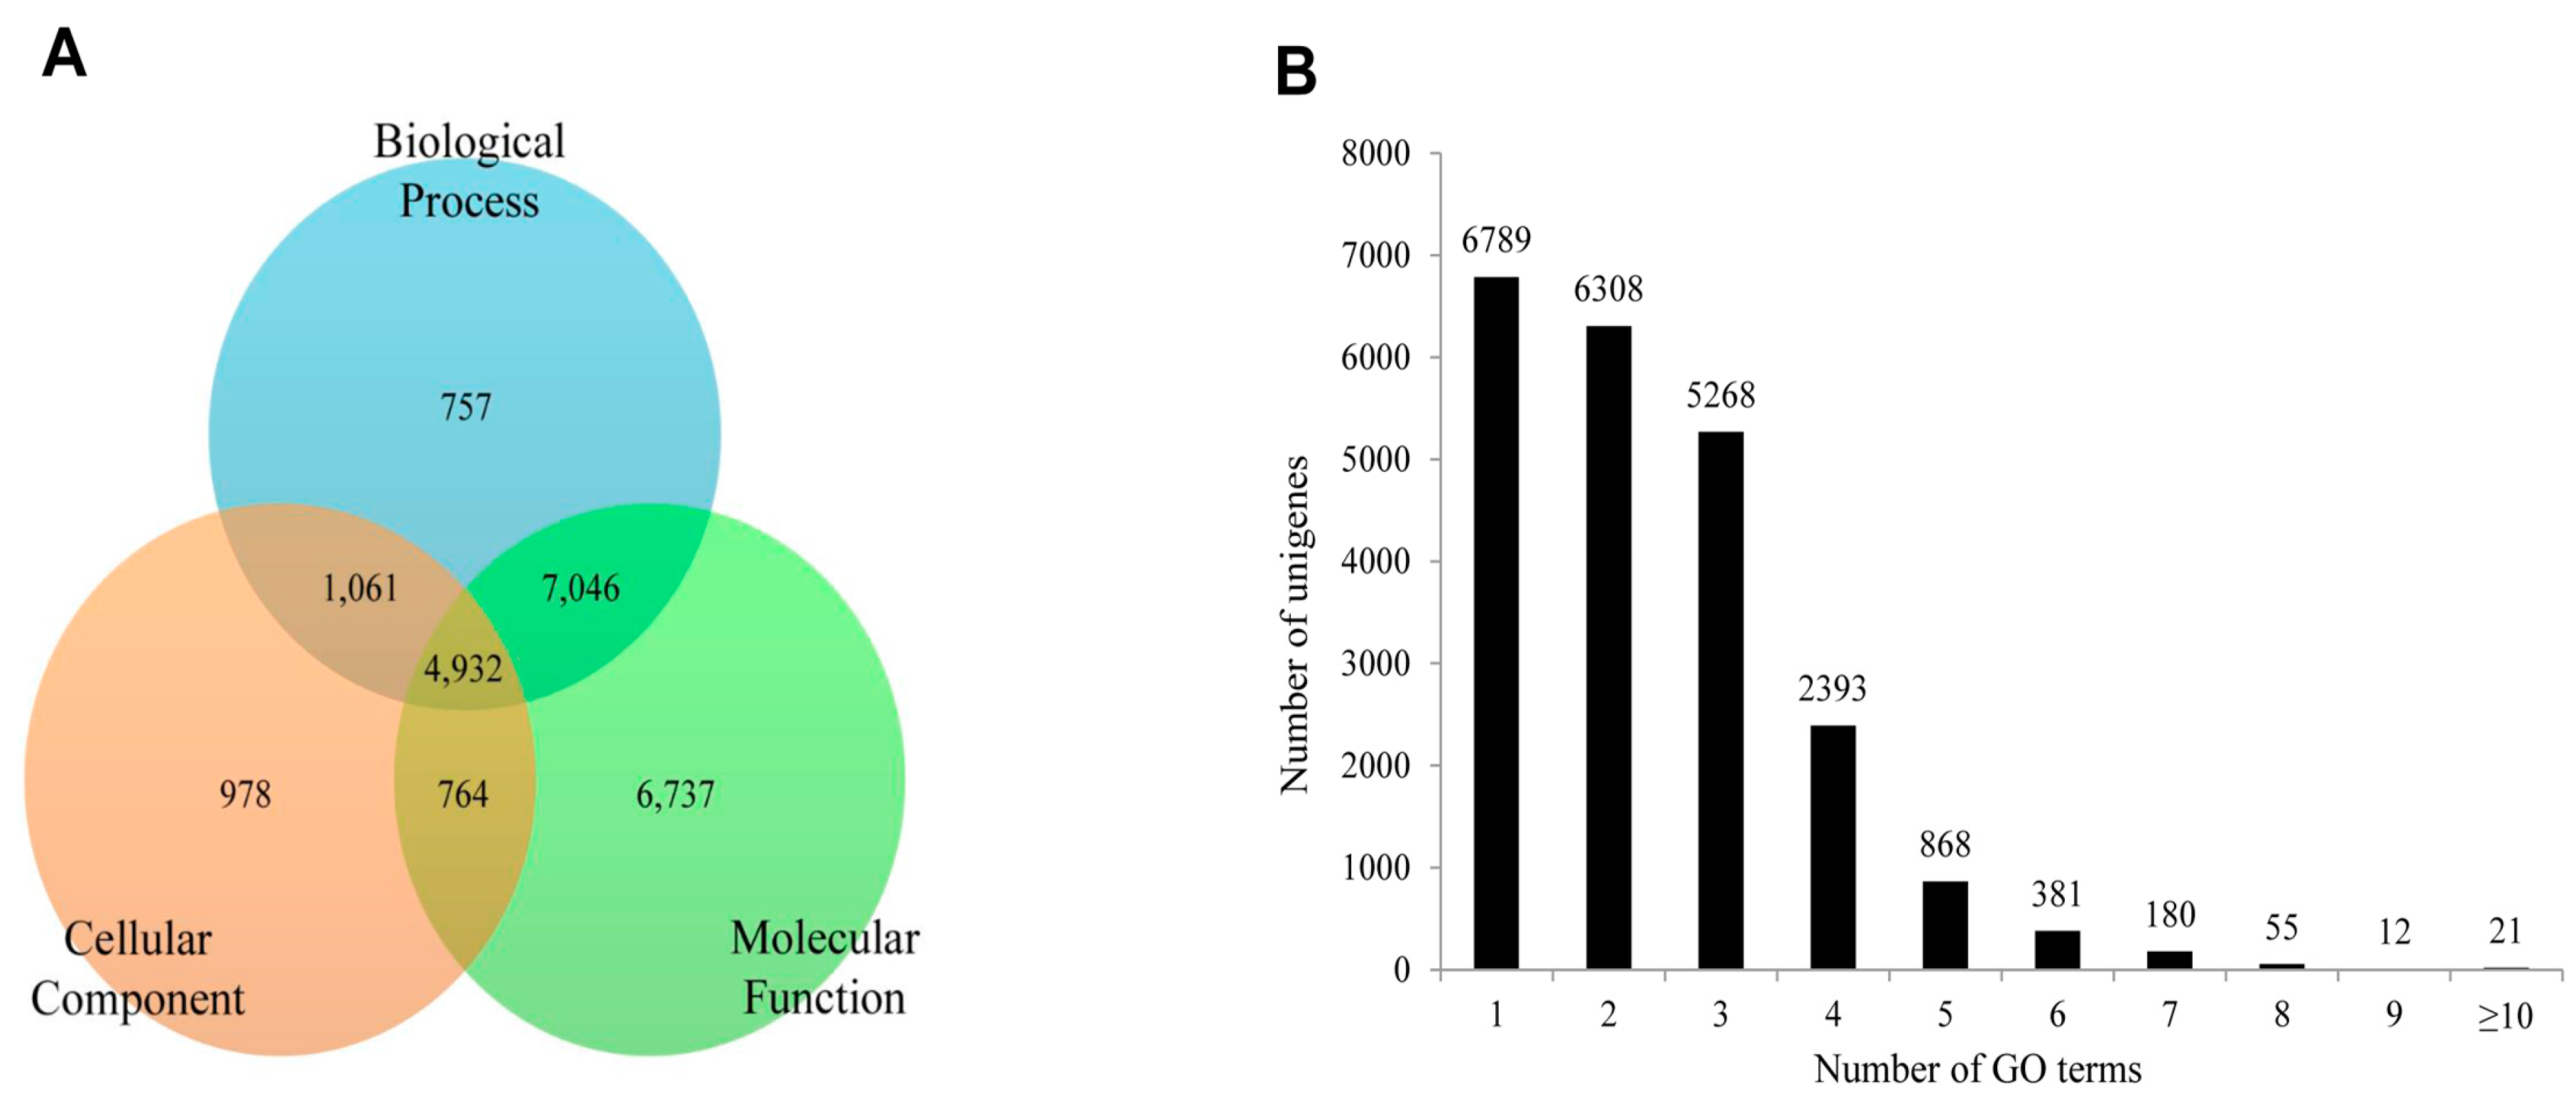
S. takanosis, 22,275 unigenes (18.39% of assembled unigenes) were assigned one or more GO terms, while 98,865 unigenes were without GO terms. The GO distribution for
S. takanosis unigenes assigned 16,200 terms to the molecular functions category, followed by 11,757 terms to the biological process and 6252 terms to the cellular components categories (
Figure 10A). A total of 6737, 978, and 757 unigenes were found exclusive to molecular function, cellular components, and biological process categories, respectively. About 4932 unigenes showed functional attributes shared between the three major categories of GO terms. As with
P. superans, a greater number
S. takanosis unigenes (15,486) also got represented by more than one GO term. Only 6789 (30.48%) unigenes showed homology to a single GO term (
Figure 10B).
Figure 9.
Gene ontology analysis of P. superans transcriptome using BLAST2GO. The number of unigenes assigned to the sub-categories under three major categories of molecular function (A); cellular components (B); and biological processes (C). All data are presented at level 2 GO categorization.
Figure 9.
Gene ontology analysis of P. superans transcriptome using BLAST2GO. The number of unigenes assigned to the sub-categories under three major categories of molecular function (A); cellular components (B); and biological processes (C). All data are presented at level 2 GO categorization.
Figure 10.
The functional distribution of the assembled unigenes of Spindasis takanosis by gene ontology assignment. (A) The distribution of the GO-annotated unigenes to biological processes, cellular components and molecular function categories; (B) The number of GO term annotations ascribed to each unigene.
The number of
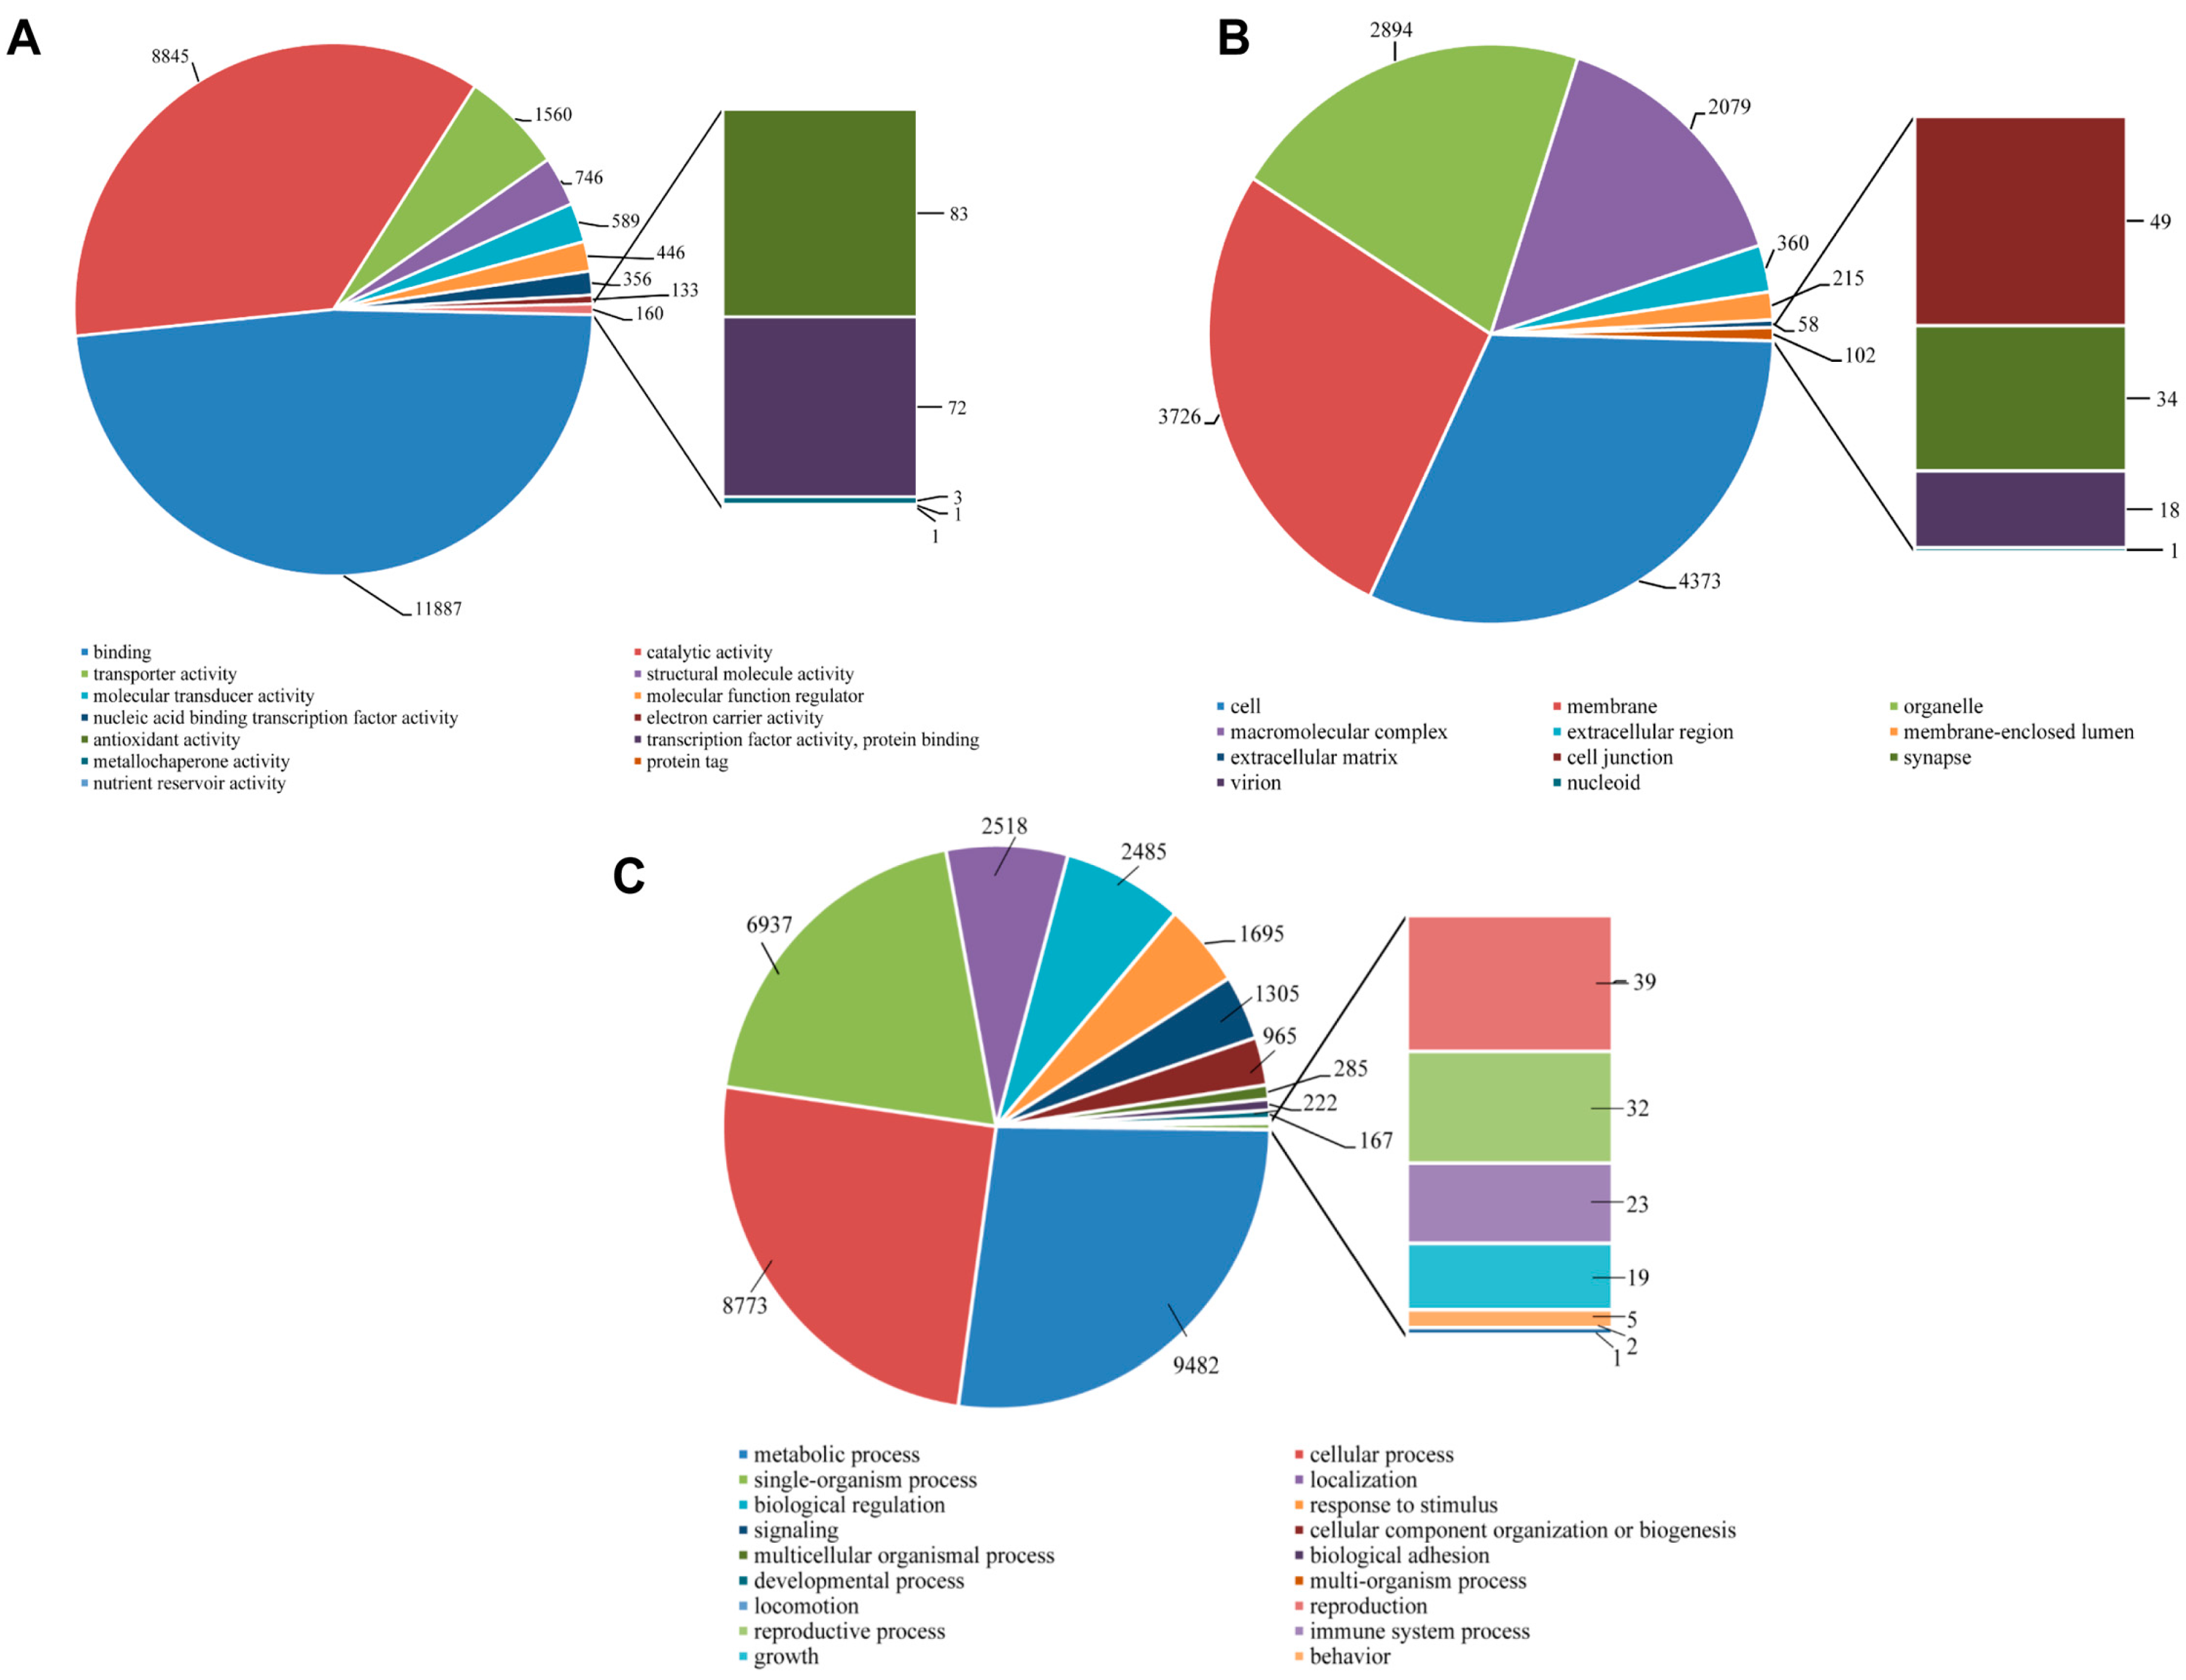
S. takanosis unigenes ascribed to various sub-categories under the three major categories of GO terms (level 2) are shown in
Figure 11. Under the molecular function category, binding (11,887 unigenes, 48.08%) and catalytic activity (8845 unigenes, 35.78%) were majorly represented. A total of 83 unigene sequences were ascribed to antioxidant activity with only three transcripts linked to metallochaperone activity (
Figure 11A). Regarding the cellular components category, a high proportion of unigenes were ascribed to cell (4373 unigenes, 31.67%), membrane (3726, 26.99%), organelle (2894, 20.96%), and macromolecular complex (2079, 15.06%) (
Figure 11B). Out of the 35,050 unigene hit to the biological process category, 20 sub-categories were represented. A high proportion of sequences showed homology to metabolic process (9482 unigenes, 27.05%), cellular process (8773, 25.03%) and single-organismal process (6937 unigenes, 19.79%). A total of 1305, 39, 32, and 23 unigene sequences fell under signaling, reproduction, reproductive process, and immune system process (
Figure 11C). In discussing the dominant GO terms for Lycaenid butterflies
P. superans and
S. takanosis, we find that the profiles are very similar. The prominence of the GO biological process category over the GO molecular function and cellular components categories is understood in related species [
33]. Also, the dominance of metabolic and cellular process under the GO biological process category has been consistently predicted in other Lepidopteran species. GO classification for functions in the sugarcane giant borer (
Telchin licus licus) transcriptome show over 50% of GO terms represented under metabolic and cellular processes [
34]. Consistent with our observations, the most prominent GO molecular function categories include binding and catalytic activity and the most prominent GO cellular components are cell, organelle and macromolecular complex in Lepidoptera and other representative insects [
33,
35].
Figure 11.
Gene ontology analysis of S. takanosis transcriptome using BLAST2GO. The number of unigenes assigned to the sub-categories under three major categories of molecular function (A); cellular components (B); and biological processes (C). All data are presented at level 2 GO categorization.
Figure 11.
Gene ontology analysis of S. takanosis transcriptome using BLAST2GO. The number of unigenes assigned to the sub-categories under three major categories of molecular function (A); cellular components (B); and biological processes (C). All data are presented at level 2 GO categorization.
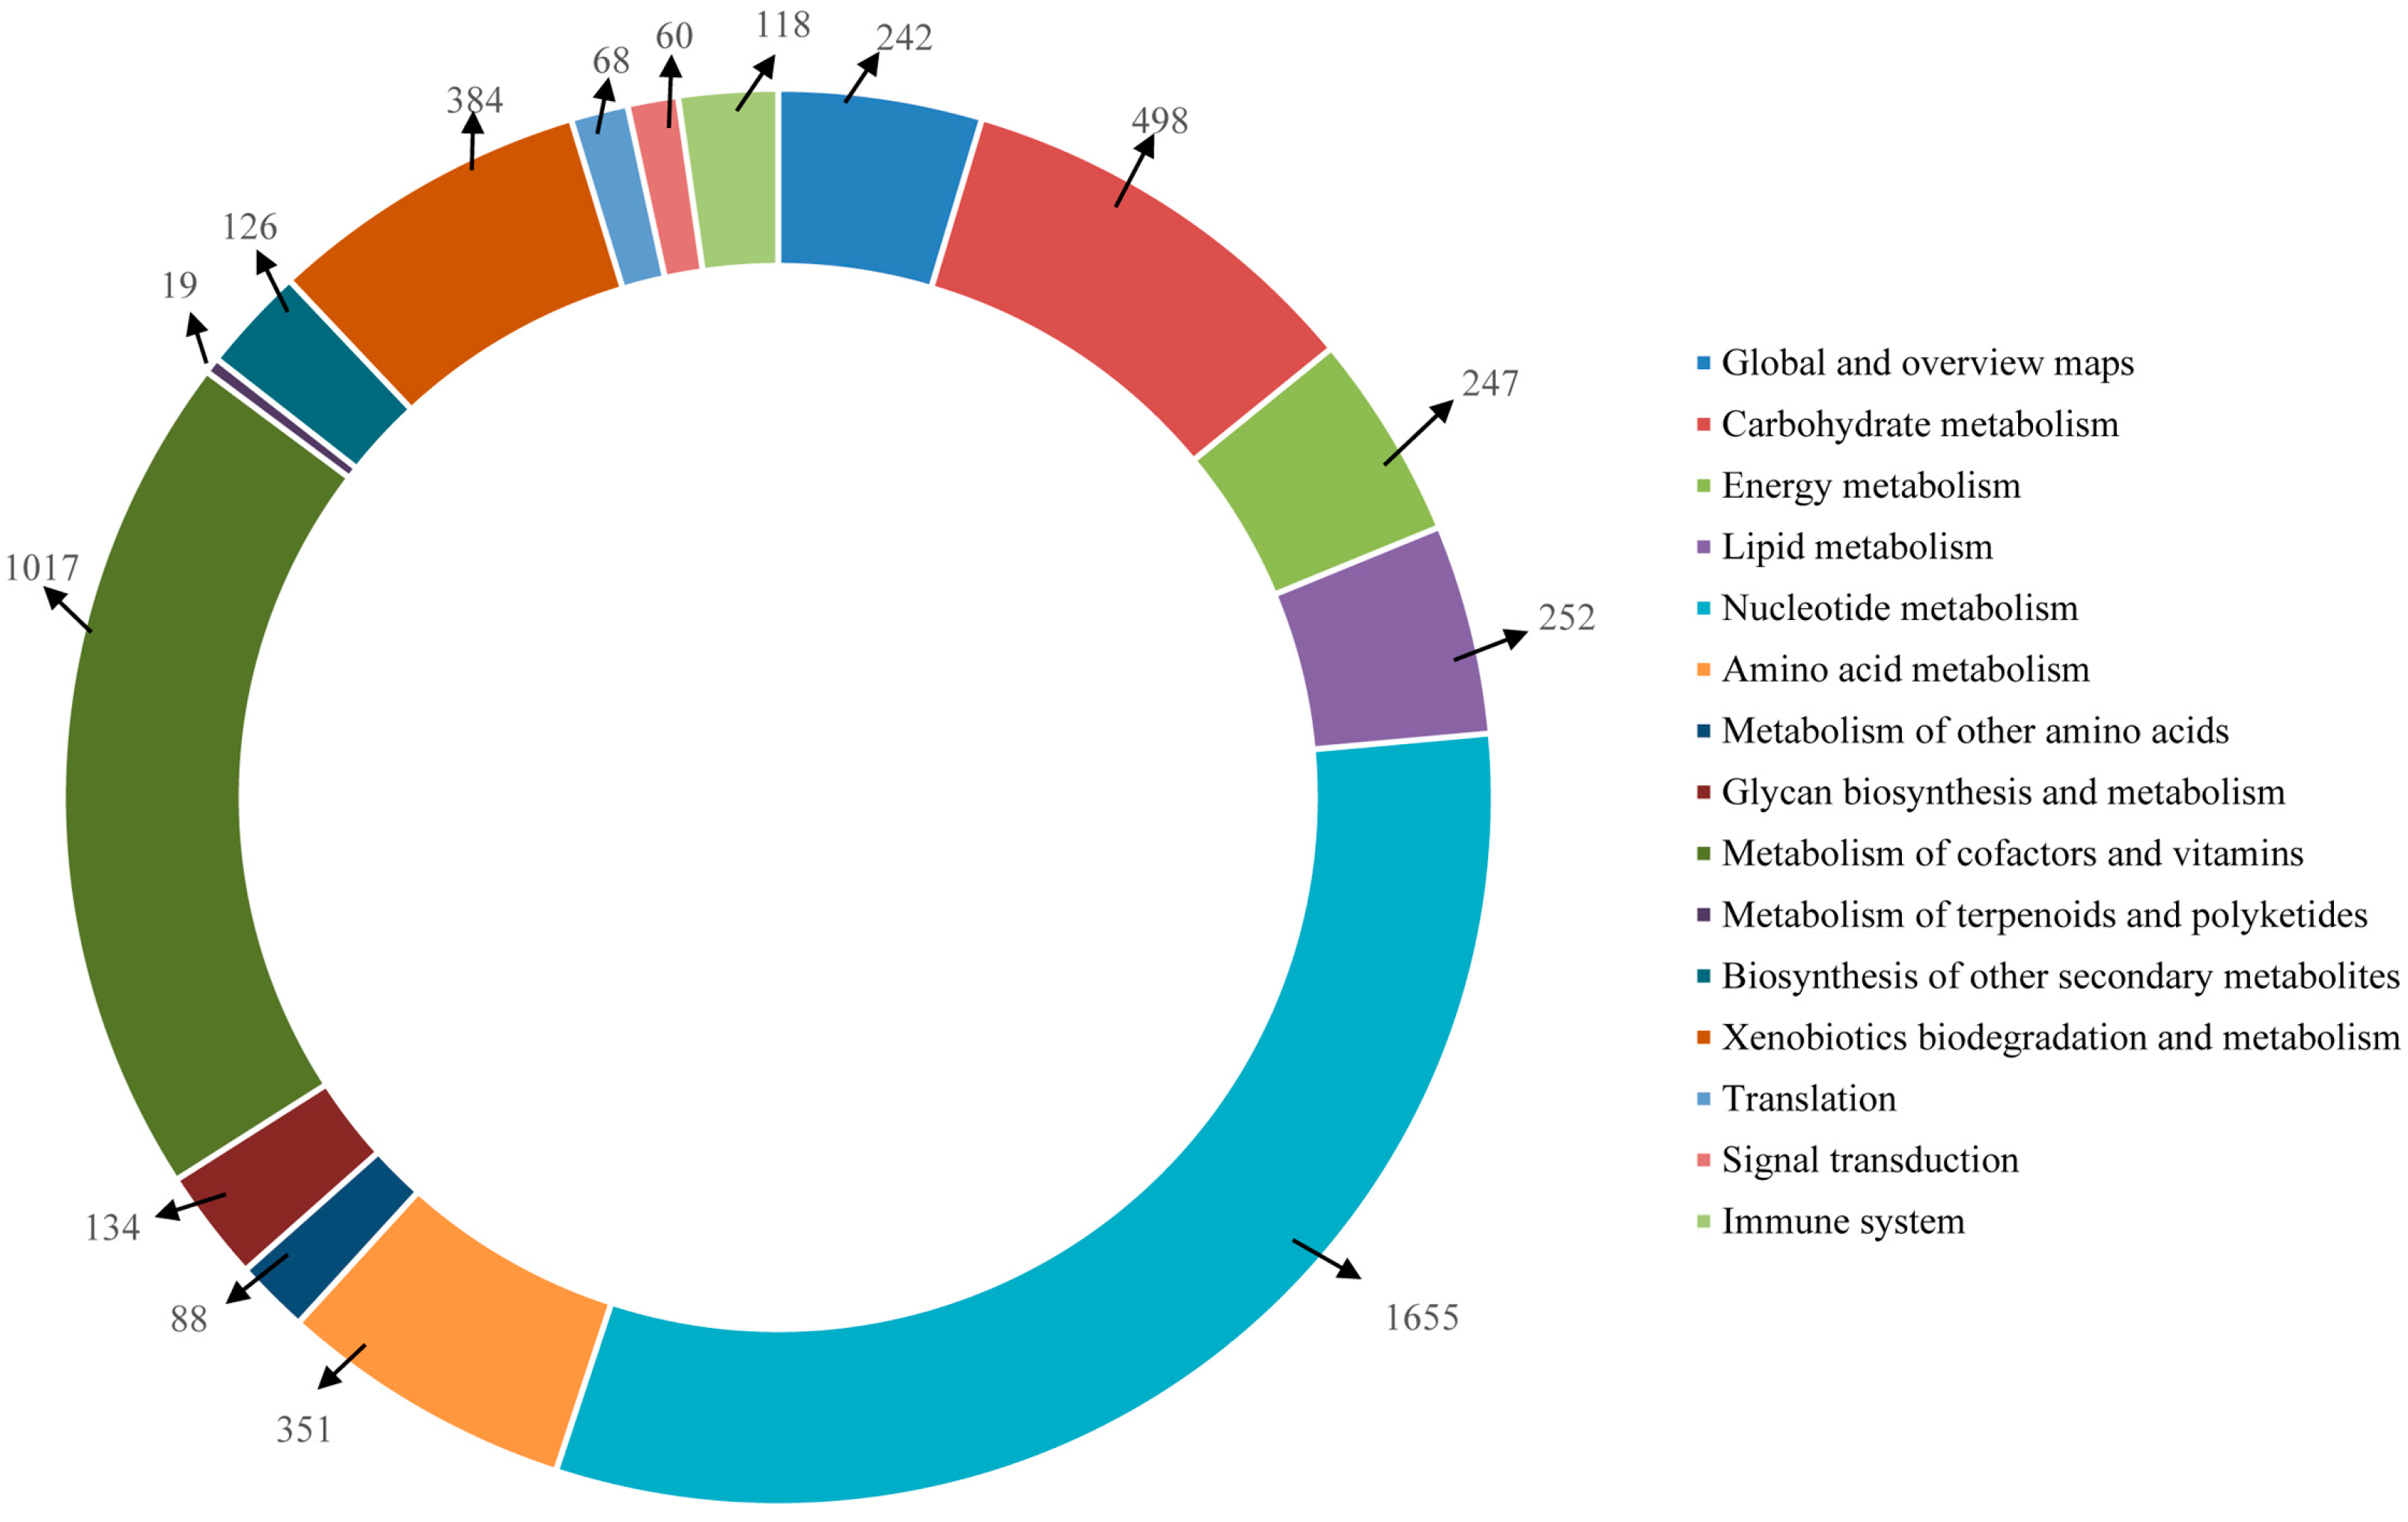
Furthermore, the unigenes were searched against the KEGG database for the identification of biological pathways active in the Lycaenid butterflies under investigation. In
P. superans, a total of 5259 unigenes were assigned to 116 pathways. Among them, 709 enzymes were assigned to these pathways. The number of unigenes assigned to the main pathways have been presented in
Figure 12. The unigenes predominantly fall into the metabolism (5013 unigenes, 95.32%) group, followed by the organismal systems (118 unigenes, 2.24%), genetic information processing (68 unigenes, 1.29%), and environmental information processing (60 unigenes, 1.14%) groups. Among the metabolism group, the majority of the unigenes were ascribed to the nucleotide metabolism sub-group (1655, 31.47%) followed by the metabolism of co-factors and vitamins (1017, 19.34%). Apart from the metabolism group, the unigenes exclusively fell under the translation sub-group for the genetic information processing group, the signal transduction sub-group for the environmental information processing group and the immune system sub-group for the organismal systems group.
Figure 12.
KEGG pathway assignment for P. superans transcriptome.
Figure 12.
KEGG pathway assignment for P. superans transcriptome.
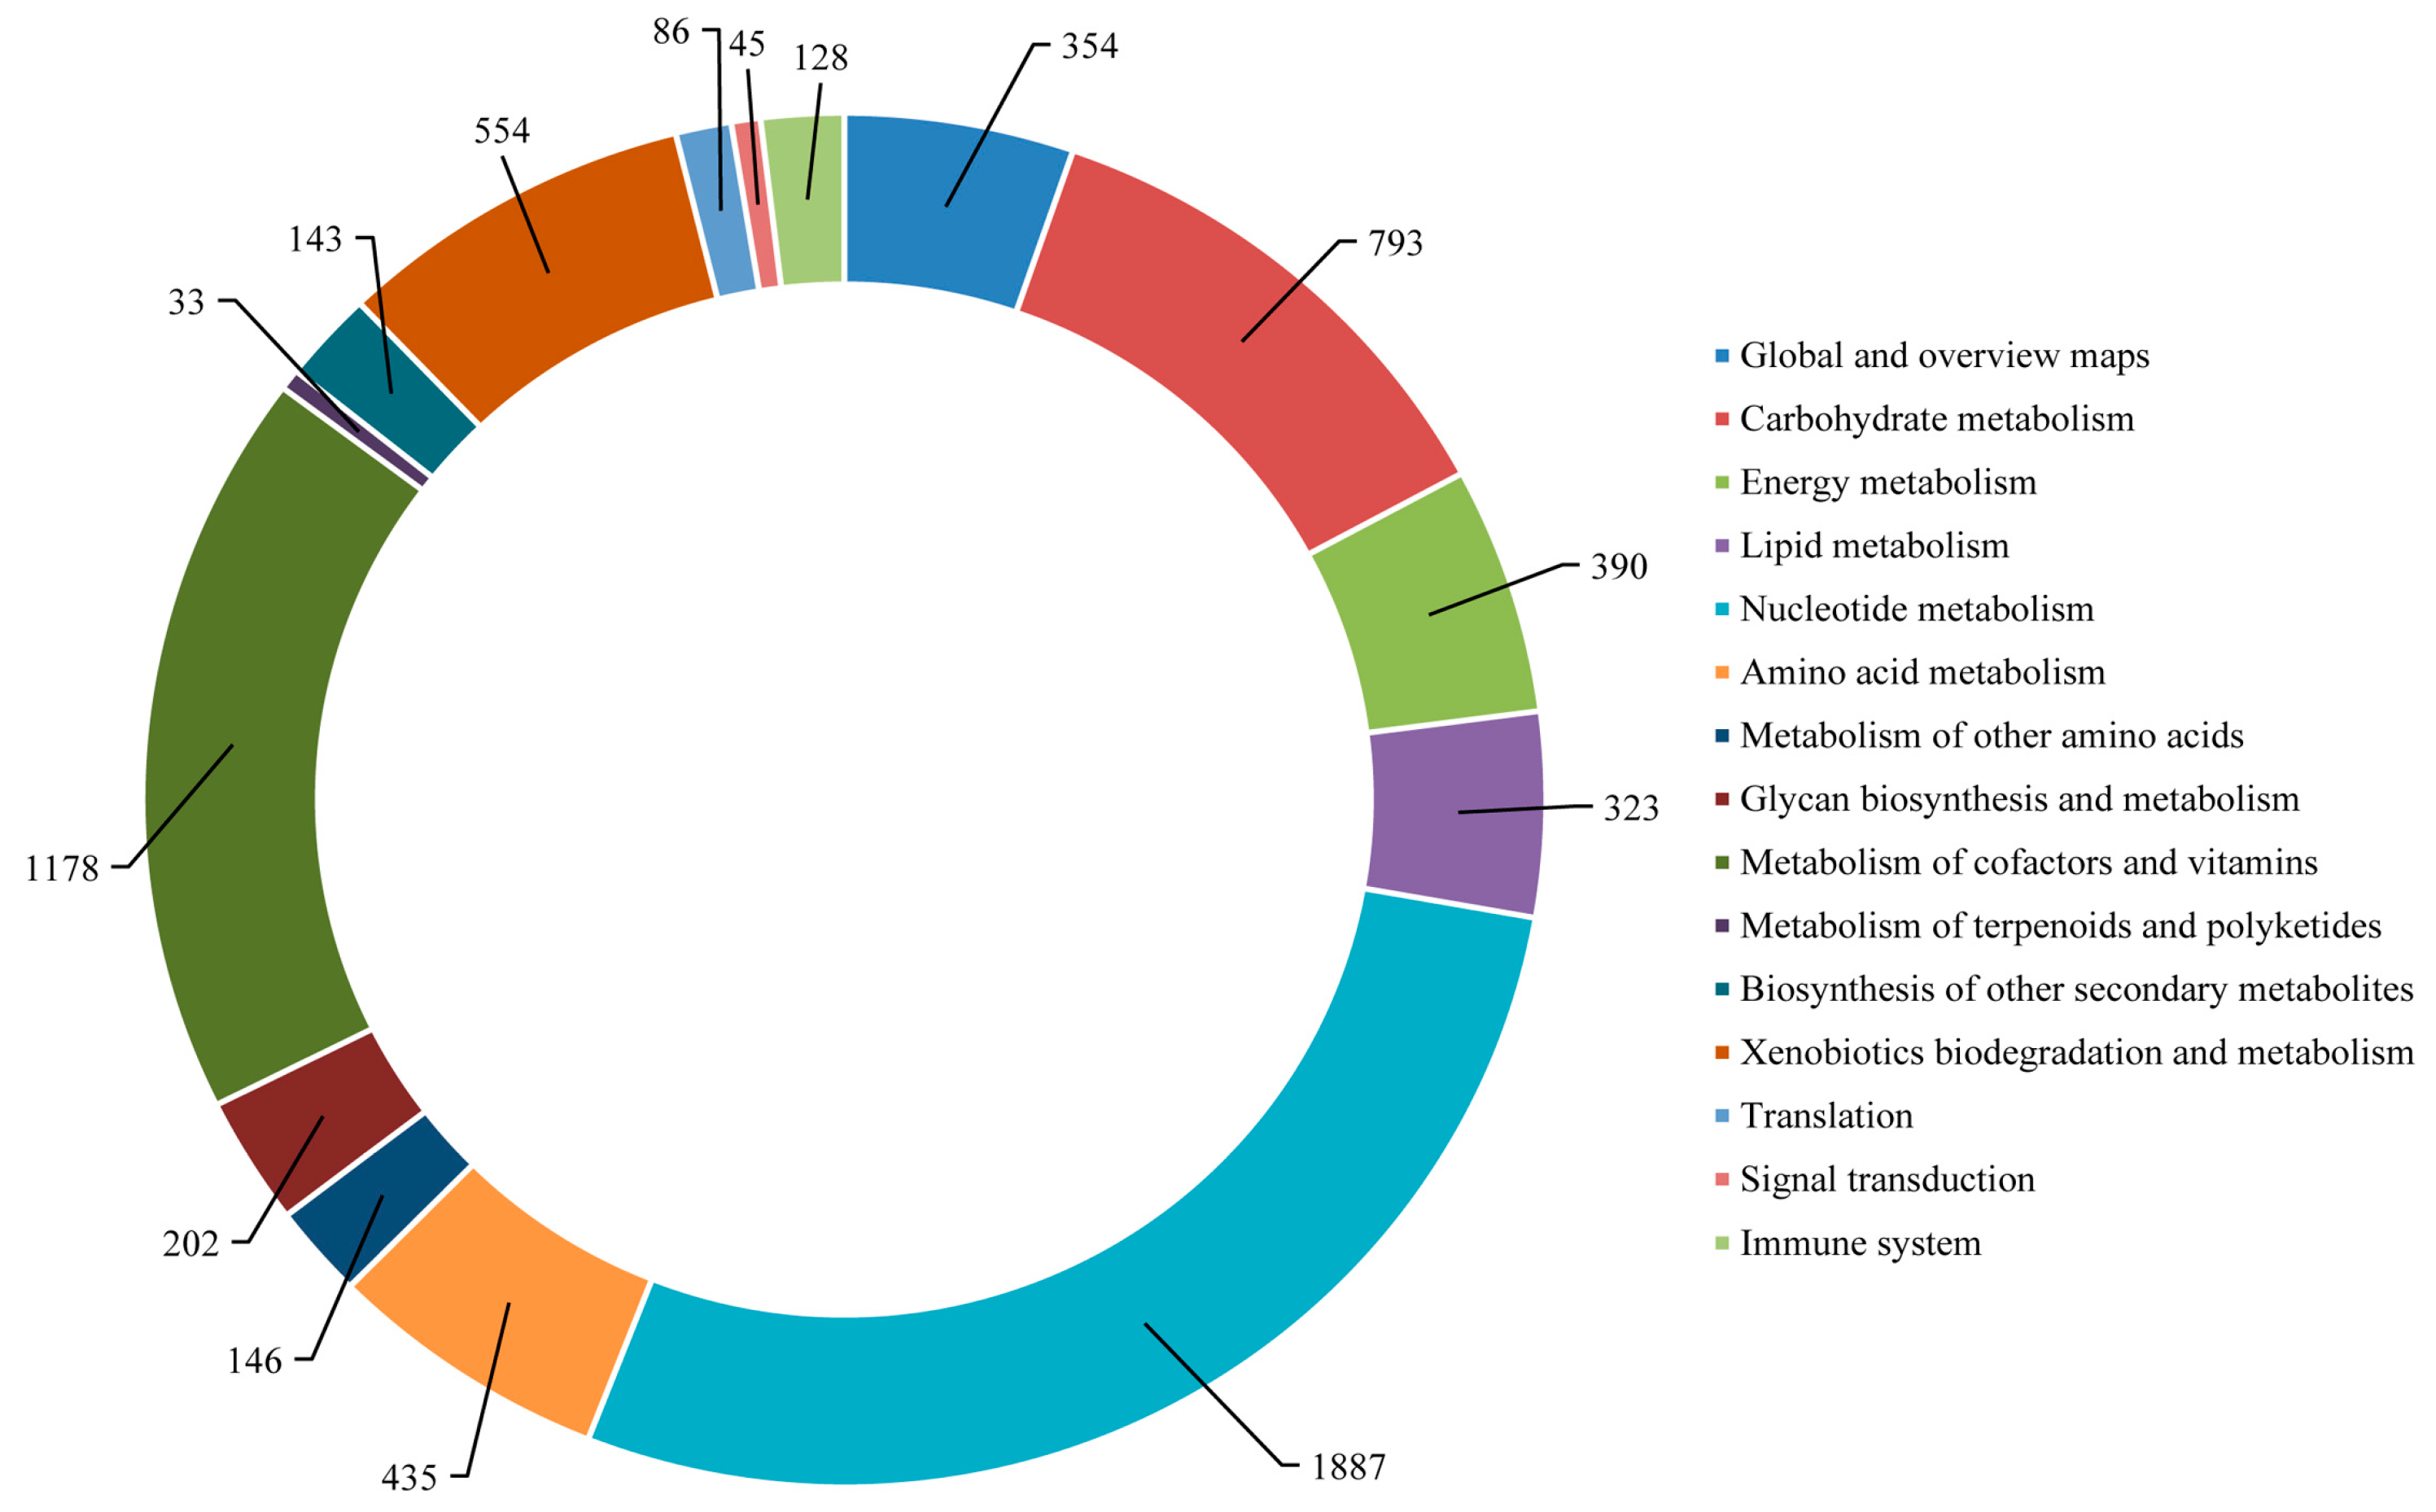
The mapping of
S. takanosis annotated unigenes to typical KEGG pathways identified a total of 6697 assembled sequences assigned to 119 pathways. Among them, 800 enzymes were assigned to these pathways. A total of 6438 (96.13%) unigenes belonged to the metabolism pathway, out of which 1887 unigenes fell under nucleotide metabolism and 1178 unigenes fell under the metabolism of cofactors and vitamins sub-group. A total of 128 unigenes (1.91%) were represented under the immune system pathway under the category of organismal systems. A total of 86 and 45 unigenes fell under the translation and signal transduction pathways of the genetic information processing and environmental information processing categories, respectively (
Figure 13). The KEGG pathways identified in
S. takanosis but not in
P. superans were chlorocyclohexane and chlorobenzene degradation, flavone and flavonol biosynthesis, fluorobenzoate degradation and steroid degradation, while the betalain biosynthesis pathway was observed in only
P. superans.
The GO classification, in a stricter sense, does not mean evidence of functionality; instead, it only suggests that a unigene sequence can be grouped to those of known (or predicted) function. An analysis to consider is the evidence code associated with each GO term. We find that a majority of GO terms (above 99% in both the sequenced Lycaenids) represented in our study are assigned the code “IEA” (inferred from electronic annotation), which are not manually curated and probably may contain more false positives. This is true, as out of the over 16 million GO annotations as of October 2007, 15,687,382 are in fact computationally derived IEA codes [
36]. Hence, in the discussion of GO term annotations for the study, we emphasize that not all GO terms are of equal validity and, based on this, the interpretations of unigenes relate only to predicted function. Additionally, we presume at this point that, using BLASTx, unigene sequences are found to share homology with known pathway genes in the KEGG database. In addition, it is critical to study both the partial and full-length unigene sequences at the functional level for major applications of transcriptome sequencing.
Figure 13.
KEGG pathway assignment for S. takanosis transcriptome.
Figure 13.
KEGG pathway assignment for S. takanosis transcriptome.
2.5. Protein Domain Analysis
InterProScan searches were conducted on the identified 107,950
P. superans unigenes by BLAST2GO. We discovered a total of 154,298 protein domains that include a maximum of 10,978 C
2H
2-like zinc finger domains. A summary of top 40 domains predicted in the
P. superans transcriptome has been shown in
Table S2. The notable conserved protein domains included the C
2H
2-like zinc finger, protein kinase, WD40 (also known as WD or β-transducin repeats), ABC-transporter, EGF-like (epidermal growth factor-like), Immunoglobulin-like, and fibronectin type-III domains. Among the enlisted top 40, we also found cytochrome P450, insect cuticle protein, G protein-coupled receptor, UDP-glucosyltransferase (Uridine diphosphate-glucosyltransferase), and major facilitator superfamily domains.
As with
P. superans, a protein domain classification of
S. takanosis transcripts was identified using BLAST2GO with the top 40 InterPro domains represented in
Table S3. With the notable presence of the C
2H
2-like zinc finger domain, WD40 repeat domain, Armadillo-like helical domain, and cytochrome P450 domain, as also observed with
P. superans, some other functional domains were characteristic of
S. takanosis unigenes.
The C-type lectin domain, cadherin domain and the thioredoxin-like fold domain showed significant
S. takanosis unigene hits. The C-type lectin domain proteins are known to be encoded by a number of genes in insects with strategic functions in the regulation of antimicrobial activity, proPO activation, and other associated immune functions [
37,
38].
The protein kinases and zinc finger domains show conspicuous presence in other invertebrate transcriptomes as these process cellular functions including survival, differentiation and apoptosis [
31,
39,
40]. The transcriptome abundant and conserved C
2H
2-like zinc finger domains exists in proteins as multiple tandem pairs of zinc fingers or tandem arrays of three or more zinc fingers, and hence are often represented by few proteins in surveyed species. These proteins are most likely DNA-binding transcription factors but can also bind to RNA and other protein targets [
41,
42]. The presence of WD40 repeat and Armadillo-like helical domains in 172 and 106 unigenes of
P. superans is consistent with similar analysis in insects and crustaceans [
43,
44]. The immunoglobulin and fibronectin type-III domains are basically involved in cell-signaling mechanisms related to cellular processes and immunity [
31,
45]. While cytochrome P450 genes are predominantly involved in the metabolism of xenobiotics in mollusks, polychaete and crustaceans, these sequences are categorized as “environmental response genes” in insects [
46]. The protein domain information provides vital clues to understanding the mechanisms of cellular survival and signaling mechanisms leading to adaptation in the endangered Lycaenid butterflies,
P. superans and
S. takanosis.
2.6. Discovery of Microsatellites
We used the MISA (MicroSAtellite identification tool) Perl script to explore the SSR profiles in unigenes of Lycaenid butterflies
P. superans and
S. takanosis. In the case of
P. superans, out of a total of 107,950 unigenes investigated, 400,330 SSRs were detected. A total of 89,877 sequences contained SSRs with 66,187 (61.31%) sequences containing more than one SSR. After eliminating the mono-nucleotide repeats (18,116 number of SSRs) and deca-nucleotide repeats (50 number of SSRs), a total of 382,164 SSRs were obtained. The di-nucleotide repeats were predominant (294,244, 76.99%) with a maximum of three tandem reiterations (254,481). In fact, three tandem repeats were the most common among the repeat motifs. The total number of di-nucleotide motifs were followed by tri- (19.5%), tetra- (2.68%), penta- (0.59%), hexa- (0.17%), hepta- (0.052%), and octa-nucleotide repeats (0.018%) (
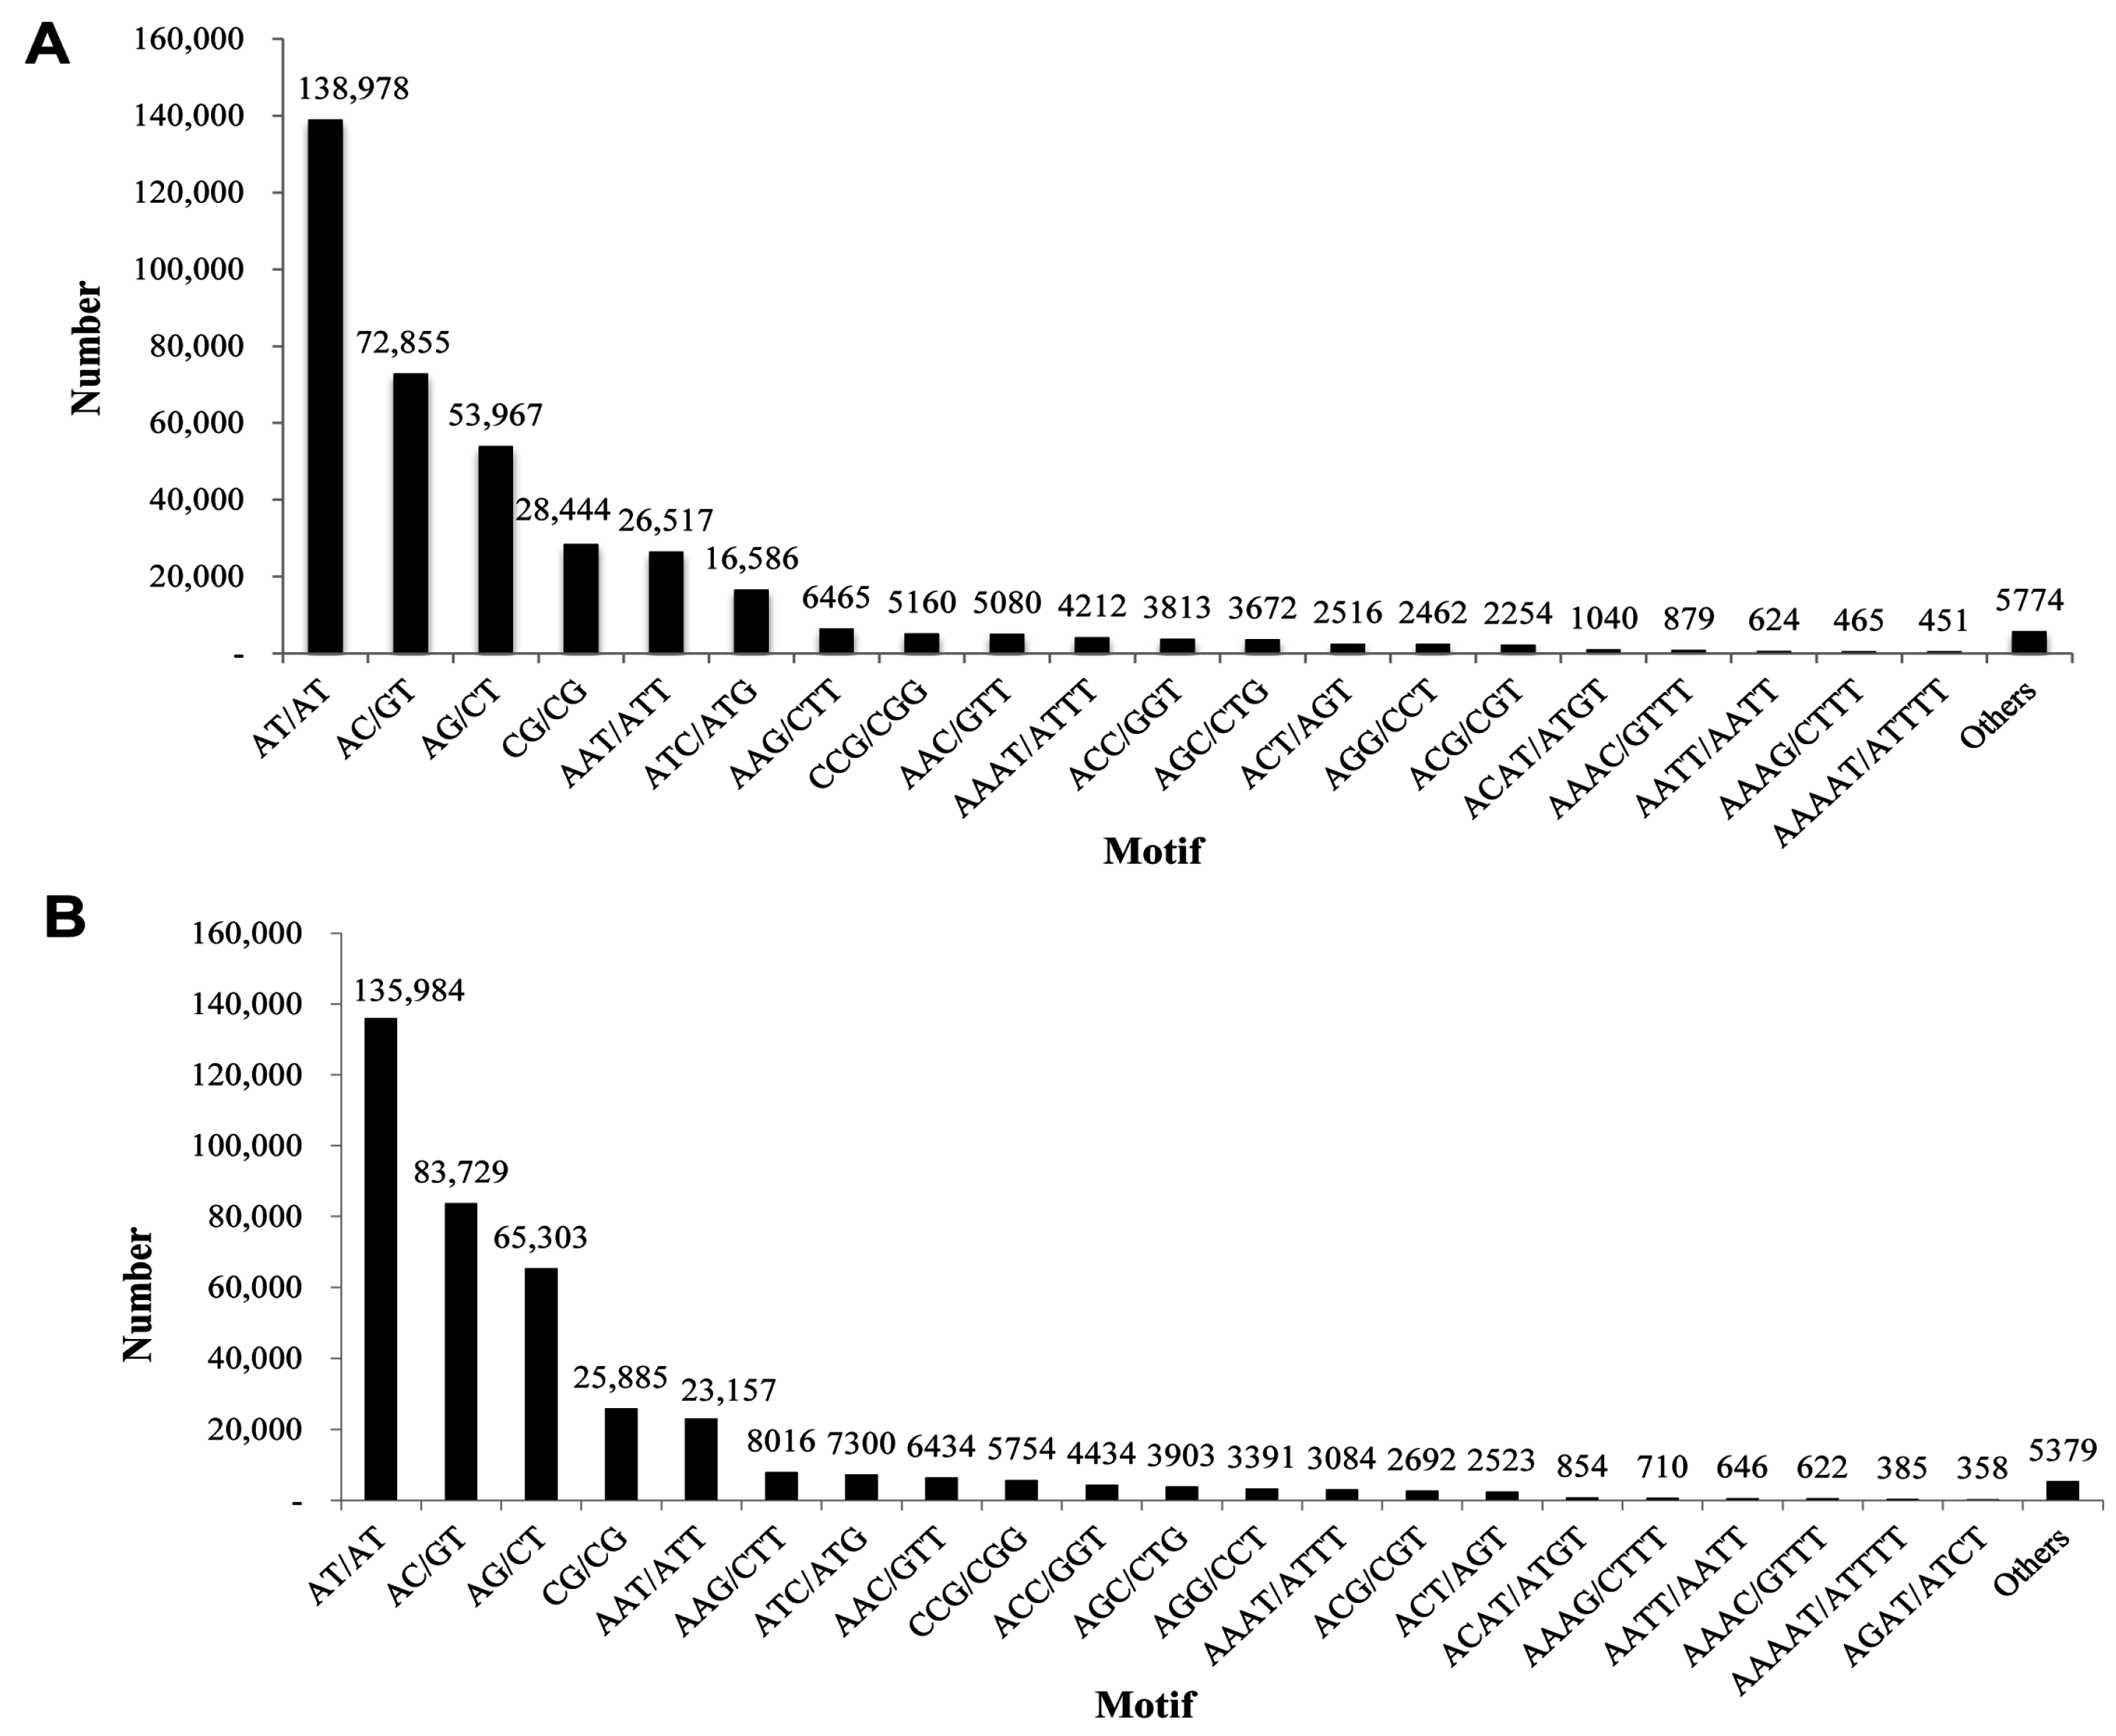
Table 3). AT/AT (138,978, 36.36%) was the most abundant motif in the SSR profile, followed by AC/GT (72,855, 19.06%), and AG/CT (53,967, 14.12%) (
Figure 14A). There was a consistency observed with the tri-nucleotide repeat motifs with minor variations in the numbers. From the
S. takanosis unigene information, we derived a total of 402,685 SSRs with 67,023 (55.33%) sequences containing more than one SSR. A total of 141,700 SSRs were present in compound form. We obtained a total of 390,516 SSRs after elimination of mono-nucleotide repeats (12,142 number of SSRs) and deca-nucleotide repeats (27 number of SSRs). The di-nucleotide repeats formed the largest group with 310,901 SSRs (79.6%) followed by the tri- (67,604), tetra- (9098), penta- (1960), hexa- (738), hepta- (148), and octa-nucleotide motifs (93) (
Table 4). The most abundant repeat motifs identified were AT/AT (135,984, 34.83%), AC/GT (83,729, 21.45%), and AG/CT (65,303, 16.73%) (
Figure 14B).
Figure 14.
Frequency distribution of simple sequence repeats based on motif sequence types. (A) P. superans; and (B) S. takanosis.
Figure 14.
Frequency distribution of simple sequence repeats based on motif sequence types. (A) P. superans; and (B) S. takanosis.
Table 3.
Summary of simple sequence repeat (SSR) types in the Protantigius superans transcriptome.
Table 3.
Summary of simple sequence repeat (SSR) types in the Protantigius superans transcriptome.
| Motif Length | Repeat Numbers |
|---|
| 3 | 4 | 5 | 6 | 7 | 8 | 9 | 10 | 11 | 12 | 13 | 14 | 15 | 16 | 17 | 18 | 19 | 20 | ≥21 | Number # | % $ |
|---|
| Di | 254,481 | 30,793 | 5254 | 1495 | 642 | 425 | 300 | 190 | 155 | 142 | 33 | 70 | 43 | 33 | 39 | 29 | 18 | 20 | 82 | 294,244 | 76.99 |
| Tri | 61,763 | 8858 | 2514 | 765 | 332 | 182 | 29 | 15 | 14 | 10 | 7 | 1 | 9 | 6 | 3 | 2 | 2 | 3 | 10 | 74,525 | 19.5 |
| Tetra | 8967 | 1050 | 196 | 32 | 1 | 1 | 4 | 3 | 3 | 0 | 0 | 2 | 0 | 0 | 0 | 2 | 1 | 0 | 3 | 10,265 | 2.68 |
| Penta | 2024 | 175 | 32 | 4 | 5 | 0 | 0 | 0 | 0 | 0 | 0 | 1 | 0 | 0 | 0 | 0 | 0 | 1 | 0 | 2242 | 0.59 |
| Hexa | 538 | 82 | 6 | 9 | 0 | 2 | 1 | 0 | 3 | 0 | 2 | 0 | 0 | 0 | 0 | 0 | 0 | 0 | 0 | 643 | 0.17 |
| Hepta | 156 | 14 | 3 | 3 | 1 | 3 | 1 | 2 | 1 | 0 | 0 | 0 | 1 | 1 | 0 | 0 | 0 | 0 | 0 | 186 | 0.052 |
| Octa | 55 | 1 | 2 | 0 | 0 | 0 | 1 | 0 | 0 | 0 | 0 | 0 | 0 | 0 | 0 | 0 | 0 | 0 | 0 | 59 | 0.018 |
| Total | 327,984 | 40,973 | 8007 | 2308 | 981 | 613 | 336 | 210 | 176 | 152 | 42 | 74 | 53 | 40 | 42 | 33 | 21 | 24 | 95 | 382,164 | 100.00 |
Table 4.
Summary of simple sequence repeat (SSR) types in the Spindasis takanosis transcriptome.
Table 4.
Summary of simple sequence repeat (SSR) types in the Spindasis takanosis transcriptome.
| Motif Length | Repeat Numbers |
|---|
| 3 | 4 | 5 | 6 | 7 | 8 | 9 | 10 | 11 | 12 | 13 | 14 | 15 | 16 | 17 | 18 | 19 | 20 | ≥21 | Number # | % $ |
|---|
| Di | 272,076 | 31,299 | 4624 | 1078 | 476 | 291 | 211 | 149 | 142 | 140 | 33 | 46 | 62 | 57 | 38 | 30 | 31 | 17 | 101 | 310,901 | 79.61 |
| Tri | 59,652 | 5834 | 1249 | 416 | 215 | 111 | 16 | 21 | 16 | 11 | 4 | 5 | 4 | 4 | 8 | 4 | 3 | 5 | 26 | 67,604 | 17.31 |
| Tetra | 7734 | 859 | 295 | 134 | 10 | 9 | 6 | 11 | 8 | 3 | 8 | 6 | 7 | 2 | 2 | 2 | 1 | 0 | 1 | 9098 | 2.33 |
| Penta | 1687 | 185 | 49 | 6 | 11 | 6 | 5 | 3 | 1 | 4 | 1 | 0 | 0 | 0 | 1 | 0 | 0 | 1 | 0 | 1960 | 0.50 |
| Hexa | 613 | 77 | 5 | 2 | 3 | 2 | 1 | 1 | 3 | 0 | 1 | 2 | 1 | 0 | 1 | 0 | 0 | 0 | 0 | 738 | 0.019 |
| Hepta | 113 | 17 | 2 | 5 | 3 | 1 | 3 | 1 | 2 | 0 | 0 | 0 | 0 | 1 | 0 | 0 | 0 | 0 | 0 | 148 | 0.003 |
| Octa | 73 | 4 | 10 | 2 | 0 | 0 | 2 | 2 | 0 | 0 | 0 | 0 | 0 | 0 | 0 | 0 | 0 | 0 | 0 | 93 | 0.002 |
| Total | 341,948 | 38,275 | 6234 | 1643 | 718 | 420 | 244 | 188 | 172 | 158 | 47 | 59 | 74 | 64 | 50 | 36 | 35 | 23 | 128 | 390,516 | 100.00 |
SSRs derived from the
Tenebrio molitor transcriptome database also show AT as the most abundant motif and SSRs with five repeat units as the most common genetic marker [
47]. Another study reported a SSR profile of 92 in the butterfly
Euphydryas editha [
48] which accumulates the rarest SSRs of Lepidopteran genomes. A thorough understanding of SSRs in the Lycaenid butterflies will be useful for the development of markers for genetic diversity assessment, gene flow characterization and conservation genomics. Additionally, SSRs from transcriptome datasets are critical for the identification of associations with functional genes and cataloguing the phenotypes [
49]. With the exception of Mono-nucleotide repeat motifs that may be a result of sequencing, other repeat motifs will be suitable for polymorphic microsatellite loci identification [
50,
51]. A list of informative PCR primers targeting the most relevant repeat types (di-, tri-, tetra-nucleotide with a minimum of seven repeats) has been shown for
P. superans (
Table S4) and
S. takanosis (
Table S5). These sequences will be significant in further studies of genetic variation, population and conservation genomics of the species.


 ,
, 


