Article

A Comparative Study of Laser Doppler Vibrometers for Vibration Measurements on Pavement Materials

1
EMIB Research Group, University of Antwerp, Groenenborgerlaan 171, 2020 Antwerp, Belgium
2
BIMEF Research Group, University of Antwerp, Groenenborgerlaan 171, 2020 Antwerp, Belgium
3
Op3Mech Research Group, University of Antwerp, Groenenborgerlaan 171, 2020 Antwerp, Belgium
*
Author to whom correspondence should be addressed.
Submission received: 5 October 2018 / Revised: 30 October 2018 / Accepted: 30 October 2018 / Published: 1 November 2018
(This article belongs to the Special Issue Recent Advances and Future Trends in Pavement Engineering)

Abstract

:
A laser Doppler vibrometer (LDV) is a noncontact optical measurement device to measure the vibration velocities of particular points on the surface of an object. Even though LDV has become more popular in road engineering in recent years, their signal-to-noise ratio (SNR) is strongly dependent on light scattering properties of the surface which, in some cases, needs to be properly conditioned. SNR is the main limitation in LDV instrumentation when measuring on low diffusive surfaces like pavements; therefore, an investigation on the SNR of different LDV devices on different surface conditions is of great importance. The objective of this research is to investigate the quality of two types of commercially available LDV systems—helium–neon (He–Ne)-based vibrometers and recently developed infrared vibrometers—on different surface conditions, i.e., retroreflective tape, white tape, black tape, and asphalt concrete. Both noise floor and modal analysis experiments are carried out on these surface conditions. It is shown that the noise floor of the He–Ne LDV is higher when dealing with a noncooperative dark surface, such as asphalt concrete, and it can be improved by improving the surface quality or by using an infrared LDV, which consequently improves the modal analysis experiments performed on pavement materials.

1. Introduction

Nondestructive testing (NDT) is an important part of optimizing any pavement management system. Techniques such as falling weight deflectometer (FWD) using geophones [1] and rolling wheel deflectometer (RWD) using laser deflection system [2] are popular among researchers to find properties of the road. Moreover, accelerometers can be used to find the mechanical properties of asphalt concrete by applying a back calculation technique [3]. In recent years, laser Doppler vibrometer (LDV) has been introduced to conduct noncontact measurements in road engineering, and it is replacing the traditional vibration sensors [4,5].
LDV is an optical measurement system that is used to perform noncontact vibration measurements on a surface [6]. LDV devices were first introduced in the 1980s, but their limited sensitivity and low signal-to-noise ratio (SNR) allowed measurements only on very diffusive surfaces or by applying a retroreflective tape on the testing objects. It was only in the early 1990s that hardware and software developments increased instrumentation performances and applicability, leading to many researchers using LDV. LDV can significantly extend measurement capabilities compared to traditional vibration sensors, such as accelerometers, because the results will not be affected by errors due to mass loading of accelerometers. This is relevant for modal parameter estimation, especially when testing light or small structures or highly damped nonlinear materials [7]. LDV can also replace accelerometers for vibration measurement in cases where installing accelerometers in different measurement points is difficult [8]. One of the main applications of the LDV in road engineering is traffic speed deflectometer (TSD). TSD is an RWD that uses Doppler technology to measure pavement deflection while traveling at normal traffic speed. Using the measured deflection, bearing capacity indices can be derived, and pavement fatigue or residual life can be estimated [5]. Furthermore, scanning laser Doppler vibrometer (SLDV) has the ability to rapidly and precisely move the measurement point on the structure, allowing the analysis of a large surface with high spatial resolution. Using an SLDV, it is possible to perform modal analysis on targets and evaluate the natural frequencies, modal damping, and modal shapes of a structure [9,10]. This method can be used for pavement materials in order to conduct a modal analysis experiment and determine the mechanical properties of different types of asphalt concretes using a back-calculation technique [11].
For many years, the He–Ne laser was the leading technology used in commercial laser Doppler instruments. The desire for long-range measurements without reduction of the signal quality has seen the introduction of an instrument with a higher power infrared (invisible) fiber laser, which is used in conjunction with a green laser for sighting purposes. The infrared laser technology is now migrating into instrument designs for short-range applications on optically less cooperative surfaces, finally challenging the supremacy of the He–Ne laser [12]. This is an important improvement as the poor surface quality of the asphalt concretes can increase measurement uncertainties.
In data acquisition and signal processing, the noise floor is a measure of the summation of all the noise sources and unwanted signals generated by the entire data acquisition and signal processing system. In any measurement, the minimum resolvable signal level must be sufficiently larger than the noise content of the signal to obtain reliable measurements. To be able to use an LDV system for measurement, it is important to know the minimum detectable level. The noise floor can be established by examining the content of the spectrum of a signal measured by LDV where no external vibration is applied to the system. It is dependent on the optics, electronics, the software of the LDV, and the properties of the media and reflective target [13]. Speckle noise is one of the main sources of noise in LDV, especially in cases where there is relative motion between the test item and laser beam [7]. This particular type of noise has been investigated and modeled by several researchers [14,15,16].
In this research, noise floor measurements are firstly reported for two types of LDV on four different surface conditions. Then, a modal analysis experiment is designed to investigate the ability of both instruments to perform measurements on different types of pavements with both treated and untreated surface conditions.
This paper is divided into four sections. The first section includes the introduction and state of the art. In Section 2, an overview of the research methodology, experimental setup, and measurement procedure is given. In Section 3, the measurement results are discussed in detail. This entails a comparison of the noise floor of both instruments, the effect of the surface quality on the noise floor measurements, and modal analysis of three types of pavements. Finally, conclusions of the research are given in the last section.

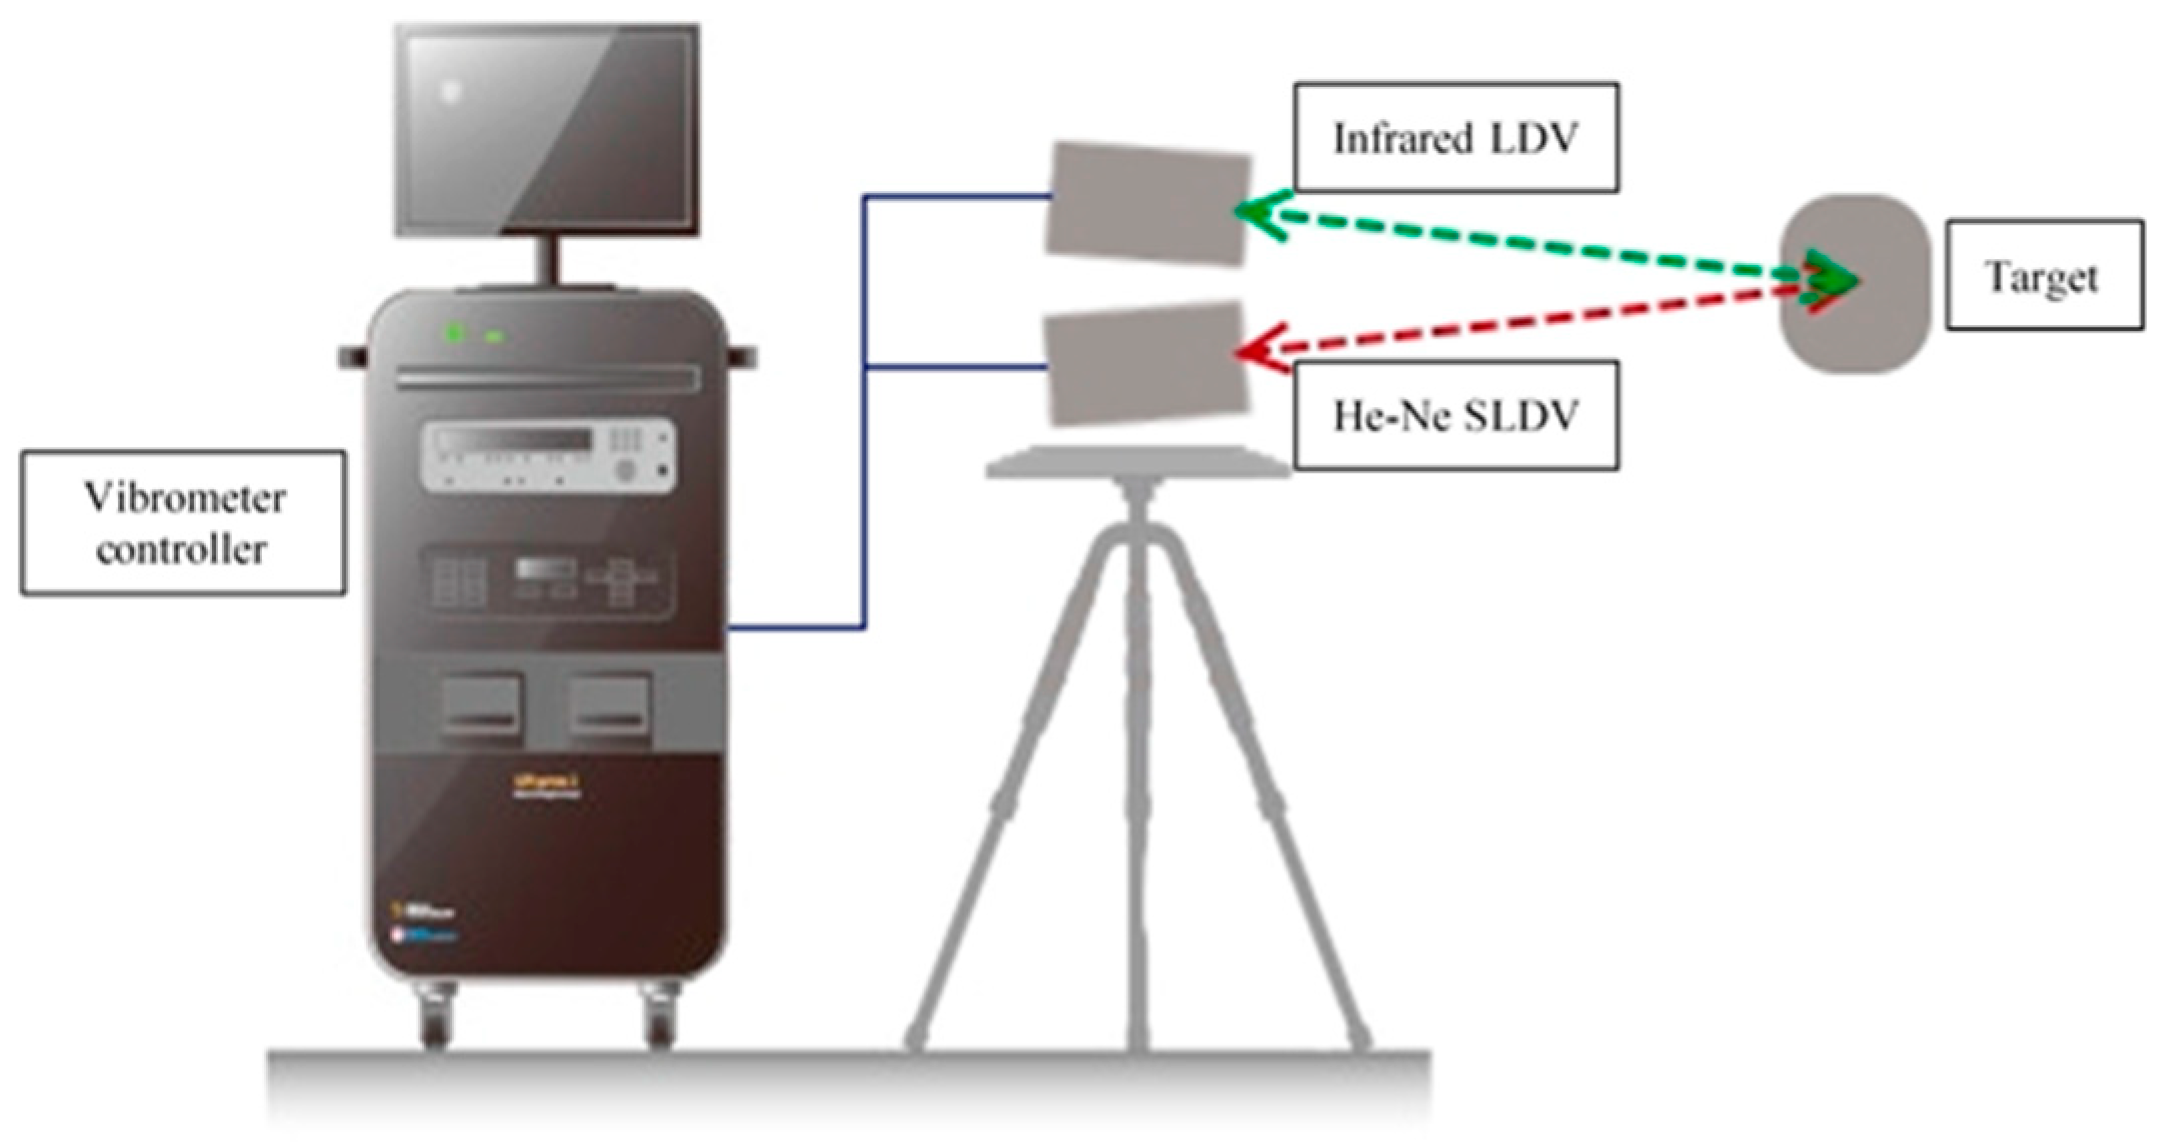
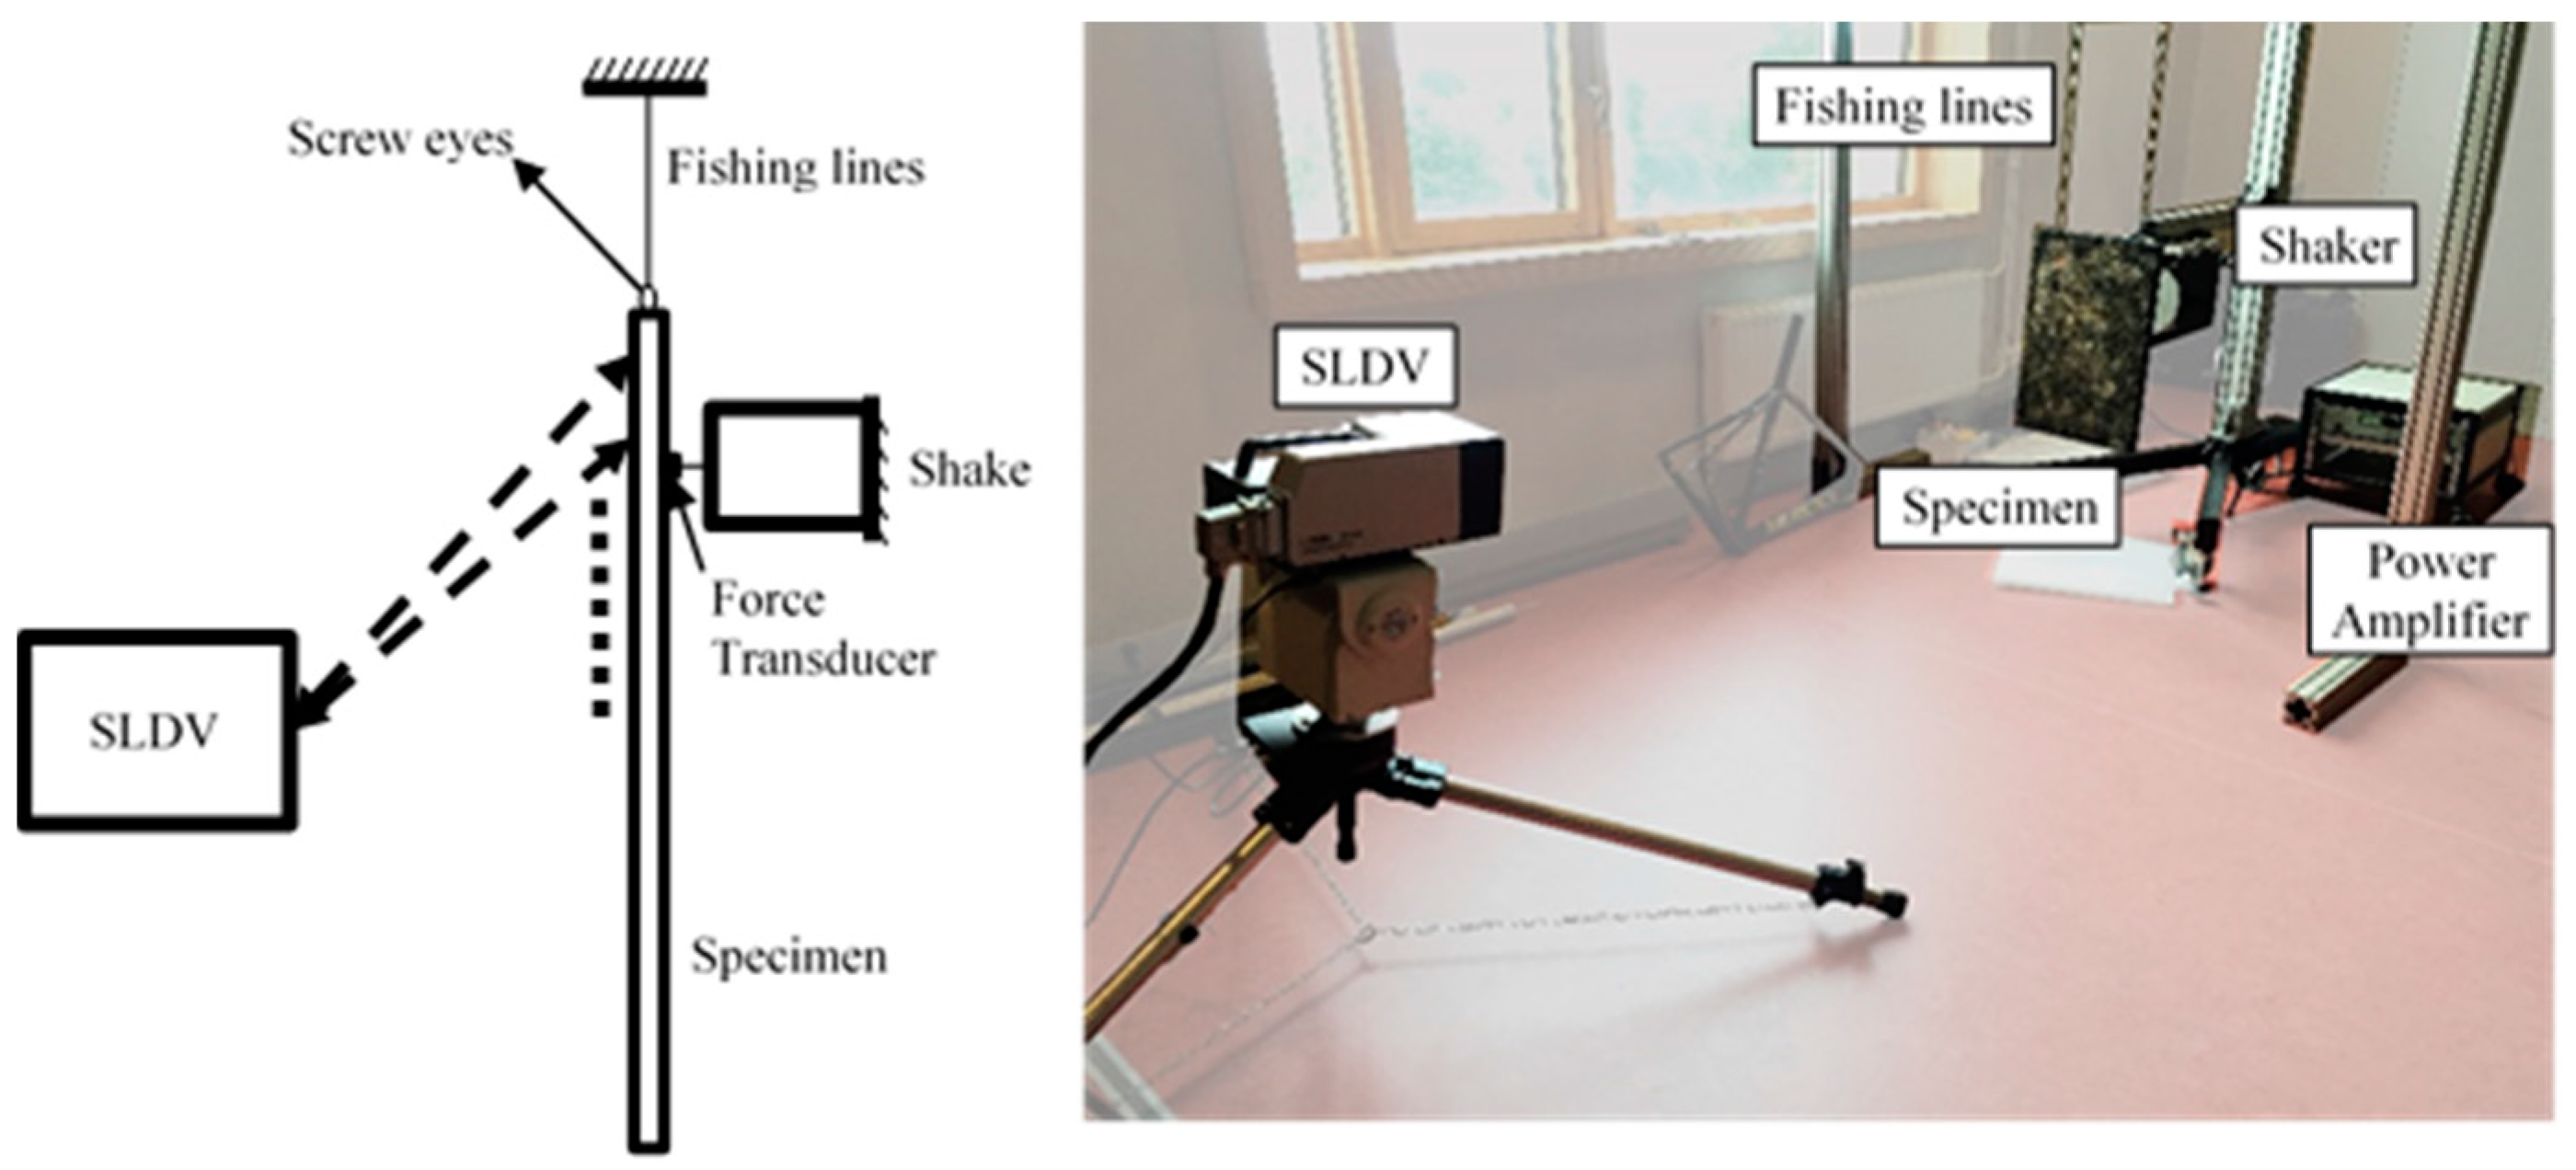
2. Materials and Methods
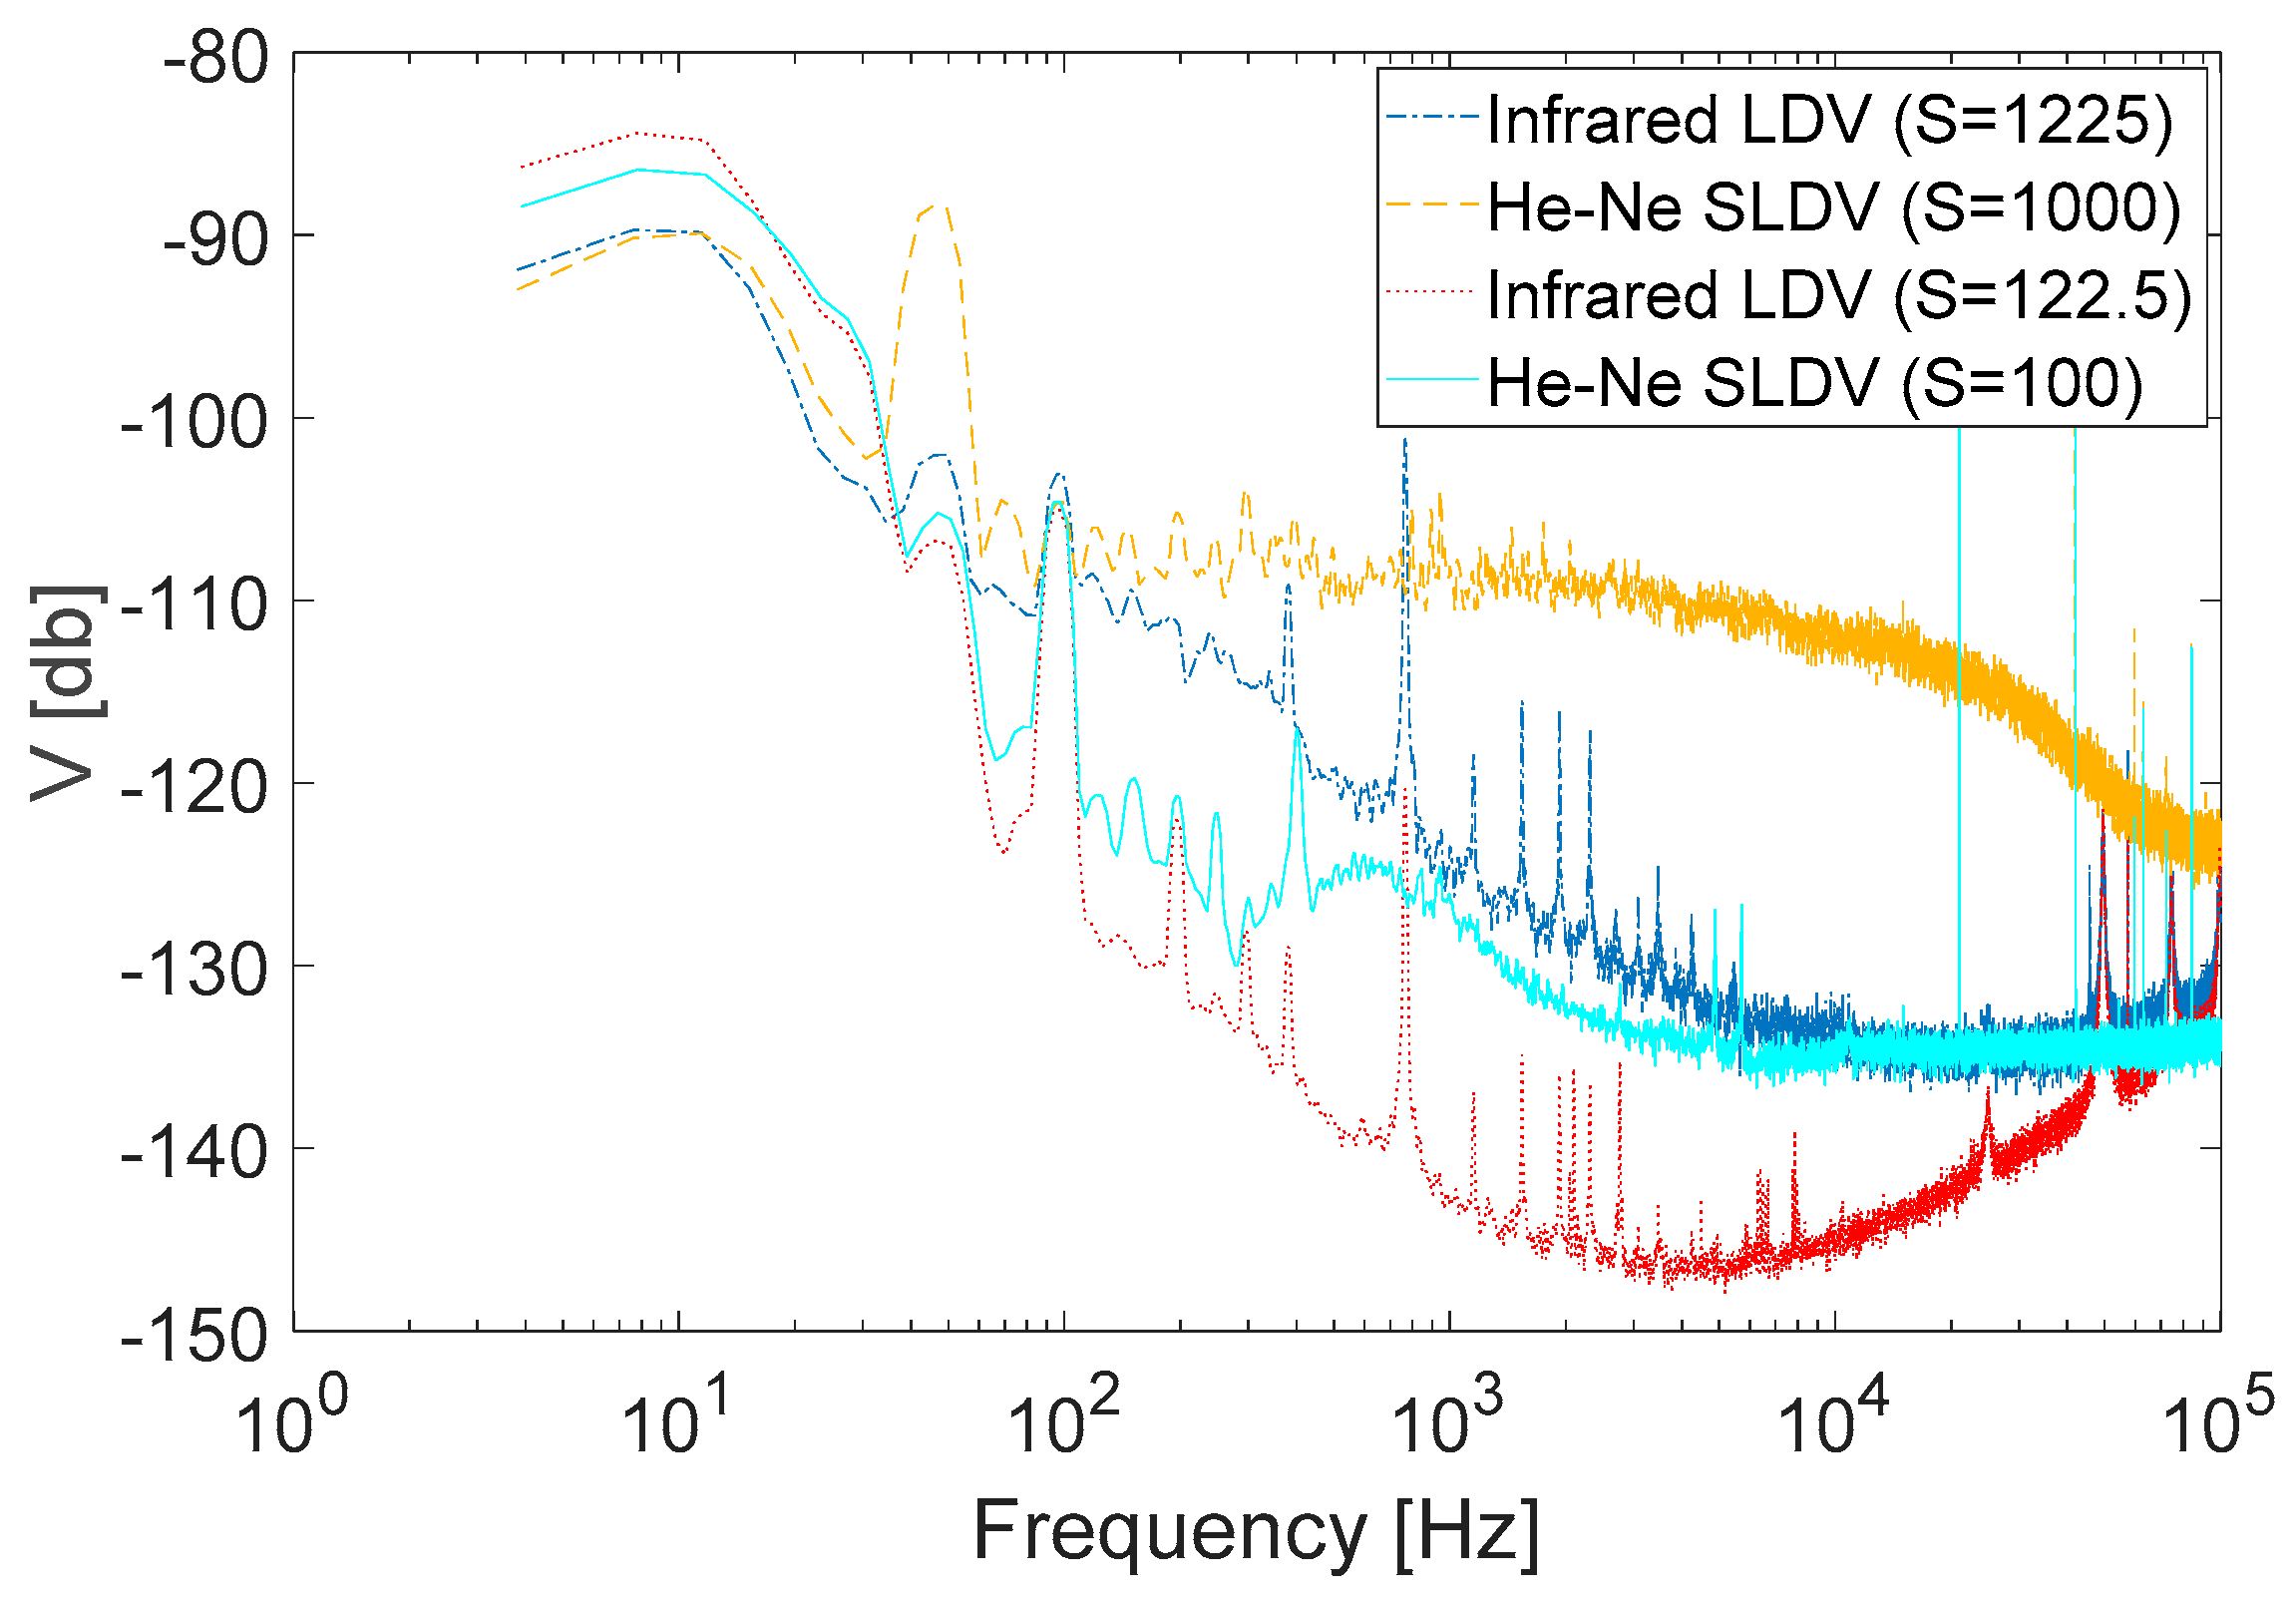
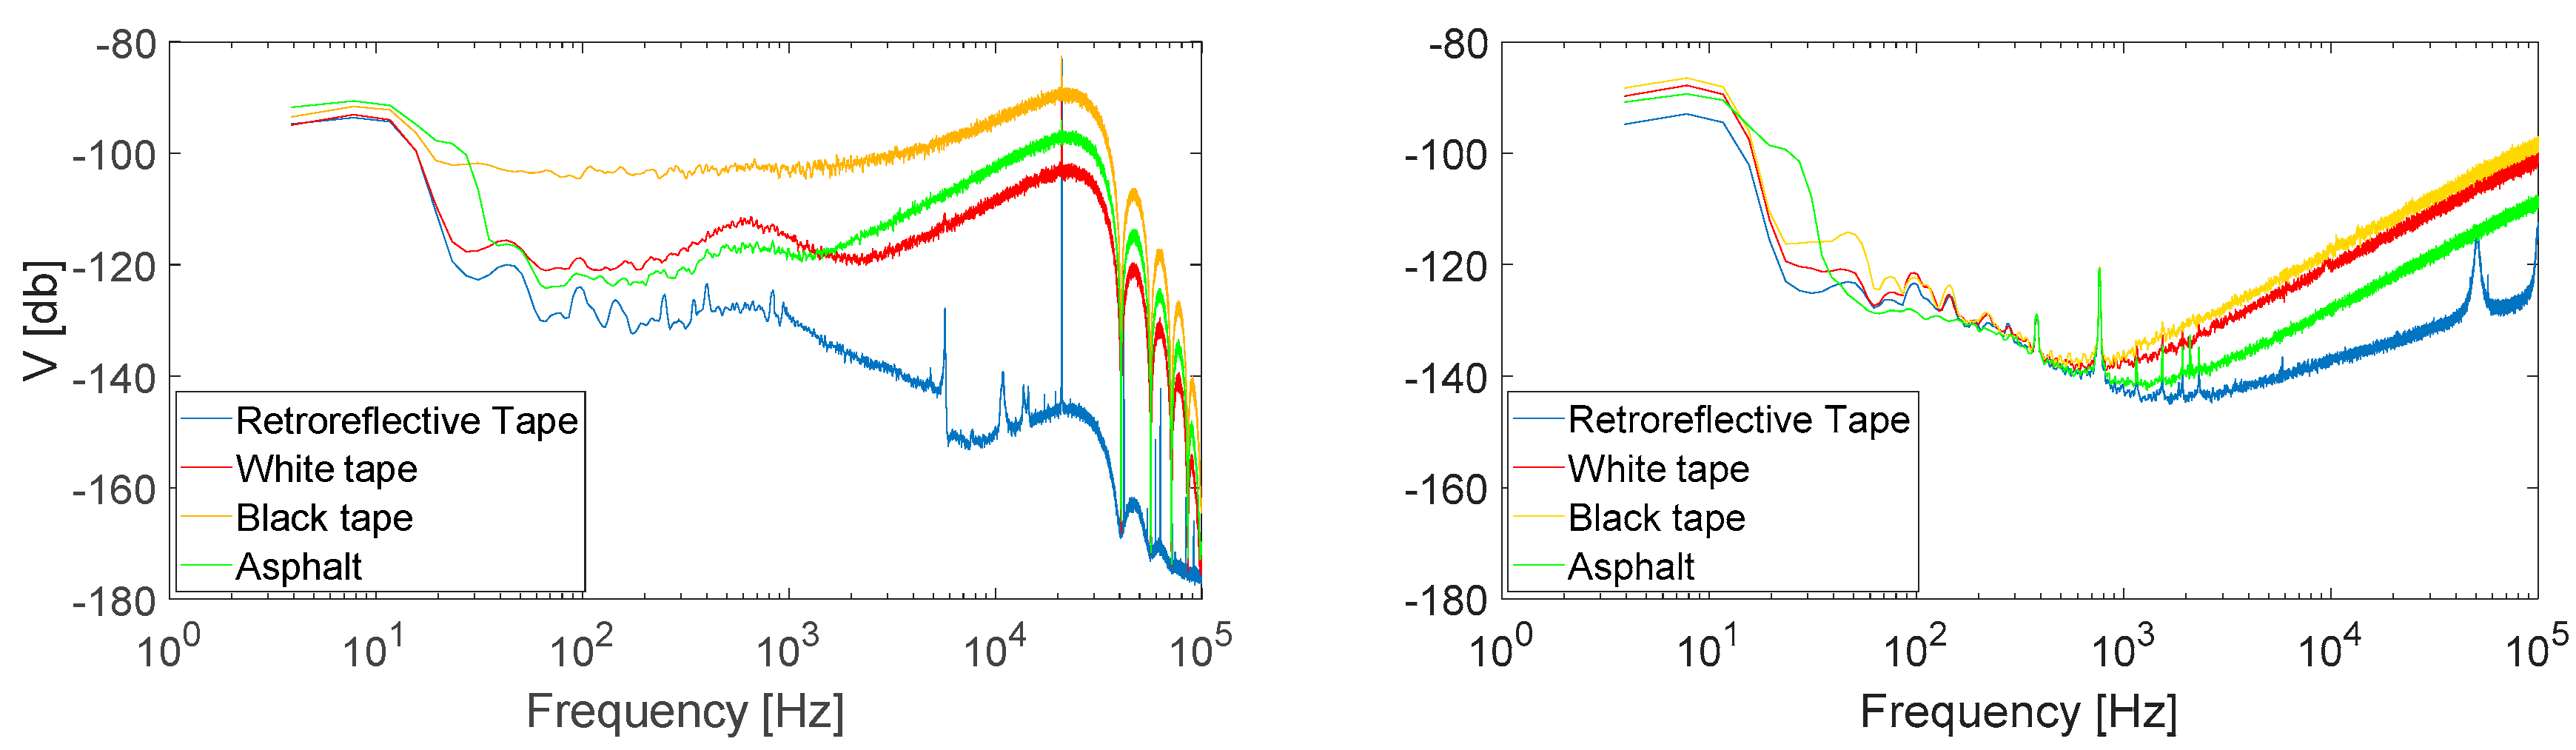
Three measurement instruments were used in this research: a He–Ne SLDV (Polytec PSV-400), an infrared LDV (Polytec RSV-150) with two short-range and long-range lenses, and an infrared SLDV (Polytec PSV-500-3D Xtra). The LDV has the ability to carry out measurements at one point, and the SLDV has a computer-controlled mirror that can direct the laser to the desired measurement points so that measurements can be performed on a predefined grid on the surface of an object. The He–Ne SLDV has a class 2 laser with 633 nm wavelength and less than 1 mW power. The infrared LDV has a green targeting laser with 523 nm wavelength and a measurement laser with a wavelength of 1550 nm. The output power of the infrared LDV when both lasers are in operation is 10 mW class 2. The autofocus of both SLDV instruments is done automatically, but the infrared LDV has two long-range and short-range lenses and has to be manually focused. The short-range lens is for standoff distances between 1 to 5 m, and the long-range lens is used for a standoff distance larger than 5 m and up to 300 m.
Two sets of experiments were conducted in this research. The first experiment was to estimate the noise floor on targets with different surface conditions. The He–Ne SLDV and the infrared LDV were placed at the same standoff distance in front of the target, and measurements were conducted on one point on the target (Figure 1).
These instruments have different analog-to-digital converters (ADC); therefore, the sensitivity of the ADC is important for the experiments. To be able to compare the devices with each other, closest sensitivity values were chosen for both devices in a way that the less accurate device (He–Ne SLDV) had a lower sensitivity. Afterwards, to compare the noise floor of each device for different surfaces, the sensitivity of the He–Ne SLDV and infrared LDV were set to 20 and 122.5 mm/s/v, respectively. The four investigated targets were surfaces covered with a retroreflective tape, white tape, black tape, and an asphalt concrete.
The second experiment was designed to investigate the ability of different SLDVs to measure treated and untreated pavements. Modal analysis experiments were conducted to find the modal parameters of three different pavement slabs. First, a He–Ne SLDV was used for measurements on pavements with poor surface quality. To investigate the effect of surface quality, one side of the specimens were painted with a white spray paint (Ardrox® 9D1B aerosol), and the same modal analysis experiments were conducted on the painted side. Meanwhile, mode shapes of the specimens were predicted by a finite element model, and the modal assurance criterion (MAC) was calculated between the mode shapes acquired by SLDV and FEM. These type of experiments can be used to find mechanical properties of specimens with inverse method [11]. Then, the same modal analysis experiments on the same specimens were conducted with a 3D infrared SLDV.
The test items were three types of pavements. The first one was a thin asphalt layer (TAL) pavement with dimensions of 59 cm in length, 39 cm in width, and 2.6 cm in thickness. This type of asphalt is used as a top layer with an optimized fine texture in order to reduce tire vibrations and therefore the tire/road noise. The pavement used in the research project was the N19 in Kasterlee, Belgium [17,18] and Antwerpen, Belgium [19]. The second specimen was a 50*18*5.5 cm poroelastic road surface (PERS). PERS is a type of low-noise pavement with a higher elasticity than conventional road surfaces and a larger percentage of voids. The PERS has a porous structure composed of granular rubber made from recycled tires, aggregates, and polyurethane (PUR) resin as a binder [20,21]. The third test specimen was a 59*39*3.4 cm stone mastic asphalt (SMA). SMA has been used successfully in Europe for over 40 years to provide better rutting resistance and to resist studded tire wear [22]. As represented in Figure 2, in this part, the specimens were hung from a frame using two screw eyes and fishing lines to simulate the free-free condition. A Brüel & Kjær modal exciter type 4824 excited the specimens with a periodic chirp signal between the frequency range of 5 to 1000 Hz. Signals were generated using the Polytec onboard signal generator and amplified by a Brüel & Kjær power amplifier type 2732. A Brüel & Kjær force transducer type 8230-001 was placed between the tip of the shaker and the specimen to measure the exact force used for FRF calculations. Then, using an accurate modal parameter estimator called the Polymax estimator [23], modal parameters of the specimens were calculated from the spectrum of measured signals. An overview of all the experiments and their settings are presented in Table 1 and Table 2.

3. Results

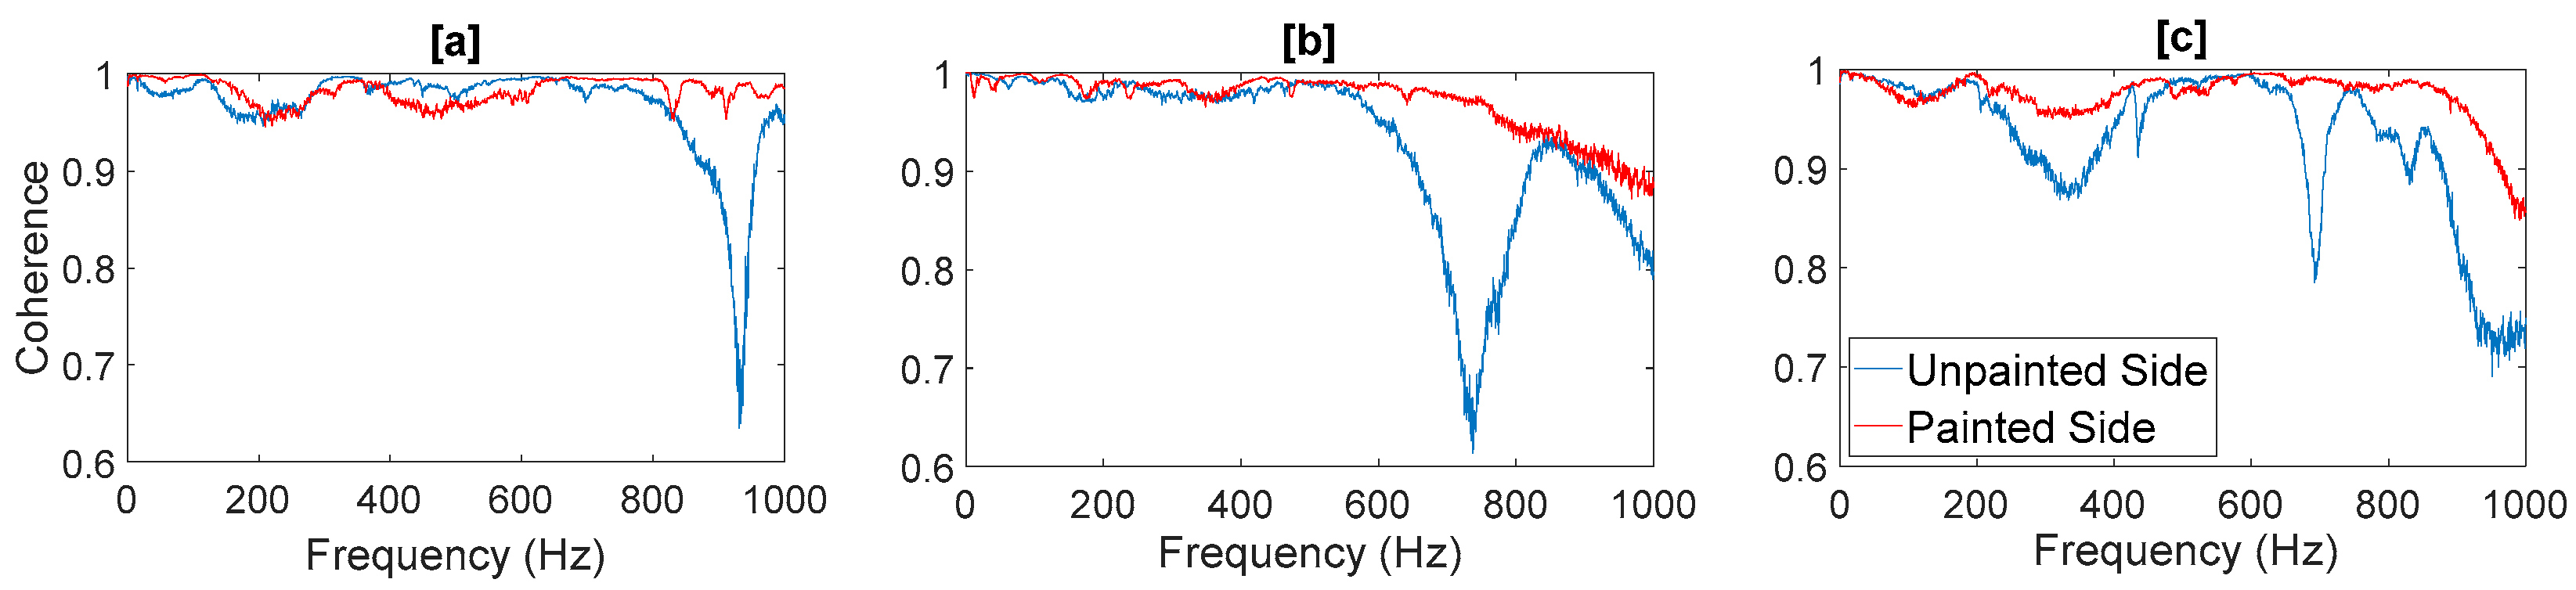
3.1. He–Ne vs. Infrared LDV

In this section, the noise floor measurements of a He–Ne SLDV and an infrared LDV on a retroreflective tape were investigated (see Table 1). The sensitivities of the ADCs of the devices were chosen as explained before. Both ADCs had the same low pass filters so that the noise floors could be compared until 105 Hz. Figure 3 shows that the noise floor of the He–Ne SLDV was higher than the noise floor of the infrared LDV in two different sensitivity settings, even though the sensitivity of the He–Ne SLDV was slightly lower in both cases compared to the sensitivity of the infrared LDV.

3.2. He–Ne vs. Infrared LDV on Different Surfaces

In this step, the same noise floor experiments were conducted on different surface conditions. Figure 4 shows that the noise floor of the He–Ne SLDV was higher than noise floor of the infrared LDV regardless of the surface conditions. The difference between noise floors of the instruments was at its lowest when retroreflective tape was used on the surface of the object, and it was more excessive for darker surfaces, especially at high frequencies. It could also be seen that the trend of the noise floor of each instrument was similar for all surfaces. For the He–Ne SLDV, the noise floor was almost the same with white tape and asphalt surface, and it was the highest for the black tape. It should be mentioned that the He–Ne SLDV is not able to autofocus the laser spot on black tape or the asphalt surface and therefore the laser spot was focused on the surface manually. Moreover, the reason for the sudden drop in the noise floor of the He–Ne LDV after 25 kHz was that the frequency range of the decoder of the He–Ne LDV was 0 to 25 kHz. The noise floor of the infrared LDV on different surfaces was almost the same on all surfaces, decreasing from more than −100 dB in low frequencies to around −140 dB at 1 kHz. After 1 kHz, it started rising for all surfaces and was highest for the black tape and lowest for the retroreflective tape.

3.3. Modal Parameters with SLDV

In this section, a He–Ne SLDV was used to calculate the modal parameters of three types of pavement slabs (see Table 2). Table 3 lists the modal frequencies (f), damping ratios (D), and MAC calculated by the SLDV for both (unpainted and painted) sides of three specimens. More mode shapes of the specimens were acquired from the painted side of the specimens, which proved that the measurement on the painted side was more accurate. Furthermore, the measurement of each point was repeated eight times to calculate the coherence function. Figure 5 illustrates that the coherence function was much better on the painted side compared to the unpainted side.

3.4. He–Ne vs. Infrared SLDV for Modal Analysis on Pavement

In this step, a He–Ne SLDV and an infrared 3D SLDV were used to measure the modal parameters of three specimens. The specimens were the same pavement slabs used in the previous tests, hung in free-free condition with their unpainted side facing the SLDV. The natural frequencies and damping ratios of the pavement slabs, measured by the two instruments, are represented in Table 4. It was evident that using an infrared 3D SLDV led to finding more mode shapes of the specimens, especially in higher frequencies where the applied load by shaker was lower than that in the lower frequencies; thus, the slightest noise could influence the results of the measurement. Therefore, as the infrared SLDV had a lower noise floor, it was able to conduct better measurements that led to finding more mode shapes of the specimen.

4. Conclusions

After 30 years of using He–Ne LDV as an accurate, noncontact measurement device, an infrared LDV with higher power compared to the conventional He–Ne LDV was developed to improve the quality of measurements in long-range applications. The infrared LDV is now becoming more popular, including in applications of optically low cooperative surfaces. In this paper, the noise floor of the two instruments (He–Ne and infrared LDV) were compared, and it was revealed that infrared LDV had lower noise level than He–Ne LDV in all surfaces, especially dark surfaces with low surface quality. Furthermore, it was shown that surface quality was more influential in measurements with He–Ne LDV. For instance, at some frequencies, there could be up to 60 dB difference between the noise floor measurements performed on the dark and retroreflective surfaces. Meanwhile, in an infrared LDV, surface quality was not important until 1000 Hz. For higher frequencies, retroreflective tapes could reduce the noise up to 20 dB. Therefore, in short-range measurements on materials with good surface quality, the difference of the noise between the instruments would not be significant. However, in cases where measurements are being conducted on materials with poor surface quality—like in road engineering where measurements are done on asphalt surface—using an infrared LDV could lead to better results (up to 30 dB reduction of noise floor in some frequencies).

Author Contributions

Data curation, N.H. and S.V.; Formal analysis, N.H.; Investigation, N.H.; Methodology, N.H., C.V., and S.V.; Resources, W.V.d.b.; Supervision, C.V., W.V.d.b., J.D., and S.V.; Writing—original draft, N.H.; Writing—review & editing, C.V. and S.V.

Funding

The authors would like to thank the research council of the Faculty of Applied Engineering for granting this project funded by the Everdepoel legacy.

Acknowledgments

Special thanks must be given to Polytec GmbH for the loan of Polytec LDV and 3D SLDV and for their technical assistance.

Conflicts of Interest

The authors declare that there is no conflict of interest regarding the publication of this paper.

References

  1. Varma, S.; Emin Kutay, M. Backcalculation of viscoelastic and nonlinear flexible pavement layer properties from falling weight deflections. Int. J. Pavement Eng. 2015, 1–15. [Google Scholar] [CrossRef]
  2. Elseifi, M.A.; Abdel-Khalek, A.M.; Gaspard, K.; Zhang, Z.; Ismail, S. Evaluation of Continuous Deflection Testing Using the Rolling Wheel Deflectometer in Louisiana. J. Transp. Eng. 2012, 138, 414–422. [Google Scholar] [CrossRef]
  3. Gudmarsson, A.; Ryden, N.; Di Benedetto, H.; Sauzeat, C. Complex modulus and complex Poisson’s ratio from cyclic and dynamic modal testing of asphalt concrete. Constr. Build. Mater. 2015, 88, 20–31. [Google Scholar] [CrossRef]
  4. He, L.; Lin, H.; Zou, Q.; Zhang, D. Accurate measurement of pavement deflection velocity under dynamic loads. Autom. Constr. 2017, 83, 149–162. [Google Scholar] [CrossRef]
  5. Flintsch, G.W.; Ferne, B.; Diefenderfer, B.; Brayce, J. Evaluation of Traffic Speed Continuous Deflection Devices. Transp. Res. Procedia 2012, 14, 3031–3039. [Google Scholar]
  6. Halliwell, N.A. Laser-Doppler measurement of vibrating surfaces: A portable instrument. J. Sound Vib. 1979, 62, 312–315. [Google Scholar] [CrossRef]
  7. Castellini, P.; Martarelli, M.; Tomasini, E.P. Laser Doppler Vibrometry: Development of advanced solutions answering to technology’s needs. Mech. Syst. Signal Process. 2006, 20, 1265–1285. [Google Scholar] [CrossRef]
  8. Rossi, G.; Marsili, R.; Gusella, V.; Gioffrè, M. Comparison between accelerometer and laser vibrometer to measure traffic excited vibrations on bridges. Shock Vib. 2002, 9, 11–18. [Google Scholar] [CrossRef]
  9. Stanbridge, A.B.; Ewins, D.J. Modal testing using a scanning laser Doppler vibrometer. Mech. Syst. Signal Process. 1999, 13, 255–270. [Google Scholar] [CrossRef]
  10. Martatelli, M.; Revel, G.M.; Santolini, C. Automated Modal Analysis By Scanning Laser Vibrometry: Problems and Uncertainties Associated With the Scanning System Calibration. Mech. Syst. Signal Process. 2001, 15, 581–601. [Google Scholar] [CrossRef]
  11. Hasheminejad, N.; Vuye, C.; Van den Bergh, W.; Dirckx, J.; Leysen, J.; Sels, S.; Vanlanduit, S. Identification of pavement material properties using a scanning laser Doppler vibrometer. In Proceedings of the 12th International A.I.VE.LA. Conference on Vibration Measurements by Laser and Noncontact Techniques, Ancona, Italy, 29 June–1 July 2016. [Google Scholar] [CrossRef]
  12. Rothberg, S.J.; Allen, M.S.; Castellini, P.; Di Maio, D.; Dirckx, J.J.J.; Ewins, D.J.; Halkon, B.J.; Muyshondt, P.; Paone, N.; Ryan, T.; et al. An international review of laser Doppler vibrometry: Making light work of vibration measurement. Opt. Lasers Eng. 2016. [Google Scholar] [CrossRef]
  13. Harland, A.R.; Petzing, J.N.; Tyrer, J.R.; Bickley, C.J.; Robinson, S.P.; Preston, R.C. Application and assessment of laser Doppler velocimetry for underwater acoustic measurements. J. Sound Vib. 2003, 265, 627–645. [Google Scholar] [CrossRef]
  14. Strean, R.F.; Mitchell, L.D.; Barker, A.J. Global noise characteristics of a laser Doppler vibrometer—I Theory. Opt. Lasers Eng. 1998, 30, 127–139. [Google Scholar] [CrossRef]
  15. Martin, P.; Rothberg, S. Introducing speckle noise maps for Laser Vibrometry. Opt. Lasers Eng. 2009, 47, 431–442. [Google Scholar] [CrossRef] [Green Version]
  16. Denman, M.; Halliwell, N.A.; Rothberg, S.J. Speckle noise reduction in laser vibrometry: Experimental and numerical optimisation. In Proceedings of the Second International Conference on Vibration Measurements by Laser Techniques: Advances and Applications, Ancona, Italy, 23–25 September 1996; Tomasini, E.P., Ed.; Volume 2868, pp. 12–21. [Google Scholar]
  17. Vuye, C.; Devroye, G.; Stuer, W.; Van Geen, G. Van; Van den bergh, W.; Bergiers, A.; Goubert, L.; Vanhooreweder, B.; Buytaert, A. Acoustical Characteristics of Low-Noise Test Tracks in Flanders. In Proceedings of the 22nd International Congress on Sound and Vibration, Florence, Italy, 12–16 July 2015. [Google Scholar]
  18. Vuye, C.; Bergiers, A.; Vanhooreweder, B. The Acoustical Durability of Thin Noise Reducing Asphalt Layers. Coatings 2016, 6, 21. [Google Scholar] [CrossRef]
  19. Vuye, C.; Musovic, F.; Tyszka, L.; Van Den, W.; Kampen, J.; Bergiers, A.; Maeck, J. First experiences with thin noise reducing asphalt layers in an urban environment in Belgium. In Proceedings of the ISMA 2016 Noise and Vibration Engineering Conference, Leuven, Belgium, 19–21 September 2016. [Google Scholar]
  20. Sandberg, U. Low noise road surfaces. A state-of-the-art review. J. Acoust. Soc. Jpn. 1999, 20, 1–17. [Google Scholar] [CrossRef]
  21. Vuye, C.; Devroye, G.; Stuer, W.; Van Beveren, M. Acoustical and Mechanical Impedance Measurements on PoroElastic Road Surfaces. In Proceedings of the 10th European Congress and Exposition on Noise Control Engineering, Maastricht, The Netherlands, 31 May–3 June 2015; pp. 1205–1210. [Google Scholar]
  22. Brown, E.R.; Haddock, J.E.; Mallick, R.; Lynn, T. A Development of a Mixture Design Procedure for Stone Matrix Asphalt. Proc. Assoc. Asph. Paving Technol. 1997, 66, 1–24. [Google Scholar]
  23. Guillaume, P.; Verboven, P.; Vanlanduit, S. Frequency-Domain Maximum Likelihood Identification of Modal Parameters with Confidence Intervals. In Proceedings of the International Seminar on Modal Analysis Katholieke Universiteit, Leuven, Belgium, 16–18 September 1998; Volume 1, pp. 359–366. [Google Scholar]
Figure 1. First experiment: noise floor measurement with two measuring systems on different targets.
Infrastructures 03 00047 g001
Figure 2. Second experiment: modal analysis on a pavement plate with two different scanning laser Doppler vibrometer (SLDV) systems.
Infrastructures 03 00047 g002
Figure 3. Noise floor comparison between He–Ne and infrared laser Doppler vibrometer (LDV); S = sensitivity (mm/s/v).
Infrastructures 03 00047 g003
Figure 4. Noise floor measurement for four different surfaces by He–Ne SLDV (left) and infrared LDV (right). Stand-off distance is 1.7 m for asphalt and 9 m for all the other surfaces.
Infrastructures 03 00047 g004
Figure 5. Coherence function of the specimens: (a) thin asphalt layer (TAL); (b) poroelastic road surface (PERS); (c) stone mastic asphalt (SMA).
Infrastructures 03 00047 g005
Table 1. First experiment: noise floor measurement of two He–Ne and infrared laser Doppler vibrometers on four different surfaces.
ExperimentTest NumberSurfaceMeasurement SystemStandoff Distance (m)
Noise Floor Measurements1Retroreflective tapeHe–Ne SLDV and infrared LDV9
2White tapeHe–Ne SLDV and infrared LDV9
3Black tapeHe–Ne SLDV and infrared LDV9
4Asphalt concreteHe–Ne SLDV and infrared LDV1.7
Table 2. Second experiment: modal analysis of three different specimens with different surface conditions and different measurement systems.
ExperimentTest NumberSpecimenSurface ConditionMeasurement System
Part 11TALUnpaintedHe–Ne SLDV
2TALPaintedHe–Ne SLDV
3PERSUnpaintedHe–Ne SLDV
4PERSPaintedHe–Ne SLDV
5SMAUnpaintedHe–Ne SLDV
6SMAPaintedHe–Ne SLDV
Part 21TALUnpaintedHe–Ne SLDV
2TALUnpainted3D infrared SLDV
3PERSUnpaintedHe–Ne SLDV
4PERSUnpainted3D infrared SLDV
5SMAUnpaintedHe–Ne SLDV
6SMAUnpainted3D infrared SLDV
Table 3. Modal parameters of three types of pavement slabs on their two sides (unpainted and painted). The gray rows are mode shapes that Polymax estimate was not able to detect.
ModeTALPERSSMA
f (Hz)D (%)MACf (Hz)D (%)MACf (Hz)− (%)MAC
Unpainted side
1 92.79.398.2201.512.198.4
2126.810.573.3149.19.597.7214.44.2 *93.0
3311.110.992.5250.510.296.3
4337.29.090.7 493.18.694.1
5378.58.886.4454.19.390.0567.712.193.3
6457.98.390.1497.910.392.6663.28.992.2
7561.58.795.1
8673.88.190.9
Painted side
1 93.89.499.4203.012.193.1
2125.910.576.4151.19.899.1215.89.886.9
3311.38.196.6255.310.498.6456.18.991.1
4337.18.891.9314.510.097.7493.48.575.9
5378.98.985.1439.21.3 *90.6575.010.296.3
6450.74.579.1485.510.786.1660.510.196.6
7563.28.294.9641.810.278.3
8682.98.595.0
* In some cases, due to the heavy coupling between two mode shapes, the polymax estimator was not able to estimate the damping ratio of the mode shapes with a high accuracy.
Table 4. Modal parameters of three specimens estimated from measurements conducted by two instruments: He–Ne SLDV and infrared 3D SLDV. The gray cells are the mode shapes that Polymax estimate was not able to detect.
Frequency (Hz)Damping Ratio (%)
He–Ne SLDVInfrared 3D SLDVHe–Ne SLDVInfrared 3D SLDV
TALPERSSMATALPERSSMATALPERSSMATALPERSSMA
92.7201.5 90.5188.7 9.212.1 9.512.9
126.8149.1214.4128.9144.8207.010.59.54.210.310.210.7
311.1250.5 246.5445.910.910.2 13.312.3
337.2 493.1337.6302.3484.39.0 8.68.59.79.9
378.5454.4567.7382.2450.6589.98.89.312.19.411.011.6
457.9497.9663.2459.1 651.78.310.38.99.1 7.6
561.5 574.2 830.28.7 7.6 9.7
673.8 676.0641.5964.48.1 8.011.110.6
770.9 7.6
923.7 8.9
969.8 8.7
1044.9 10.2

