Article

A CTC-Cluster-Specific Signature Derived from OMICS Analysis of Patient-Derived Xenograft Tumors Predicts Outcomes in Basal-Like Breast Cancer

by
Hariprasad Thangavel
1,†,
Carmine De Angelis
2,3,†,
Suhas Vasaikar
4,
Raksha Bhat
1,
Mohit Kumar Jolly
5,6,
Chandandeep Nagi
2,
Chad J. Creighton
7,
Fengju Chen
7,
Lacey E. Dobrolecki
2,
Jason T. George
6,8,
Tanya Kumar
1,
Noor Mazin Abdulkareem
1,9,
Sufeng Mao
2,
Agostina Nardone
2,10,
Mothaffar Rimawi
2,7,8,
C. Kent Osborne
2,7,8,
Michael T. Lewis
2,7,11,
Herbert Levine
6,12,
Bing Zhang
2,7,11,
Rachel Schiff
2,7,8,11,
Mario Giuliano
2,3 and
Meghana V. Trivedi
1,2,7,8,9,*
add Show full author list remove Hide full author list
1
Department of Pharmacy Practice and Translational Research, University of Houston College of Pharmacy, Houston, TX 77204, USA
2
Lester and Sue Smith Breast Center, Baylor College of Medicine, Houston, TX 77030, USA
3
Department of Clinical Medicine and Surgery, University of Naples Federico II, 80131 Naples, Italy
4
Department of Translational Molecular Pathology, MD Anderson Cancer Research Center, Houston, TX 77030, USA
5
Centre for BioSystems Science and Engineering, Indian Institute of Science, Bangalore 560012, India
6
Center for Theoretical Biological Physics, Rice University, Houston, TX 77005, USA
7
Dan L. Duncan Comprehensive Cancer Center, Baylor College of Medicine, Houston, TX 77030, USA
8
Department of Medicine, Baylor College of Medicine, Houston, TX 77030, USA
9
Department of Pharmacological and Pharmaceutical Sciences, University of Houston College of Pharmacy, Houston, TX 77204, USA
10
Center for Functional Cancer Epigenetics, Dana Farber Cancer Institute, Boston, MA 02215, USA
11
Department of Molecular and Cellular Biology, Baylor College of Medicine, Houston, TX 77030, USA
12
Department of Bioengineering, Northeastern University, Boston, MA 02120, USA
*
Author to whom correspondence should be addressed.
Co-first authors, these authors contributed equally to this work.
J. Clin. Med. 2019, 8(11), 1772; https://0-doi-org.brum.beds.ac.uk/10.3390/jcm8111772
Submission received: 18 September 2019 / Revised: 12 October 2019 / Accepted: 21 October 2019 / Published: 24 October 2019

Abstract

:
Circulating tumor cell clusters (CTCcl) have a higher metastatic potential compared to single CTCs and predict long-term outcomes in breast cancer (BC) patients. Because of the rarity of CTCcls, molecular characterization of primary tumors that give rise to CTCcl hold significant promise for better diagnosis and target discovery to combat metastatic BC. In our study, we utilized the reverse-phase protein array (RPPA) and transcriptomic (RNA-Seq) data of 10 triple-negative BC patient-derived xenograft (TNBC PDX) transplantable models with CTCs and evaluated expression of upregulated candidate protein Bcl2 (B-cell lymphoma 2) by immunohistochemistry (IHC). The sample-set consisted of six CTCcl-negative (CTCcl−) and four CTCcl-positive (CTCcl+) models. We analyzed the RPPA and transcriptomic profiles of CTCcl− and CTCcl+ TNBC PDX models. In addition, we derived a CTCcl-specific gene signature for testing if it predicted outcomes using a publicly available dataset from 360 patients with basal-like BC. The RPPA analysis of CTCcl+ vs. CTCcl− TNBC PDX tumors revealed elevated expression of Bcl2 (false discovery rate (FDR) < 0.0001, fold change (FC) = 3.5) and reduced acetyl coenzyme A carboxylase-1 (ACC1) (FDR = 0.0005, FC = 0.3) in CTCcl+ compared to CTCcl− tumors. Genome-wide transcriptomic analysis of CTCcl+ vs. CTCcl− tumors revealed 549 differentially expressed genes associated with the presence of CTCcls. Apoptosis was one of the significantly downregulated pathways (normalized enrichment score (NES) = −1.69; FDR < 0.05) in TNBC PDX tumors associated with CTCcl positivity. Two out of four CTCcl+ TNBC PDX primary tumors had high Bcl2 expression by IHC (H-score > 34); whereas, only one of six CTCcl− TNBC PDX primary tumors met this criterion. Evaluation of epithelial-mesenchymal transition (EMT)-specific signature did not show significant differences between CTCcl+ and CTCcl− tumors. However, a gene signature associated with the presence of CTCcls in TNBC PDX models was associated with worse relapse-free survival in the publicly available dataset from 360 patients with basal-like BC. In summary, we identified the multigene signature of primary PDX tumors associated with the presence of CTCcls. Evaluation of additional TNBC PDX models and patients can further illuminate cellular and molecular pathways facilitating CTCcl formation.

1. Introduction

The majority of breast cancer (BC)-related mortality is caused by metastasis in women worldwide [1,2]. A key metastatic process involves the dissemination of tumor cells from the primary site to distant organs via the bloodstream [3,4]. The number of circulating tumor cells (CTCs) in the blood is an independent predictor of worse survival in BC patients [5,6,7]. In addition, CTC clusters (CTCcls) represent a unique subset with a better cell survival advantage, higher metastatic potential, and resistance to chemotherapy [8,9,10]. The incidence of CTCcls in metastatic BC (MBC) patients ranges between 17.3% and 40.7% based on different studies conducted with varying sample sizes and CTC detection platforms [9,11,12,13,14]. Interestingly, the median CTCcl counts are reported to be higher in patients with early-stage/locally-advanced BC compared to those with metastatic disease [15]. The clinical prognostic value of CTCcls at baseline and after treatment to predict progression-free survival and overall survival has also been demonstrated in recent studies [16,17,18,19,20,21]. While recent technological advancements have allowed detection and characterization of CTCcls, much remains unknown about the pathways regulating their formation [22].
Irrespective of the investigational platforms employed, many studies, including our own, have detected CTCcls of varying size (2–100 tumor cells/CTCcl) within the circulation of BC animal models and patients [8,11,21,23,24,25,26]. Two possible mechanisms leading to CTCcls formation are either collective migration of tumor cells from the primary site into the circulation or intravascular aggregation of isolated CTCs within the circulation. In support of collective migration, Plakoglobin (also known as γ-catenin), a member of the catenin protein family and also an adaptor protein found in both desmosomes and adherens junction, was demonstrated in a preclinical study [8] to play a crucial role in CTCcl formation and subsequent BC metastasis. This study also reported that the CTCcls were formed from oligoclonal clumps of primary breast tumor cells, using mouse xenograft models [8]. Although the aggregation of CTCs in major blood vessels is unlikely due to the shear stress in circulating blood and a huge excess of hematopoietic cells in the blood in relation to CTCs [9], aggregation of CTCs after intravasation in microvessels surrounding the tumor has been demonstrated recently [27]. Using tissue sections from MBC patients and triple-negative BC patient-derived xenograft (TNBC PDX) models, this study revealed the ubiquitous expression of CD44 (a marker for cancer stem cells [28,29,30,31] and a prognostic predictor in multiple cancer [32,33,34,35,36,37]) in CTCcls compared to single CTCs, and reported the interaction between CD44 and its downstream target p-21 activated kinase 2 (PAK2) as a key mechanism found to mediate tumor cell aggregation [27]. More than one pathway may function independently or simultaneously to dictate the formation and survival of CTCcls. The discovery of additional ‘druggable’ targets to halt CTCcls is important to arrest metastatic progression.
In our previous research on CTCs and CTCcls, we used BC PDX as a model system [24,38]. The BC PDX models serve as the renewable source of CTCs and CTCcls by retaining the genomic, transcriptomic, and biomarker profiles of the original patient-derived tumors that would allow us to better understand their role in metastasis. In this study, our aim was to identify tumor-specific pathways predicting the presence of CTCcls using TNBC PDX transplantable models. We found a higher expression of B-cell lymphoma 2 (Bcl2) and reduced expression of acetyl coenzyme A carboxylase-1 (ACC1) in tumors associated with CTCcl positivity in reverse-phase protein array (RPPA) analysis. In support of this, apoptosis was one of the significantly downregulated pathways, associated with the presence of CTCcls, in the genome-wide transcriptomic analysis. A higher proportion of CTCcl+ tumors than CTCcl− tumors were positive for Bcl2. A CTCcl+ gene signature consisting of 54 upregulated genes was significantly associated with poor relapse-free survival (RFS) in a publicly available dataset from 360 patients with basal-like BC.

2. Methods

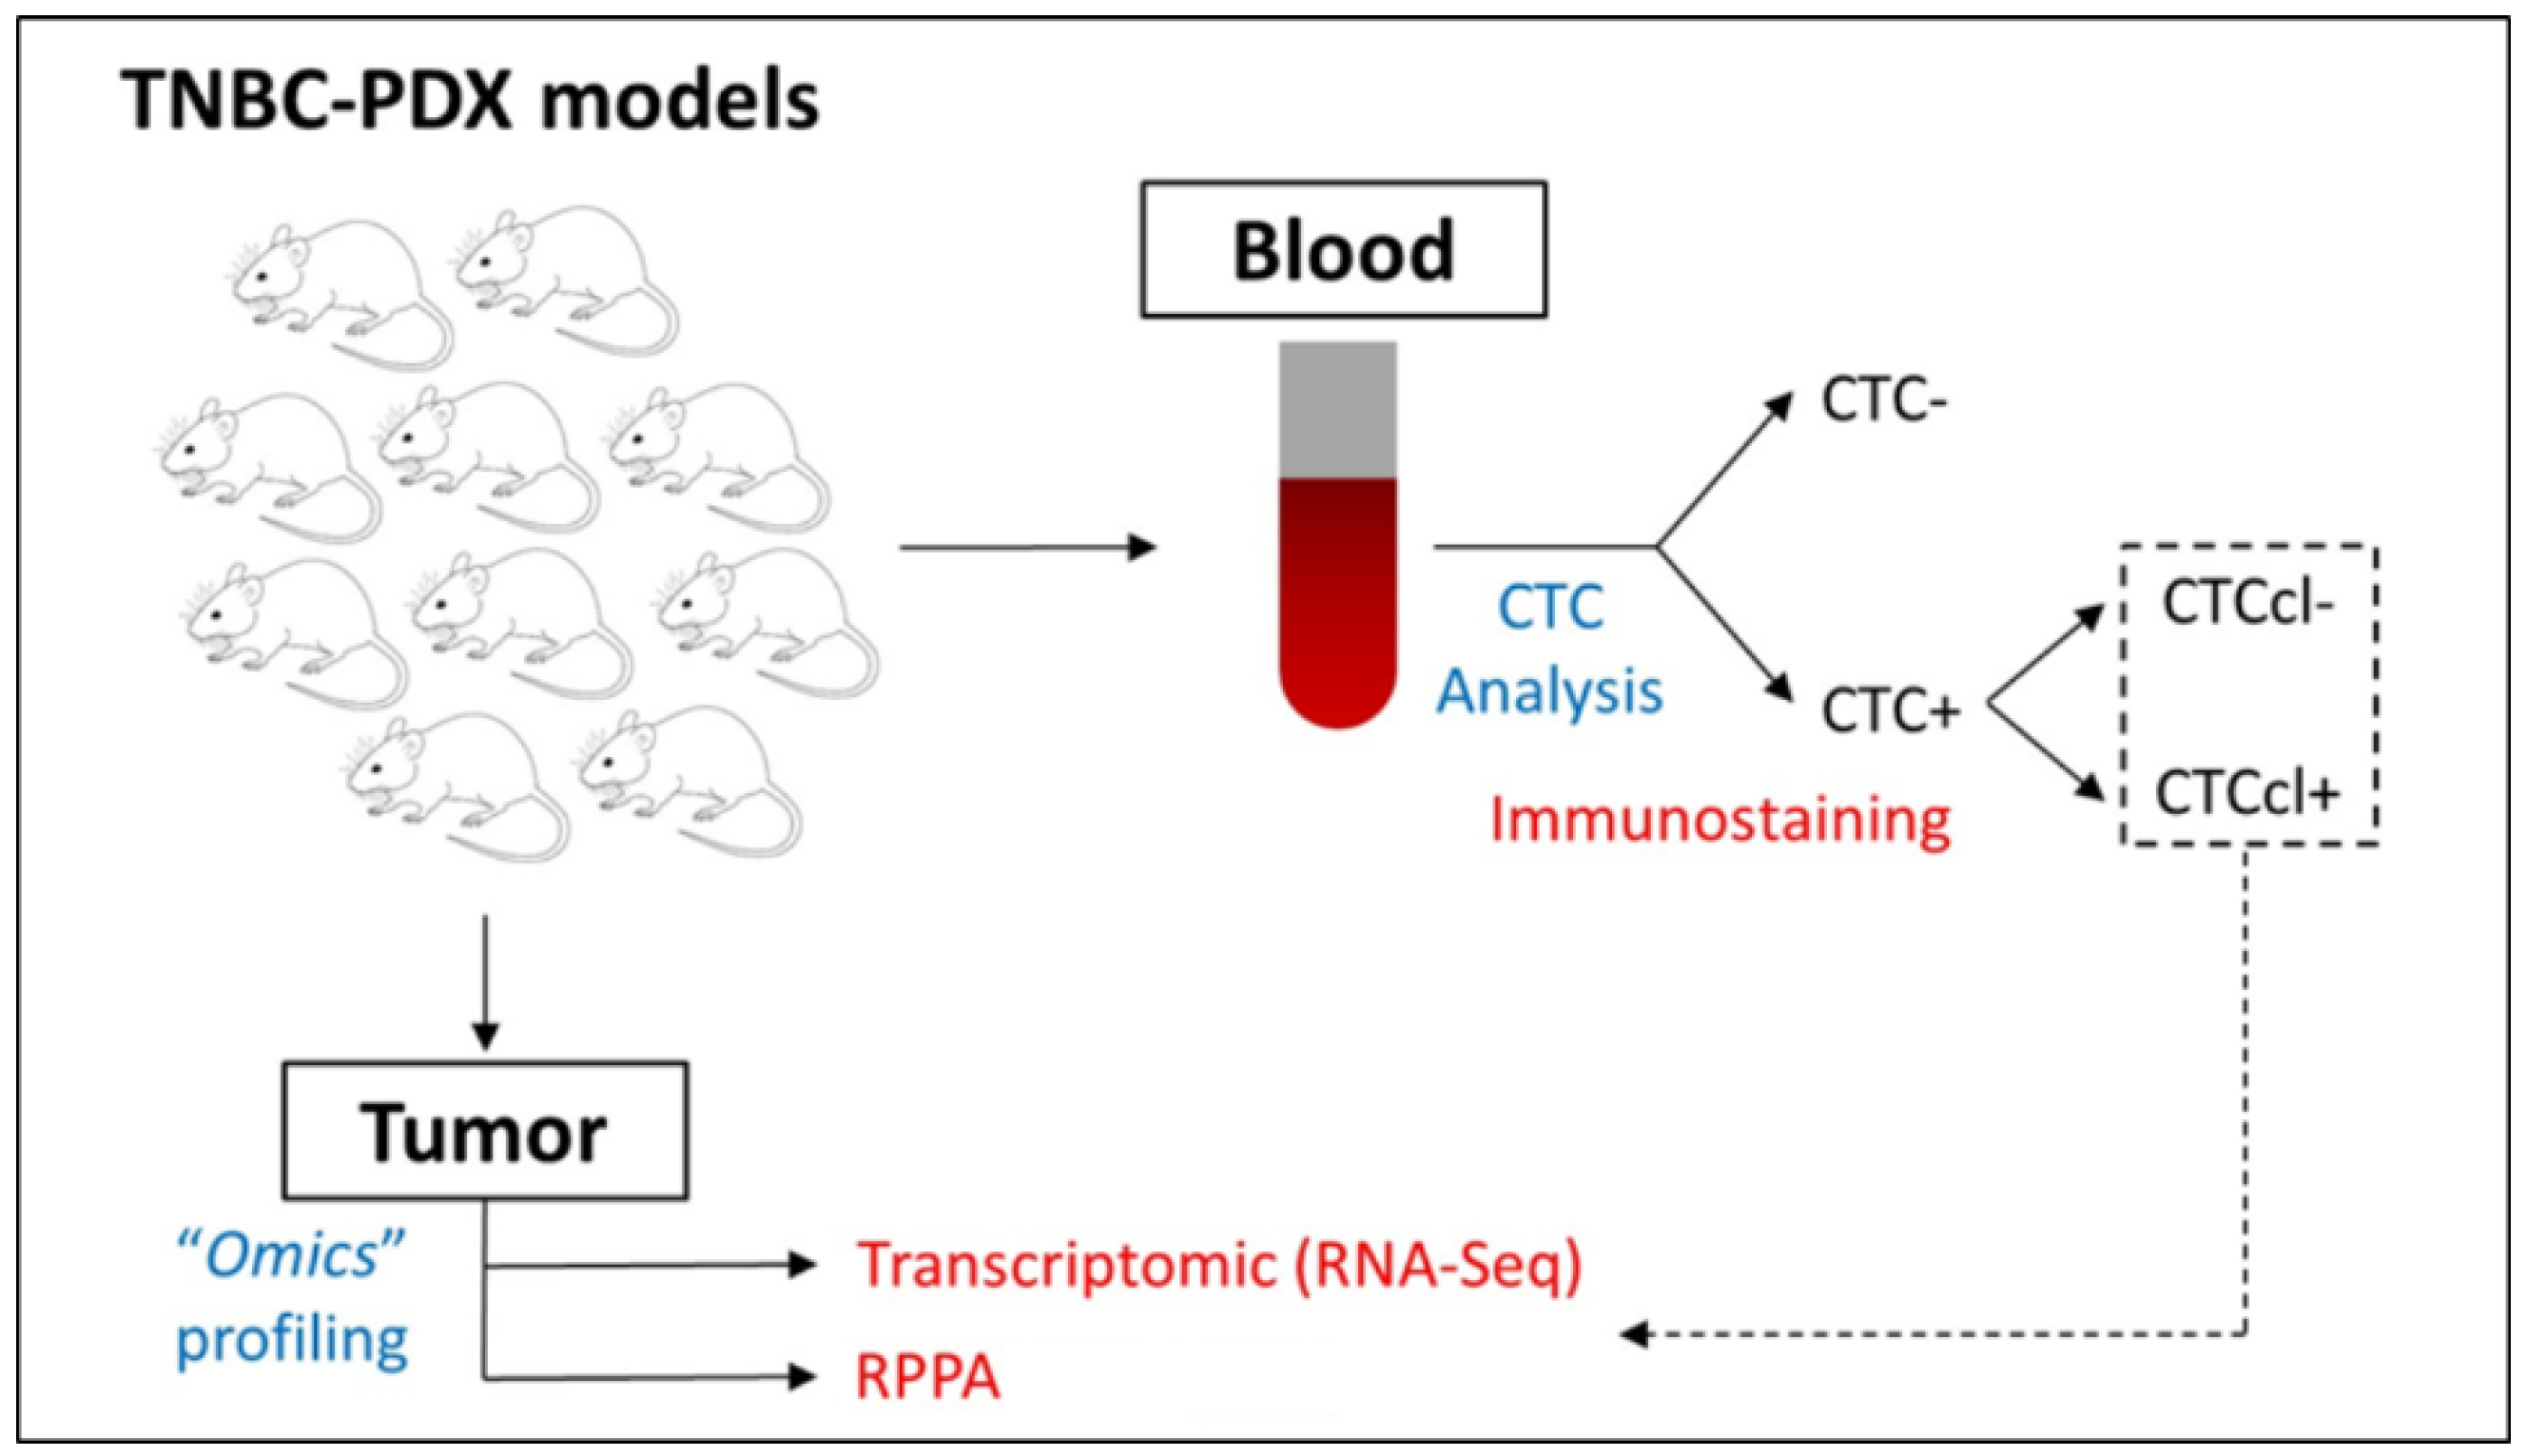
2.1. Selection of BC PDX Models

The BC PDX mouse models in our study have been described before [24,39] and have been characterized for the presence of CTCs and CTCcls [24,38]. CTCcls were defined as aggregates of two or more pan-cytokeratin+ CTCs identified by immunohistochemistry (IHC). A total of 10 TNBC PDX models (BCM-3107, BCM-3204, BCM-3561, BCM-3887, BCM-4272, BCM-4664, BCM-5156, BCM-5471, BCM-5998, BCM-6257) were available for the OMICS (RPPA and transcriptomic) analysis described in this study (Figure 1). Out of these PDX models, four (BCM-3204, BCM-3887, BCM-5471, BCM-6257) were CTCcl-positive (CTCcl+), and the rest were CTCcl-negative (CTCcl−) [24].

2.2. Protein Analysis by Reverse-Phase Protein Array

Reverse-phase protein arrays analysis was performed as described previously [39]. The RPPA panel included 171 validated antibodies that detect various proteins and phosphoproteins involved in diverse cellular processes ranging from growth factor receptors, nuclear receptors/transcriptional regulators, metabolomic enzymes, and proteins involved in epithelial-mesenchymal transition (EMT), DNA-damage, apoptosis, proliferation, and cell cycle [40]. RPPA quantitative data were available for 6 CTCcl− (BCM-3107, BCM-3561, BCM-4272, BCM-4664, BCM-5156, and BCM-5998) and 3 CTCcl+ (BCM-3204, BCM-3887, and BCM-5471) TNBC PDX models. A false discovery rate (FDR) adjusted p-value (q-value) threshold of 0.05 was used to define differentially expressed proteins between CTCcl+ and CTCcl− TNBC PDX groups.

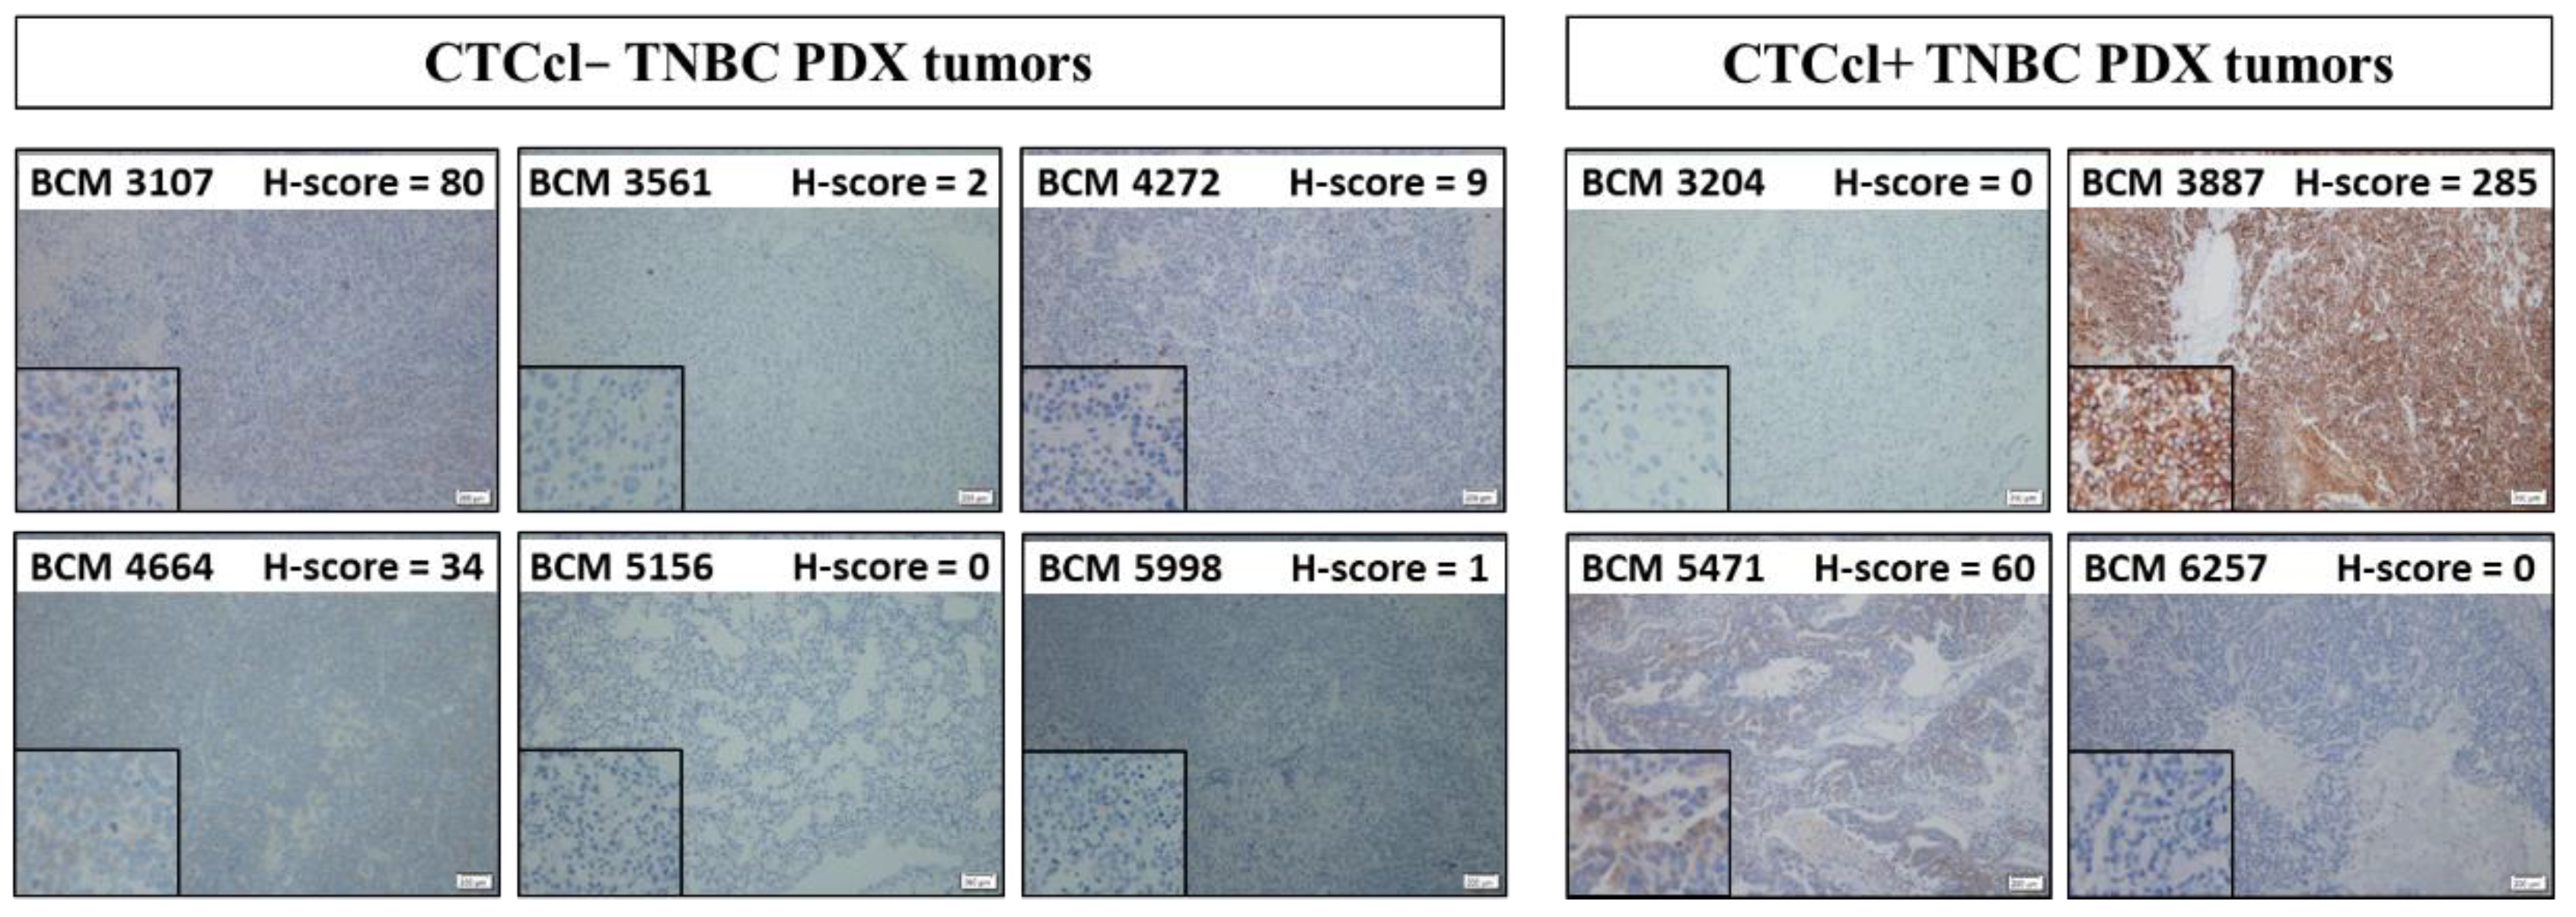
2.3. Bcl2 Immunohistochemistry

Tumor tissues from available formalin-fixed paraffin-embedded sections of primary PDX tumors were retrieved from the archives. Specimens were used for immunohistochemical staining. Anti-Bcl2 (Mouse monoclonal antibody, clone 124, #M0887) antibody was purchased from Dako, Carpinteria, CA, USA. Immunohistochemistry (IHC) was conducted by processing sections for antigen retrieval (microwaved in 10 mM citrate buffer, pH 6 for 10 min), followed by treatment with 3% H2O2 in methanol for 10 min and washing in phosphate-buffered saline (PBS) twice. After blocking in 3% bovine serum albumin and 5% goat serum in PBS for 2 h at room temperature, sections were incubated with primary antibodies overnight at 4 °C. Then, sections were washed in PBS and incubated with EnVision-labeled polymer reagent (DAKO, Carpinteria, CA, USA) for 30 min at room temperature. Finally, sections were exposed with nickel, cobalt-3,3-diaminobenzidine (Immunopure Metal Enhanced DAB Substrate Kit; Pierce, Rockford, IL, USA) and counterstained with hematoxylin.

2.4. Immunohistochemical Scoring

Protein expression levels were scored by a clinical pathologist blinded to CTCcl status, using a weighted histoscore method, also known as the H-score [41,42,43], which is based on staining intensity (0 (absent), 1+ (weak), 2+ (moderate), or 3+ (strong)) and the percentage of cells stained with that intensity for the full tissue section. The H-score was calculated using the formula (1*(% cells 1+) + 2*(% cells 2+) + 3*(% cells 3+)) that provided a semiquantitative classification of staining intensity, with a maximum score of 300 (if 100% of cells stained strongly positive) and a minimum score of 0 (if 100% of cells were negative). A total of three independent tumors per PDX model were used to assess the histoscore and then averaged to assign the final H-score for each of the 10 TNBC PDX models.

2.5. Gene Expression and Network Analysis

RNA-Sequencing (RNA-Seq) data of individual PDX models were retrieved from Gene Expression Omnibus (GEO), a public functional genomics data repository (accession number GSE97726) [44]. Raw fragments per kilobase of transcript per million mapped read values (FPKM) were used for downstream analysis. The sample-set consisted of 6 CTCcl− (BCM-3107, BCM-3561, BCM-4272, BCM-4664, BCM-5156, BCM-5998) and 4 CTCcl+ (BCM-3204, BCM-3887, BCM-5471, BCM-6257) TNBC PDX models. Data were normalized by trimmed mean of M values (TMM) implemented in edgeR (Bioconductor v3.7) and then transformed by voom in limma. For differential expression, genes expressed differentially between the CTCcl+ and CTCcl− were identified using limma (Bioconductor v3.7). A p-value < 0.05 was used to define differentially expressed genes between CTCcl+ and CTCcl− TNBC PDX groups. Statistical analysis was performed by a moderated t-test implemented in limma. Wikipathway database was used for pathway enrichment [45], while enrichment analysis was performed by Gene Set Enrichment Analysis (GSEA) implemented in WebGestalt [46,47].

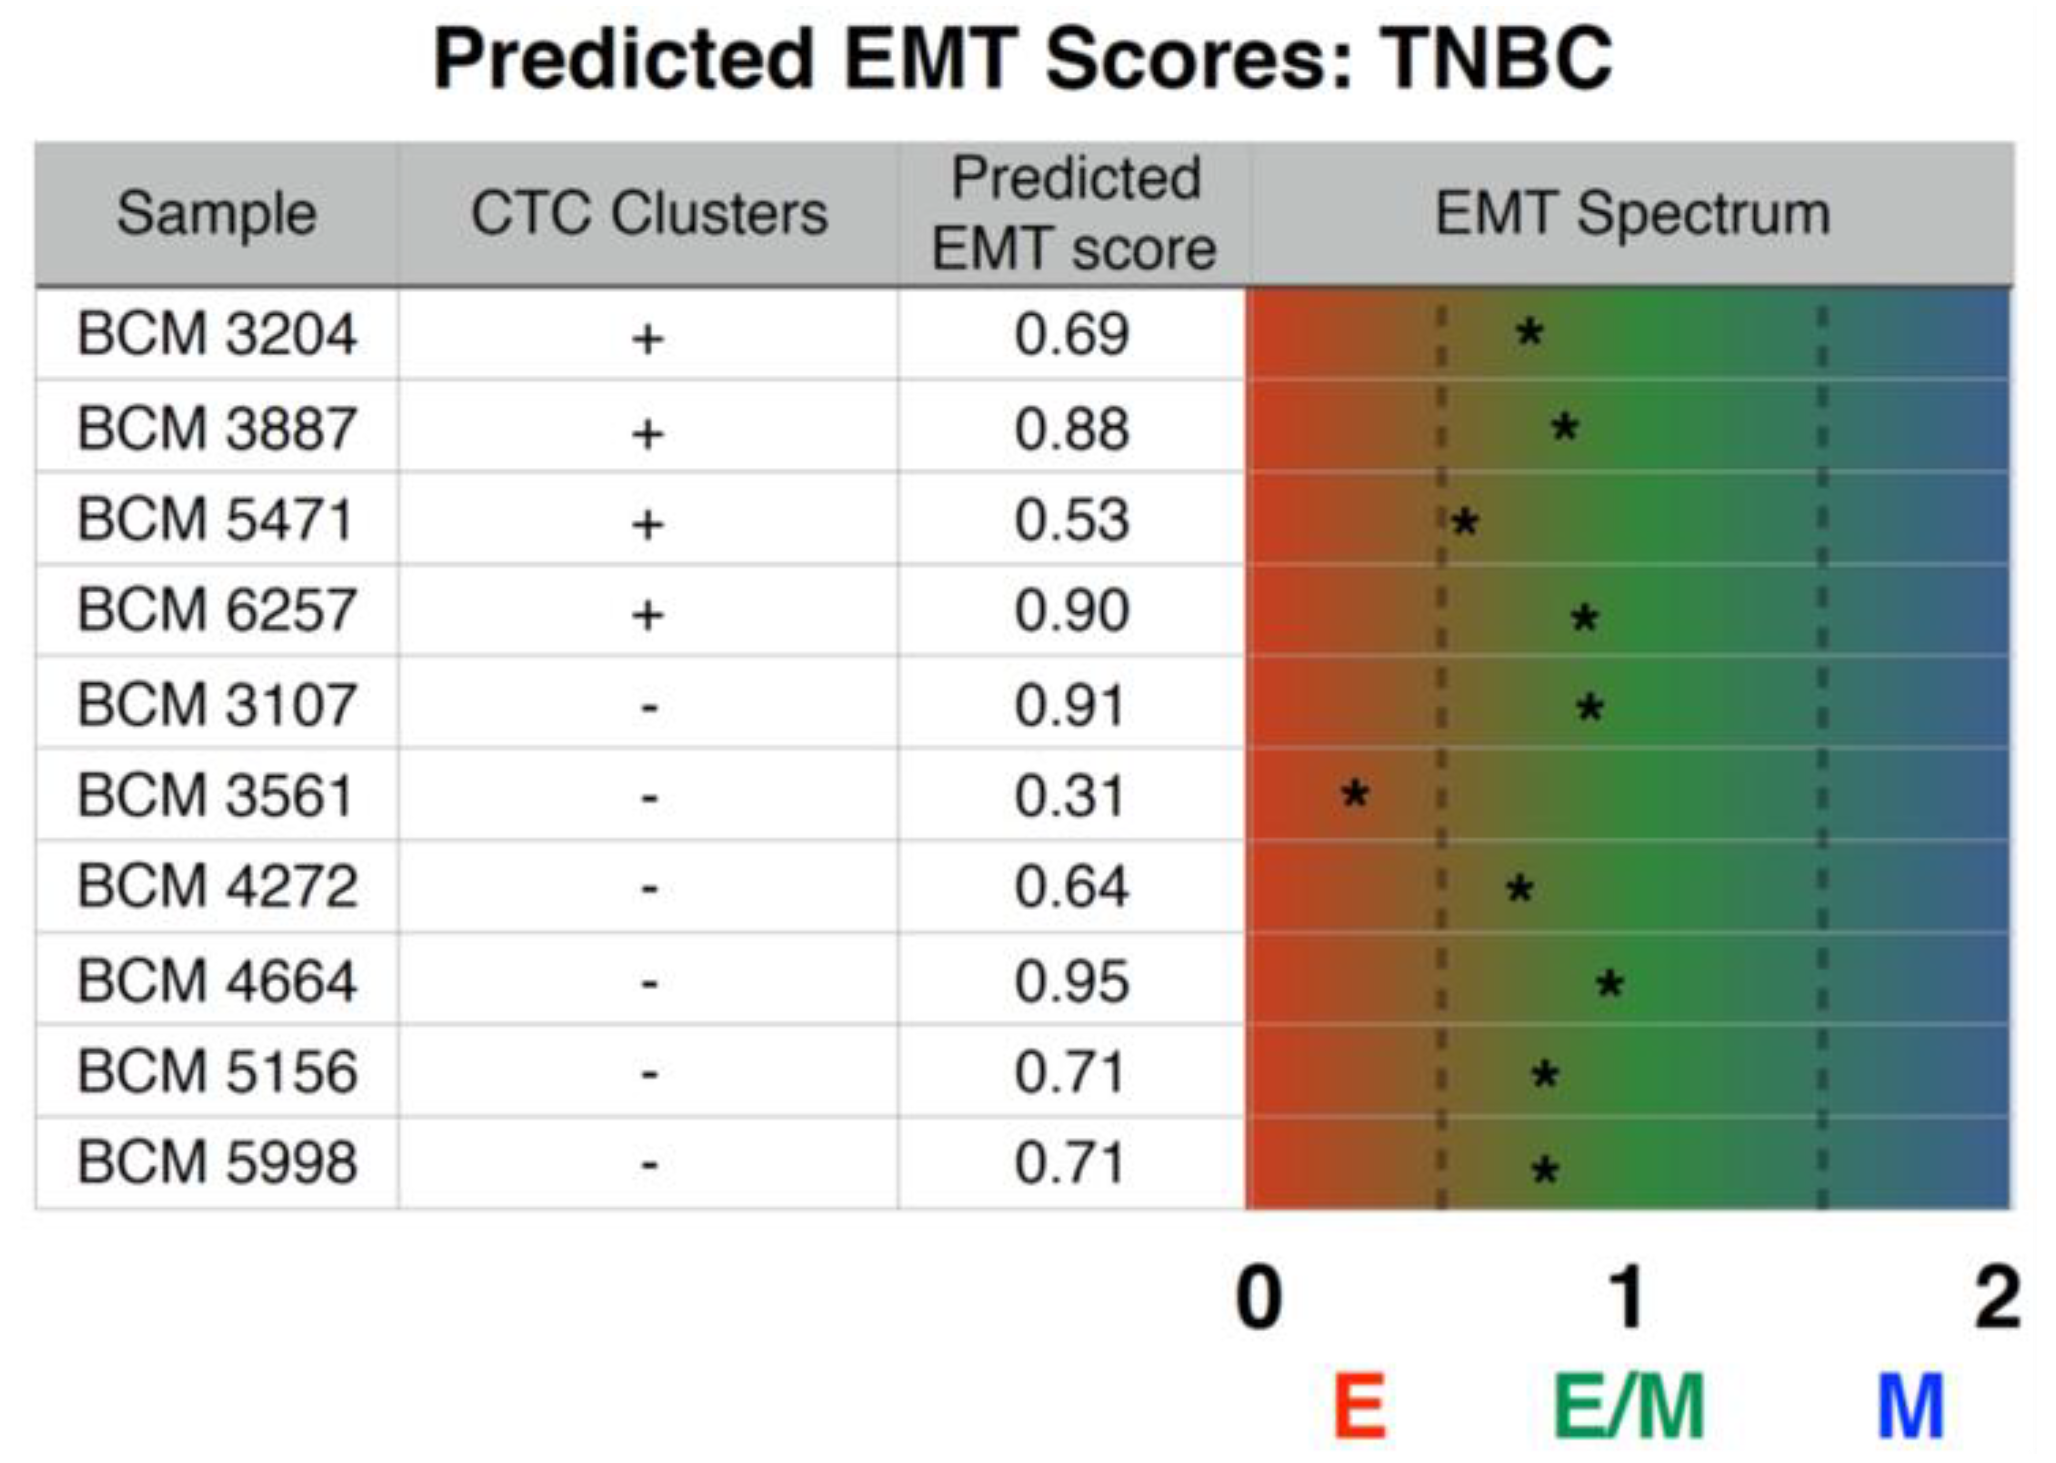
2.6. Inferential EMT Metric

The epithelial-mesenchymal transition (EMT) metric previously described [48,49] was applied to transcriptomic datasets above to calculate the extent of ‘EMT-ness’ on a scale of 0 (fully epithelial) to 2 (fully mesenchymal). This inferential metric considers a set of EMT-relevant predictor transcripts and a cross-platform normalizer transcript set and uses them to probabilistically categorize samples into epithelial, mesenchymal, or hybrid E/M. For each sample i, an ordered triple Si = (PE, PE/M, PM) characterizes the probability of belonging to epithelial, hybrid E/M, or mesenchymal phenotype. These probabilities are then projected onto the range (0–2): epithelial samples get placed close to 0 and mesenchymal samples close to 2, whereas maximally hybrid E/M samples are assigned values close to 1.

2.7. Patient Survival Analysis

The Kaplan-Meier Plotter online web tool was used to assess the association of the gene signature consisting of upregulated genes in CTCcl+ TNBC PDXs and RFS in 360 basal-like BC patients, most of whom had TNBC [50,51,52]. Fifty-four upregulated genes with p < 0.01 in CTCcl+ tumors were entered into the database to obtain Kaplan-Meier survival plots, hazard ratios with 95% confidence intervals, and log-rank p-values. The “JetSet best probe set” option was selected to select the optimal probe set for each gene [53].

3. Results

3.1. Protein Profiling of TNBC PDX Models

Available RPPA quantitative data from six CTCcl− and three CTCcl+ TNBC PDX tumors were used to investigate expression levels of 171 total and phosphorylated proteins that belong to several cellular processes and proteins, including EMT, DNA-damage, apoptosis, proliferation and cell cycle, growth factor receptors, nuclear receptors/transcriptional regulators, and metabolic enzymes [40]. The analysis of differentially expressed proteins (Supplementary Table S1) revealed higher levels of the anti-apoptotic protein Bcl2 (FDR q-value < 0.0001, fold-change (FC) 3.5) in CTCcl+ TNBC PDX tumors (Table 1). Additionally, the fatty acid metabolism regulator ACC1 was found to be the only significantly downregulated protein (FDR q-value = 0.0005, FC 0.3) in CTCcl+ tumors compared to CTCcl− TNBC PDXs (Table 1).

3.2. Bcl2 Expression in TNBC PDX Tumors with and without CTCcls

We examined the expression of Bcl2 in primary tumors from all 10 TNBC PDX models by IHC staining. A median H-score of 34 for Bcl2 expression in TNBC PDX tumors was considered as a cut-off for analysis. A similar scoring system for Bcl2 has been recently reported by a few other studies [54,55]. Only one out of six CTCcl− TNBC PDX tumors had an H-score of > 34 (BCM-3107 with H-score of 80). On the other hand, two out of four CTCcl+ TNBC PDX tumors had an H-score of > 34 for Bcl2 (BCM-5471 with an H-score of 60; BCM-3887 with an H-score of 285) (Figure 2). Although an optimal cut-off for Bcl2 score for positivity requires further research, a dichotomized median H-score as cut-off was used here based on its commonality in several other studies [56,57,58,59].

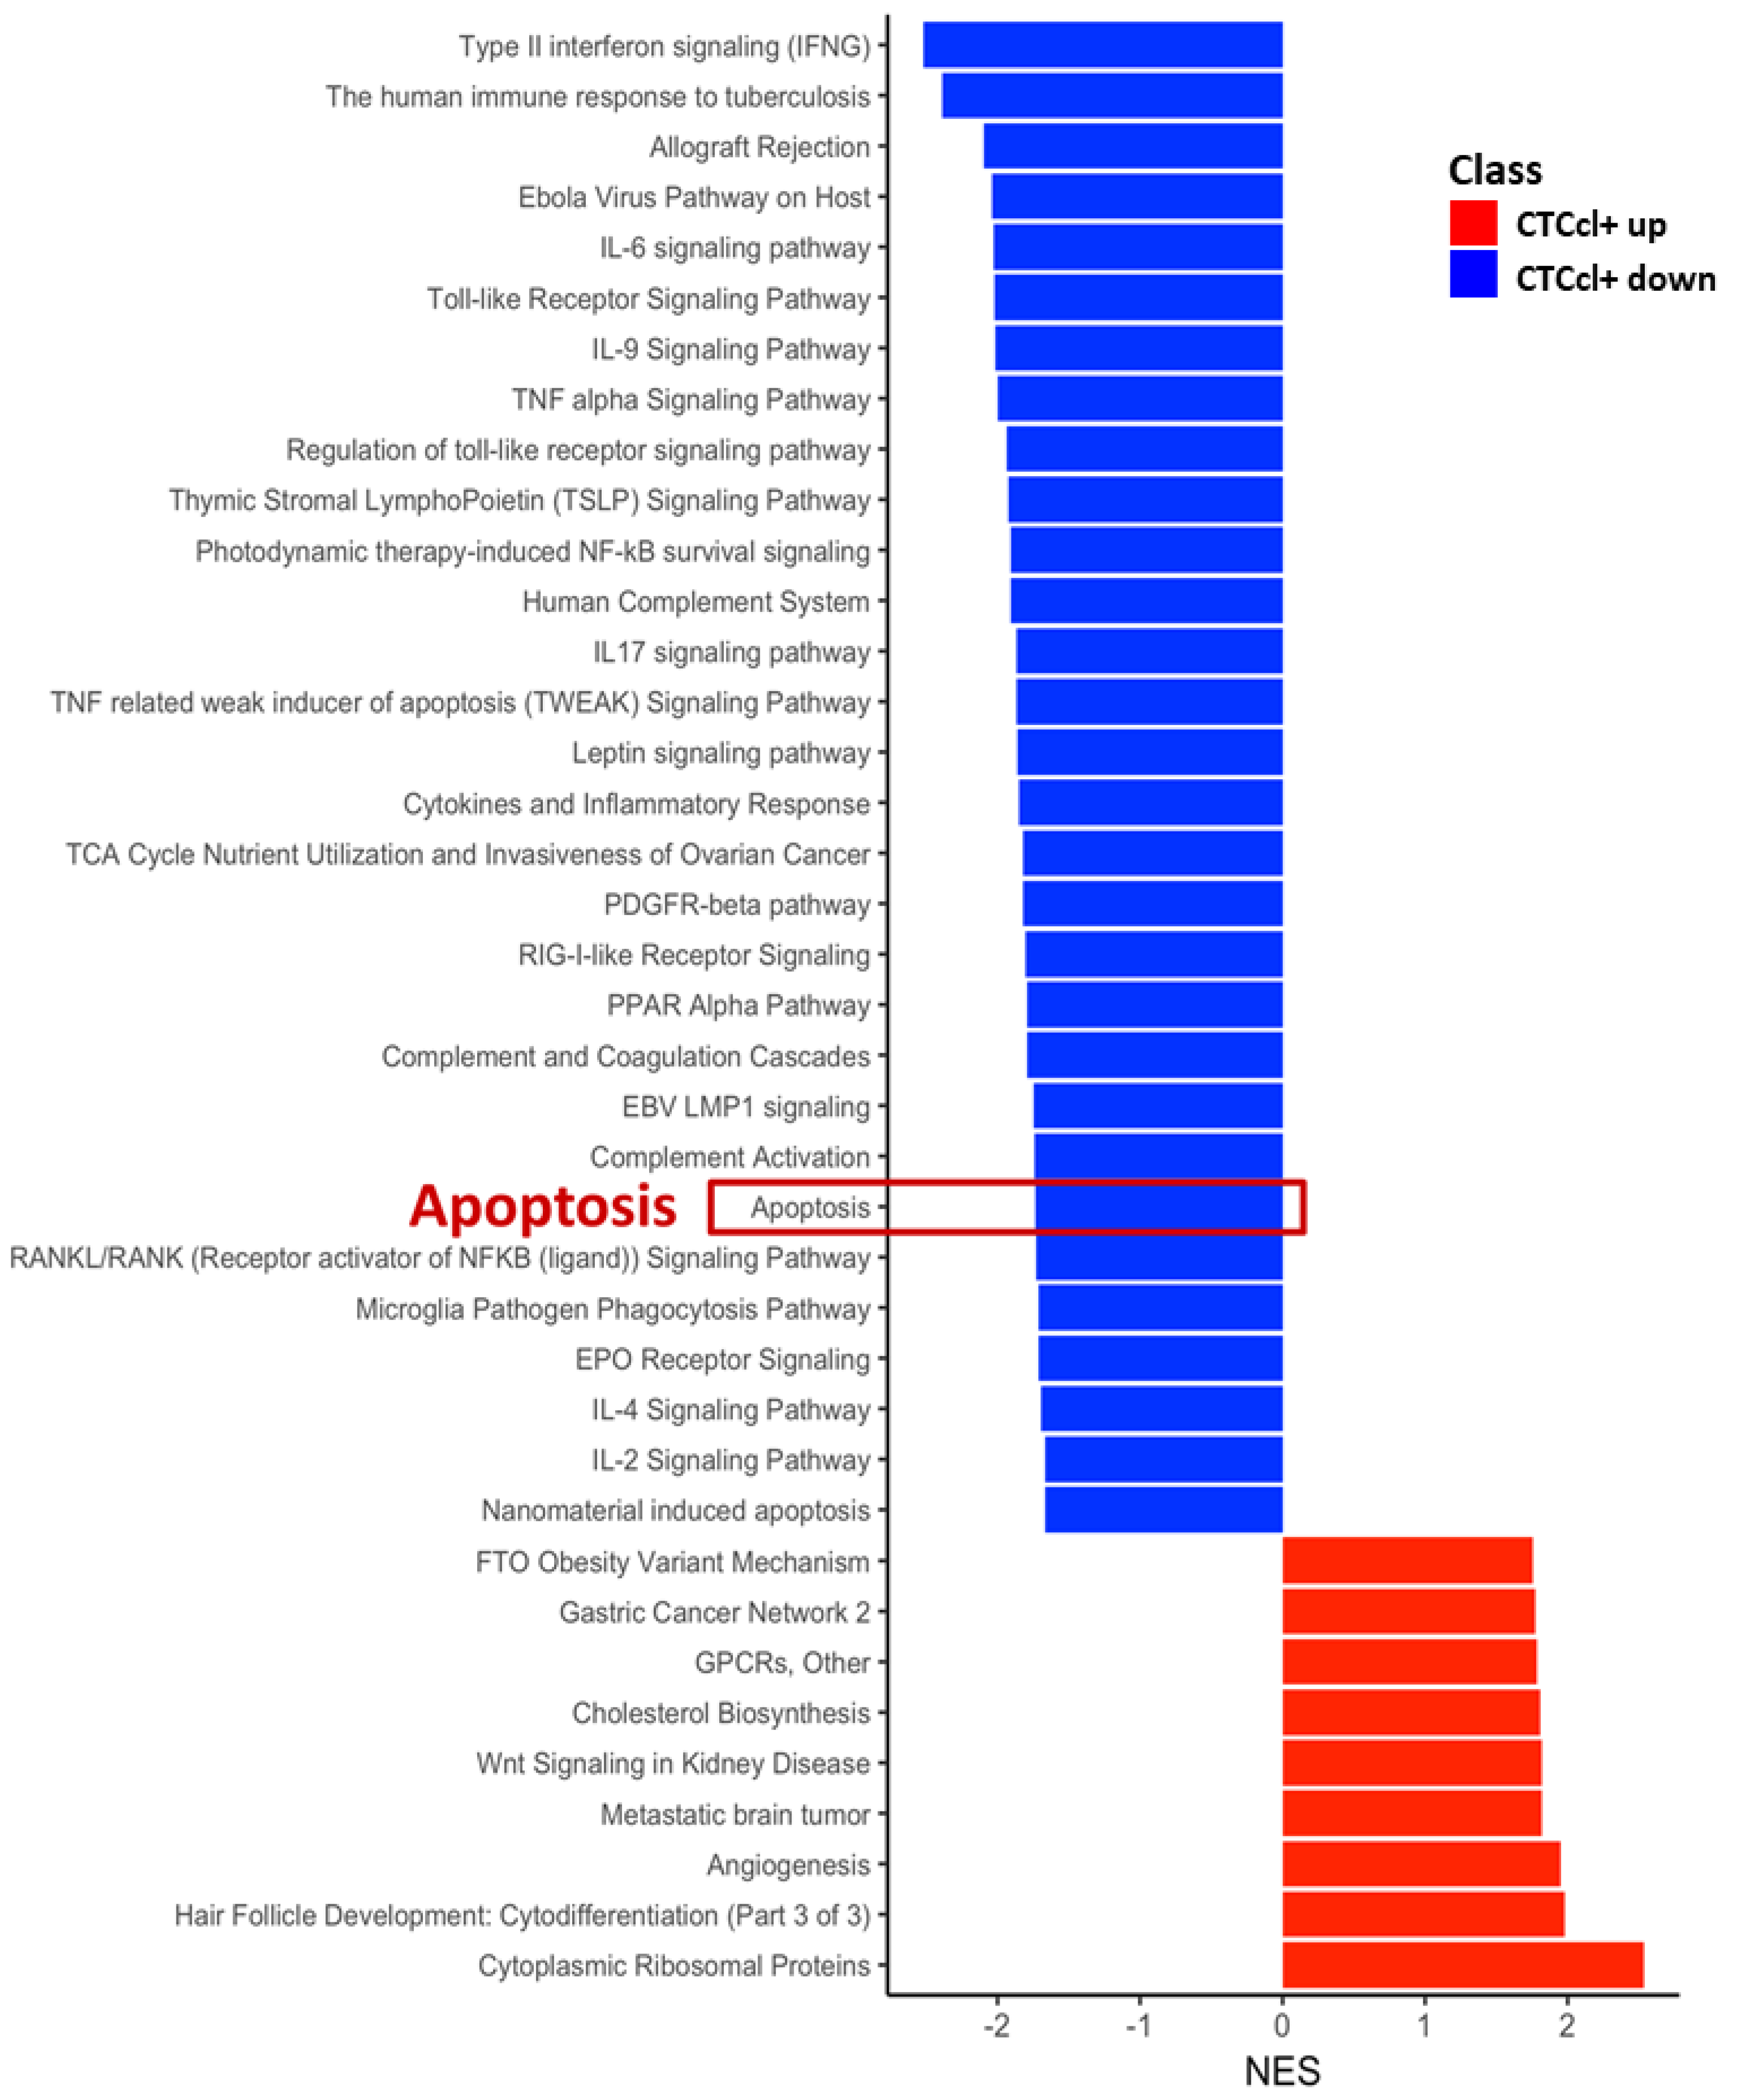
3.3. Gene Signature Associated with CTCcl-Specificity

To identify genes associated with a higher propensity of generating CTCcls and consequently with a higher metastatic potential, we conducted a genome-wide transcriptomic analysis of six CTCcl− and four CTCcl+ TNBC PDX models. None of the genes in the RNA-Seq analysis had FDR < 0.05 (Supplementary Table S2). We next performed GSEA to elucidate potential biological processes that were associated with the generation of CTCcls. The normalized gene counts consisted of 12,778 features (merged the redundant features and filtered for no variance). The differential analysis through edgeR resulted in log2-FC and associated p-value and FDR q-value. We used the log2-FC as input for GSEA-based enrichment for biological pathways from Wikipathway [45]. We identified 39 enriched pathway terms with p-value < 0.05 and FDR q-value < 0.1, and the enrichment score was given as normalized enrichment score (NES). Pathway terms, such as ‘cytoplasmic ribosomal proteins (NES = 2.53)’, ‘angiogenesis (NES = 1.95)’, ‘metastatic brain tumor (NES = 1.82)’, ‘cholesterol biosynthesis (NES = 1.8)’, ‘G protein-coupled receptors (GPCRs) (NES = 1.79)’ were among the top-enriched pathways positively associated with CTCcls+ TNBC PDX tumors (Figure 3, Supplementary Table S3). Interestingly, our analysis also revealed that genes within GSEA terms relating to ‘type II interferon signaling (NES = −2.52)’, ‘antigen processing and presentation (NES = −2.38)’, ‘tumor necrosis factor (TNF) signaling pathway (NES = −2.04)’, and ‘apoptosis (NES = −1.73)’ were downregulated in CTCcl+ TNBC PDX models (Figure 3, Supplementary Table S3).

3.4. Expression of Plakoglobin, CD44, and PAK2 in TNBC PDX Tumors

We also examined the expression levels of JUP (gene for plakoglobin), CD44, and PAK2 in CTCcl+ vs. CTCcl− TNBC PDX models as they were reported to have a role in tumor cell aggregation/CTCcl formation and subsequent metastasis [8,27]. None of the three genes were differentially regulated in our analysis even with FDR cut-off of 0.1: PAK2 (log2-FC = 0.88, p-value < 0.05); JUP (log2-FC = −0.54, p = 0.29); and CD44 (log2-FC = −0.93, p = 0.17).

3.5. Prediction of Inferential EMT Metric for TNBC PDX Models

EMT has been proposed to play an important role in promoting CTC formation in epithelial cancers by increasing tumor cell invasiveness, intravasation into blood vessels, and survival in the peripheral system. However, recent studies have argued that EMT is not an ‘all-or-none’ process as initially postulated, but cells may stably acquire one or more hybrid epithelial/mesenchymal phenotype(s) [60]. To correlate differences in the EMT status of TNBC PDX tumors with the presence and absence of CTCcls, we applied our recently developed inferential EMT metric to calculate EMT scores for each PDX tumor. This metric uses canonical epithelial and mesenchymal markers and computes an ‘EMT score’ on a scale of 0 (fully epithelial) to 2 (fully mesenchymal) [48,49]. These analyses indicated that the extent of EMT activated in TNBC PDX tumors generating CTCcls was not significantly different from those tumors where no CTCcls were detected (Figure 4).

3.6. Prognostic Values of CTCcl-Associated Signature in Basal-Like BC Patients

A gene signature associated with CTCcl positivity was defined by selecting the 54 upregulated genes (Supplementary Table S4) with a log2-FC of 0.9 and p-value < 0.01 in CTCcl+ vs. CTCcl− TNBC PDX tumors. The CTCcl positivity signature was significantly associated with poor RFS (Hazard ratio (HR) 1.49, 95% confidence interval (CI) 1.08–2.06, p-value = 0.016) in a publicly available cohort of 360 patients with basal-like BC (http://kmplot.com/) (Figure 5).

4. Discussion

Tumor cells in the circulation were once regarded as sporadic events with a lack of tools and techniques to detect and identify them in cancer patients [61]. However, with recent technological advancements, the CTCs are now well established as prognosis predictors of survival and treatment outcomes in metastatic cancers [5,6,7]. CTCcls represent a unique subset of CTCs with a greater survival advantage, higher metastatic potential, and resistance to chemotherapy [8,9,10]. The clinical prognostic value of CTCcls at baseline and after treatment for predicting progression-free survival and overall survival in cancer patients has also been recently demonstrated [16,17,18,19,20,21]. While the prognostic value of CTCcls has been shown primarily in metastatic cancer patients, it is unknown whether the presence of CTCcls in locally-advanced or early-stage disease would predict early metastatic recurrence. Likewise, the tumor characteristics that give rise to CTCcls and the pathophysiological events by which CTCcls originate are also largely unknown [22]. Additional clinical studies are required to fill the knowledge gap.
Our RPPA and transcriptomic analyses identified high Bcl2 expression and downregulation of apoptosis pathways associated with CTCcls. Bcl2 is an oncogene that promotes survival and regulates pro- and anti-apoptotic pathways [62,63], which is one of the hallmarks of cancer [64]. Approximately 75% of breast tumors are positive for Bcl2 [65,66]. While Bcl2 is a favorable prognostic marker in estrogen receptor-positive BC and an independent predictor of clinical outcome in patients treated with endocrine therapy, its expression is a poor prognostic factor in TNBC patients, especially in the absence of adjuvant therapy [67]. In addition, Bcl2 is also reported as an independent prognostic marker [68] and is associated with poor RFS [69] and worse overall survival [70] in TNBC patients receiving anthracycline-based adjuvant chemotherapy. Although highly expressed in 20–40% of TNBC/basal-like BC [68,69,71,72], Bcl2 has not been clinically investigated as a drug target in TNBC patients. In the preclinical setting, venetoclax (ABT-199), a Food and Drug Administration (FDA)-approved anti-Bcl2 drug, was showed to increase anti-tumor effects of doxorubicin on subcutaneously injected MDA-MB-231 cells in xenograft models [73]. Similarly, ABT-737, an inhibitor of Bcl2 and Bcl-xl, sensitized TNBC PDXs to docetaxel [74] and accelerated apoptosis in irradiated TNBC cells in vitro and in vivo [74] in another study. Further preclinical and clinical validation of Bcl2 as a predictor and driver of CTCcls formation and metastasis is warranted in TNBC. Besides apoptosis, tumor microenvironment/cytokine-specific signature and tumor cell metabolism-related pathways are the two other prominent pathways that are downregulated in our enrichment analysis. However, the PDX tumors are maintained in SCID/Beige mice, which is severely immunocompromised and lack both T-cells and B-cells and have diminished natural killer (NK) cell activity. How these pathways play a role in CTCcls formation and maintenance in PDXs, needs further investigation.
The uniqueness of our study comes from the use of PDX models to investigate CTCcls. While many preclinical CTC studies are using cell line xenograft models, we have pioneered the characterization of various BC PDX models for the presence of CTCs, CTCcls, and disseminated tumor cells (DTCs) in bone marrow [24]. PDX models are clinically relevant and phenotypically stable because they maintain morphologic and structural characteristics and also metastasize as original tumors [75,76]. CTCs/CTCcls are extremely rare in patients when only 5–10 mL of blood can be withdrawn from patients at a time. In contrast, at least 1/4th to 1/3rd of the whole blood volume can be collected from a mouse for detecting CTCcls [38]. Moreover, CTCs/CTCcls from PDX models can be interrogated in their unperturbed state, in the absence of treatment, to understand their influence on metastatic processes. BC PDXs also recapitulate many key biological aspects of the original patients’ tumor, including molecular heterogeneity and drug sensitivity, and hence are considered excellent models of translational research [77,78]. In our study, we utilized the existing RPPA and transcriptomic (RNA-Seq) data of PDX tumors, performed using total protein and RNA samples, respectively. While we cannot rule out the contribution from mouse stromal cells, PDX tumors cluster according to their original PAM50 subtype, and most proteins included in the RPPA panel are tumor-specific. For Bcl2 IHC assay, we used an anti-human Bcl2 antibody that does not cross-react with mouse protein, and the IHC scoring agreed with the signal from RPPA analysis. The ongoing bioinformatic effort for computationally editing the stromal reads may help in the future analysis of PDX tumors.
Single-cell RNA sequencing of clustered versus single CTCs has identified plakoglobin, a cell adhesion protein, as a highly expressed gene in CTCcls [8]. High plakoglobin expression was also found on primary tumors of BC patients and served as an independent prognostic factor for distant-metastasis-free survival (DMFS) in BC patients undergoing neoadjuvant chemotherapy [8,26]. In a recent study, intercellular CD44 homophilic interactions and its subsequent interactions with PAK2 were reported to mediate tumor cell aggregation and polyclonal metastasis in BC PDX models [27]. In our study, we took a different approach of interrogating protein and transcriptomic data from CTCcl+ versus CTCcl− TNBC PDX tumors to identify global molecular pathways responsible for CTCcls and to identify ‘druggable’ targets for combating CTCcl-driven metastasis. While we identified Bcl2, a druggable target, for future interrogation and validation, the evaluation of a larger panel of TNBC PDX models and patients is necessary to identify additional biomarkers and targets.

5. Conclusions

Our study shows for the first time that OMICS analysis of PDX tumors can determine CTCcl-specific protein markers and gene signature to predict outcomes in patients. Primary tumors with active anti-apoptotic and/or survival pathways may promote CTCcls formation and increase the risk of distant metastasis. Considering the molecular heterogeneity within TNBC, a large panel of TNBC PDX needs to be characterized to ensure robust analysis with high precision. Discovering tumoral predictors and drivers of CTCcls that can serve as biomarkers may identify patients at higher risk of metastatic relapse. Understanding the biology behind the genesis of CTCcls can also elucidate pathways that can be targeted using novel therapies for the prevention and treatment of CTCcl-associated metastasis in TNBC.

Supplementary Materials

The following are available online at https://0-www-mdpi-com.brum.beds.ac.uk/2077-0383/8/11/1772/s1. Table S1: Differential expression of proteins and phosphoproteins by RPPA analysis in CTCcl+ vs. CTCcl− TNBC PDX models; Table S2: Differentially expressed genes by RNA-Seq analysis in CTCcl+ vs. CTCcl− TNBC PDX models; Table S3: Differentially regulated biological pathways elucidated by GSEA in CTCcl+ vs. CTCcl− TNBC PDX models; Table S4: List of 54 upregulated genes with p-value < 0.01 in TNBC PDX models associated with the CTCcl-specific signature.

Author Contributions

H.T., C.D.A., R.S., M.G., and M.V.T. contributed to the conception and overall study design. H.T., C.D.A., S.V., R.B., M.K.J., C.N., C.J.C., F.C., L.E.D., J.T.G., R.S., M.G., and M.V.T. performed experiments and/or data analysis. H.T., C.D.A., S.V., R.B., M.K.J., C.N., C.J.C., J.T.G., T.K., N.M.A., S.M., A.N., M.R., C.K.O., M.T.L., H.L., B.Z., R.S., M.G., and M.V.T. participated in overall data analysis or interpretation and/or in writing, review, and revision of the manuscript. M.V.T. provided administrative support and was responsible for the overall study supervision. All authors read and approved the final manuscript.

Funding

This research was supported in part by the UH GEAR Grants Program and Breast Cancer Research Foundation (BCRF). HT and MT were supported by the NIH 1P20CA221731-01A1. CDA was supported by the Cancer Prevention & Research Institute of Texas CPRIT RP 140102 and the Conquer Cancer Foundation - Gianni Bonadonna Breast Cancer Research Fellowship. MKJ was supported by a training fellowship from the Gulf Coast Consortia on the Computational Biology Training Program - CPRIT grant RP170593. RS was supported by BCRF 16-142, 17-143, 18-145, and NIH 1P20CA221729-01A1. SV and BZ were supported by the Cancer Prevention & Research Institutes of Texas (CPRIT) grant RR160027 and by funding from the McNair Medical Institute at The Robert and Janice McNair Foundation. None of the funding agencies had any role in the design, analysis, or reporting of the analyses.

Acknowledgments

We would like to acknowledge the Patient-derived Xenograft and Advanced In Vivo Models core at Baylor College of Medicine for providing the RPPA and transcriptomic data of TNBC PDX models used in this study. The core operations were supported by the P30 Cancer Center Support Grant NCI-CA125123 and CPRIT Core Facilities Support Grant RP170691.

Conflicts of Interest

Rachel Schiff reported research funding from AstraZeneca, GlaxoSmithKline, Gilead Sciences, and PUMA Biotechnology and is a consulting/advisory committee member for Macrogenics and, in the past, for Eli Lilly outside the submitted work. Mothaffar Rimawi reported a research grant from Pfizer and is a consultant for Macrogenics, Daiichi, Novartis, and Genentech. Mario Giuliano reported honoraria from Roche, Pfizer, AstraZeneca, Novartis, Celgene, Eli Lilly, Amgen, and Eisai. The remaining authors declare no competing interests.

References

  1. Gennari, A.; Conte, P.; Rosso, R.; Orlandini, C.; Bruzzi, P. Survival of metastatic breast carcinoma patients over a 20-year period: A retrospective analysis based on individual patient data from six consecutive studies. Cancer 2005, 104, 1742–1750. [Google Scholar] [CrossRef]
  2. Chia, S.K.; Speers, C.H.; D’Yachkova, Y.; Kang, A.; Malfair-Taylor, S.; Barnett, J.; Coldman, A.; Gelmon, K.A.; O’Reilly, S.E.; Olivotto, I.A. The impact of new chemotherapeutic and hormone agents on survival in a population-based cohort of women with metastatic breast cancer. Cancer 2007, 110, 973–979. [Google Scholar] [CrossRef]
  3. Krebs, M.G.; Metcalf, R.L.; Carter, L.; Brady, G.; Blackhall, F.H.; Dive, C. Molecular analysis of circulating tumour cells-biology and biomarkers. Nat. Rev. Clin. Oncol. 2014, 11, 129–144. [Google Scholar] [CrossRef]
  4. Bray, F.; Ferlay, J.; Soerjomataram, I.; Siegel, R.L.; Torre, L.A.; Jemal, A. Global cancer statistics 2018: GLOBOCAN estimates of incidence and mortality worldwide for 36 cancers in 185 countries. CA Cancer J. Clin. 2018, 68, 394–424. [Google Scholar] [CrossRef] [Green Version]
  5. Moussavi-Harami, S.F.; Wisinski, K.B.; Beebe, D.J. Circulating tumor cells in metastatic breast cancer: A prognostic and predictive marker. J. Patient Cent. Res. Rev. 2014, 1, 85–92. [Google Scholar] [CrossRef]
  6. Zhou, L.; Dicker, D.T.; Matthew, E.; El-Deiry, W.S.; Alpaugh, R.K. Circulating tumor cells: Silent predictors of metastasis. F1000 Res. 2017, 6. [Google Scholar] [CrossRef]
  7. Court, C.M.; Ankeny, J.S.; Sho, S.; Winograd, P.; Hou, S.; Song, M.; Wainberg, Z.A.; Girgis, M.D.; Graeber, T.G.; Agopian, V.G.; et al. Circulating tumor cells predict occult metastatic disease and prognosis in pancreatic cancer. Ann. Surg. Oncol. 2018, 25, 1000–1008. [Google Scholar] [CrossRef]
  8. Aceto, N.; Bardia, A.; Miyamoto, D.T.; Donaldson, M.C.; Wittner, B.S.; Spencer, J.A.; Yu, M.; Pely, A.; Engstrom, A.; Zhu, H.; et al. Circulating tumor cell clusters are oligoclonal precursors of breast cancer metastasis. Cell 2014, 158, 1110–1122. [Google Scholar] [CrossRef]
  9. Hong, Y.; Fang, F.; Zhang, Q. Circulating tumor cell clusters: What we know and what we expect (Review). Int. J. Oncol. 2016, 49, 2206–2216. [Google Scholar] [CrossRef] [Green Version]
  10. Hou, J.M.; Krebs, M.; Ward, T.; Sloane, R.; Priest, L.; Hughes, A.; Clack, G.; Ranson, M.; Blackhall, F.; Dive, C. Circulating tumor cells as a window on metastasis biology in lung cancer. Am. J. Pathol. 2011, 178, 989–996. [Google Scholar] [CrossRef]
  11. Jansson, S.; Bendahl, P.O.; Larsson, A.M.; Aaltonen, K.E.; Ryden, L. Prognostic impact of circulating tumor cell apoptosis and clusters in serial blood samples from patients with metastatic breast cancer in a prospective observational cohort. BMC Cancer 2016, 16, 433. [Google Scholar] [CrossRef]
  12. Mu, Z.; Benali-Furet, N.; Uzan, G.; Znaty, A.; Ye, Z.; Paolillo, C.; Wang, C.; Austin, L.; Rossi, G.; Fortina, P.; et al. Detection and characterization of circulating tumor associated cells in metastatic breast cancer. Int. J. Mol. Sci. 2016, 17, 1665. [Google Scholar] [CrossRef]
  13. Sarioglu, A.F.; Aceto, N.; Kojic, N.; Donaldson, M.C.; Zeinali, M.; Hamza, B.; Engstrom, A.; Zhu, H.; Sundaresan, T.K.; Miyamoto, D.T.; et al. A microfluidic device for label-free, physical capture of circulating tumor cell clusters. Nat. Methods 2015, 12, 685–691. [Google Scholar] [CrossRef]
  14. Larsson, A.M.; Jansson, S.; Bendahl, P.O.; Levin Tykjaer Jorgensen, C.; Loman, N.; Graffman, C.; Lundgren, L.; Aaltonen, K.; Ryden, L. Longitudinal enumeration and cluster evaluation of circulating tumor cells improve prognostication for patients with newly diagnosed metastatic breast cancer in a prospective observational trial. Breast Cancer Res. 2018, 20, 48. [Google Scholar] [CrossRef]
  15. Fina, E.; Reduzzi, C.; Motta, R.; Di Cosimo, S.; Bianchi, G.; Martinetti, A.; Wechsler, J.; Cappelletti, V.; Daidone, M.G. Did circulating tumor cells tell us all they could? The missed circulating tumor cell message in breast cancer. Int. J. Biol. Mark. 2015, 30, e429–e433. [Google Scholar] [CrossRef]
  16. Cristofanilli, M.; Budd, G.T.; Ellis, M.J.; Stopeck, A.; Matera, J.; Miller, M.C.; Reuben, J.M.; Doyle, G.V.; Allard, W.J.; Terstappen, L.W.; et al. Circulating tumor cells, disease progression, and survival in metastatic breast cancer. N. Engl. J. Med. 2004, 351, 781–791. [Google Scholar] [CrossRef]
  17. Budd, G.T.; Cristofanilli, M.; Ellis, M.J.; Stopeck, A.; Borden, E.; Miller, M.C.; Matera, J.; Repollet, M.; Doyle, G.V.; Terstappen, L.W.; et al. Circulating tumor cells versus imaging—Predicting overall survival in metastatic breast cancer. Clin. Cancer Res. 2006, 12, 6403–6409. [Google Scholar] [CrossRef]
  18. Dawood, S.; Broglio, K.; Valero, V.; Reuben, J.; Handy, B.; Islam, R.; Jackson, S.; Hortobagyi, G.N.; Fritsche, H.; Cristofanilli, M. Circulating tumor cells in metastatic breast cancer: From prognostic stratification to modification of the staging system? Cancer 2008, 113, 2422–2430. [Google Scholar] [CrossRef]
  19. Giuliano, M.; Giordano, A.; Jackson, S.; Hess, K.R.; De Giorgi, U.; Mego, M.; Handy, B.C.; Ueno, N.T.; Alvarez, R.H.; De Laurentiis, M.; et al. Circulating tumor cells as prognostic and predictive markers in metastatic breast cancer patients receiving first-line systemic treatment. Breast Cancer Res. 2011, 13, R67. [Google Scholar] [CrossRef]
  20. Hayashi, N.; Nakamura, S.; Tokuda, Y.; Shimoda, Y.; Yagata, H.; Yoshida, A.; Ota, H.; Hortobagyi, G.N.; Cristofanilli, M.; Ueno, N.T. Prognostic value of HER2-positive circulating tumor cells in patients with metastatic breast cancer. Int. J. Clin. Oncol. 2012, 17, 96–104. [Google Scholar] [CrossRef]
  21. Wang, C.; Mu, Z.; Chervoneva, I.; Austin, L.; Ye, Z.; Rossi, G.; Palazzo, J.P.; Sun, C.; Abu-Khalaf, M.; Myers, R.E.; et al. Longitudinally collected CTCs and CTC-clusters and clinical outcomes of metastatic breast cancer. Breast Cancer Res. Treat. 2017, 161, 83–94. [Google Scholar] [CrossRef]
  22. Giuliano, M.; Shaikh, A.; Lo, H.C.; Arpino, G.; De Placido, S.; Zhang, X.H.; Cristofanilli, M.; Schiff, R.; Trivedi, M.V. Perspective on circulating tumor cell clusters: Why it takes a village to metastasize. Cancer Res. 2018, 78, 845–852. [Google Scholar] [CrossRef]
  23. Cho, E.H.; Wendel, M.; Luttgen, M.; Yoshioka, C.; Marrinucci, D.; Lazar, D.; Schram, E.; Nieva, J.; Bazhenova, L.; Morgan, A.; et al. Characterization of circulating tumor cell aggregates identified in patients with epithelial tumors. Phys. Biol. 2012, 9, 016001. [Google Scholar] [CrossRef] [PubMed]
  24. Giuliano, M.; Herrera, S.; Christiny, P.; Shaw, C.; Creighton, C.J.; Mitchell, T.; Bhat, R.; Zhang, X.; Mao, S.; Dobrolecki, L.E.; et al. Circulating and disseminated tumor cells from breast cancer patient-derived xenograft-bearing mice as a novel model to study metastasis. Breast Cancer Res. 2015, 17, 3. [Google Scholar] [CrossRef] [PubMed]
  25. Mu, Z.; Wang, C.; Ye, Z.; Austin, L.; Civan, J.; Hyslop, T.; Palazzo, J.P.; Jaslow, R.; Li, B.; Myers, R.E.; et al. Prospective assessment of the prognostic value of circulating tumor cells and their clusters in patients with advanced-stage breast cancer. Breast Cancer Res. Treat. 2015, 154, 563–571. [Google Scholar] [CrossRef]
  26. Goto, W.; Kashiwagi, S.; Asano, Y.; Takada, K.; Takahashi, K.; Hatano, T.; Takashima, T.; Tomita, S.; Motomura, H.; Ohsawa, M.; et al. Circulating tumor cell clusters-associated gene plakoglobin is a significant prognostic predictor in patients with breast cancer. Biomark. Res. 2017, 5, 19. [Google Scholar] [CrossRef] [Green Version]
  27. Liu, X.; Taftaf, R.; Kawaguchi, M.; Chang, Y.F.; Chen, W.; Entenberg, D.; Zhang, Y.; Gerratana, L.; Huang, S.; Patel, D.B.; et al. Homophilic CD44 interactions mediate tumor cell aggregation and polyclonal metastasis in patient-derived breast cancer models. Cancer Discov. 2019, 9, 96–113. [Google Scholar] [CrossRef] [PubMed]
  28. Thapa, R.; Wilson, G.D. The importance of CD44 as a stem cell biomarker and therapeutic target in cancer. Stem. Cells Int. 2016, 2016, 2087204. [Google Scholar] [CrossRef]
  29. Li, W.; Ma, H.; Zhang, J.; Zhu, L.; Wang, C.; Yang, Y. Unraveling the roles of CD44/CD24 and ALDH1 as cancer stem cell markers in tumorigenesis and metastasis. Sci. Rep. 2017, 7, 13856. [Google Scholar] [CrossRef]
  30. Wang, L.; Zuo, X.; Xie, K.; Wei, D. The role of CD44 and cancer stem cells. Methods Mol. Biol. 2018, 1692, 31–42. [Google Scholar] [CrossRef]
  31. Chen, C.; Zhao, S.; Karnad, A.; Freeman, J.W. The biology and role of CD44 in cancer progression: Therapeutic implications. J. Hematol. Oncol. 2018, 11, 64. [Google Scholar] [CrossRef] [PubMed]
  32. Xu, H.; Tian, Y.; Yuan, X.; Liu, Y.; Wu, H.; Liu, Q.; Wu, G.S.; Wu, K. Enrichment of CD44 in basal-type breast cancer correlates with EMT, cancer stem cell gene profile, and prognosis. OncoTargets Ther. 2016, 9, 431–444. [Google Scholar] [CrossRef] [Green Version]
  33. Xia, P.; Xu, X.Y. Prognostic significance of CD44 in human colon cancer and gastric cancer: Evidence from bioinformatic analyses. Oncotarget 2016, 7, 45538–45546. [Google Scholar] [CrossRef] [PubMed] [Green Version]
  34. Wang, Z.; Wang, Q.; Wang, Q.; Wang, Y.; Chen, J. Prognostic significance of CD24 and CD44 in breast cancer: A meta-analysis. Int. J. Biol. Mark. 2017, 32, e75–e82. [Google Scholar] [CrossRef] [PubMed]
  35. Lin, J.; Ding, D. The prognostic role of the cancer stem cell marker CD44 in ovarian cancer: A meta-analysis. Cancer Cell Int. 2017, 17, 8. [Google Scholar] [CrossRef] [PubMed]
  36. Qiao, G.L.; Song, L.N.; Deng, Z.F.; Chen, Y.; Ma, L.J. Prognostic value of CD44v6 expression in breast cancer: A meta-analysis. OncoTargets Ther. 2018, 11, 5451–5457. [Google Scholar] [CrossRef]
  37. Wang, Z.; Tang, Y.; Xie, L.; Huang, A.; Xue, C.; Gu, Z.; Wang, K.; Zong, S. The prognostic and clinical value of CD44 in colorectal cancer: A meta-analysis. Front. Oncol. 2019, 9, 309. [Google Scholar] [CrossRef]
  38. Ramirez, A.B.; Bhat, R.; Sahay, D.; De Angelis, C.; Thangavel, H.; Hedayatpour, S.; Dobrolecki, L.E.; Nardone, A.; Giuliano, M.; Nagi, C.; et al. Circulating tumor cell investigation in breast cancer patient-derived xenograft models by automated immunofluorescence staining, image acquisition, and single cell retrieval and analysis. BMC Cancer 2019, 19, 220. [Google Scholar] [CrossRef]
  39. Zhang, X.; Claerhout, S.; Prat, A.; Dobrolecki, L.E.; Petrovic, I.; Lai, Q.; Landis, M.D.; Wiechmann, L.; Schiff, R.; Giuliano, M.; et al. A renewable tissue resource of phenotypically stable, biologically and ethnically diverse, patient-derived human breast cancer xenograft models. Cancer Res. 2013, 73, 4885–4897. [Google Scholar] [CrossRef]
  40. Akbani, R.; Ng, P.K.; Werner, H.M.; Shahmoradgoli, M.; Zhang, F.; Ju, Z.; Liu, W.; Yang, J.Y.; Yoshihara, K.; Li, J.; et al. A pan-cancer proteomic perspective on the cancer genome atlas. Nat. Commun. 2014, 5, 3887. [Google Scholar] [CrossRef]
  41. Hirsch, F.R.; Varella-Garcia, M.; Bunn, P.A., Jr.; Di Maria, M.V.; Veve, R.; Bremmes, R.M.; Baron, A.E.; Zeng, C.; Franklin, W.A. Epidermal growth factor receptor in non-small-cell lung carcinomas: Correlation between gene copy number and protein expression and impact on prognosis. J. Clin. Oncol. 2003, 21, 3798–3807. [Google Scholar] [CrossRef] [PubMed]
  42. John, T.; Liu, G.; Tsao, M.S. Overview of molecular testing in non-small-cell lung cancer: Mutational analysis, gene copy number, protein expression and other biomarkers of EGFR for the prediction of response to tyrosine kinase inhibitors. Oncogene 2009, 28 (Suppl. 1), S14–S23. [Google Scholar] [CrossRef] [PubMed]
  43. Ahmad, I.; Patel, R.; Singh, L.B.; Nixon, C.; Seywright, M.; Barnetson, R.J.; Brunton, V.G.; Muller, W.J.; Edwards, J.; Sansom, O.J.; et al. HER2 overcomes PTEN (loss)-induced senescence to cause aggressive prostate cancer. Proc. Natl. Acad. Sci. USA 2011, 108, 16392–16397. [Google Scholar] [CrossRef] [PubMed] [Green Version]
  44. Neelakantan, D.; Zhou, H.; Oliphant, M.U.J.; Zhang, X.; Simon, L.M.; Henke, D.M.; Shaw, C.A.; Wu, M.F.; Hilsenbeck, S.G.; White, L.D.; et al. EMT cells increase breast cancer metastasis via paracrine GLI activation in neighbouring tumour cells. Nat. Commun. 2017, 8, 15773. [Google Scholar] [CrossRef]
  45. Slenter, D.N.; Kutmon, M.; Hanspers, K.; Riutta, A.; Windsor, J.; Nunes, N.; Melius, J.; Cirillo, E.; Coort, S.L.; Digles, D.; et al. WikiPathways: A multifaceted pathway database bridging metabolomics to other omics research. Nucleic Acids Res. 2018, 46, D661–D667. [Google Scholar] [CrossRef]
  46. Wang, J.; Vasaikar, S.; Shi, Z.; Greer, M.; Zhang, B. WebGestalt 2017: A more comprehensive, powerful, flexible and interactive gene set enrichment analysis toolkit. Nucleic Acids Res. 2017, 45, W130–W137. [Google Scholar] [CrossRef]
  47. Subramanian, A.; Tamayo, P.; Mootha, V.K.; Mukherjee, S.; Ebert, B.L.; Gillette, M.A.; Paulovich, A.; Pomeroy, S.L.; Golub, T.R.; Lander, E.S.; et al. Gene set enrichment analysis: A knowledge-based approach for interpreting genome-wide expression profiles. Proc. Natl. Acad. Sci. USA 2005, 102, 15545–15550. [Google Scholar] [CrossRef] [Green Version]
  48. George, J.T.; Jolly, M.K.; Xu, S.; Somarelli, J.A.; Levine, H. Survival outcomes in cancer patients predicted by a partial EMT gene expression scoring metric. Cancer Res. 2017, 77, 6415–6428. [Google Scholar] [CrossRef]
  49. Jolly, M.K.; Boareto, M.; Huang, B.; Jia, D.; Lu, M.; Ben-Jacob, E.; Onuchic, J.N.; Levine, H. Implications of the hybrid epithelial/mesenchymal phenotype in metastasis. Front. Oncol. 2015, 5, 155. [Google Scholar] [CrossRef]
  50. Lanczky, A.; Nagy, A.; Bottai, G.; Munkacsy, G.; Szabo, A.; Santarpia, L.; Gyorffy, B. miRpower: A web-tool to validate survival-associated miRNAs utilizing expression data from 2178 breast cancer patients. Breast Cancer Res. Treat. 2016, 160, 439–446. [Google Scholar] [CrossRef]
  51. Perou, C.M.; Sorlie, T.; Eisen, M.B.; van de Rijn, M.; Jeffrey, S.S.; Rees, C.A.; Pollack, J.R.; Ross, D.T.; Johnsen, H.; Akslen, L.A.; et al. Molecular portraits of human breast tumours. Nature 2000, 406, 747–752. [Google Scholar] [CrossRef] [PubMed]
  52. Badve, S.; Dabbs, D.J.; Schnitt, S.J.; Baehner, F.L.; Decker, T.; Eusebi, V.; Fox, S.B.; Ichihara, S.; Jacquemier, J.; Lakhani, S.R.; et al. Basal-like and triple-negative breast cancers: A critical review with an emphasis on the implications for pathologists and oncologists. Mod. Pathol. 2011, 24, 157–167. [Google Scholar] [CrossRef] [PubMed]
  53. Li, Q.; Birkbak, N.J.; Gyorffy, B.; Szallasi, Z.; Eklund, A.C. Jetset: Selecting the optimal microarray probe set to represent a gene. BMC Bioinform. 2011, 12, 474. [Google Scholar] [CrossRef] [PubMed]
  54. Ceccarelli, C.; De Leo, A.; Chieco, P.; Zamagni, C.; Zamagni, A.; Rubino, D.; Taffurelli, M.; Santini, D. A simple immunohistochemical bio-profile incorporating Bcl2 curbs those cases of invasive breast carcinoma for which an Oncotype Dx characterization is needed. PLoS ONE 2019, 14, e0217937. [Google Scholar] [CrossRef] [PubMed]
  55. Zarella, M.D.; Heintzelman, R.C.; Popnikolov, N.K.; Garcia, F.U. BCL-2 expression aids in the immunohistochemical prediction of the Oncotype DX breast cancer recurrence score. BMC Clin. Pathol. 2018, 18, 14. [Google Scholar] [CrossRef]
  56. Rimawi, M.F.; De Angelis, C.; Contreras, A.; Pareja, F.; Geyer, F.C.; Burke, K.A.; Herrera, S.; Wang, T.; Mayer, I.A.; Forero, A.; et al. Low PTEN levels and PIK3CA mutations predict resistance to neoadjuvant lapatinib and trastuzumab without chemotherapy in patients with HER2 over-expressing breast cancer. Breast Cancer Res. Treat. 2018, 167, 731–740. [Google Scholar] [CrossRef]
  57. Dziadziuszko, R.; Wynes, M.W.; Singh, S.; Asuncion, B.R.; Ranger-Moore, J.; Konopa, K.; Rzyman, W.; Szostakiewicz, B.; Jassem, J.; Hirsch, F.R. Correlation between MET gene copy number by silver in situ hybridization and protein expression by immunohistochemistry in non-small cell lung cancer. J. Thorac. Oncol. 2012, 7, 340–347. [Google Scholar] [CrossRef]
  58. Igarashi, T.; Teramoto, K.; Ishida, M.; Hanaoka, J.; Daigo, Y. Scoring of PD-L1 expression intensity on pulmonary adenocarcinomas and the correlations with clinicopathological factors. ESMO Open 2016, 1, e000083. [Google Scholar] [CrossRef] [Green Version]
  59. Parra, E.R.; Behrens, C.; Rodriguez-Canales, J.; Lin, H.; Mino, B.; Blando, J.; Zhang, J.; Gibbons, D.L.; Heymach, J.V.; Sepesi, B.; et al. Image analysis-based assessment of PD-L1 and tumor-associated immune cells density supports distinct intratumoral microenvironment groups in non-small cell lung carcinoma patients. Clin. Cancer Res. 2016, 22, 6278–6289. [Google Scholar] [CrossRef]
  60. Jolly, M.K.; Tripathi, S.C.; Jia, D.; Mooney, S.M.; Celiktas, M.; Hanash, S.M.; Mani, S.A.; Pienta, K.J.; Ben-Jacob, E.; Levine, H. Stability of the hybrid epithelial/mesenchymal phenotype. Oncotarget 2016, 7, 27067–27084. [Google Scholar] [CrossRef] [Green Version]
  61. Alix-Panabieres, C.; Pantel, K. Circulating tumor cells: Liquid biopsy of cancer. Clin. Chem. 2013, 59, 110–118. [Google Scholar] [CrossRef] [PubMed]
  62. Tsujimoto, Y.; Finger, L.R.; Yunis, J.; Nowell, P.C.; Croce, C.M. Cloning of the chromosome breakpoint of neoplastic B cells with the t(14;18) chromosome translocation. Science 1984, 226, 1097–1099. [Google Scholar] [CrossRef] [PubMed]
  63. Chiarugi, V.; Ruggiero, M. Role of three cancer “master genes” p53, bcl2 and c-myc on the apoptotic process. Tumori 1996, 82, 205–209. [Google Scholar] [PubMed]
  64. Hanahan, D.; Weinberg, R.A. Hallmarks of cancer: The next generation. Cell 2011, 144, 646–674. [Google Scholar] [CrossRef]
  65. Curtis, C.; Shah, S.P.; Chin, S.F.; Turashvili, G.; Rueda, O.M.; Dunning, M.J.; Speed, D.; Lynch, A.G.; Samarajiwa, S.; Yuan, Y.; et al. The genomic and transcriptomic architecture of 2,000 breast tumours reveals novel subgroups. Nature 2012, 486, 346–352. [Google Scholar] [CrossRef]
  66. Hwang, K.T.; Kim, K.; Chang, J.H.; Oh, S.; Kim, Y.A.; Lee, J.Y.; Jung, S.H.; Choi, I.S. BCL2 regulation according to molecular subtype of breast cancer by analysis of the cancer genome atlas database. Cancer Res. Treat. 2018, 50, 658–669. [Google Scholar] [CrossRef]
  67. Honma, N.; Horii, R.; Ito, Y.; Saji, S.; Younes, M.; Iwase, T.; Akiyama, F. Differences in clinical importance of Bcl-2 in breast cancer according to hormone receptors status or adjuvant endocrine therapy. BMC Cancer 2015, 15, 698. [Google Scholar] [CrossRef]
  68. Abdel-Fatah, T.M.; Perry, C.; Dickinson, P.; Ball, G.; Moseley, P.; Madhusudan, S.; Ellis, I.O.; Chan, S.Y. Bcl2 is an independent prognostic marker of triple negative breast cancer (TNBC) and predicts response to anthracycline combination (ATC) chemotherapy (CT) in adjuvant and neoadjuvant settings. Ann. Oncol. 2013, 24, 2801–2807. [Google Scholar] [CrossRef]
  69. Bouchalova, K.; Svoboda, M.; Kharaishvili, G.; Vrbkova, J.; Bouchal, J.; Trojanec, R.; Koudelakova, V.; Radova, L.; Cwiertka, K.; Hajduch, M.; et al. BCL2 is an independent predictor of outcome in basal-like triple-negative breast cancers treated with adjuvant anthracycline-based chemotherapy. Tumour. Biol. 2015, 36, 4243–4252. [Google Scholar] [CrossRef]
  70. Ozretic, P.; Alvir, I.; Sarcevic, B.; Vujaskovic, Z.; Rendic-Miocevic, Z.; Roguljic, A.; Beketic-Oreskovic, L. Apoptosis regulator Bcl-2 is an independent prognostic marker for worse overall survival in triple-negative breast cancer patients. Int. J. Biol. Mark. 2018, 33, 109–115. [Google Scholar] [CrossRef]
  71. Vaillant, F.; Merino, D.; Lee, L.; Breslin, K.; Pal, B.; Ritchie, M.E.; Smyth, G.K.; Christie, M.; Phillipson, L.J.; Burns, C.J.; et al. Targeting BCL-2 with the BH3 mimetic ABT-199 in estrogen receptor-positive breast cancer. Cancer Cell 2013, 24, 120–129. [Google Scholar] [CrossRef] [PubMed]
  72. Escorcio-Dourado, C.S.; Martins, L.M.; Simplicio-Revoredo, C.M.; Sampaio, F.A.; Tavares, C.B.; da Silva-Sampaio, J.P.; Borges, U.S.; Alves-Ribeiro, F.A.; Lopes-Costa, P.V.; Lima-Dourado, J.C.; et al. Bcl-2 antigen expression in luminal A and triple-negative breast cancer. Med. Oncol. 2017, 34, 161. [Google Scholar] [CrossRef]
  73. Inao, T.; Iida, Y.; Moritani, T.; Okimoto, T.; Tanino, R.; Kotani, H.; Harada, M. Bcl-2 inhibition sensitizes triple-negative human breast cancer cells to doxorubicin. Oncotarget 2018, 9, 25545–25556. [Google Scholar] [CrossRef] [PubMed] [Green Version]
  74. Oakes, S.R.; Vaillant, F.; Lim, E.; Lee, L.; Breslin, K.; Feleppa, F.; Deb, S.; Ritchie, M.E.; Takano, E.; Ward, T.; et al. Sensitization of BCL-2-expressing breast tumors to chemotherapy by the BH3 mimetic ABT-737. Proc. Natl. Acad. Sci. USA 2012, 109, 2766–2771. [Google Scholar] [CrossRef] [PubMed]
  75. DeRose, Y.S.; Wang, G.; Lin, Y.C.; Bernard, P.S.; Buys, S.S.; Ebbert, M.T.; Factor, R.; Matsen, C.; Milash, B.A.; Nelson, E.; et al. Tumor grafts derived from women with breast cancer authentically reflect tumor pathology, growth, metastasis and disease outcomes. Nat. Med. 2011, 17, 1514–1520. [Google Scholar] [CrossRef] [PubMed]
  76. Chijiwa, T.; Kawai, K.; Noguchi, A.; Sato, H.; Hayashi, A.; Cho, H.; Shiozawa, M.; Kishida, T.; Morinaga, S.; Yokose, T.; et al. Establishment of patient-derived cancer xenografts in immunodeficient NOG mice. Int. J. Oncol. 2015, 47, 61–70. [Google Scholar] [CrossRef] [Green Version]
  77. Dobrolecki, L.E.; Airhart, S.D.; Alferez, D.G.; Aparicio, S.; Behbod, F.; Bentires-Alj, M.; Brisken, C.; Bult, C.J.; Cai, S.; Clarke, R.B.; et al. Patient-derived xenograft (PDX) models in basic and translational breast cancer research. Cancer Metastasis Rev. 2016, 35, 547–573. [Google Scholar] [CrossRef] [Green Version]
  78. Whittle, J.R.; Lewis, M.T.; Lindeman, G.J.; Visvader, J.E. Patient-derived xenograft models of breast cancer and their predictive power. Breast Cancer Res. 2015, 17, 17. [Google Scholar] [CrossRef]
Figure 1. Outline of experimental design. Workflow showing detection of circulating tumor cells (CTCs) and CTC clusters (CTCcls) from patient-derived xenograft (PDX) blood using immunofluorescence staining. The reverse-phase protein array (RPPA) and transcriptomic data from PDX tumors with versus without CTCcls were interrogated and analyzed to identify differentially expressed proteins and genes.
Jcm 08 01772 g001
Figure 2. IHC analysis of B-cell lymphoma 2 (Bcl2) expression with H-score in CTCcl− vs. CTCcl+ triple-negative breast cancer (TNBC) PDX tumors. Primary tumor tissues were sectioned and stained individually with an anti-Bcl2 antibody after antigen retrieval. Sections were exposed with metal enhanced 3,3′-Diaminobenzidine (DAB) substrate and counter-stained with hematoxylin. Histoscore was assigned based on staining intensity (0 (absent), 1+ (weak), 2+ (moderate), or 3+ (strong)) and the percentage of cells stained.
Jcm 08 01772 g002
Figure 3. Pathway analysis showing apoptosis as one of the downregulated pathways in CTCcl+ samples. A total of 39 enriched pathway terms were identified with p-value < 0.05 and a false discovery rate (FDR) q-value < 0.1, and the enrichment score was given as normalized enrichment score (NES).
Jcm 08 01772 g003
Figure 4. Inferential epithelial-mesenchymal transition (EMT) metric assigned to TNBC PDX models. This metric considers a set of EMT-relevant predictor transcripts and a cross-platform normalizer transcript set and uses it to probabilistically categorize samples into epithelial (close to 0), mesenchymal (close to 2), or hybrid E/M (close to 1).
Jcm 08 01772 g004
Figure 5. Prognostic value of CTCcl-associated gene signature in patients with basal-like breast cancer (BC), most of whom have TNBC. Fifty-four genes were found to be upregulated in TNBC PDX models with CTCcls. Gene-expression profiles of 360 basal-like BC were each scored with this signature. Kaplan-Meier curve compares distant metastasis-free survival in BC patients with relatively higher signature scoring versus those with lower scoring. Patient data were extracted from publicly available datasets using http://kmplot.com/.
Jcm 08 01772 g005
Table 1. Differentially expressed proteins in TNBC PDX tumors with versus without CTCcls based on RPPA analysis.
AntibodyAverage Log2 Intensity on TNBC-PDX Tumorsp-ValueFDR q-ValueExpression LevelsFC
CTCcl+CTCcl−
* Bcl21.63−0.18<0.0001<0.00013.5
# ACC1−1.550.02<0.00010.00050.3
*, significantly upregulated protein; #, significantly downregulated protein. Abbreviations: ACC1, acetyl CoA carboxylase-1; Bcl2, B-cell lymphoma 2; CTCcl, circulating tumor cell cluster; FC, fold change; FDR, false discovery rate; PDX, patient-derived xenograft; TNBC, triple-negative breast cancer; RPPA, reverse-phase protein array.

