Article

Studies of Effects of Calcination Temperature on the Crystallinity and Optical Properties of Ag-Doped ZnO Nanocomposites

1
Department of Applied Chemistry & Chemical Engineering, Faculty of Engineering & Technology, University of Dhaka, Dhaka 1000, Bangladesh
2
Department of Chemistry for Materials, Graduate School of Engineering, Mie University, Tsu, Mie 514–8507, Japan
3
Mie Global Environment Center for Education & Research, Mie University, Tsu, Mie 514–8507, Japan
*
Author to whom correspondence should be addressed.
Submission received: 24 January 2019 / Revised: 7 February 2019 / Accepted: 12 February 2019 / Published: 14 February 2019

Abstract

:
Ag-doped ZnO nanocomposites are successfully synthesized at different calcination temperatures and times through a simple, effective, high-yield and low-cost mechanochemical combustion technique. Effects of calcination temperature on the crystallinity and optical properties of Ag/ZnO nanocomposites have been studied by X-ray diffraction (XRD), UV−visible diffuse reflectance spectroscopy (UV-DRS), photoluminescence spectroscopy (PL) and X-ray photoelectron spectroscopy (XPS). The XRD patterns of the synthesized Ag/ZnO exhibit a well-crystalline wurtzite ZnO crystal structure. The grain size of Ag/ZnO nanocomposites is found to be 19 and 46 nm at calcination temperatures of 400 °C and 700 °C, respectively. The maximum absorption in the UV region is obtained for Ag/ZnO nanocomposites synthesized at a calcination temperature of 500 °C for 3 h. The peak position of blue emissions is almost the same for the nanocomposites obtained at 300–700 °C calcination temperatures. The usual band edge emission in the UV is not obtained at 330 nm excitation. Band edge and blue band emissions are observed for the use of low excitation energy at 335–345 nm.

1. Introduction

Nano-sized semiconductors are of great interest because of their extraordinary physicochemical properties, which differ from their bulk counterparts [1]. Zinc oxide (ZnO) is a wide direct band-gap (3.2 eV) semiconductor with large exciton binding energy of 60 meV at room temperature [2]. ZnO also has excellent optical and electrical properties, catalytic activity, chemical stability as well as environmental friendliness [3]. The n-type ZnO semiconductor has higher electron mobility, high breakdown voltages and higher breakdown field strength [4]. Zinc oxide is promising for applications including gas sensors, memory devices, UV-light emitting diodes, solar cells, piezo- electric transducers, photodiodes, photodetectors and photocatalysts [5,6,7]. In addition, modified ZnO has also been used as transparent conducting electrodes for several types of optoelectronic devices [2].
Fabrication of efficient devices based on semiconductor nanostructures requires an in-depth understanding of their optoelectronic behaviors, which depend on their shape, size and impurity contents. Due to the vast optoelectronic applications of ZnO nanostructures, several theoretical and experimental studies have been conducted on the optical properties of ZnO nanostructures with different morphologies, such as nanoparticles, nanowires, nanobelts, nanoprisms and nanostructured thin films [8,9,10]. Doping of transition metals into the ZnO lattice can lead to changes in the electrical, optical and magnetic properties of ZnO [11]. Different transition or noble metals such as Mn, Fe, Ni, Cu and Ag have been widely used in the doping of ZnO [12,13]. Among the metals, Ag doping has many advantages; Ag nanoparticles act as electron sinks under UV, as a photo-sensitizer in visible light and as an electron sink/photo-sensitizer under solar light. The surface plasmon resonance (SPR) effect of Ag can enhance photocatalytic activity through its optical vibration under the visible region [14,15]. Also, ohmic contact at the Ag/ZnO interface can facilitate interfacial charge transfer, enhancing the separation of photo-induced electron/hole pairs [12,16]. Thus, Ag/ZnO nanocomposites can have high piezo/solar-photocatalytic activity by coupling the surface plasmon resonance and piezophototronic effect [17]. Xue et al. [18] have studied the piezo-potential enhanced photocatalytic degradation of organic dye using ZnO nanowires. Park et al. [19] have reported the role of Ag as a prominent luminescent activator in compound semiconductor.
The present article has dealt with the synthesis of undoped and Ag-doped ZnO nanocomposites through mechanochemical combustion method. Effects of calcination temperature on the X-ray diffraction (XRD), diffuse reflectance spectroscopy (DRS), photoluminescence spectroscopy (PL) and X-ray photoelectron spectroscopy (XPS) behavior of the Ag/ZnO nanocomposites are studied in details.

2. Materials and Methods

2.1. Chemicals and Materials

Zinc acetate dehydrate (C4H6O4Zn·2H2O), oxalic acid dehydrate (C2H2O4·2H2O), silver acetate (C2H3O2Ag) and pure water (resistivity >18 MΩ cm) were used for the synthesis of the sample. All the reagents were of analytical grade and used without further purification.

2.2. Preparation of Ag/ZnO

Ag/ZnO was prepared by the mechanochemical combustion technique with controlled combustion method (Figure 1). In a typical synthesis, 2.195 g of zinc acetate dihydrate and 2.521 g of oxalic acid dihydrate were taken in agate mortar and the mixture was ground for 10 min in order to obtain a paste of zinc oxalate dihydrate and acetic acid. The existence of acetic acid was confirmed by its typical smell. The loss of acetic acid byproduct in the form of fumes became a driving force for the reaction. Silver acetate was added to the above paste as a source of silver, and the grinding process was continued for the next 10 min to obtain zinc oxalate-silver oxalate precursor. The Ag doped zinc oxide crystallites were obtained by calcination of precursor powders at the temperature of 300−700 °C under an air atmosphere. The undoped ZnO was also synthesized by calcination of a paste of zinc oxalate and acetic acid for the comparison.

2.3. Characterization of Ag/ZnO

The powder X–ray diffractometer (XRD, RIGAKU Ultima IV, sample horizontal type) was used in order to record the diffraction patterns of photocatalysts employing Cu Kα radiation of wavelength 0.15406 nm with tube current of 50 mA at 40 kV in 2θ angle range from 10° to 80° with a scan speed of 4°/min and a step size of 0.02°. A Hitachi S–4000 scanning electron microscope (SEM) was employed to observe the morphologies of oxides. The particle size was measured by transmission electron microscopy (TEM, JEOL, JEM−1011, Peabody, MA, USA) working at 100 kV. The diffuse reflectance spectra (DRS) of photocatalysts were recorded over a range of 200−800 nm with a Shimadzu UV–2450 UV/vis system equipped with an integrating sphere diffuse reflectance accessory using the reference material BaSO4 as a reference standard material. Photoluminescence (PL) spectra of oxide powders were measured at room temperature using a Shimadzu RF–5300PC system equipped with solid sample holder. X–ray photoelectron spectroscopy (XPS) measurements were carried out with PHI Quantera SXM photoelectron spectrometer using Al Kα radiation.

3. Results and Discussion

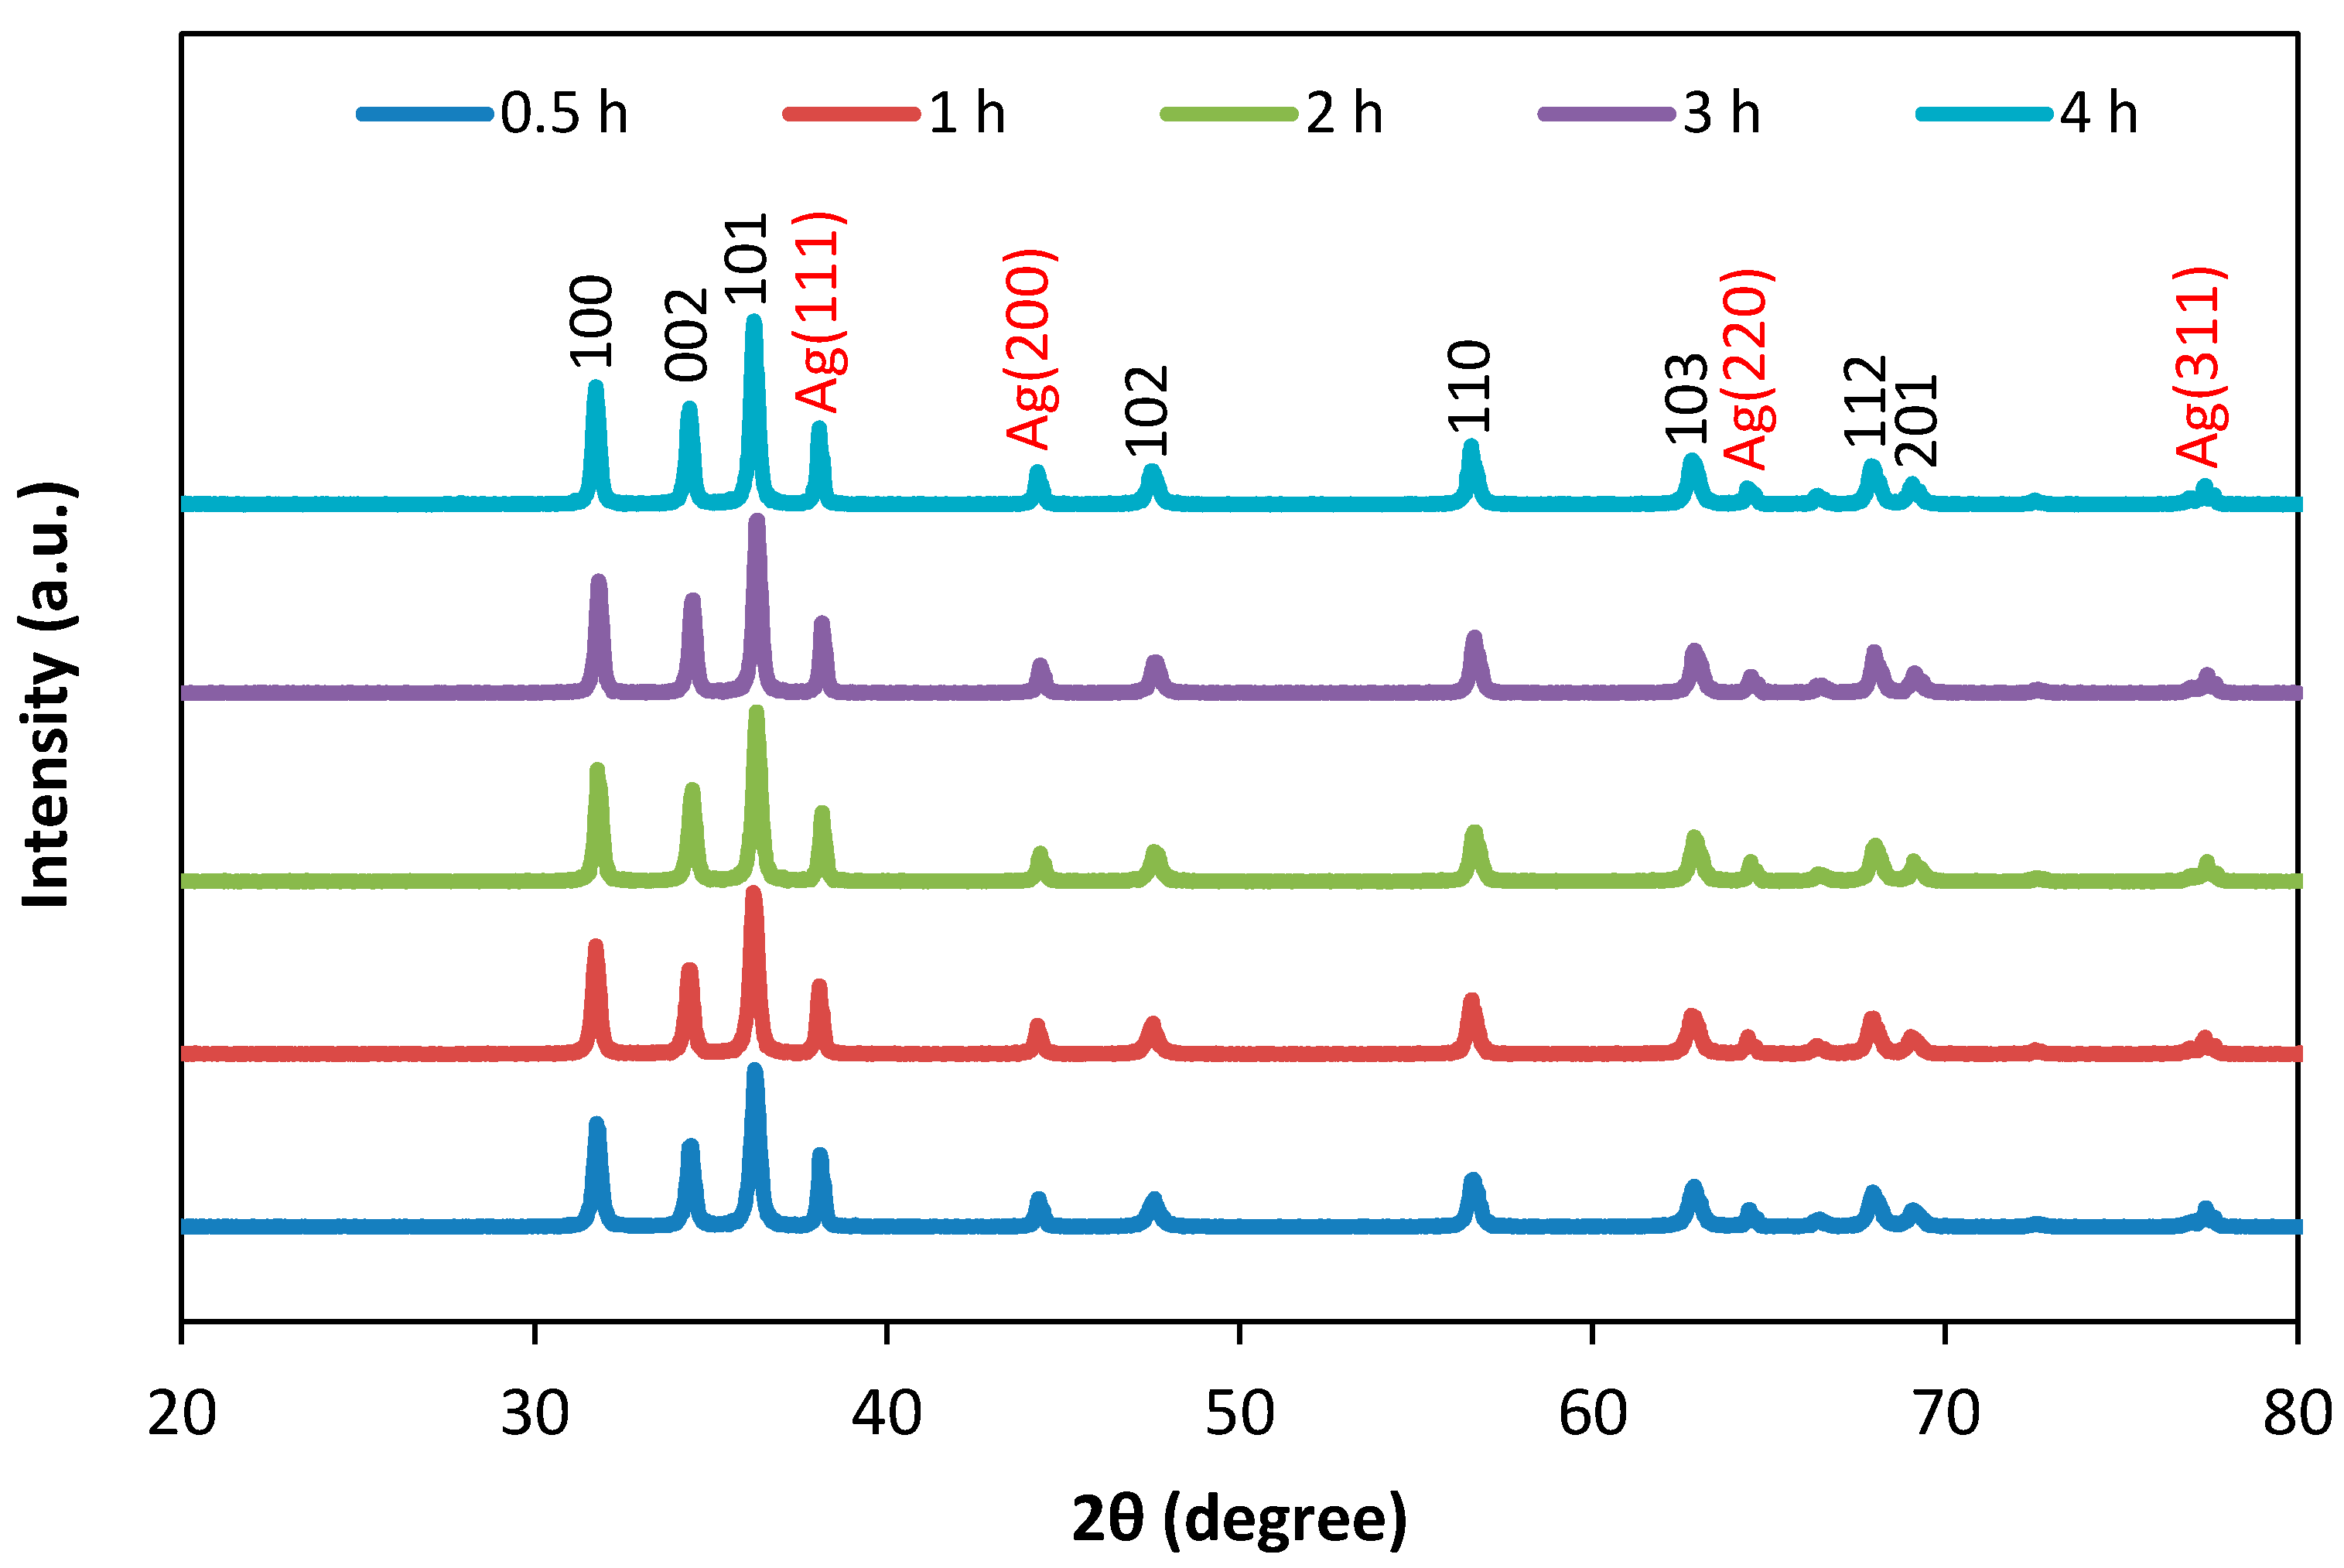
3.1. Structural Analysis

Figure 2 displays XRD analysis of Ag/ZnO nanocomposites synthesized at calcination temperatures from 300 °C to 700 °C. The major peaks of ZnO at 2θ values of 31.7°, 34.4°, 36.2° and 47.5° can be indexed to (100), (002), (101) and (102) crystal planes and characteristic ZnO peaks become obvious at calcination temperatures above 300 °C. It should be noted that the formation of the crystalline phase of ZnO begins at about 400 °C [20]. From Figure 2, it can be seen that Ag/ZnO composite samples has four major peaks at 38.16°, 44.34°, 64.48° and 77.42°, which are readily assigned to the (111), (200), (220) and (311) planes of face–center–cubic (fcc) structure of Ag (JCPDS card no. 04–783), respectively [21].
The half peak widths of the characteristic peaks gradually reduce with increasing calcination temperatures. This fact suggests that ZnO particle sizes increase with increasing calcination temperature. The diffraction intensities and angles of Ag do not significantly change with increasing calcination temperatures. The grain size of the Ag-doped ZnO have been obtained from the full width at half maximum (FWHM) of the most intense peaks of the respective crystals using the Scherrer equation, D = 0.9λ/βcosθ, where λ is the X-ray wavelength, D the average crystallite size, θ the Bragg diffraction angle and β the full width at half-maximum. The grain size is found to be 19 and 46 nm at calcination temperatures of 400 °C and 700 °C, respectively. Potti and Srivastava have also reported that the crystallite size of the oxides expanded with increasing the calcination temperatures [22].
The Figure 3 illustrates XRD analysis of Ag/ZnO at different calcination times from 0.5 h to 4 h. The diffraction intensities and angles of ZnO and Ag does not remarkably shift with increasing calcination time.

3.2. Morphology study

Figure 4 displays SEM and TEM micrographs of the Ag/ZnO synthesized at the calcination temperature at 500 °C for 3 h. From the Figure 4, it is seen that the Ag/ZnO is heterogeneous in nature and distributed over the surface with the rod-shaped branches of building blocks. The average size of the particles is in the nanometer range, which is consistent with the XRD results.

3.3. Diffuse Reflectance Spectroscopic (DRS) Spectra

The spectra of Ag-doped ZnO samples are measured by UV-diffuse reflectance spectroscopy. The absorption peaks at the UV region correspond to the absorption of ZnO. The zinc oxide–silver nanocomposites display strong absorption in the UV region and weak absorption in the visible region, which is related to the ZnO bands and surface plasmon resonance (SPR) bands of Ag nanoparticles, respectively [23,24]. The optical property of Ag/ZnO nanocomposites synthesized at different calcination temperatures has been studied by DRS (Figure 5a). The largest absorbance for all the nanocomposites is in the UV-region, whereas the Ag/ZnO nanocomposite prepared at a calcination temperature of 500 °C shows the maximum absorption.
The reflectance data has been converted to the Kubelka−Munk equation which is expressed as F(R) = (1 − R)2/2R. The band gap of the oxides is deduced from the Tauc plot of [F(R)hν]2 versus photon energy. The Tauc plots are shown in Figure 5b. A slight decrease in the band gap of Ag/ZnO is obtained at the 500 °C calcination temperature, compared with those observed at other temperatures. The conduction and valence band positions of the semiconductor at the point of zero charge can be calculated by the following formula [25,26]:
E VB = χ E e   + 0.5 E g
E CB = E VB E g
where EVB is the potential of the valence band, χ is the electronegativity of the semiconductor. The electronegativity value for Ag/ZnO is 5.79 eV [27]. The Ee is the energy of free electrons on the hydrogen scale (4.5 eV) and Eg is the band gap energy of the Ag/ZnO nanocomposites (3.24 eV). The EVB and ECB of Ag/ZnO prepared at the calcination temperature of 500 °C are 2.91 and –0.33 eV, respectively.
The effect of different calcination times on the optical properties of Ag/ZnO is investigated by DRS (Figure 6a). The best absorption intensity of an Ag/ZnO composite is obtained for 3 h of calcination time. The Tauc plots are shown in Figure 6b.

3.4. Photoluminescence Study

The room temperature photoluminescence (PL) spectra of Ag/ZnO are recorded over the wavelength range 350−600 nm. Figure 7 present the PL of Ag/ZnO synthesized at different calcination temperatures. In the PL spectra for ZnO, typically there are emission bands in the ultraviolet (UV) and visible (green, yellow, blue and violet) regions [28]. The Ag/ZnO composite shows a strong emission peak at around 389 nm in the UV region, which is attributed to near band edge emission and also related to the electron–hole charge recombination process [29]. The weak emission at 400–600 nm corresponds to intrinsic or extrinsic defects in ZnO and oxygen vacancies. It is estimated that the blue band emission is due to the transition from extended interstitial Zn states to the valence band [30]. The peak position of the blue emissions is almost the same for the samples obtained at 300–700 °C calcination temperatures and the usual band edge emission is not obtained at the high excitation energy (330 nm) for Ag/ZnO (Figure 7a). The band edge and blue band emissions are observed for the use of low excitation energy at 335–345 nm, as presented in Figure 7b–d. The near band edge is weak at 330 nm excitation due to low the exciton recombination and strong near band edge is observed on excitation at 340 nm due to the high exciton transition from the localized level below the conduction band to the valence band.
Figure 8 present the PL of Ag/ZnO synthesized at different calcination times. The peak positions of the blue emissions are almost the same for the composites obtained for calcination times (Figure 8). The usual band edge emission in the UV region cannot be obtained at 330 nm excitation (Figure 8a). At excitation energies of 335–345 nm, the usual band edge and deep-level emission in the blue band can be seen, as shown in Figure 8b–d.
The dependence of the intensity of UV and blue emissions on calcination temperatures can be clearly associated in Figure 9a. The rapid increases of intensity at 390 nm and 467 nm using 340 nm excitation are well demonstrated with increasing calcination temperatures. Figure 9b shows the calcination times dependence of the intensity of UV and blue emissions using 340 nm excitation for Ag/ZnO. The blue emissions intensity at 468 nm is almost flat for all of calcination times.

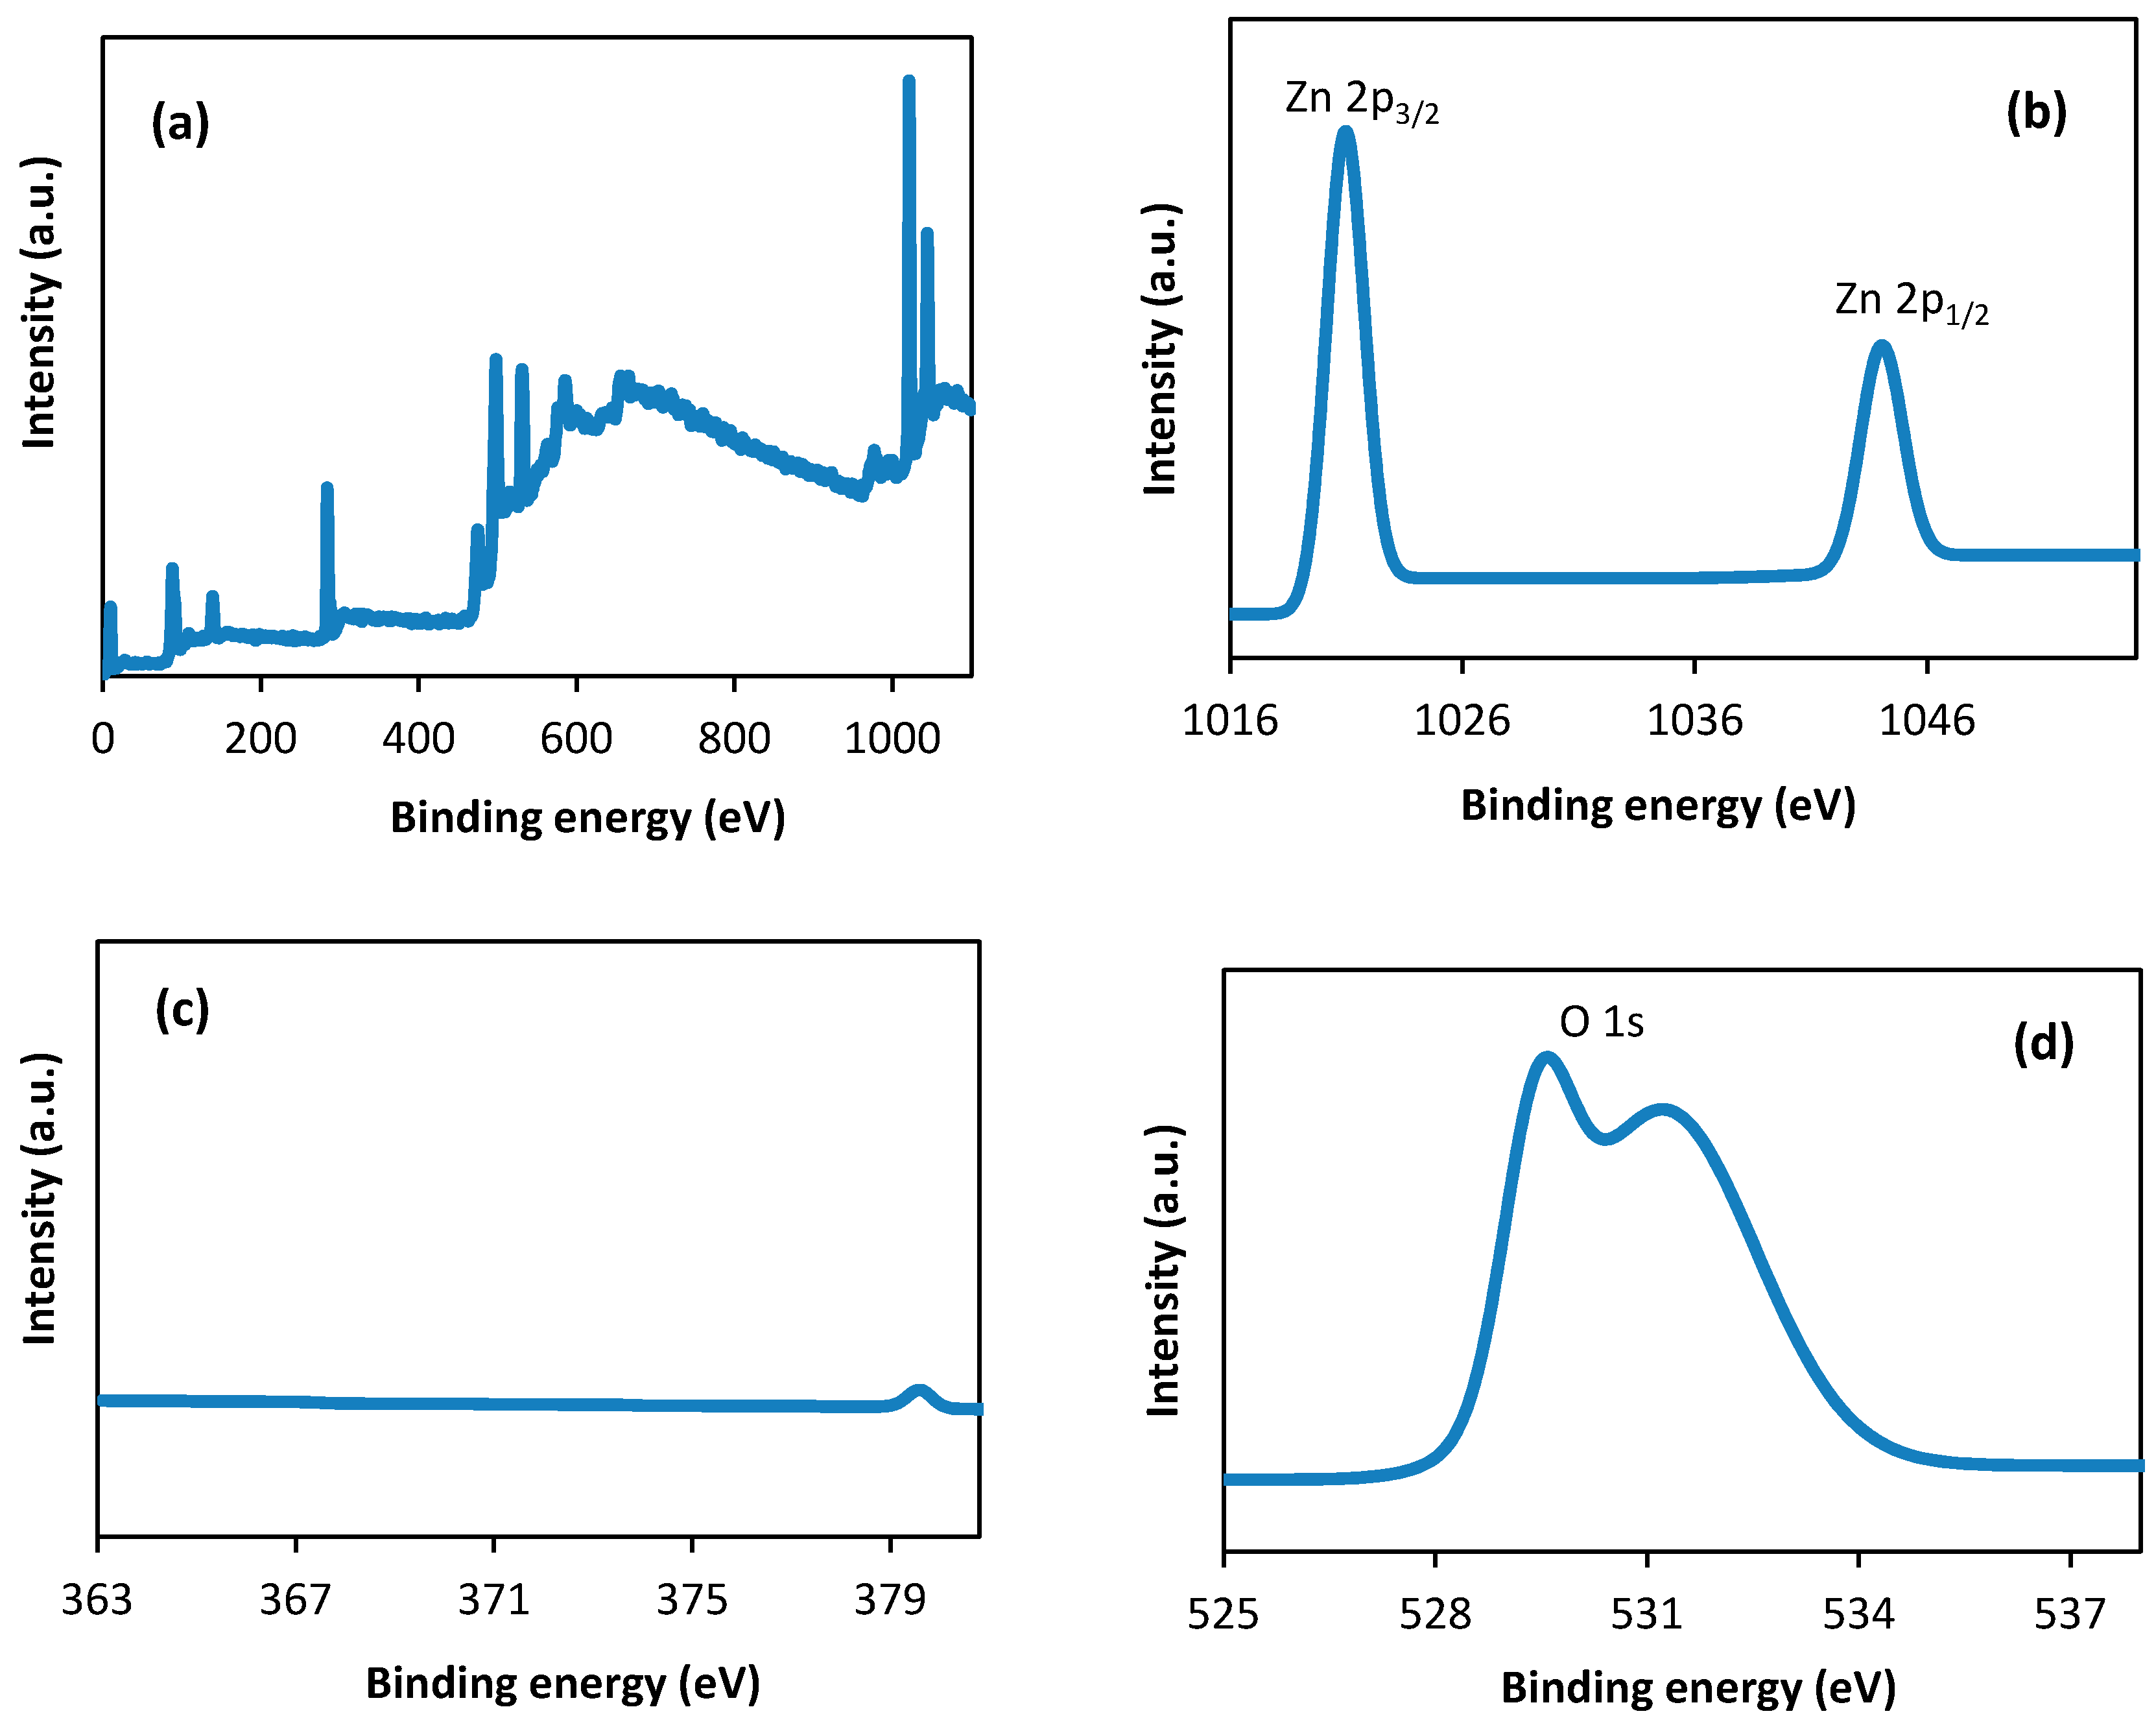
3.5. X-Ray Photoelectron Spectroscopic (XPS) Spectra

XPS is a sensitive technique for investigating the chemical composition of the surface of a material. The surface compositions and chemical states of the pure ZnO are determined by XPS. Figure 10a displays the fully scanned spectrum of ZnO synthesized at a calcination temperature of 500 °C for 3 h. In Figure 10b, the peak of Zn 2p1/2 and Zn 2p3/2 is located at 1044.1 and 1021.0 eV, respectively [31]. At 373.6 eV (Ag 3d3/2) and 367.6 eV (Ag 3d5/2), the peaks are not detected in undoped ZnO (Figure 10c) [32]. The O1s spectra of ZnO are shown in Figure 10d. The 529.6 eV peak belongs to the crystal lattice oxygen (OL) in ZnO, while the 531.2 eV peak can be assigned to the oxygen of surface hydroxyl (OH) on the catalyst surface [33].
Figure 11a show the scan survey spectra for the representative Ag/ZnO synthesized at the calcination temperature at 500 °C for 3 h. All of the peaks on the curve can be ascribed to Ag, Zn and O elements and no peaks of other elements were observed (Figure 11). Therefore, the sample is composed of Ag, Zn and O only and these results are agreement with the XRD patterns. The positions of Zn 2p3/2 peak for Ag/ZnO nanocomposites (Figure 11b) are nearly same value, compared with that of the prepared undoped ZnO nanoparticles, which confirms that Zn element exists mainly in the form of the Zn2+ chemical state on the sample surfaces. The difference between the two bonding energies of Zn 2p1/2 and Zn 2p3/2 for Ag/ZnO samples is 23.1 eV, which also suggests that the Zn is in a +2 oxidation state [34]. Figure 11c illustrates the Ag 3d XPS spectra for Ag/ZnO samples. The difference between the peaks of Ag 3d5/2 and 3d3/2 is 6.0 eV, indicates the presence of metallic Ag [35]. The high-resolution spectra of O 1s are shown in Figure 11d. O 1s profile is asymmetric, which can be attributed to the lattice oxygen of ZnO and physical adsorbed oxygen, respectively [34]. Patil et al. have mentioned only OL in the O 1s spectrum of the Ag–ZnO sample at a binding energy of 529.75 eV [36]. The data is similar to our synthesized Ag/ZnO nanocomposites and no OH peak is present at the binding energy of about 531.2 eV (Figure 11d).

4. Conclusions

Ag-doped ZnO nanocomposites were successfully synthesized at different calcination temperatures and times through the mechanochemical combustion technique. The synthesized nanocomposite materials were characterized by XRD, SEM, TEM, UV–DRS, PL and XPS. It was shown that Ag/ZnO nanocomposites were composed of metallic Ag and wurtzite ZnO. The maximum absorption intensity was obtained at a calcination temperature of 500 °C for 3 h. The usual band edge emission in the UV region was not obtained at 330 nm excitation, whereas the band edge and blue band emissions were observed at excitations of 335–345 nm.

Author Contributions

M.A.I.M. and S.K. conceived and designed the experiments. M.A.I.M. performed the experiments and wrote the paper. M.F., I.T., and H.K. analyzed the results and advised the project.

Acknowledgments

The present research was partly supported by Grant–in–Aid for Scientific Research (C) 18K11709 from the Ministry of Education, Culture, Sports, Science, and Technology of Japan. All experiments were conducted at Mie University. Any opinions, findings, conclusions or recommendations expressed in this paper are those of the authors and do not necessarily reflect the view of the supporting organizations.

Conflicts of Interest

The authors declare no conflict of interest.

References

  1. Sánchez Zeferino, R.; Barboza Flores, M.; Pal, U. Photoluminescence and raman scattering in Ag-doped ZnO nanoparticles. J. Appl. Phys. 2011, 109, 014308. [Google Scholar] [CrossRef]
  2. Lee, K.M.; Lai, C.W.; Ngai, K.S.; Juan, J.C. Recent developments of zinc oxide based photocatalyst in water treatment technology: A review. Water Res. 2016, 88, 428–448. [Google Scholar] [CrossRef] [PubMed]
  3. Ansari, S.A.; Cho, M.H. Facile and sustainable synthesis of carbon-doped ZnO nanostructures towards the superior visible light photocatalytic performance. New J. Chem. 2017, 41, 9314–9320. [Google Scholar] [CrossRef]
  4. Liu, K.; Sakurai, M.; Aono, M. ZnO-based ultraviolet photodetectors. Sensors 2010, 10, 8604–8634. [Google Scholar] [CrossRef] [PubMed]
  5. Saleh, R.; Djaja, N.F. Transition-metal-doped ZnO nanoparticles: Synthesis, characterization and photocatalytic activity under UV light. Spectrochim. Acta A 2014, 130, 581–590. [Google Scholar] [CrossRef]
  6. Habibi, M.H.; Rahmati, M.H. The effect of operational parameters on the photocatalytic degradation of Congo red organic dye using ZnO—CdS core–shell nano-structure coated on glass by Doctor Blade method. Spectrochim. Acta A 2015, 137, 160–164. [Google Scholar] [CrossRef]
  7. Ansari, M.Z.; Ansari, S.A.; Parveen, N.; Cho, M.H.; Song, T. Lithium ion storage ability, supercapacitor electrode performance, and photocatalytic performance of tungsten disulfide nanosheets. New J. Chem. 2018, 42, 5859–5867. [Google Scholar] [CrossRef]
  8. Wang, D.; Song, C. Controllable Synthesis of ZnO Nanorod and Prism Arrays in a Large Area. J. Phys. Chem. B 2005, 109, 12697–12700. [Google Scholar] [CrossRef]
  9. Feng, W.H.; Wang, B.; Zheng, Z.Y.; Fang, Z.B.; Wang, Z.F.; Zhang, S.Y.; Li, Y.H.; Liu, P. Predictive model for optimizing the near–field electromagnetic energy transfer in plasmonic nanostructure–involved photocatalysts. Appl. Catal. B 2016, 186, 143–150. [Google Scholar] [CrossRef]
  10. Zhao, L.; Lian, J.; Liu, Y.; Jiang, Q. Structural and optical properties of ZnO thin films deposited on quartz glass by pulsed laser deposition. Appl. Surf. Sci. 2006, 252, 8451–8455. [Google Scholar] [CrossRef]
  11. Türkyılmaza, Ş.Ş.; Güya, N.; Özacar, M. Photocatalytic efficiencies of Ni, Mn, Fe and Ag doped ZnO nanostructures synthesized by hydrothermal method: The synergistic/antagonistic effect between ZnO and metals. J. Photochem. Photobiol. A Chem. 2017, 341, 39–50. [Google Scholar] [CrossRef]
  12. Hou, X.M. ZnO/Ag heterostructured nanoassemblies: Wet–chemical preparation and improved visible–light photocatalytic performance. Mater. Lett. 2015, 139, 201–204. [Google Scholar] [CrossRef]
  13. Park, W.; Jone, T.C.; Summers, C.J. Optical properties of SrS:Cu,Ag two-component phosphors for electroluminescent devices. Appl. Phys. Lett. 1999, 74, 1785–1787. [Google Scholar] [CrossRef]
  14. Xie, W.; Li, Y.; Sun, W.; Huang, J.; Xie, H.; Zhao, X. Surface modification of ZnO with Ag improves its photocatalytic efficiency and photostability. J. Photochem. Photobiol. A 2010, 216, 149–155. [Google Scholar] [CrossRef]
  15. Lee, M.-K.; Kim, T.G.; Kim, W.; Sung, Y.-M. Surface plasmon resonance (SPR) electron and energy transfer in noble metal-zinc oxide composite nanocrystals. J. Phys. Chem. C 2008, 112, 10079–10082. [Google Scholar] [CrossRef]
  16. Dong, Y.M.; Feng, C.Y.; Jiang, P.P.; Wang, G.L.; Li, K.; Miao, H.Y. Simple one-pot synthesis of ZnO/Ag heterostructures and the application in visible-light-responsive photocatalysis. RSC Adv. 2014, 4, 7340–7346. [Google Scholar] [CrossRef]
  17. Zhang, L.; Zhu, D.; He, H.; Wang, Q.; Xing, L.; Xue, X. Enhanced piezo/solar-photocatalytic activity of Ag/ZnO nanotetrapods arising from the coupling of surface plasmon resonance and piezophototronic effect. J. Phys. Chem. Solids 2017, 102, 27–33. [Google Scholar] [CrossRef]
  18. Xue, X.; Zang, W.; Deng, P.; Wang, Q.; Xing, L.; Zhang, Y.; Wang, Z.L. Piezo-potential enhanced photocatalytic degradation of organic dye using ZnO nanowires. Nano Energy 2015, 13, 414–422. [Google Scholar] [CrossRef]
  19. Wang, X.; Ding, Y.; Li, Z.; Song, J.; Wang, Z.L. Single-Crystal Mesoporous ZnO Thin Films Composed of Nanowalls. J. Phys. Chem. C 2009, 113, 1791–1794. [Google Scholar] [CrossRef] [Green Version]
  20. Georgekutty, R.; Seery, M.K.; Pillai, S.C. A highly efficient Ag–ZnO photocatalyst: Synthesis, properties, and mechanism. J. Phys. Chem. C 2008, 112, 13563–13570. [Google Scholar] [CrossRef]
  21. Liang, Y.; Guo, N.; Li, L.; Li, R.; Ji, G.; Gan, S. Fabrication of porous 3D flower–like Ag/ZnO heterostructure composites with enhanced photocatalytic performance. Appl. Surf. Sci. 2015, 332, 32–39. [Google Scholar] [CrossRef]
  22. Potti, P.R.; Srivastava, V.C. Comparative studies on structural, optical, and textural properties of combustion derived ZnO prepared using various fuels and their photocatalytic activity. Ind. Eng. Chem. Res. 2012, 51, 7948–7956. [Google Scholar] [CrossRef]
  23. Rokesh, K.; Mohan, S.C.; Karuppuchamy, S.; Jothivenkatachalam, K. Photo-assisted advanced oxidation processes for Rhodamine B degradation using ZnO–Ag nanocomposite materials. J. Environ. Chem. Eng. 2018, 6, 3610–3620. [Google Scholar] [CrossRef]
  24. Zheng, Y.; Chen, C.; Zhan, Y.; Lin, X.; Zheng, Q.; Wei, K.; Zhu, J. Photocatalytic activity of Ag/ZnO heterostructure nanocatalyst: Correlation between structure and property. J. Phys. Chem. C 2008, 112, 10773–10777. [Google Scholar] [CrossRef]
  25. Ansari, S.A.; Cho, M.H. Growth of three-dimensional flower-like SnS2 on g-C3N4 sheets as an efficient visible-light photocatalyst, photoelectrode, and electrochemical supercapacitance material. Sustain. Energy Fuels 2017, 1, 510–519. [Google Scholar] [CrossRef]
  26. Sohrabnezhad, S.; Pourahmad, A.; Salavatiyan, T. CuO–MMT nanocomposite: Effective photocatalyst for the discoloration of methylene blue in the absence of H2O2. Appl. Phys. A 2016, 122, 111–117. [Google Scholar] [CrossRef]
  27. Xu, Y.; Schoonen, M.A.A. The absolute energy positions of conduction and valence bands of selected semiconducting minerals. Am. Mineral. 2000, 85, 543–556. [Google Scholar] [CrossRef]
  28. Zeng, H.; Duan, G.; Li, Y.; Yang, S.; Xu, X.; Cai, W. Blue luminescence of ZnO nanoparticles based on non–equilibrium processes: Defect origins and emission controls. Adv. Funct. Mater. 2010, 20, 561–572. [Google Scholar] [CrossRef]
  29. Rokesh, K.; Pandikumar, A.; Jothivenkatachalam, K. Zinc oxide nanopillar: Preparation, characterization and its photoelectrocatalytic activity. Mater. Focus 2014, 3, 345–349. [Google Scholar] [CrossRef]
  30. Zhang, D.H.; Wang, Q.P.; Xue, Z.Y. Photoluminescence of ZnO films excited with light of different wavelength. Appl. Surf. Sci. 2003, 207, 20–25. [Google Scholar] [CrossRef]
  31. Zhai, J.; Wang, L.; Wang, D.; Lin, Y.; He, D.; Xie, T. UV–illumination room–temperature gas sensing activity of carbon–doped ZnO microspheres. Sens. Actuators B Chem. 2012, 161, 292–297. [Google Scholar] [CrossRef]
  32. Ansari, S.A.; Khan, M.M.; Ansari, M.O.; Lee, J.; Cho, M.H. Biogenic synthesis, photocatalytic, and photoelectrochemical performance of Ag–ZnO nanocomposite. J. Phys. Chem. C 2013, 117, 27023–27030. [Google Scholar] [CrossRef]
  33. Bai, H.W.; Liu, Z.Y.; Sun, D.D. Hierarchical ZnO/Cu corn–like materials with high photodegradation and antibacterial capability under visible light. Phys. Chem. Chem. Phys. 2011, 13, 6205–6210. [Google Scholar] [CrossRef] [PubMed]
  34. Das, J.; Pradhan, S.; Sahu, D.; Mishra, D.; Sarangi, S.; Nayak, B.; Verma, S.; Roul, B. Micro–Raman and XPS studies of pure ZnO ceramics. Phys. B Condens. Matter 2010, 405, 2492–2497. [Google Scholar] [CrossRef]
  35. Khosravi–Gandomani, S.; Yousefi, R.; Jamali–Sheini, F.; Huang, N.M. Optical and electrical properties of p–type Ag–doped ZnO nanostructures. Ceram. Int. 2014, 40, 7957–7963. [Google Scholar] [CrossRef]
  36. Patil, S.S.; Mali, M.G.; Tamboli, M.S.; Patil, D.R.; Kulkarni, M.V.; Yoon, H.; Kim, H.; Al–Deyab, S.S.; Yoon, S.S.; Kolekar, S.S.; et al. Green approach for hierarchical nanostructured Ag–ZnO and their photocatalytic performance under sunlight. Catal. Today 2016, 260, 126–134. [Google Scholar] [CrossRef]
Figure 1. Schematic representation of the synthesis process of Ag/ZnO.
Jcs 03 00018 g001
Figure 2. X-ray diffraction patterns of ZnO and Ag/ZnO synthesized at different calcination temperatures.
Jcs 03 00018 g002
Figure 3. XRD patterns of Ag/ZnO synthesized at different calcination times.
Jcs 03 00018 g003
Figure 4. (a) SEM and (b) TEM images of Ag/ZnO nanocomposite.
Jcs 03 00018 g004
Figure 5. (a) Diffuse reflectance UV–visible spectra of Ag/ZnO and (b) Tauc plot of [F(R)hν]2 versus photon energy at different calcination temperatures.
Jcs 03 00018 g005
Figure 6. (a) Diffuse reflectance UV–visible spectra of Ag/ZnO and (b) Tauc plot of [F(R)hν]2 versus photon energy at different calcination times.
Jcs 03 00018 g006
Figure 7. Photoluminescence spectra for Ag/ZnO at different calcination temperatures. Excitation source: (a) 330, (b) 335, (c) 340, (d) 345 nm.
Jcs 03 00018 g007
Figure 8. Photoluminescence spectra for Ag/ZnO at different calcination times. Excitation source: (a) 330, (b) 335, (c) 340, (d) 345 nm.
Jcs 03 00018 g008
Figure 9. Changes of relative intensity with (a) different calcination temperatures and (b) different calcination times.
Jcs 03 00018 g009
Figure 10. (a) Full range X-ray photoelectron spectroscopy (XPS) spectra of ZnO; (bd) High resolution XPS spectra of Zn 2P, Ag 3d and O 1s for ZnO.
Jcs 03 00018 g010
Figure 11. (a) Full range XPS spectra of Ag/ZnO; (bd) High resolution XPS spectra of Zn 2P, Ag 3d and O 1s for ZnO.
Jcs 03 00018 g011

