Urban Land Cover Change in Ecologically Fragile Environments: The Case of the Galapagos Islands


1
Galapagos Science Center, EC200201 San Cristóbal, Galápagos, Ecuador
2
Instituto de Geografía—Universidad San Francisco de Quito, EC170150 Quito, Ecuador
3
Colegio de Ciencias Biológicas y Ambientales—Universidad San Francisco de Quito, EC170150 Quito, Ecuador
*
Author to whom correspondence should be addressed.
Land 2018, 7(1), 21; https://0-doi-org.brum.beds.ac.uk/10.3390/land7010021
Submission received: 3 November 2017
/
Revised: 13 January 2018
/
Accepted: 25 January 2018
/
Published: 1 February 2018
Abstract
:The Galapagos Islands are a unique sanctuary for wildlife and have gone through a fluctuating process of urbanization in the three main inhabited islands. Despite being colonized since the 1800s, it is during the last 25 years that a dramatic increase in population has been observed. Analyzing impervious surface change over this period in an ecologically fragile environment is a challenging task, thus two methods that have been widely employed in studying urban environments were compared in this study: sub-pixel using spectral mixture analyses (SMA) and object-based classification. The SMA linear model, applied over moderate spatial resolution imagery, does not produce accurate results for urban composition mapping showing significant spectral confusion between classes. Instead, the object-based classification using spectral indices proved to be more effective for detecting impervious surfaces over heterogeneous urban environments in inhabited islands. The accuracy assessment showed a correlation between estimated and true impervious surface abundance fraction higher than first expected (R2 = 67.7%) for the object-based classification, considering the limitations of pixel size (Landsat imagery) in small heterogeneous urban landscapes. Hence, this methodology was applied to all three urban centers for further analysis. Through this assessment, the average annual growth rate in urban areas was calculated as 3.3% from 1992 to 2017. The foreseen applications and local implications for land planning and management are especially important for the Galapagos Islands. There is a need for planning systems and processes that involve all stakeholders, in order to support pre-existing conservation initiatives and sustainable development policies.
1. Introduction
Urbanization is commonly considered a positive process linked to economic and social development, where rural areas are transformed into urban centers [1]. However, landscape transformation greatly impacts biodiversity, water cycles, local and regional climate, and a range of ecosystem services. This is particularly important in urban areas that are close to, or within, protected areas, and that are growing in area and population, such as in the Galapagos Islands where urban settlements emerged before the establishment of the Galapagos National Park [2].
Urban growth is usually accompanied by the increase of impervious surface [3], which is defined as a type of surface material that does not allow water infiltration directly into the soil and it is primarily associated with asphalt and concrete infrastructures in urban areas, including streets, parking lots, housing and rooftops [4,5]. The amount of impervious surface in a landscape is an important indicator of its environmental quality [6].
Oceanic islands, like many other regions of the world, are in the process of rapid urbanization, which increases biophysical and social vulnerabilities that contribute simultaneously to ecosystem degradation and decreasing living standards for human populations. These vulnerabilities are associated with fragile island ecosystems, limited land resources, shortage of basic supplies, global warming risks, weak economies, land tenure conflicts, and institutional limitations [7]. Reliable and robust information is key to supporting land management decision-making, ecosystem monitoring, and urban planning [8].
In this paper, we generate detailed information about the urbanization process by using remote sensing to estimate the growth of impervious surfaces in the Galapagos Islands. Remote sensing technologies have been one of the primary methods for providing detailed land use and land cover information. High-resolution remotely sensed data have been widely used to map urban impervious surfaces due to the rich spatial details they provide [4,9,10]. However, high-resolution imagery has some disadvantages compared to medium resolution imagery such as their low spectral and temporal resolution, high cost of acquisition, and the abundance of shadows in urban scenes, which changes the spectral information in shade areas [3,4,11]. Now, the latest generation of satellite sensors is emerging with enhanced spectral and spatial properties such as the Landsat 8 sensor, Operational Land Imager (OLI), which has proved to be especially valuable for urban mapping [12,13,14,15,16,17,18,19].
Traditionally, urban classification has been conducted using sub-pixel approaches [4,12,18,20], which have demonstrated high accuracy in heterogeneous urban landscapes compared with per-pixel classification [21]. Nevertheless, in order to suppress salt-and-pepper noises and within-class spectral variability, researchers have established a new paradigm by assessing a geo-object for classification in its entirety, a process known as object-based impervious surface mapping [15,22,23].
The sub-pixel and object-based approaches are defined as “soft” classifiers, where the sub-pixel methods quantify the mixture of surfaces within a pixel and the object-based methods classify a group of pixels based on spectral similarity and spatial proximity using a fuzzy-logic approach [24]. Researchers have evaluated the performance to detect impervious surfaces between per-pixel and sub-pixel classifications or between per-pixel and object-based classification [17,21]. However, there is no significant research about the performance comparison between sub-pixel and object-based classifiers applied in urban areas, and even less in urban landscapes of inhabitant islands.
Thus, the aims of this study are to: (1) compare the performance of sub-pixel vs. object-based classification methods to estimate impervious surface on inhabited volcanic islands using Landsat imagery; (2) quantify the current urban impervious surface in the main Galapagos urban centers and; (3) identify changes in impervious surface cover over a period of 25 years.
2. Materials and Methods
2.1. Study Area and Datasets
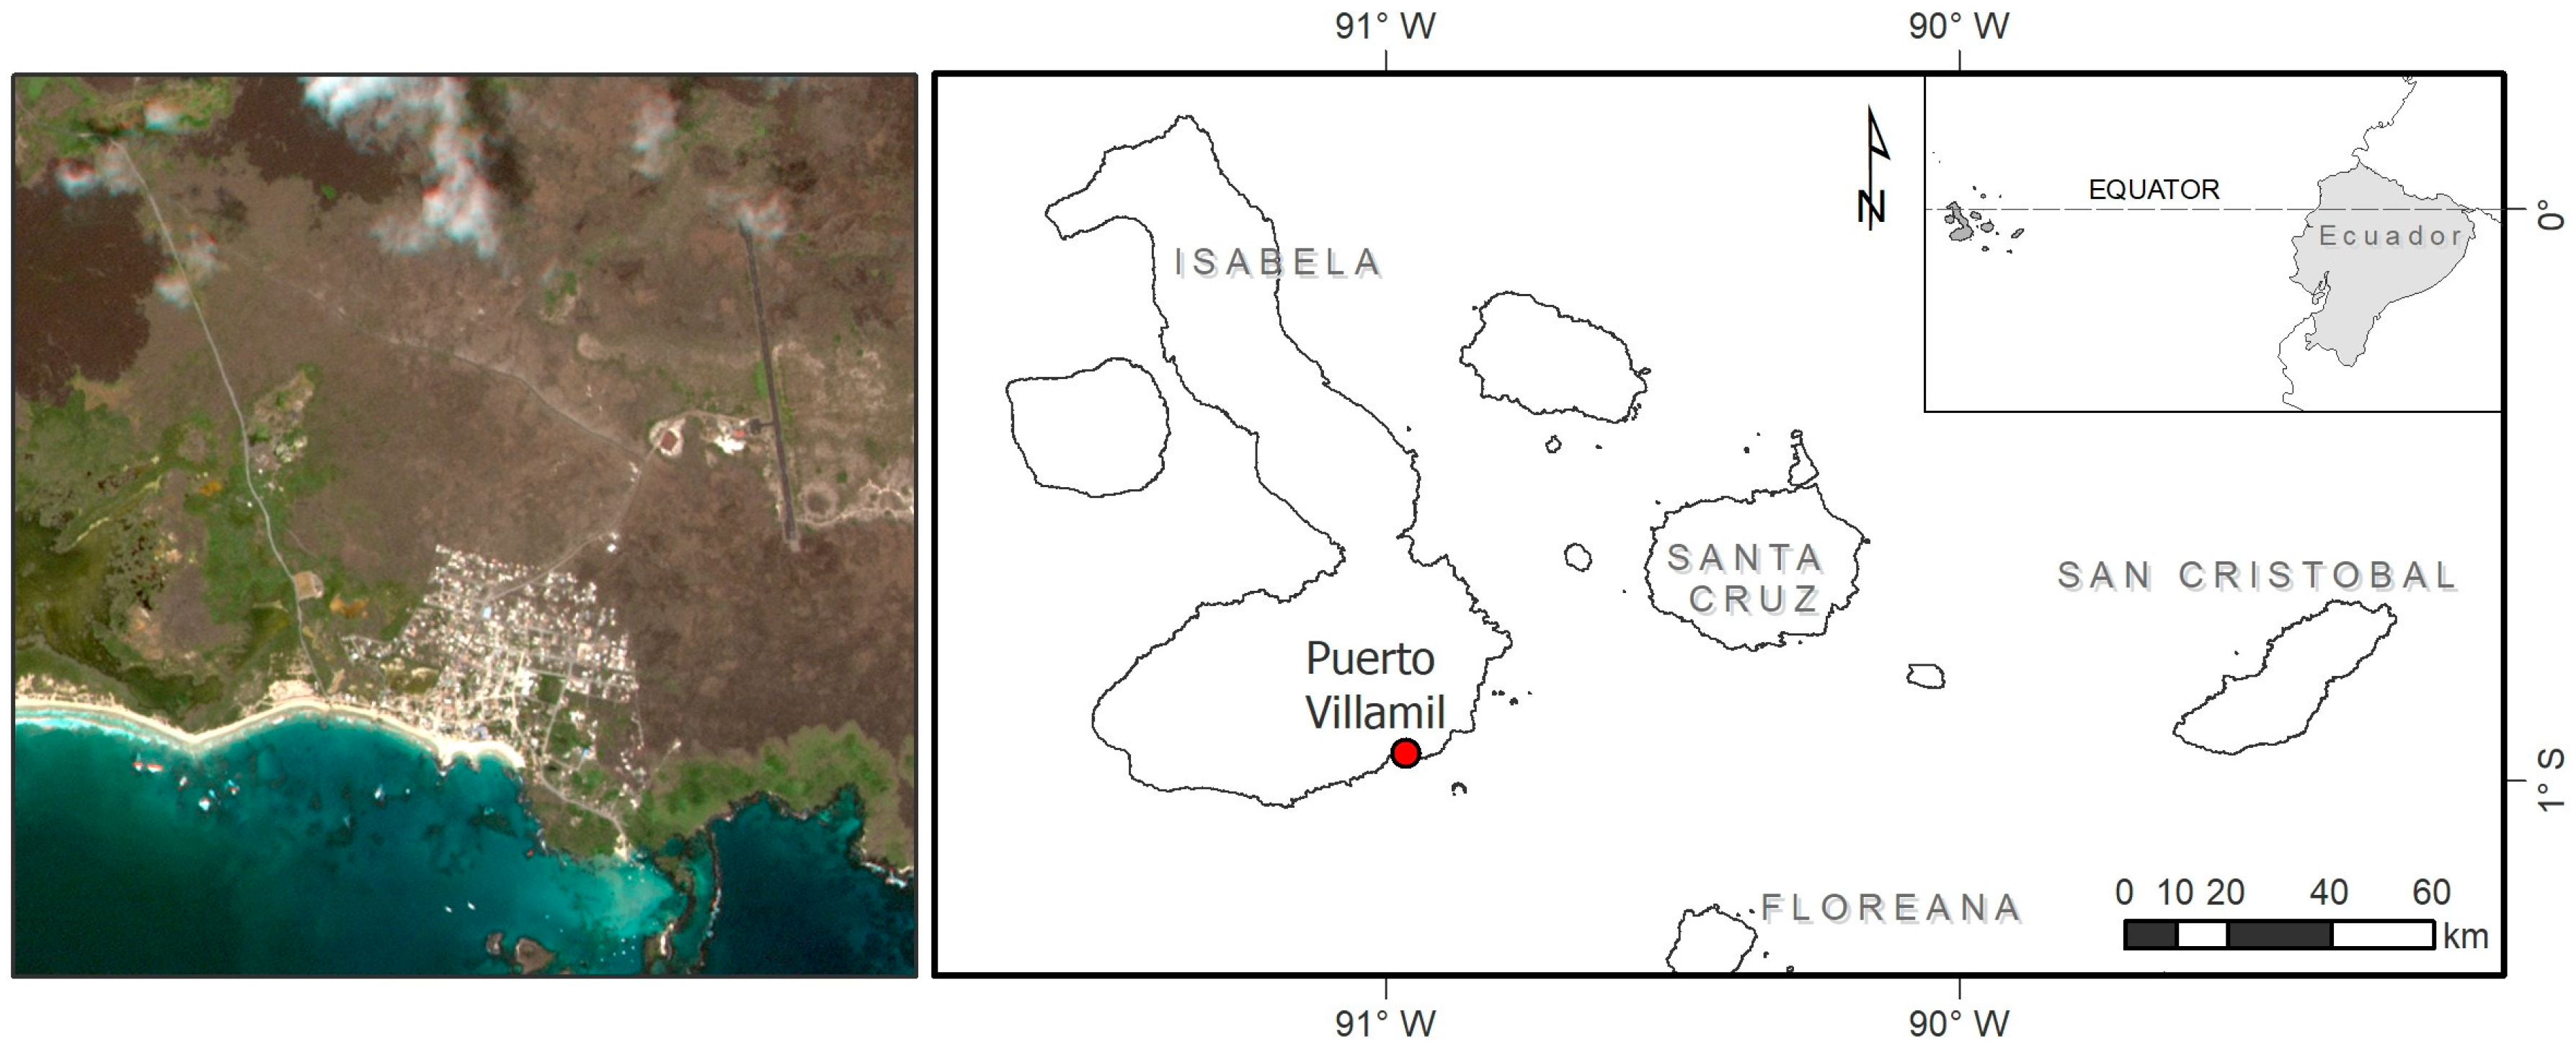
Puerto Villamil, together with Puerto Ayora and Puerto Baquerizo Moreno constitute the main urban centers of the Galapagos archipelago. Puerto Villamil is the focus of this study, since it is a small port village located in the southeast edge of Isabela Island and shows a high urban growth (Figure 1). The urban community of Puerto Villamil accounted for 2164 inhabitants in 2015 [25], which represents 92.3% of the total inhabitants in Isabela.
Puerto Villamil has experienced rapid urbanization in the past 25 years, going from 696 inhabitants in 1990 to 2164 in 2015; a mean annual growth rate of 8.4% [25,26]. This growth brings drastic transformations to the landscape, which is interspersed by dry and humid vegetation, sand, rocky outcrop of different ages and the unique biodiversity endemic to the Galapagos Islands.
The first settlers of the islands are recorded in the early 1800’s, when Galapagos was only considered a port of call or refuge for pirates and whalers. These early attempts were then followed by the official mandate of Juan Jose Flores, the first president of the newly formed Republic of Ecuador. In 1832 he appointed Jose Villamil as the Governor of the Galapagos territory and sent him in a mission to establish a colony and claim the archipelago as Ecuadorian territory that was directly west off the coast of Ecuador mainland [27].
The barren environment and harsh conditions did not make it easy to sustain a colony, particularly where no fresh water sources were available. The early colonies in the islands that have been recorded were settled close to a fresh water source and were originally dependent on agriculture more than on fisheries. The colonization of Isabela started in 1893, when the first settler, Antonio Gil, established two colonies: Puerto Villamil in the southeastern coast and Santo Tomas de Berlanga in the highlands. Throughout the process of colonization, the island’s population went up and down and permanent residency only began when scientists and tourists began travelling regularly to the area. The first national census of Ecuador in 1950 shows 309 inhabitants in Isabela [2]. Puerto Villamil is the smallest urban center, since Puerto Velasco Ibarra, in Floreana (pop. 100 in 2015), is not considered an urban settlement for the purpose of this study.
The study specifically focused on detecting the impervious surface based on spatial remotely sense data freely available (i.e., Landsat imagery) by monitoring land use change patterns and urban growth over time.
Landsat 8/OLI images at Level 1TP (30 m resolution) and high-resolution images (readily available from Google Earth) were used to compare the performance of sub-pixel and object-based classification methods in impervious surface detection. Scenes from the warm-wet season—typically running from December to June [28]—were used in this study, as in this time of the year images are less affected by cloud cover. Landsat 8 scene (Path 18, Row 61) acquired on 15 January 2017 was selected, being cloud-free and closest to the acquisition date of the high-resolution reference image accessed online from Google Earth (CNES/Airbus: 23 January 2017). Furthermore, the reference image was used to identify pure pixels on the Landsat 8/OLI for SMA model.
In order to address the other objectives, a set of Landsat scenes were studied to quantify the change in urban impervious surface in Galapagos. Table 1 describes each Landsat scene used in this study.
Pre-processing procedures were performed in order to transform raw sensor data (i.e., satellite-generated images) into an appropriate format for spectral analysis. These procedures included conversion from digital number (ND) to surface reflectance applying a radiometric calibration and an atmospheric correction using the FLAASH algorithm, in ENVI software. Since the spectra of water and waves on land are similar to low-albedo and high-albedo impervious surfaces, respectively, water bodies were masked out the image based on visual interpretation via regions of interests (ROIs) [13,29,30]. Change detection analysis required a spatial co-registration between the Landsat imagery, where the 2017 scenes were selected as reference to register the scenes with 1GS processing level.
2.2. Methodology
The methods were divided into four main steps as described in detail in the following subsections: (a) mapping fractional images of impervious surfaces, vegetation, sand, and bare soil endmembers in the study area based on a sub-pixel classification using Spectral Mixture Analysis for 2017; (b) distribution mapping of impervious surface, vegetation, sand and bare soil cover classes in the study area based on an object-based classification using a set of fuzzy expressions defined by membership functions [31,32], for 2017; (c) performance analysis of the two above-mentioned approaches via accuracy assessment and identification of the most appropriate method to estimate urban impervious surface in inhabited volcanic islands. Finally; (d) urban impervious surface coverage was estimated for all urban centers in Galapagos by applying the selected method to the Landsat scenes from circa 1992 to 2017. The resulting impervious surface maps constitute the input parameters for change detection analysis, which identifies structural change in the urban landscape within the respective period.
2.2.1. The Spectral Mixture Analysis (SMA)
SMA provides a mathematical framework that simultaneously addresses the problems of mixed pixels, image calibration and variations in illumination geometry. It displays the results in terms of proportions of pure land cover types, called endmembers [33]. One basic assumption of SMA models is that the spectrum for each pixel is a linear or nonlinear combination of endmember spectra according to the complexity of scattering of light on land cover types [34]. For this study, a linear SMA model was used due to its proven effectiveness in urban applications [18,33]. All linear SMA procedures were undertaken in the ENVI environment.
The key for successfully extracting fractional cover on the SMA model is an appropriate endmember selection [19,35,36,37] and an appropriate conceptual model to parameterize urban biophysical composition [38]. Thus, four endmembers (vegetation, impervious surface, sand and soil) were identified in the study area based on the Vegetation-Impervious Surface-Soil (V-I-S) model proposed by Ridd [38] and on the Galapagos urban landscape. In this study, endmembers were derived from the imagery, since reference endmembers measured in laboratory or in-field were not available. ROIs of pure pixels were identified for each cover type within the high-resolution reference image. Taking into consideration the large difference between the spatial resolution of the two types of dataset, the minimal area of each ROI was 30 × 30 m.
The linear SMA begins with the forward Minimum Noise Fraction (MNF) transformation applied to the seven bands of the reflectance image, which reduces spectral dimensions by separating data from noise and reduces the computational requirements for subsequent processing [39]. Examining the final eigenvalues, the MNF dimensionality was reduced to five bands, separating the noise from the data. The next step is the application of the Pixel Purity Index (PPI) analysis to the MNF output in order to reduce spatial dimensions and determine spectrally pure pixels for endmember selection [40]. In the three-dimensional scatterplot of the first three MNF bands, the ROIs were plotted and identified. Image endmember classes were clustered by choosing pure pixels within these ROIs, and then plotted again to verify their spectral signature (Figure 2). The spectra location of each cover type was clearly identified in the point cloud.
Knowing the spectral reflectance of each endmember, the observed pixel value in any spectral band is modelled by linear combination of the spectral responses of endmember materials found within the pixel [41] with a sum-to-one abundance constraint. This together generates the fraction images for vegetation, impervious surface, soil and sand.
2.2.2. The Object-Based Classification Using Spectral Indices
Calculating Anthropogenic Impervious Surface Index
The spectral indices have an apparent advantage due to their implementation and convenience in practical applications [29], which are considered key features to extract and map built-up areas.
Kant and Kumar [13] developed the Normalized Difference Anthropogenic Impervious Surface Index (NDAISI) using the existing Biophysical Composition Index (BCI) [29], and creating a new bare soil index named Modified Normalized Difference Soil Index (MNDSI). Based on their findings, the MNDSI was computed from the Short-Wave Infrared (SWIR2) and Panchromatic (PAN) bands from the Landsat sensors. However, urban landscape in Galapagos presents different physical characteristics than the Kant and Kumar study [13]; therefore, a new soil index named Modified Normalized Difference Soil Index for Islands (MNDSII) is proposed in this study in order to calculate the NDAISI index.
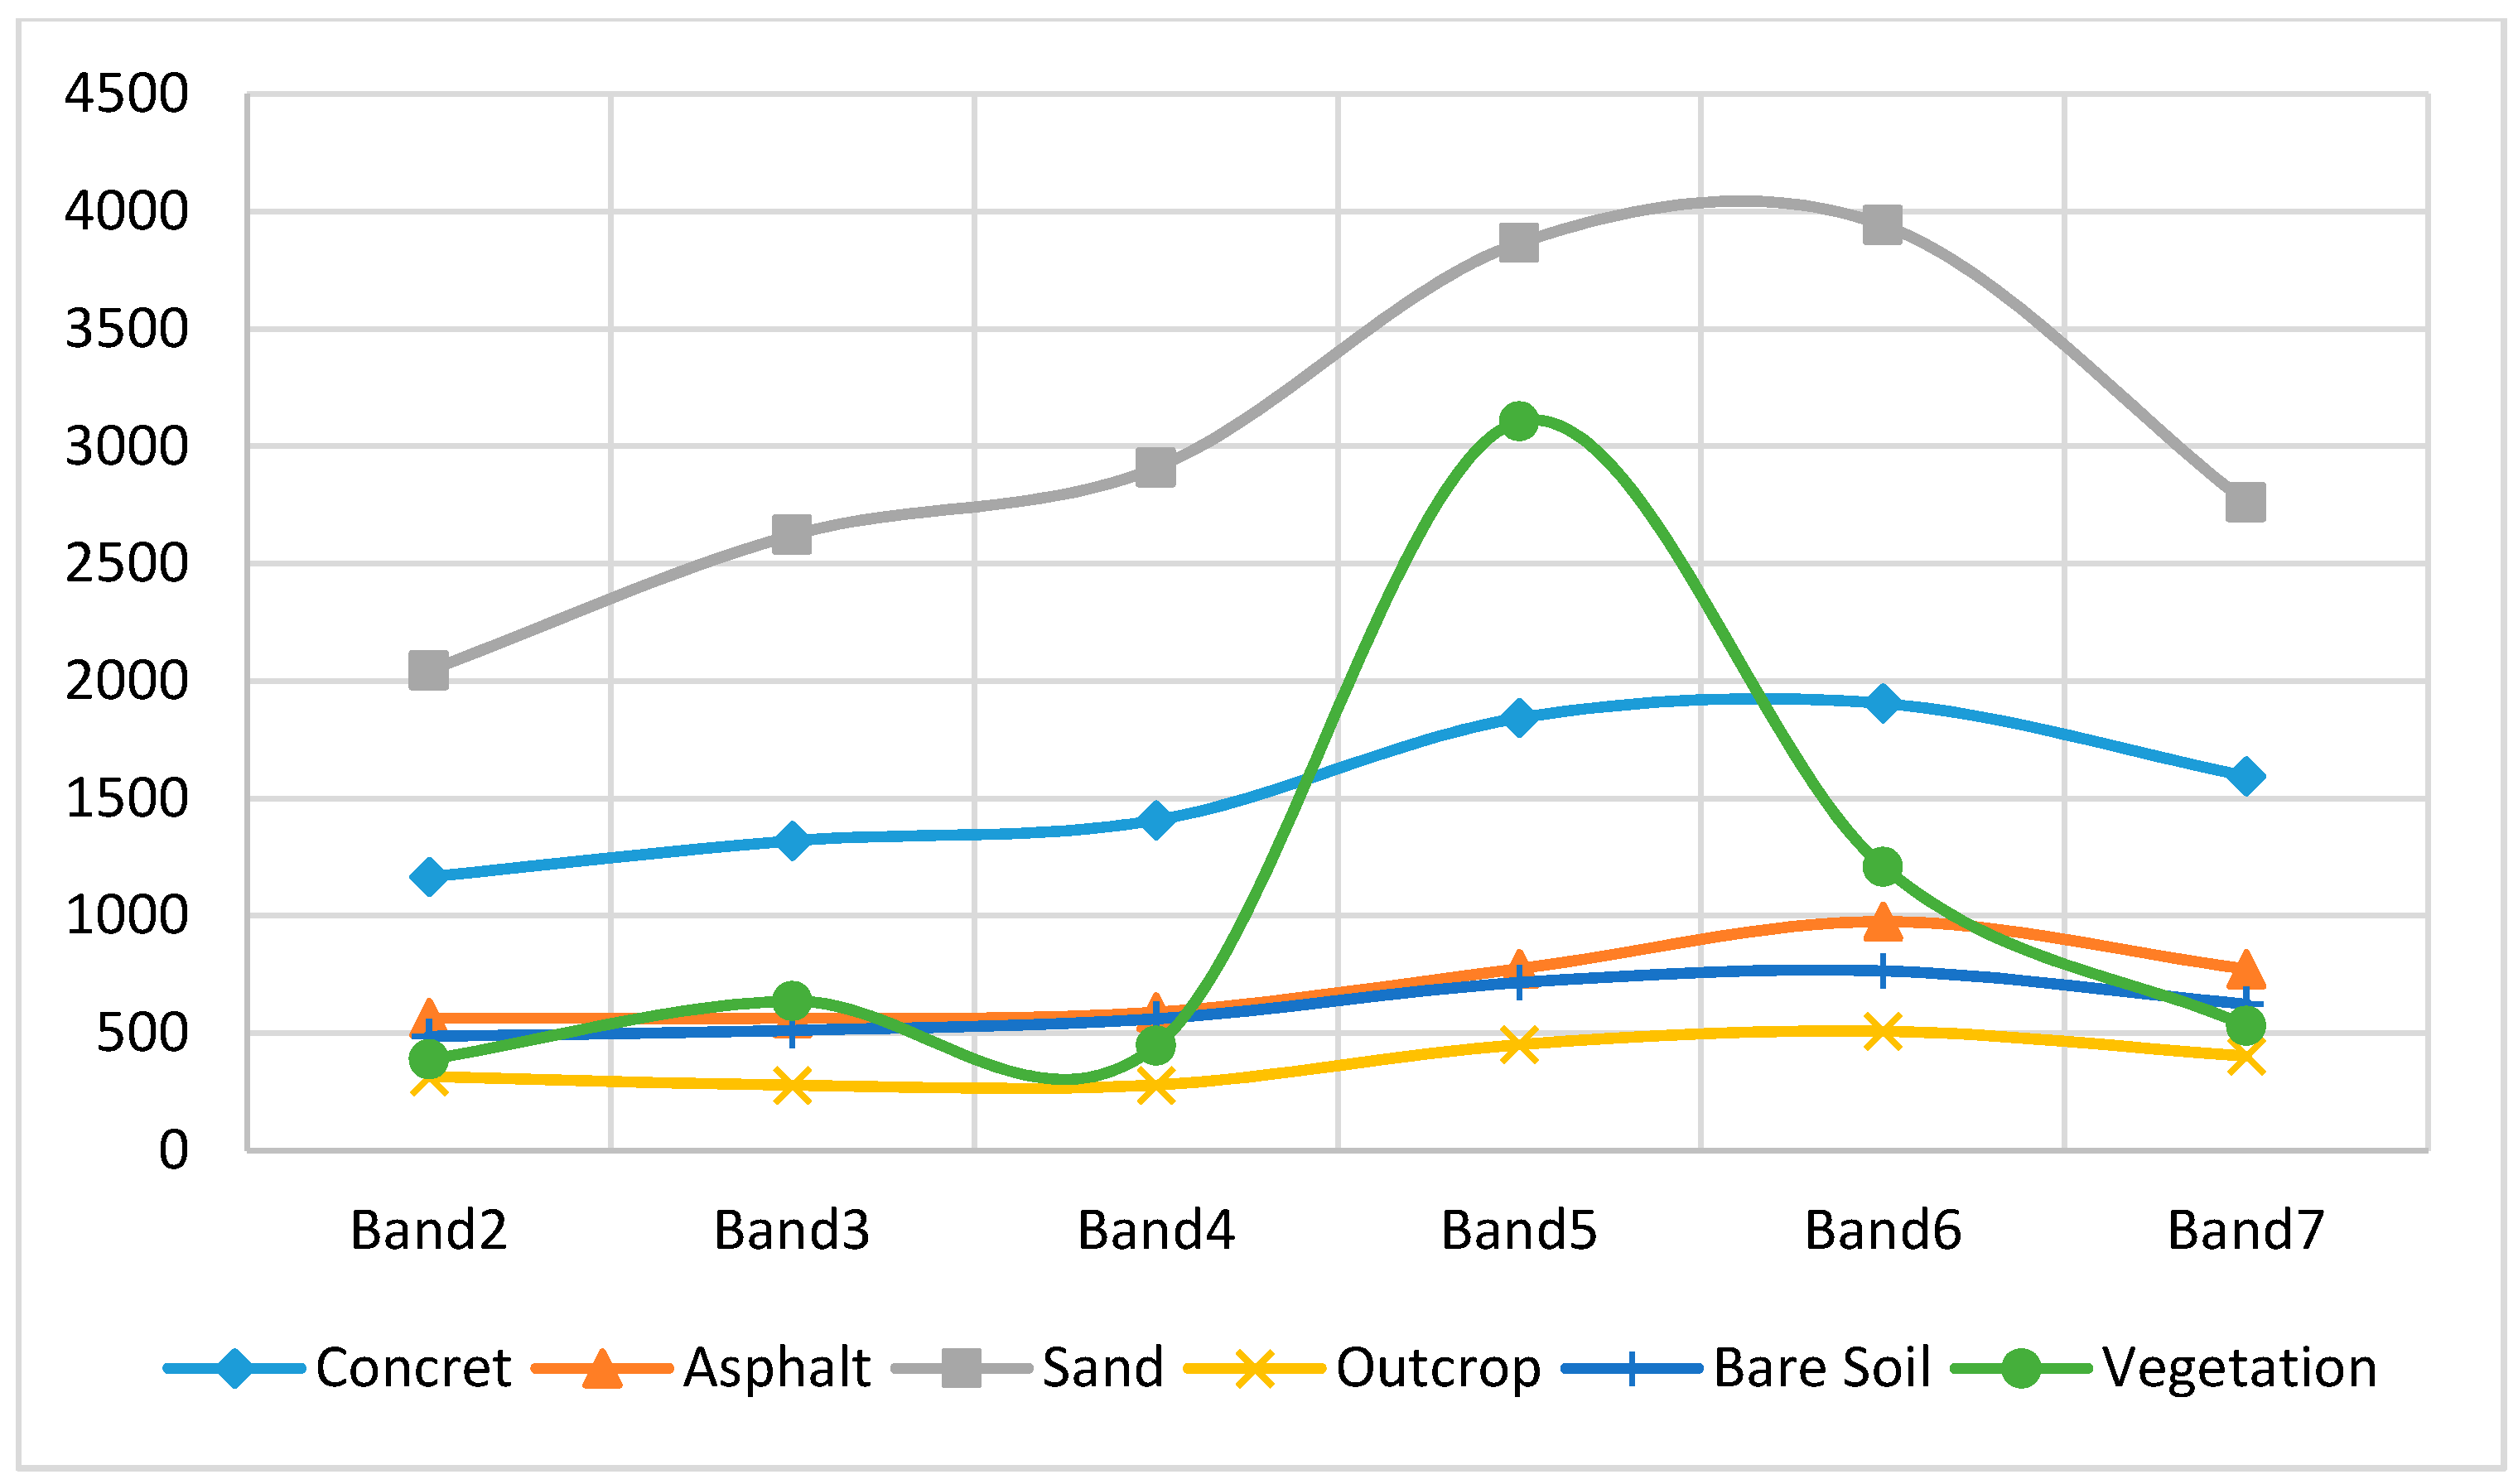
Using a similar approach as Kant and Kumar [13], signatures of different land covers found in the study area (impervious surface: concrete and asphalt; sand; soil: bare soil and rocky outcrop and; vegetation) were collected. Then, a study on the behavior of reflectance values was carried out for Bands 2–7 to parameterize the computation of MNDSII and highlight soil (bare soil and outcrop covers) and sand. In Figure 3, bands 5, 6 and 7 show higher mean values for soil and sand than bands 2, 3 and 4. The PAN band was not considered because our aim is to find a methodology applicable in a multi-temporal study using the Landsat archive.
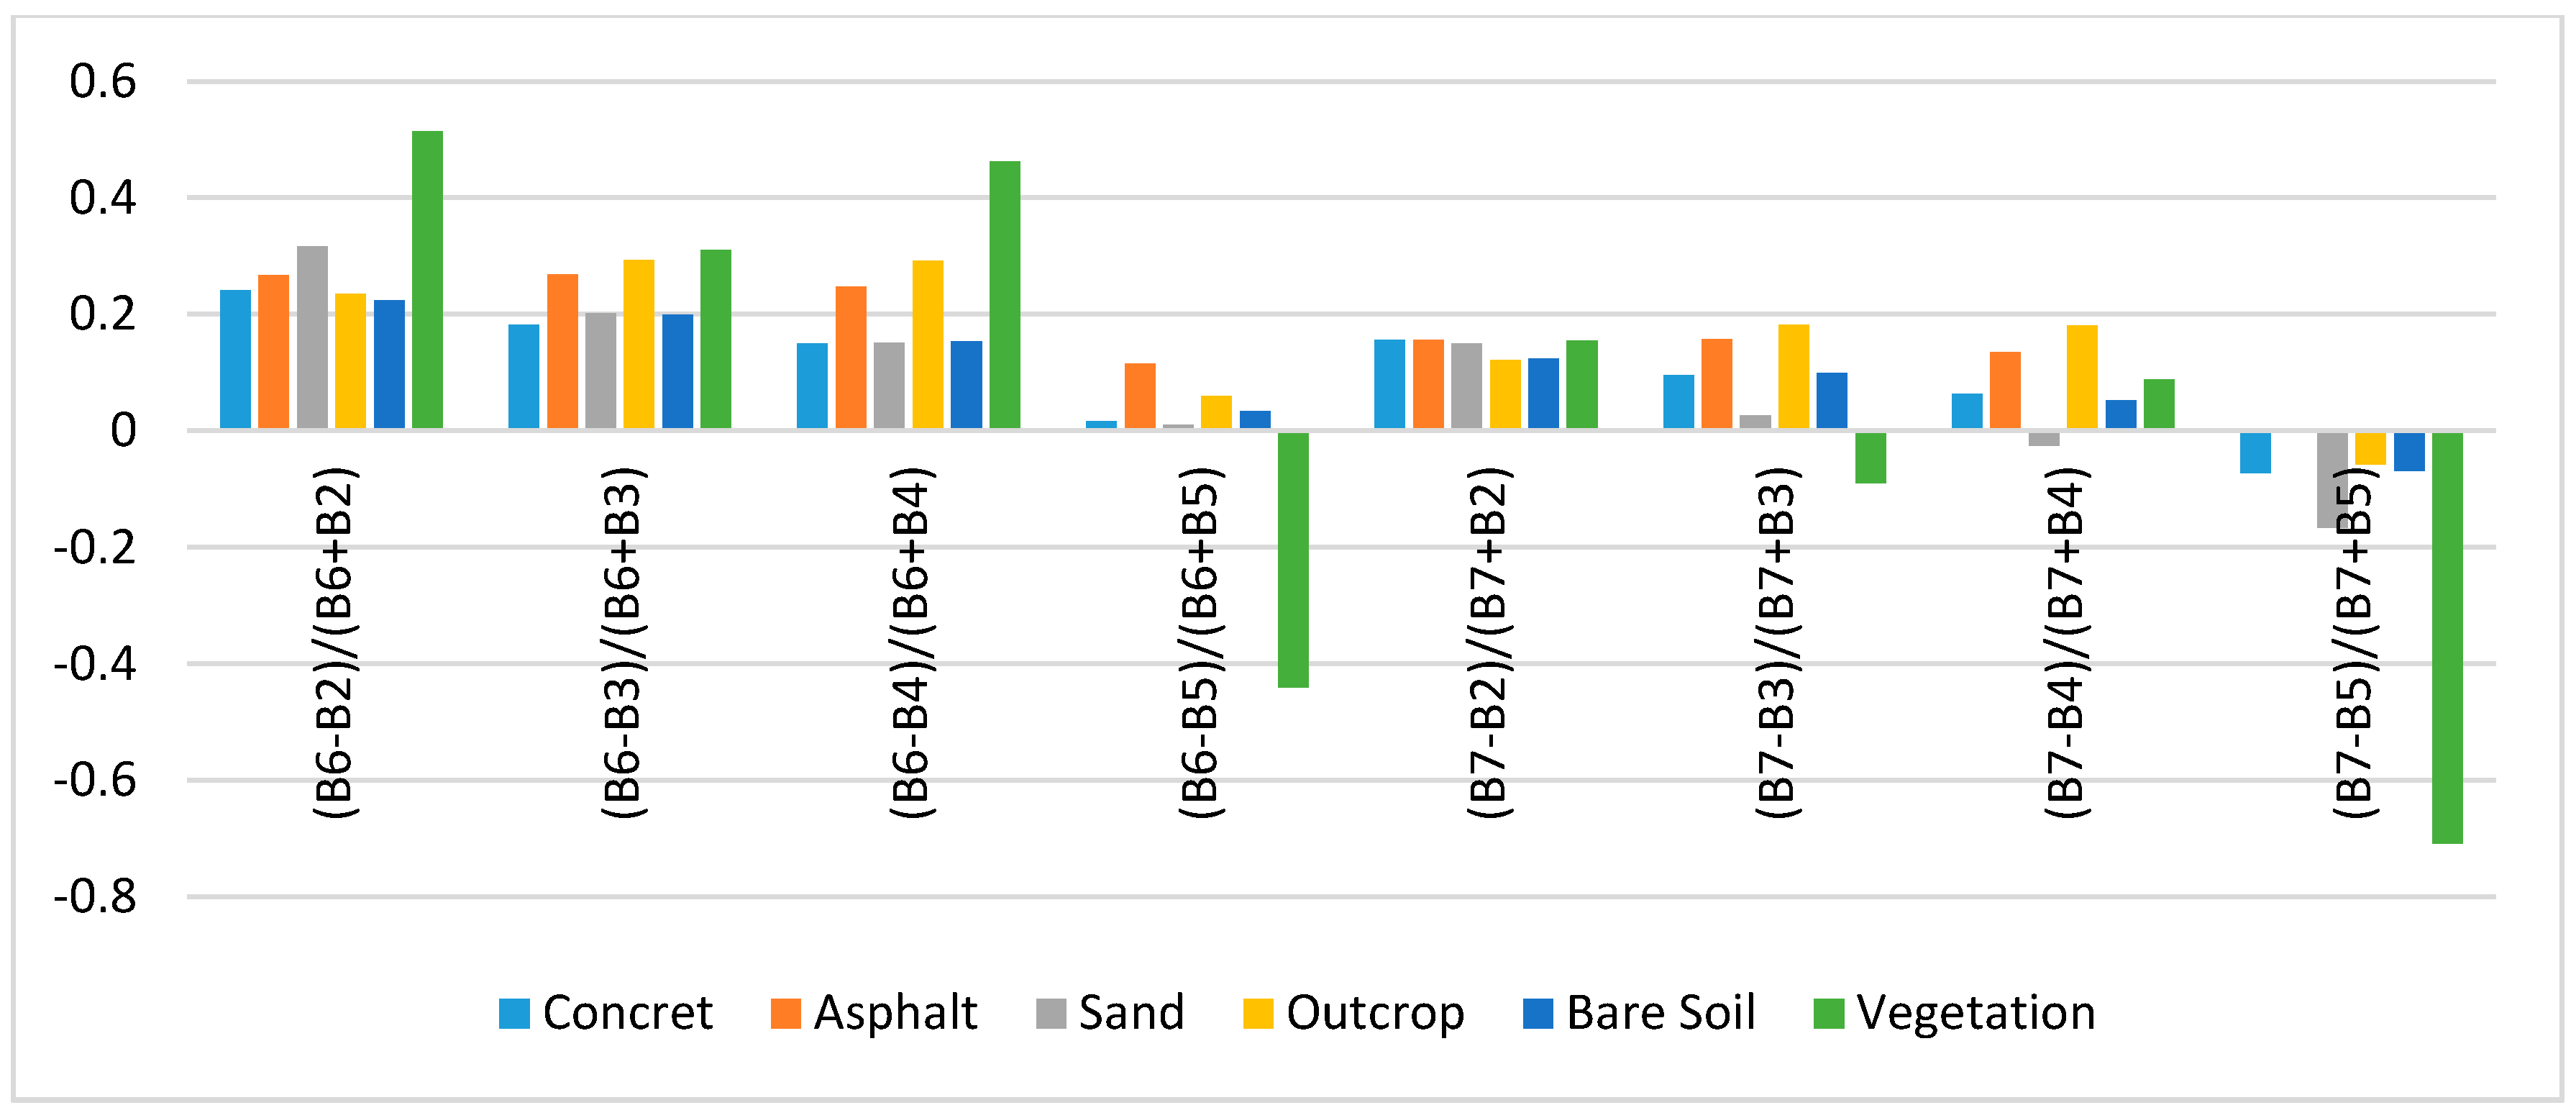
Based on the signature behavior of each land cover, an exercise on the basis of a Spectral Discrimination Index (SDI > 1 high separability; SDI < 1 low separability) [13] was carried out to identify a suitable band combination that would highlight soil and sand from impervious surfaces (Figure 4). Visually, the normalized difference transformation between band 5 (NIR) and band 6 (SWIR1) and, band 4 (Red) and band 7 (SWIR2) shows a good separability among the materials. However, applying the SDI analysis, the first combination shows a lower separability between high-albedo impervious surfaces, and sand and bare soil.
On the other hand, the combination of bands 4 and 7 separates soil from low-albedo impervious surface (i.e., asphalt), and it also separates sand from high-albedo impervious surface (i.e., concrete) more effectively than the first combination. Here, asphalt has significantly higher values when compared to bare soil and lower values when compared to rocky outcrop. Similarly, concrete is significantly different than sand due to its opposite values (concrete shows positive values while sand shows negative values).
Based on the above discussion, the MNDSII was computed and subsequently used for calculating the anthropogenic impervious surface index: NDAISI.
Extraction of Impervious Surface through an Object-Based Classification
Recent years have seen significant developments in classification methodologies, specifically with regard to the object-based classification approach in which land cover classes are allocated to objects representing real-world features instead of somewhat arbitrary pixel structures [11]. The object-based classification performs a spatial and spectral analysis, which integrates relevant properties such as shape, texture, spectral and contextual information from analyzed entities in the surface.
Object-based classification was performed on the reflectance image using the eCognition software. This procedure involves two main steps: segmentation and classification. Segmentation was conducted first: single-pixel objects were grouped with their neighbors to form a significant object that is defined by three main parameters (scale and homogeneity criterion parameters). This study used a multiresolution segmentation, which is an optimization procedure that minimizes the average heterogeneity and maximizes the respective homogeneity of the objects [42]. The parameters used in the classification were: scale = 10, shape = 0.1 and compactness = 0.5. These parameters were selected using a trial and error empirical analysis, selecting the most suitable parameters to discriminate impervious surfaces from soil areas.
Following segmentation, a classification process was conducted on the segmented objects. Each object was classified on the basis of the spectral information of its pixels and the contextual information of the neighbor objects. A set of fuzzy membership functions (fuzzy rule) was used to identify and describe the object-classes, which consists of a combination of several conditions that have to be fulfilled for an object to be assigned to a class [43].
The fuzzy membership function is based on the values of specific features. In this case, anthropogenic impervious surfaces and vegetation indices were used as potential futures to built-up the fuzzy rule-set. The anthropogenic impervious surface indices selected for this study were the Biophysical Composition Index (BCI) that is derived from Tasseled Cap (TC) components and was proposed by Deng and Wu [29]; and the Normalized Difference Anthropogenic Impervious Surface Index (NDAISI) proposed by Kant and Kumar [13] and calculating in the previous section for the study area. The Normalized Difference Vegetation Index (NDVI) proposed by Rouse et al. [44], and the Normalized Green-Red Difference Vegetation Index (NGRDI) proposed by Tucker [45] were also used. The equations that describe the spectral indices are shown in Table 2.
Threshold values were obtained based on the evaluation of true samples collected in the high-resolution image, where a suitable value was found through testing of values using a trial and error principle. Following the rule-set in a decision tree (Figure 5), object-based classification was performed for the four land cover classes initially identified to ensure a fair comparison between sub-pixel and object-based classification.
2.2.3. Accuracy Assessment
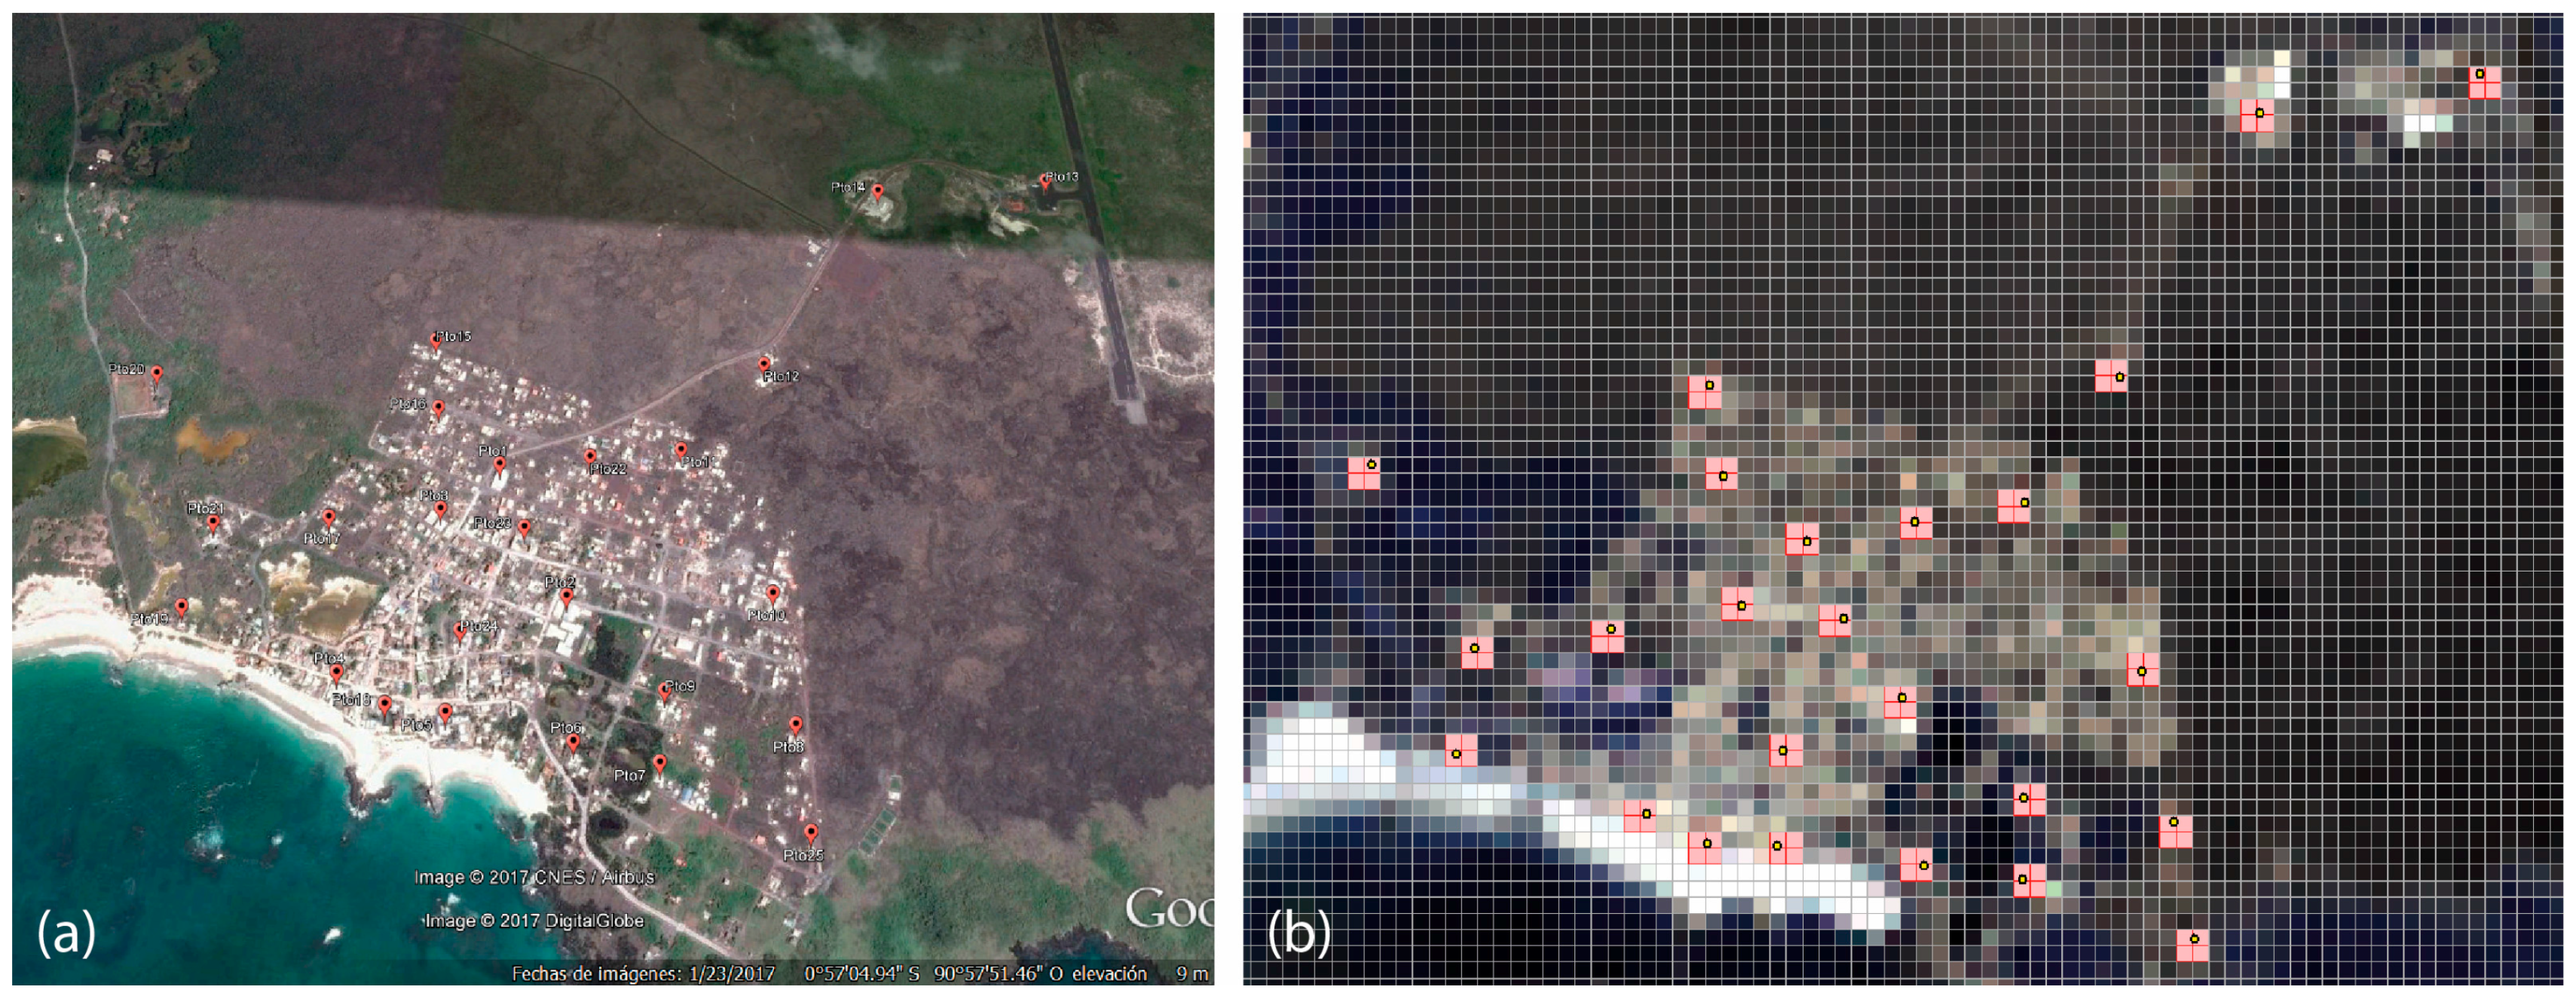
An accuracy assessment was performed on the basis of abundance of each cover land within sample areas, comparing the fractional abundance estimate with the reference fractional abundance extracted from the high-spatial resolution (high-res) image. First, a process of visual interpretation and digitalization of high-res image was conducted to generate a thematic map using Google Earth Pro tools and GIS software. This thematic map shows the true area of the four land cover types. A set of 100 random points (25 for each class, Figure 6a) were selected to perform the accuracy assessment. Each point matched within a window of 2 by 2 pixels sampling-unit of the Landsat scene (Figure 6b) in order to reduce estimation errors due to geometric co-registration and different spatial resolution between the Landsat and high-res imagery. The land cover reference fractional abundance within the sampling-unit (60 by 60 m) was calculated by dividing the true data area of each cover land by the total sample area.
To quantify the fractional abundance of each land cover type within the sampling-unit by SMA methodology, the percentage fraction was calculated as the mean value of the four pixels that conform the sample. This procedure was computed in each fraction (abundance) image of all endmembers.
In the case of object-based classification, it was assumed that the class fractional abundance of each pixel in the classified map is equal to 100%, in order to quantify the resulting proportion of each land cover within the sampling-unit.
Using the reference and estimated fractional abundance for land cover classes, three widely-used error measurements and one correlation coefficient [3,12,14,15], were adopted to evaluate the performance of SMA and object-based classification for mapping urban impervious surface abundance and distribution. These four accuracy metrics: root mean square error (RMSE), mean absolute error (MAE), systematic error (SE), and correlation coefficient R2, were calculated using Equations (1)–(4) as follows.
where is the estimated land cover fraction for sample , is the true land cover fraction for sample , is the mean land cover fraction of the samples, and is the total number of samples. In an ideal scenario, the error measurements would equal zero, and the R-squared value would approach one.
3. Results
3.1. Methods Analysis
3.1.1. Spectral Mixture Analysis
As a result of the linear SMA model, fraction layers for each endmember were generated (Figure 7). Bright areas represent higher abundance, while dark areas represent lower abundance of the land cover type. Blank areas represent water bodies that were masked out. These fraction layers demonstrate visually that the distribution of vegetation, soil, sand, and impervious surface correlates with their actual spatial distribution in the image (Figure 7a). However, several patches of soil in the northeast region were misinterpreted as sand (Figure 7b), being a primary error source.
The fraction of impervious surface is between 80–100% in urban areas, 20–40% in main roads, and near zero in the runway of Puerto Villamil Airport (Figure 7d). Figure 7b shows high abundance values (80–100%) for soil fractions in low-albedo impervious surface (i.e., airport runway), while Figure 7d illustrates that impervious surfaces have moderate abundance values (60–80%) in beach areas. It suggests that misperception of low-albedo and high-albedo impervious surface with soil and sand, respectively, is still a major concern in the urban areas of islands using moderate resolution imagery.
Fraction vegetation areas (Figure 7e) show high abundance values (80–100%) in areas covered by humid vegetation (e.g., mangroves), which keeps its greenness irrespective of the season, while areas of dry vegetation show fractions near zero. It can be inferred that the linear-SMA-model image will show a significant underestimation of vegetation in islands with those ecosystems.
These results demonstrate that this method, despite its potential to monitor impervious surfaces in urban areas [46], is still insufficient to discriminate between specific materials (e.g., concrete and asphalt) in inhabitant urban areas due to spectral confusion when it is applied to multispectral and moderate resolution imagery. Identifying endmembers for all classes in this type of imagery is a limitation in relatively small urban landscapes with high heterogeneity, where classification accuracy can be degraded by the potential presence of unidentified classes [24].
3.1.2. Object-Based Classification
Using the object-based ruleset classification system, the land cover map of the urban landscape in Puerto Villamil was produced (Figure 8d). The use of spectral indices, on top of spectral information of each band, improves the impervious surface detection and discrimination from land cover types that show similar spectral behavior such as soil and sand.
The NDAISI index shows great improvement in spectral discrimination of high-albedo impervious surface and soil when compared to BCI. High NDAISI values represent impervious surfaces, while low values represent areas covered by soil. Additionally, this index helps to separate low-albedo impervious surfaces from rocky outcrop areas. Rocky outcrop surfaces are common in islands of volcanic origin and their spectral responses are very similar to impervious surface materials like asphalt. Nevertheless, NDAISI was not useful for separating humid rocky outcrop areas from the low-albedo impervious surface. Thus, NDVI and BCI indices were important to isolate these classes. Within rocky outcrop surfaces, spread vegetation is commonly found, thus areas with low NDVI and high BCI values were classified as impervious surfaces.
While NDAISI played an important role in distinguishing between high-albedo impervious surface and soil, it was not useful to actually separate high-albedo impervious surface from sand cover. Urban areas in coastal regions are surrounded by sand as part of the landscape. Sand cover showed very high NDAISI values compared with impervious surface materials like concrete. However, our result map shows sand areas that were classified as impervious surface in the southwest region, showing that some misclassification still remains between sand and bright impervious surfaces when this approach is used.
In view of that, the selection of an appropriate threshold value, mainly between classes with similar spectral behavior, is the principal limitation for this methodology because the range of values depend on the study regions, image acquisition time and different geometric and atmospheric conditions. In addition, in small spatial distances (<30 m) within heterogeneous landscapes, surfaces rapidly change from impervious surfaces to soil or to sand; therefore in the bordering areas spatial resolution is a limitation for this methodology.
3.1.3. Accuracy Assessment
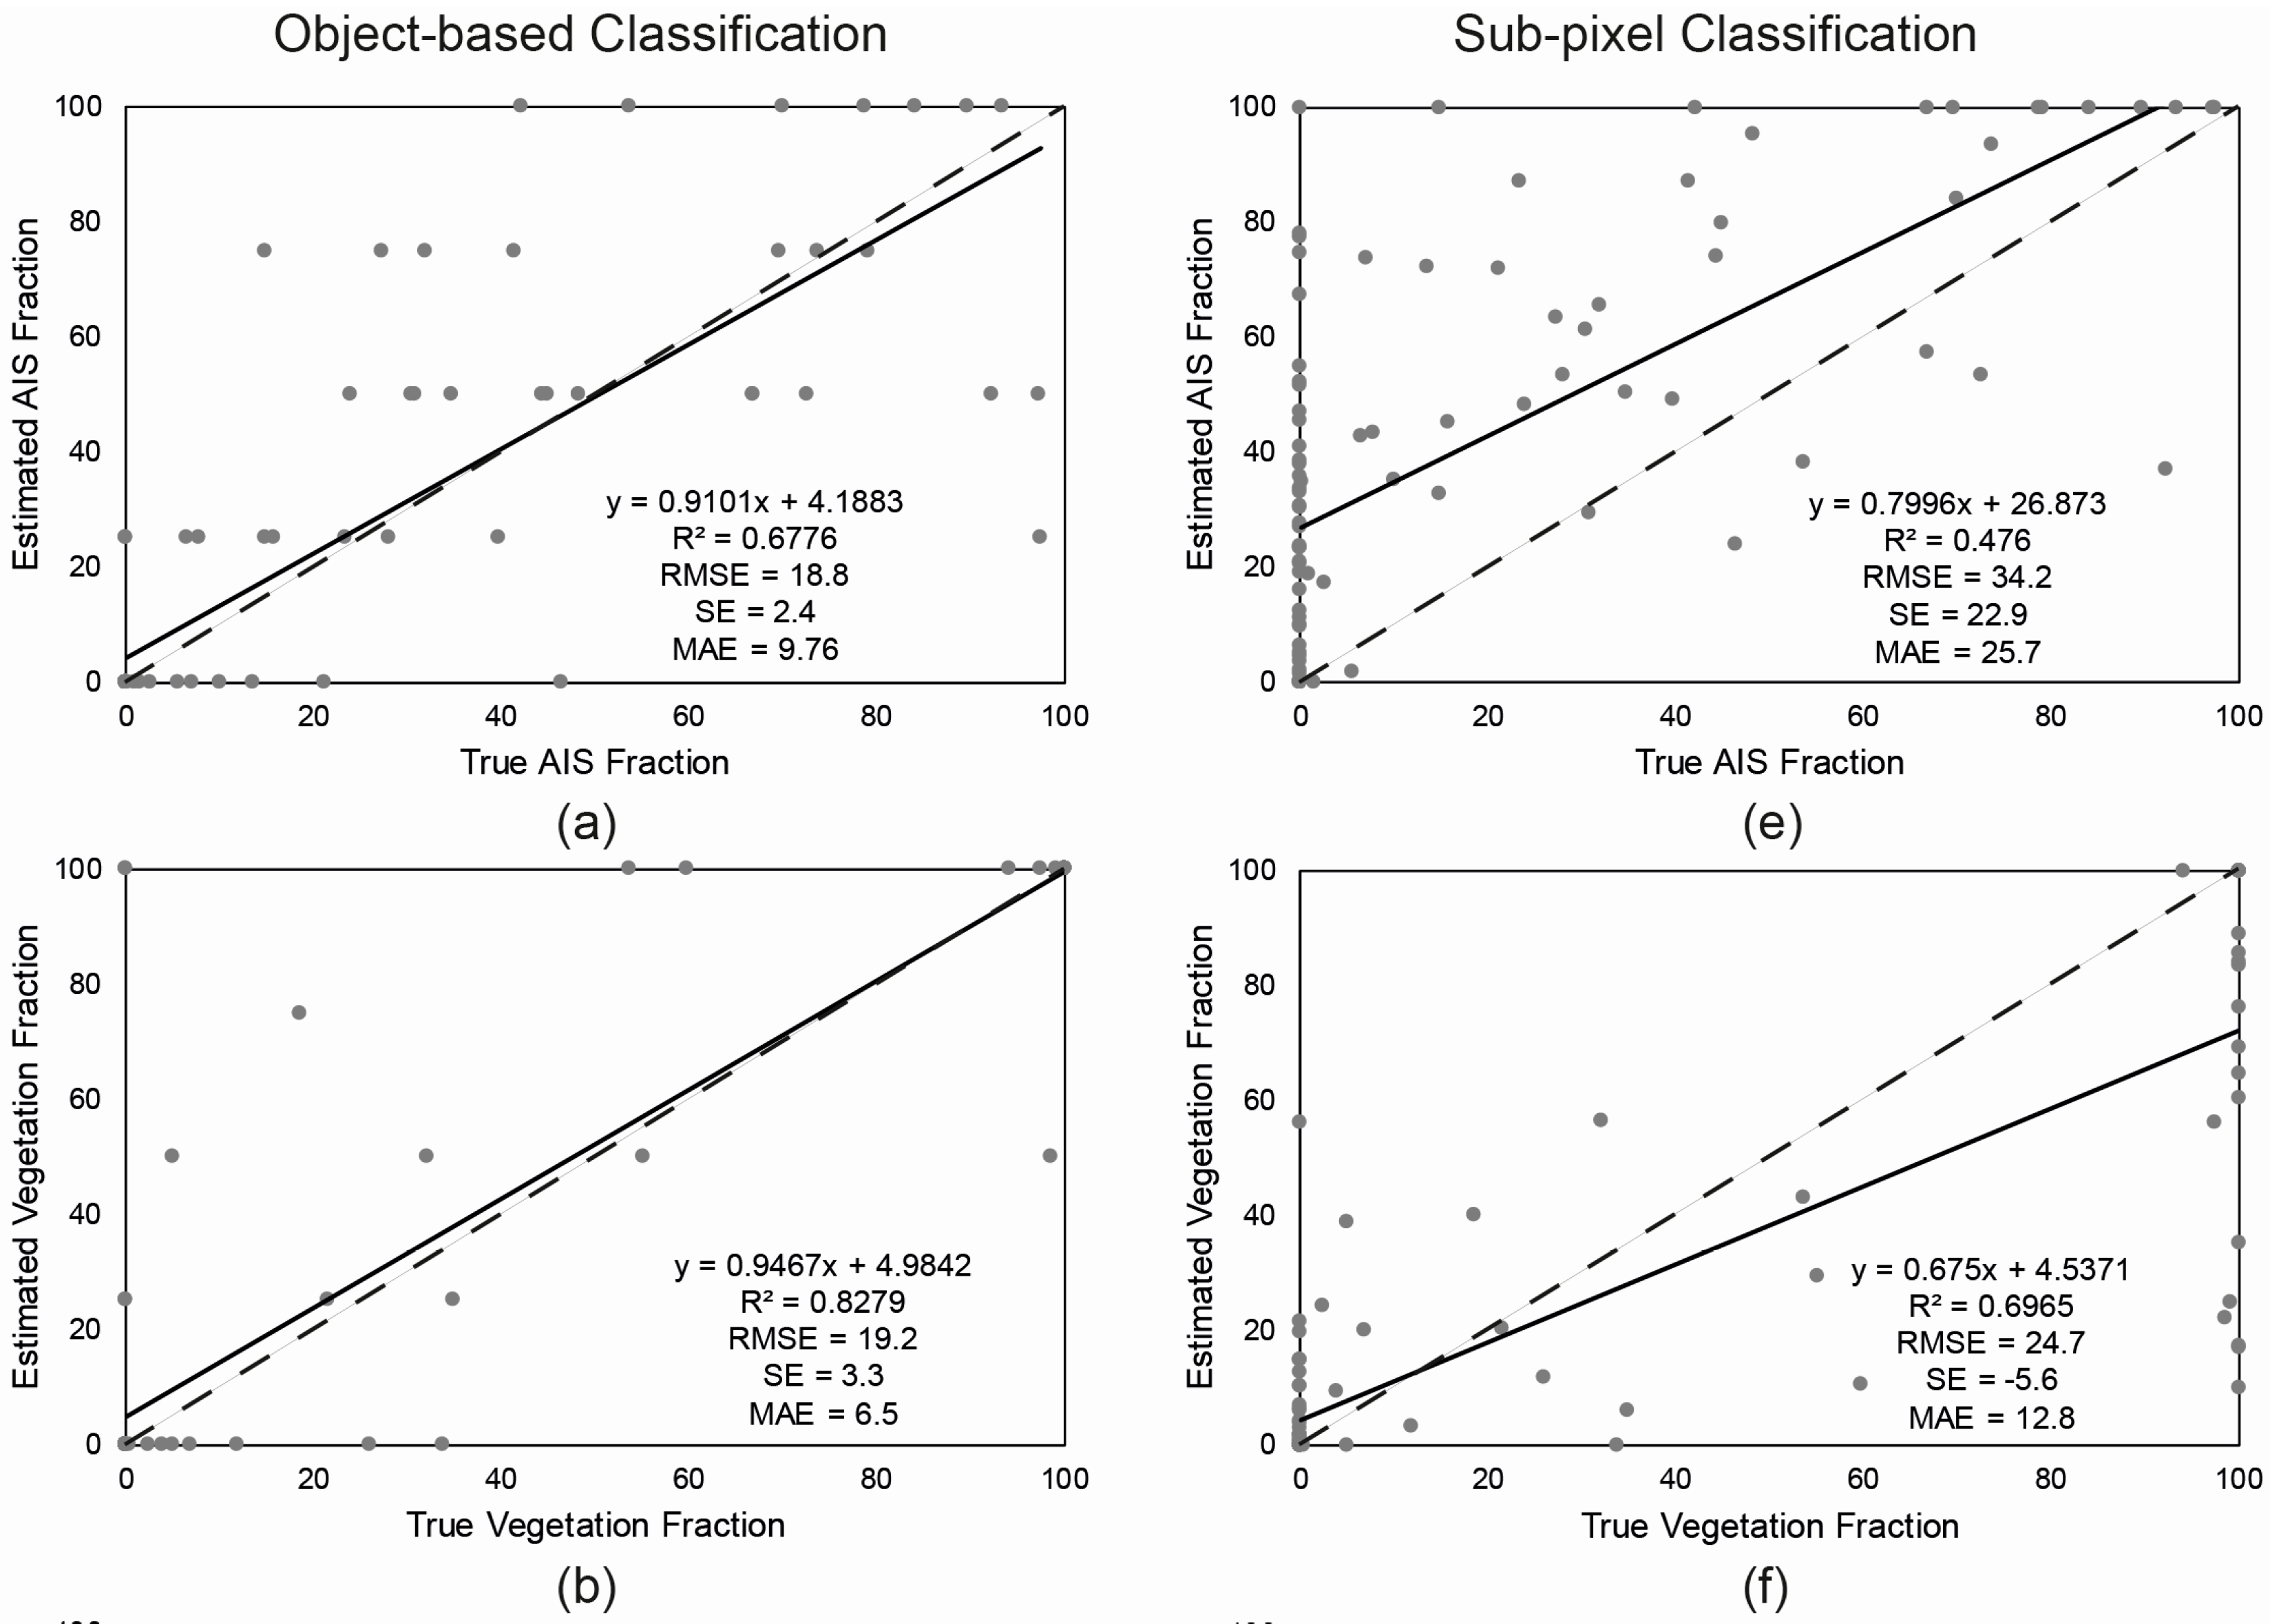
Scatterplots were drawn to examine the relationship between the independent reference data (true data) and the estimated data modeled by linear SMA and object-based classification for each land cover type (Figure 9). The results of a detailed accuracy assessment are reported in each scatterplot where RMSE, MAE, SE and R2 were calculated to quantify the performance of both methodologies. Accuracy measurements indicate that object-based classification using spectral indices provides an adequate estimation of impervious surface distribution with values of RMSE = 18.8%, SE = 2.4%, and MAE = 9.76% (Figure 9a–d). These values are considerably lower when compared to the sub-pixel accuracy measurements (RMSE = 34.2%; SE = 22.9%; MAE = 25.7%), which suggests a better general estimation achieved with the object-based classification. However, the correlation between estimated and true impervious surface fraction is significantly higher (R2 = 67.7%) in the object-based classification than in the sub-pixel classification (R2 = 47.6%).
The other three land cover types: vegetation, soil and sand, showed a similar behavior in their accuracy measurement results. Higher R2 (82.7%, 71.2% and 85%, respectively) and lower RMSE and MAE values were obtained in the object-based classification approach comparing with the sub-pixel classification.
Detailed analysis of SE (bias) also found that there is a considerable overestimation of impervious surface in the sub-pixel classification (22.9% for SE) compared with the object-based classification (2.4% for SE). Furthermore, there is a slight underestimation of vegetation in the sub-pixel classification with an SE of −5.6% that confirms the difficulties in detecting dry vegetation in linear SMA classification. With respect to soil, the object-based classification showed a major underestimation (SE = −10.2%) in comparison to an SE value of −2.9% in the sub-pixel classification.
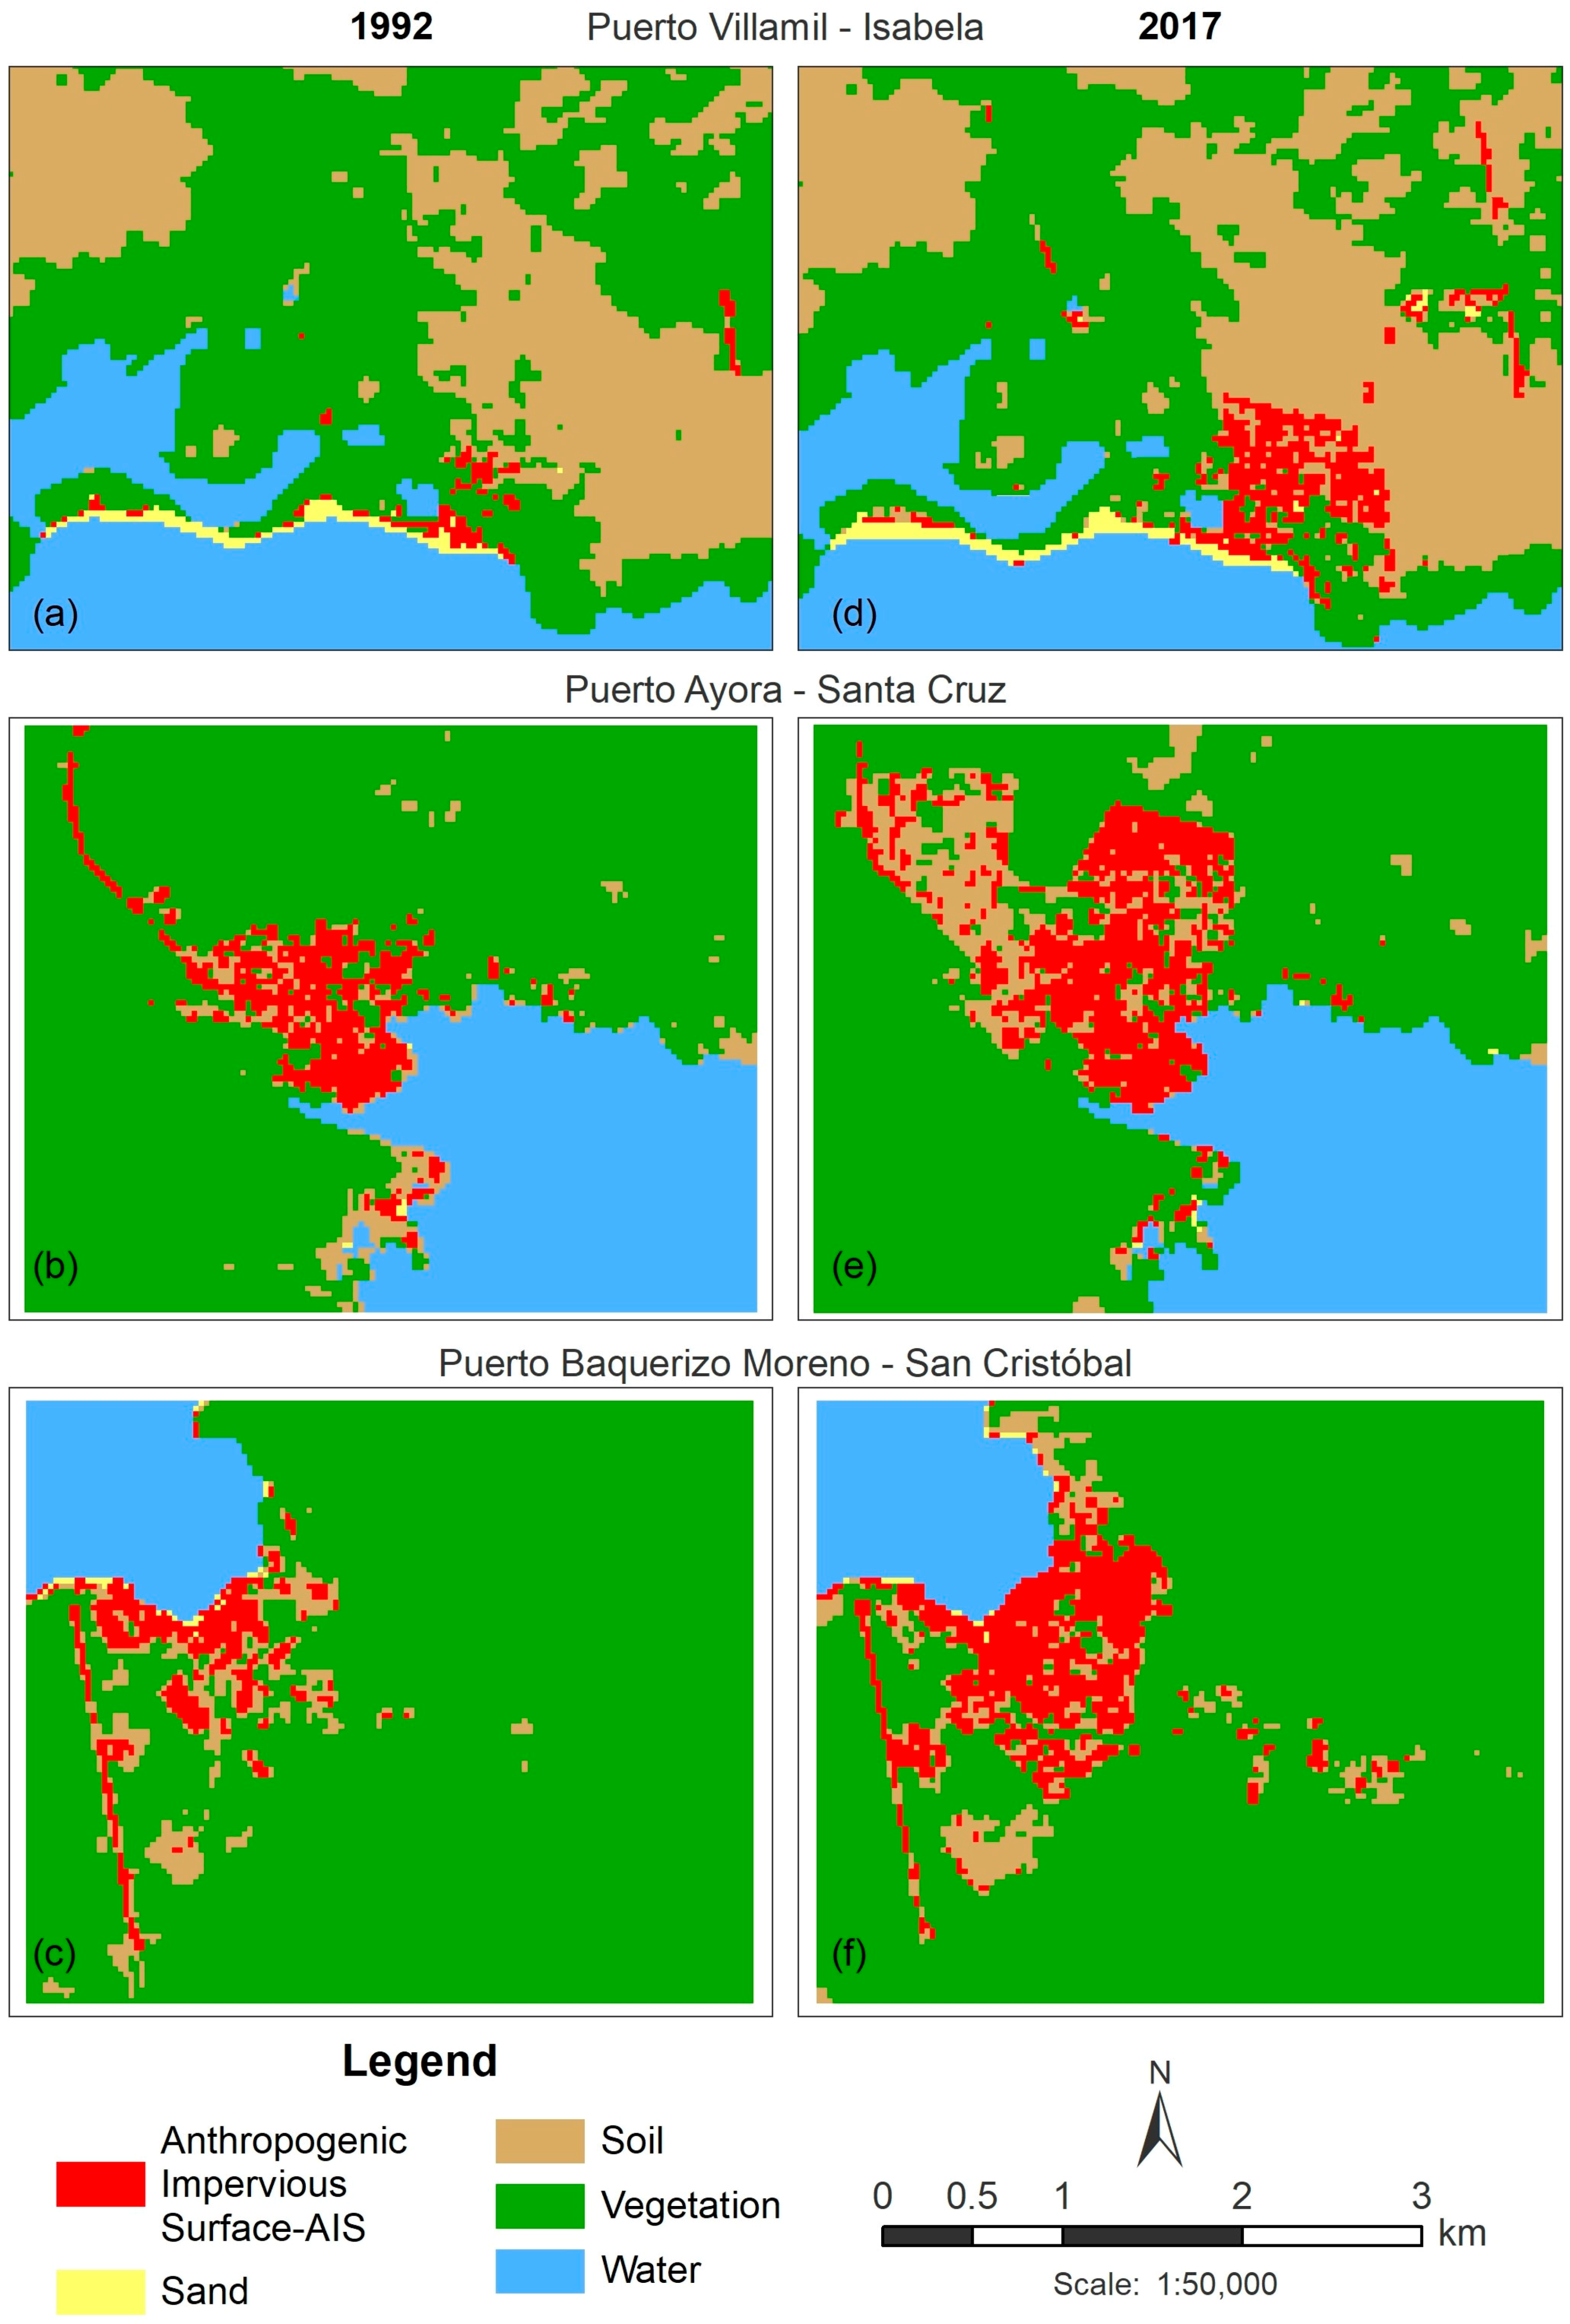
In conclusion, the experiments within the Puerto Villamil study area verified the effectiveness of object-based classification for impervious surface mapping in inhabited islands. Thus, that same method was replicated in the other urban centers in Galapagos (Figure 8) to identify the total area of imperviousness in the Archipelago and analyze the land cover change that has occurred in the past 25 years.
3.2. Land Cover Change between 1992 and 2017
Based on the quantitative accuracy assessment, a multi-date object-based classification change detection analysis was used to determine changes in land cover in the interval: 1992–2017. An important aspect of change detection is to determine which land cover or land use class is changing compared to the other in order to understand the current environmental status and ongoing change to an area [6,47].
Individual class area and change statistics vary between land uses (Table 3). From 1992 to 2017, urban areas in Galapagos increased approximately 170 ha (127%), while bare soil and sand increased 177.5 ha (19.4%) and 0.5 ha (2%), respectively. However, in all cases, the increase is the result of a decrease in natural vegetation, with a total of 348 ha (10.9%) in 25 years.
To further evaluate the results of land cover conversions in the Archipelago, a matrix of land cover changes from 1992 to 2017 was created (Table 4). Unchanged pixels are located along the major diagonal of the matrix. These results indicate that increases in impervious surfaces are mainly due to changes from vegetation to urban uses during the period of 1992–2017. Out of the 304.4 ha of total growth in impervious surfaces, 141.10 ha was converted from vegetation areas, 66.19 ha from soil land and 3.78 ha from sand areas. While those 141.10 ha of vegetation were changed, 14.22 ha of impervious surface was converted to vegetation. These unusual changes could be caused by omission and commission errors in the Landsat classification.
3.3. Impervious Surface Growth and Sprawl
According to the results, urban impervious surfaces increased from 133.92 ha (circa 1992) to 304.20 ha (2017). The average annual growth rate in urban areas, determined from remote sensing change detection, was approximately 3.3% from 1992 to 2017. This total growth in urban impervious surfaces is similar compared to an annual population growth rate of approximately 3.8% from 1990 to 2015 (Table 5). An urban sprawl index (USI) was calculated to examine the relationship between population growth and growth in urban impervious surfaces [48]. The USI measures the growth in build-up area over time adjusted for the growth in population. The index is equal to zero when both population and build-up areas are stable over time. It is greater (less) than zero when the growth of build-up area is greater (smaller) than the growth of population and its density has decreased (increased). In the urban centers in Galapagos, the USI, in general is negative (Table 6), so the build-up area is slightly smaller than the population growth. However, this result could be biased by Puerto Ayora’s behavior, which is the principal urban center and where 47% and 57.6% of the total population and total urban population of Galapagos, respectively, is settled.
4. Discussion
4.1. Classifier Approach
Despite the object-based classification showing better results in comparison with sub-pixel classification, the accuracy is not potentially significantly (>85%; [49]). The spatial resolution and the selection of an optimum threshold value are significant factors in increasing the spatial accuracy of mapping complex urban land cover [11,13], as is the Galapagos urban centers. These settlements are small and their expansion is restricted by a protected area. Thus, this limitation of space makes these areas highly heterogeneous in small spaces, causing a mixture of coverages within a single pixel when moderate spatial resolution imagery is used. Better results could be obtained if imagery with higher spatial resolution and free access (e.g., Sentinel 2) are used without compromising the low costs of the methodology.
Furthermore, in order to determine an optimal spectral indices threshold value to extract impervious surfaces, an automated and effective algorithm or technique should be explored and implemented (e.g., statistics analyses) to reduce the misclassification between land-covers with similar spectral behavior.
4.2. Urban Growth
It is expected that the increase of impervious surfaces will have profound implications for the human- ecological systems of Galapagos [50], and specifically, related to growth of urban surfaces in the Galapagos, can have implications to wildlife health [51] and endemic vegetation [52], human health and infrastructure [53,54], and in the relationship between wildlife and humans (e.g., [55]). Despite that there are new efforts to understand how population growth affects public services in the Galapagos [54,56] and the contribution to the invasion of alien species [57], there is not enough research to assess the impact of urban infrastructure growth in endemic species and how urban ecology programs can be built to ameliorate potential impacts. This is the first study to quantify the increase of impervious surfaces in the Galapagos Islands and it should be a priority, in terms of research.
The most obvious direct driver of land change in Galapagos is related to the development of the tourism industry in the islands [50,58], however there are many underlying causes, beyond the number of people coming to Galapagos to live or to visit, that contribute the increase of impervious surfaces in the islands. Reasons for this might have to do with cultural expectations or the belief that pavement is a sign of progress or development in a frontier environment, which is also related to the lack of environmental awareness of the immense social and ecological value of green spaces to the local community and local planners and authorities (for example, [59,60,61]).
5. Conclusions
Throughout this study, the impervious surface expansion in the Galapagos Islands, over different periods using multi-temporal satellite imagery, has been shown. As expected, it is demonstrated that there was a significant increase of impervious surfaces, in terms of area, in all three main inhabited islands in the archipelago.
In terms of methodology, object-based classification, using spectral indices, proved to be significantly better in impervious surface detection in comparison to sub-pixel classification. The object-based classification showed a correlation coefficient for the impervious surface detection of 68%, while the sub-pixel classification correlation coefficient was 48%. Similarly, the classification of land cover in urban landscape of inhabited islands using an object-based approach showed a mean correlation coefficient of 76.7% while the sub-pixel model showed a mean correlation coefficient of 60%.
The change detection analysis of the urban landscape in Galapagos over this 25-year period is a step towards better understanding the patterns and trends of growth and sprawl of urban centers in island environments. From a proper understanding of this information, local authorities could derive important information for land planning and zoning for a better management in the short and long terms. In fact, policy makers should be able to use this information in their decision-making process with regard to policies relevant to limited territory environments such as population growth control, urbanization and construction permits at local and regional levels.
Furthermore, local citizens can also be users and potential contributors of information that is relevant in the local context to make better, more-informed choices. This is particularly important in the context of the Galapagos Islands, where the studied urban areas are sitting right next to the protected area designated as a National Park. Data and trials on environment-friendly rooftop options that minimize the impervious surface coverage are one of the potential extended applications of this information, where local people and tourists could effectively be part of a citizen science initiative.
Further research on this topic may be needed to understand and connect the implications of impervious surface increases on island ecosystem services, particularly water provision and water cycle maintenance. This is a novel approach applied in an archipelago environment, and its applications and implications are numerous. It is important to continue with similar research that informs all stakeholders and supports conservation initiatives and sustainable development policies that are already set in place for the Galapagos Islands.
Acknowledgments
This study was supported by the Galapagos Science Center and the Geography Institute of the San Francisco de Quito University.
Author Contributions
Fátima L. Benítez led the analysis and wrote the manuscript, with guidance from Carlos F. Mena and Leo Zurita-Arthos. Leo Zurita-Arthos and Carlos F. Mena interpreted the results and contributed in the discussion and conclusion writing and manuscript revision.
Conflicts of Interest
The authors declare no conflict of interest.
References
- Poumanyvong, P.; Kaneko, S. Does urbanization lead to less energy use and lower CO2 emissions? A cross-country analysis. Ecol. Econ. 2010, 70, 434–444. [Google Scholar] [CrossRef]
- ME (Ministerio de Economía). Primer Censo de Población del Ecuador 1950; Dirección General de Estadísticas y Censos: Quito, Ecuador, 1960.
- Dams, J.; Dujardin, J.; Reggers, R.; Bashir, I.; Canters, F.; Batelaan, O. Mapping impervious surface change from remote sensing for hydrological modeling. J. Hydrol. 2013, 485, 84–95. [Google Scholar] [CrossRef]
- Yang, J.; He, Y. Automated mapping of impervious surfaces in urban and suburban areas: Linear spectral unmixing of high spatial resolution imagery. Int. J. Appl. Earth Obs. Geoinf. 2017, 54, 53–64. [Google Scholar] [CrossRef]
- Wang, J.; Huang, B.; Fu, D.; Atkinson, P.M. Spatiotemporal variation in surface urban heat island intensity and associated determinants across major Chinese cities. Remote Sens. 2015, 7, 3670–3689. [Google Scholar] [CrossRef]
- El Garouani, A.; Mulla, D.J.; El Garouani, S.; Knight, J. Analysis of urban growth and sprawl from remote sensing data: Case of Fez, Morocco. Int. J. Sustain. Built Environ. 2017, 6, 160–169. [Google Scholar] [CrossRef]
- Cocklin, C.; Keen, M. Urbanization in the Pacific: Environmental change, vulnerability and human security. Environ. Conserv. 2000, 27, 392–403. [Google Scholar] [CrossRef]
- Garg, A.; Pal, D.; Singh, H. A comparative study of NDBI, NDISI and NDII for extraction of urban impervious surface of Dehradun [Uttarakhand, India] using Landsat 8 imagery. In Proceedings of the 2016 International Conference on Emerging Trends in Communication Technologies (ETCT), Dehradun, India, 18–19 November 2016; pp. 1–5. [Google Scholar]
- Cablk, M.; Minor, T. Detecting and discriminating impervious cover with high-resolution IKONOS data using principal component analysis and morphological operators. Int. J. Remote Sens. 2003, 24, 4627–4645. [Google Scholar] [CrossRef]
- Yang, J.; Li, P. Impervious surface extraction in urban areas from high spatial resolution imagery using linear spectral unmixing. Remote Sens. Appl. Soc. Environ. 2015, 1, 61–71. [Google Scholar] [CrossRef]
- Momeni, R.; Aplin, P.; Boyd, D.S. Mapping complex urban land cover from spaceborne imagery: The influence of spatial resolution, spectral band set and classification approach. Remote Sens. 2016, 8, 88. [Google Scholar] [CrossRef]
- Deng, C.; Wu, C. A spatially adaptive spectral mixture analysis for mapping subpixel urban impervious surface distribution. Remote Sens. Environ. 2013, 133, 62–70. [Google Scholar] [CrossRef]
- Kant, A.; Kumar, S. Semi-automatic mapping of anthropogenic impervious surfaces in an urban_suburban area using Landsat 8 satellite data. GISci. Remote Sens. 2017, 54, 471–494. [Google Scholar]
- Kuang, W.; Liu, J.; Zhang, Z.; Lu, D.; Xiang, B. Spatiotemporal dynamics of impervious surface areas across China during the early 21st century. Chin. Sci. Bull. 2012, 58, 1691–1701. [Google Scholar] [CrossRef]
- Lu, D.; Moran, E.; Hetrick, S. Detection of impervious surface change with multitemporal Landsat images in an urban-rural frontier. ISPRS J. Photogramm. Remote Sens. 2011, 66, 298–306. [Google Scholar] [CrossRef] [PubMed]
- Poursanidis, D.; Chrysoulakis, N.; Mitraka, Z. Landsat 8 vs. Landsat 5: A comparison based on urban and peri-urban land cover mapping. Int. J. Appl. Earth Obs. Geoinf. 2015, 35, 259–269. [Google Scholar] [CrossRef]
- Yuan, F.; Wu, C.; Bauer, M.E. Comparison of spectral analysis techniques for impervious surface estimation using Landsat imagery. Photogramm. Eng. Remote Sens. 2008, 74, 1045–1055. [Google Scholar] [CrossRef]
- Wu, C.; Murray, A.T. Estimating impervious surface distribution by spectral mixture analysis. Remote Sens. Environ. 2003, 84, 493–505. [Google Scholar] [CrossRef]
- Zhang, Y.; Balzter, H.; Liu, B.; Chen, Y. Analyzing the impacts of urbanization and seasonal variation on land surface temperature based on subpixel fractional covers using Landsat images. IEEE J. Sel. Top. Appl. Earth Obs. Remote Sens. 2017, 10, 1344–1356. [Google Scholar] [CrossRef]
- Powell, R.L.; Roberts, D.A.; Dennison, P.E.; Hess, L.L. Sub-pixel mapping of urban land cover using multiple endmember spectral mixture analysis: Manaus, Brazil. Remote Sens. Environ. 2007, 106, 253–267. [Google Scholar] [CrossRef]
- Tran, T.; Julian, J.; de Beurs, K. Land cover heterogeneity effects on sub-pixel and per-pixel classifications. ISPRS Int. J. Geo-Inf. 2014, 3, 540–553. [Google Scholar] [CrossRef]
- Yuan, F.; Bauer, M.E. Mapping impervious surface area using high resolution imagery: A comparison of object-based and per pixel classification. In Proceedings of the ASPRS 2006 Annual Conference, Reno, NV, USA, 1–5 May 2006; pp. 1667–1674. [Google Scholar]
- Zhou, Y.; Wang, Y. Extraction of impervious surface areas from high spatial resolution imagery by multiple agent segmentation and classification. Photogramm. Eng. Remote Sens. 2008, 74, 857–868. [Google Scholar] [CrossRef]
- Myint, S.W.; Mesev, V.; Quattrochi, D.; Wentz, E.A. Urban image classification: Per-pixel classifiers, sub-pixel analysis, object-based image analysis, and geospatial methods. In Urban Remote Sensing: Evolution, History, Current State-of-Art, and Future Vision; NASA: Washington, DC, USA; Taylor & Francis: Huntsville, AL, USA, 2013. [Google Scholar]
- INEC (Instituto Nacional de Estadísticas y Censos). Censo de Población y Vivienda Galápagos; Publicaciones INEC: Quito, Ecuador, 2015.
- INEC (Instituto Nacional de Estadísticas y Censos). V Censo de Población y IV de Vivienda 1990; Publicaciones INEC: Quito, Ecuador, 1990.
- GCT (Galapagos Conservation Trust). Available online: http://galapagosconservation.org.uk (accessed on 15 August 2017).
- Collins, A.; Bush, M.B. An analysis of modern pollen representation and climatic conditions on the Galapagos Islands. Holocene 2011, 21, 237–250. [Google Scholar] [CrossRef]
- Deng, C.; Wu, C. BCI: A biophysical composition index for remote sensing of urban environments. Remote Sens. Environ. 2012, 127, 247–259. [Google Scholar] [CrossRef]
- Zhou, Y.; Yang, G.; Wang, S.; Wang, L.; Wang, F.; Liu, X. A new index for mapping built-up and bare land areas from Landsat-8 OLI data. Remote Sens. Lett. 2014, 5, 862–871. [Google Scholar] [CrossRef]
- Al Fugara, A.M.; Pradhan, B.; Mohamed, T.A. Improvement of land-use classification using object-oriented and fuzzy logic approach. Appl. Geomat. 2009, 1, 111–120. [Google Scholar] [CrossRef]
- Yan, G. Pixel Based and Object Oriented Image Analysis for Coal Fire Research. Master’s Thesis, International Institute for Geo-Information Science and Earth Observation, Enshede, The Netherlands, 2003. [Google Scholar]
- Phinn, S.; Stanford, M.; Scarth, P.; Murray, A.T.; Shyy, P.T. Monitoring the composition of urban environments based on the vegetation-impervious surface-soil (VIS) model by subpixel analysis techniques. Int. J. Remote Sens. 2002, 23, 4131–4153. [Google Scholar] [CrossRef]
- Wu, C. Normalized spectral mixture analysis for monitoring urban composition using ETM+ imagery. Remote Sens. Environ. 2004, 93, 480–492. [Google Scholar] [CrossRef]
- Lu, D.; Moran, E.; Batistella, M. Linear mixture model applied to Amazonian vegetation classification. Remote Sens. Environ. 2003, 87, 456–469. [Google Scholar] [CrossRef] [Green Version]
- Pu, R.; Gong, P.; Michishita, R.; Sasagawa, T. Spectral mixture analysis for mapping abundance of urban surface components from the Terra/ASTER Data. Remote Sens. Environ. 2008, 112, 939–954. [Google Scholar] [CrossRef]
- Tompkins, S.; Mustard, J.F.; Pieters, C.M.; Forsyth, D.W. Optimization of endmembers for spectral mixture analysis. Remote Sens. Environ. 1997, 59, 472–489. [Google Scholar] [CrossRef]
- Ridd, M.K. Exploring a V–I–S (vegetation–impervious surface–soil) model for urban ecosystem analysis through remote sensing: Comparative anatomy for cities. Int. J. Remote Sens. 1995, 16, 2165–2185. [Google Scholar] [CrossRef]
- Boardman, J.W.; Kruse, F.A. Automated spectral analysis: A geological example using AVIRIS data, north Grapevine Mountains, Nevada. In Proceedings of the ERIM Tenth Thematic Conference on Geologic Remote Sensing, Environmental Research Institute of Michigan, Ann Arbor, MI, USA, 9–12 May 1994; pp. 407–418. [Google Scholar]
- Boardman, J.W.; Kruse, F.A.; Green, R.O. Mapping target signatures via partial unmixing of AVIRIS data. In Proceedings of the Summaries of the 5th Airborne Earth Science Workshop, Pasadena, CA, USA, 23–26 January 1995; Volume 95, pp. 23–26. [Google Scholar]
- Sakti, A.D.; Tsuyuki, S. Spectral mixture analysis (SMA) of Landsat imagery for land cover study of highly degraded peatland in Indonesia. Int. Arch. Photogramm. Remote Sens. Spat. Inf. Sci. ISPRS Arch. 2015, 40, 495–501. [Google Scholar] [CrossRef]
- Trimble. eCognition Developer 8.7: User Guide; Trimble Germany Gmbh: Eschborn, Germany, 2011. [Google Scholar]
- Wong, T.H.; Mansor, S.B.; Mispan, M.R.; Ahmad, N.; Sulaiman, W.N.A. Feature extraction based on object oriented analysis. In Proceedings of the ATC 2003 Conference, San Antonio, TX, USA, 9–14 June 2003; pp. 1–10. [Google Scholar]
- Rouse, J.W.; Hass, R.H.; Schell, J.A.; Deering, D.W. Monitoring vegetation systems in the Great Plains with ERTS. In Proceedings of the ERTS SYMPOSIUM, Washington, DC, USA, 10–14 December 1973; pp. 309–317. [Google Scholar]
- Tucker, C.J. Red and photographic infrared linear combinations for monitoring vegetation. Remote Sens. Environ. 1979, 8, 127–150. [Google Scholar] [CrossRef]
- Shen, Y.; Shen, H.; Li, H.; Cheng, Q. Long-term urban impervious surface monitoring using spectral mixture analysis: A case study of Wuhan city in China. In Proceedings of the 2016 IEEE International Geoscience and Remote Sensing Symposium (IGARSS), Beijing, China, 10–15 July 2016; pp. 6754–6757. [Google Scholar]
- Yuan, F.; Sawaya, K.E.; Loeffelholz, B.C.; Bauer, M.E. Land cover classification and change analysis of the Twin Cities (Minnesota) metropolitan area by multitemporal Landsat remote sensing. Remote Sens. Environ. 2005, 98, 317–328. [Google Scholar] [CrossRef]
- OECD. OECD Regions at a Glance; OECD Publishing: Paris, France, 2013. [Google Scholar]
- Foody, G.M. Status of land cover classification accuracy assessment. Remote Sens. Environ. 2002, 80, 185–201. [Google Scholar] [CrossRef]
- Walsh, S.J.; Mena, C.F. Coupled human-natural systems: Interactions of social, terrestrial & marine sub-systems in the Galapagos Islands. Proc. Natl. Acad. Sci. USA 2016, 113, 14536–14543. [Google Scholar] [PubMed]
- Zylberberg, M.; Lee, K.A.; Klasing, K.C.; Wikelski, M. Variation with land use of immune function and prevalence of avian pox in Galapagos finches. Conserv. Biol. 2013, 27, 103–112. [Google Scholar] [CrossRef] [PubMed]
- de la Torre, S. Research in agricultural and urban areas in Galapagos: A biological perspective. In Science and Conservation in the Galapagos Islands; Walsh, S.J., Mena, C.F., Eds.; Springer: New York, NY, USA, 2013; pp. 185–198. [Google Scholar]
- Walsh, S.J.; McCleary, A.L.; Heumann, B.W.; Brewington, L.; Raczkowski, E.J.; Mena, C.F. Community expansion and infrastructure development: Implications for human health and environmental quality in the Galápagos Islands of Ecuador. J. Lat. Am. Geogr. 2010, 9, 137–159. [Google Scholar] [CrossRef]
- Ragazzi, M.; Catellani, R.; Rada, E.C.; Torretta, V.; Salazar-Valenzuela, X. Management of urban wastewater on one of the Galapagos Islands. Sustainability 2016, 8, 208. [Google Scholar] [CrossRef]
- Denkinger, J.; Quiroga, D.; Murillo, J.C. Assessing human–wildlife conflicts and benefits of Galápagos sea lions on San Cristobal Island, Galápagos. In The Galapagos Marine Reserve: A Dynamic Social-Ecological System; Denkinger, J., Vinueza, L., Eds.; Springer: New York, NY, USA, 2014; pp. 285–305. [Google Scholar]
- Reyes, M.F.; Trifunović, N.; Sharma, S.; Kennedy, M. Data assessment for water demand and supply balance on the island of Santa Cruz (Galápagos Islands). Desalin. Water Treat. 2016, 57, 21335–21349. [Google Scholar] [CrossRef]
- Toral-Granda, M.V.; Causton, C.E.; Jäger, H.; Trueman, M.; Izurieta, J.C.; Araujo, E.; Cruz, M.; Zander, K.K.; Izurieta, A.; Garnett, S.T. Alien species pathways to the Galapagos Islands, Ecuador. PLoS ONE 2017, 12, e0184379. [Google Scholar] [CrossRef] [PubMed]
- Pizzitutti, F.; Walsh, S.J.; Rindfuss, R.R.; Gunter, R.; Quiroga, D.; Tippett, R.; Mena, C.F. Scenario planning for tourism management: A participatory and system dynamics model applied to the Galapagos Islands of Ecuador. J. Sustain. Tour. 2017, 25, 1117–1137. [Google Scholar] [CrossRef]
- Zhang, B.; Xie, G.; Zhang, C.; Zhang, J. The economic benefits of rainwater-runoff reduction by urban green spaces: A case study in Beijing, China. J. Environ. Manag. 2012, 100, 65–71. [Google Scholar] [CrossRef] [PubMed]
- Jenerette, G.D.; Harlan, S.L.; Stefanov, W.L.; Martin, C.A. Ecosystem services and urban heat riskscape moderation: Water, green spaces, and social inequality in Phoenix, USA. Ecol. Appl. 2011, 21, 2637–2651. [Google Scholar] [CrossRef] [PubMed]
- Young, R.F. Managing municipal green space for ecosystem services. Urban For. Urban Green. 2010, 9, 313–321. [Google Scholar] [CrossRef]
Figure 1.
Location of the study area.

Figure 2.
(a) Three-dimensional visualization model of four land cover classes for Puerto Villamil fraction model; (b) Spectral signatures of the endmembers.
Figure 2.
(a) Three-dimensional visualization model of four land cover classes for Puerto Villamil fraction model; (b) Spectral signatures of the endmembers.

Figure 3.
Average reflectance values of various land cover classes in Bands 2–7 of Landsat 8 sensor data.
Figure 3.
Average reflectance values of various land cover classes in Bands 2–7 of Landsat 8 sensor data.

Figure 4.
Higher potential of bands 4 and 7 combination to highlight bare soil and sand in comparison to other bands combination.
Figure 4.
Higher potential of bands 4 and 7 combination to highlight bare soil and sand in comparison to other bands combination.

Figure 5.
Membership functions for the four classes.

Figure 6.
Process to build-up the sampling-unit and perform the accuracy assessment: (a) location of 25 random points on impervious surfaces in the high-res image; (b) 2 × 2 pixel windows matched in each point of the Landsat scene.
Figure 6.
Process to build-up the sampling-unit and perform the accuracy assessment: (a) location of 25 random points on impervious surfaces in the high-res image; (b) 2 × 2 pixel windows matched in each point of the Landsat scene.

Figure 7.
(a) Reflectance Image of the study area; and fraction maps of all endmembers: (b) Soil; (c) Sand; (d) Impervious Surface; (e) Vegetation; (f) RMS error by linear spectral mixture analysis.
Figure 7.
(a) Reflectance Image of the study area; and fraction maps of all endmembers: (b) Soil; (c) Sand; (d) Impervious Surface; (e) Vegetation; (f) RMS error by linear spectral mixture analysis.

Figure 8.
Land cover maps of Galapagos Urban Centers for circa 1992: (a) Puerto Villamil; (b) Puerto Ayora; (c) Puerto Baquerizo Moreno; and 2017: (d) Puerto Villamil; (e) Puerto Ayora; (f) Puerto Baquerizo Moreno.
Figure 8.
Land cover maps of Galapagos Urban Centers for circa 1992: (a) Puerto Villamil; (b) Puerto Ayora; (c) Puerto Baquerizo Moreno; and 2017: (d) Puerto Villamil; (e) Puerto Ayora; (f) Puerto Baquerizo Moreno.

Figure 9.
Scatterplots of the land cover fractions constructed by the reference data and the estimated data modeled by the object-based classification: (a) Impervious surface; (b) Vegetation; (c) Soil; (d) Sand; and by the sub-pixel classification: (e) Impervious surface; (f) Vegetation; (g) Soil; (h) Sand.


Table 1.
Landsat time-series used in this study.
| Sensor | Level | Path/Row | Acquisition Date | Urban Center |
|---|---|---|---|---|
| OLI | 1TP | 18/61 | 15-January-2017 | Puerto Villamil |
| TM | 1TP | 18/61 | 18-March-1993 | Puerto Villamil |
| OLI | 1TP | 17/61 | 30-April-2017 | Puerto Baquerizo Moreno |
| TM | 1GS | 17/61 | 17-May-1994 | Puerto Baquerizo Moreno |
| OLI | 1TP | 18/60 | 4-March-2017 | Puerto Ayora |
| TM | 1TP | 18/60 | 14-April-1991 | Puerto Ayora |
Table 2.
Spectral indices used in the object-based classification.
| Index | Equation |
|---|---|
| Normalized Difference Vegetation Index | |
| Normalized Green-Red Difference Vegetation Index | |
| Biophysical Composition Index | where: = normalized TC1 = normalized TC3 = normalized TC2 |
| Modified Normalized Difference Soil Index for Islands | |
| Normalized Difference Anthropogenic Impervious Surface Index | where: |
Table 3.
Land Use change between circa 1992 and 2017 (all areas are expressed in hectares).
| Puerto Ayora | Puerto Baquerizo Moreno | Puerto Villamil | TOTAL | |||||||||
|---|---|---|---|---|---|---|---|---|---|---|---|---|
| 1991 | 2017 | Change | 1994 | 2017 | Change | 1993 | 2017 | Change | ~1992 | 2017 | Change | |
| IS | 72.5 | 127.5 | 55.0 | 46.5 | 113.2 | 66.7 | 14.9 | 63.6 | 48.7 | 134.0 | 304.4 | 170.4 |
| Soil | 46.4 | 100.7 | 54.3 | 57.2 | 68.8 | 11.5 | 811.8 | 923.5 | 111.7 | 915.5 | 1093.0 | 177.5 |
| Vegetation | 891.7 | 782.2 | −109.5 | 1126.3 | 1048.9 | −77.4 | 1181.9 | 1020.4 | −161.5 | 3199.9 | 2851.5 | −348.4 |
| Sand | 0.7 | 1.0 | 0.3 | 3.2 | 2.3 | −0.8 | 18.2 | 19.3 | 1.1 | 22.1 | 22.6 | 0.5 |
| TOTAL | 1011.4 | 1011.4 | 1233.2 | 1233.2 | 2026.8 | 2026.8 | 4271.4 | 4271.4 | ||||
Table 4.
Matrix of land cover changes from 1992 to 2017 (unchanged pixels are shaded).
| IS | Soil | Vegetation | Sand | 2017 Total | |
|---|---|---|---|---|---|
| IS | 93.29 | 66.19 | 141.10 | 3.78 | 304.4 |
| Soil | 23.77 | 776.27 | 292.57 | 0.36 | 1093.0 |
| Vegetation | 14.22 | 72.39 | 2763.34 | 1.53 | 2851.5 |
| Sand | 2.70 | 0.63 | 2.88 | 16.38 | 22.6 |
| 1992 Total | 134.0 | 915.5 | 3199.9 | 22.1 | 4271.4 |
Table 5.
Comparison of urban impervious surface estimates from Landsat classifications and Demographic census data.
Table 5.
Comparison of urban impervious surface estimates from Landsat classifications and Demographic census data.
| Census Data | |||||||
| Urban Centers | 1990 | 2001 | 2006 | 2010 | 2015 | 2015–1990 | Annual Growth Rate (%) |
| Puerto Ayora | 4294 | 9582 | 9208 | 11,974 | 11,822 | 7528 | 4.1 |
| Puerto Baquerizo Moreno | 3023 | 4908 | 5539 | 6672 | 6553 | 3530 | 3.1 |
| Puerto Villamil | 696 | 1420 | 1570 | 2092 | 2164 | 1468 | 4.6 |
| TOTAL | 8013 | 15,910 | 16,317 | 20,738 | 20,539 | 12,526 | 3.8 |
| Landsat Classification | |||||||
| Urban Centers | 1991 | 1993 | 1994 | ~1992 | 2017 | 2017–(~1992) | Annual Growth Rate (%) |
| Puerto Ayora | 72.63 | -- | -- | -- | 127.53 | 54.99 | 2.2 |
| Puerto Baquerizo Moreno | -- | -- | 46.51 | -- | 113.20 | 66.70 | 3.5 |
| Puerto Villamil | -- | 14.94 | -- | -- | 63.63 | 48.69 | 5.7 |
| TOTAL | 133.99 | 304.36 | 170.38 | 3.3 | |||
Table 6.
Urban Sprawl Index (USI) and Population density (PD).
| Urban Centers | USI | PD |
|---|---|---|
| Puerto Ayora | −1.0 | 1.9 |
| Puerto Baquerizo Moreno | 0.3 | 0.9 |
| Puerto Villamil | 1.1 | 0.8 |
© 2018 by the authors. Licensee MDPI, Basel, Switzerland. This article is an open access article distributed under the terms and conditions of the Creative Commons Attribution (CC BY) license (http://creativecommons.org/licenses/by/4.0/).
Share and Cite
MDPI and ACS Style
Benítez, F.L.; Mena, C.F.; Zurita-Arthos, L. Urban Land Cover Change in Ecologically Fragile Environments: The Case of the Galapagos Islands. Land 2018, 7, 21. https://0-doi-org.brum.beds.ac.uk/10.3390/land7010021
AMA Style
Benítez FL, Mena CF, Zurita-Arthos L. Urban Land Cover Change in Ecologically Fragile Environments: The Case of the Galapagos Islands. Land. 2018; 7(1):21. https://0-doi-org.brum.beds.ac.uk/10.3390/land7010021
Chicago/Turabian StyleBenítez, Fátima L., Carlos F. Mena, and Leo Zurita-Arthos. 2018. "Urban Land Cover Change in Ecologically Fragile Environments: The Case of the Galapagos Islands" Land 7, no. 1: 21. https://0-doi-org.brum.beds.ac.uk/10.3390/land7010021
Note that from the first issue of 2016, this journal uses article numbers instead of page numbers. See further details here.